Smithfield, VA Map & Demographics
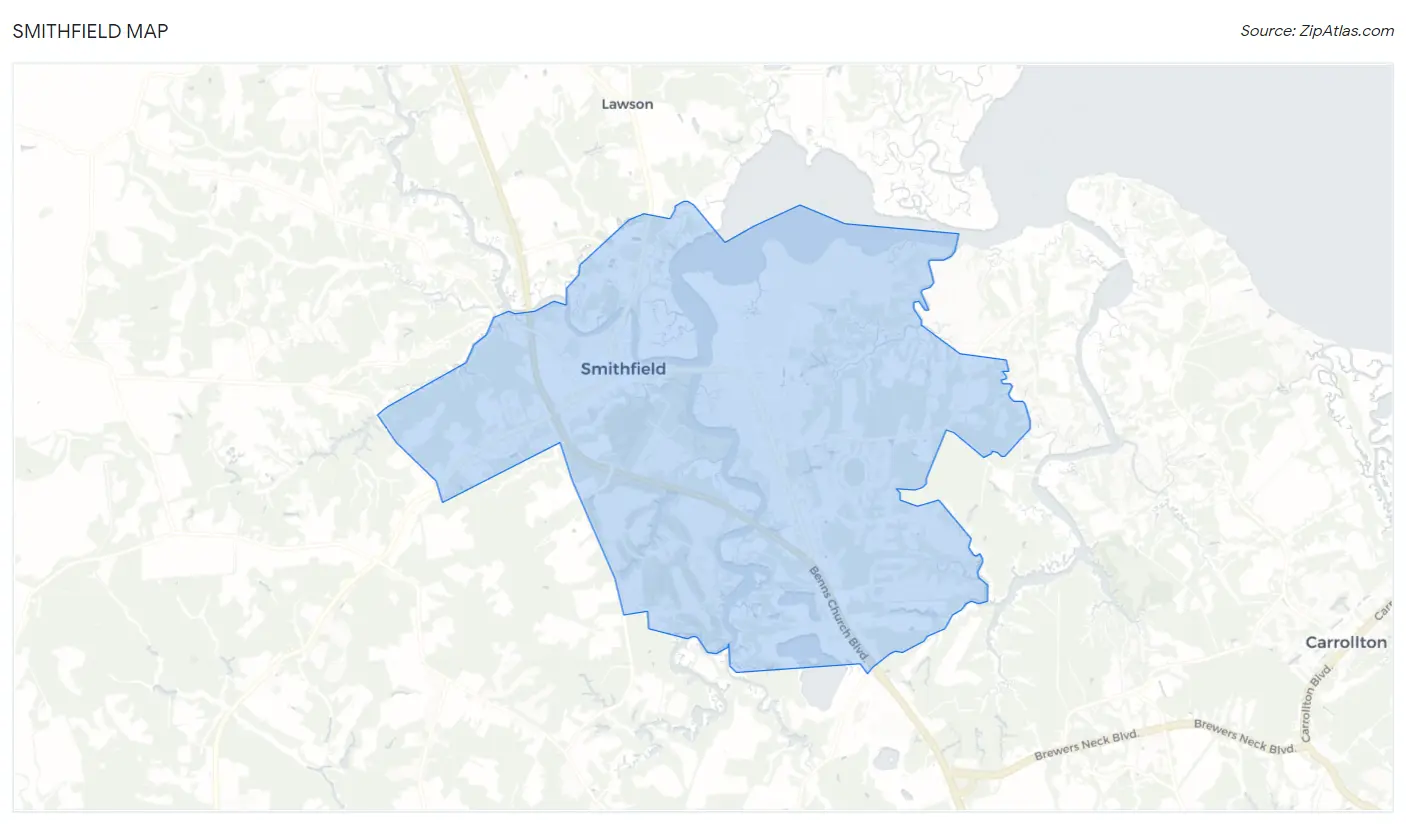
Smithfield Map
Smithfield Overview
$50,223
PER CAPITA INCOME
$121,029
AVG FAMILY INCOME
$101,081
AVG HOUSEHOLD INCOME
38.6%
WAGE / INCOME GAP [ % ]
61.4¢/ $1
WAGE / INCOME GAP [ $ ]
0.45
INEQUALITY / GINI INDEX
8,625
TOTAL POPULATION
4,315
MALE POPULATION
4,310
FEMALE POPULATION
100.12
MALES / 100 FEMALES
99.88
FEMALES / 100 MALES
45.6
MEDIAN AGE
3.0
AVG FAMILY SIZE
2.5
AVG HOUSEHOLD SIZE
4,440
LABOR FORCE [ PEOPLE ]
62.6%
PERCENT IN LABOR FORCE
4.7%
UNEMPLOYMENT RATE
Smithfield Zip Codes
Smithfield Area Codes
Income in Smithfield
Income Overview in Smithfield
Per Capita Income in Smithfield is $50,223, while median incomes of families and households are $121,029 and $101,081 respectively.
| Characteristic | Number | Measure |
| Per Capita Income | 8,625 | $50,223 |
| Median Family Income | 2,368 | $121,029 |
| Mean Family Income | 2,368 | $142,728 |
| Median Household Income | 3,418 | $101,081 |
| Mean Household Income | 3,418 | $121,284 |
| Income Deficit | 2,368 | $0 |
| Wage / Income Gap (%) | 8,625 | 38.58% |
| Wage / Income Gap ($) | 8,625 | 61.42¢ per $1 |
| Gini / Inequality Index | 8,625 | 0.45 |
Earnings by Sex in Smithfield
Average Earnings in Smithfield are $53,080, $65,425 for men and $40,183 for women, a difference of 38.6%.
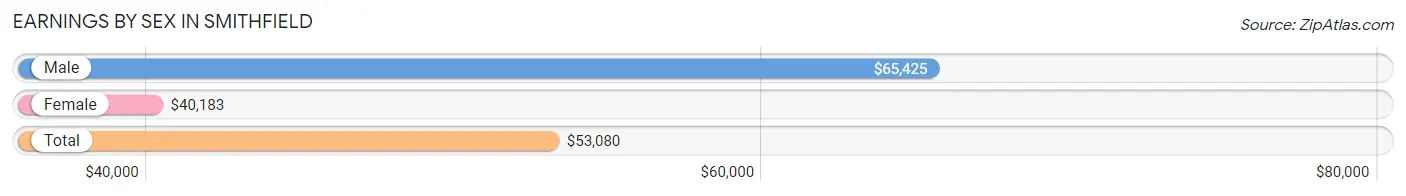
| Sex | Number | Average Earnings |
| Male | 2,692 (57.1%) | $65,425 |
| Female | 2,024 (42.9%) | $40,183 |
| Total | 4,716 (100.0%) | $53,080 |
Earnings by Sex by Income Bracket in Smithfield
The most common earnings brackets in Smithfield are $100,000+ for men (830 | 30.8%) and $35,000 to $39,999 for women (256 | 12.7%).
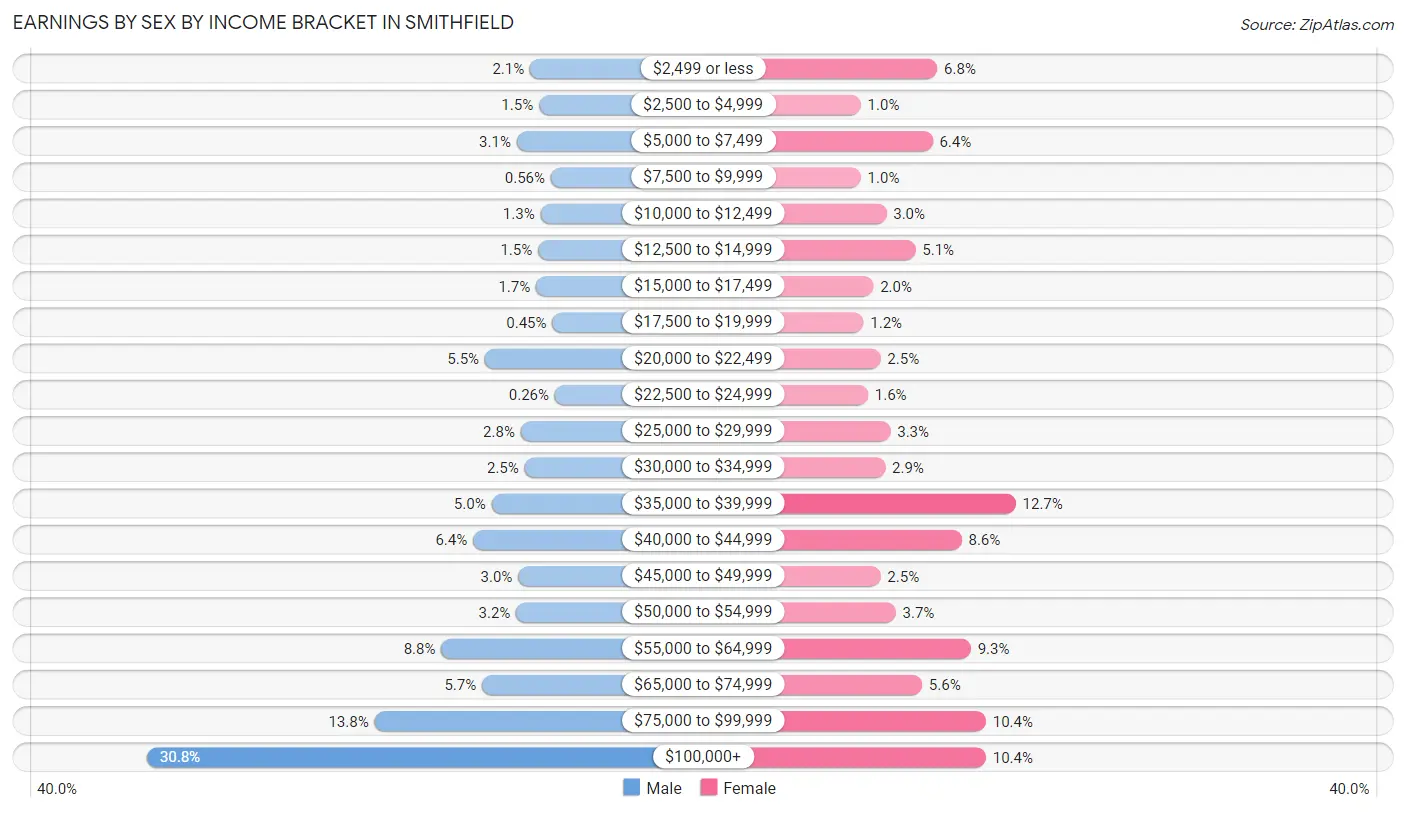
| Income | Male | Female |
| $2,499 or less | 57 (2.1%) | 137 (6.8%) |
| $2,500 to $4,999 | 39 (1.5%) | 21 (1.0%) |
| $5,000 to $7,499 | 84 (3.1%) | 130 (6.4%) |
| $7,500 to $9,999 | 15 (0.6%) | 21 (1.0%) |
| $10,000 to $12,499 | 36 (1.3%) | 60 (3.0%) |
| $12,500 to $14,999 | 41 (1.5%) | 104 (5.1%) |
| $15,000 to $17,499 | 45 (1.7%) | 40 (2.0%) |
| $17,500 to $19,999 | 12 (0.4%) | 25 (1.2%) |
| $20,000 to $22,499 | 148 (5.5%) | 51 (2.5%) |
| $22,500 to $24,999 | 7 (0.3%) | 32 (1.6%) |
| $25,000 to $29,999 | 76 (2.8%) | 66 (3.3%) |
| $30,000 to $34,999 | 68 (2.5%) | 58 (2.9%) |
| $35,000 to $39,999 | 135 (5.0%) | 256 (12.7%) |
| $40,000 to $44,999 | 172 (6.4%) | 174 (8.6%) |
| $45,000 to $49,999 | 81 (3.0%) | 51 (2.5%) |
| $50,000 to $54,999 | 85 (3.2%) | 74 (3.7%) |
| $55,000 to $64,999 | 236 (8.8%) | 188 (9.3%) |
| $65,000 to $74,999 | 154 (5.7%) | 114 (5.6%) |
| $75,000 to $99,999 | 371 (13.8%) | 211 (10.4%) |
| $100,000+ | 830 (30.8%) | 211 (10.4%) |
| Total | 2,692 (100.0%) | 2,024 (100.0%) |
Earnings by Sex by Educational Attainment in Smithfield
Average earnings in Smithfield are $73,156 for men and $41,750 for women, a difference of 42.9%. Men with an educational attainment of graduate degree enjoy the highest average annual earnings of $125,380, while those with less than high school education earn the least with $46,583. Women with an educational attainment of graduate degree earn the most with the average annual earnings of $87,031, while those with college or associate's degree education have the smallest earnings of $34,423.
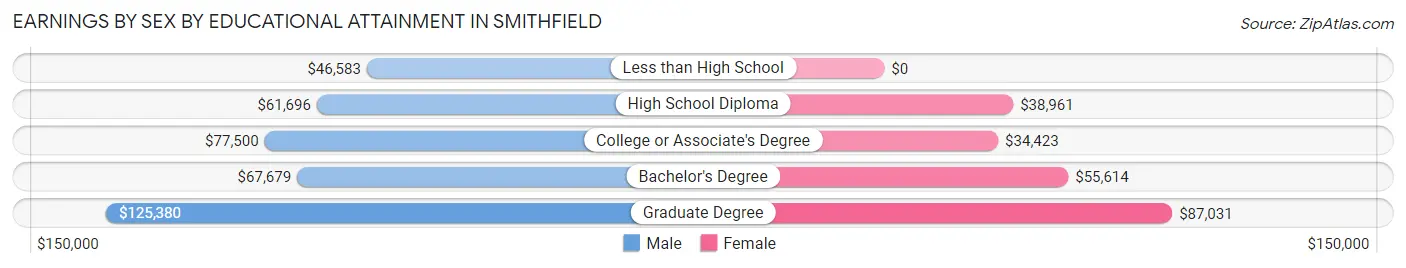
| Educational Attainment | Male Income | Female Income |
| Less than High School | $46,583 | $0 |
| High School Diploma | $61,696 | $38,961 |
| College or Associate's Degree | $77,500 | $34,423 |
| Bachelor's Degree | $67,679 | $55,614 |
| Graduate Degree | $125,380 | $87,031 |
| Total | $73,156 | $41,750 |
Family Income in Smithfield
Family Income Brackets in Smithfield
According to the Smithfield family income data, there are 628 families falling into the $150,000 to $199,999 income range, which is the most common income bracket and makes up 26.5% of all families. Conversely, the $10,000 to $14,999 income bracket is the least frequent group with only 40 families (1.7%) belonging to this category.
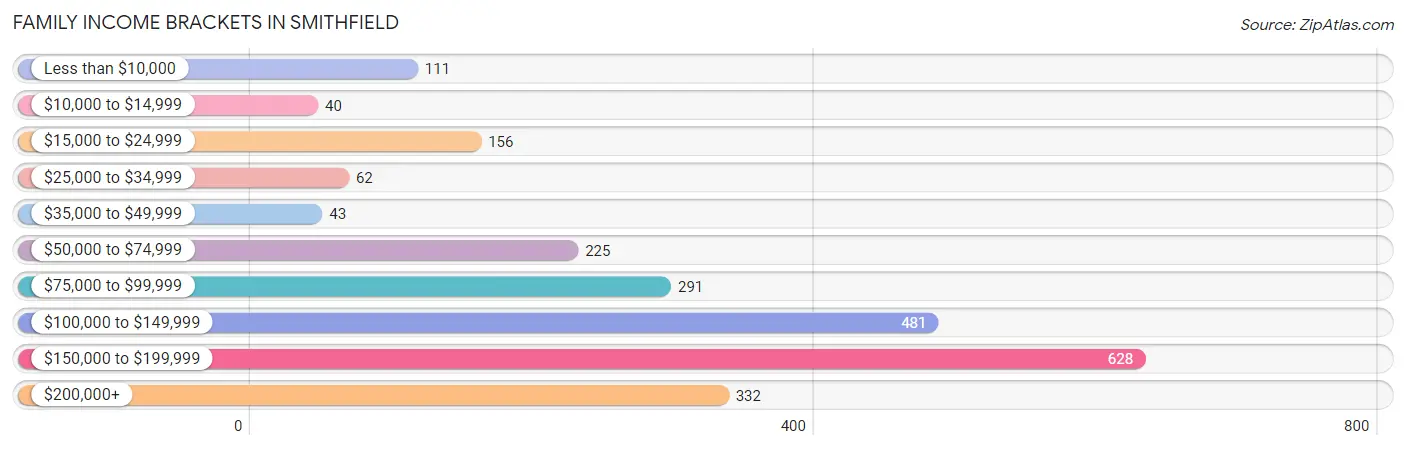
| Income Bracket | # Families | % Families |
| Less than $10,000 | 111 | 4.7% |
| $10,000 to $14,999 | 40 | 1.7% |
| $15,000 to $24,999 | 156 | 6.6% |
| $25,000 to $34,999 | 62 | 2.6% |
| $35,000 to $49,999 | 43 | 1.8% |
| $50,000 to $74,999 | 225 | 9.5% |
| $75,000 to $99,999 | 291 | 12.3% |
| $100,000 to $149,999 | 481 | 20.3% |
| $150,000 to $199,999 | 628 | 26.5% |
| $200,000+ | 332 | 14.0% |
Family Income by Famaliy Size in Smithfield
5-person families (117 | 4.9%) account for the highest median family income in Smithfield with $185,190 per family, while 3-person families (693 | 29.3%) have the highest median income of $52,899 per family member.
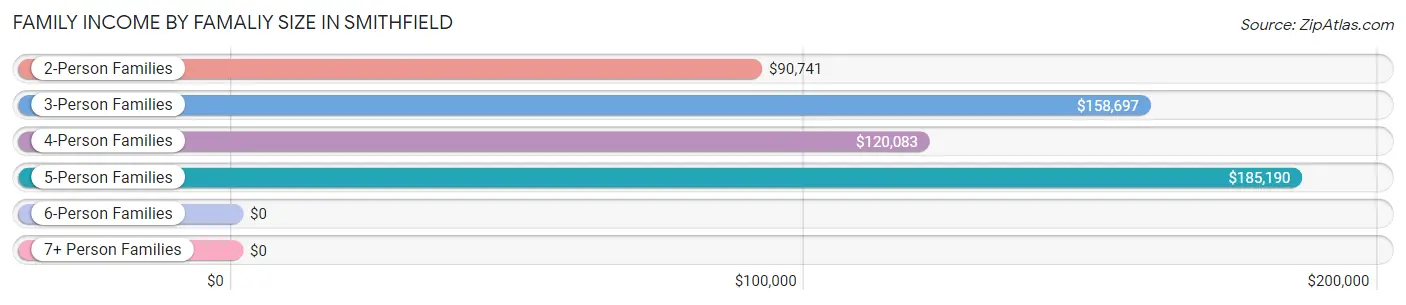
| Income Bracket | # Families | Median Income |
| 2-Person Families | 1,002 (42.3%) | $90,741 |
| 3-Person Families | 693 (29.3%) | $158,697 |
| 4-Person Families | 533 (22.5%) | $120,083 |
| 5-Person Families | 117 (4.9%) | $185,190 |
| 6-Person Families | 10 (0.4%) | $0 |
| 7+ Person Families | 13 (0.5%) | $0 |
| Total | 2,368 (100.0%) | $121,029 |
Family Income by Number of Earners in Smithfield
The median family income in Smithfield is $121,029, with families comprising 3+ earners (227) having the highest median family income of $188,750, while families with no earners (400) have the lowest median family income of $56,786, accounting for 9.6% and 16.9% of families, respectively.
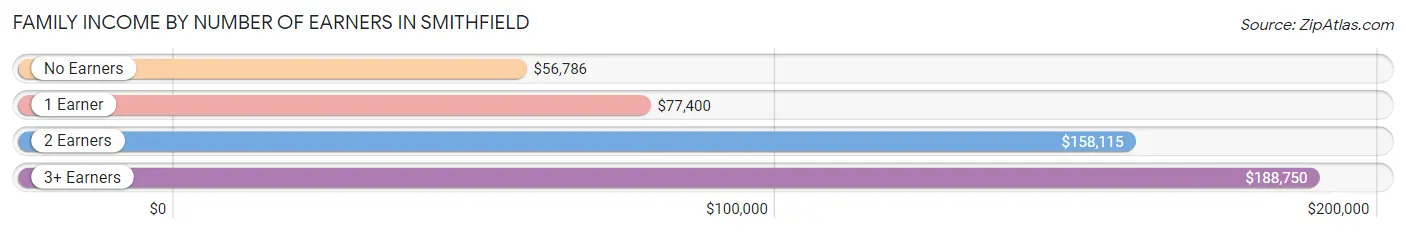
| Number of Earners | # Families | Median Income |
| No Earners | 400 (16.9%) | $56,786 |
| 1 Earner | 600 (25.3%) | $77,400 |
| 2 Earners | 1,141 (48.2%) | $158,115 |
| 3+ Earners | 227 (9.6%) | $188,750 |
| Total | 2,368 (100.0%) | $121,029 |
Household Income in Smithfield
Household Income Brackets in Smithfield
With 701 households falling in the category, the $100,000 to $149,999 income range is the most frequent in Smithfield, accounting for 20.5% of all households. In contrast, only 126 households (3.7%) fall into the $10,000 to $14,999 income bracket, making it the least populous group.
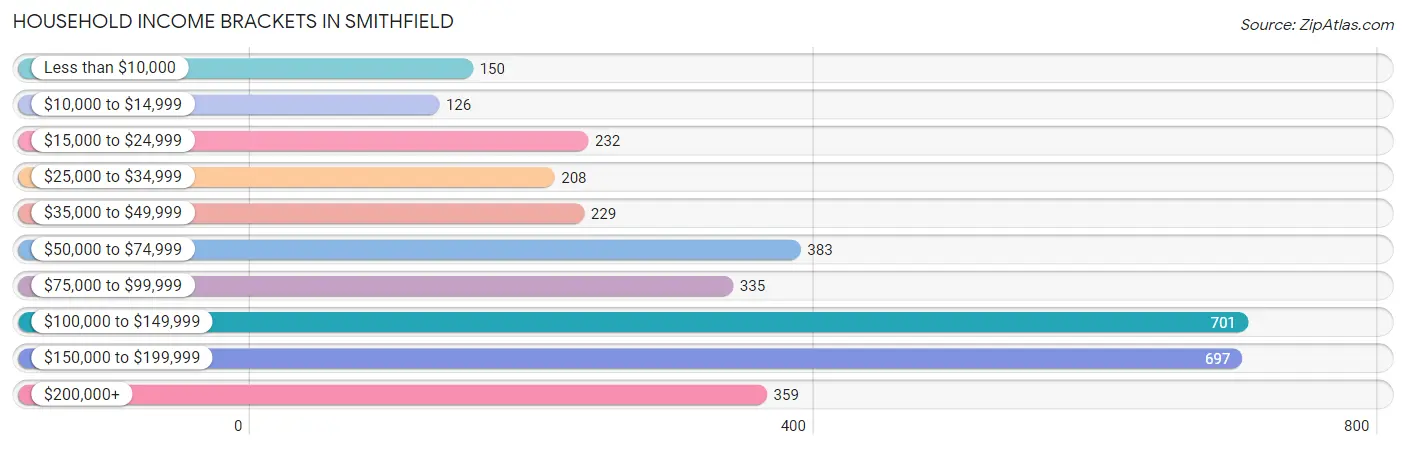
| Income Bracket | # Households | % Households |
| Less than $10,000 | 150 | 4.4% |
| $10,000 to $14,999 | 126 | 3.7% |
| $15,000 to $24,999 | 232 | 6.8% |
| $25,000 to $34,999 | 208 | 6.1% |
| $35,000 to $49,999 | 229 | 6.7% |
| $50,000 to $74,999 | 383 | 11.2% |
| $75,000 to $99,999 | 335 | 9.8% |
| $100,000 to $149,999 | 701 | 20.5% |
| $150,000 to $199,999 | 697 | 20.4% |
| $200,000+ | 359 | 10.5% |
Household Income by Householder Age in Smithfield
The median household income in Smithfield is $101,081, with the highest median household income of $142,572 found in the 45 to 64 years age bracket for the primary householder. A total of 1,634 households (47.8%) fall into this category. Meanwhile, the 15 to 24 years age bracket for the primary householder has the lowest median household income of $0, with 65 households (1.9%) in this group.
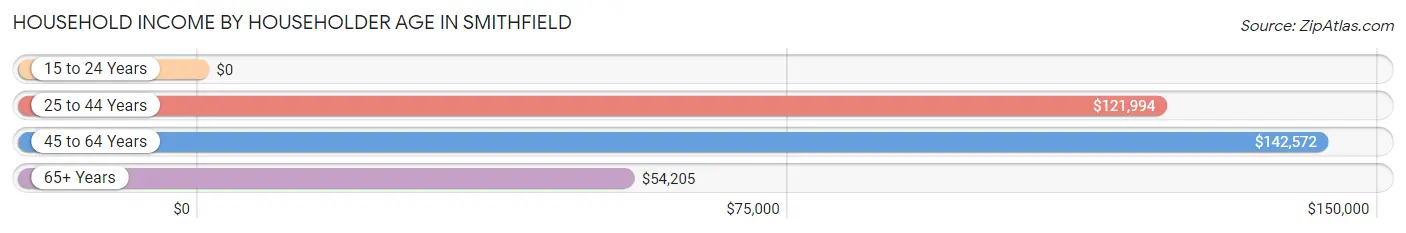
| Income Bracket | # Households | Median Income |
| 15 to 24 Years | 65 (1.9%) | $0 |
| 25 to 44 Years | 821 (24.0%) | $121,994 |
| 45 to 64 Years | 1,634 (47.8%) | $142,572 |
| 65+ Years | 898 (26.3%) | $54,205 |
| Total | 3,418 (100.0%) | $101,081 |
Poverty in Smithfield
Income Below Poverty by Sex and Age in Smithfield
With 7.2% poverty level for males and 17.4% for females among the residents of Smithfield, 12 to 14 year old males and 5 year old females are the most vulnerable to poverty, with 43 males (35.0%) and 86 females (68.8%) in their respective age groups living below the poverty level.
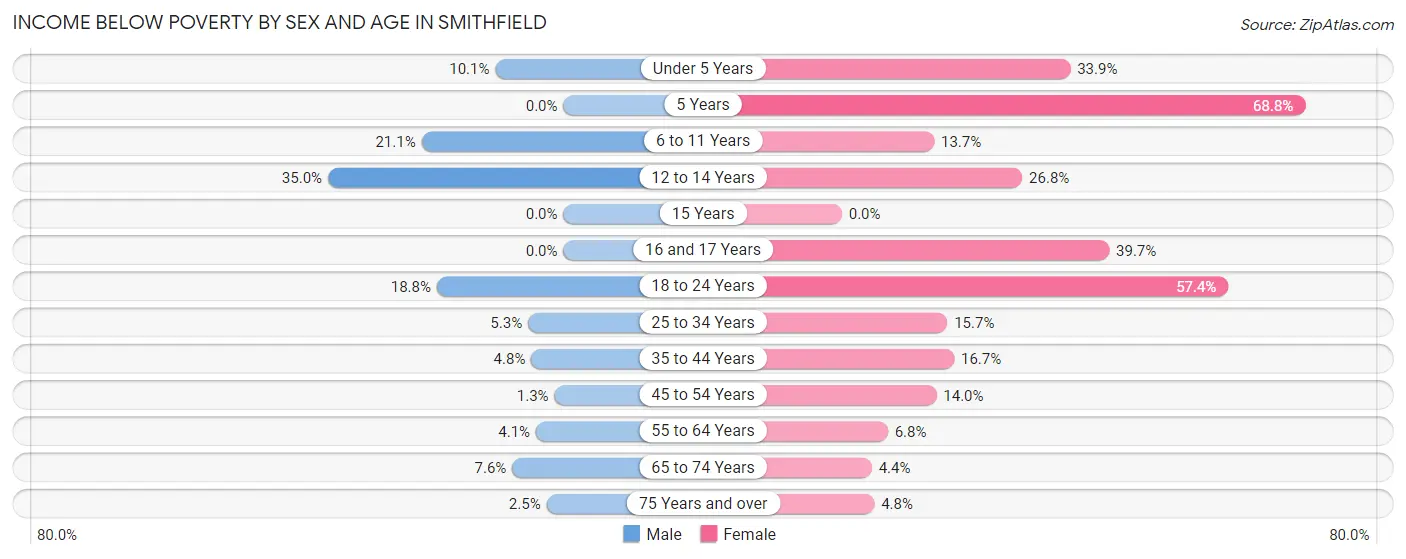
| Age Bracket | Male | Female |
| Under 5 Years | 28 (10.1%) | 97 (33.9%) |
| 5 Years | 0 (0.0%) | 86 (68.8%) |
| 6 to 11 Years | 59 (21.1%) | 20 (13.7%) |
| 12 to 14 Years | 43 (35.0%) | 49 (26.8%) |
| 15 Years | 0 (0.0%) | 0 (0.0%) |
| 16 and 17 Years | 0 (0.0%) | 52 (39.7%) |
| 18 to 24 Years | 56 (18.8%) | 109 (57.4%) |
| 25 to 34 Years | 32 (5.2%) | 101 (15.7%) |
| 35 to 44 Years | 19 (4.8%) | 65 (16.7%) |
| 45 to 54 Years | 10 (1.3%) | 74 (14.0%) |
| 55 to 64 Years | 31 (4.1%) | 49 (6.8%) |
| 65 to 74 Years | 19 (7.6%) | 22 (4.4%) |
| 75 Years and over | 9 (2.5%) | 19 (4.8%) |
| Total | 306 (7.2%) | 743 (17.4%) |
Income Above Poverty by Sex and Age in Smithfield
According to the poverty statistics in Smithfield, males aged 5 years and females aged 15 years are the age groups that are most secure financially, with 100.0% of males and 100.0% of females in these age groups living above the poverty line.
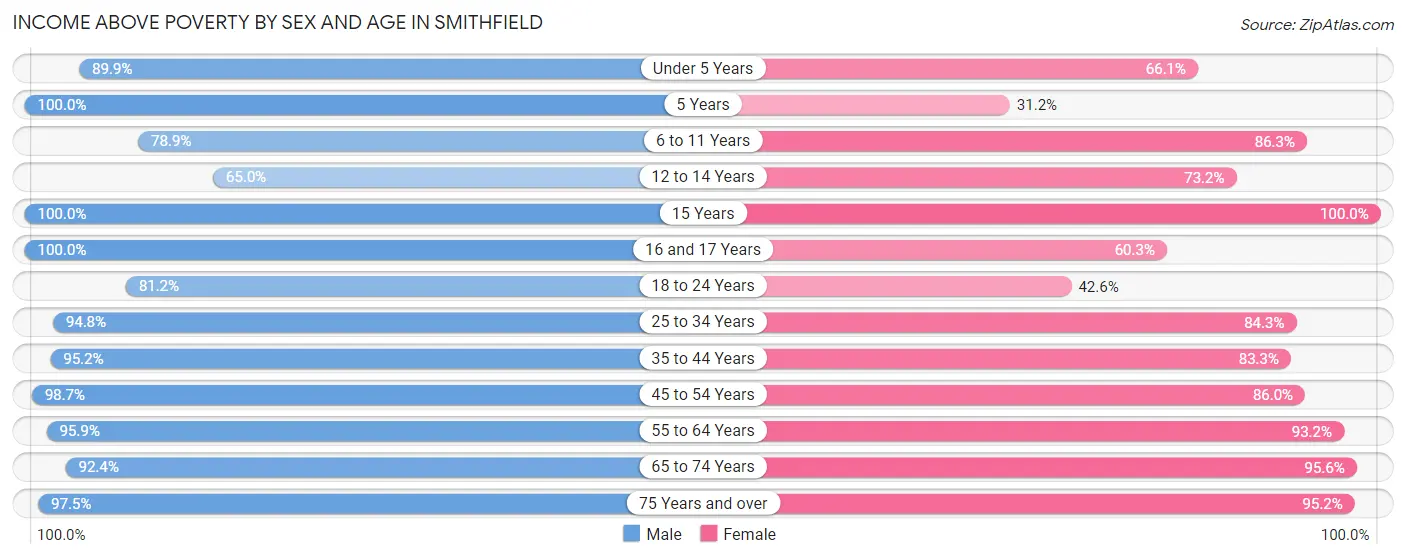
| Age Bracket | Male | Female |
| Under 5 Years | 249 (89.9%) | 189 (66.1%) |
| 5 Years | 11 (100.0%) | 39 (31.2%) |
| 6 to 11 Years | 221 (78.9%) | 126 (86.3%) |
| 12 to 14 Years | 80 (65.0%) | 134 (73.2%) |
| 15 Years | 69 (100.0%) | 33 (100.0%) |
| 16 and 17 Years | 77 (100.0%) | 79 (60.3%) |
| 18 to 24 Years | 242 (81.2%) | 81 (42.6%) |
| 25 to 34 Years | 577 (94.8%) | 544 (84.3%) |
| 35 to 44 Years | 379 (95.2%) | 325 (83.3%) |
| 45 to 54 Years | 746 (98.7%) | 453 (86.0%) |
| 55 to 64 Years | 731 (95.9%) | 670 (93.2%) |
| 65 to 74 Years | 231 (92.4%) | 474 (95.6%) |
| 75 Years and over | 351 (97.5%) | 375 (95.2%) |
| Total | 3,964 (92.8%) | 3,522 (82.6%) |
Income Below Poverty Among Married-Couple Families in Smithfield
The poverty statistics for married-couple families in Smithfield show that 3.3% or 62 of the total 1,910 families live below the poverty line. Families with 1 or 2 children have the highest poverty rate of 4.5%, comprising of 25 families. On the other hand, families with 3 or 4 children have the lowest poverty rate of 0.0%, which includes 0 families.
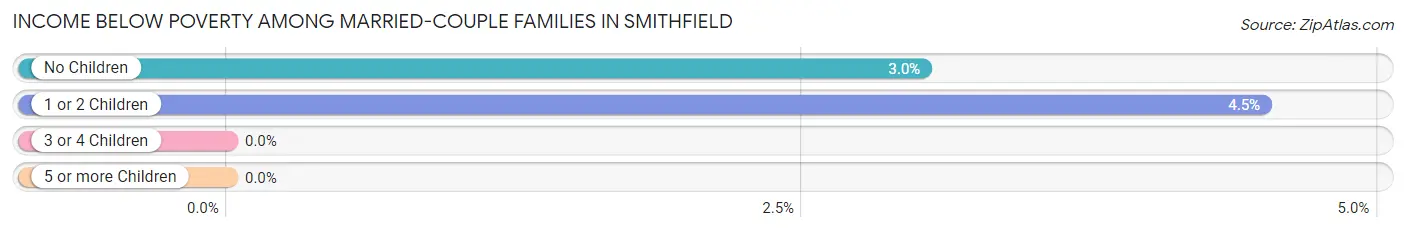
| Children | Above Poverty | Below Poverty |
| No Children | 1,188 (97.0%) | 37 (3.0%) |
| 1 or 2 Children | 531 (95.5%) | 25 (4.5%) |
| 3 or 4 Children | 129 (100.0%) | 0 (0.0%) |
| 5 or more Children | 0 (0.0%) | 0 (0.0%) |
| Total | 1,848 (96.8%) | 62 (3.3%) |
Income Below Poverty Among Single-Parent Households in Smithfield
According to the poverty data in Smithfield, 9.9% or 9 single-father households and 50.4% or 185 single-mother households are living below the poverty line. Among single-father households, those with 1 or 2 children have the highest poverty rate, with 9 households (52.9%) experiencing poverty. Likewise, among single-mother households, those with 3 or 4 children have the highest poverty rate, with 50 households (66.7%) falling below the poverty line.
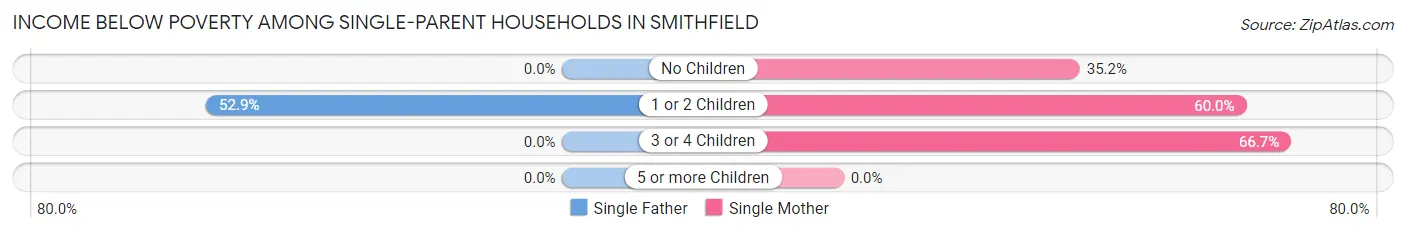
| Children | Single Father | Single Mother |
| No Children | 0 (0.0%) | 57 (35.2%) |
| 1 or 2 Children | 9 (52.9%) | 78 (60.0%) |
| 3 or 4 Children | 0 (0.0%) | 50 (66.7%) |
| 5 or more Children | 0 (0.0%) | 0 (0.0%) |
| Total | 9 (9.9%) | 185 (50.4%) |
Income Below Poverty Among Married-Couple vs Single-Parent Households in Smithfield
The poverty data for Smithfield shows that 62 of the married-couple family households (3.3%) and 194 of the single-parent households (42.4%) are living below the poverty level. Within the married-couple family households, those with 1 or 2 children have the highest poverty rate, with 25 households (4.5%) falling below the poverty line. Among the single-parent households, those with 3 or 4 children have the highest poverty rate, with 50 household (66.7%) living below poverty.
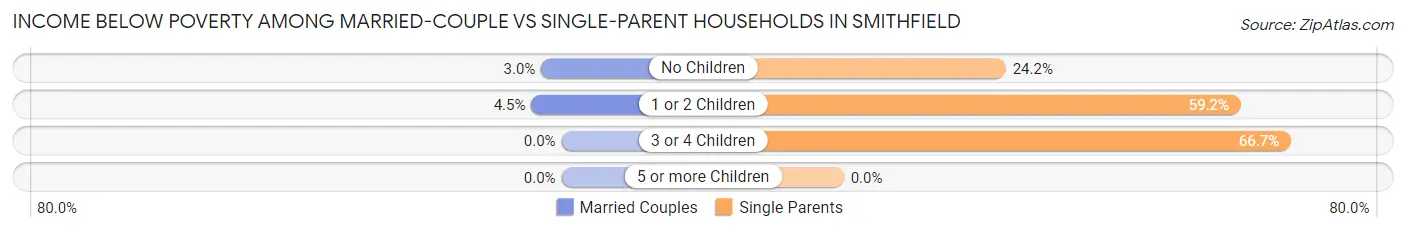
| Children | Married-Couple Families | Single-Parent Households |
| No Children | 37 (3.0%) | 57 (24.1%) |
| 1 or 2 Children | 25 (4.5%) | 87 (59.2%) |
| 3 or 4 Children | 0 (0.0%) | 50 (66.7%) |
| 5 or more Children | 0 (0.0%) | 0 (0.0%) |
| Total | 62 (3.3%) | 194 (42.4%) |
Race in Smithfield
The most populous races in Smithfield are White / Caucasian (6,169 | 71.5%), Black / African American (1,996 | 23.1%), and Hispanic or Latino (464 | 5.4%).
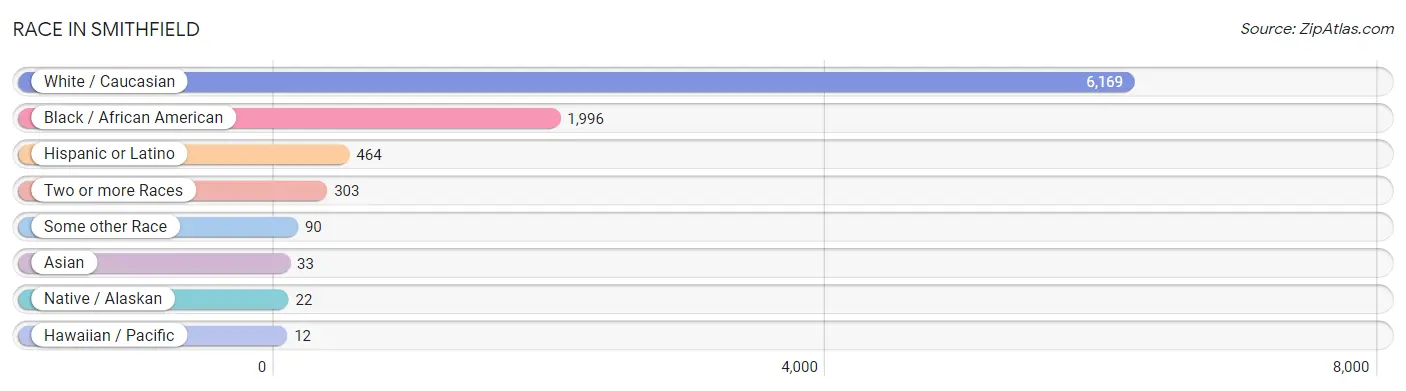
| Race | # Population | % Population |
| Asian | 33 | 0.4% |
| Black / African American | 1,996 | 23.1% |
| Hawaiian / Pacific | 12 | 0.1% |
| Hispanic or Latino | 464 | 5.4% |
| Native / Alaskan | 22 | 0.3% |
| White / Caucasian | 6,169 | 71.5% |
| Two or more Races | 303 | 3.5% |
| Some other Race | 90 | 1.0% |
| Total | 8,625 | 100.0% |
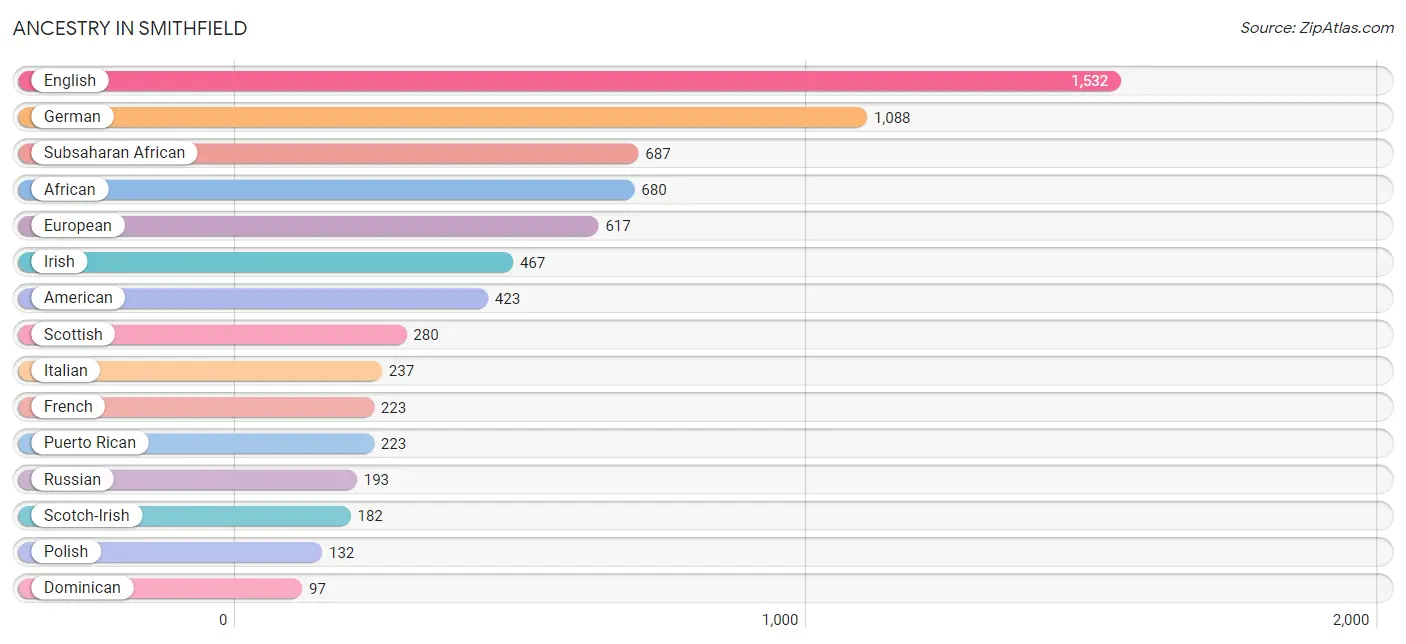
Ancestry in Smithfield
The most populous ancestries reported in Smithfield are English (1,532 | 17.8%), German (1,088 | 12.6%), Subsaharan African (687 | 8.0%), African (680 | 7.9%), and European (617 | 7.1%), together accounting for 53.4% of all Smithfield residents.
| Ancestry | # Population | % Population |
| African | 680 | 7.9% |
| American | 423 | 4.9% |
| Apache | 13 | 0.2% |
| Arab | 16 | 0.2% |
| Blackfeet | 23 | 0.3% |
| British | 62 | 0.7% |
| Burmese | 34 | 0.4% |
| Cape Verdean | 7 | 0.1% |
| Cherokee | 7 | 0.1% |
| Chippewa | 15 | 0.2% |
| Cuban | 62 | 0.7% |
| Czech | 23 | 0.3% |
| Dominican | 97 | 1.1% |
| Dutch | 26 | 0.3% |
| Eastern European | 9 | 0.1% |
| Ecuadorian | 12 | 0.1% |
| English | 1,532 | 17.8% |
| European | 617 | 7.1% |
| French | 223 | 2.6% |
| French Canadian | 51 | 0.6% |
| German | 1,088 | 12.6% |
| Hungarian | 15 | 0.2% |
| Irish | 467 | 5.4% |
| Iroquois | 15 | 0.2% |
| Italian | 237 | 2.8% |
| Jamaican | 55 | 0.6% |
| Lebanese | 16 | 0.2% |
| Mexican | 39 | 0.4% |
| Native Hawaiian | 12 | 0.1% |
| Northern European | 17 | 0.2% |
| Norwegian | 18 | 0.2% |
| Pennsylvania German | 6 | 0.1% |
| Polish | 132 | 1.5% |
| Portuguese | 27 | 0.3% |
| Puerto Rican | 223 | 2.6% |
| Russian | 193 | 2.2% |
| Scandinavian | 22 | 0.3% |
| Scotch-Irish | 182 | 2.1% |
| Scottish | 280 | 3.3% |
| South American | 12 | 0.1% |
| Spaniard | 31 | 0.4% |
| Sri Lankan | 56 | 0.6% |
| Subsaharan African | 687 | 8.0% |
| Swedish | 5 | 0.1% |
| Swiss | 10 | 0.1% |
| Ukrainian | 17 | 0.2% |
| Welsh | 94 | 1.1% | View All 47 Rows |
Immigrants in Smithfield
The most numerous immigrant groups reported in Smithfield came from Latin America (140 | 1.6%), Caribbean (128 | 1.5%), Europe (120 | 1.4%), Dominican Republic (63 | 0.7%), and Cuba (54 | 0.6%), together accounting for 5.8% of all Smithfield residents.
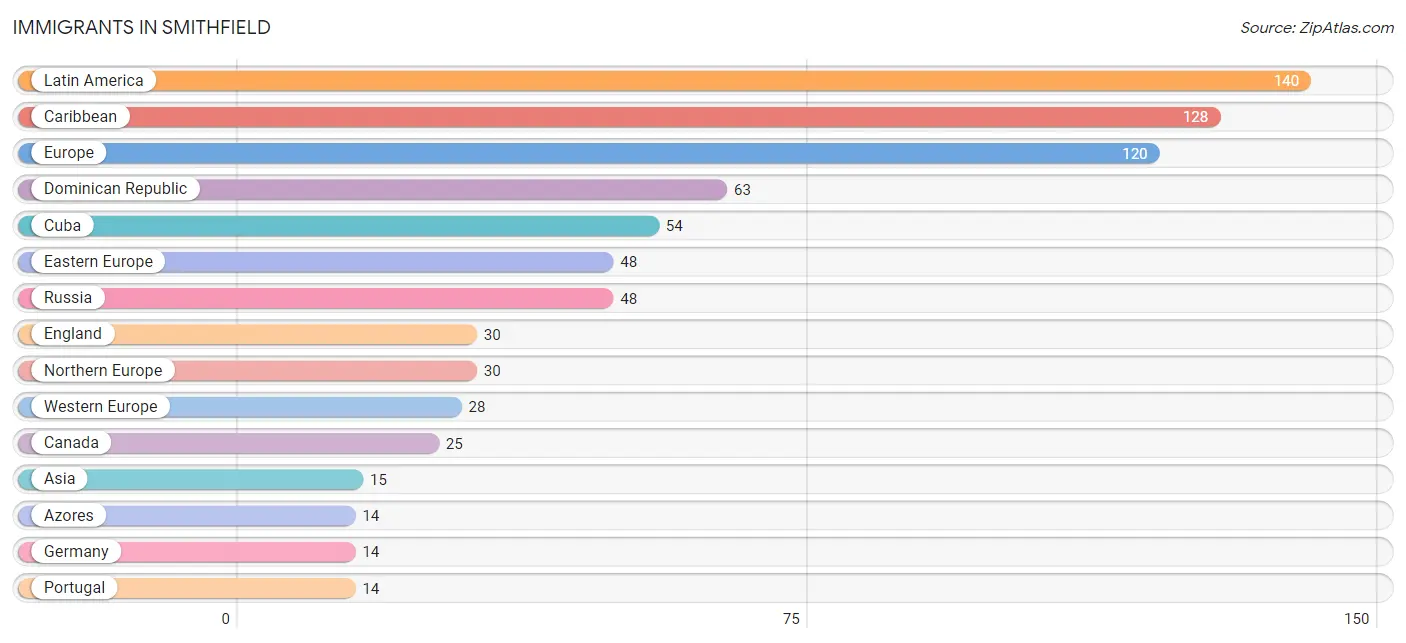
| Immigration Origin | # Population | % Population |
| Asia | 15 | 0.2% |
| Azores | 14 | 0.2% |
| Canada | 25 | 0.3% |
| Caribbean | 128 | 1.5% |
| Central America | 12 | 0.1% |
| Cuba | 54 | 0.6% |
| Dominican Republic | 63 | 0.7% |
| Eastern Asia | 6 | 0.1% |
| Eastern Europe | 48 | 0.6% |
| England | 30 | 0.4% |
| Europe | 120 | 1.4% |
| Germany | 14 | 0.2% |
| Jamaica | 11 | 0.1% |
| Korea | 6 | 0.1% |
| Latin America | 140 | 1.6% |
| Mexico | 12 | 0.1% |
| Northern Europe | 30 | 0.4% |
| Portugal | 14 | 0.2% |
| Russia | 48 | 0.6% |
| South Central Asia | 9 | 0.1% |
| Southern Europe | 14 | 0.2% |
| Switzerland | 14 | 0.2% |
| Western Europe | 28 | 0.3% | View All 23 Rows |
Sex and Age in Smithfield
Sex and Age in Smithfield
The most populous age groups in Smithfield are 45 to 49 Years (418 | 9.7%) for men and 25 to 29 Years (425 | 9.9%) for women.
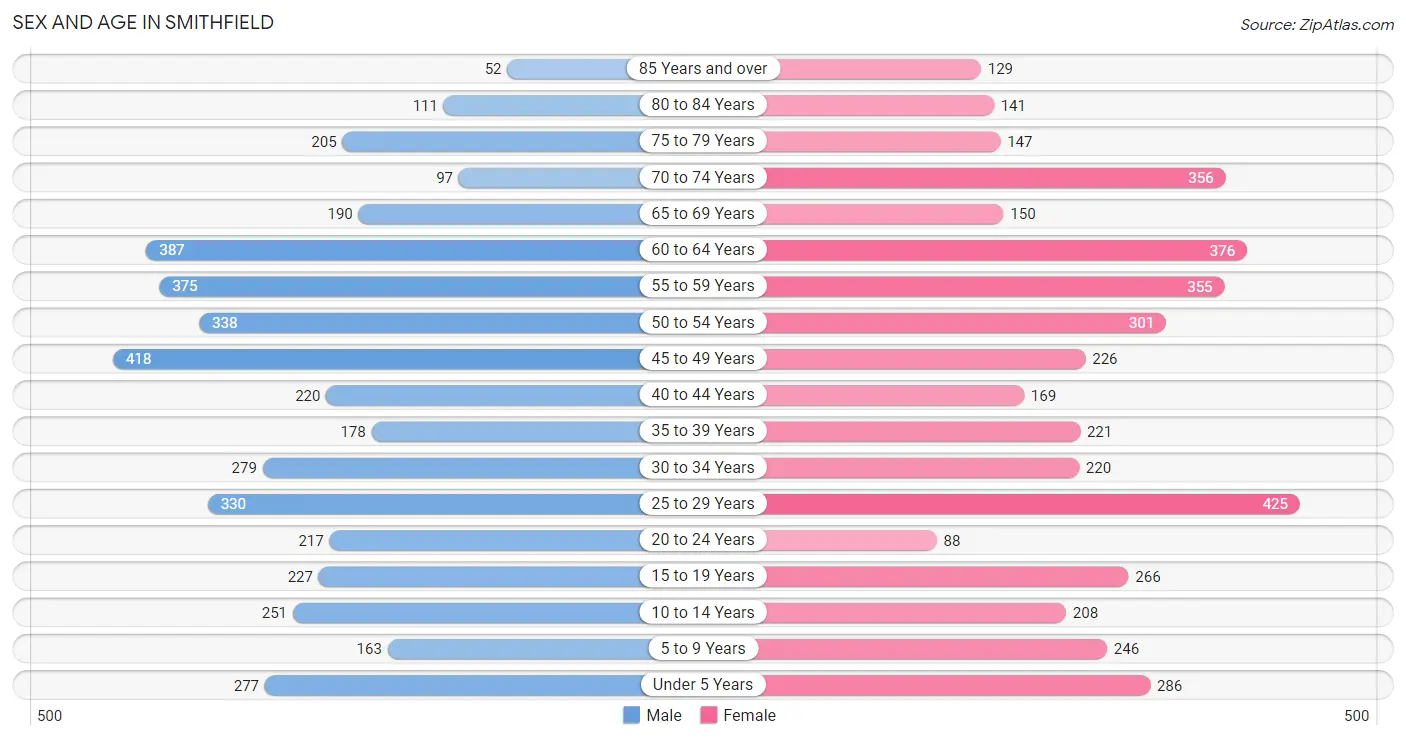
| Age Bracket | Male | Female |
| Under 5 Years | 277 (6.4%) | 286 (6.6%) |
| 5 to 9 Years | 163 (3.8%) | 246 (5.7%) |
| 10 to 14 Years | 251 (5.8%) | 208 (4.8%) |
| 15 to 19 Years | 227 (5.3%) | 266 (6.2%) |
| 20 to 24 Years | 217 (5.0%) | 88 (2.0%) |
| 25 to 29 Years | 330 (7.6%) | 425 (9.9%) |
| 30 to 34 Years | 279 (6.5%) | 220 (5.1%) |
| 35 to 39 Years | 178 (4.1%) | 221 (5.1%) |
| 40 to 44 Years | 220 (5.1%) | 169 (3.9%) |
| 45 to 49 Years | 418 (9.7%) | 226 (5.2%) |
| 50 to 54 Years | 338 (7.8%) | 301 (7.0%) |
| 55 to 59 Years | 375 (8.7%) | 355 (8.2%) |
| 60 to 64 Years | 387 (9.0%) | 376 (8.7%) |
| 65 to 69 Years | 190 (4.4%) | 150 (3.5%) |
| 70 to 74 Years | 97 (2.2%) | 356 (8.3%) |
| 75 to 79 Years | 205 (4.8%) | 147 (3.4%) |
| 80 to 84 Years | 111 (2.6%) | 141 (3.3%) |
| 85 Years and over | 52 (1.2%) | 129 (3.0%) |
| Total | 4,315 (100.0%) | 4,310 (100.0%) |
Families and Households in Smithfield
Median Family Size in Smithfield
The median family size in Smithfield is 3.00 persons per family, with single female/mother families (367 | 15.5%) accounting for the largest median family size of 3.26 persons per family. On the other hand, single male/father families (91 | 3.8%) represent the smallest median family size with 2.09 persons per family.
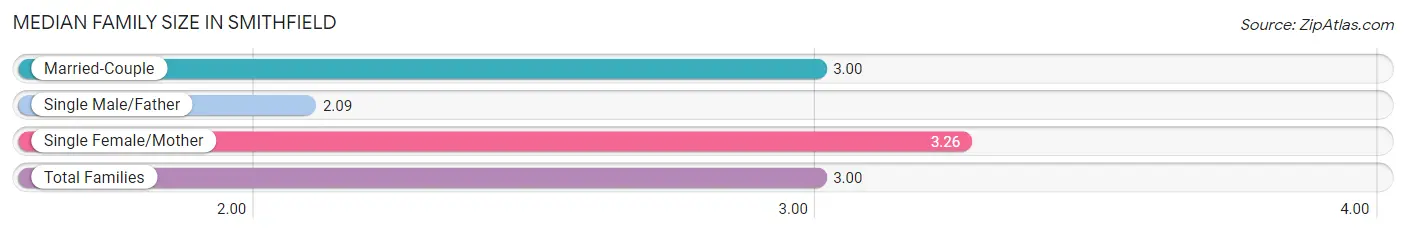
| Family Type | # Families | Family Size |
| Married-Couple | 1,910 (80.7%) | 3.00 |
| Single Male/Father | 91 (3.8%) | 2.09 |
| Single Female/Mother | 367 (15.5%) | 3.26 |
| Total Families | 2,368 (100.0%) | 3.00 |
Median Household Size in Smithfield
The median household size in Smithfield is 2.50 persons per household, with single female/mother households (367 | 10.7%) accounting for the largest median household size of 3.28 persons per household. non-family households (1,050 | 30.7%) represent the smallest median household size with 1.32 persons per household.
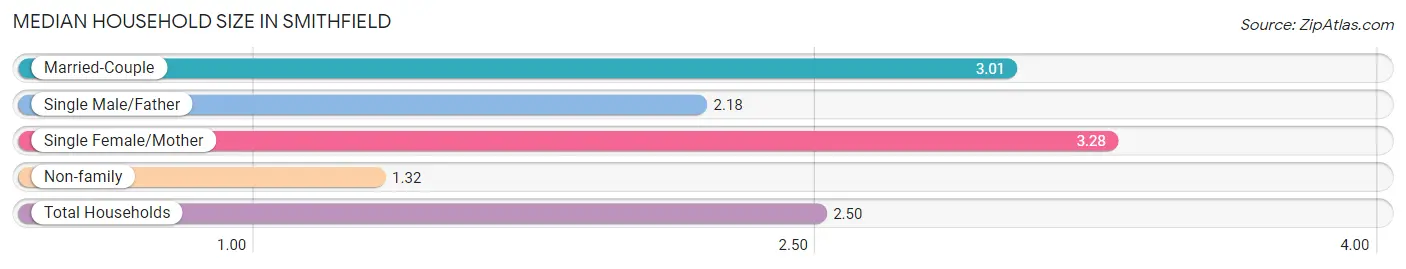
| Household Type | # Households | Household Size |
| Married-Couple | 1,910 (55.9%) | 3.01 |
| Single Male/Father | 91 (2.7%) | 2.18 |
| Single Female/Mother | 367 (10.7%) | 3.28 |
| Non-family | 1,050 (30.7%) | 1.32 |
| Total Households | 3,418 (100.0%) | 2.50 |
Household Size by Marriage Status in Smithfield
Out of a total of 3,418 households in Smithfield, 2,368 (69.3%) are family households, while 1,050 (30.7%) are nonfamily households. The most numerous type of family households are 2-person households, comprising 994, and the most common type of nonfamily households are 1-person households, comprising 778.
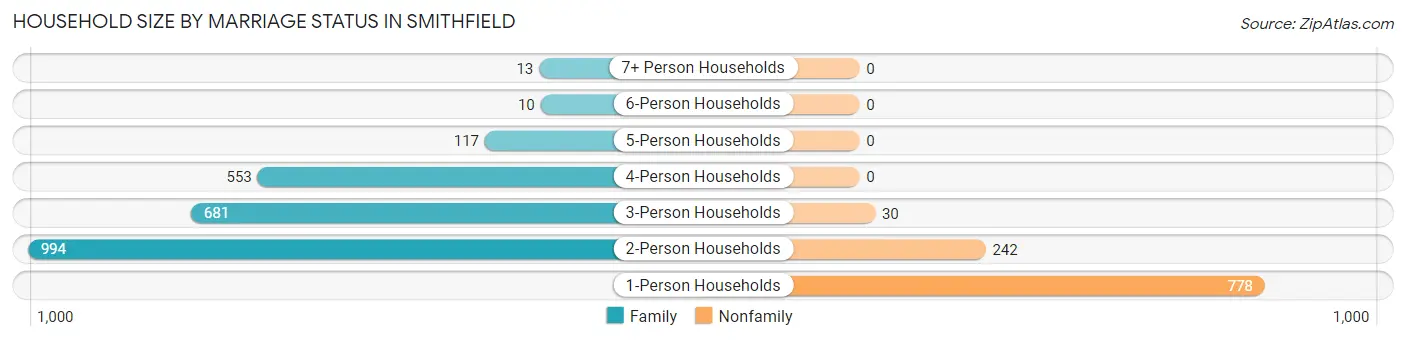
| Household Size | Family Households | Nonfamily Households |
| 1-Person Households | - | 778 (22.8%) |
| 2-Person Households | 994 (29.1%) | 242 (7.1%) |
| 3-Person Households | 681 (19.9%) | 30 (0.9%) |
| 4-Person Households | 553 (16.2%) | 0 (0.0%) |
| 5-Person Households | 117 (3.4%) | 0 (0.0%) |
| 6-Person Households | 10 (0.3%) | 0 (0.0%) |
| 7+ Person Households | 13 (0.4%) | 0 (0.0%) |
| Total | 2,368 (69.3%) | 1,050 (30.7%) |
Female Fertility in Smithfield
Fertility by Age in Smithfield
Average fertility rate in Smithfield is 94.0 births per 1,000 women. Women in the age bracket of 20 to 34 years have the highest fertility rate with 210.0 births per 1,000 women. Women in the age bracket of 20 to 34 years acount for 95.7% of all women with births.
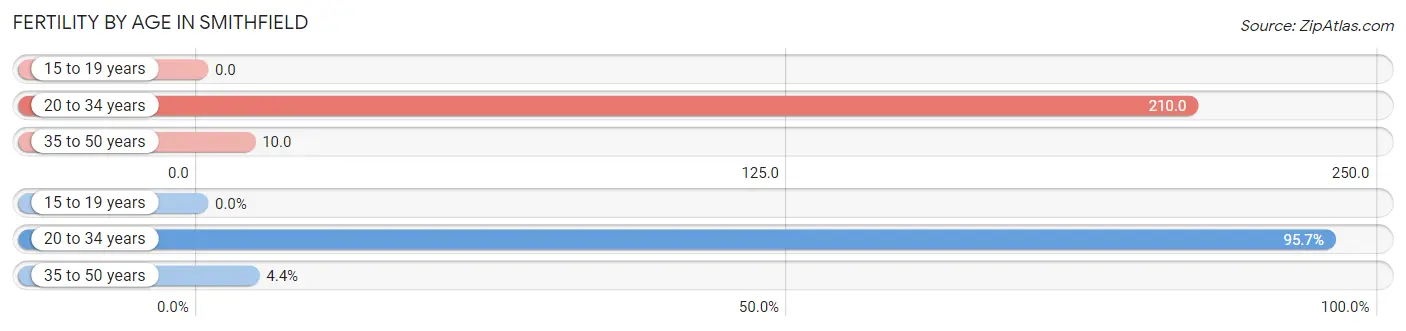
| Age Bracket | Women with Births | Births / 1,000 Women |
| 15 to 19 years | 0 (0.0%) | 0.0 |
| 20 to 34 years | 154 (95.7%) | 210.0 |
| 35 to 50 years | 7 (4.3%) | 10.0 |
| Total | 161 (100.0%) | 94.0 |
Fertility by Age by Marriage Status in Smithfield
73.3% of women with births (161) in Smithfield are married. The highest percentage of unmarried women with births falls into 20 to 34 years age bracket with 27.9% of them unmarried at the time of birth, while the lowest percentage of unmarried women with births belong to 35 to 50 years age bracket with 0.0% of them unmarried.
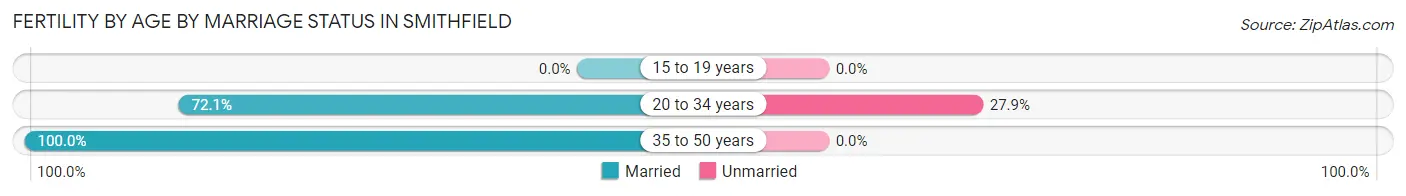
| Age Bracket | Married | Unmarried |
| 15 to 19 years | 0 (0.0%) | 0 (0.0%) |
| 20 to 34 years | 111 (72.1%) | 43 (27.9%) |
| 35 to 50 years | 7 (100.0%) | 0 (0.0%) |
| Total | 118 (73.3%) | 43 (26.7%) |
Fertility by Education in Smithfield
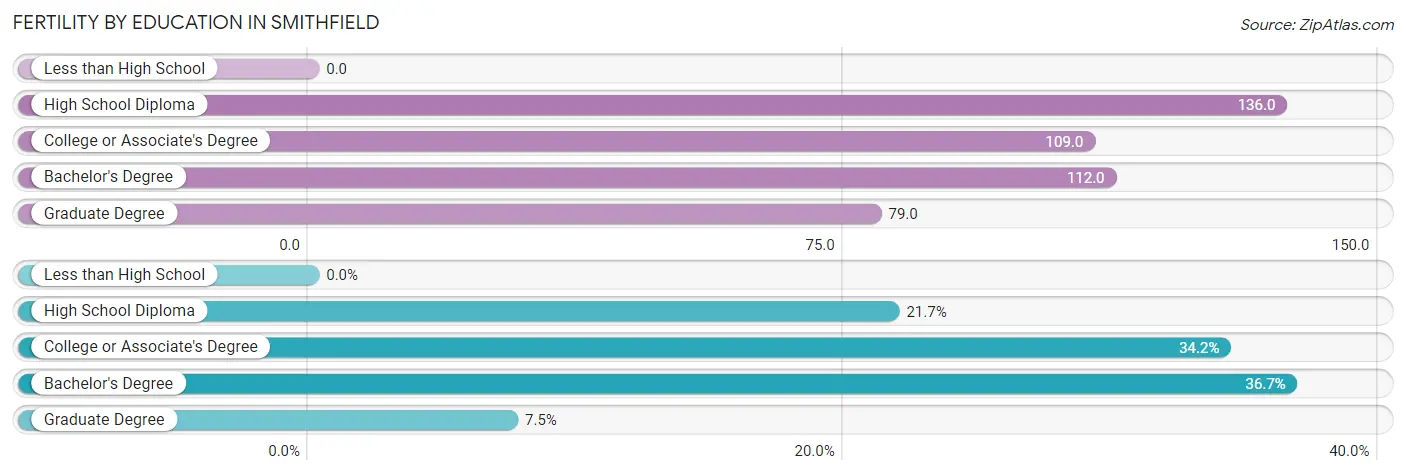
| Educational Attainment | Women with Births | Births / 1,000 Women |
| Less than High School | 0 (0.0%) | 0.0 |
| High School Diploma | 35 (21.7%) | 136.0 |
| College or Associate's Degree | 55 (34.2%) | 109.0 |
| Bachelor's Degree | 59 (36.6%) | 112.0 |
| Graduate Degree | 12 (7.4%) | 79.0 |
| Total | 161 (100.0%) | 94.0 |
Fertility by Education by Marriage Status in Smithfield
26.7% of women with births in Smithfield are unmarried. Women with the educational attainment of bachelor's degree are most likely to be married with 100.0% of them married at childbirth, while women with the educational attainment of high school diploma are least likely to be married with 100.0% of them unmarried at childbirth.
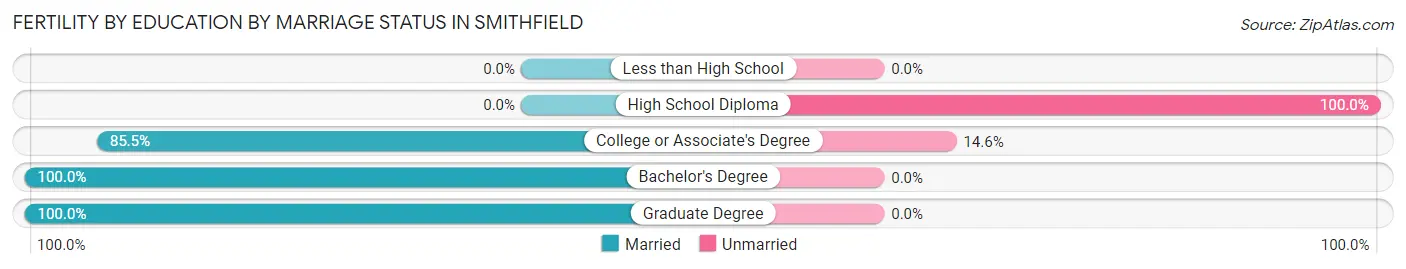
| Educational Attainment | Married | Unmarried |
| Less than High School | 0 (0.0%) | 0 (0.0%) |
| High School Diploma | 0 (0.0%) | 35 (100.0%) |
| College or Associate's Degree | 47 (85.5%) | 8 (14.5%) |
| Bachelor's Degree | 59 (100.0%) | 0 (0.0%) |
| Graduate Degree | 12 (100.0%) | 0 (0.0%) |
| Total | 118 (73.3%) | 43 (26.7%) |
Employment Characteristics in Smithfield
Employment by Class of Employer in Smithfield
Among the 4,041 employed individuals in Smithfield, private company employees (2,710 | 67.1%), federal government employees (364 | 9.0%), and not-for-profit organizations (274 | 6.8%) make up the most common classes of employment.
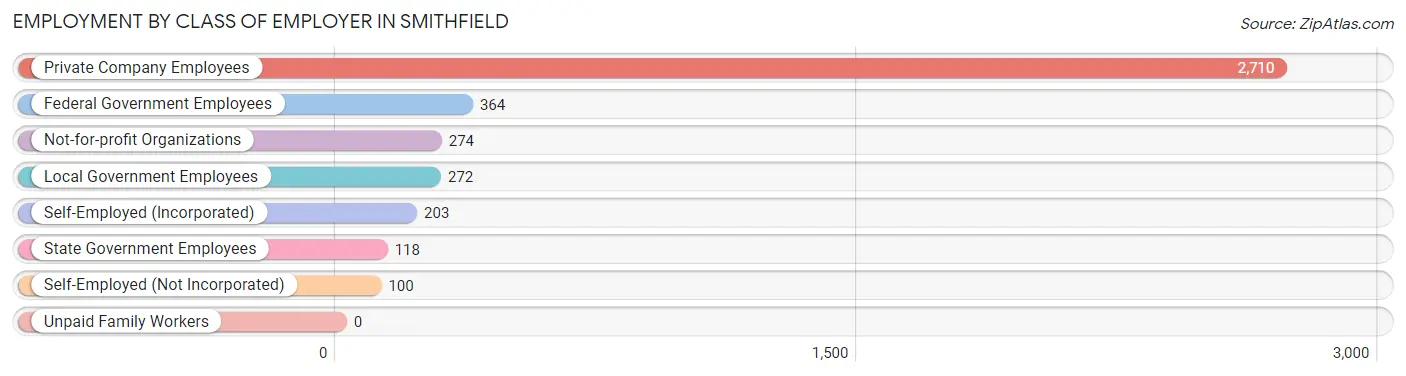
| Employer Class | # Employees | % Employees |
| Private Company Employees | 2,710 | 67.1% |
| Self-Employed (Incorporated) | 203 | 5.0% |
| Self-Employed (Not Incorporated) | 100 | 2.5% |
| Not-for-profit Organizations | 274 | 6.8% |
| Local Government Employees | 272 | 6.7% |
| State Government Employees | 118 | 2.9% |
| Federal Government Employees | 364 | 9.0% |
| Unpaid Family Workers | 0 | 0.0% |
| Total | 4,041 | 100.0% |
Employment Status by Age in Smithfield
According to the labor force statistics for Smithfield, out of the total population over 16 years of age (7,092), 62.6% or 4,440 individuals are in the labor force, with 4.7% or 209 of them unemployed. The age group with the highest labor force participation rate is 30 to 34 years, with 95.6% or 477 individuals in the labor force. Within the labor force, the 16 to 19 years age range has the highest percentage of unemployed individuals, with 12.3% or 26 of them being unemployed.
| Age Bracket | In Labor Force | Unemployed |
| 16 to 19 Years | 211 (54.0%) | 26 (12.3%) |
| 20 to 24 Years | 201 (65.9%) | 21 (10.5%) |
| 25 to 29 Years | 568 (75.2%) | 30 (5.3%) |
| 30 to 34 Years | 477 (95.6%) | 14 (3.0%) |
| 35 to 44 Years | 678 (86.0%) | 64 (9.4%) |
| 45 to 54 Years | 1,085 (84.6%) | 40 (3.7%) |
| 55 to 59 Years | 544 (74.5%) | 0 (0.0%) |
| 60 to 64 Years | 414 (54.3%) | 7 (1.7%) |
| 65 to 74 Years | 192 (24.2%) | 0 (0.0%) |
| 75 Years and over | 68 (8.7%) | 6 (8.8%) |
| Total | 4,440 (62.6%) | 209 (4.7%) |
Employment Status by Educational Attainment in Smithfield
According to labor force statistics for Smithfield, 78.2% of individuals (3,768) out of the total population between 25 and 64 years of age (4,818) are in the labor force, with 4.1% or 154 of them being unemployed. The group with the highest labor force participation rate are those with the educational attainment of bachelor's degree or higher, with 89.8% or 1,519 individuals in the labor force. Within the labor force, individuals with less than high school education have the highest percentage of unemployment, with 25.7% or 28 of them being unemployed.
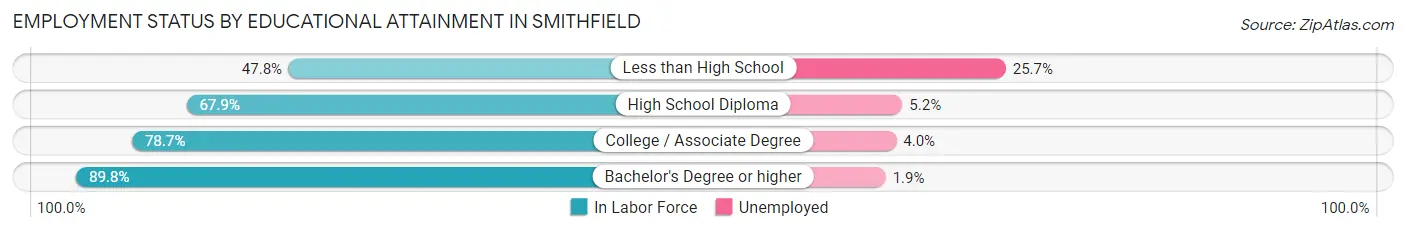
| Educational Attainment | In Labor Force | Unemployed |
| Less than High School | 109 (47.8%) | 59 (25.7%) |
| High School Diploma | 904 (67.9%) | 69 (5.2%) |
| College / Associate Degree | 1,233 (78.7%) | 63 (4.0%) |
| Bachelor's Degree or higher | 1,519 (89.8%) | 32 (1.9%) |
| Total | 3,768 (78.2%) | 198 (4.1%) |
Employment Occupations by Sex in Smithfield
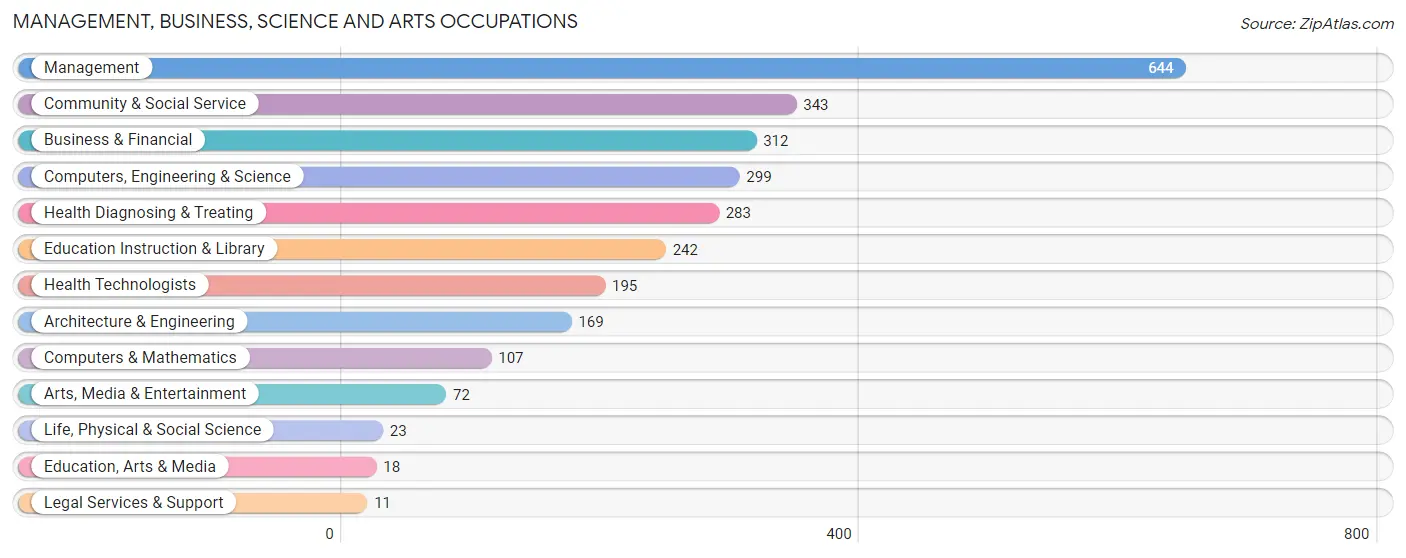
Management, Business, Science and Arts Occupations
The most common Management, Business, Science and Arts occupations in Smithfield are Management (644 | 15.8%), Community & Social Service (343 | 8.4%), Business & Financial (312 | 7.7%), Computers, Engineering & Science (299 | 7.3%), and Health Diagnosing & Treating (283 | 6.9%).
Management, Business, Science and Arts Occupations by Sex
Within the Management, Business, Science and Arts occupations in Smithfield, the most male-oriented occupations are Education, Arts & Media (100.0%), Architecture & Engineering (81.1%), and Computers & Mathematics (79.4%), while the most female-oriented occupations are Legal Services & Support (100.0%), Health Technologists (100.0%), and Education Instruction & Library (95.0%).
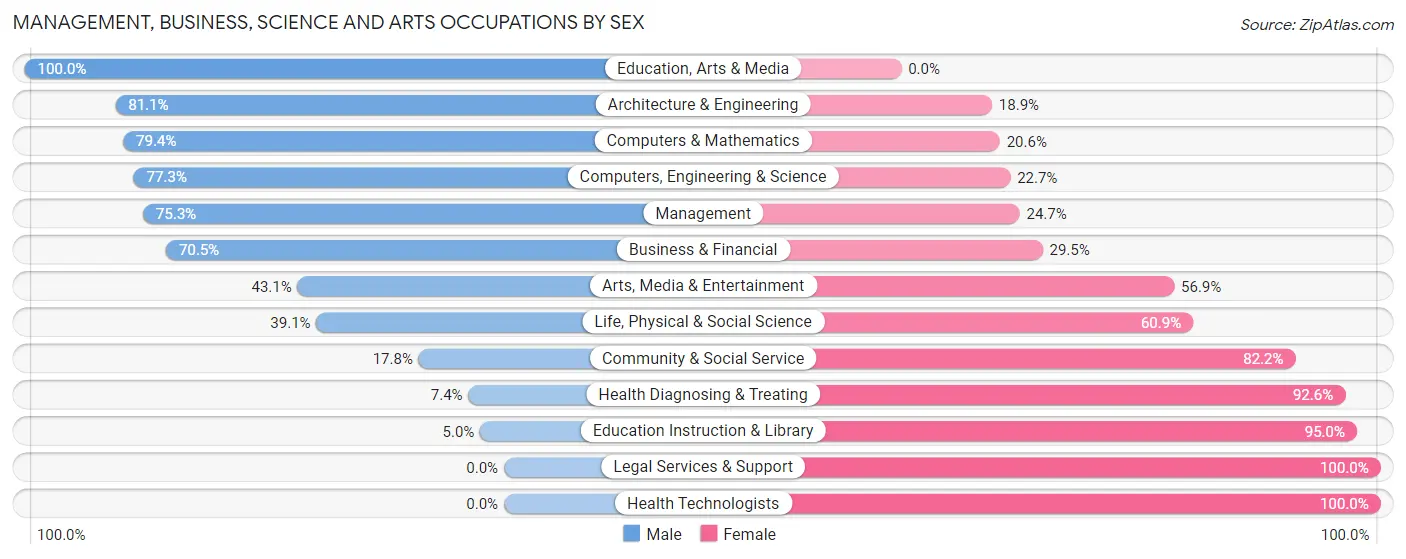
| Occupation | Male | Female |
| Management | 485 (75.3%) | 159 (24.7%) |
| Business & Financial | 220 (70.5%) | 92 (29.5%) |
| Computers, Engineering & Science | 231 (77.3%) | 68 (22.7%) |
| Computers & Mathematics | 85 (79.4%) | 22 (20.6%) |
| Architecture & Engineering | 137 (81.1%) | 32 (18.9%) |
| Life, Physical & Social Science | 9 (39.1%) | 14 (60.9%) |
| Community & Social Service | 61 (17.8%) | 282 (82.2%) |
| Education, Arts & Media | 18 (100.0%) | 0 (0.0%) |
| Legal Services & Support | 0 (0.0%) | 11 (100.0%) |
| Education Instruction & Library | 12 (5.0%) | 230 (95.0%) |
| Arts, Media & Entertainment | 31 (43.1%) | 41 (56.9%) |
| Health Diagnosing & Treating | 21 (7.4%) | 262 (92.6%) |
| Health Technologists | 0 (0.0%) | 195 (100.0%) |
| Total (Category) | 1,018 (54.1%) | 863 (45.9%) |
| Total (Overall) | 2,229 (54.7%) | 1,846 (45.3%) |
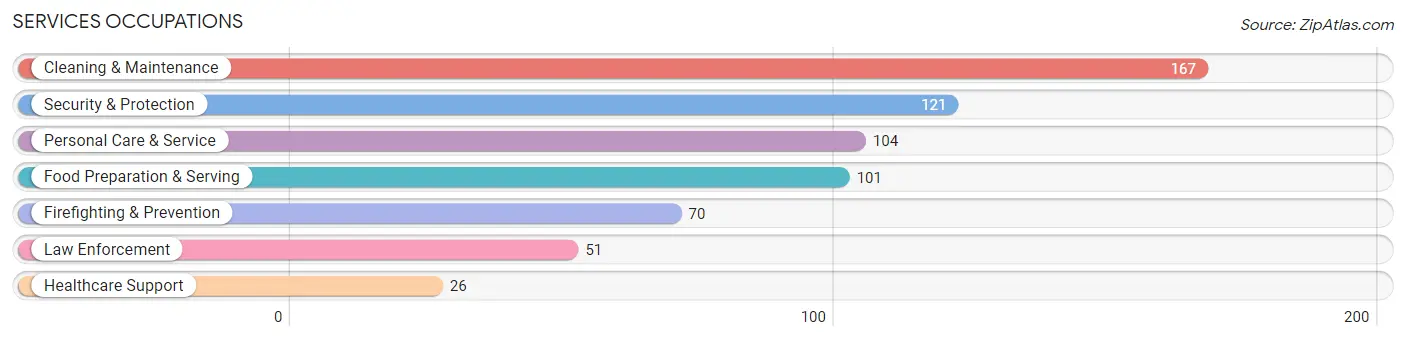
Services Occupations
The most common Services occupations in Smithfield are Cleaning & Maintenance (167 | 4.1%), Security & Protection (121 | 3.0%), Personal Care & Service (104 | 2.5%), Food Preparation & Serving (101 | 2.5%), and Firefighting & Prevention (70 | 1.7%).
Services Occupations by Sex
Within the Services occupations in Smithfield, the most male-oriented occupations are Firefighting & Prevention (100.0%), Cleaning & Maintenance (86.2%), and Security & Protection (83.5%), while the most female-oriented occupations are Healthcare Support (100.0%), Food Preparation & Serving (88.1%), and Personal Care & Service (70.2%).
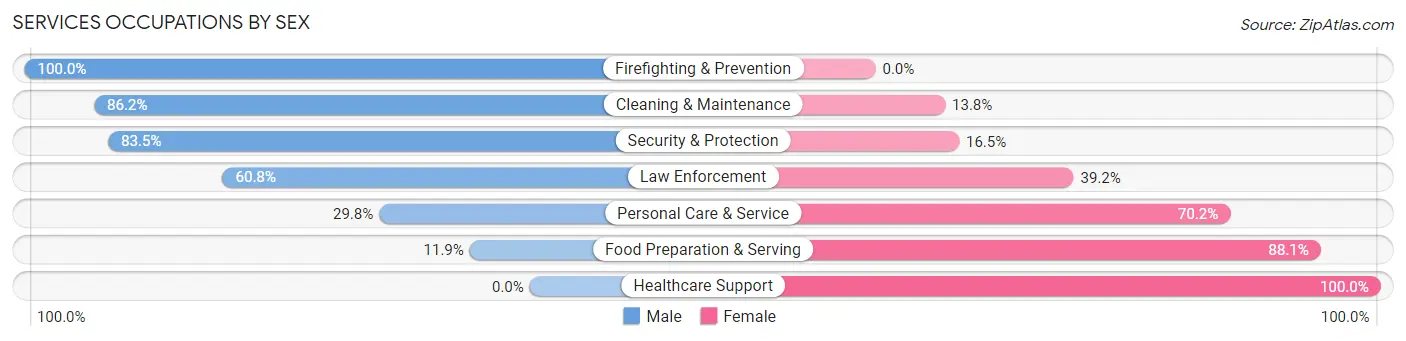
| Occupation | Male | Female |
| Healthcare Support | 0 (0.0%) | 26 (100.0%) |
| Security & Protection | 101 (83.5%) | 20 (16.5%) |
| Firefighting & Prevention | 70 (100.0%) | 0 (0.0%) |
| Law Enforcement | 31 (60.8%) | 20 (39.2%) |
| Food Preparation & Serving | 12 (11.9%) | 89 (88.1%) |
| Cleaning & Maintenance | 144 (86.2%) | 23 (13.8%) |
| Personal Care & Service | 31 (29.8%) | 73 (70.2%) |
| Total (Category) | 288 (55.5%) | 231 (44.5%) |
| Total (Overall) | 2,229 (54.7%) | 1,846 (45.3%) |
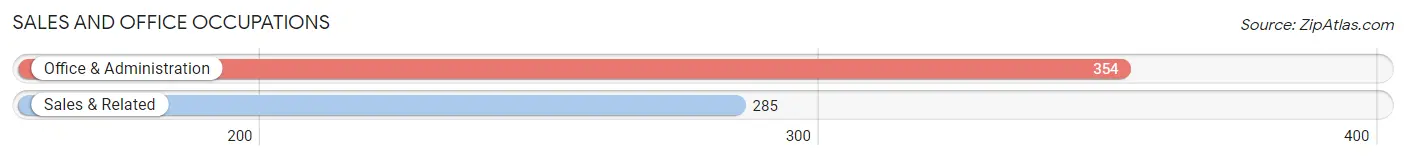
Sales and Office Occupations
The most common Sales and Office occupations in Smithfield are Office & Administration (354 | 8.7%), and Sales & Related (285 | 7.0%).
Sales and Office Occupations by Sex
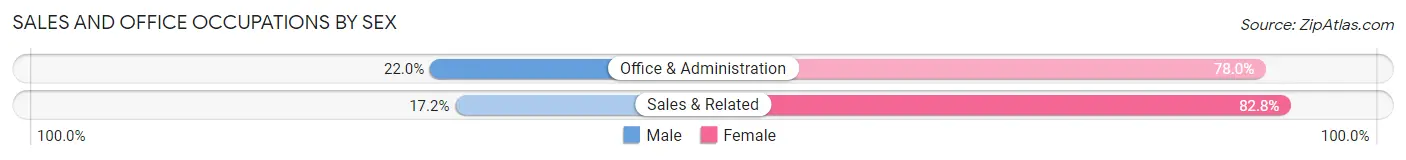
| Occupation | Male | Female |
| Sales & Related | 49 (17.2%) | 236 (82.8%) |
| Office & Administration | 78 (22.0%) | 276 (78.0%) |
| Total (Category) | 127 (19.9%) | 512 (80.1%) |
| Total (Overall) | 2,229 (54.7%) | 1,846 (45.3%) |
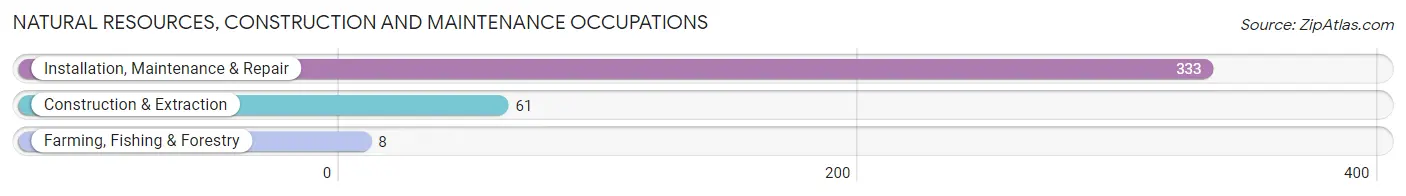
Natural Resources, Construction and Maintenance Occupations
The most common Natural Resources, Construction and Maintenance occupations in Smithfield are Installation, Maintenance & Repair (333 | 8.2%), Construction & Extraction (61 | 1.5%), and Farming, Fishing & Forestry (8 | 0.2%).
Natural Resources, Construction and Maintenance Occupations by Sex
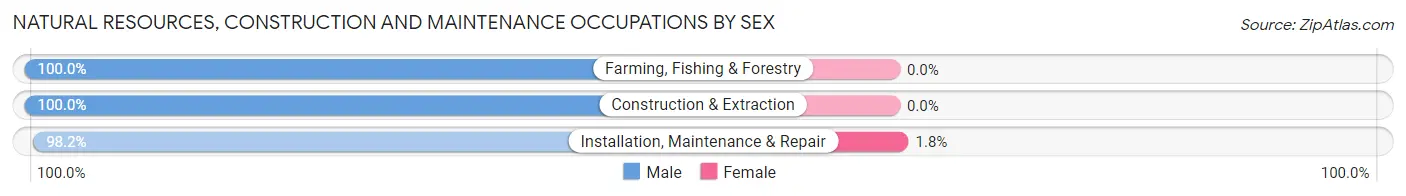
| Occupation | Male | Female |
| Farming, Fishing & Forestry | 8 (100.0%) | 0 (0.0%) |
| Construction & Extraction | 61 (100.0%) | 0 (0.0%) |
| Installation, Maintenance & Repair | 327 (98.2%) | 6 (1.8%) |
| Total (Category) | 396 (98.5%) | 6 (1.5%) |
| Total (Overall) | 2,229 (54.7%) | 1,846 (45.3%) |
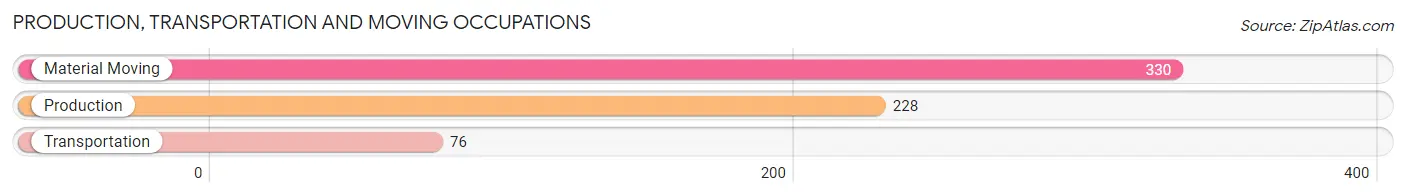
Production, Transportation and Moving Occupations
The most common Production, Transportation and Moving occupations in Smithfield are Material Moving (330 | 8.1%), Production (228 | 5.6%), and Transportation (76 | 1.9%).
Production, Transportation and Moving Occupations by Sex
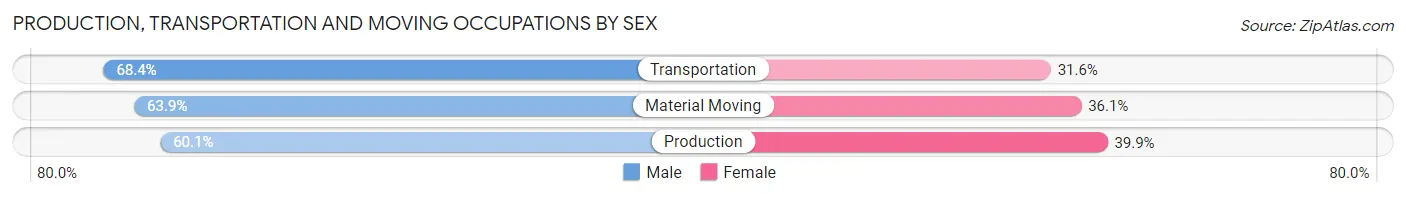
| Occupation | Male | Female |
| Production | 137 (60.1%) | 91 (39.9%) |
| Transportation | 52 (68.4%) | 24 (31.6%) |
| Material Moving | 211 (63.9%) | 119 (36.1%) |
| Total (Category) | 400 (63.1%) | 234 (36.9%) |
| Total (Overall) | 2,229 (54.7%) | 1,846 (45.3%) |
Employment Industries by Sex in Smithfield
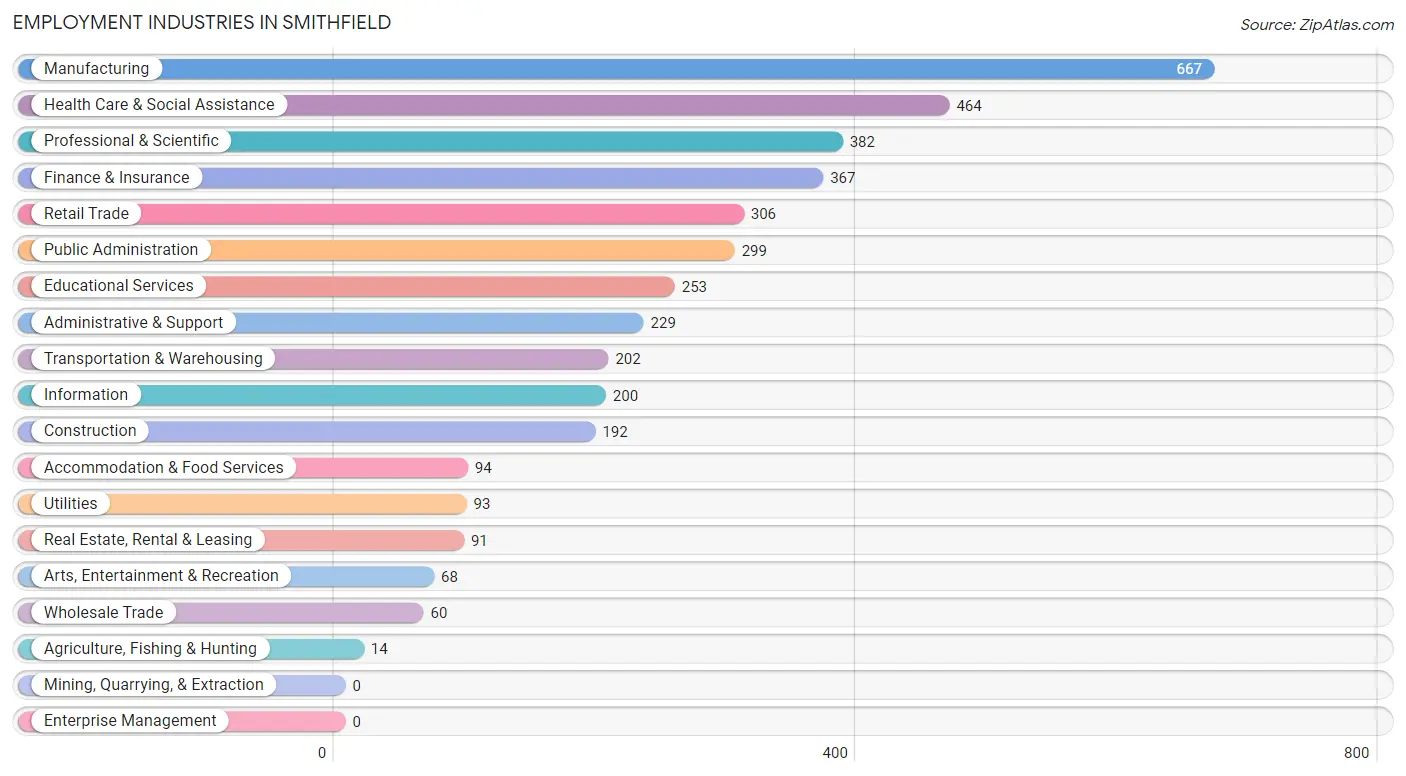
Employment Industries in Smithfield
The major employment industries in Smithfield include Manufacturing (667 | 16.4%), Health Care & Social Assistance (464 | 11.4%), Professional & Scientific (382 | 9.4%), Finance & Insurance (367 | 9.0%), and Retail Trade (306 | 7.5%).
Employment Industries by Sex in Smithfield
The Smithfield industries that see more men than women are Agriculture, Fishing & Hunting (100.0%), Utilities (100.0%), and Information (93.5%), whereas the industries that tend to have a higher number of women are Health Care & Social Assistance (84.7%), Accommodation & Food Services (79.8%), and Educational Services (77.9%).
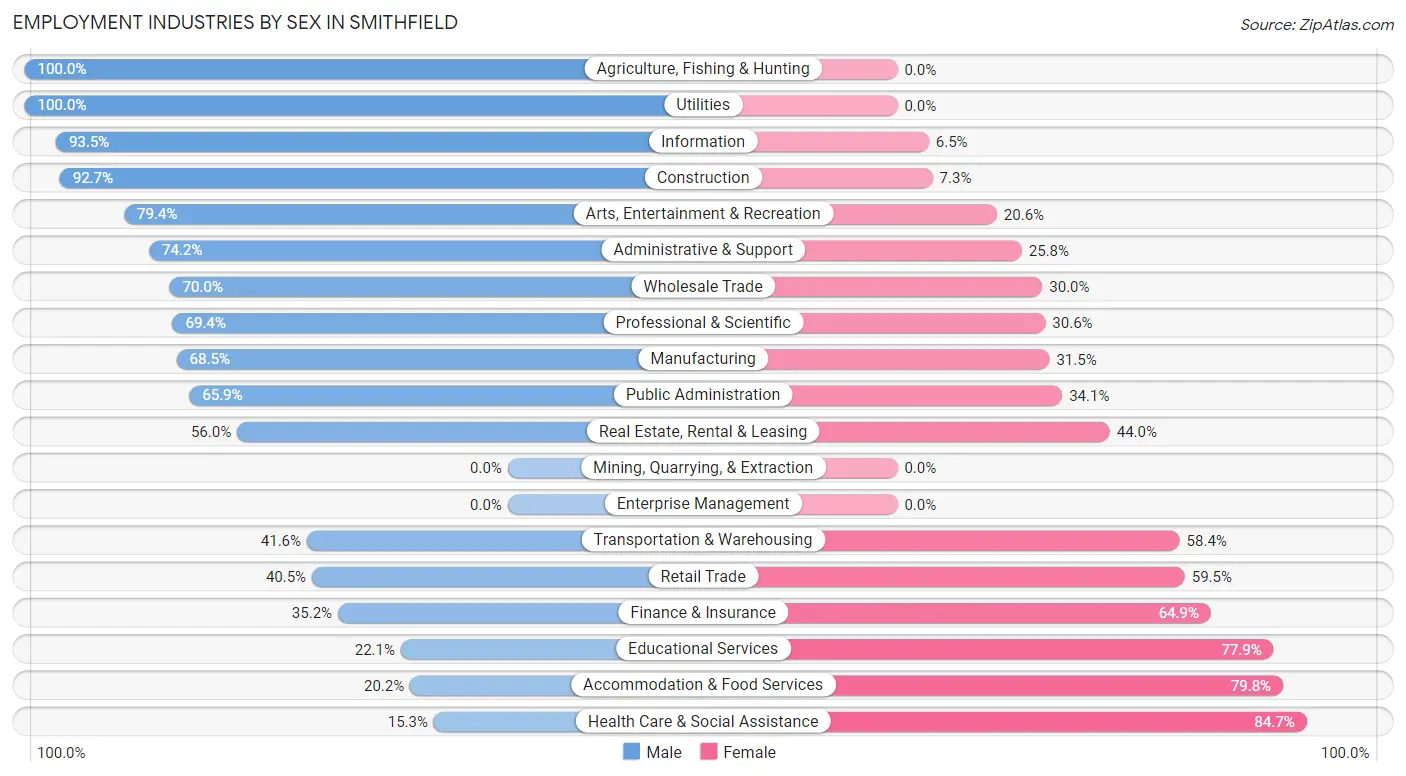
| Industry | Male | Female |
| Agriculture, Fishing & Hunting | 14 (100.0%) | 0 (0.0%) |
| Mining, Quarrying, & Extraction | 0 (0.0%) | 0 (0.0%) |
| Construction | 178 (92.7%) | 14 (7.3%) |
| Manufacturing | 457 (68.5%) | 210 (31.5%) |
| Wholesale Trade | 42 (70.0%) | 18 (30.0%) |
| Retail Trade | 124 (40.5%) | 182 (59.5%) |
| Transportation & Warehousing | 84 (41.6%) | 118 (58.4%) |
| Utilities | 93 (100.0%) | 0 (0.0%) |
| Information | 187 (93.5%) | 13 (6.5%) |
| Finance & Insurance | 129 (35.1%) | 238 (64.8%) |
| Real Estate, Rental & Leasing | 51 (56.0%) | 40 (44.0%) |
| Professional & Scientific | 265 (69.4%) | 117 (30.6%) |
| Enterprise Management | 0 (0.0%) | 0 (0.0%) |
| Administrative & Support | 170 (74.2%) | 59 (25.8%) |
| Educational Services | 56 (22.1%) | 197 (77.9%) |
| Health Care & Social Assistance | 71 (15.3%) | 393 (84.7%) |
| Arts, Entertainment & Recreation | 54 (79.4%) | 14 (20.6%) |
| Accommodation & Food Services | 19 (20.2%) | 75 (79.8%) |
| Public Administration | 197 (65.9%) | 102 (34.1%) |
| Total | 2,229 (54.7%) | 1,846 (45.3%) |
Education in Smithfield
School Enrollment in Smithfield
The most common levels of schooling among the 1,938 students in Smithfield are high school (426 | 22.0%), middle school (374 | 19.3%), and graduate / professional (313 | 16.2%).
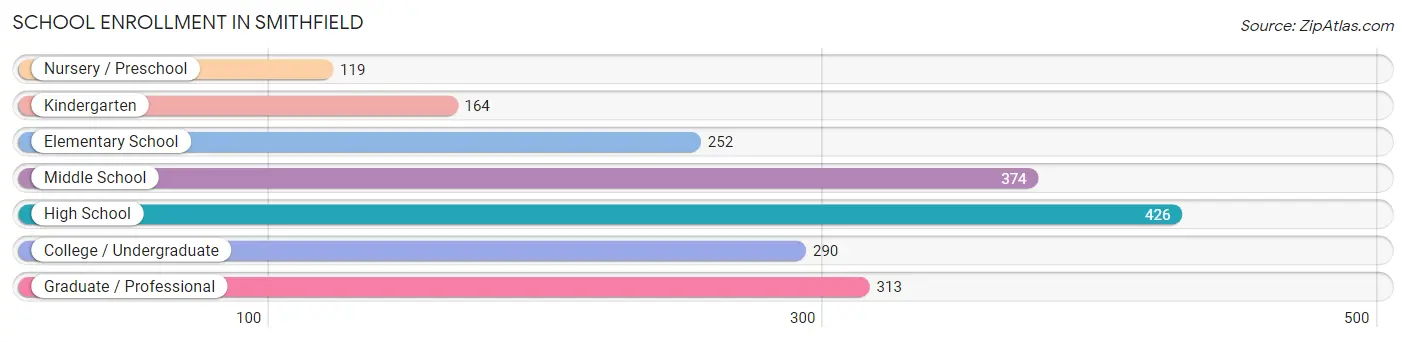
| School Level | # Students | % Students |
| Nursery / Preschool | 119 | 6.1% |
| Kindergarten | 164 | 8.5% |
| Elementary School | 252 | 13.0% |
| Middle School | 374 | 19.3% |
| High School | 426 | 22.0% |
| College / Undergraduate | 290 | 15.0% |
| Graduate / Professional | 313 | 16.2% |
| Total | 1,938 | 100.0% |
School Enrollment by Age by Funding Source in Smithfield
Out of a total of 1,938 students who are enrolled in schools in Smithfield, 543 (28.0%) attend a private institution, while the remaining 1,395 (72.0%) are enrolled in public schools. The age group of 3 to 4 year olds has the highest likelihood of being enrolled in private schools, with 110 (100.0% in the age bracket) enrolled. Conversely, the age group of 5 to 9 year old has the lowest likelihood of being enrolled in a private school, with 382 (97.7% in the age bracket) attending a public institution.
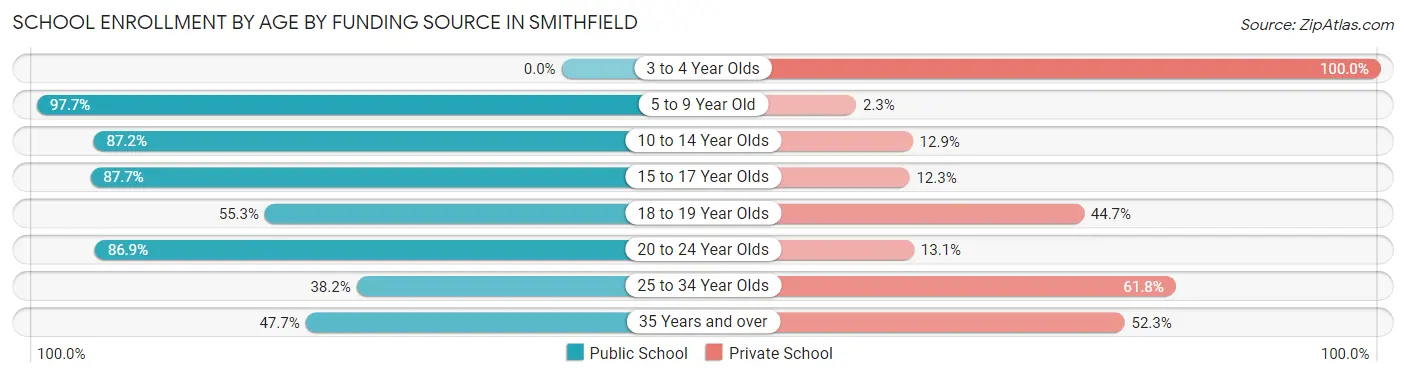
| Age Bracket | Public School | Private School |
| 3 to 4 Year Olds | 0 (0.0%) | 110 (100.0%) |
| 5 to 9 Year Old | 382 (97.7%) | 9 (2.3%) |
| 10 to 14 Year Olds | 400 (87.2%) | 59 (12.9%) |
| 15 to 17 Year Olds | 272 (87.7%) | 38 (12.3%) |
| 18 to 19 Year Olds | 63 (55.3%) | 51 (44.7%) |
| 20 to 24 Year Olds | 93 (86.9%) | 14 (13.1%) |
| 25 to 34 Year Olds | 113 (38.2%) | 183 (61.8%) |
| 35 Years and over | 72 (47.7%) | 79 (52.3%) |
| Total | 1,395 (72.0%) | 543 (28.0%) |
Educational Attainment by Field of Study in Smithfield
Business (422 | 18.0%), education (422 | 18.0%), science & technology (239 | 10.2%), computers & mathematics (223 | 9.5%), and arts & humanities (168 | 7.2%) are the most common fields of study among 2,346 individuals in Smithfield who have obtained a bachelor's degree or higher.
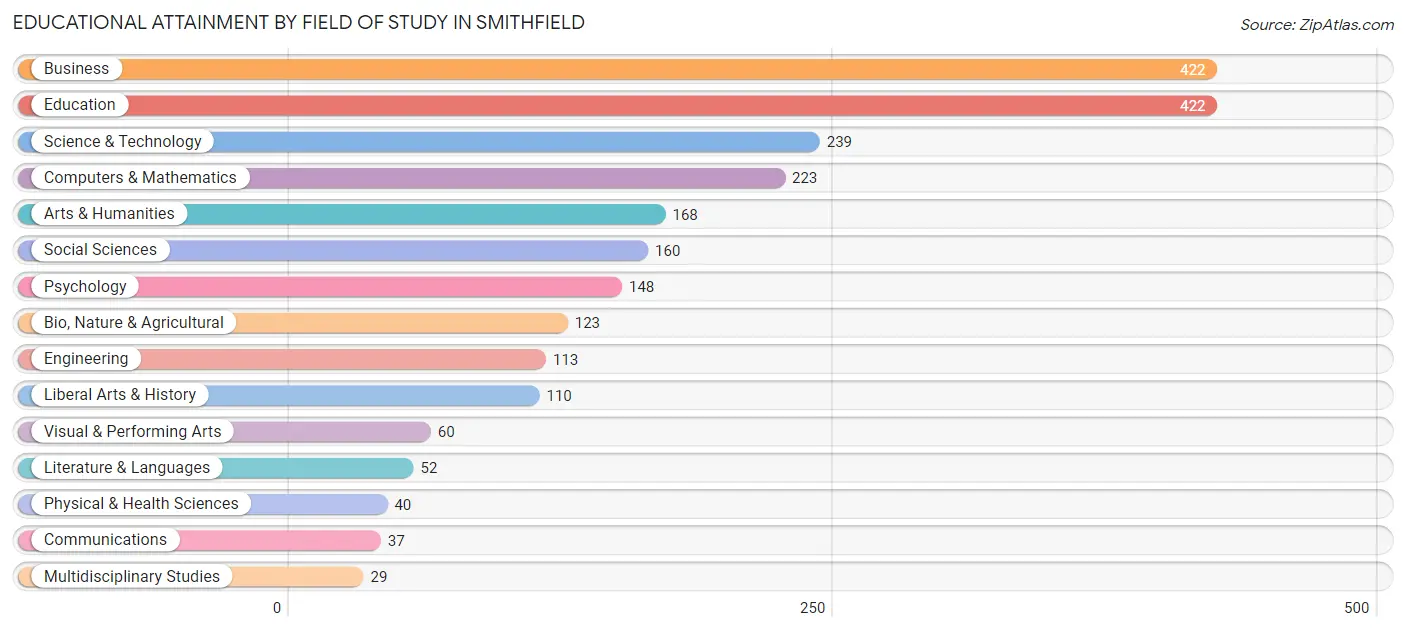
| Field of Study | # Graduates | % Graduates |
| Computers & Mathematics | 223 | 9.5% |
| Bio, Nature & Agricultural | 123 | 5.2% |
| Physical & Health Sciences | 40 | 1.7% |
| Psychology | 148 | 6.3% |
| Social Sciences | 160 | 6.8% |
| Engineering | 113 | 4.8% |
| Multidisciplinary Studies | 29 | 1.2% |
| Science & Technology | 239 | 10.2% |
| Business | 422 | 18.0% |
| Education | 422 | 18.0% |
| Literature & Languages | 52 | 2.2% |
| Liberal Arts & History | 110 | 4.7% |
| Visual & Performing Arts | 60 | 2.6% |
| Communications | 37 | 1.6% |
| Arts & Humanities | 168 | 7.2% |
| Total | 2,346 | 100.0% |
Transportation & Commute in Smithfield
Vehicle Availability by Sex in Smithfield
The most prevalent vehicle ownership categories in Smithfield are males with 2 vehicles (989, accounting for 42.1%) and females with 2 vehicles (604, making up 58.5%).
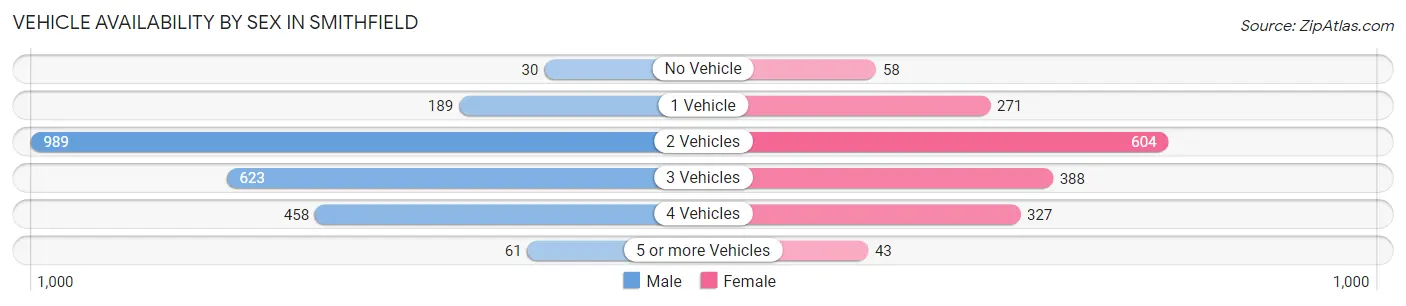
| Vehicles Available | Male | Female |
| No Vehicle | 30 (1.3%) | 58 (3.4%) |
| 1 Vehicle | 189 (8.0%) | 271 (16.0%) |
| 2 Vehicles | 989 (42.1%) | 604 (35.7%) |
| 3 Vehicles | 623 (26.5%) | 388 (23.0%) |
| 4 Vehicles | 458 (19.5%) | 327 (19.3%) |
| 5 or more Vehicles | 61 (2.6%) | 43 (2.5%) |
| Total | 2,350 (100.0%) | 1,691 (100.0%) |
Commute Time in Smithfield
The most frequently occuring commute durations in Smithfield are 30 to 34 minutes (635 commuters, 17.9%), 25 to 29 minutes (496 commuters, 14.0%), and 45 to 59 minutes (441 commuters, 12.4%).
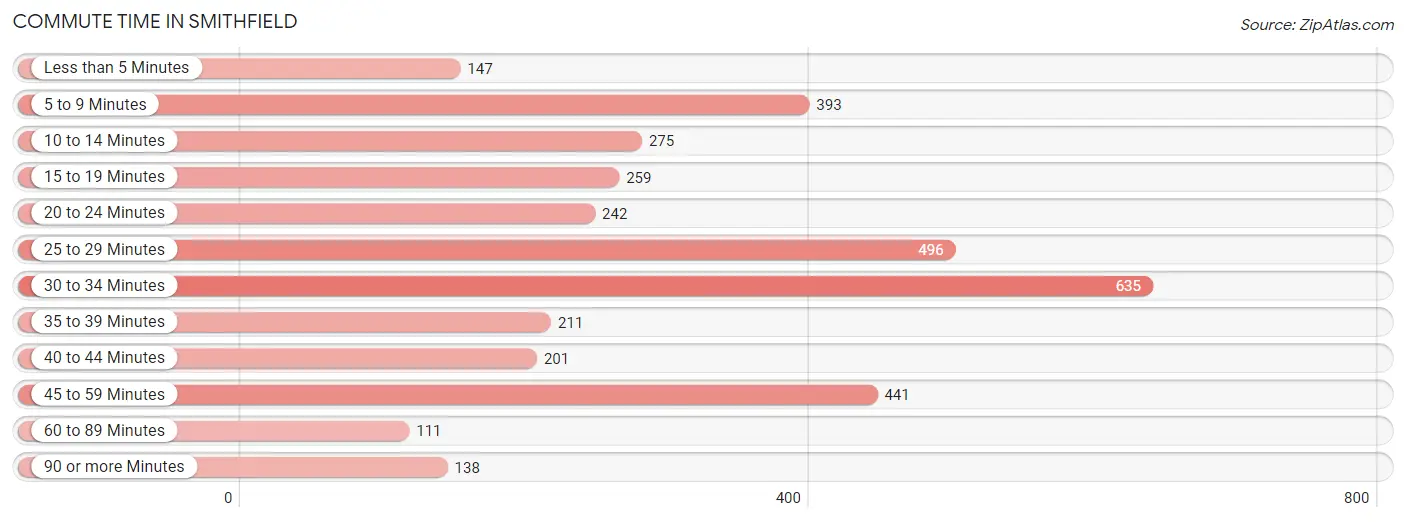
| Commute Time | # Commuters | % Commuters |
| Less than 5 Minutes | 147 | 4.1% |
| 5 to 9 Minutes | 393 | 11.1% |
| 10 to 14 Minutes | 275 | 7.7% |
| 15 to 19 Minutes | 259 | 7.3% |
| 20 to 24 Minutes | 242 | 6.8% |
| 25 to 29 Minutes | 496 | 14.0% |
| 30 to 34 Minutes | 635 | 17.9% |
| 35 to 39 Minutes | 211 | 5.9% |
| 40 to 44 Minutes | 201 | 5.7% |
| 45 to 59 Minutes | 441 | 12.4% |
| 60 to 89 Minutes | 111 | 3.1% |
| 90 or more Minutes | 138 | 3.9% |
Commute Time by Sex in Smithfield
The most common commute times in Smithfield are 30 to 34 minutes (333 commuters, 16.7%) for males and 25 to 29 minutes (323 commuters, 20.8%) for females.
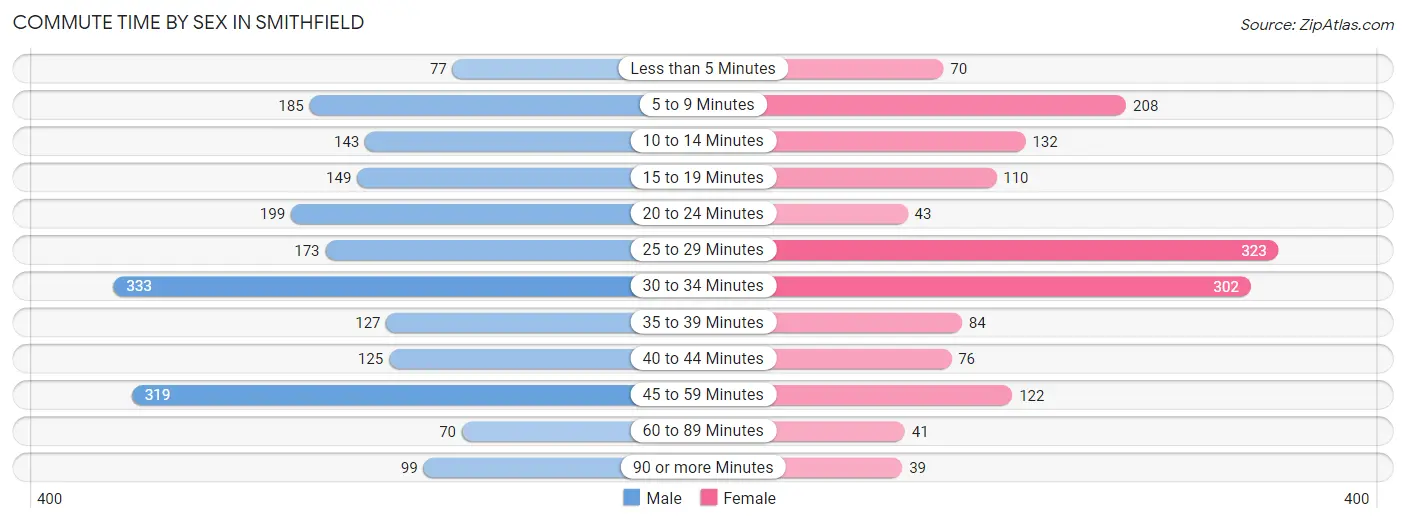
| Commute Time | Male | Female |
| Less than 5 Minutes | 77 (3.8%) | 70 (4.5%) |
| 5 to 9 Minutes | 185 (9.2%) | 208 (13.4%) |
| 10 to 14 Minutes | 143 (7.1%) | 132 (8.5%) |
| 15 to 19 Minutes | 149 (7.4%) | 110 (7.1%) |
| 20 to 24 Minutes | 199 (10.0%) | 43 (2.8%) |
| 25 to 29 Minutes | 173 (8.6%) | 323 (20.8%) |
| 30 to 34 Minutes | 333 (16.7%) | 302 (19.5%) |
| 35 to 39 Minutes | 127 (6.4%) | 84 (5.4%) |
| 40 to 44 Minutes | 125 (6.2%) | 76 (4.9%) |
| 45 to 59 Minutes | 319 (16.0%) | 122 (7.9%) |
| 60 to 89 Minutes | 70 (3.5%) | 41 (2.6%) |
| 90 or more Minutes | 99 (5.0%) | 39 (2.5%) |
Time of Departure to Work by Sex in Smithfield
The most frequent times of departure to work in Smithfield are 6:00 AM to 6:29 AM (347, 17.4%) for males and 8:00 AM to 8:29 AM (304, 19.6%) for females.
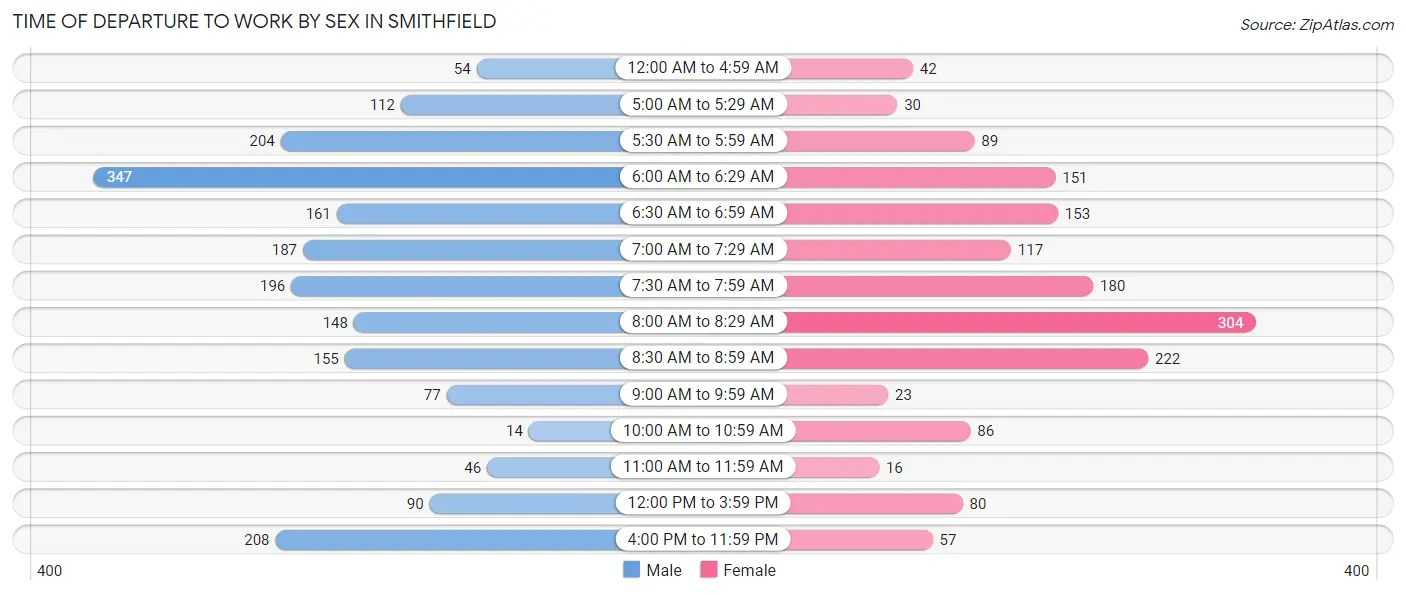
| Time of Departure | Male | Female |
| 12:00 AM to 4:59 AM | 54 (2.7%) | 42 (2.7%) |
| 5:00 AM to 5:29 AM | 112 (5.6%) | 30 (1.9%) |
| 5:30 AM to 5:59 AM | 204 (10.2%) | 89 (5.7%) |
| 6:00 AM to 6:29 AM | 347 (17.4%) | 151 (9.7%) |
| 6:30 AM to 6:59 AM | 161 (8.1%) | 153 (9.9%) |
| 7:00 AM to 7:29 AM | 187 (9.3%) | 117 (7.5%) |
| 7:30 AM to 7:59 AM | 196 (9.8%) | 180 (11.6%) |
| 8:00 AM to 8:29 AM | 148 (7.4%) | 304 (19.6%) |
| 8:30 AM to 8:59 AM | 155 (7.7%) | 222 (14.3%) |
| 9:00 AM to 9:59 AM | 77 (3.8%) | 23 (1.5%) |
| 10:00 AM to 10:59 AM | 14 (0.7%) | 86 (5.6%) |
| 11:00 AM to 11:59 AM | 46 (2.3%) | 16 (1.0%) |
| 12:00 PM to 3:59 PM | 90 (4.5%) | 80 (5.2%) |
| 4:00 PM to 11:59 PM | 208 (10.4%) | 57 (3.7%) |
| Total | 1,999 (100.0%) | 1,550 (100.0%) |
Housing Occupancy in Smithfield
Occupancy by Ownership in Smithfield
Of the total 3,418 dwellings in Smithfield, owner-occupied units account for 2,651 (77.6%), while renter-occupied units make up 767 (22.4%).
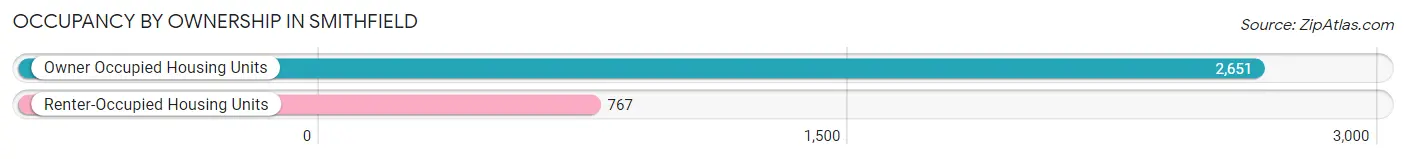
| Occupancy | # Housing Units | % Housing Units |
| Owner Occupied Housing Units | 2,651 | 77.6% |
| Renter-Occupied Housing Units | 767 | 22.4% |
| Total Occupied Housing Units | 3,418 | 100.0% |
Occupancy by Household Size in Smithfield
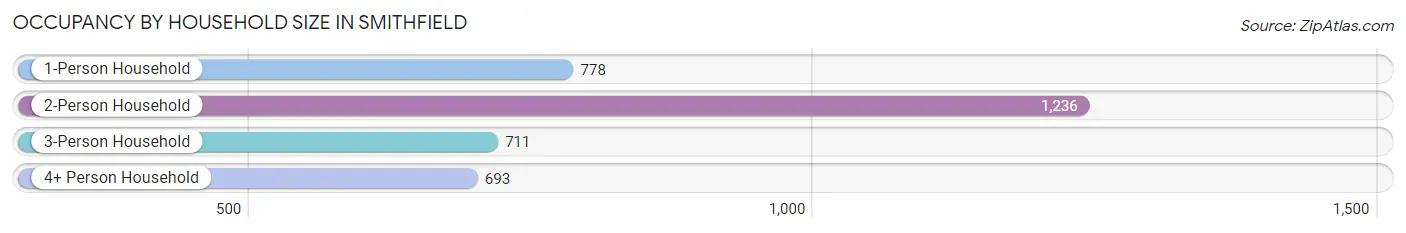
| Household Size | # Housing Units | % Housing Units |
| 1-Person Household | 778 | 22.8% |
| 2-Person Household | 1,236 | 36.2% |
| 3-Person Household | 711 | 20.8% |
| 4+ Person Household | 693 | 20.3% |
| Total Housing Units | 3,418 | 100.0% |
Occupancy by Ownership by Household Size in Smithfield
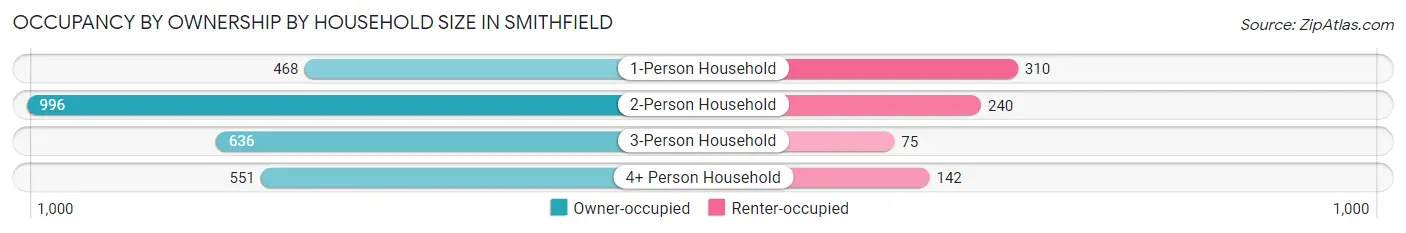
| Household Size | Owner-occupied | Renter-occupied |
| 1-Person Household | 468 (60.2%) | 310 (39.9%) |
| 2-Person Household | 996 (80.6%) | 240 (19.4%) |
| 3-Person Household | 636 (89.4%) | 75 (10.5%) |
| 4+ Person Household | 551 (79.5%) | 142 (20.5%) |
| Total Housing Units | 2,651 (77.6%) | 767 (22.4%) |
Occupancy by Educational Attainment in Smithfield
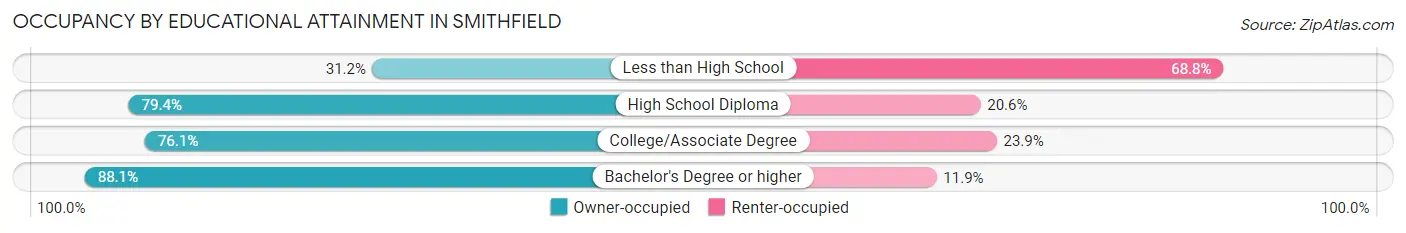
| Household Size | Owner-occupied | Renter-occupied |
| Less than High School | 77 (31.2%) | 170 (68.8%) |
| High School Diploma | 665 (79.4%) | 173 (20.6%) |
| College/Associate Degree | 928 (76.1%) | 291 (23.9%) |
| Bachelor's Degree or higher | 981 (88.1%) | 133 (11.9%) |
Occupancy by Age of Householder in Smithfield
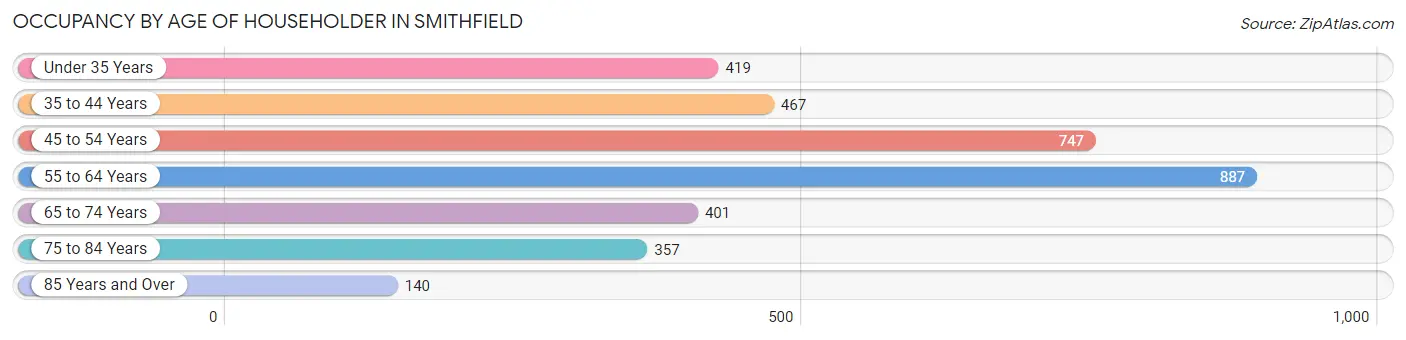
| Age Bracket | # Households | % Households |
| Under 35 Years | 419 | 12.3% |
| 35 to 44 Years | 467 | 13.7% |
| 45 to 54 Years | 747 | 21.8% |
| 55 to 64 Years | 887 | 26.0% |
| 65 to 74 Years | 401 | 11.7% |
| 75 to 84 Years | 357 | 10.4% |
| 85 Years and Over | 140 | 4.1% |
| Total | 3,418 | 100.0% |
Housing Finances in Smithfield
Median Income by Occupancy in Smithfield
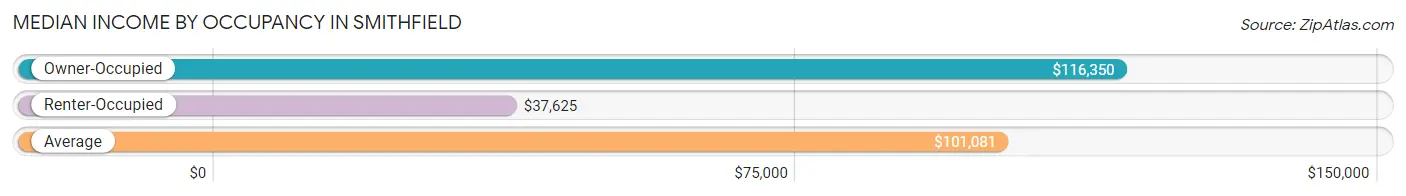
| Occupancy Type | # Households | Median Income |
| Owner-Occupied | 2,651 (77.6%) | $116,350 |
| Renter-Occupied | 767 (22.4%) | $37,625 |
| Average | 3,418 (100.0%) | $101,081 |
Occupancy by Householder Income Bracket in Smithfield
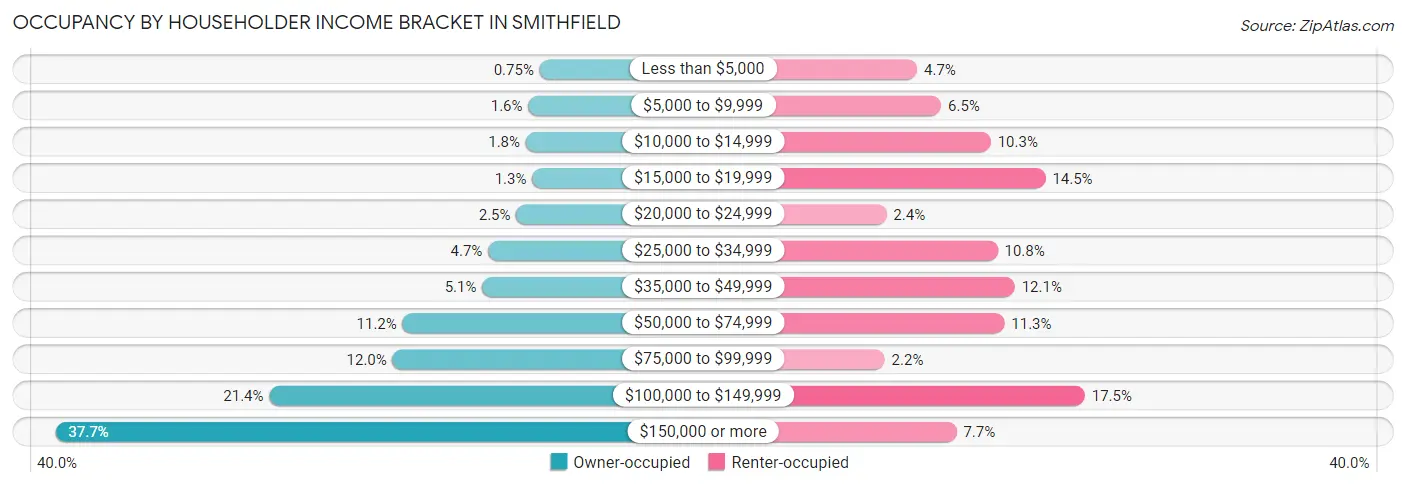
| Income Bracket | Owner-occupied | Renter-occupied |
| Less than $5,000 | 20 (0.7%) | 36 (4.7%) |
| $5,000 to $9,999 | 43 (1.6%) | 50 (6.5%) |
| $10,000 to $14,999 | 48 (1.8%) | 79 (10.3%) |
| $15,000 to $19,999 | 35 (1.3%) | 111 (14.5%) |
| $20,000 to $24,999 | 67 (2.5%) | 18 (2.4%) |
| $25,000 to $34,999 | 124 (4.7%) | 83 (10.8%) |
| $35,000 to $49,999 | 136 (5.1%) | 93 (12.1%) |
| $50,000 to $74,999 | 297 (11.2%) | 87 (11.3%) |
| $75,000 to $99,999 | 317 (12.0%) | 17 (2.2%) |
| $100,000 to $149,999 | 566 (21.3%) | 134 (17.5%) |
| $150,000 or more | 998 (37.7%) | 59 (7.7%) |
| Total | 2,651 (100.0%) | 767 (100.0%) |
Monthly Housing Cost Tiers in Smithfield
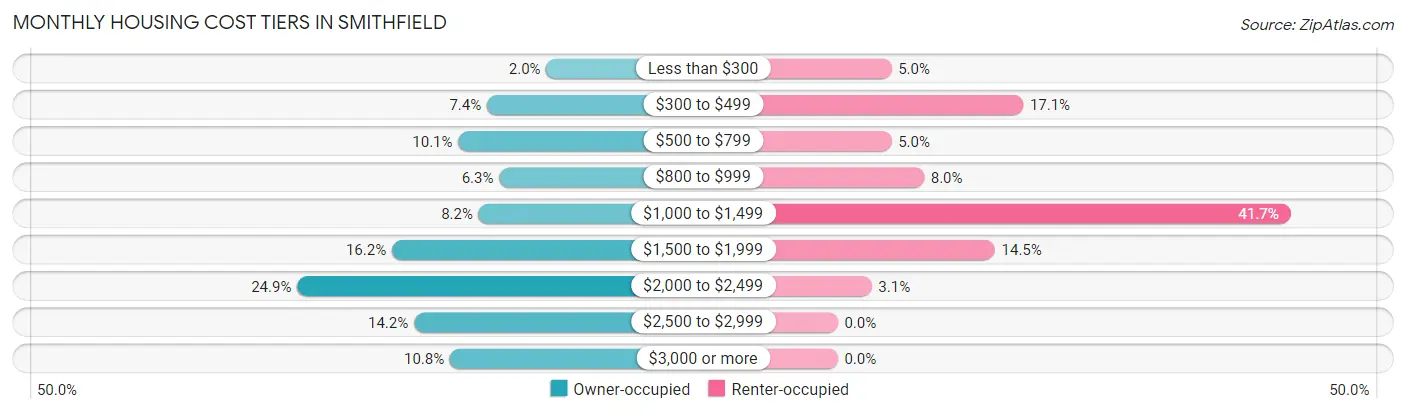
| Monthly Cost | Owner-occupied | Renter-occupied |
| Less than $300 | 52 (2.0%) | 38 (5.0%) |
| $300 to $499 | 197 (7.4%) | 131 (17.1%) |
| $500 to $799 | 267 (10.1%) | 38 (5.0%) |
| $800 to $999 | 167 (6.3%) | 61 (8.0%) |
| $1,000 to $1,499 | 217 (8.2%) | 320 (41.7%) |
| $1,500 to $1,999 | 429 (16.2%) | 111 (14.5%) |
| $2,000 to $2,499 | 660 (24.9%) | 24 (3.1%) |
| $2,500 to $2,999 | 375 (14.1%) | 0 (0.0%) |
| $3,000 or more | 287 (10.8%) | 0 (0.0%) |
| Total | 2,651 (100.0%) | 767 (100.0%) |
Physical Housing Characteristics in Smithfield
Housing Structures in Smithfield
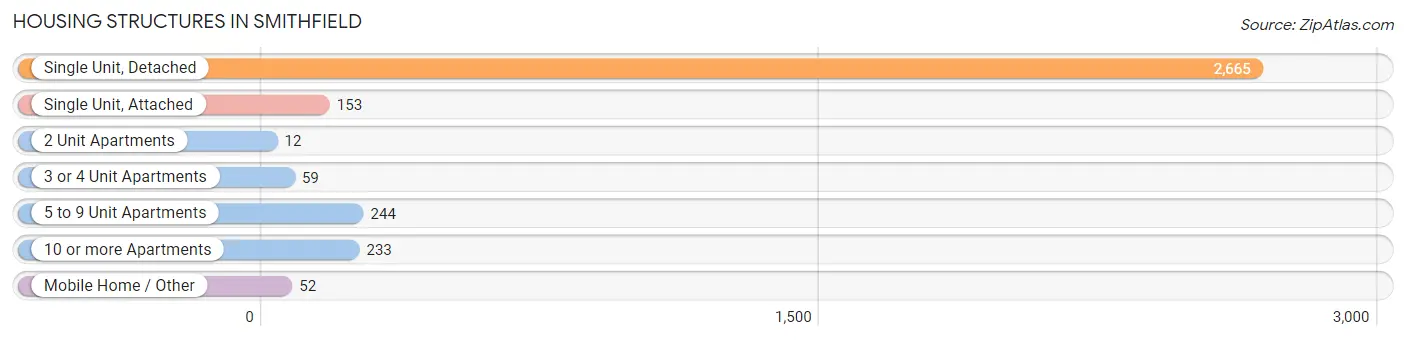
| Structure Type | # Housing Units | % Housing Units |
| Single Unit, Detached | 2,665 | 78.0% |
| Single Unit, Attached | 153 | 4.5% |
| 2 Unit Apartments | 12 | 0.4% |
| 3 or 4 Unit Apartments | 59 | 1.7% |
| 5 to 9 Unit Apartments | 244 | 7.1% |
| 10 or more Apartments | 233 | 6.8% |
| Mobile Home / Other | 52 | 1.5% |
| Total | 3,418 | 100.0% |
Housing Structures by Occupancy in Smithfield
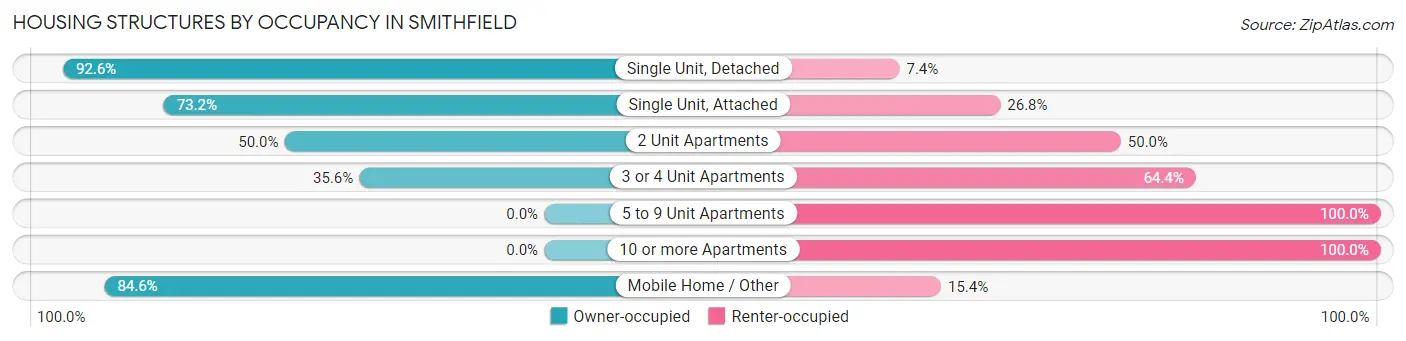
| Structure Type | Owner-occupied | Renter-occupied |
| Single Unit, Detached | 2,468 (92.6%) | 197 (7.4%) |
| Single Unit, Attached | 112 (73.2%) | 41 (26.8%) |
| 2 Unit Apartments | 6 (50.0%) | 6 (50.0%) |
| 3 or 4 Unit Apartments | 21 (35.6%) | 38 (64.4%) |
| 5 to 9 Unit Apartments | 0 (0.0%) | 244 (100.0%) |
| 10 or more Apartments | 0 (0.0%) | 233 (100.0%) |
| Mobile Home / Other | 44 (84.6%) | 8 (15.4%) |
| Total | 2,651 (77.6%) | 767 (22.4%) |
Housing Structures by Number of Rooms in Smithfield
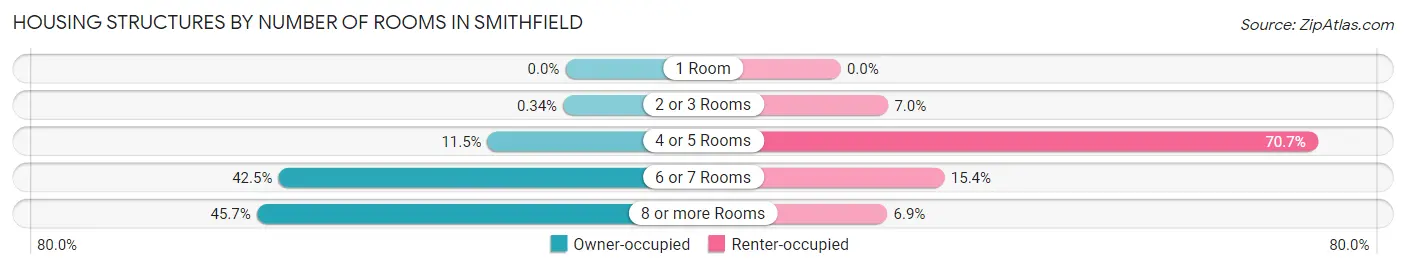
| Number of Rooms | Owner-occupied | Renter-occupied |
| 1 Room | 0 (0.0%) | 0 (0.0%) |
| 2 or 3 Rooms | 9 (0.3%) | 54 (7.0%) |
| 4 or 5 Rooms | 305 (11.5%) | 542 (70.7%) |
| 6 or 7 Rooms | 1,126 (42.5%) | 118 (15.4%) |
| 8 or more Rooms | 1,211 (45.7%) | 53 (6.9%) |
| Total | 2,651 (100.0%) | 767 (100.0%) |
Housing Structure by Heating Type in Smithfield
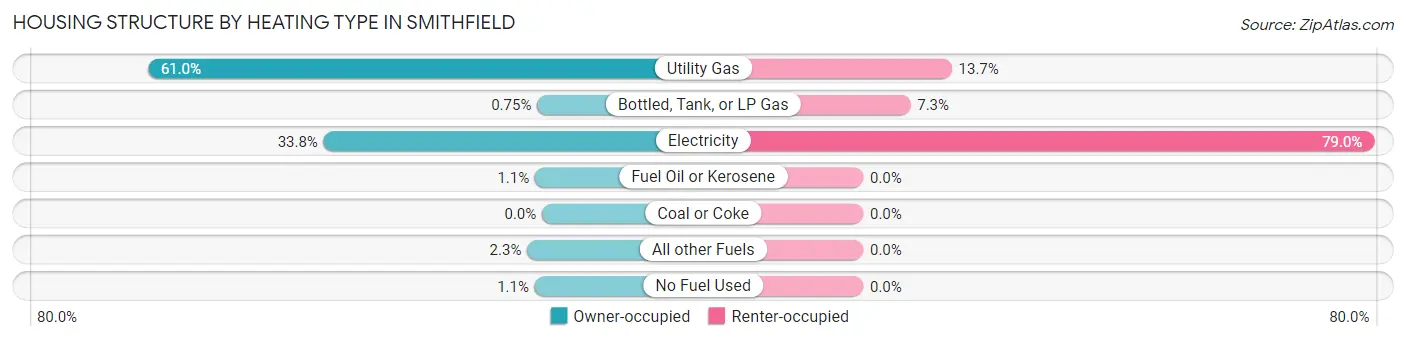
| Heating Type | Owner-occupied | Renter-occupied |
| Utility Gas | 1,616 (61.0%) | 105 (13.7%) |
| Bottled, Tank, or LP Gas | 20 (0.7%) | 56 (7.3%) |
| Electricity | 895 (33.8%) | 606 (79.0%) |
| Fuel Oil or Kerosene | 29 (1.1%) | 0 (0.0%) |
| Coal or Coke | 0 (0.0%) | 0 (0.0%) |
| All other Fuels | 61 (2.3%) | 0 (0.0%) |
| No Fuel Used | 30 (1.1%) | 0 (0.0%) |
| Total | 2,651 (100.0%) | 767 (100.0%) |
Household Vehicle Usage in Smithfield
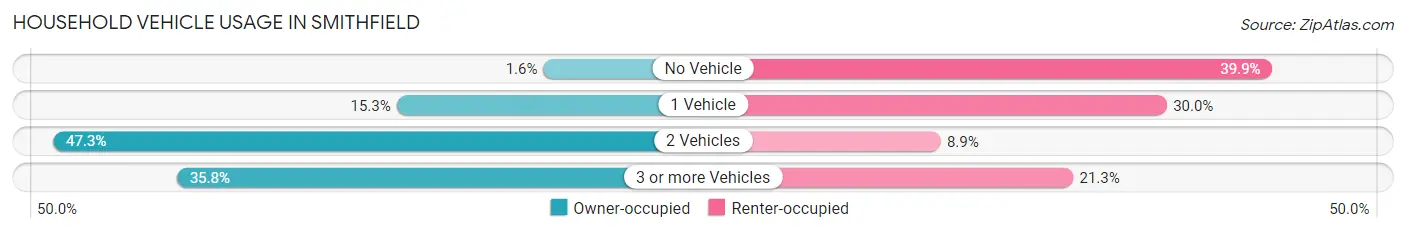
| Vehicles per Household | Owner-occupied | Renter-occupied |
| No Vehicle | 42 (1.6%) | 306 (39.9%) |
| 1 Vehicle | 405 (15.3%) | 230 (30.0%) |
| 2 Vehicles | 1,255 (47.3%) | 68 (8.9%) |
| 3 or more Vehicles | 949 (35.8%) | 163 (21.2%) |
| Total | 2,651 (100.0%) | 767 (100.0%) |
Real Estate & Mortgages in Smithfield
Real Estate and Mortgage Overview in Smithfield
| Characteristic | Without Mortgage | With Mortgage |
| Housing Units | 661 | 1,990 |
| Median Property Value | $288,000 | $358,500 |
| Median Household Income | $62,250 | $910 |
| Monthly Housing Costs | $592 | $276 |
| Real Estate Taxes | $2,732 | $0 |
Property Value by Mortgage Status in Smithfield
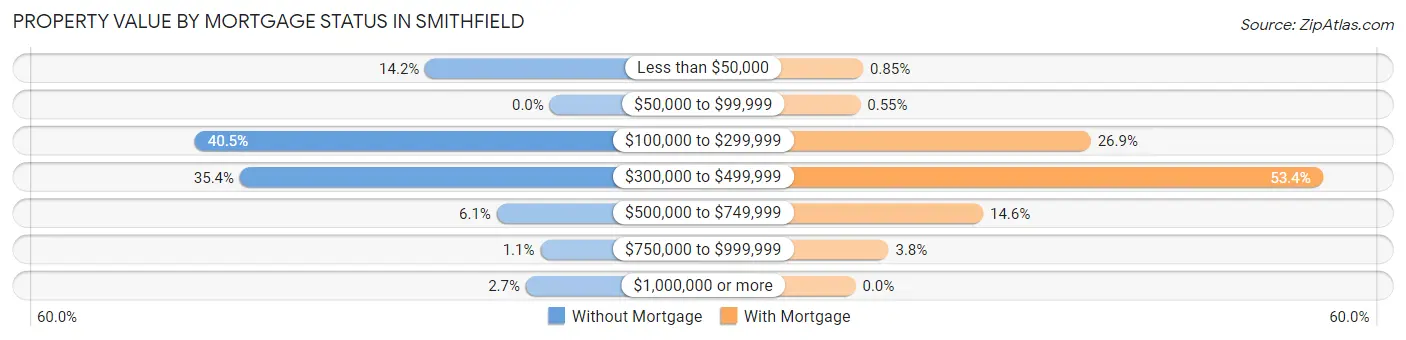
| Property Value | Without Mortgage | With Mortgage |
| Less than $50,000 | 94 (14.2%) | 17 (0.9%) |
| $50,000 to $99,999 | 0 (0.0%) | 11 (0.5%) |
| $100,000 to $299,999 | 268 (40.5%) | 535 (26.9%) |
| $300,000 to $499,999 | 234 (35.4%) | 1,062 (53.4%) |
| $500,000 to $749,999 | 40 (6.0%) | 290 (14.6%) |
| $750,000 to $999,999 | 7 (1.1%) | 75 (3.8%) |
| $1,000,000 or more | 18 (2.7%) | 0 (0.0%) |
| Total | 661 (100.0%) | 1,990 (100.0%) |
Household Income by Mortgage Status in Smithfield
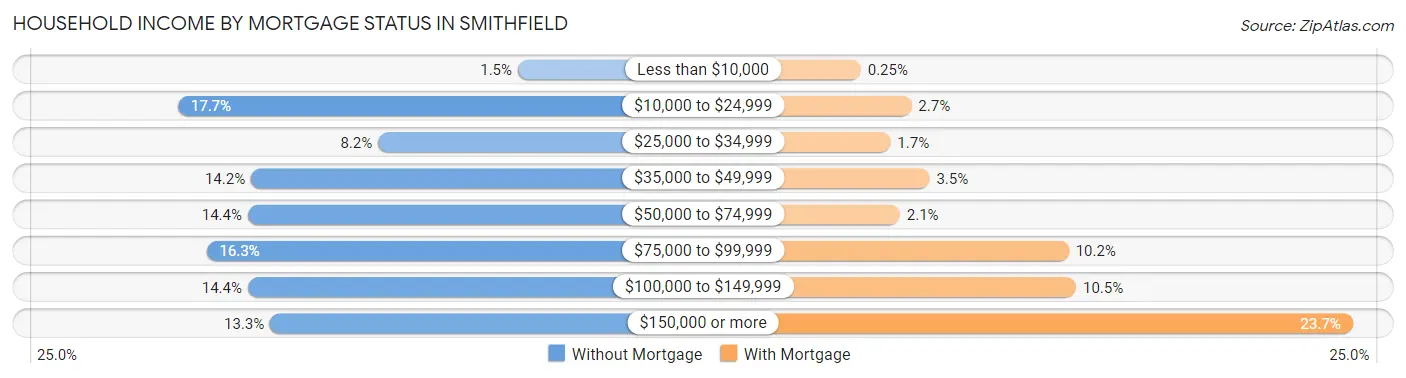
| Household Income | Without Mortgage | With Mortgage |
| Less than $10,000 | 10 (1.5%) | 5 (0.3%) |
| $10,000 to $24,999 | 117 (17.7%) | 53 (2.7%) |
| $25,000 to $34,999 | 54 (8.2%) | 33 (1.7%) |
| $35,000 to $49,999 | 94 (14.2%) | 70 (3.5%) |
| $50,000 to $74,999 | 95 (14.4%) | 42 (2.1%) |
| $75,000 to $99,999 | 108 (16.3%) | 202 (10.2%) |
| $100,000 to $149,999 | 95 (14.4%) | 209 (10.5%) |
| $150,000 or more | 88 (13.3%) | 471 (23.7%) |
| Total | 661 (100.0%) | 1,990 (100.0%) |
Property Value to Household Income Ratio in Smithfield
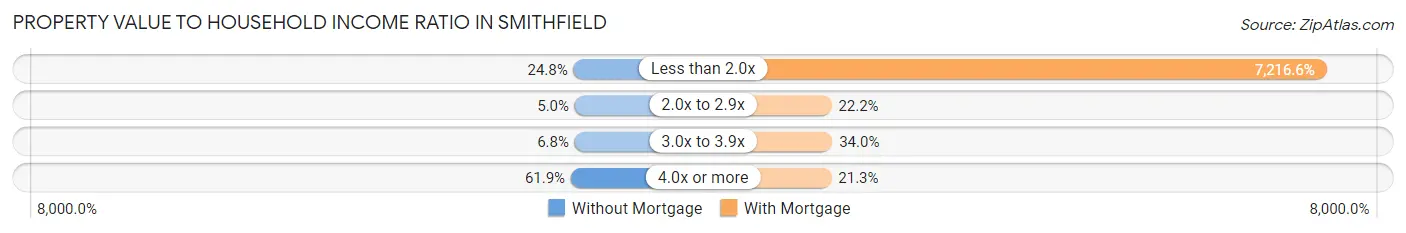
| Value-to-Income Ratio | Without Mortgage | With Mortgage |
| Less than 2.0x | 164 (24.8%) | 143,611 (7,216.6%) |
| 2.0x to 2.9x | 33 (5.0%) | 441 (22.2%) |
| 3.0x to 3.9x | 45 (6.8%) | 677 (34.0%) |
| 4.0x or more | 409 (61.9%) | 423 (21.3%) |
| Total | 661 (100.0%) | 1,990 (100.0%) |
Real Estate Taxes by Mortgage Status in Smithfield
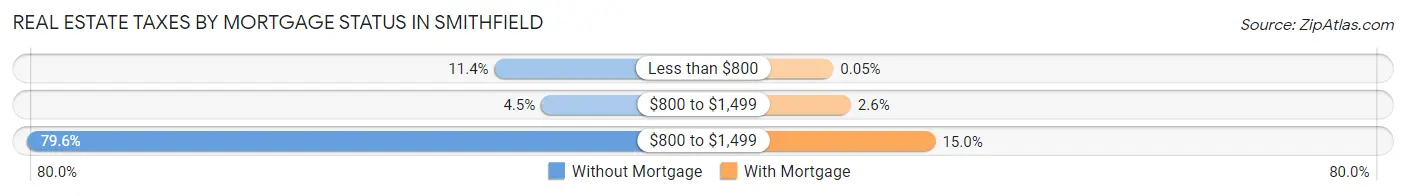
| Property Taxes | Without Mortgage | With Mortgage |
| Less than $800 | 75 (11.4%) | 1 (0.1%) |
| $800 to $1,499 | 30 (4.5%) | 52 (2.6%) |
| $800 to $1,499 | 526 (79.6%) | 298 (15.0%) |
| Total | 661 (100.0%) | 1,990 (100.0%) |
Health & Disability in Smithfield
Health Insurance Coverage by Age in Smithfield
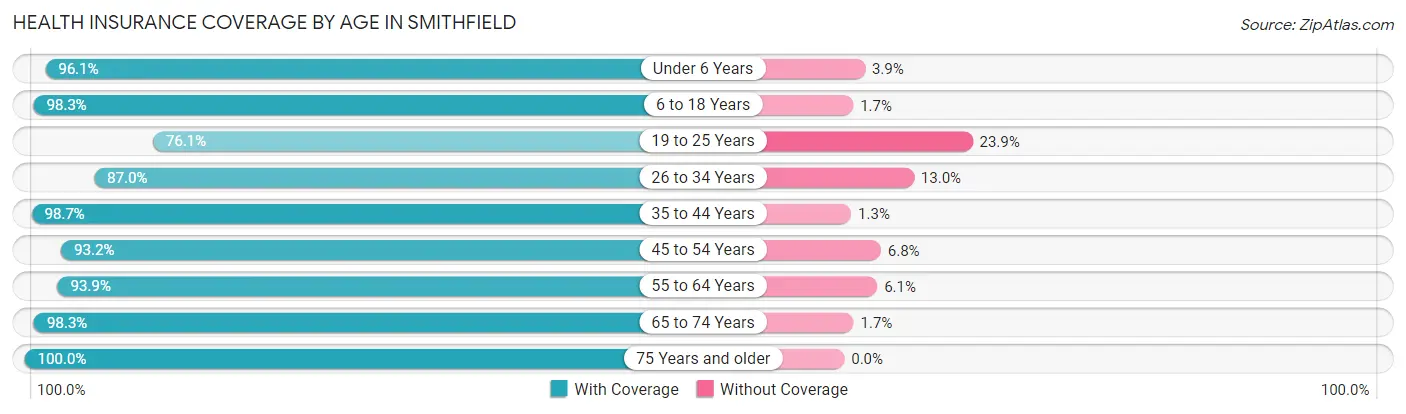
| Age Bracket | With Coverage | Without Coverage |
| Under 6 Years | 672 (96.1%) | 27 (3.9%) |
| 6 to 18 Years | 1,128 (98.3%) | 19 (1.7%) |
| 19 to 25 Years | 318 (76.1%) | 100 (23.9%) |
| 26 to 34 Years | 959 (87.0%) | 143 (13.0%) |
| 35 to 44 Years | 770 (98.7%) | 10 (1.3%) |
| 45 to 54 Years | 1,161 (93.2%) | 85 (6.8%) |
| 55 to 64 Years | 1,390 (93.9%) | 91 (6.1%) |
| 65 to 74 Years | 733 (98.3%) | 13 (1.7%) |
| 75 Years and older | 754 (100.0%) | 0 (0.0%) |
| Total | 7,885 (94.2%) | 488 (5.8%) |
Health Insurance Coverage by Citizenship Status in Smithfield
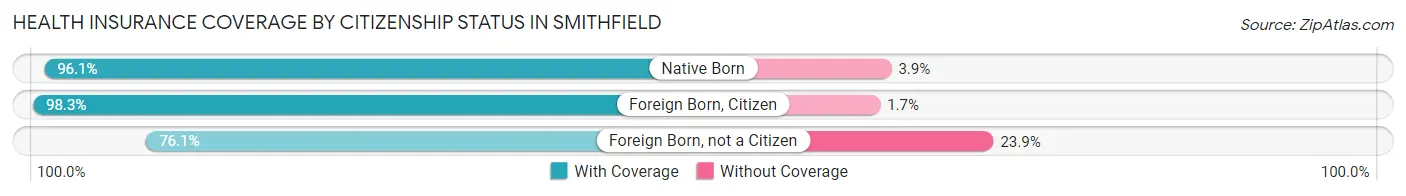
| Citizenship Status | With Coverage | Without Coverage |
| Native Born | 672 (96.1%) | 27 (3.9%) |
| Foreign Born, Citizen | 1,128 (98.3%) | 19 (1.7%) |
| Foreign Born, not a Citizen | 318 (76.1%) | 100 (23.9%) |
Health Insurance Coverage by Household Income in Smithfield
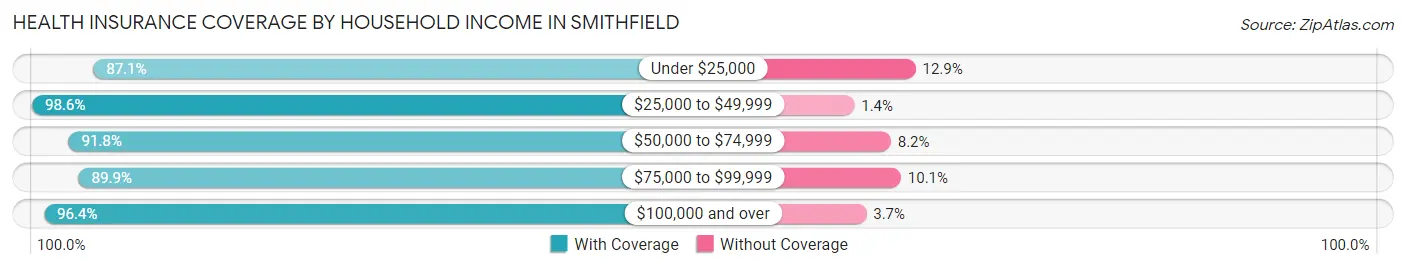
| Household Income | With Coverage | Without Coverage |
| Under $25,000 | 967 (87.1%) | 143 (12.9%) |
| $25,000 to $49,999 | 563 (98.6%) | 8 (1.4%) |
| $50,000 to $74,999 | 835 (91.8%) | 75 (8.2%) |
| $75,000 to $99,999 | 710 (89.9%) | 80 (10.1%) |
| $100,000 and over | 4,810 (96.4%) | 182 (3.6%) |
Public vs Private Health Insurance Coverage by Age in Smithfield
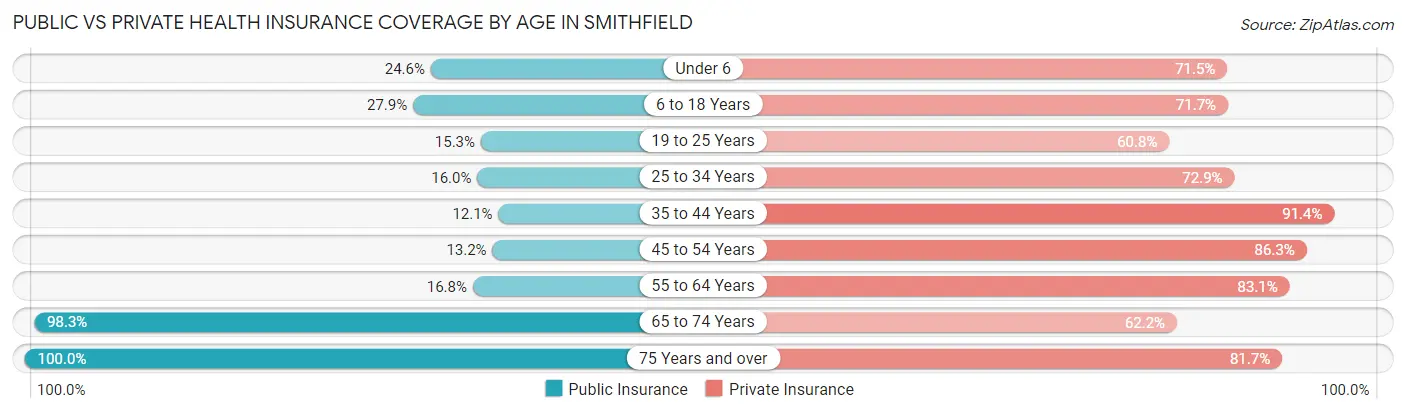
| Age Bracket | Public Insurance | Private Insurance |
| Under 6 | 172 (24.6%) | 500 (71.5%) |
| 6 to 18 Years | 320 (27.9%) | 822 (71.7%) |
| 19 to 25 Years | 64 (15.3%) | 254 (60.8%) |
| 25 to 34 Years | 176 (16.0%) | 803 (72.9%) |
| 35 to 44 Years | 94 (12.0%) | 713 (91.4%) |
| 45 to 54 Years | 164 (13.2%) | 1,075 (86.3%) |
| 55 to 64 Years | 249 (16.8%) | 1,231 (83.1%) |
| 65 to 74 Years | 733 (98.3%) | 464 (62.2%) |
| 75 Years and over | 754 (100.0%) | 616 (81.7%) |
| Total | 2,726 (32.6%) | 6,478 (77.4%) |
Disability Status by Sex by Age in Smithfield
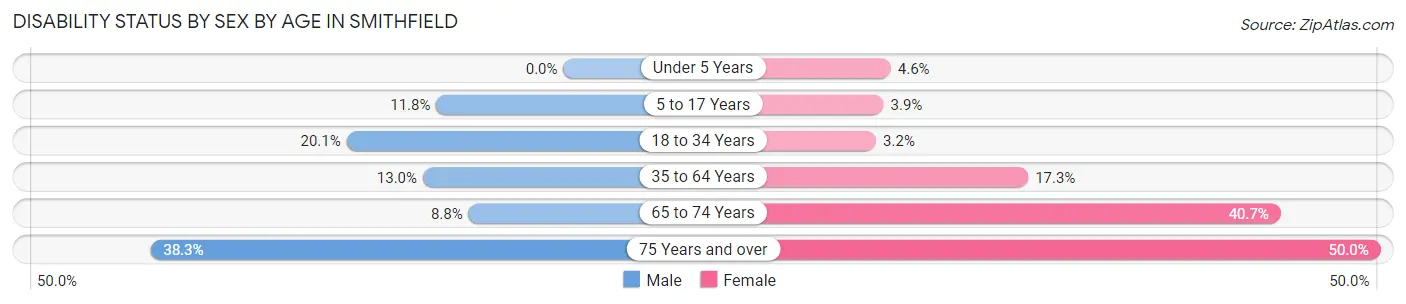
| Age Bracket | Male | Female |
| Under 5 Years | 0 (0.0%) | 13 (4.5%) |
| 5 to 17 Years | 66 (11.8%) | 24 (3.9%) |
| 18 to 34 Years | 163 (20.1%) | 26 (3.2%) |
| 35 to 64 Years | 244 (13.0%) | 283 (17.3%) |
| 65 to 74 Years | 22 (8.8%) | 202 (40.7%) |
| 75 Years and over | 138 (38.3%) | 197 (50.0%) |
Disability Class by Sex by Age in Smithfield
Disability Class: Hearing Difficulty
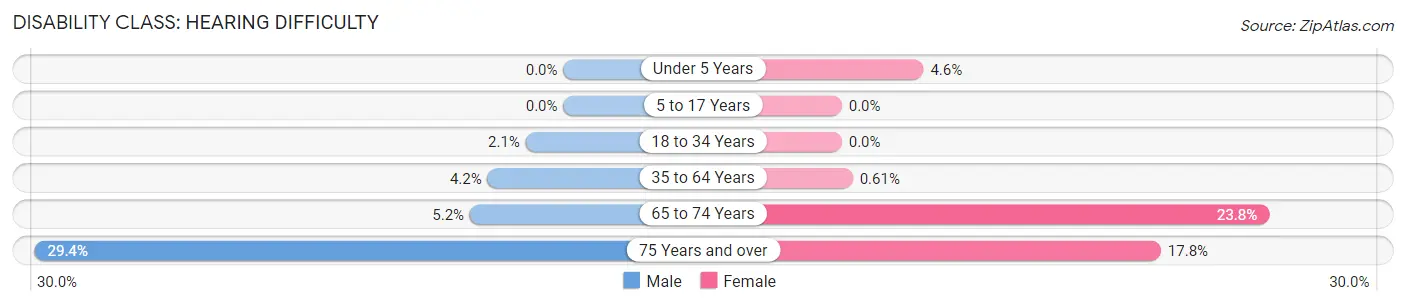
| Age Bracket | Male | Female |
| Under 5 Years | 0 (0.0%) | 13 (4.5%) |
| 5 to 17 Years | 0 (0.0%) | 0 (0.0%) |
| 18 to 34 Years | 17 (2.1%) | 0 (0.0%) |
| 35 to 64 Years | 79 (4.2%) | 10 (0.6%) |
| 65 to 74 Years | 13 (5.2%) | 118 (23.8%) |
| 75 Years and over | 106 (29.4%) | 70 (17.8%) |
Disability Class: Vision Difficulty
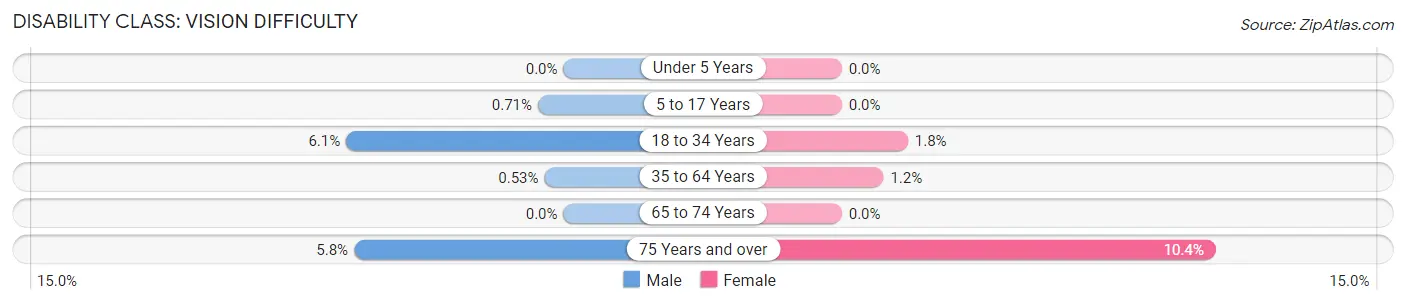
| Age Bracket | Male | Female |
| Under 5 Years | 0 (0.0%) | 0 (0.0%) |
| 5 to 17 Years | 4 (0.7%) | 0 (0.0%) |
| 18 to 34 Years | 49 (6.0%) | 15 (1.8%) |
| 35 to 64 Years | 10 (0.5%) | 19 (1.2%) |
| 65 to 74 Years | 0 (0.0%) | 0 (0.0%) |
| 75 Years and over | 21 (5.8%) | 41 (10.4%) |
Disability Class: Cognitive Difficulty
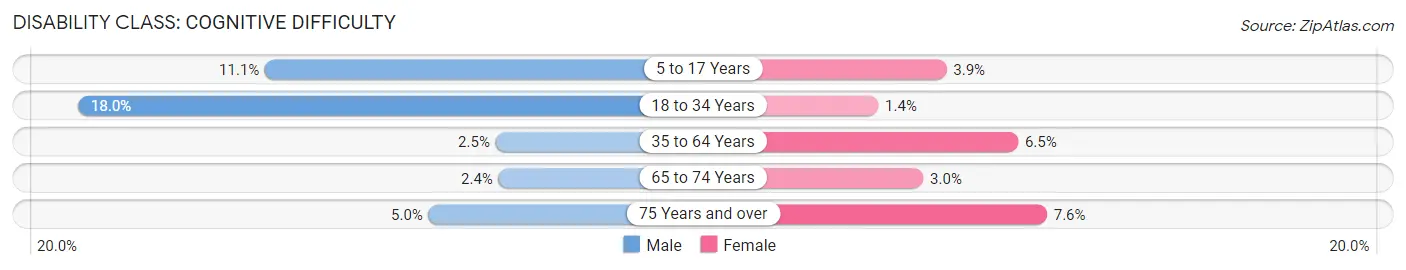
| Age Bracket | Male | Female |
| 5 to 17 Years | 62 (11.1%) | 24 (3.9%) |
| 18 to 34 Years | 146 (18.0%) | 11 (1.3%) |
| 35 to 64 Years | 47 (2.5%) | 107 (6.5%) |
| 65 to 74 Years | 6 (2.4%) | 15 (3.0%) |
| 75 Years and over | 18 (5.0%) | 30 (7.6%) |
Disability Class: Ambulatory Difficulty
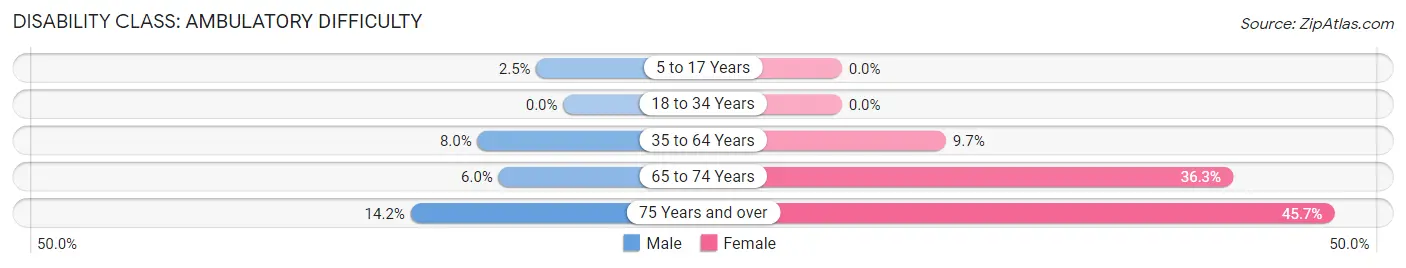
| Age Bracket | Male | Female |
| 5 to 17 Years | 14 (2.5%) | 0 (0.0%) |
| 18 to 34 Years | 0 (0.0%) | 0 (0.0%) |
| 35 to 64 Years | 149 (8.0%) | 158 (9.7%) |
| 65 to 74 Years | 15 (6.0%) | 180 (36.3%) |
| 75 Years and over | 51 (14.2%) | 180 (45.7%) |
Disability Class: Self-Care Difficulty
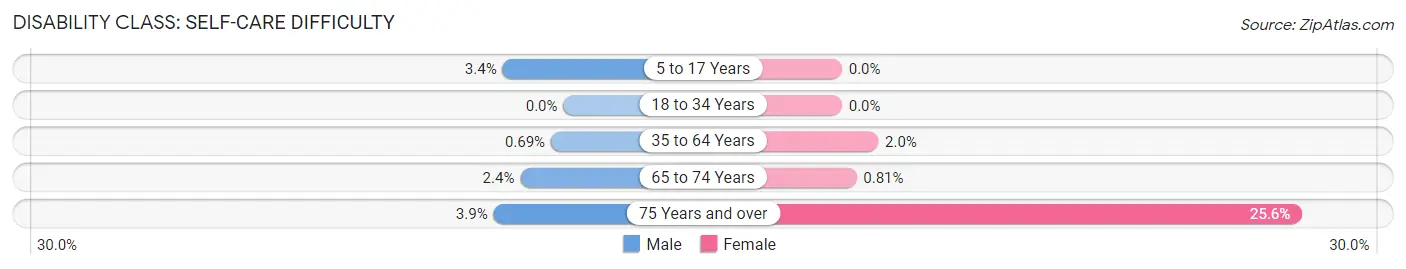
| Age Bracket | Male | Female |
| 5 to 17 Years | 19 (3.4%) | 0 (0.0%) |
| 18 to 34 Years | 0 (0.0%) | 0 (0.0%) |
| 35 to 64 Years | 13 (0.7%) | 33 (2.0%) |
| 65 to 74 Years | 6 (2.4%) | 4 (0.8%) |
| 75 Years and over | 14 (3.9%) | 101 (25.6%) |
Technology Access in Smithfield
Computing Device Access in Smithfield
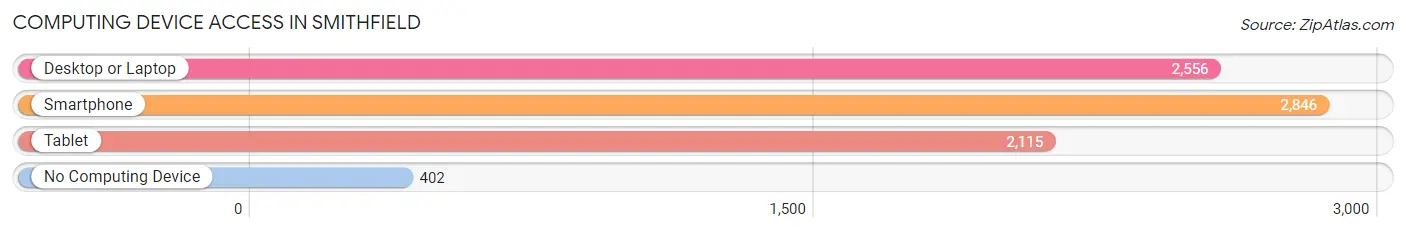
| Device Type | # Households | % Households |
| Desktop or Laptop | 2,556 | 74.8% |
| Smartphone | 2,846 | 83.3% |
| Tablet | 2,115 | 61.9% |
| No Computing Device | 402 | 11.8% |
| Total | 3,418 | 100.0% |
Internet Access in Smithfield
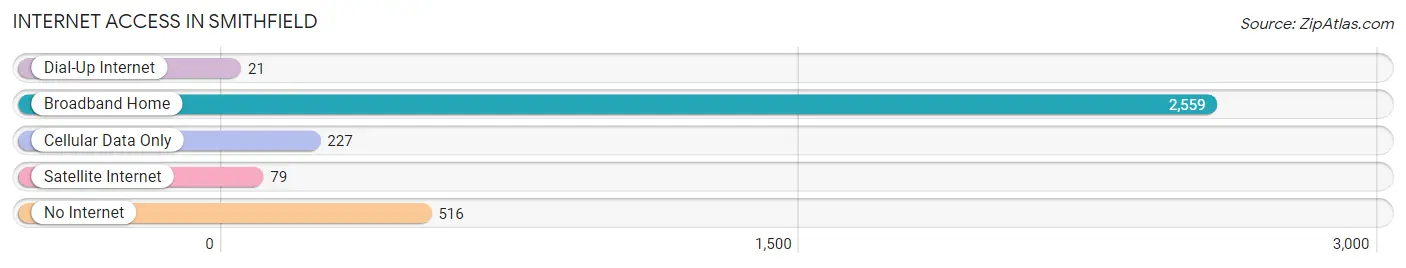
| Internet Type | # Households | % Households |
| Dial-Up Internet | 21 | 0.6% |
| Broadband Home | 2,559 | 74.9% |
| Cellular Data Only | 227 | 6.6% |
| Satellite Internet | 79 | 2.3% |
| No Internet | 516 | 15.1% |
| Total | 3,418 | 100.0% |
Smithfield Summary
Smithfield, Virginia is a small town located in the southeastern part of the state, in Isle of Wight County. It is situated on the banks of the Pagan River, and is part of the Hampton Roads metropolitan area. The town has a population of 8,089 as of the 2010 census, and is the county seat of Isle of Wight County.
History
Smithfield was first settled in 1634 by English colonists, and was originally known as “Smith’s Ferry”. The town was named after the Smith family, who were among the first settlers. The town was officially incorporated in 1752, and was the first town in the county to be incorporated.
In the late 1700s, Smithfield became a major port for the export of tobacco, and was a major center of the slave trade. The town was also a major center of the Revolutionary War, and was the site of several battles.
In the late 1800s, Smithfield became a major center of the pork industry, and is still known as the “Ham Capital of the World”. The town is home to several major pork processing plants, and is the site of the annual Smithfield Ham and Gourmet Food Festival.
Geography
Smithfield is located in southeastern Virginia, in Isle of Wight County. The town is situated on the banks of the Pagan River, and is part of the Hampton Roads metropolitan area. The town has a total area of 4.2 square miles, all of which is land.
The town is located in a humid subtropical climate zone, and has hot, humid summers and mild winters. The average annual temperature is around 61 degrees Fahrenheit, and the average annual precipitation is around 44 inches.
Economy
Smithfield’s economy is largely based on the pork industry. The town is home to several major pork processing plants, and is the site of the annual Smithfield Ham and Gourmet Food Festival. The town is also home to several other industries, including manufacturing, retail, and tourism.
Demographics
As of the 2010 census, Smithfield had a population of 8,089. The racial makeup of the town was 79.2% White, 15.3% African American, 0.7% Native American, 0.9% Asian, 0.1% Pacific Islander, 1.7% from other races, and 2.1% from two or more races. Hispanic or Latino of any race were 4.2% of the population.
The median income for a household in Smithfield was $45,938, and the median income for a family was $54,938. The per capita income for the town was $22,938. About 11.2% of families and 14.2% of the population were below the poverty line, including 19.2% of those under age 18 and 8.2% of those age 65 or over.
Common Questions
What is Per Capita Income in Smithfield?
Per Capita income in Smithfield is $50,223.
What is the Median Family Income in Smithfield?
Median Family Income in Smithfield is $121,029.
What is the Median Household income in Smithfield?
Median Household Income in Smithfield is $101,081.
What is Income or Wage Gap in Smithfield?
Income or Wage Gap in Smithfield is 38.6%.
Women in Smithfield earn 61.4 cents for every dollar earned by a man.
What is Inequality or Gini Index in Smithfield?
Inequality or Gini Index in Smithfield is 0.45.
What is the Total Population of Smithfield?
Total Population of Smithfield is 8,625.
What is the Total Male Population of Smithfield?
Total Male Population of Smithfield is 4,315.
What is the Total Female Population of Smithfield?
Total Female Population of Smithfield is 4,310.
What is the Ratio of Males per 100 Females in Smithfield?
There are 100.12 Males per 100 Females in Smithfield.
What is the Ratio of Females per 100 Males in Smithfield?
There are 99.88 Females per 100 Males in Smithfield.
What is the Median Population Age in Smithfield?
Median Population Age in Smithfield is 45.6 Years.
What is the Average Family Size in Smithfield
Average Family Size in Smithfield is 3.0 People.
What is the Average Household Size in Smithfield
Average Household Size in Smithfield is 2.5 People.
How Large is the Labor Force in Smithfield?
There are 4,440 People in the Labor Forcein in Smithfield.
What is the Percentage of People in the Labor Force in Smithfield?
62.6% of People are in the Labor Force in Smithfield.
What is the Unemployment Rate in Smithfield?
Unemployment Rate in Smithfield is 4.7%.