North Springfield, VA Map & Demographics
North Springfield Map
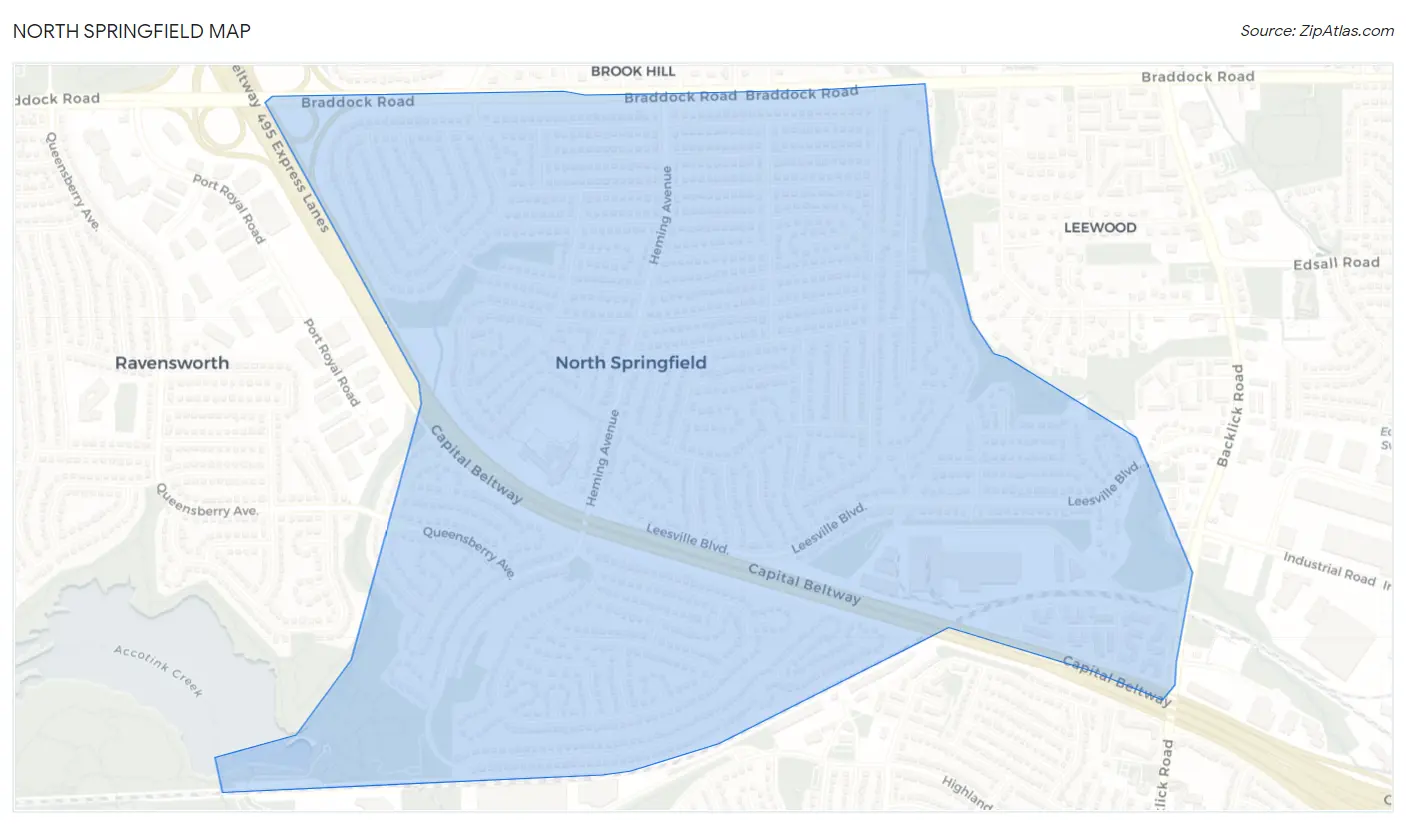
North Springfield Overview
$44,163
PER CAPITA INCOME
$157,863
AVG FAMILY INCOME
$119,151
AVG HOUSEHOLD INCOME
16.3%
WAGE / INCOME GAP [ % ]
83.7¢/ $1
WAGE / INCOME GAP [ $ ]
0.34
INEQUALITY / GINI INDEX
6,916
TOTAL POPULATION
3,432
MALE POPULATION
3,484
FEMALE POPULATION
98.51
MALES / 100 FEMALES
101.52
FEMALES / 100 MALES
38.6
MEDIAN AGE
3.8
AVG FAMILY SIZE
3.1
AVG HOUSEHOLD SIZE
3,743
LABOR FORCE [ PEOPLE ]
71.6%
PERCENT IN LABOR FORCE
3.5%
UNEMPLOYMENT RATE
North Springfield Area Codes
Income in North Springfield
Income Overview in North Springfield
Per Capita Income in North Springfield is $44,163, while median incomes of families and households are $157,863 and $119,151 respectively.
| Characteristic | Number | Measure |
| Per Capita Income | 6,916 | $44,163 |
| Median Family Income | 1,535 | $157,863 |
| Mean Family Income | 1,535 | $150,766 |
| Median Household Income | 2,222 | $119,151 |
| Mean Household Income | 2,222 | $133,259 |
| Income Deficit | 1,535 | $0 |
| Wage / Income Gap (%) | 6,916 | 16.26% |
| Wage / Income Gap ($) | 6,916 | 83.74¢ per $1 |
| Gini / Inequality Index | 6,916 | 0.34 |
Earnings by Sex in North Springfield
Average Earnings in North Springfield are $50,556, $54,209 for men and $45,395 for women, a difference of 16.3%.
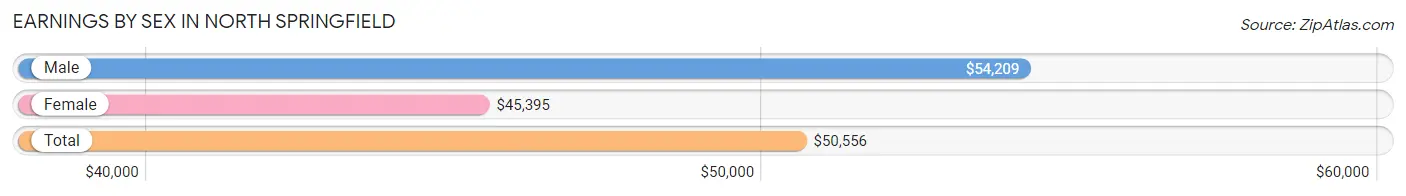
| Sex | Number | Average Earnings |
| Male | 2,146 (55.9%) | $54,209 |
| Female | 1,690 (44.1%) | $45,395 |
| Total | 3,836 (100.0%) | $50,556 |
Earnings by Sex by Income Bracket in North Springfield
The most common earnings brackets in North Springfield are $100,000+ for men (481 | 22.4%) and $55,000 to $64,999 for women (249 | 14.7%).
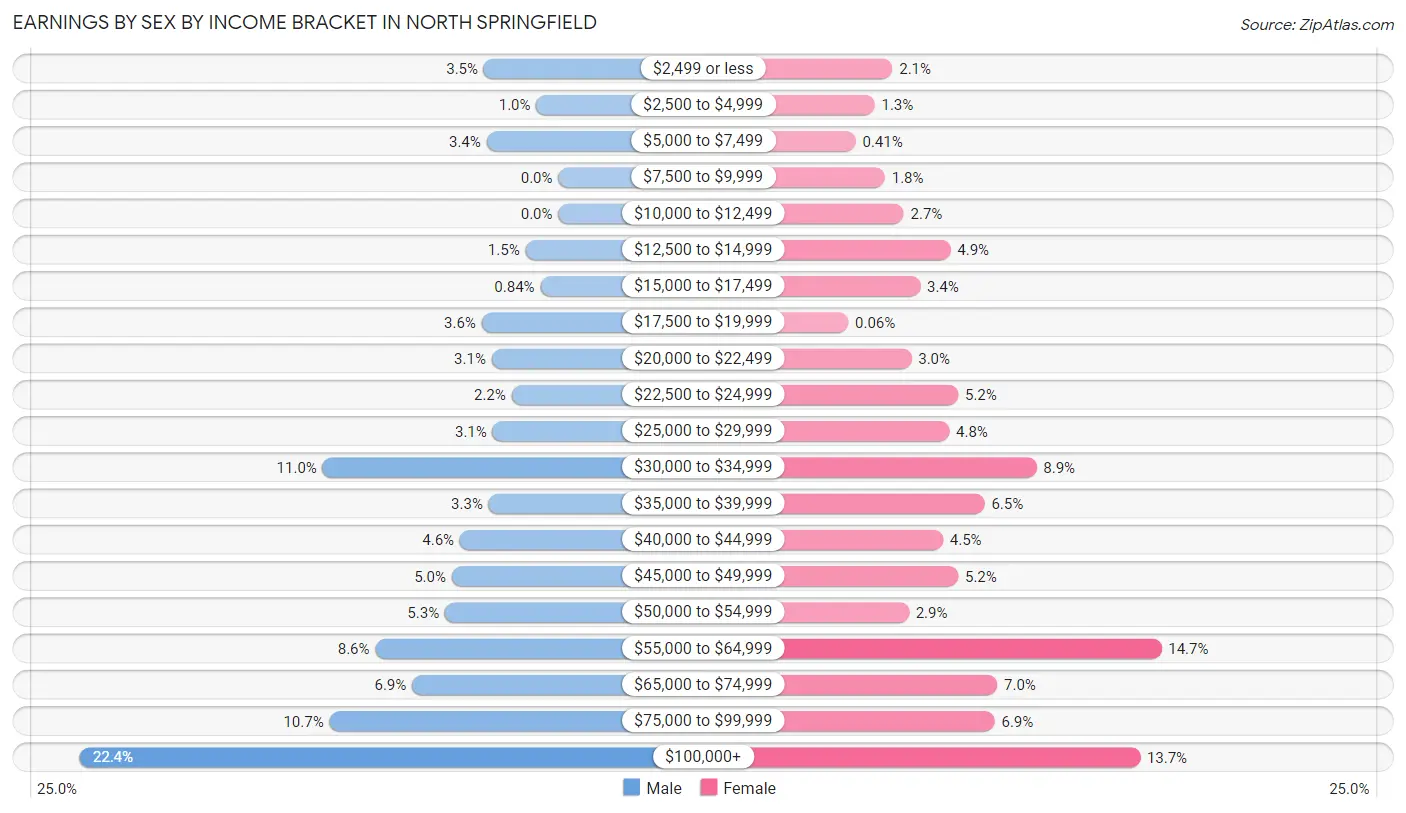
| Income | Male | Female |
| $2,499 or less | 75 (3.5%) | 36 (2.1%) |
| $2,500 to $4,999 | 22 (1.0%) | 22 (1.3%) |
| $5,000 to $7,499 | 72 (3.4%) | 7 (0.4%) |
| $7,500 to $9,999 | 0 (0.0%) | 30 (1.8%) |
| $10,000 to $12,499 | 0 (0.0%) | 45 (2.7%) |
| $12,500 to $14,999 | 33 (1.5%) | 82 (4.9%) |
| $15,000 to $17,499 | 18 (0.8%) | 58 (3.4%) |
| $17,500 to $19,999 | 77 (3.6%) | 1 (0.1%) |
| $20,000 to $22,499 | 67 (3.1%) | 51 (3.0%) |
| $22,500 to $24,999 | 47 (2.2%) | 88 (5.2%) |
| $25,000 to $29,999 | 66 (3.1%) | 81 (4.8%) |
| $30,000 to $34,999 | 237 (11.0%) | 150 (8.9%) |
| $35,000 to $39,999 | 70 (3.3%) | 109 (6.5%) |
| $40,000 to $44,999 | 99 (4.6%) | 76 (4.5%) |
| $45,000 to $49,999 | 107 (5.0%) | 88 (5.2%) |
| $50,000 to $54,999 | 114 (5.3%) | 49 (2.9%) |
| $55,000 to $64,999 | 184 (8.6%) | 249 (14.7%) |
| $65,000 to $74,999 | 147 (6.9%) | 119 (7.0%) |
| $75,000 to $99,999 | 230 (10.7%) | 117 (6.9%) |
| $100,000+ | 481 (22.4%) | 232 (13.7%) |
| Total | 2,146 (100.0%) | 1,690 (100.0%) |
Earnings by Sex by Educational Attainment in North Springfield
Average earnings in North Springfield are $56,809 for men and $46,952 for women, a difference of 17.3%. Men with an educational attainment of graduate degree enjoy the highest average annual earnings of $104,722, while those with high school diploma education earn the least with $41,727. Women with an educational attainment of graduate degree earn the most with the average annual earnings of $83,309, while those with high school diploma education have the smallest earnings of $25,703.
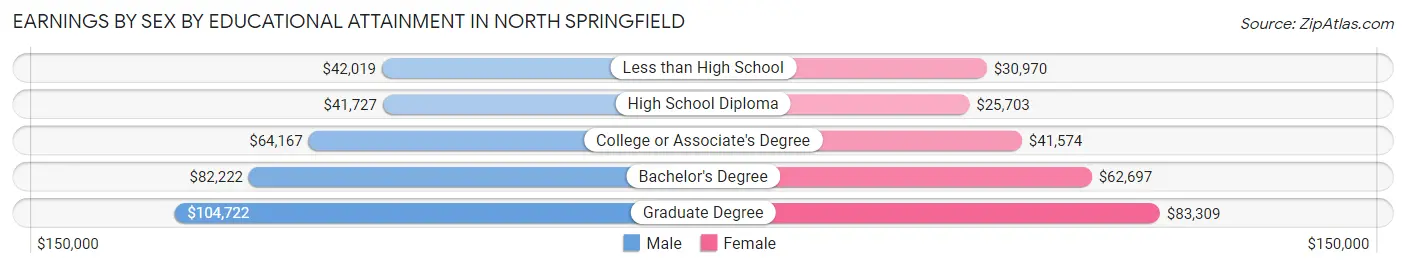
| Educational Attainment | Male Income | Female Income |
| Less than High School | $42,019 | $30,970 |
| High School Diploma | $41,727 | $25,703 |
| College or Associate's Degree | $64,167 | $41,574 |
| Bachelor's Degree | $82,222 | $62,697 |
| Graduate Degree | $104,722 | $83,309 |
| Total | $56,809 | $46,952 |
Family Income in North Springfield
Family Income Brackets in North Springfield
According to the North Springfield family income data, there are 454 families falling into the $150,000 to $199,999 income range, which is the most common income bracket and makes up 29.6% of all families.
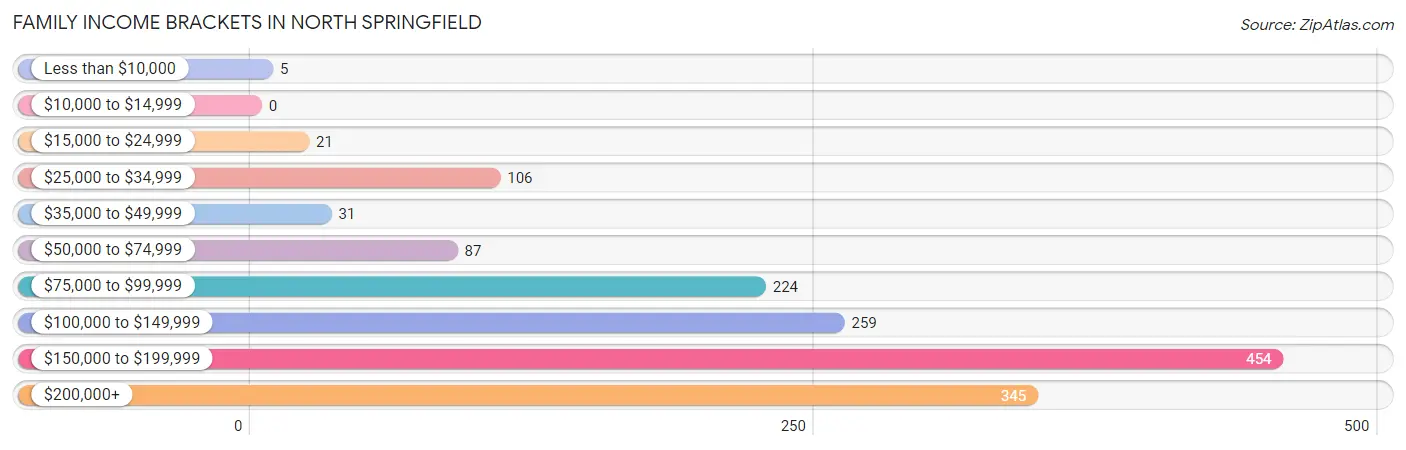
| Income Bracket | # Families | % Families |
| Less than $10,000 | 5 | 0.3% |
| $10,000 to $14,999 | 0 | 0.0% |
| $15,000 to $24,999 | 21 | 1.4% |
| $25,000 to $34,999 | 106 | 6.9% |
| $35,000 to $49,999 | 31 | 2.0% |
| $50,000 to $74,999 | 87 | 5.7% |
| $75,000 to $99,999 | 224 | 14.6% |
| $100,000 to $149,999 | 259 | 16.9% |
| $150,000 to $199,999 | 454 | 29.6% |
| $200,000+ | 345 | 22.5% |
Family Income by Famaliy Size in North Springfield
3-person families (294 | 19.2%) account for the highest median family income in North Springfield with $171,250 per family, while 2-person families (536 | 34.9%) have the highest median income of $62,200 per family member.
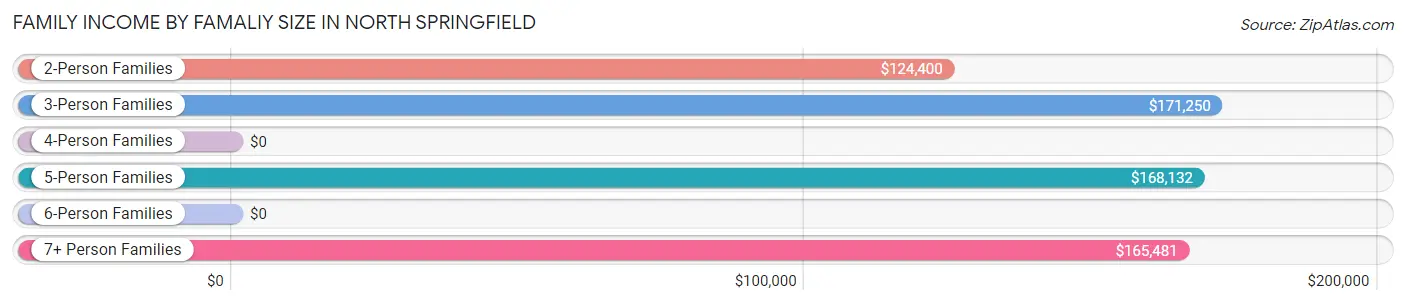
| Income Bracket | # Families | Median Income |
| 2-Person Families | 536 (34.9%) | $124,400 |
| 3-Person Families | 294 (19.2%) | $171,250 |
| 4-Person Families | 332 (21.6%) | $0 |
| 5-Person Families | 302 (19.7%) | $168,132 |
| 6-Person Families | 26 (1.7%) | $0 |
| 7+ Person Families | 45 (2.9%) | $165,481 |
| Total | 1,535 (100.0%) | $157,863 |
Family Income by Number of Earners in North Springfield
The median family income in North Springfield is $157,863, with families comprising 3+ earners (368) having the highest median family income of $167,989, while families with no earners (176) have the lowest median family income of $115,441, accounting for 24.0% and 11.5% of families, respectively.
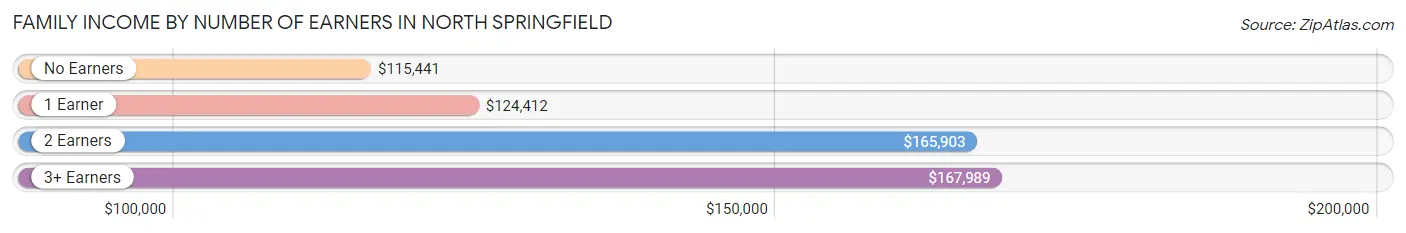
| Number of Earners | # Families | Median Income |
| No Earners | 176 (11.5%) | $115,441 |
| 1 Earner | 358 (23.3%) | $124,412 |
| 2 Earners | 633 (41.2%) | $165,903 |
| 3+ Earners | 368 (24.0%) | $167,989 |
| Total | 1,535 (100.0%) | $157,863 |
Household Income in North Springfield
Household Income Brackets in North Springfield
With 504 households falling in the category, the $150,000 to $199,999 income range is the most frequent in North Springfield, accounting for 22.7% of all households. In contrast, only 22 households (1.0%) fall into the $10,000 to $14,999 income bracket, making it the least populous group.
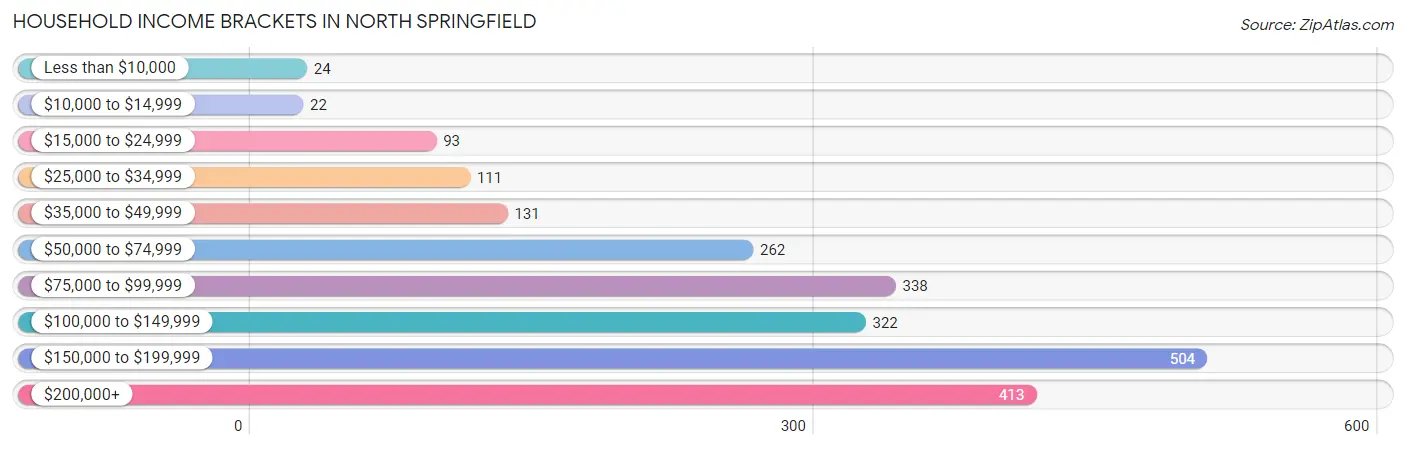
| Income Bracket | # Households | % Households |
| Less than $10,000 | 24 | 1.1% |
| $10,000 to $14,999 | 22 | 1.0% |
| $15,000 to $24,999 | 93 | 4.2% |
| $25,000 to $34,999 | 111 | 5.0% |
| $35,000 to $49,999 | 131 | 5.9% |
| $50,000 to $74,999 | 262 | 11.8% |
| $75,000 to $99,999 | 338 | 15.2% |
| $100,000 to $149,999 | 322 | 14.5% |
| $150,000 to $199,999 | 504 | 22.7% |
| $200,000+ | 413 | 18.6% |
Household Income by Householder Age in North Springfield
The median household income in North Springfield is $119,151, with the highest median household income of $154,457 found in the 45 to 64 years age bracket for the primary householder. A total of 952 households (42.8%) fall into this category. Meanwhile, the 15 to 24 years age bracket for the primary householder has the lowest median household income of $0, with 75 households (3.4%) in this group.
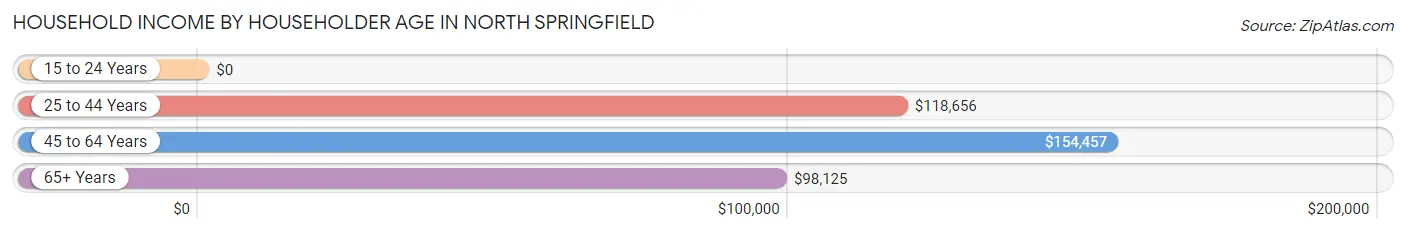
| Income Bracket | # Households | Median Income |
| 15 to 24 Years | 75 (3.4%) | $0 |
| 25 to 44 Years | 561 (25.3%) | $118,656 |
| 45 to 64 Years | 952 (42.8%) | $154,457 |
| 65+ Years | 634 (28.5%) | $98,125 |
| Total | 2,222 (100.0%) | $119,151 |
Poverty in North Springfield
Income Below Poverty by Sex and Age in North Springfield
With 7.3% poverty level for males and 6.5% for females among the residents of North Springfield, 6 to 11 year old males and 12 to 14 year old females are the most vulnerable to poverty, with 94 males (38.7%) and 97 females (72.4%) in their respective age groups living below the poverty level.
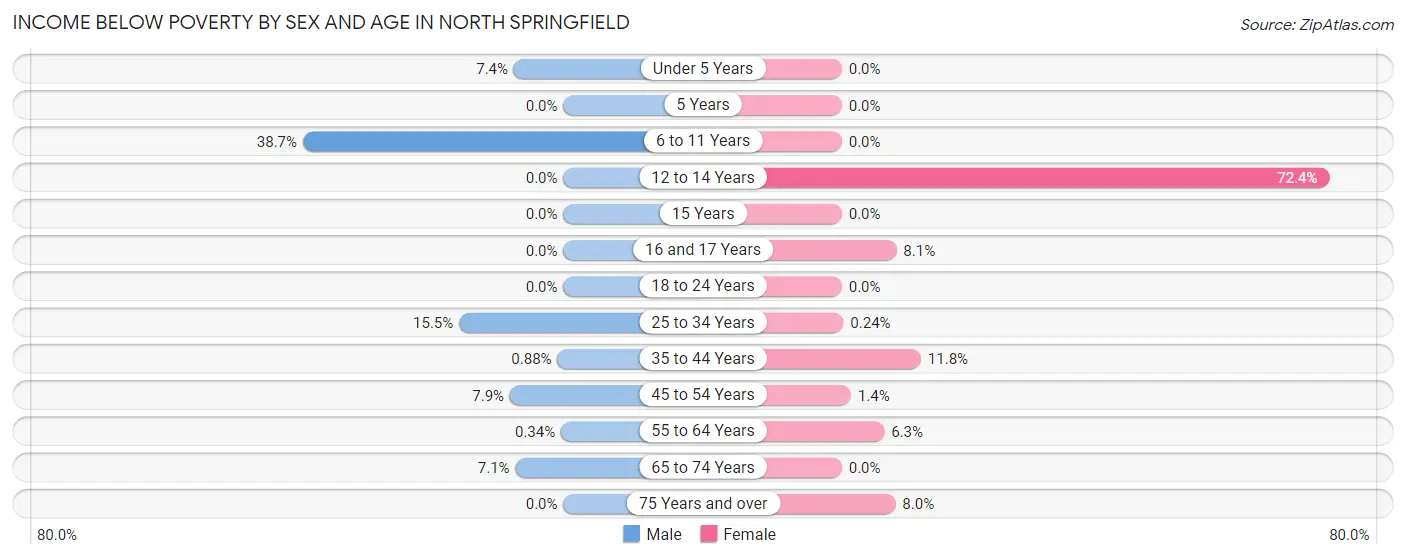
| Age Bracket | Male | Female |
| Under 5 Years | 23 (7.3%) | 0 (0.0%) |
| 5 Years | 0 (0.0%) | 0 (0.0%) |
| 6 to 11 Years | 94 (38.7%) | 0 (0.0%) |
| 12 to 14 Years | 0 (0.0%) | 97 (72.4%) |
| 15 Years | 0 (0.0%) | 0 (0.0%) |
| 16 and 17 Years | 0 (0.0%) | 3 (8.1%) |
| 18 to 24 Years | 0 (0.0%) | 0 (0.0%) |
| 25 to 34 Years | 63 (15.5%) | 1 (0.2%) |
| 35 to 44 Years | 3 (0.9%) | 67 (11.7%) |
| 45 to 54 Years | 43 (7.9%) | 3 (1.4%) |
| 55 to 64 Years | 2 (0.3%) | 38 (6.3%) |
| 65 to 74 Years | 23 (7.1%) | 0 (0.0%) |
| 75 Years and over | 0 (0.0%) | 16 (8.0%) |
| Total | 251 (7.3%) | 225 (6.5%) |
Income Above Poverty by Sex and Age in North Springfield
According to the poverty statistics in North Springfield, males aged 5 years and females aged under 5 years are the age groups that are most secure financially, with 100.0% of males and 100.0% of females in these age groups living above the poverty line.
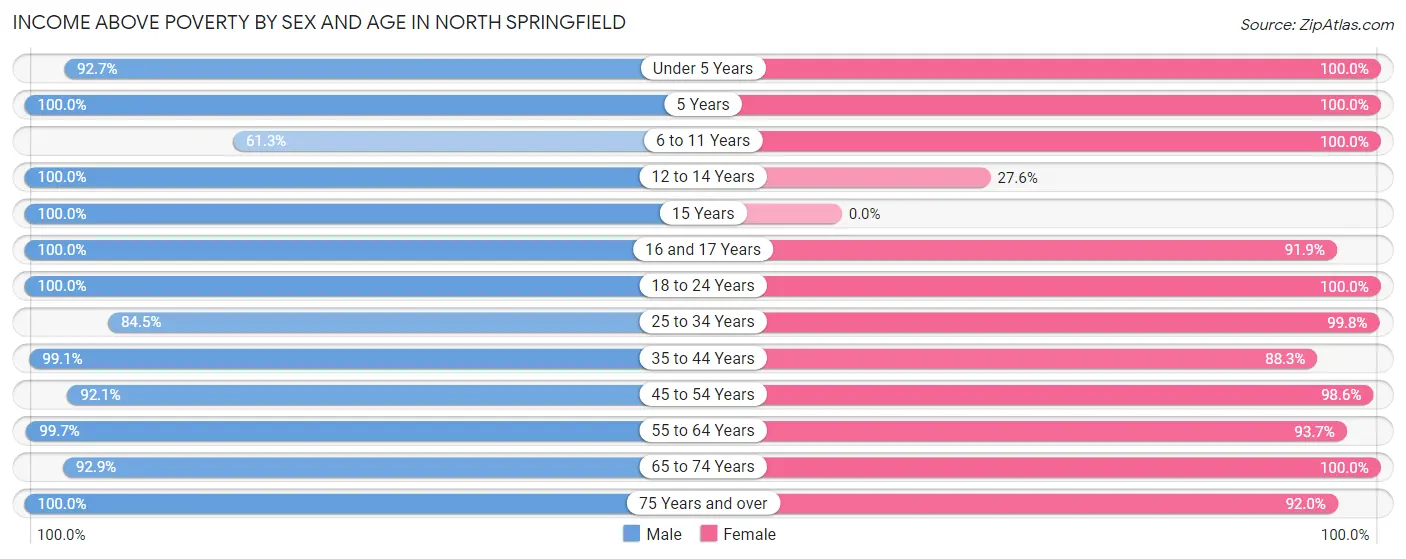
| Age Bracket | Male | Female |
| Under 5 Years | 290 (92.6%) | 301 (100.0%) |
| 5 Years | 72 (100.0%) | 98 (100.0%) |
| 6 to 11 Years | 149 (61.3%) | 375 (100.0%) |
| 12 to 14 Years | 130 (100.0%) | 37 (27.6%) |
| 15 Years | 23 (100.0%) | 0 (0.0%) |
| 16 and 17 Years | 60 (100.0%) | 34 (91.9%) |
| 18 to 24 Years | 275 (100.0%) | 160 (100.0%) |
| 25 to 34 Years | 344 (84.5%) | 420 (99.8%) |
| 35 to 44 Years | 337 (99.1%) | 503 (88.2%) |
| 45 to 54 Years | 499 (92.1%) | 218 (98.6%) |
| 55 to 64 Years | 581 (99.7%) | 564 (93.7%) |
| 65 to 74 Years | 300 (92.9%) | 362 (100.0%) |
| 75 Years and over | 121 (100.0%) | 185 (92.0%) |
| Total | 3,181 (92.7%) | 3,257 (93.5%) |
Income Below Poverty Among Married-Couple Families in North Springfield
The poverty statistics for married-couple families in North Springfield show that 4.6% or 53 of the total 1,159 families live below the poverty line. Families with 3 or 4 children have the highest poverty rate of 23.4%, comprising of 45 families. On the other hand, families with 1 or 2 children have the lowest poverty rate of 0.0%, which includes 0 families.
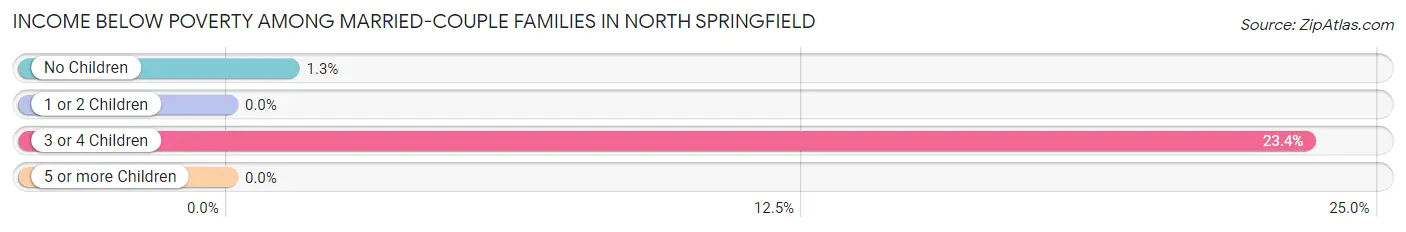
| Children | Above Poverty | Below Poverty |
| No Children | 591 (98.7%) | 8 (1.3%) |
| 1 or 2 Children | 365 (100.0%) | 0 (0.0%) |
| 3 or 4 Children | 147 (76.6%) | 45 (23.4%) |
| 5 or more Children | 3 (100.0%) | 0 (0.0%) |
| Total | 1,106 (95.4%) | 53 (4.6%) |
Income Below Poverty Among Single-Parent Households in North Springfield
| Children | Single Father | Single Mother |
| No Children | 0 (0.0%) | 0 (0.0%) |
| 1 or 2 Children | 0 (0.0%) | 0 (0.0%) |
| 3 or 4 Children | 0 (0.0%) | 0 (0.0%) |
| 5 or more Children | 0 (0.0%) | 17 (100.0%) |
| Total | 0 (0.0%) | 17 (10.8%) |
Income Below Poverty Among Married-Couple vs Single-Parent Households in North Springfield
The poverty data for North Springfield shows that 53 of the married-couple family households (4.6%) and 17 of the single-parent households (4.5%) are living below the poverty level. Within the married-couple family households, those with 3 or 4 children have the highest poverty rate, with 45 households (23.4%) falling below the poverty line. Among the single-parent households, those with 5 or more children have the highest poverty rate, with 17 household (100.0%) living below poverty.
| Children | Married-Couple Families | Single-Parent Households |
| No Children | 8 (1.3%) | 0 (0.0%) |
| 1 or 2 Children | 0 (0.0%) | 0 (0.0%) |
| 3 or 4 Children | 45 (23.4%) | 0 (0.0%) |
| 5 or more Children | 0 (0.0%) | 17 (100.0%) |
| Total | 53 (4.6%) | 17 (4.5%) |
Race in North Springfield
The most populous races in North Springfield are White / Caucasian (3,216 | 46.5%), Asian (2,649 | 38.3%), and Hispanic or Latino (1,128 | 16.3%).
| Race | # Population | % Population |
| Asian | 2,649 | 38.3% |
| Black / African American | 228 | 3.3% |
| Hawaiian / Pacific | 0 | 0.0% |
| Hispanic or Latino | 1,128 | 16.3% |
| Native / Alaskan | 90 | 1.3% |
| White / Caucasian | 3,216 | 46.5% |
| Two or more Races | 432 | 6.2% |
| Some other Race | 301 | 4.3% |
| Total | 6,916 | 100.0% |
Ancestry in North Springfield
The most populous ancestries reported in North Springfield are Sri Lankan (1,801 | 26.0%), Irish (573 | 8.3%), German (475 | 6.9%), Central American (468 | 6.8%), and English (443 | 6.4%), together accounting for 54.4% of all North Springfield residents.
| Ancestry | # Population | % Population |
| African | 61 | 0.9% |
| American | 332 | 4.8% |
| Arab | 43 | 0.6% |
| Bolivian | 269 | 3.9% |
| Brazilian | 33 | 0.5% |
| British | 305 | 4.4% |
| Burmese | 165 | 2.4% |
| Canadian | 6 | 0.1% |
| Celtic | 3 | 0.0% |
| Central American | 468 | 6.8% |
| Central American Indian | 38 | 0.5% |
| Cherokee | 3 | 0.0% |
| Colombian | 18 | 0.3% |
| Croatian | 9 | 0.1% |
| Czech | 22 | 0.3% |
| Dutch | 43 | 0.6% |
| Eastern European | 20 | 0.3% |
| English | 443 | 6.4% |
| Ethiopian | 22 | 0.3% |
| European | 147 | 2.1% |
| Finnish | 5 | 0.1% |
| French | 63 | 0.9% |
| French Canadian | 18 | 0.3% |
| German | 475 | 6.9% |
| Greek | 17 | 0.3% |
| Guyanese | 11 | 0.2% |
| Haitian | 18 | 0.3% |
| Honduran | 258 | 3.7% |
| Hungarian | 16 | 0.2% |
| Indian (Asian) | 185 | 2.7% |
| Iranian | 13 | 0.2% |
| Irish | 573 | 8.3% |
| Italian | 245 | 3.5% |
| Korean | 242 | 3.5% |
| Liberian | 2 | 0.0% |
| Mexican | 155 | 2.2% |
| Mexican American Indian | 95 | 1.4% |
| Mongolian | 237 | 3.4% |
| Moroccan | 10 | 0.1% |
| Norwegian | 42 | 0.6% |
| Palestinian | 23 | 0.3% |
| Peruvian | 47 | 0.7% |
| Polish | 74 | 1.1% |
| Portuguese | 66 | 0.9% |
| Puerto Rican | 8 | 0.1% |
| Romanian | 39 | 0.6% |
| Russian | 11 | 0.2% |
| Salvadoran | 210 | 3.0% |
| Scandinavian | 13 | 0.2% |
| Scotch-Irish | 66 | 0.9% |
| Scottish | 104 | 1.5% |
| Sierra Leonean | 5 | 0.1% |
| Slovene | 20 | 0.3% |
| South American | 334 | 4.8% |
| South American Indian | 2 | 0.0% |
| Spaniard | 23 | 0.3% |
| Spanish | 122 | 1.8% |
| Sri Lankan | 1,801 | 26.0% |
| Subsaharan African | 98 | 1.4% |
| Swiss | 12 | 0.2% |
| Thai | 301 | 4.3% |
| Ukrainian | 7 | 0.1% |
| Welsh | 47 | 0.7% | View All 63 Rows |
Immigrants in North Springfield
The most numerous immigrant groups reported in North Springfield came from Asia (1,529 | 22.1%), South Eastern Asia (1,184 | 17.1%), Vietnam (825 | 11.9%), Latin America (684 | 9.9%), and South America (344 | 5.0%), together accounting for 66.0% of all North Springfield residents.
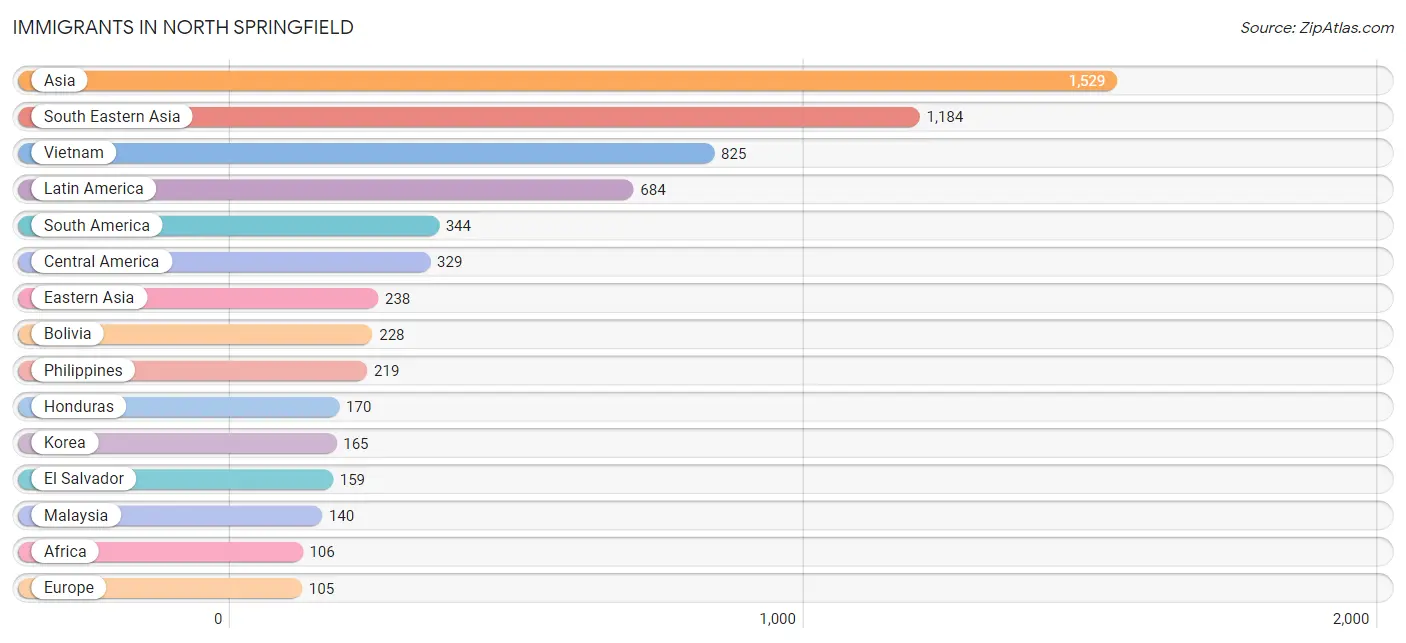
| Immigration Origin | # Population | % Population |
| Africa | 106 | 1.5% |
| Argentina | 32 | 0.5% |
| Asia | 1,529 | 22.1% |
| Bangladesh | 8 | 0.1% |
| Bolivia | 228 | 3.3% |
| Brazil | 15 | 0.2% |
| Cameroon | 6 | 0.1% |
| Caribbean | 11 | 0.2% |
| Central America | 329 | 4.8% |
| China | 66 | 0.9% |
| Eastern Africa | 64 | 0.9% |
| Eastern Asia | 238 | 3.4% |
| Eastern Europe | 46 | 0.7% |
| El Salvador | 159 | 2.3% |
| England | 29 | 0.4% |
| Eritrea | 37 | 0.5% |
| Ethiopia | 27 | 0.4% |
| Europe | 105 | 1.5% |
| France | 11 | 0.2% |
| Guyana | 11 | 0.2% |
| Haiti | 11 | 0.2% |
| Honduras | 170 | 2.5% |
| Hong Kong | 45 | 0.6% |
| India | 8 | 0.1% |
| Iran | 13 | 0.2% |
| Japan | 7 | 0.1% |
| Jordan | 5 | 0.1% |
| Korea | 165 | 2.4% |
| Kuwait | 28 | 0.4% |
| Latin America | 684 | 9.9% |
| Liberia | 5 | 0.1% |
| Malaysia | 140 | 2.0% |
| Middle Africa | 14 | 0.2% |
| Morocco | 10 | 0.1% |
| Northern Africa | 10 | 0.1% |
| Northern Europe | 29 | 0.4% |
| Peru | 58 | 0.8% |
| Philippines | 219 | 3.2% |
| Portugal | 19 | 0.3% |
| Romania | 39 | 0.6% |
| Sierra Leone | 5 | 0.1% |
| South America | 344 | 5.0% |
| South Central Asia | 29 | 0.4% |
| South Eastern Asia | 1,184 | 17.1% |
| Southern Europe | 19 | 0.3% |
| Turkey | 37 | 0.5% |
| Ukraine | 7 | 0.1% |
| Vietnam | 825 | 11.9% |
| Western Africa | 18 | 0.3% |
| Western Asia | 78 | 1.1% |
| Western Europe | 11 | 0.2% | View All 51 Rows |
Sex and Age in North Springfield
Sex and Age in North Springfield
The most populous age groups in North Springfield are 55 to 59 Years (428 | 12.5%) for men and 5 to 9 Years (441 | 12.7%) for women.
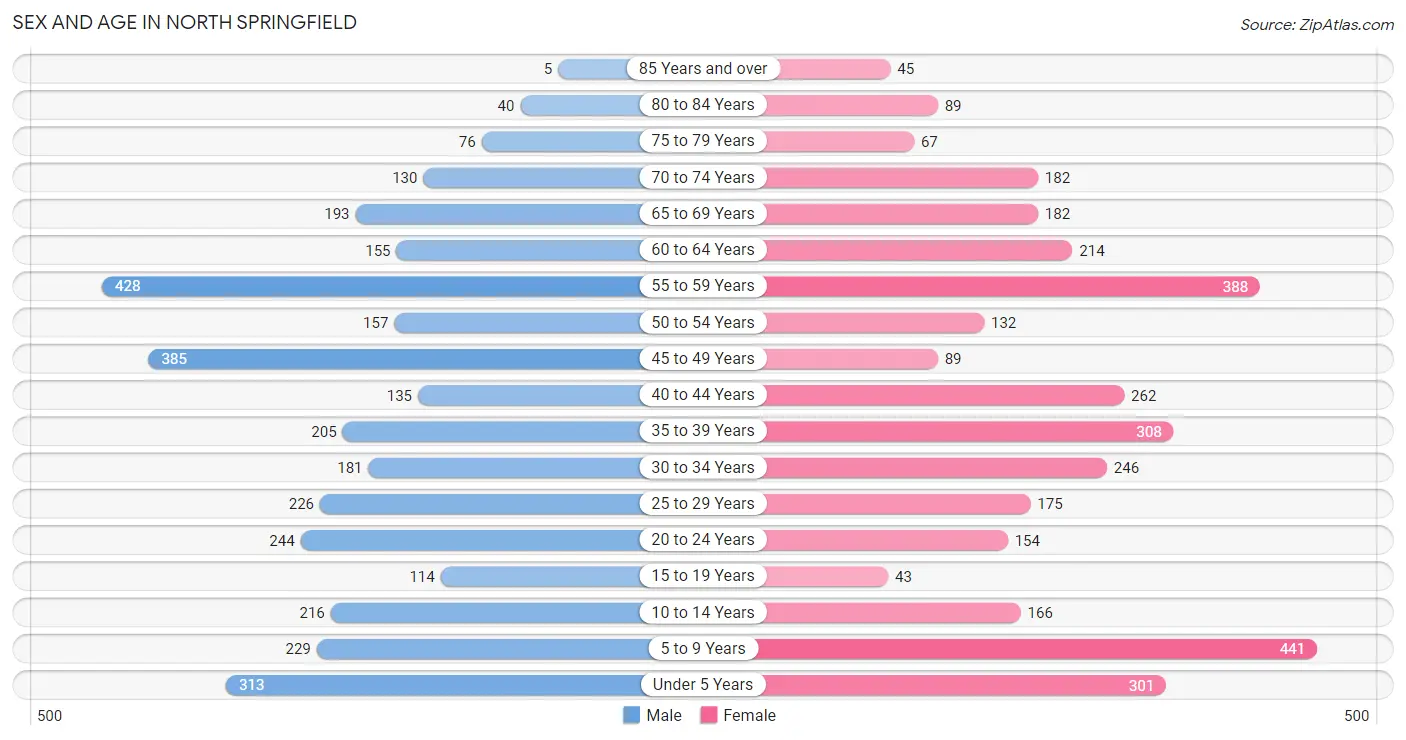
| Age Bracket | Male | Female |
| Under 5 Years | 313 (9.1%) | 301 (8.6%) |
| 5 to 9 Years | 229 (6.7%) | 441 (12.7%) |
| 10 to 14 Years | 216 (6.3%) | 166 (4.8%) |
| 15 to 19 Years | 114 (3.3%) | 43 (1.2%) |
| 20 to 24 Years | 244 (7.1%) | 154 (4.4%) |
| 25 to 29 Years | 226 (6.6%) | 175 (5.0%) |
| 30 to 34 Years | 181 (5.3%) | 246 (7.1%) |
| 35 to 39 Years | 205 (6.0%) | 308 (8.8%) |
| 40 to 44 Years | 135 (3.9%) | 262 (7.5%) |
| 45 to 49 Years | 385 (11.2%) | 89 (2.5%) |
| 50 to 54 Years | 157 (4.6%) | 132 (3.8%) |
| 55 to 59 Years | 428 (12.5%) | 388 (11.1%) |
| 60 to 64 Years | 155 (4.5%) | 214 (6.1%) |
| 65 to 69 Years | 193 (5.6%) | 182 (5.2%) |
| 70 to 74 Years | 130 (3.8%) | 182 (5.2%) |
| 75 to 79 Years | 76 (2.2%) | 67 (1.9%) |
| 80 to 84 Years | 40 (1.2%) | 89 (2.5%) |
| 85 Years and over | 5 (0.2%) | 45 (1.3%) |
| Total | 3,432 (100.0%) | 3,484 (100.0%) |
Families and Households in North Springfield
Median Family Size in North Springfield
The median family size in North Springfield is 3.78 persons per family, with single female/mother families (158 | 10.3%) accounting for the largest median family size of 4 persons per family. On the other hand, single male/father families (218 | 14.2%) represent the smallest median family size with 3.18 persons per family.
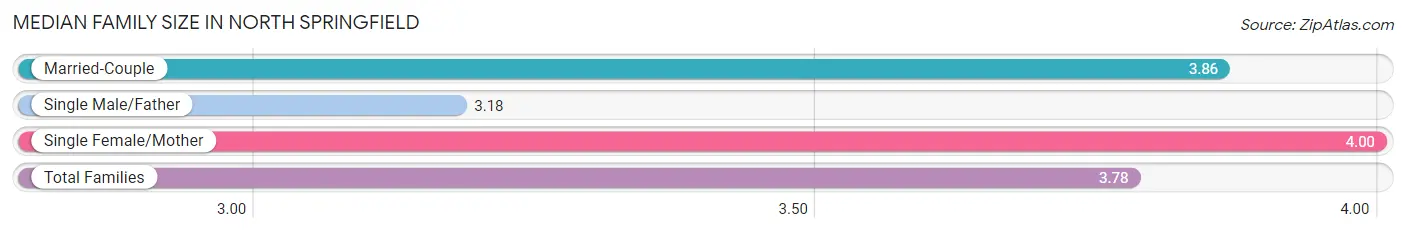
| Family Type | # Families | Family Size |
| Married-Couple | 1,159 (75.5%) | 3.86 |
| Single Male/Father | 218 (14.2%) | 3.18 |
| Single Female/Mother | 158 (10.3%) | 4.00 |
| Total Families | 1,535 (100.0%) | 3.78 |
Median Household Size in North Springfield
The median household size in North Springfield is 3.11 persons per household, with single female/mother households (158 | 7.1%) accounting for the largest median household size of 4.08 persons per household. non-family households (687 | 30.9%) represent the smallest median household size with 1.35 persons per household.
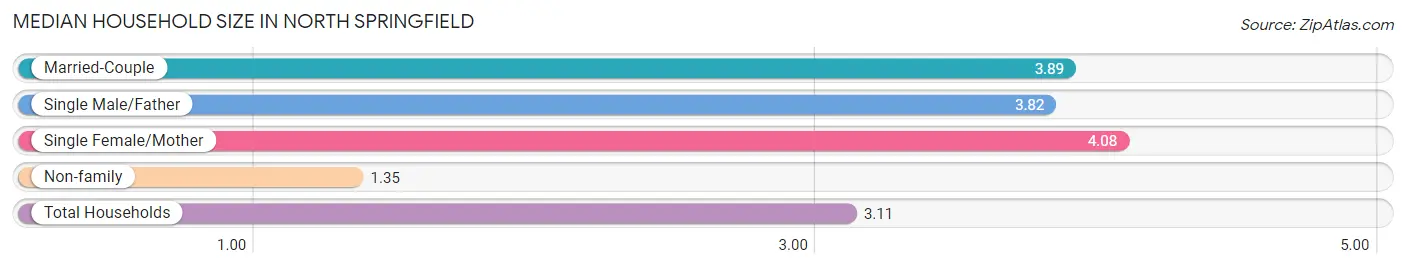
| Household Type | # Households | Household Size |
| Married-Couple | 1,159 (52.2%) | 3.89 |
| Single Male/Father | 218 (9.8%) | 3.82 |
| Single Female/Mother | 158 (7.1%) | 4.08 |
| Non-family | 687 (30.9%) | 1.35 |
| Total Households | 2,222 (100.0%) | 3.11 |
Household Size by Marriage Status in North Springfield
Out of a total of 2,222 households in North Springfield, 1,535 (69.1%) are family households, while 687 (30.9%) are nonfamily households. The most numerous type of family households are 2-person households, comprising 471, and the most common type of nonfamily households are 1-person households, comprising 521.
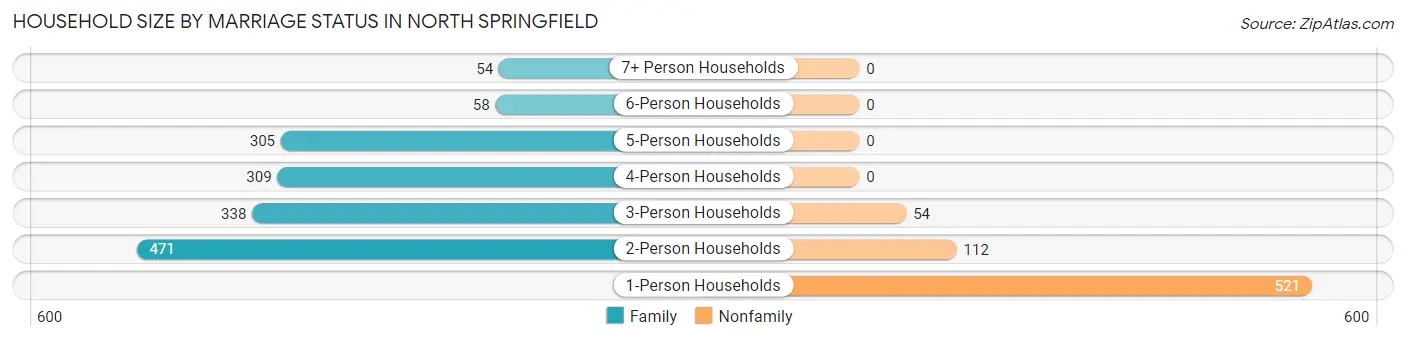
| Household Size | Family Households | Nonfamily Households |
| 1-Person Households | - | 521 (23.4%) |
| 2-Person Households | 471 (21.2%) | 112 (5.0%) |
| 3-Person Households | 338 (15.2%) | 54 (2.4%) |
| 4-Person Households | 309 (13.9%) | 0 (0.0%) |
| 5-Person Households | 305 (13.7%) | 0 (0.0%) |
| 6-Person Households | 58 (2.6%) | 0 (0.0%) |
| 7+ Person Households | 54 (2.4%) | 0 (0.0%) |
| Total | 1,535 (69.1%) | 687 (30.9%) |
Female Fertility in North Springfield
Fertility by Age in North Springfield
Average fertility rate in North Springfield is 54.0 births per 1,000 women. Women in the age bracket of 20 to 34 years have the highest fertility rate with 59.0 births per 1,000 women. Women in the age bracket of 35 to 50 years acount for 51.4% of all women with births.
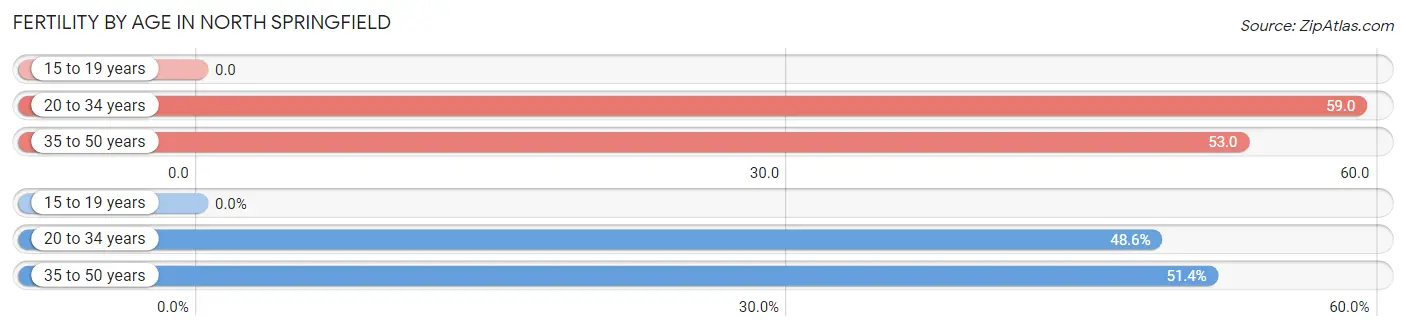
| Age Bracket | Women with Births | Births / 1,000 Women |
| 15 to 19 years | 0 (0.0%) | 0.0 |
| 20 to 34 years | 34 (48.6%) | 59.0 |
| 35 to 50 years | 36 (51.4%) | 53.0 |
| Total | 70 (100.0%) | 54.0 |
Fertility by Age by Marriage Status in North Springfield
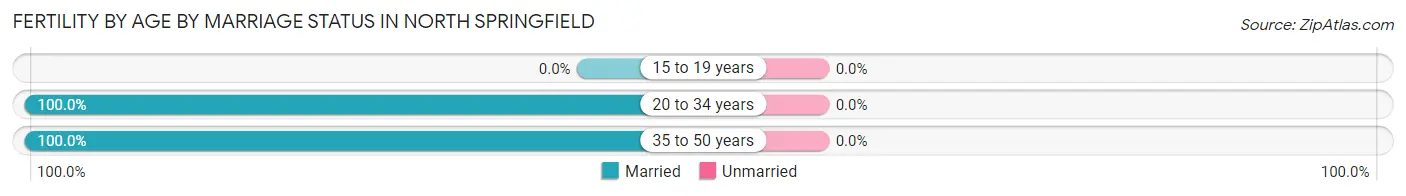
| Age Bracket | Married | Unmarried |
| 15 to 19 years | 0 (0.0%) | 0 (0.0%) |
| 20 to 34 years | 34 (100.0%) | 0 (0.0%) |
| 35 to 50 years | 36 (100.0%) | 0 (0.0%) |
| Total | 70 (100.0%) | 0 (0.0%) |
Fertility by Education in North Springfield
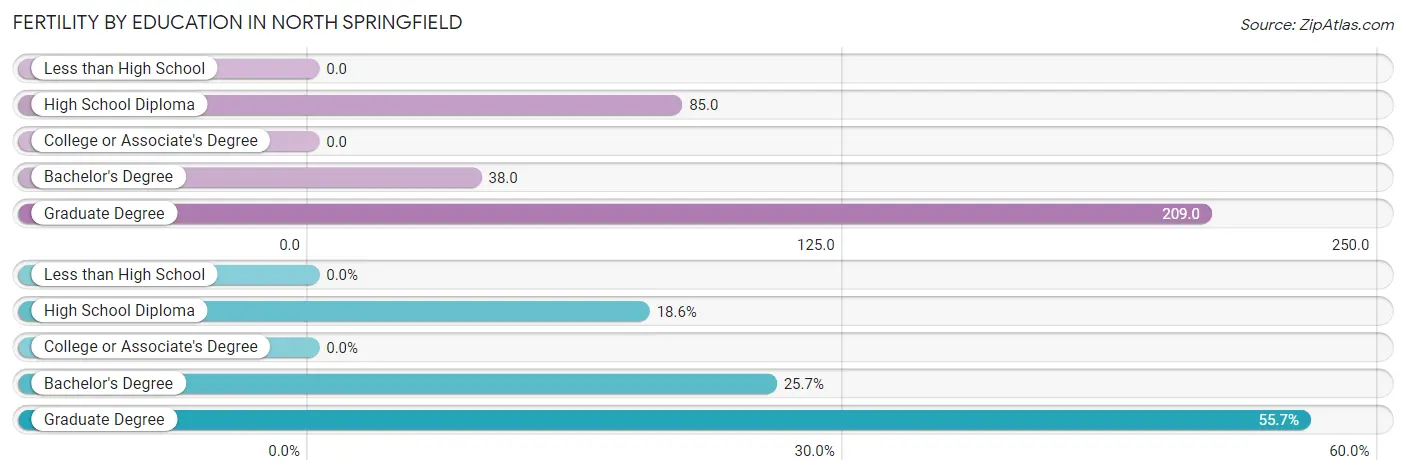
| Educational Attainment | Women with Births | Births / 1,000 Women |
| Less than High School | 0 (0.0%) | 0.0 |
| High School Diploma | 13 (18.6%) | 85.0 |
| College or Associate's Degree | 0 (0.0%) | 0.0 |
| Bachelor's Degree | 18 (25.7%) | 38.0 |
| Graduate Degree | 39 (55.7%) | 209.0 |
| Total | 70 (100.0%) | 54.0 |
Fertility by Education by Marriage Status in North Springfield
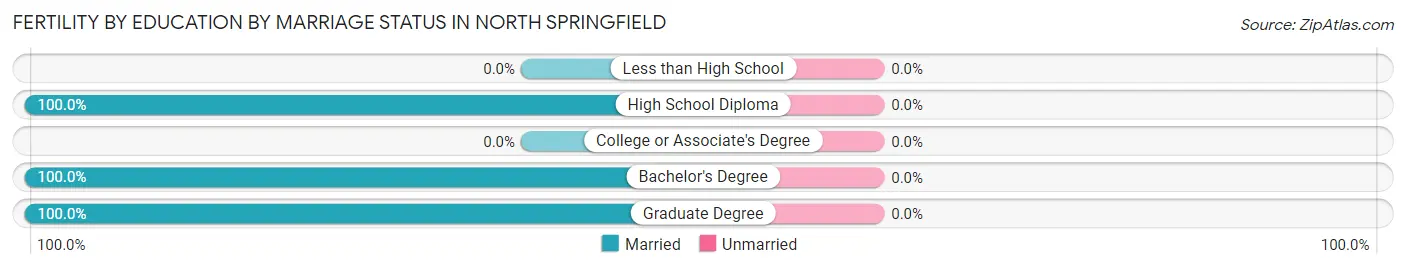
| Educational Attainment | Married | Unmarried |
| Less than High School | 0 (0.0%) | 0 (0.0%) |
| High School Diploma | 13 (100.0%) | 0 (0.0%) |
| College or Associate's Degree | 0 (0.0%) | 0 (0.0%) |
| Bachelor's Degree | 18 (100.0%) | 0 (0.0%) |
| Graduate Degree | 39 (100.0%) | 0 (0.0%) |
| Total | 70 (100.0%) | 0 (0.0%) |
Employment Characteristics in North Springfield
Employment by Class of Employer in North Springfield
Among the 3,535 employed individuals in North Springfield, private company employees (2,294 | 64.9%), self-employed (not incorporated) (340 | 9.6%), and not-for-profit organizations (283 | 8.0%) make up the most common classes of employment.
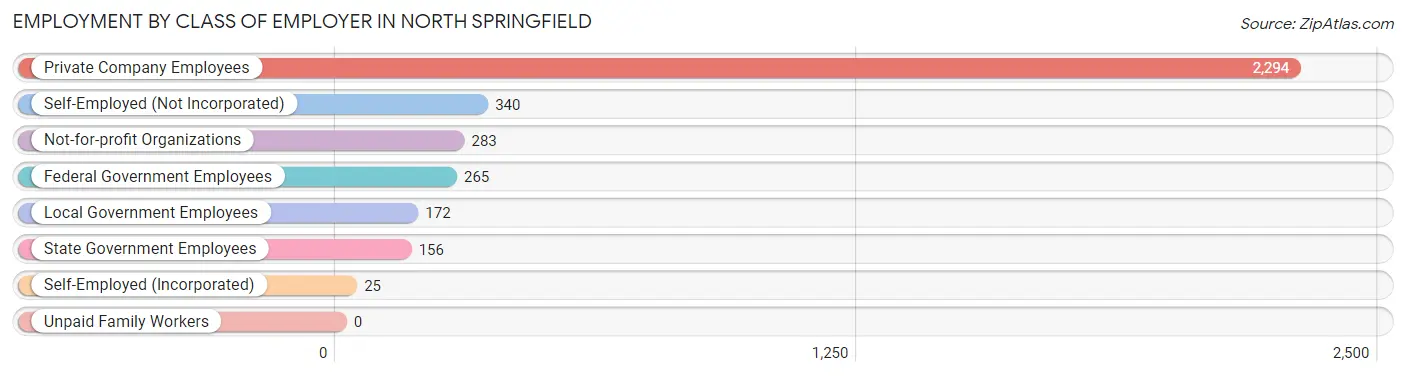
| Employer Class | # Employees | % Employees |
| Private Company Employees | 2,294 | 64.9% |
| Self-Employed (Incorporated) | 25 | 0.7% |
| Self-Employed (Not Incorporated) | 340 | 9.6% |
| Not-for-profit Organizations | 283 | 8.0% |
| Local Government Employees | 172 | 4.9% |
| State Government Employees | 156 | 4.4% |
| Federal Government Employees | 265 | 7.5% |
| Unpaid Family Workers | 0 | 0.0% |
| Total | 3,535 | 100.0% |
Employment Status by Age in North Springfield
According to the labor force statistics for North Springfield, out of the total population over 16 years of age (5,227), 71.6% or 3,743 individuals are in the labor force, with 3.5% or 131 of them unemployed. The age group with the highest labor force participation rate is 20 to 24 years, with 94.7% or 377 individuals in the labor force. Within the labor force, the 25 to 29 years age range has the highest percentage of unemployed individuals, with 16.5% or 56 of them being unemployed.
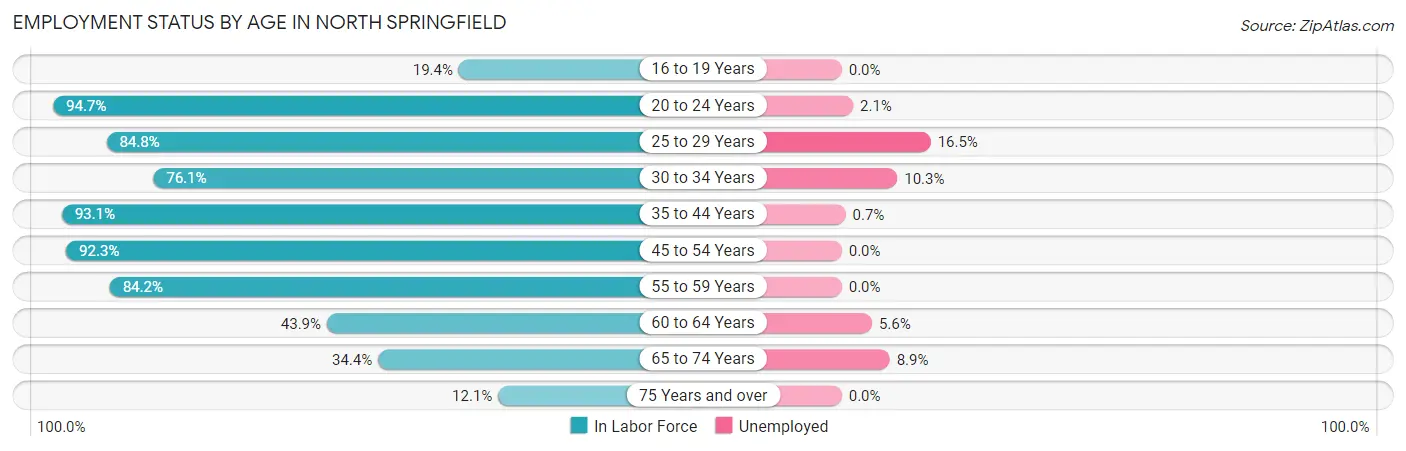
| Age Bracket | In Labor Force | Unemployed |
| 16 to 19 Years | 26 (19.4%) | 0 (0.0%) |
| 20 to 24 Years | 377 (94.7%) | 8 (2.1%) |
| 25 to 29 Years | 340 (84.8%) | 56 (16.5%) |
| 30 to 34 Years | 325 (76.1%) | 33 (10.3%) |
| 35 to 44 Years | 847 (93.1%) | 6 (0.7%) |
| 45 to 54 Years | 704 (92.3%) | 0 (0.0%) |
| 55 to 59 Years | 687 (84.2%) | 0 (0.0%) |
| 60 to 64 Years | 162 (43.9%) | 9 (5.6%) |
| 65 to 74 Years | 236 (34.4%) | 21 (8.9%) |
| 75 Years and over | 39 (12.1%) | 0 (0.0%) |
| Total | 3,743 (71.6%) | 131 (3.5%) |
Employment Status by Educational Attainment in North Springfield
According to labor force statistics for North Springfield, 83.2% of individuals (3,067) out of the total population between 25 and 64 years of age (3,686) are in the labor force, with 3.3% or 101 of them being unemployed. The group with the highest labor force participation rate are those with the educational attainment of college / associate degree, with 96.3% or 752 individuals in the labor force. Within the labor force, individuals with college / associate degree education have the highest percentage of unemployment, with 9.0% or 68 of them being unemployed.
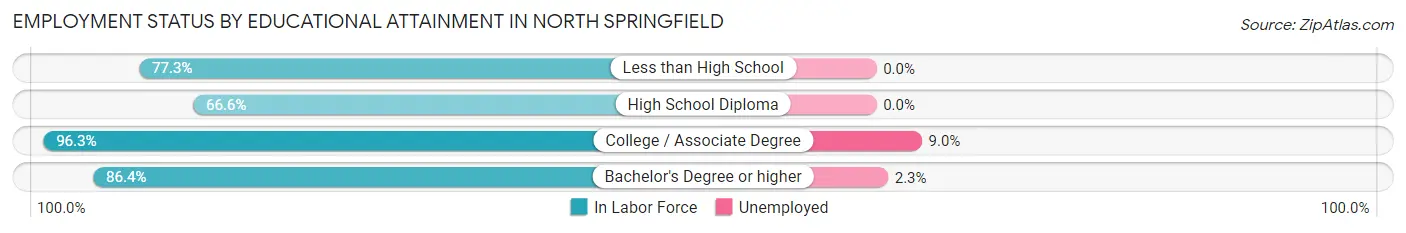
| Educational Attainment | In Labor Force | Unemployed |
| Less than High School | 413 (77.3%) | 0 (0.0%) |
| High School Diploma | 501 (66.6%) | 0 (0.0%) |
| College / Associate Degree | 752 (96.3%) | 70 (9.0%) |
| Bachelor's Degree or higher | 1,399 (86.4%) | 37 (2.3%) |
| Total | 3,067 (83.2%) | 122 (3.3%) |
Employment Occupations by Sex in North Springfield
Management, Business, Science and Arts Occupations
The most common Management, Business, Science and Arts occupations in North Springfield are Computers, Engineering & Science (454 | 12.8%), Community & Social Service (396 | 11.2%), Computers & Mathematics (312 | 8.8%), Management (305 | 8.6%), and Business & Financial (251 | 7.1%).
Management, Business, Science and Arts Occupations by Sex
Within the Management, Business, Science and Arts occupations in North Springfield, the most male-oriented occupations are Architecture & Engineering (100.0%), Computers, Engineering & Science (93.4%), and Computers & Mathematics (91.7%), while the most female-oriented occupations are Education, Arts & Media (100.0%), Health Technologists (100.0%), and Legal Services & Support (96.6%).
| Occupation | Male | Female |
| Management | 168 (55.1%) | 137 (44.9%) |
| Business & Financial | 145 (57.8%) | 106 (42.2%) |
| Computers, Engineering & Science | 424 (93.4%) | 30 (6.6%) |
| Computers & Mathematics | 286 (91.7%) | 26 (8.3%) |
| Architecture & Engineering | 133 (100.0%) | 0 (0.0%) |
| Life, Physical & Social Science | 5 (55.6%) | 4 (44.4%) |
| Community & Social Service | 139 (35.1%) | 257 (64.9%) |
| Education, Arts & Media | 0 (0.0%) | 40 (100.0%) |
| Legal Services & Support | 1 (3.5%) | 28 (96.6%) |
| Education Instruction & Library | 103 (41.4%) | 146 (58.6%) |
| Arts, Media & Entertainment | 35 (44.9%) | 43 (55.1%) |
| Health Diagnosing & Treating | 65 (43.0%) | 86 (57.0%) |
| Health Technologists | 0 (0.0%) | 50 (100.0%) |
| Total (Category) | 941 (60.4%) | 616 (39.6%) |
| Total (Overall) | 1,943 (54.9%) | 1,598 (45.1%) |
Services Occupations
The most common Services occupations in North Springfield are Personal Care & Service (311 | 8.8%), Healthcare Support (170 | 4.8%), Food Preparation & Serving (162 | 4.6%), Cleaning & Maintenance (99 | 2.8%), and Security & Protection (16 | 0.4%).
Services Occupations by Sex
Within the Services occupations in North Springfield, the most male-oriented occupations are Food Preparation & Serving (52.5%), Security & Protection (50.0%), and Firefighting & Prevention (50.0%), while the most female-oriented occupations are Healthcare Support (87.1%), Personal Care & Service (82.3%), and Cleaning & Maintenance (65.7%).
| Occupation | Male | Female |
| Healthcare Support | 22 (12.9%) | 148 (87.1%) |
| Security & Protection | 8 (50.0%) | 8 (50.0%) |
| Firefighting & Prevention | 8 (50.0%) | 8 (50.0%) |
| Law Enforcement | 0 (0.0%) | 0 (0.0%) |
| Food Preparation & Serving | 85 (52.5%) | 77 (47.5%) |
| Cleaning & Maintenance | 34 (34.3%) | 65 (65.7%) |
| Personal Care & Service | 55 (17.7%) | 256 (82.3%) |
| Total (Category) | 204 (26.9%) | 554 (73.1%) |
| Total (Overall) | 1,943 (54.9%) | 1,598 (45.1%) |
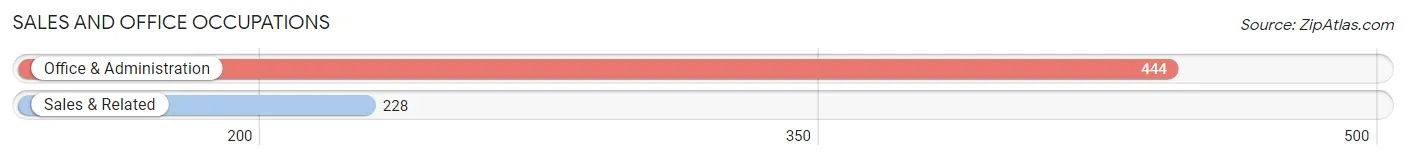
Sales and Office Occupations
The most common Sales and Office occupations in North Springfield are Office & Administration (444 | 12.5%), and Sales & Related (228 | 6.4%).
Sales and Office Occupations by Sex
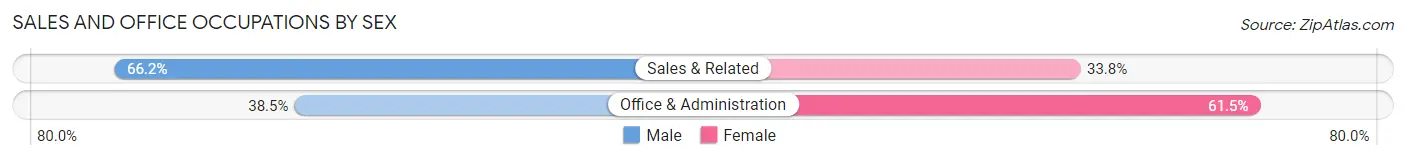
| Occupation | Male | Female |
| Sales & Related | 151 (66.2%) | 77 (33.8%) |
| Office & Administration | 171 (38.5%) | 273 (61.5%) |
| Total (Category) | 322 (47.9%) | 350 (52.1%) |
| Total (Overall) | 1,943 (54.9%) | 1,598 (45.1%) |
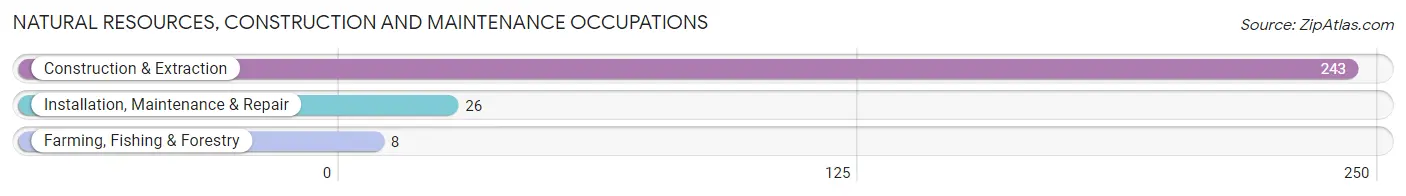
Natural Resources, Construction and Maintenance Occupations
The most common Natural Resources, Construction and Maintenance occupations in North Springfield are Construction & Extraction (243 | 6.9%), Installation, Maintenance & Repair (26 | 0.7%), and Farming, Fishing & Forestry (8 | 0.2%).
Natural Resources, Construction and Maintenance Occupations by Sex
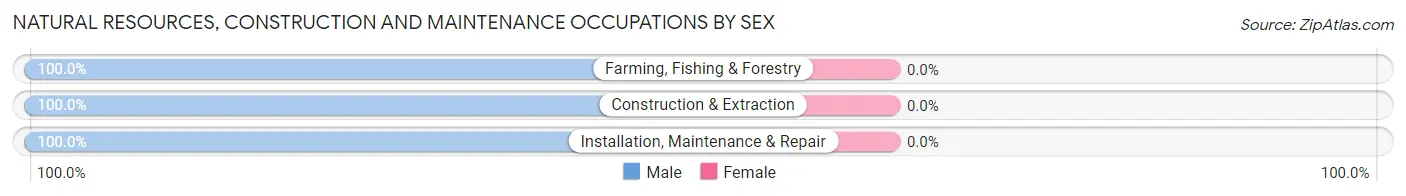
| Occupation | Male | Female |
| Farming, Fishing & Forestry | 8 (100.0%) | 0 (0.0%) |
| Construction & Extraction | 243 (100.0%) | 0 (0.0%) |
| Installation, Maintenance & Repair | 26 (100.0%) | 0 (0.0%) |
| Total (Category) | 277 (100.0%) | 0 (0.0%) |
| Total (Overall) | 1,943 (54.9%) | 1,598 (45.1%) |
Production, Transportation and Moving Occupations
The most common Production, Transportation and Moving occupations in North Springfield are Production (177 | 5.0%), Transportation (91 | 2.6%), and Material Moving (9 | 0.3%).
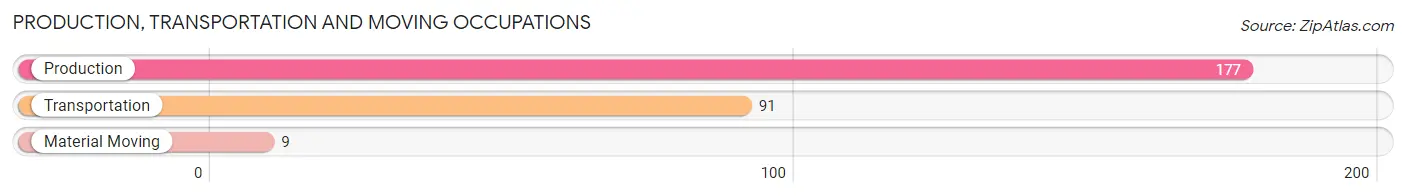
Production, Transportation and Moving Occupations by Sex
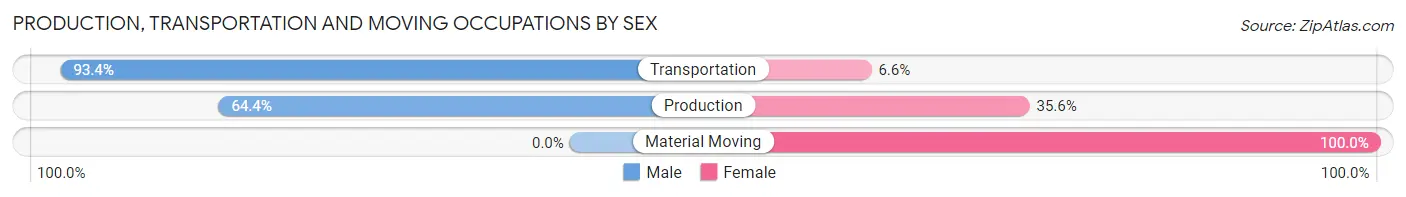
| Occupation | Male | Female |
| Production | 114 (64.4%) | 63 (35.6%) |
| Transportation | 85 (93.4%) | 6 (6.6%) |
| Material Moving | 0 (0.0%) | 9 (100.0%) |
| Total (Category) | 199 (71.8%) | 78 (28.2%) |
| Total (Overall) | 1,943 (54.9%) | 1,598 (45.1%) |
Employment Industries by Sex in North Springfield
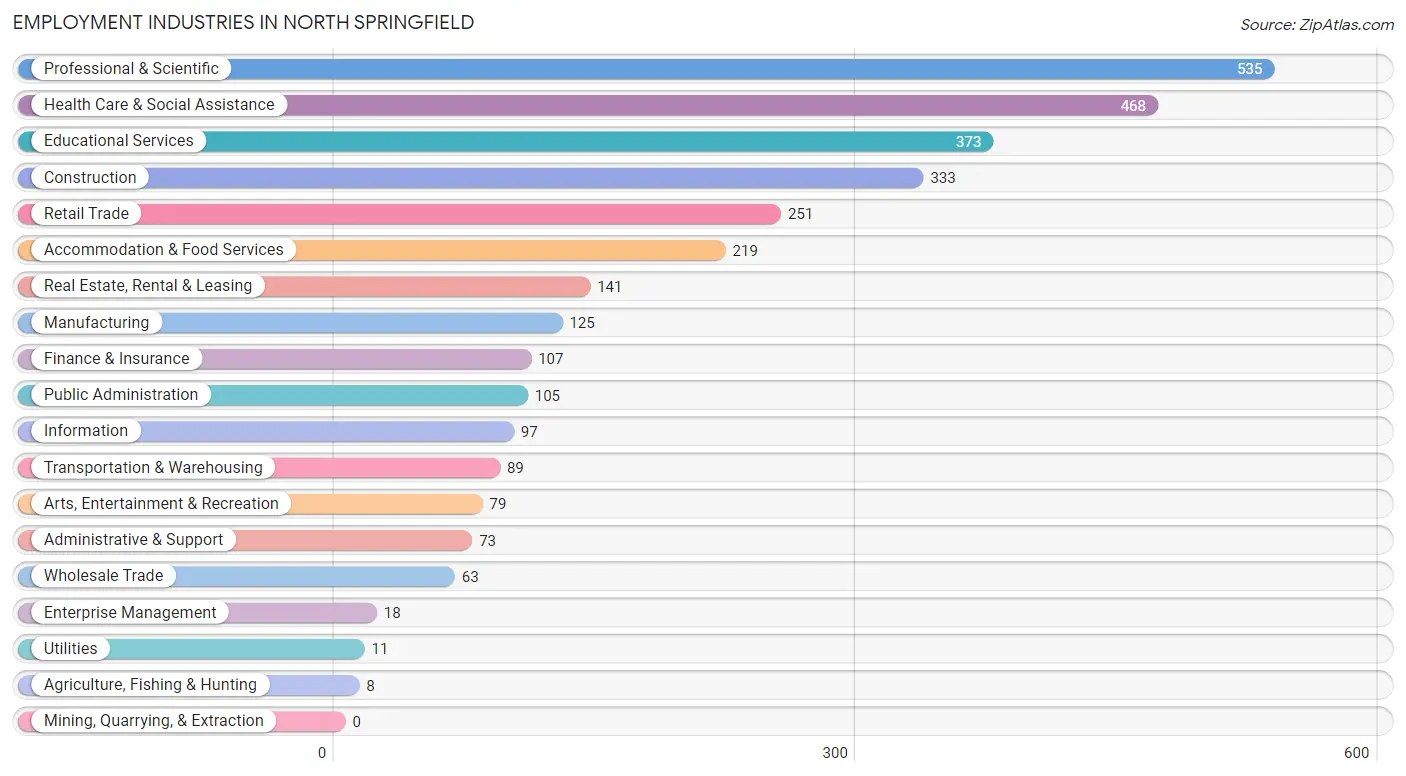
Employment Industries in North Springfield
The major employment industries in North Springfield include Professional & Scientific (535 | 15.1%), Health Care & Social Assistance (468 | 13.2%), Educational Services (373 | 10.5%), Construction (333 | 9.4%), and Retail Trade (251 | 7.1%).
Employment Industries by Sex in North Springfield
The North Springfield industries that see more men than women are Agriculture, Fishing & Hunting (100.0%), Construction (100.0%), and Manufacturing (100.0%), whereas the industries that tend to have a higher number of women are Administrative & Support (76.7%), Health Care & Social Assistance (75.4%), and Accommodation & Food Services (70.8%).
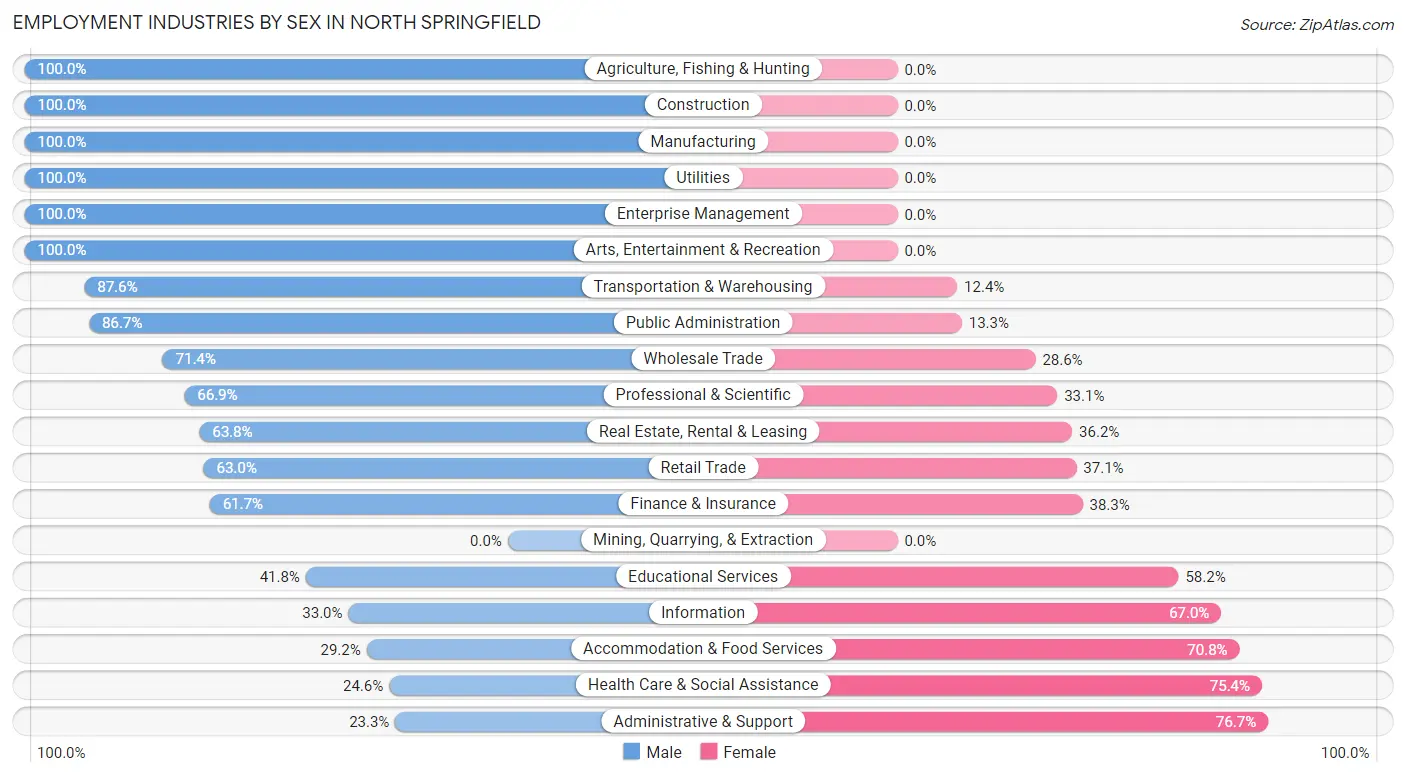
| Industry | Male | Female |
| Agriculture, Fishing & Hunting | 8 (100.0%) | 0 (0.0%) |
| Mining, Quarrying, & Extraction | 0 (0.0%) | 0 (0.0%) |
| Construction | 333 (100.0%) | 0 (0.0%) |
| Manufacturing | 125 (100.0%) | 0 (0.0%) |
| Wholesale Trade | 45 (71.4%) | 18 (28.6%) |
| Retail Trade | 158 (62.9%) | 93 (37.0%) |
| Transportation & Warehousing | 78 (87.6%) | 11 (12.4%) |
| Utilities | 11 (100.0%) | 0 (0.0%) |
| Information | 32 (33.0%) | 65 (67.0%) |
| Finance & Insurance | 66 (61.7%) | 41 (38.3%) |
| Real Estate, Rental & Leasing | 90 (63.8%) | 51 (36.2%) |
| Professional & Scientific | 358 (66.9%) | 177 (33.1%) |
| Enterprise Management | 18 (100.0%) | 0 (0.0%) |
| Administrative & Support | 17 (23.3%) | 56 (76.7%) |
| Educational Services | 156 (41.8%) | 217 (58.2%) |
| Health Care & Social Assistance | 115 (24.6%) | 353 (75.4%) |
| Arts, Entertainment & Recreation | 79 (100.0%) | 0 (0.0%) |
| Accommodation & Food Services | 64 (29.2%) | 155 (70.8%) |
| Public Administration | 91 (86.7%) | 14 (13.3%) |
| Total | 1,943 (54.9%) | 1,598 (45.1%) |
Education in North Springfield
School Enrollment in North Springfield
The most common levels of schooling among the 1,396 students in North Springfield are elementary school (485 | 34.7%), college / undergraduate (333 | 23.8%), and middle school (201 | 14.4%).
| School Level | # Students | % Students |
| Nursery / Preschool | 67 | 4.8% |
| Kindergarten | 105 | 7.5% |
| Elementary School | 485 | 34.7% |
| Middle School | 201 | 14.4% |
| High School | 187 | 13.4% |
| College / Undergraduate | 333 | 23.8% |
| Graduate / Professional | 18 | 1.3% |
| Total | 1,396 | 100.0% |
School Enrollment by Age by Funding Source in North Springfield
Out of a total of 1,396 students who are enrolled in schools in North Springfield, 155 (11.1%) attend a private institution, while the remaining 1,241 (88.9%) are enrolled in public schools. The age group of 18 to 19 year olds has the highest likelihood of being enrolled in private schools, with 25 (80.6% in the age bracket) enrolled. Conversely, the age group of 15 to 17 year olds has the lowest likelihood of being enrolled in a private school, with 115 (100.0% in the age bracket) attending a public institution.
| Age Bracket | Public School | Private School |
| 3 to 4 Year Olds | 48 (71.6%) | 19 (28.4%) |
| 5 to 9 Year Old | 519 (96.8%) | 17 (3.2%) |
| 10 to 14 Year Olds | 306 (95.3%) | 15 (4.7%) |
| 15 to 17 Year Olds | 115 (100.0%) | 0 (0.0%) |
| 18 to 19 Year Olds | 6 (19.4%) | 25 (80.6%) |
| 20 to 24 Year Olds | 150 (100.0%) | 0 (0.0%) |
| 25 to 34 Year Olds | 69 (52.3%) | 63 (47.7%) |
| 35 Years and over | 28 (63.6%) | 16 (36.4%) |
| Total | 1,241 (88.9%) | 155 (11.1%) |
Educational Attainment by Field of Study in North Springfield
Education (316 | 13.5%), business (285 | 12.1%), science & technology (249 | 10.6%), engineering (216 | 9.2%), and computers & mathematics (212 | 9.0%) are the most common fields of study among 2,345 individuals in North Springfield who have obtained a bachelor's degree or higher.
| Field of Study | # Graduates | % Graduates |
| Computers & Mathematics | 212 | 9.0% |
| Bio, Nature & Agricultural | 109 | 4.6% |
| Physical & Health Sciences | 146 | 6.2% |
| Psychology | 121 | 5.2% |
| Social Sciences | 198 | 8.4% |
| Engineering | 216 | 9.2% |
| Multidisciplinary Studies | 28 | 1.2% |
| Science & Technology | 249 | 10.6% |
| Business | 285 | 12.1% |
| Education | 316 | 13.5% |
| Literature & Languages | 75 | 3.2% |
| Liberal Arts & History | 102 | 4.3% |
| Visual & Performing Arts | 122 | 5.2% |
| Communications | 75 | 3.2% |
| Arts & Humanities | 91 | 3.9% |
| Total | 2,345 | 100.0% |
Transportation & Commute in North Springfield
Vehicle Availability by Sex in North Springfield
The most prevalent vehicle ownership categories in North Springfield are males with 2 vehicles (599, accounting for 30.2%) and females with 2 vehicles (481, making up 38.5%).
| Vehicles Available | Male | Female |
| No Vehicle | 23 (1.2%) | 28 (1.8%) |
| 1 Vehicle | 264 (13.3%) | 170 (10.9%) |
| 2 Vehicles | 599 (30.2%) | 481 (30.9%) |
| 3 Vehicles | 548 (27.7%) | 453 (29.1%) |
| 4 Vehicles | 371 (18.7%) | 359 (23.1%) |
| 5 or more Vehicles | 175 (8.8%) | 64 (4.1%) |
| Total | 1,980 (100.0%) | 1,555 (100.0%) |
Commute Time in North Springfield
The most frequently occuring commute durations in North Springfield are 20 to 24 minutes (863 commuters, 27.8%), 30 to 34 minutes (522 commuters, 16.8%), and 45 to 59 minutes (414 commuters, 13.3%).
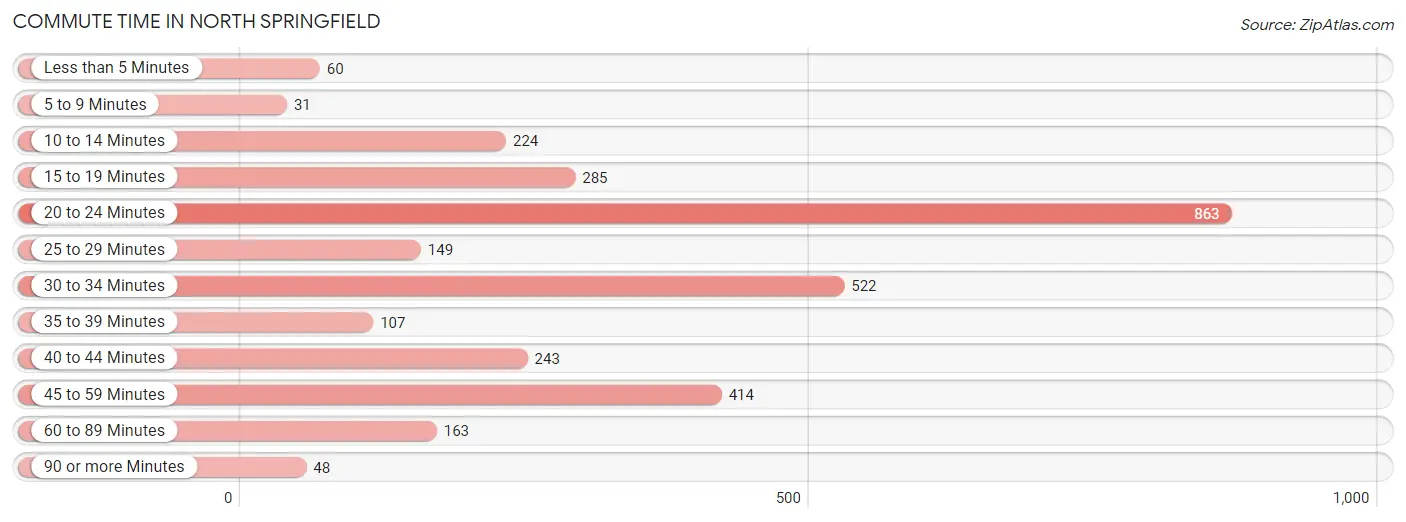
| Commute Time | # Commuters | % Commuters |
| Less than 5 Minutes | 60 | 1.9% |
| 5 to 9 Minutes | 31 | 1.0% |
| 10 to 14 Minutes | 224 | 7.2% |
| 15 to 19 Minutes | 285 | 9.2% |
| 20 to 24 Minutes | 863 | 27.8% |
| 25 to 29 Minutes | 149 | 4.8% |
| 30 to 34 Minutes | 522 | 16.8% |
| 35 to 39 Minutes | 107 | 3.4% |
| 40 to 44 Minutes | 243 | 7.8% |
| 45 to 59 Minutes | 414 | 13.3% |
| 60 to 89 Minutes | 163 | 5.2% |
| 90 or more Minutes | 48 | 1.5% |
Commute Time by Sex in North Springfield
The most common commute times in North Springfield are 20 to 24 minutes (449 commuters, 25.9%) for males and 20 to 24 minutes (414 commuters, 30.1%) for females.
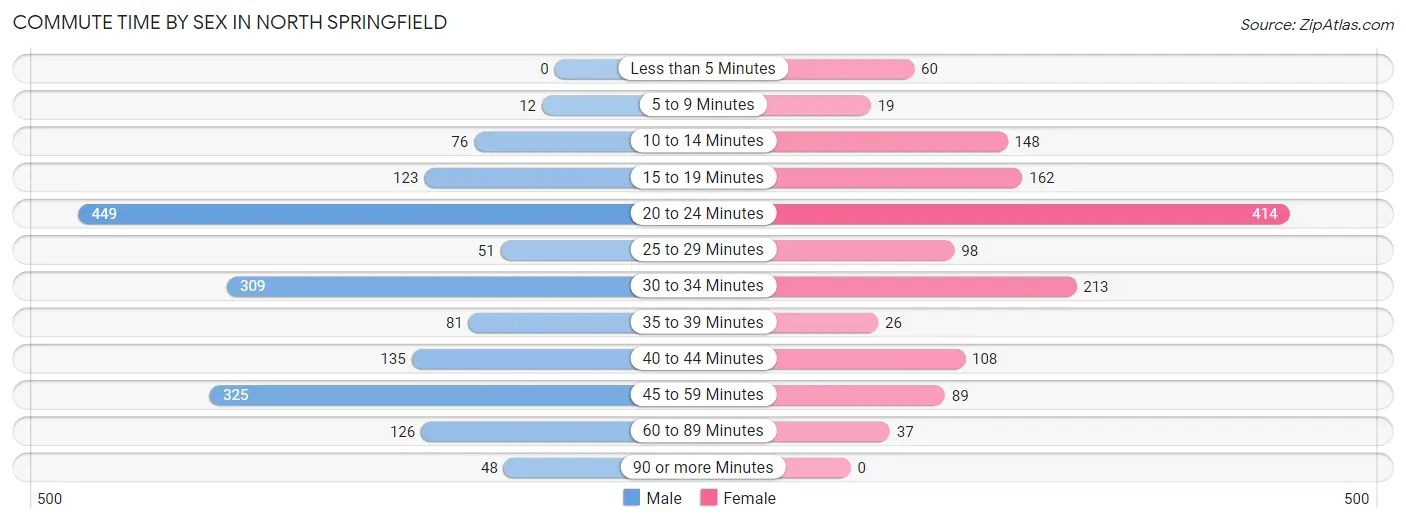
| Commute Time | Male | Female |
| Less than 5 Minutes | 0 (0.0%) | 60 (4.4%) |
| 5 to 9 Minutes | 12 (0.7%) | 19 (1.4%) |
| 10 to 14 Minutes | 76 (4.4%) | 148 (10.8%) |
| 15 to 19 Minutes | 123 (7.1%) | 162 (11.8%) |
| 20 to 24 Minutes | 449 (25.9%) | 414 (30.1%) |
| 25 to 29 Minutes | 51 (2.9%) | 98 (7.1%) |
| 30 to 34 Minutes | 309 (17.8%) | 213 (15.5%) |
| 35 to 39 Minutes | 81 (4.7%) | 26 (1.9%) |
| 40 to 44 Minutes | 135 (7.8%) | 108 (7.9%) |
| 45 to 59 Minutes | 325 (18.7%) | 89 (6.5%) |
| 60 to 89 Minutes | 126 (7.3%) | 37 (2.7%) |
| 90 or more Minutes | 48 (2.8%) | 0 (0.0%) |
Time of Departure to Work by Sex in North Springfield
The most frequent times of departure to work in North Springfield are 7:30 AM to 7:59 AM (337, 19.4%) for males and 8:30 AM to 8:59 AM (256, 18.6%) for females.
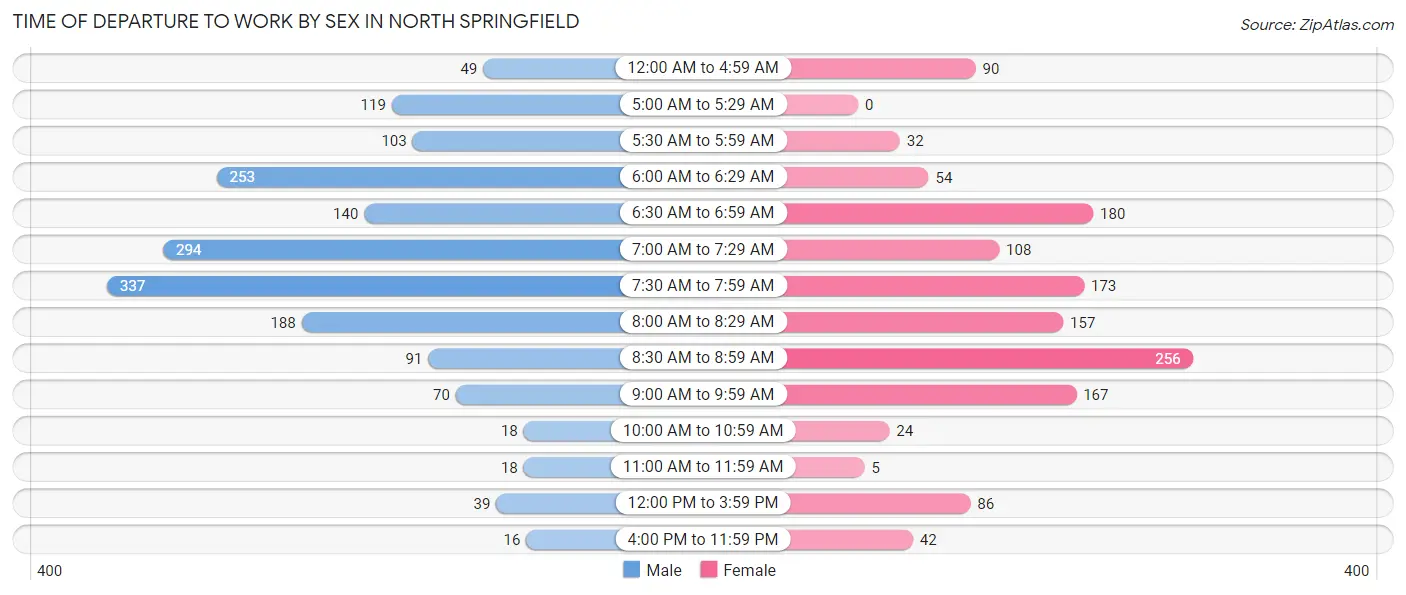
| Time of Departure | Male | Female |
| 12:00 AM to 4:59 AM | 49 (2.8%) | 90 (6.6%) |
| 5:00 AM to 5:29 AM | 119 (6.9%) | 0 (0.0%) |
| 5:30 AM to 5:59 AM | 103 (5.9%) | 32 (2.3%) |
| 6:00 AM to 6:29 AM | 253 (14.6%) | 54 (3.9%) |
| 6:30 AM to 6:59 AM | 140 (8.1%) | 180 (13.1%) |
| 7:00 AM to 7:29 AM | 294 (17.0%) | 108 (7.9%) |
| 7:30 AM to 7:59 AM | 337 (19.4%) | 173 (12.6%) |
| 8:00 AM to 8:29 AM | 188 (10.8%) | 157 (11.4%) |
| 8:30 AM to 8:59 AM | 91 (5.2%) | 256 (18.6%) |
| 9:00 AM to 9:59 AM | 70 (4.0%) | 167 (12.1%) |
| 10:00 AM to 10:59 AM | 18 (1.0%) | 24 (1.8%) |
| 11:00 AM to 11:59 AM | 18 (1.0%) | 5 (0.4%) |
| 12:00 PM to 3:59 PM | 39 (2.2%) | 86 (6.3%) |
| 4:00 PM to 11:59 PM | 16 (0.9%) | 42 (3.1%) |
| Total | 1,735 (100.0%) | 1,374 (100.0%) |
Housing Occupancy in North Springfield
Occupancy by Ownership in North Springfield
Of the total 2,222 dwellings in North Springfield, owner-occupied units account for 1,795 (80.8%), while renter-occupied units make up 427 (19.2%).
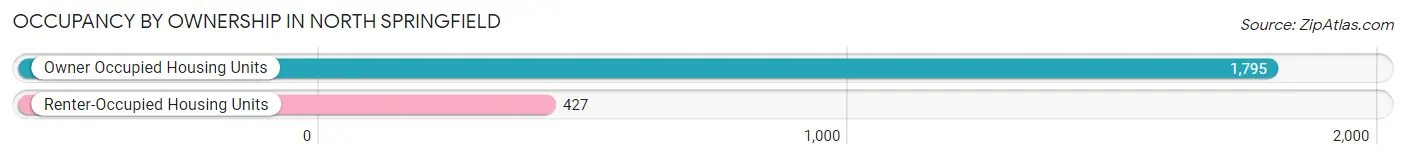
| Occupancy | # Housing Units | % Housing Units |
| Owner Occupied Housing Units | 1,795 | 80.8% |
| Renter-Occupied Housing Units | 427 | 19.2% |
| Total Occupied Housing Units | 2,222 | 100.0% |
Occupancy by Household Size in North Springfield
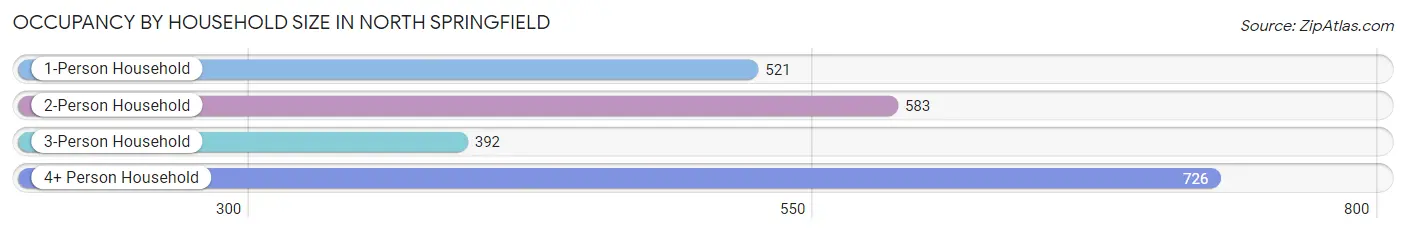
| Household Size | # Housing Units | % Housing Units |
| 1-Person Household | 521 | 23.4% |
| 2-Person Household | 583 | 26.2% |
| 3-Person Household | 392 | 17.6% |
| 4+ Person Household | 726 | 32.7% |
| Total Housing Units | 2,222 | 100.0% |
Occupancy by Ownership by Household Size in North Springfield
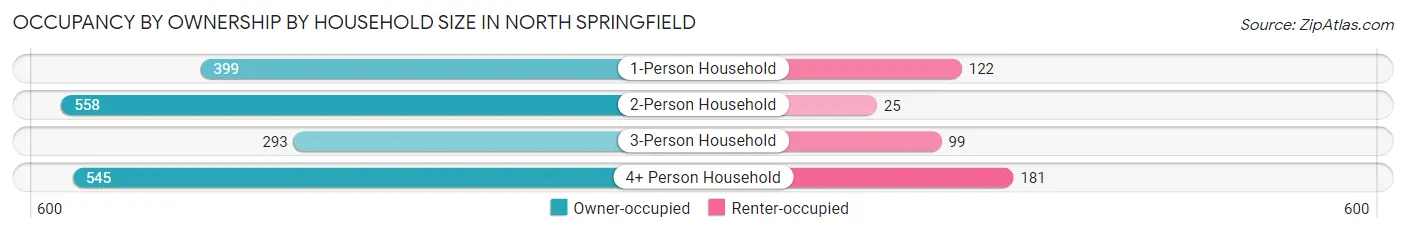
| Household Size | Owner-occupied | Renter-occupied |
| 1-Person Household | 399 (76.6%) | 122 (23.4%) |
| 2-Person Household | 558 (95.7%) | 25 (4.3%) |
| 3-Person Household | 293 (74.7%) | 99 (25.3%) |
| 4+ Person Household | 545 (75.1%) | 181 (24.9%) |
| Total Housing Units | 1,795 (80.8%) | 427 (19.2%) |
Occupancy by Educational Attainment in North Springfield
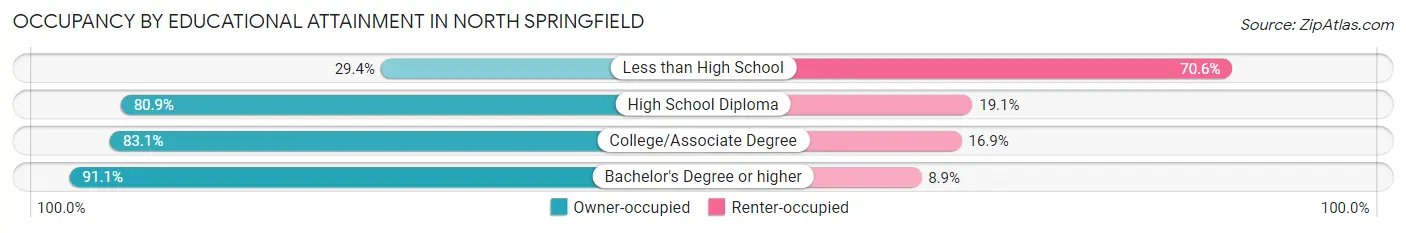
| Household Size | Owner-occupied | Renter-occupied |
| Less than High School | 72 (29.4%) | 173 (70.6%) |
| High School Diploma | 259 (80.9%) | 61 (19.1%) |
| College/Associate Degree | 466 (83.1%) | 95 (16.9%) |
| Bachelor's Degree or higher | 998 (91.1%) | 98 (8.9%) |
Occupancy by Age of Householder in North Springfield
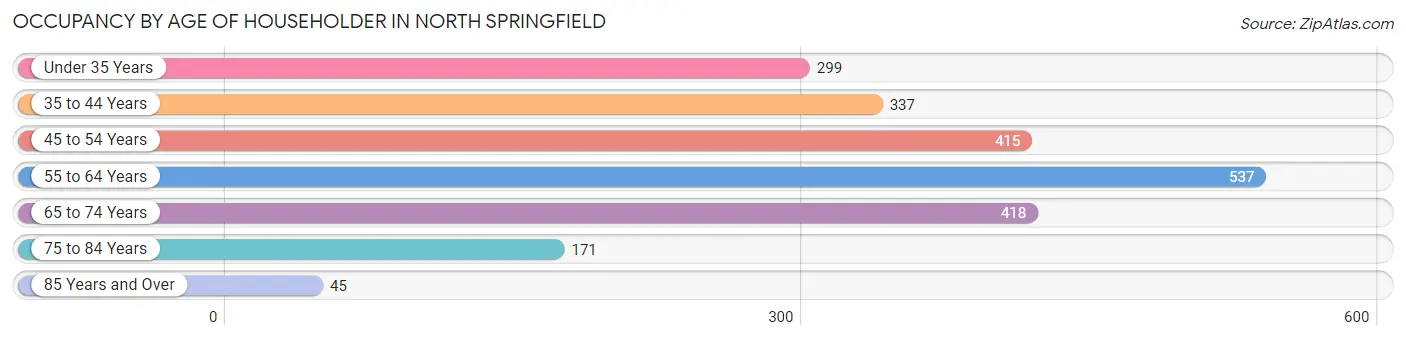
| Age Bracket | # Households | % Households |
| Under 35 Years | 299 | 13.5% |
| 35 to 44 Years | 337 | 15.2% |
| 45 to 54 Years | 415 | 18.7% |
| 55 to 64 Years | 537 | 24.2% |
| 65 to 74 Years | 418 | 18.8% |
| 75 to 84 Years | 171 | 7.7% |
| 85 Years and Over | 45 | 2.0% |
| Total | 2,222 | 100.0% |
Housing Finances in North Springfield
Median Income by Occupancy in North Springfield
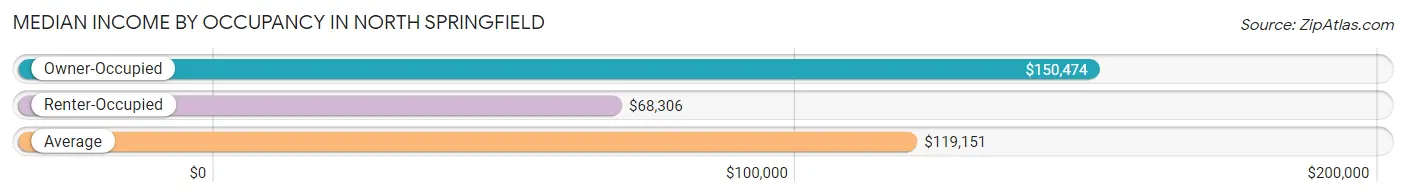
| Occupancy Type | # Households | Median Income |
| Owner-Occupied | 1,795 (80.8%) | $150,474 |
| Renter-Occupied | 427 (19.2%) | $68,306 |
| Average | 2,222 (100.0%) | $119,151 |
Occupancy by Householder Income Bracket in North Springfield
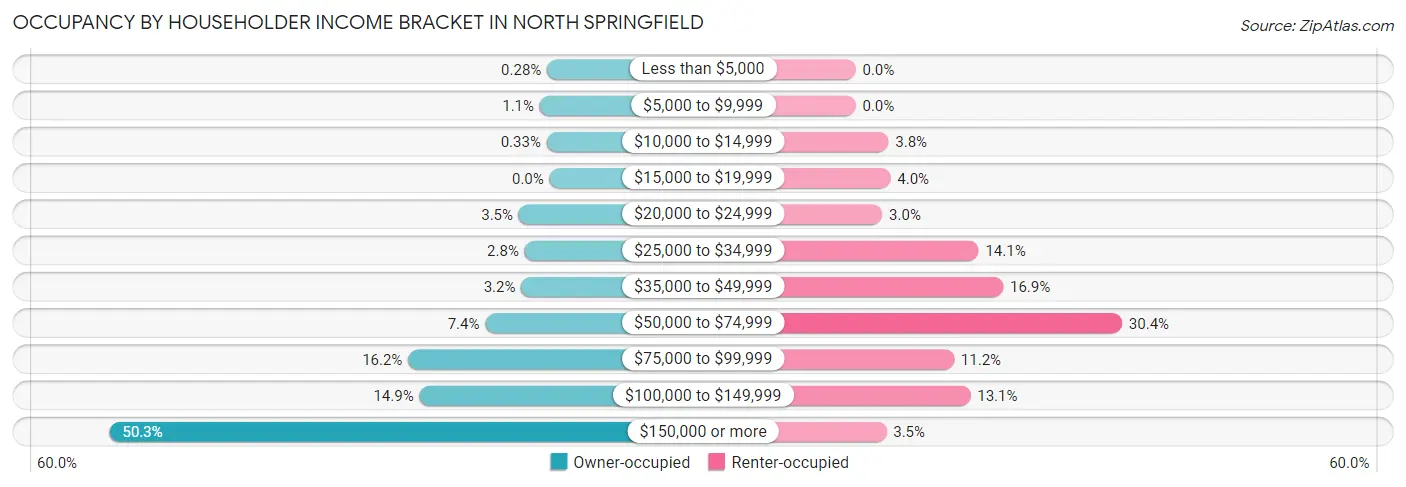
| Income Bracket | Owner-occupied | Renter-occupied |
| Less than $5,000 | 5 (0.3%) | 0 (0.0%) |
| $5,000 to $9,999 | 20 (1.1%) | 0 (0.0%) |
| $10,000 to $14,999 | 6 (0.3%) | 16 (3.7%) |
| $15,000 to $19,999 | 0 (0.0%) | 17 (4.0%) |
| $20,000 to $24,999 | 63 (3.5%) | 13 (3.0%) |
| $25,000 to $34,999 | 51 (2.8%) | 60 (14.1%) |
| $35,000 to $49,999 | 58 (3.2%) | 72 (16.9%) |
| $50,000 to $74,999 | 132 (7.3%) | 130 (30.4%) |
| $75,000 to $99,999 | 290 (16.2%) | 48 (11.2%) |
| $100,000 to $149,999 | 267 (14.9%) | 56 (13.1%) |
| $150,000 or more | 903 (50.3%) | 15 (3.5%) |
| Total | 1,795 (100.0%) | 427 (100.0%) |
Monthly Housing Cost Tiers in North Springfield
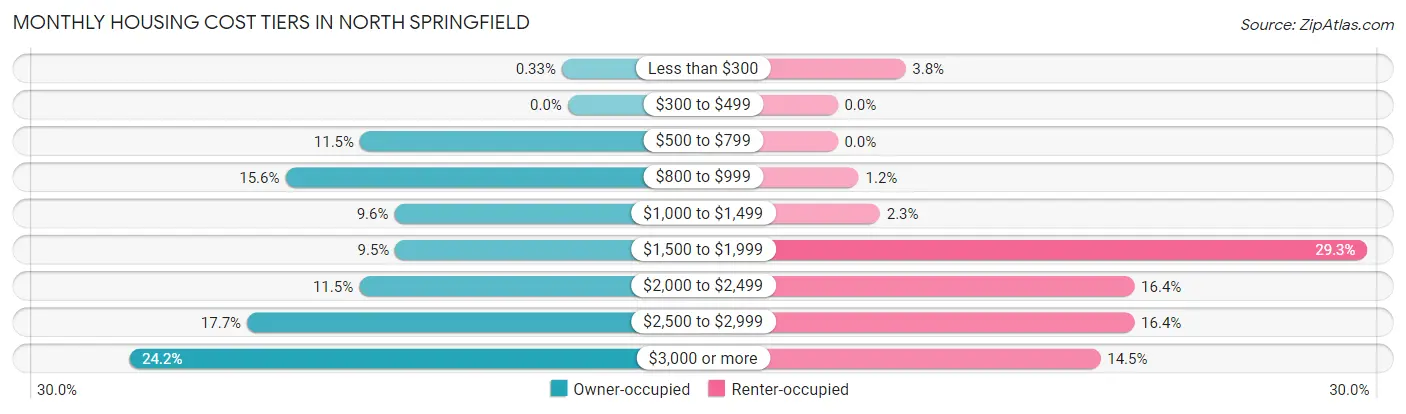
| Monthly Cost | Owner-occupied | Renter-occupied |
| Less than $300 | 6 (0.3%) | 16 (3.7%) |
| $300 to $499 | 0 (0.0%) | 0 (0.0%) |
| $500 to $799 | 206 (11.5%) | 0 (0.0%) |
| $800 to $999 | 280 (15.6%) | 5 (1.2%) |
| $1,000 to $1,499 | 172 (9.6%) | 10 (2.3%) |
| $1,500 to $1,999 | 171 (9.5%) | 125 (29.3%) |
| $2,000 to $2,499 | 207 (11.5%) | 70 (16.4%) |
| $2,500 to $2,999 | 318 (17.7%) | 70 (16.4%) |
| $3,000 or more | 435 (24.2%) | 62 (14.5%) |
| Total | 1,795 (100.0%) | 427 (100.0%) |
Physical Housing Characteristics in North Springfield
Housing Structures in North Springfield
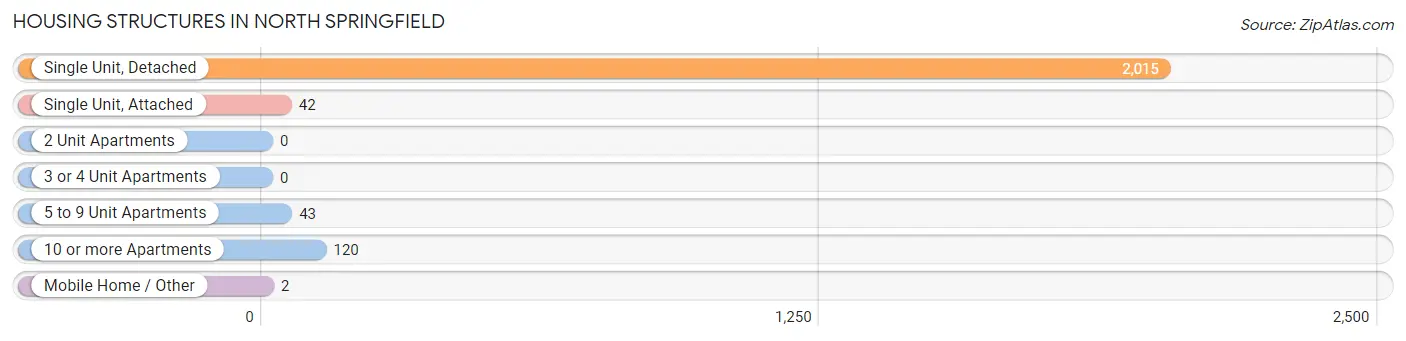
| Structure Type | # Housing Units | % Housing Units |
| Single Unit, Detached | 2,015 | 90.7% |
| Single Unit, Attached | 42 | 1.9% |
| 2 Unit Apartments | 0 | 0.0% |
| 3 or 4 Unit Apartments | 0 | 0.0% |
| 5 to 9 Unit Apartments | 43 | 1.9% |
| 10 or more Apartments | 120 | 5.4% |
| Mobile Home / Other | 2 | 0.1% |
| Total | 2,222 | 100.0% |
Housing Structures by Occupancy in North Springfield
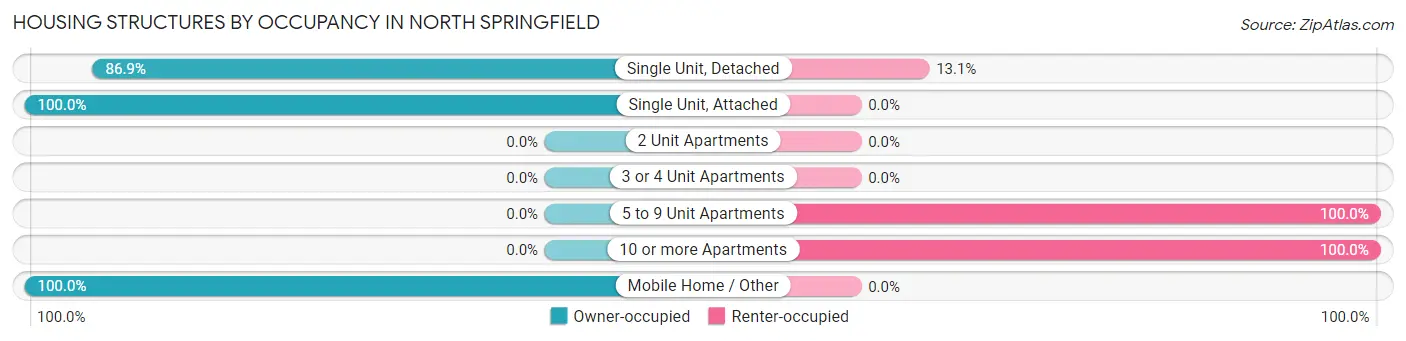
| Structure Type | Owner-occupied | Renter-occupied |
| Single Unit, Detached | 1,751 (86.9%) | 264 (13.1%) |
| Single Unit, Attached | 42 (100.0%) | 0 (0.0%) |
| 2 Unit Apartments | 0 (0.0%) | 0 (0.0%) |
| 3 or 4 Unit Apartments | 0 (0.0%) | 0 (0.0%) |
| 5 to 9 Unit Apartments | 0 (0.0%) | 43 (100.0%) |
| 10 or more Apartments | 0 (0.0%) | 120 (100.0%) |
| Mobile Home / Other | 2 (100.0%) | 0 (0.0%) |
| Total | 1,795 (80.8%) | 427 (19.2%) |
Housing Structures by Number of Rooms in North Springfield
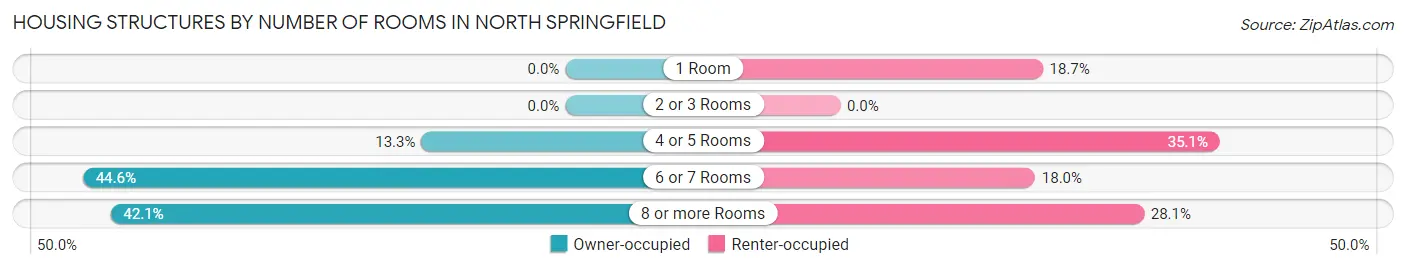
| Number of Rooms | Owner-occupied | Renter-occupied |
| 1 Room | 0 (0.0%) | 80 (18.7%) |
| 2 or 3 Rooms | 0 (0.0%) | 0 (0.0%) |
| 4 or 5 Rooms | 239 (13.3%) | 150 (35.1%) |
| 6 or 7 Rooms | 801 (44.6%) | 77 (18.0%) |
| 8 or more Rooms | 755 (42.1%) | 120 (28.1%) |
| Total | 1,795 (100.0%) | 427 (100.0%) |
Housing Structure by Heating Type in North Springfield
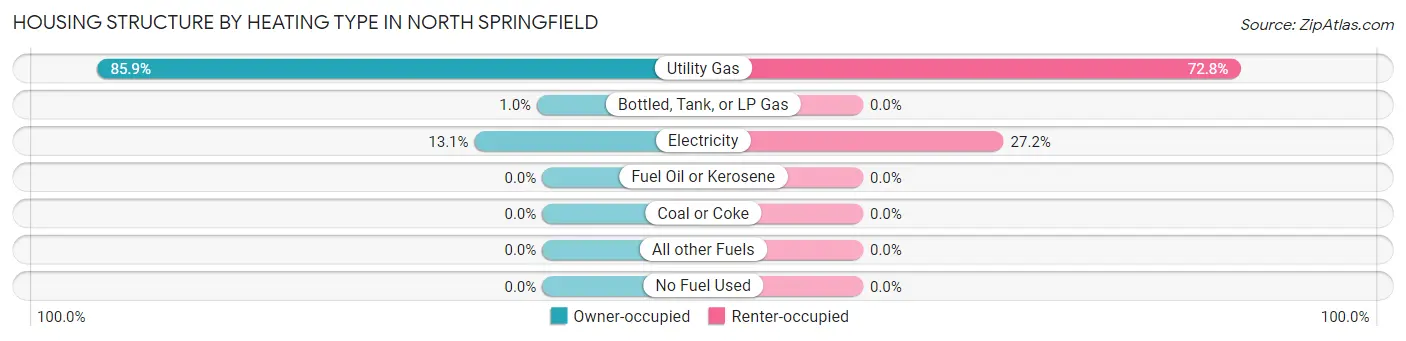
| Heating Type | Owner-occupied | Renter-occupied |
| Utility Gas | 1,542 (85.9%) | 311 (72.8%) |
| Bottled, Tank, or LP Gas | 18 (1.0%) | 0 (0.0%) |
| Electricity | 235 (13.1%) | 116 (27.2%) |
| Fuel Oil or Kerosene | 0 (0.0%) | 0 (0.0%) |
| Coal or Coke | 0 (0.0%) | 0 (0.0%) |
| All other Fuels | 0 (0.0%) | 0 (0.0%) |
| No Fuel Used | 0 (0.0%) | 0 (0.0%) |
| Total | 1,795 (100.0%) | 427 (100.0%) |
Household Vehicle Usage in North Springfield
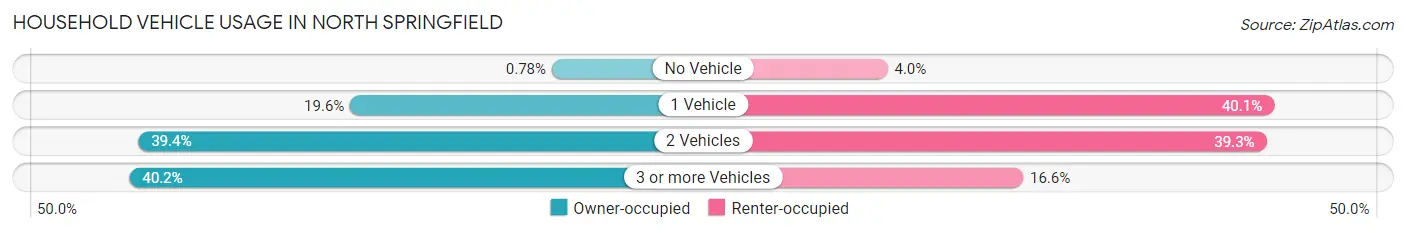
| Vehicles per Household | Owner-occupied | Renter-occupied |
| No Vehicle | 14 (0.8%) | 17 (4.0%) |
| 1 Vehicle | 352 (19.6%) | 171 (40.1%) |
| 2 Vehicles | 707 (39.4%) | 168 (39.3%) |
| 3 or more Vehicles | 722 (40.2%) | 71 (16.6%) |
| Total | 1,795 (100.0%) | 427 (100.0%) |
Real Estate & Mortgages in North Springfield
Real Estate and Mortgage Overview in North Springfield
| Characteristic | Without Mortgage | With Mortgage |
| Housing Units | 639 | 1,156 |
| Median Property Value | $584,200 | $608,900 |
| Median Household Income | $94,339 | $683 |
| Monthly Housing Costs | $875 | $435 |
| Real Estate Taxes | $6,057 | $0 |
Property Value by Mortgage Status in North Springfield
| Property Value | Without Mortgage | With Mortgage |
| Less than $50,000 | 6 (0.9%) | 5 (0.4%) |
| $50,000 to $99,999 | 0 (0.0%) | 2 (0.2%) |
| $100,000 to $299,999 | 5 (0.8%) | 5 (0.4%) |
| $300,000 to $499,999 | 157 (24.6%) | 215 (18.6%) |
| $500,000 to $749,999 | 450 (70.4%) | 806 (69.7%) |
| $750,000 to $999,999 | 0 (0.0%) | 123 (10.6%) |
| $1,000,000 or more | 21 (3.3%) | 0 (0.0%) |
| Total | 639 (100.0%) | 1,156 (100.0%) |
Household Income by Mortgage Status in North Springfield
| Household Income | Without Mortgage | With Mortgage |
| Less than $10,000 | 25 (3.9%) | 7 (0.6%) |
| $10,000 to $24,999 | 67 (10.5%) | 0 (0.0%) |
| $25,000 to $34,999 | 44 (6.9%) | 2 (0.2%) |
| $35,000 to $49,999 | 10 (1.6%) | 7 (0.6%) |
| $50,000 to $74,999 | 73 (11.4%) | 48 (4.2%) |
| $75,000 to $99,999 | 136 (21.3%) | 59 (5.1%) |
| $100,000 to $149,999 | 64 (10.0%) | 154 (13.3%) |
| $150,000 or more | 220 (34.4%) | 203 (17.6%) |
| Total | 639 (100.0%) | 1,156 (100.0%) |
Property Value to Household Income Ratio in North Springfield
| Value-to-Income Ratio | Without Mortgage | With Mortgage |
| Less than 2.0x | 11 (1.7%) | 161,809 (13,997.3%) |
| 2.0x to 2.9x | 100 (15.7%) | 66 (5.7%) |
| 3.0x to 3.9x | 120 (18.8%) | 202 (17.5%) |
| 4.0x or more | 403 (63.1%) | 484 (41.9%) |
| Total | 639 (100.0%) | 1,156 (100.0%) |
Real Estate Taxes by Mortgage Status in North Springfield
| Property Taxes | Without Mortgage | With Mortgage |
| Less than $800 | 6 (0.9%) | 0 (0.0%) |
| $800 to $1,499 | 0 (0.0%) | 7 (0.6%) |
| $800 to $1,499 | 627 (98.1%) | 5 (0.4%) |
| Total | 639 (100.0%) | 1,156 (100.0%) |
Health & Disability in North Springfield
Health Insurance Coverage by Age in North Springfield
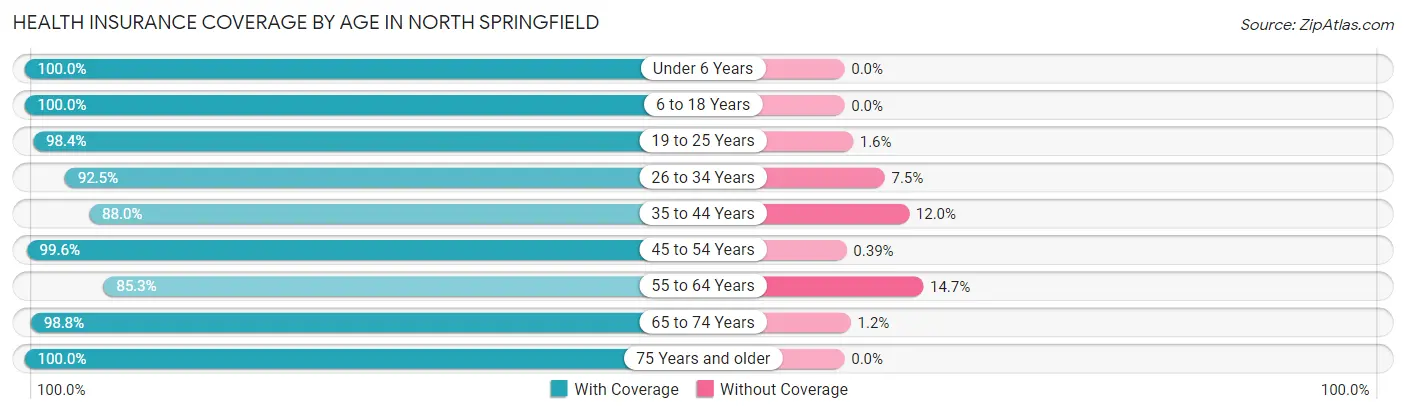
| Age Bracket | With Coverage | Without Coverage |
| Under 6 Years | 784 (100.0%) | 0 (0.0%) |
| 6 to 18 Years | 1,008 (100.0%) | 0 (0.0%) |
| 19 to 25 Years | 437 (98.4%) | 7 (1.6%) |
| 26 to 34 Years | 703 (92.5%) | 57 (7.5%) |
| 35 to 44 Years | 782 (88.0%) | 107 (12.0%) |
| 45 to 54 Years | 760 (99.6%) | 3 (0.4%) |
| 55 to 64 Years | 1,011 (85.3%) | 174 (14.7%) |
| 65 to 74 Years | 677 (98.8%) | 8 (1.2%) |
| 75 Years and older | 322 (100.0%) | 0 (0.0%) |
| Total | 6,484 (94.8%) | 356 (5.2%) |
Health Insurance Coverage by Citizenship Status in North Springfield
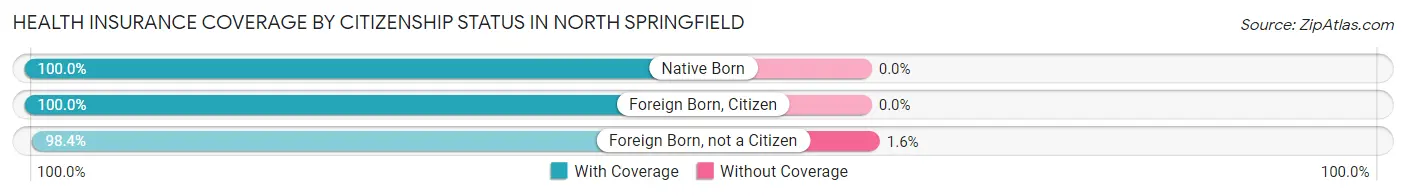
| Citizenship Status | With Coverage | Without Coverage |
| Native Born | 784 (100.0%) | 0 (0.0%) |
| Foreign Born, Citizen | 1,008 (100.0%) | 0 (0.0%) |
| Foreign Born, not a Citizen | 437 (98.4%) | 7 (1.6%) |
Health Insurance Coverage by Household Income in North Springfield
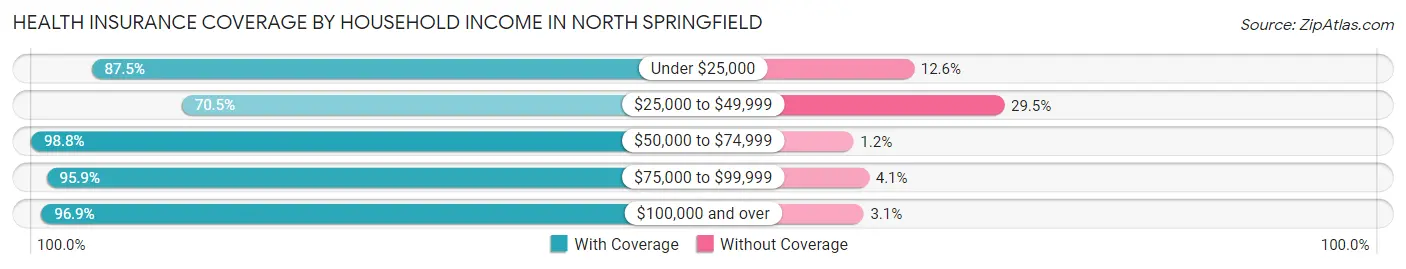
| Household Income | With Coverage | Without Coverage |
| Under $25,000 | 230 (87.5%) | 33 (12.6%) |
| $25,000 to $49,999 | 316 (70.5%) | 132 (29.5%) |
| $50,000 to $74,999 | 557 (98.8%) | 7 (1.2%) |
| $75,000 to $99,999 | 954 (95.9%) | 41 (4.1%) |
| $100,000 and over | 4,425 (96.9%) | 143 (3.1%) |
Public vs Private Health Insurance Coverage by Age in North Springfield
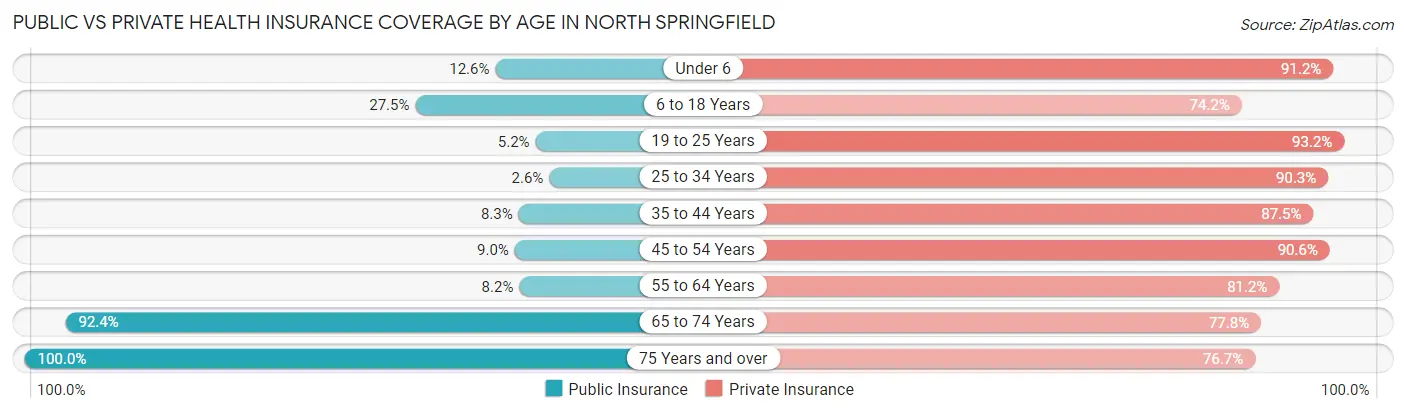
| Age Bracket | Public Insurance | Private Insurance |
| Under 6 | 99 (12.6%) | 715 (91.2%) |
| 6 to 18 Years | 277 (27.5%) | 748 (74.2%) |
| 19 to 25 Years | 23 (5.2%) | 414 (93.2%) |
| 25 to 34 Years | 20 (2.6%) | 686 (90.3%) |
| 35 to 44 Years | 74 (8.3%) | 778 (87.5%) |
| 45 to 54 Years | 69 (9.0%) | 691 (90.6%) |
| 55 to 64 Years | 97 (8.2%) | 962 (81.2%) |
| 65 to 74 Years | 633 (92.4%) | 533 (77.8%) |
| 75 Years and over | 322 (100.0%) | 247 (76.7%) |
| Total | 1,614 (23.6%) | 5,774 (84.4%) |
Disability Status by Sex by Age in North Springfield
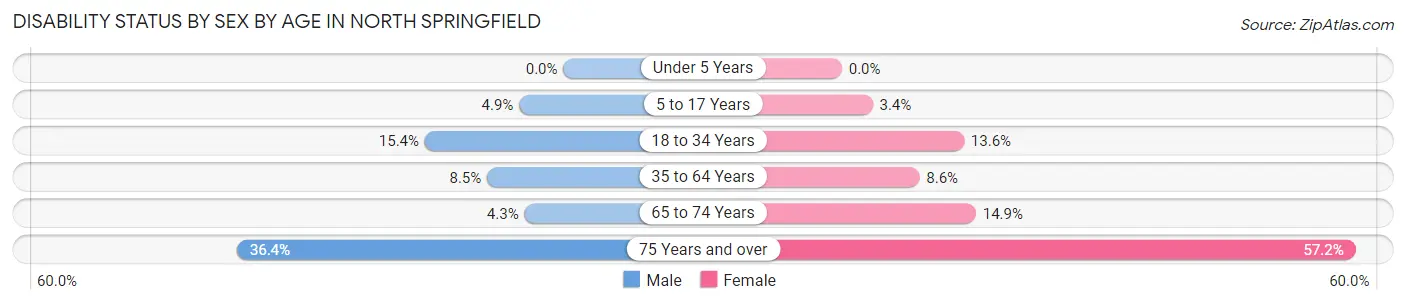
| Age Bracket | Male | Female |
| Under 5 Years | 0 (0.0%) | 0 (0.0%) |
| 5 to 17 Years | 26 (4.9%) | 22 (3.4%) |
| 18 to 34 Years | 97 (15.4%) | 79 (13.6%) |
| 35 to 64 Years | 124 (8.5%) | 119 (8.6%) |
| 65 to 74 Years | 14 (4.3%) | 54 (14.9%) |
| 75 Years and over | 44 (36.4%) | 115 (57.2%) |
Disability Class by Sex by Age in North Springfield
Disability Class: Hearing Difficulty
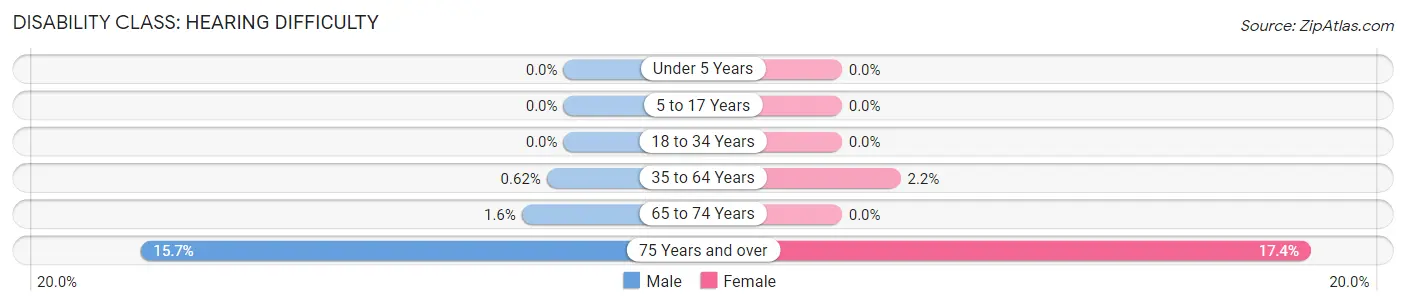
| Age Bracket | Male | Female |
| Under 5 Years | 0 (0.0%) | 0 (0.0%) |
| 5 to 17 Years | 0 (0.0%) | 0 (0.0%) |
| 18 to 34 Years | 0 (0.0%) | 0 (0.0%) |
| 35 to 64 Years | 9 (0.6%) | 30 (2.2%) |
| 65 to 74 Years | 5 (1.5%) | 0 (0.0%) |
| 75 Years and over | 19 (15.7%) | 35 (17.4%) |
Disability Class: Vision Difficulty
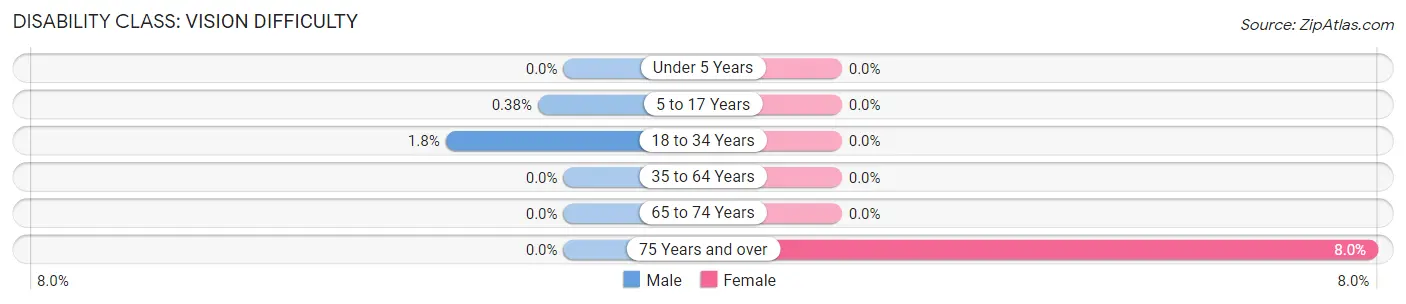
| Age Bracket | Male | Female |
| Under 5 Years | 0 (0.0%) | 0 (0.0%) |
| 5 to 17 Years | 2 (0.4%) | 0 (0.0%) |
| 18 to 34 Years | 11 (1.8%) | 0 (0.0%) |
| 35 to 64 Years | 0 (0.0%) | 0 (0.0%) |
| 65 to 74 Years | 0 (0.0%) | 0 (0.0%) |
| 75 Years and over | 0 (0.0%) | 16 (8.0%) |
Disability Class: Cognitive Difficulty
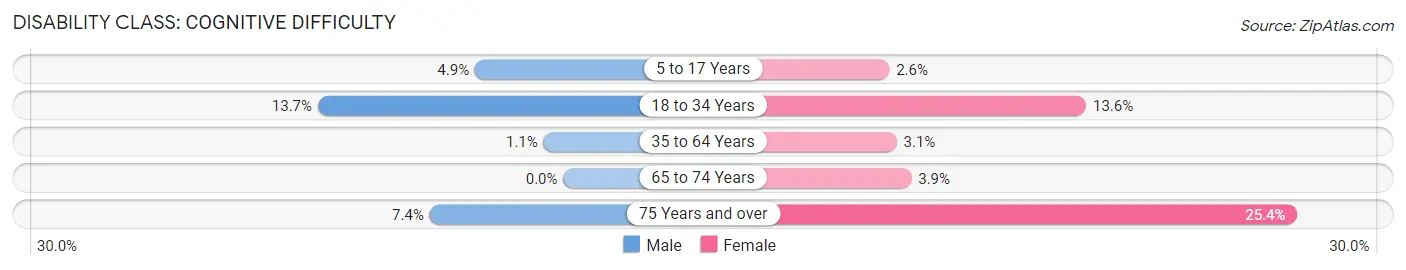
| Age Bracket | Male | Female |
| 5 to 17 Years | 26 (4.9%) | 17 (2.6%) |
| 18 to 34 Years | 86 (13.7%) | 79 (13.6%) |
| 35 to 64 Years | 16 (1.1%) | 42 (3.0%) |
| 65 to 74 Years | 0 (0.0%) | 14 (3.9%) |
| 75 Years and over | 9 (7.4%) | 51 (25.4%) |
Disability Class: Ambulatory Difficulty
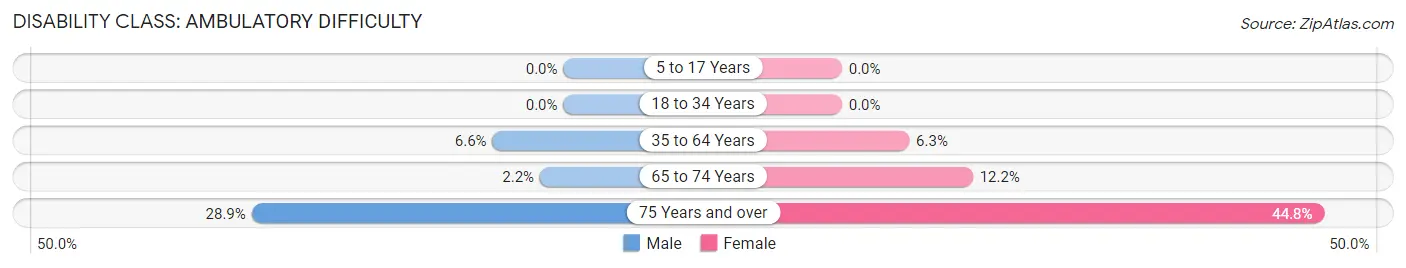
| Age Bracket | Male | Female |
| 5 to 17 Years | 0 (0.0%) | 0 (0.0%) |
| 18 to 34 Years | 0 (0.0%) | 0 (0.0%) |
| 35 to 64 Years | 96 (6.6%) | 86 (6.2%) |
| 65 to 74 Years | 7 (2.2%) | 44 (12.1%) |
| 75 Years and over | 35 (28.9%) | 90 (44.8%) |
Disability Class: Self-Care Difficulty
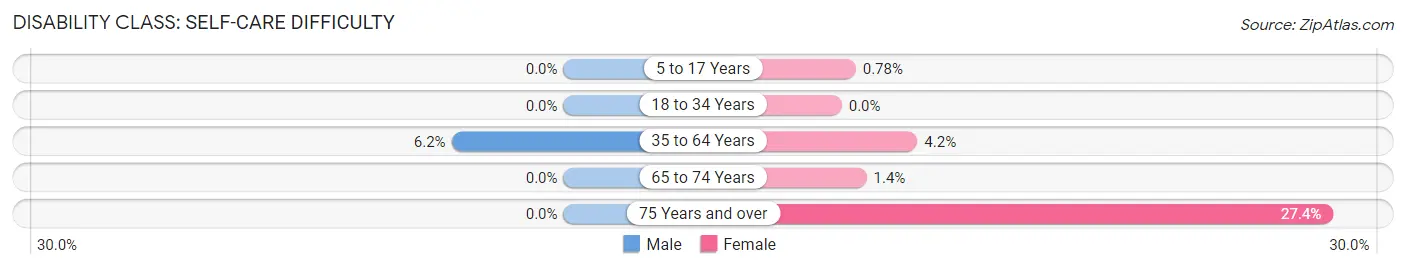
| Age Bracket | Male | Female |
| 5 to 17 Years | 0 (0.0%) | 5 (0.8%) |
| 18 to 34 Years | 0 (0.0%) | 0 (0.0%) |
| 35 to 64 Years | 91 (6.2%) | 58 (4.2%) |
| 65 to 74 Years | 0 (0.0%) | 5 (1.4%) |
| 75 Years and over | 0 (0.0%) | 55 (27.4%) |
Technology Access in North Springfield
Computing Device Access in North Springfield
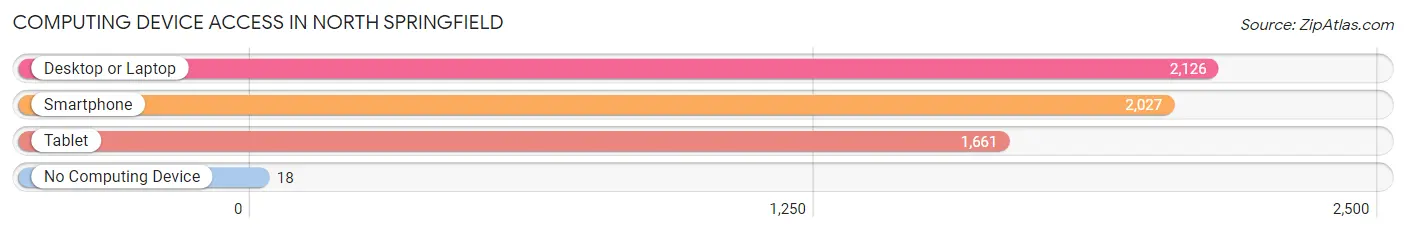
| Device Type | # Households | % Households |
| Desktop or Laptop | 2,126 | 95.7% |
| Smartphone | 2,027 | 91.2% |
| Tablet | 1,661 | 74.8% |
| No Computing Device | 18 | 0.8% |
| Total | 2,222 | 100.0% |
Internet Access in North Springfield
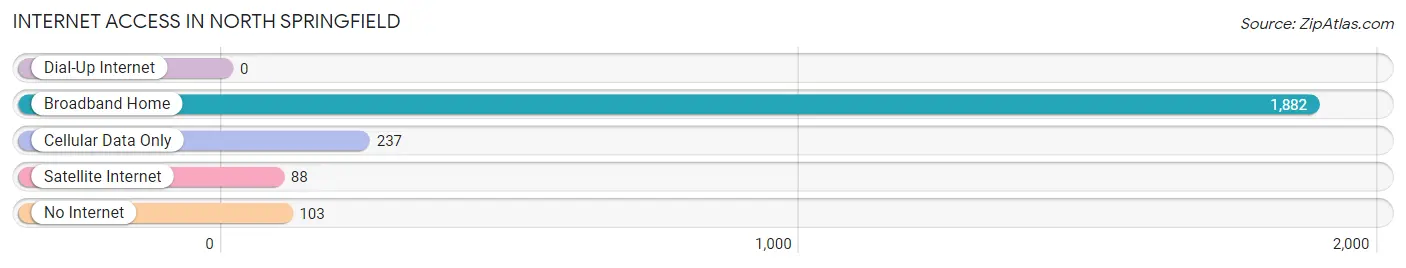
| Internet Type | # Households | % Households |
| Dial-Up Internet | 0 | 0.0% |
| Broadband Home | 1,882 | 84.7% |
| Cellular Data Only | 237 | 10.7% |
| Satellite Internet | 88 | 4.0% |
| No Internet | 103 | 4.6% |
| Total | 2,222 | 100.0% |
North Springfield Summary
Springfield, Virginia is a census-designated place (CDP) located in Fairfax County, Virginia. It is a suburb of Washington, D.C., located approximately 15 miles southwest of the nation’s capital. The population of North Springfield was 22,460 as of the 2010 census.
History
The area that is now North Springfield was originally inhabited by Native Americans, including the Piscataway and Doeg tribes. The first European settlers arrived in the area in the late 17th century. The area was part of the 10,000-acre tract of land granted to Colonel Richard Blackburn in 1698. The area was known as “Blackburn’s Ford” until the early 19th century, when it was renamed “Springfield” after the nearby spring.
In 1846, the Orange and Alexandria Railroad was built through the area, connecting it to Washington, D.C. and other nearby towns. This led to an increase in population and the development of the area. In 1871, the area was officially incorporated as the Town of Springfield.
In the early 20th century, the area experienced a period of rapid growth. The population increased from 1,000 in 1900 to over 10,000 by 1950. The area was annexed by Fairfax County in 1952.
Geography
North Springfield is located in northern Fairfax County, Virginia. It is bordered to the north by the City of Fairfax, to the east by the City of Falls Church, to the south by the City of Alexandria, and to the west by the City of Fairfax Station.
The area is located in the Piedmont region of Virginia, and is characterized by rolling hills and valleys. The area is drained by the Accotink Creek, which flows through the center of the CDP.
Economy
North Springfield is a primarily residential area, with a few small businesses located in the area. The largest employer in the area is the federal government, with many residents employed by the Department of Defense, the Department of Homeland Security, and other federal agencies.
The area is also home to several large retail stores, including Target, Walmart, and Best Buy. There are also several restaurants and other small businesses located in the area.
Demographics
As of the 2010 census, the population of North Springfield was 22,460. The racial makeup of the area was 68.3% White, 15.2% African American, 0.3% Native American, 8.2% Asian, 0.1% Pacific Islander, and 4.9% from other races. Hispanic or Latino of any race were 8.7% of the population.
The median household income in North Springfield was $90,945, and the median family income was $103,945. The per capita income was $41,945. About 4.3% of families and 5.7% of the population were below the poverty line.
The area is served by the Fairfax County Public Schools system. The area is home to several elementary schools, including North Springfield Elementary School, and one middle school, Key Middle School. The area is also home to several private schools, including St. John’s Catholic School and the Islamic Saudi Academy.
Common Questions
What is Per Capita Income in North Springfield?
Per Capita income in North Springfield is $44,163.
What is the Median Family Income in North Springfield?
Median Family Income in North Springfield is $157,863.
What is the Median Household income in North Springfield?
Median Household Income in North Springfield is $119,151.
What is Income or Wage Gap in North Springfield?
Income or Wage Gap in North Springfield is 16.3%.
Women in North Springfield earn 83.7 cents for every dollar earned by a man.
What is Inequality or Gini Index in North Springfield?
Inequality or Gini Index in North Springfield is 0.34.
What is the Total Population of North Springfield?
Total Population of North Springfield is 6,916.
What is the Total Male Population of North Springfield?
Total Male Population of North Springfield is 3,432.
What is the Total Female Population of North Springfield?
Total Female Population of North Springfield is 3,484.
What is the Ratio of Males per 100 Females in North Springfield?
There are 98.51 Males per 100 Females in North Springfield.
What is the Ratio of Females per 100 Males in North Springfield?
There are 101.52 Females per 100 Males in North Springfield.
What is the Median Population Age in North Springfield?
Median Population Age in North Springfield is 38.6 Years.
What is the Average Family Size in North Springfield
Average Family Size in North Springfield is 3.8 People.
What is the Average Household Size in North Springfield
Average Household Size in North Springfield is 3.1 People.
How Large is the Labor Force in North Springfield?
There are 3,743 People in the Labor Forcein in North Springfield.
What is the Percentage of People in the Labor Force in North Springfield?
71.6% of People are in the Labor Force in North Springfield.
What is the Unemployment Rate in North Springfield?
Unemployment Rate in North Springfield is 3.5%.