Brandermill, VA Map & Demographics
Brandermill Map
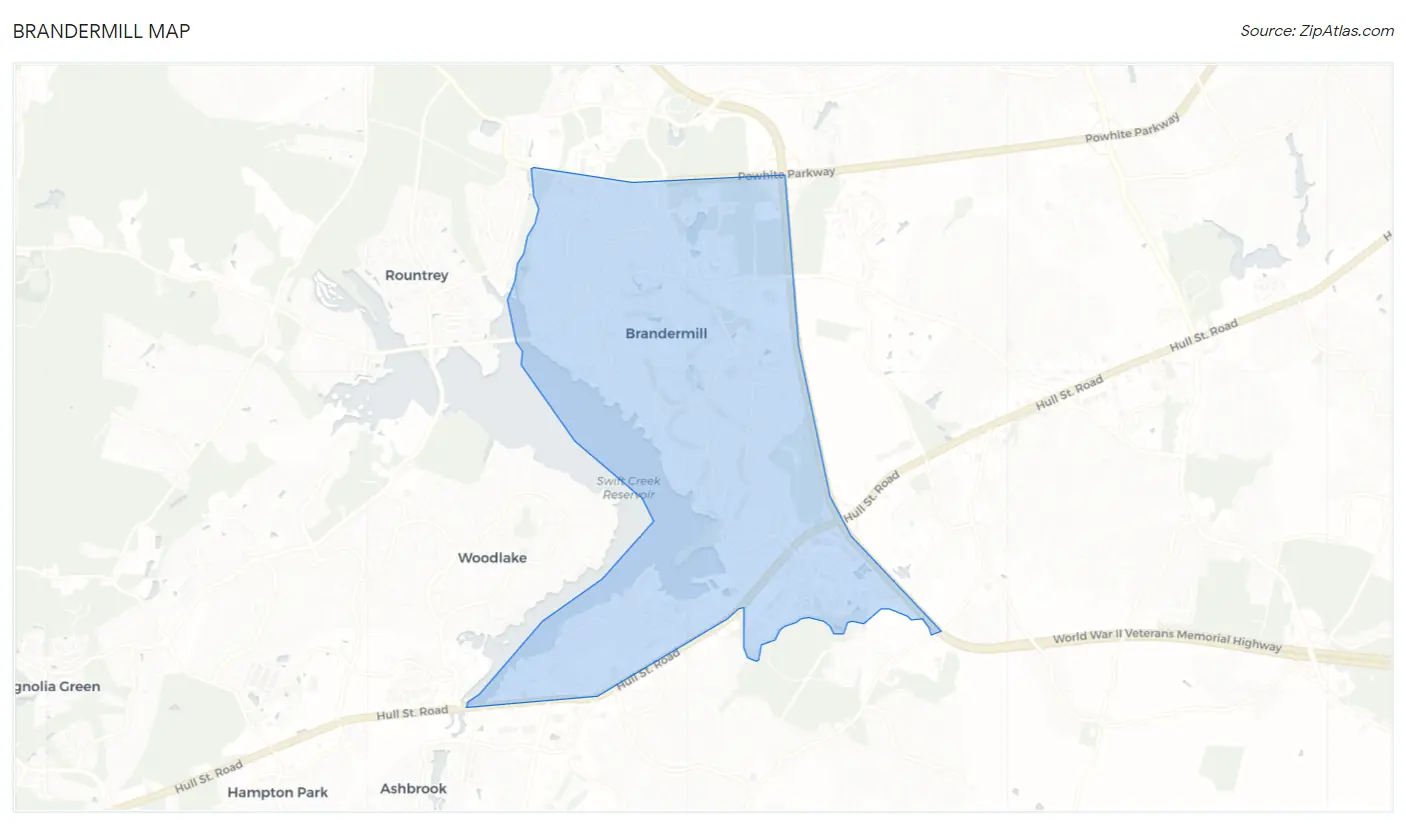
Brandermill Overview
$52,234
PER CAPITA INCOME
$126,477
AVG FAMILY INCOME
$107,061
AVG HOUSEHOLD INCOME
28.0%
WAGE / INCOME GAP [ % ]
72.0¢/ $1
WAGE / INCOME GAP [ $ ]
$10,166
FAMILY INCOME DEFICIT
0.36
INEQUALITY / GINI INDEX
14,285
TOTAL POPULATION
6,986
MALE POPULATION
7,299
FEMALE POPULATION
95.71
MALES / 100 FEMALES
104.48
FEMALES / 100 MALES
43.5
MEDIAN AGE
3.0
AVG FAMILY SIZE
2.5
AVG HOUSEHOLD SIZE
8,125
LABOR FORCE [ PEOPLE ]
69.4%
PERCENT IN LABOR FORCE
4.2%
UNEMPLOYMENT RATE
Income in Brandermill
Income Overview in Brandermill
Per Capita Income in Brandermill is $52,234, while median incomes of families and households are $126,477 and $107,061 respectively.
| Characteristic | Number | Measure |
| Per Capita Income | 14,285 | $52,234 |
| Median Family Income | 3,979 | $126,477 |
| Mean Family Income | 3,979 | $142,672 |
| Median Household Income | 5,734 | $107,061 |
| Mean Household Income | 5,734 | $124,763 |
| Income Deficit | 3,979 | $10,166 |
| Wage / Income Gap (%) | 14,285 | 28.02% |
| Wage / Income Gap ($) | 14,285 | 71.98¢ per $1 |
| Gini / Inequality Index | 14,285 | 0.36 |
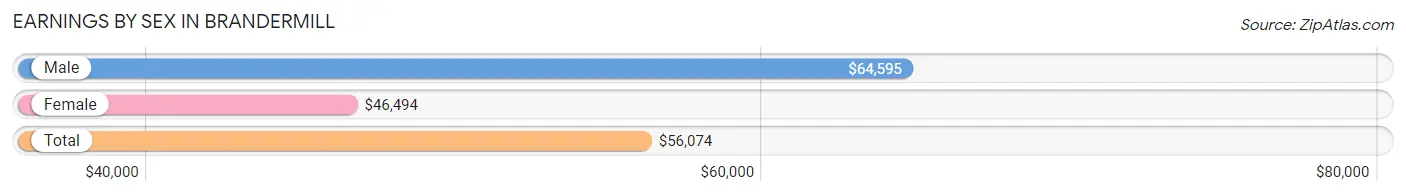
Earnings by Sex in Brandermill
Average Earnings in Brandermill are $56,074, $64,595 for men and $46,494 for women, a difference of 28.0%.
| Sex | Number | Average Earnings |
| Male | 4,547 (53.6%) | $64,595 |
| Female | 3,942 (46.4%) | $46,494 |
| Total | 8,489 (100.0%) | $56,074 |
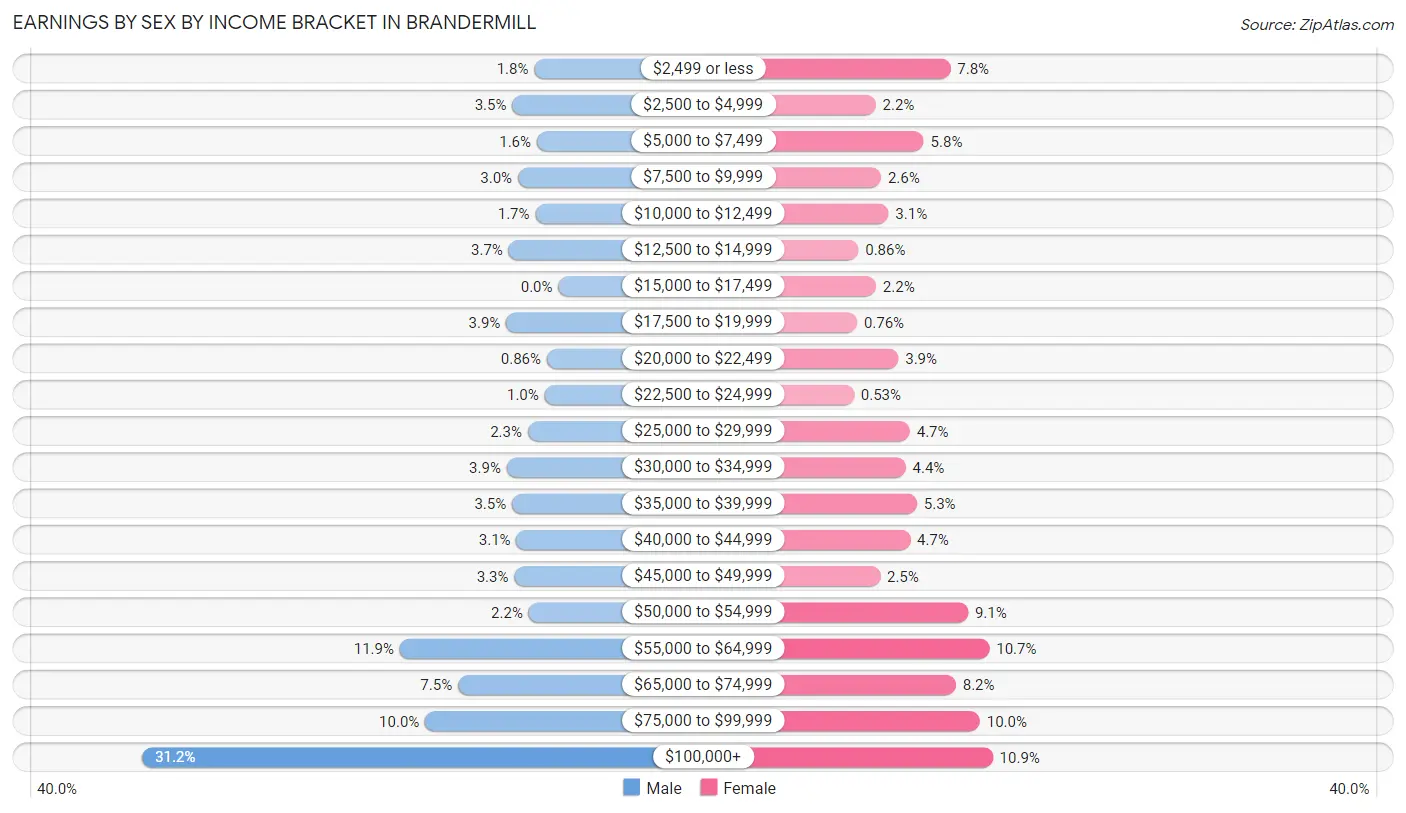
Earnings by Sex by Income Bracket in Brandermill
The most common earnings brackets in Brandermill are $100,000+ for men (1,418 | 31.2%) and $100,000+ for women (431 | 10.9%).
| Income | Male | Female |
| $2,499 or less | 82 (1.8%) | 306 (7.8%) |
| $2,500 to $4,999 | 157 (3.5%) | 85 (2.2%) |
| $5,000 to $7,499 | 73 (1.6%) | 227 (5.8%) |
| $7,500 to $9,999 | 138 (3.0%) | 101 (2.6%) |
| $10,000 to $12,499 | 78 (1.7%) | 123 (3.1%) |
| $12,500 to $14,999 | 169 (3.7%) | 34 (0.9%) |
| $15,000 to $17,499 | 0 (0.0%) | 86 (2.2%) |
| $17,500 to $19,999 | 178 (3.9%) | 30 (0.8%) |
| $20,000 to $22,499 | 39 (0.9%) | 152 (3.9%) |
| $22,500 to $24,999 | 47 (1.0%) | 21 (0.5%) |
| $25,000 to $29,999 | 104 (2.3%) | 186 (4.7%) |
| $30,000 to $34,999 | 176 (3.9%) | 174 (4.4%) |
| $35,000 to $39,999 | 158 (3.5%) | 207 (5.2%) |
| $40,000 to $44,999 | 143 (3.1%) | 187 (4.7%) |
| $45,000 to $49,999 | 150 (3.3%) | 98 (2.5%) |
| $50,000 to $54,999 | 101 (2.2%) | 358 (9.1%) |
| $55,000 to $64,999 | 540 (11.9%) | 421 (10.7%) |
| $65,000 to $74,999 | 342 (7.5%) | 322 (8.2%) |
| $75,000 to $99,999 | 454 (10.0%) | 393 (10.0%) |
| $100,000+ | 1,418 (31.2%) | 431 (10.9%) |
| Total | 4,547 (100.0%) | 3,942 (100.0%) |
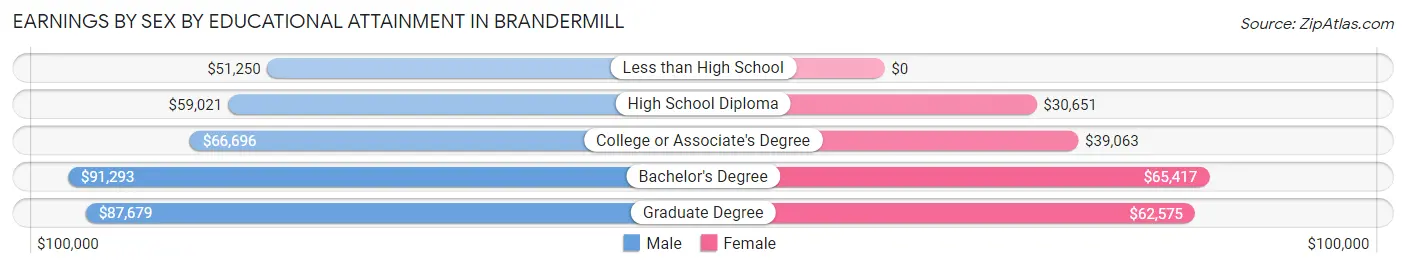
Earnings by Sex by Educational Attainment in Brandermill
Average earnings in Brandermill are $68,221 for men and $51,950 for women, a difference of 23.8%. Men with an educational attainment of bachelor's degree enjoy the highest average annual earnings of $91,293, while those with less than high school education earn the least with $51,250. Women with an educational attainment of bachelor's degree earn the most with the average annual earnings of $65,417, while those with high school diploma education have the smallest earnings of $30,651.
| Educational Attainment | Male Income | Female Income |
| Less than High School | $51,250 | $0 |
| High School Diploma | $59,021 | $30,651 |
| College or Associate's Degree | $66,696 | $39,063 |
| Bachelor's Degree | $91,293 | $65,417 |
| Graduate Degree | $87,679 | $62,575 |
| Total | $68,221 | $51,950 |
Family Income in Brandermill
Family Income Brackets in Brandermill
According to the Brandermill family income data, there are 1,134 families falling into the $100,000 to $149,999 income range, which is the most common income bracket and makes up 28.5% of all families.
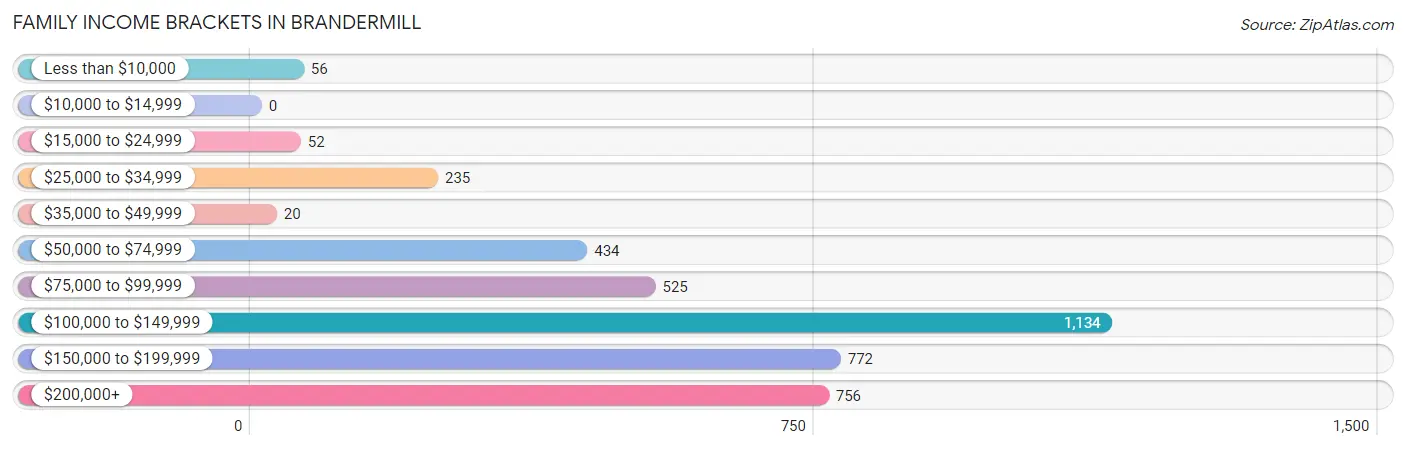
| Income Bracket | # Families | % Families |
| Less than $10,000 | 56 | 1.4% |
| $10,000 to $14,999 | 0 | 0.0% |
| $15,000 to $24,999 | 52 | 1.3% |
| $25,000 to $34,999 | 235 | 5.9% |
| $35,000 to $49,999 | 20 | 0.5% |
| $50,000 to $74,999 | 434 | 10.9% |
| $75,000 to $99,999 | 525 | 13.2% |
| $100,000 to $149,999 | 1,134 | 28.5% |
| $150,000 to $199,999 | 772 | 19.4% |
| $200,000+ | 756 | 19.0% |
Family Income by Famaliy Size in Brandermill
4-person families (488 | 12.3%) account for the highest median family income in Brandermill with $161,795 per family, while 2-person families (2,061 | 51.8%) have the highest median income of $55,290 per family member.
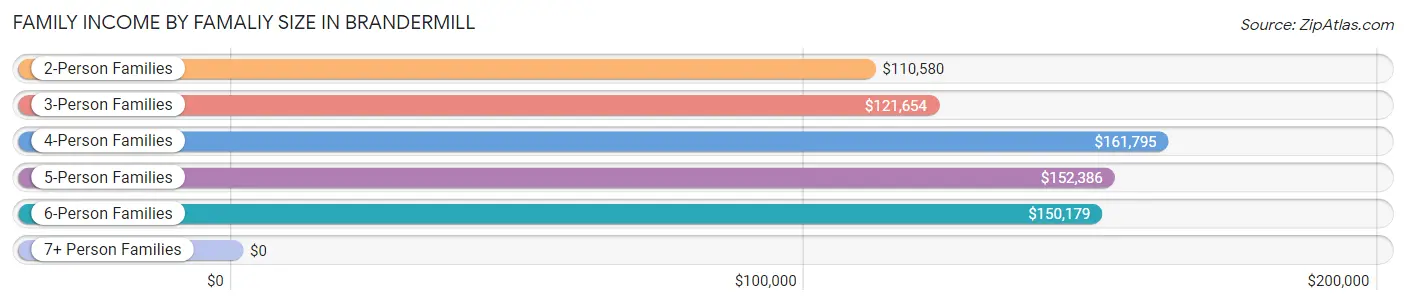
| Income Bracket | # Families | Median Income |
| 2-Person Families | 2,061 (51.8%) | $110,580 |
| 3-Person Families | 1,008 (25.3%) | $121,654 |
| 4-Person Families | 488 (12.3%) | $161,795 |
| 5-Person Families | 352 (8.8%) | $152,386 |
| 6-Person Families | 70 (1.8%) | $150,179 |
| 7+ Person Families | 0 (0.0%) | $0 |
| Total | 3,979 (100.0%) | $126,477 |
Family Income by Number of Earners in Brandermill
The median family income in Brandermill is $126,477, with families comprising 3+ earners (477) having the highest median family income of $153,964, while families with 1 earner (1,154) have the lowest median family income of $86,373, accounting for 12.0% and 29.0% of families, respectively.
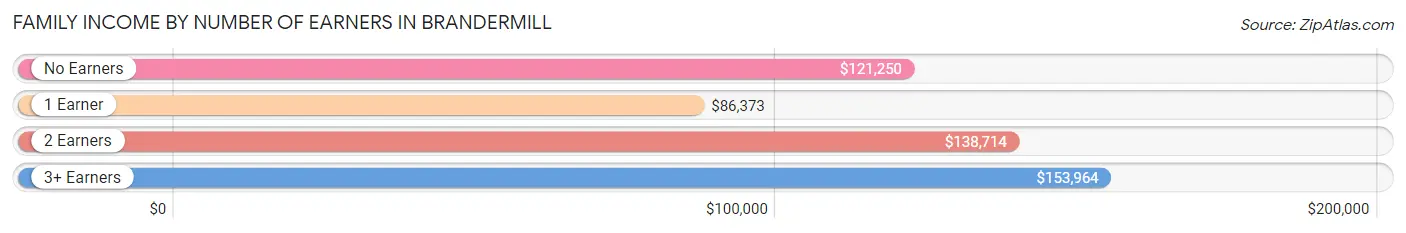
| Number of Earners | # Families | Median Income |
| No Earners | 472 (11.9%) | $121,250 |
| 1 Earner | 1,154 (29.0%) | $86,373 |
| 2 Earners | 1,876 (47.1%) | $138,714 |
| 3+ Earners | 477 (12.0%) | $153,964 |
| Total | 3,979 (100.0%) | $126,477 |
Household Income in Brandermill
Household Income Brackets in Brandermill
With 1,388 households falling in the category, the $100,000 to $149,999 income range is the most frequent in Brandermill, accounting for 24.2% of all households. In contrast, only 57 households (1.0%) fall into the $10,000 to $14,999 income bracket, making it the least populous group.
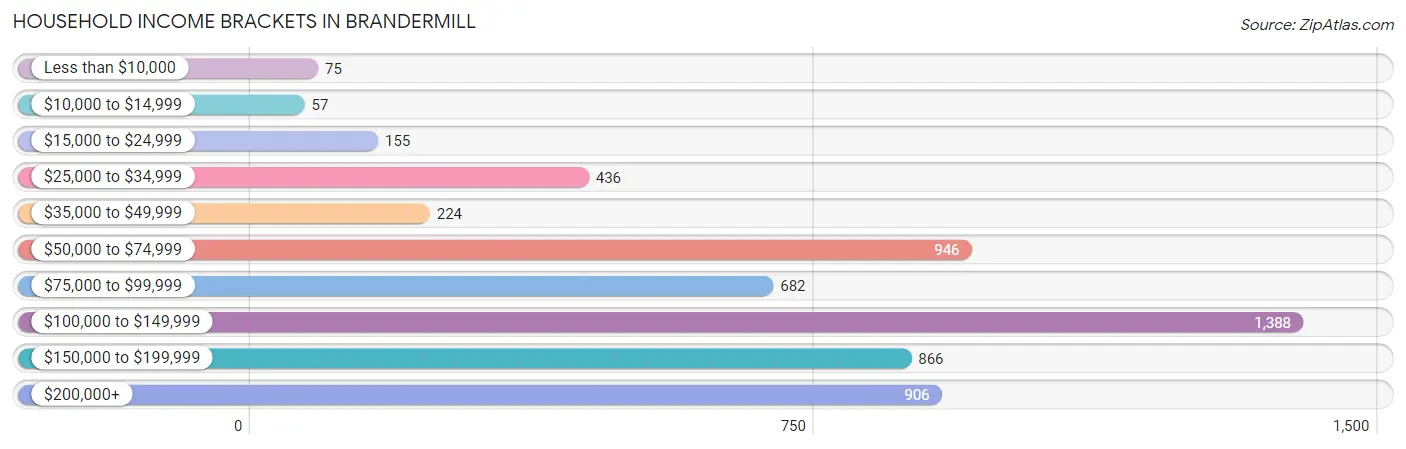
| Income Bracket | # Households | % Households |
| Less than $10,000 | 75 | 1.3% |
| $10,000 to $14,999 | 57 | 1.0% |
| $15,000 to $24,999 | 155 | 2.7% |
| $25,000 to $34,999 | 436 | 7.6% |
| $35,000 to $49,999 | 224 | 3.9% |
| $50,000 to $74,999 | 946 | 16.5% |
| $75,000 to $99,999 | 682 | 11.9% |
| $100,000 to $149,999 | 1,388 | 24.2% |
| $150,000 to $199,999 | 866 | 15.1% |
| $200,000+ | 906 | 15.8% |
Household Income by Householder Age in Brandermill
The median household income in Brandermill is $107,061, with the highest median household income of $148,934 found in the 45 to 64 years age bracket for the primary householder. A total of 2,309 households (40.3%) fall into this category. Meanwhile, the 15 to 24 years age bracket for the primary householder has the lowest median household income of $0, with 66 households (1.1%) in this group.
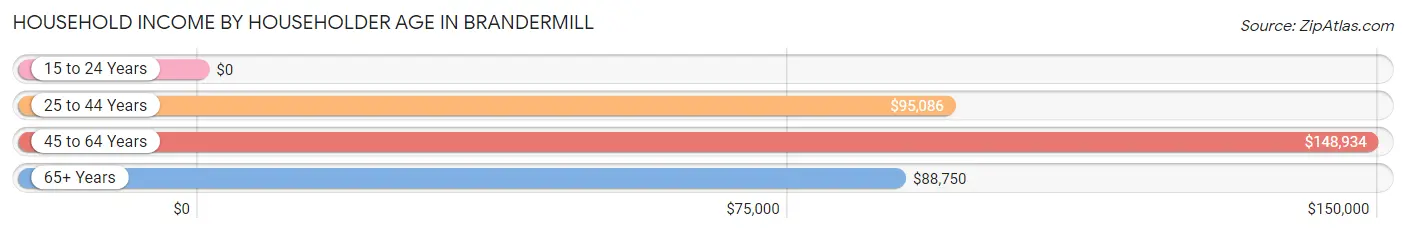
| Income Bracket | # Households | Median Income |
| 15 to 24 Years | 66 (1.1%) | $0 |
| 25 to 44 Years | 1,650 (28.8%) | $95,086 |
| 45 to 64 Years | 2,309 (40.3%) | $148,934 |
| 65+ Years | 1,709 (29.8%) | $88,750 |
| Total | 5,734 (100.0%) | $107,061 |
Poverty in Brandermill
Income Below Poverty by Sex and Age in Brandermill
With 8.0% poverty level for males and 7.1% for females among the residents of Brandermill, under 5 year old males and 6 to 11 year old females are the most vulnerable to poverty, with 230 males (51.2%) and 124 females (31.1%) in their respective age groups living below the poverty level.
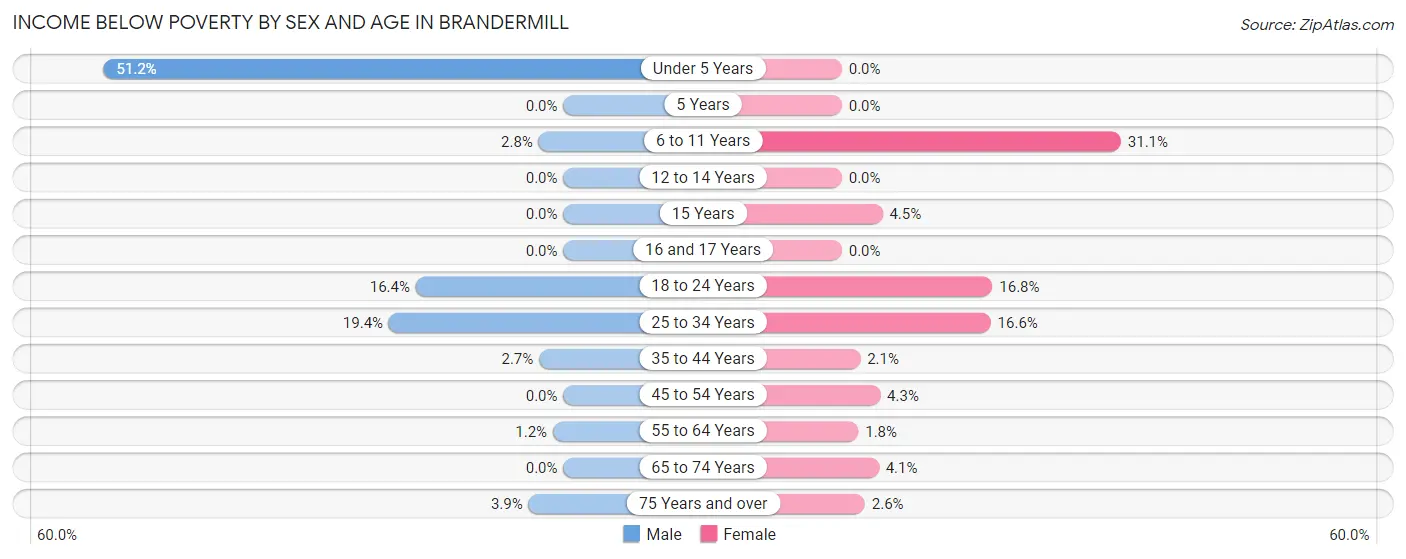
| Age Bracket | Male | Female |
| Under 5 Years | 230 (51.2%) | 0 (0.0%) |
| 5 Years | 0 (0.0%) | 0 (0.0%) |
| 6 to 11 Years | 16 (2.8%) | 124 (31.1%) |
| 12 to 14 Years | 0 (0.0%) | 0 (0.0%) |
| 15 Years | 0 (0.0%) | 11 (4.5%) |
| 16 and 17 Years | 0 (0.0%) | 0 (0.0%) |
| 18 to 24 Years | 102 (16.4%) | 83 (16.8%) |
| 25 to 34 Years | 144 (19.4%) | 163 (16.6%) |
| 35 to 44 Years | 26 (2.7%) | 16 (2.1%) |
| 45 to 54 Years | 0 (0.0%) | 49 (4.3%) |
| 55 to 64 Years | 14 (1.2%) | 15 (1.8%) |
| 65 to 74 Years | 0 (0.0%) | 38 (4.1%) |
| 75 Years and over | 25 (3.9%) | 19 (2.6%) |
| Total | 557 (8.0%) | 518 (7.1%) |
Income Above Poverty by Sex and Age in Brandermill
According to the poverty statistics in Brandermill, males aged 5 years and females aged under 5 years are the age groups that are most secure financially, with 100.0% of males and 100.0% of females in these age groups living above the poverty line.
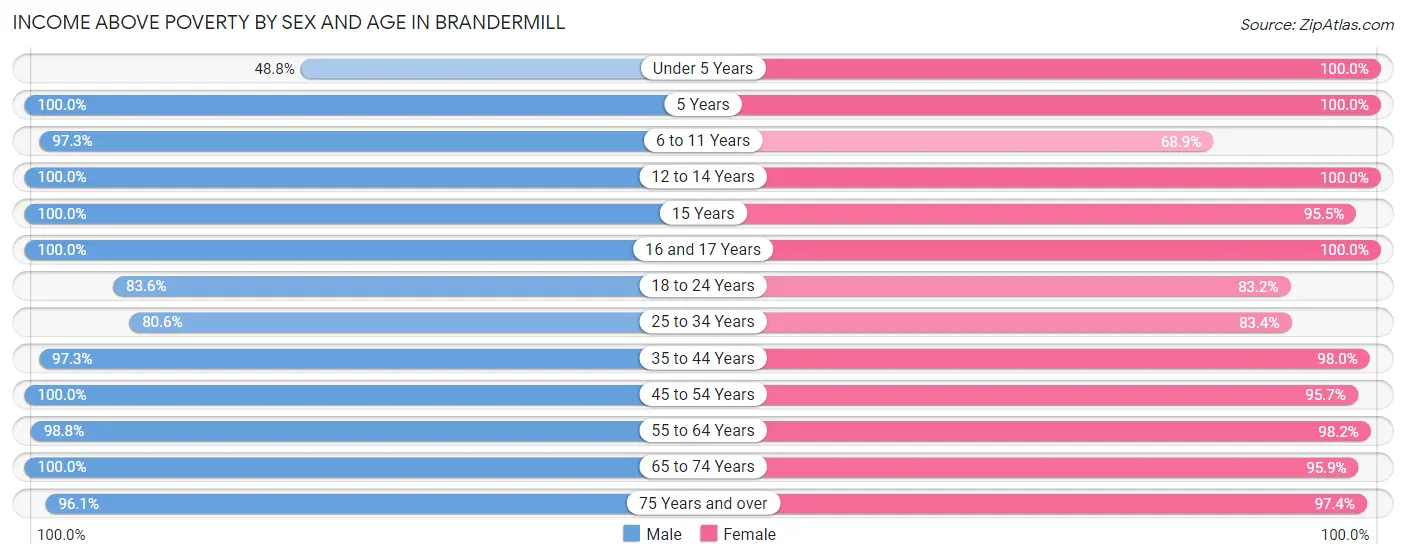
| Age Bracket | Male | Female |
| Under 5 Years | 219 (48.8%) | 364 (100.0%) |
| 5 Years | 40 (100.0%) | 89 (100.0%) |
| 6 to 11 Years | 566 (97.3%) | 275 (68.9%) |
| 12 to 14 Years | 158 (100.0%) | 200 (100.0%) |
| 15 Years | 52 (100.0%) | 232 (95.5%) |
| 16 and 17 Years | 96 (100.0%) | 116 (100.0%) |
| 18 to 24 Years | 519 (83.6%) | 412 (83.2%) |
| 25 to 34 Years | 597 (80.6%) | 820 (83.4%) |
| 35 to 44 Years | 937 (97.3%) | 765 (98.0%) |
| 45 to 54 Years | 945 (100.0%) | 1,099 (95.7%) |
| 55 to 64 Years | 1,190 (98.8%) | 801 (98.2%) |
| 65 to 74 Years | 487 (100.0%) | 887 (95.9%) |
| 75 Years and over | 620 (96.1%) | 721 (97.4%) |
| Total | 6,426 (92.0%) | 6,781 (92.9%) |
Income Below Poverty Among Married-Couple Families in Brandermill
The poverty statistics for married-couple families in Brandermill show that 4.1% or 131 of the total 3,167 families live below the poverty line. Families with 3 or 4 children have the highest poverty rate of 35.8%, comprising of 97 families. On the other hand, families with no children have the lowest poverty rate of 1.0%, which includes 20 families.
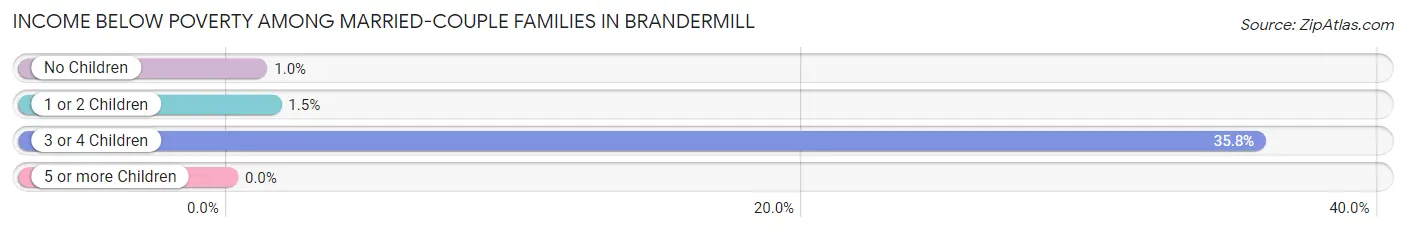
| Children | Above Poverty | Below Poverty |
| No Children | 1,947 (99.0%) | 20 (1.0%) |
| 1 or 2 Children | 915 (98.5%) | 14 (1.5%) |
| 3 or 4 Children | 174 (64.2%) | 97 (35.8%) |
| 5 or more Children | 0 (0.0%) | 0 (0.0%) |
| Total | 3,036 (95.9%) | 131 (4.1%) |
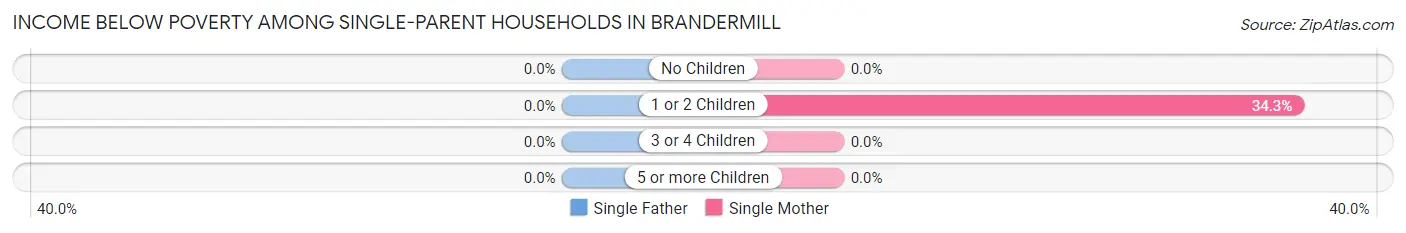
Income Below Poverty Among Single-Parent Households in Brandermill
| Children | Single Father | Single Mother |
| No Children | 0 (0.0%) | 0 (0.0%) |
| 1 or 2 Children | 0 (0.0%) | 71 (34.3%) |
| 3 or 4 Children | 0 (0.0%) | 0 (0.0%) |
| 5 or more Children | 0 (0.0%) | 0 (0.0%) |
| Total | 0 (0.0%) | 71 (12.8%) |
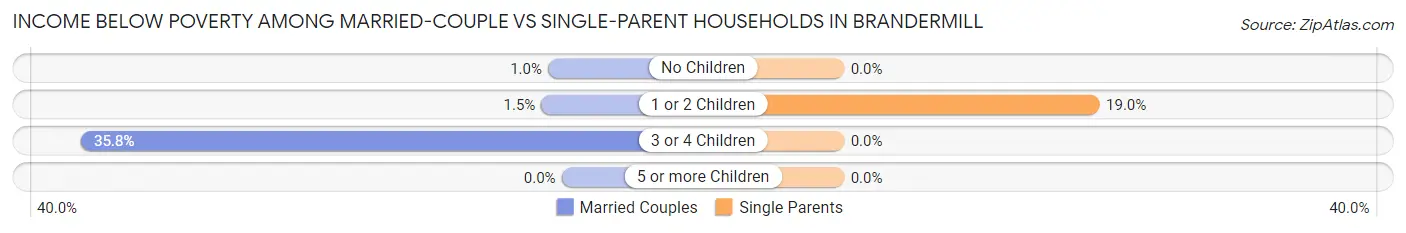
Income Below Poverty Among Married-Couple vs Single-Parent Households in Brandermill
The poverty data for Brandermill shows that 131 of the married-couple family households (4.1%) and 71 of the single-parent households (8.7%) are living below the poverty level. Within the married-couple family households, those with 3 or 4 children have the highest poverty rate, with 97 households (35.8%) falling below the poverty line. Among the single-parent households, those with 1 or 2 children have the highest poverty rate, with 71 household (19.0%) living below poverty.
| Children | Married-Couple Families | Single-Parent Households |
| No Children | 20 (1.0%) | 0 (0.0%) |
| 1 or 2 Children | 14 (1.5%) | 71 (19.0%) |
| 3 or 4 Children | 97 (35.8%) | 0 (0.0%) |
| 5 or more Children | 0 (0.0%) | 0 (0.0%) |
| Total | 131 (4.1%) | 71 (8.7%) |
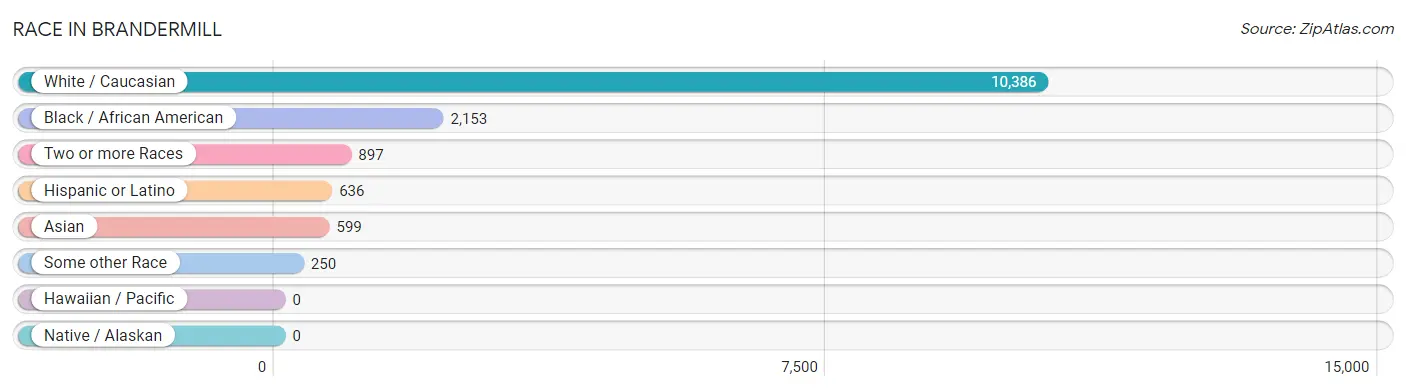
Race in Brandermill
The most populous races in Brandermill are White / Caucasian (10,386 | 72.7%), Black / African American (2,153 | 15.1%), and Two or more Races (897 | 6.3%).
| Race | # Population | % Population |
| Asian | 599 | 4.2% |
| Black / African American | 2,153 | 15.1% |
| Hawaiian / Pacific | 0 | 0.0% |
| Hispanic or Latino | 636 | 4.4% |
| Native / Alaskan | 0 | 0.0% |
| White / Caucasian | 10,386 | 72.7% |
| Two or more Races | 897 | 6.3% |
| Some other Race | 250 | 1.8% |
| Total | 14,285 | 100.0% |
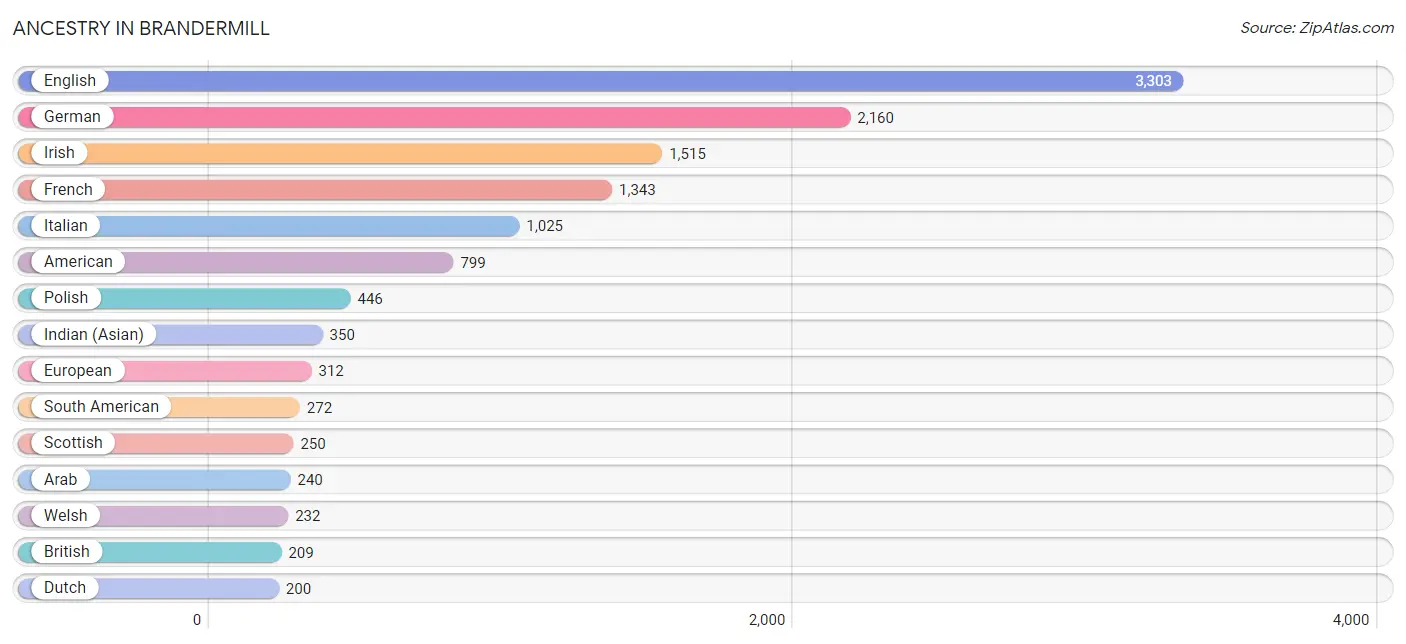
Ancestry in Brandermill
The most populous ancestries reported in Brandermill are English (3,303 | 23.1%), German (2,160 | 15.1%), Irish (1,515 | 10.6%), French (1,343 | 9.4%), and Italian (1,025 | 7.2%), together accounting for 65.4% of all Brandermill residents.
| Ancestry | # Population | % Population |
| American | 799 | 5.6% |
| Arab | 240 | 1.7% |
| Basque | 15 | 0.1% |
| Bhutanese | 82 | 0.6% |
| Blackfeet | 69 | 0.5% |
| Bolivian | 133 | 0.9% |
| Brazilian | 17 | 0.1% |
| British | 209 | 1.5% |
| Burmese | 93 | 0.6% |
| Canadian | 23 | 0.2% |
| Central American | 139 | 1.0% |
| Cherokee | 87 | 0.6% |
| Colombian | 26 | 0.2% |
| Costa Rican | 30 | 0.2% |
| Cuban | 20 | 0.1% |
| Czech | 17 | 0.1% |
| Czechoslovakian | 52 | 0.4% |
| Danish | 11 | 0.1% |
| Dutch | 200 | 1.4% |
| Eastern European | 13 | 0.1% |
| Ecuadorian | 79 | 0.5% |
| Egyptian | 118 | 0.8% |
| English | 3,303 | 23.1% |
| European | 312 | 2.2% |
| French | 1,343 | 9.4% |
| French Canadian | 69 | 0.5% |
| German | 2,160 | 15.1% |
| Greek | 154 | 1.1% |
| Honduran | 9 | 0.1% |
| Hungarian | 81 | 0.6% |
| Indian (Asian) | 350 | 2.5% |
| Indonesian | 45 | 0.3% |
| Irish | 1,515 | 10.6% |
| Israeli | 71 | 0.5% |
| Italian | 1,025 | 7.2% |
| Jamaican | 7 | 0.1% |
| Japanese | 19 | 0.1% |
| Lebanese | 60 | 0.4% |
| Lithuanian | 20 | 0.1% |
| Mexican | 85 | 0.6% |
| Nicaraguan | 14 | 0.1% |
| Northern European | 40 | 0.3% |
| Norwegian | 103 | 0.7% |
| Panamanian | 35 | 0.3% |
| Peruvian | 34 | 0.2% |
| Polish | 446 | 3.1% |
| Portuguese | 16 | 0.1% |
| Puerto Rican | 51 | 0.4% |
| Romanian | 32 | 0.2% |
| Russian | 83 | 0.6% |
| Salvadoran | 29 | 0.2% |
| Scandinavian | 94 | 0.7% |
| Scotch-Irish | 167 | 1.2% |
| Scottish | 250 | 1.8% |
| Slavic | 13 | 0.1% |
| Slovak | 13 | 0.1% |
| Slovene | 40 | 0.3% |
| South American | 272 | 1.9% |
| Spaniard | 69 | 0.5% |
| Subsaharan African | 16 | 0.1% |
| Swedish | 163 | 1.1% |
| Swiss | 58 | 0.4% |
| Thai | 28 | 0.2% |
| Turkish | 62 | 0.4% |
| U.S. Virgin Islander | 120 | 0.8% |
| Ukrainian | 19 | 0.1% |
| Welsh | 232 | 1.6% |
| Yugoslavian | 87 | 0.6% | View All 68 Rows |
Immigrants in Brandermill
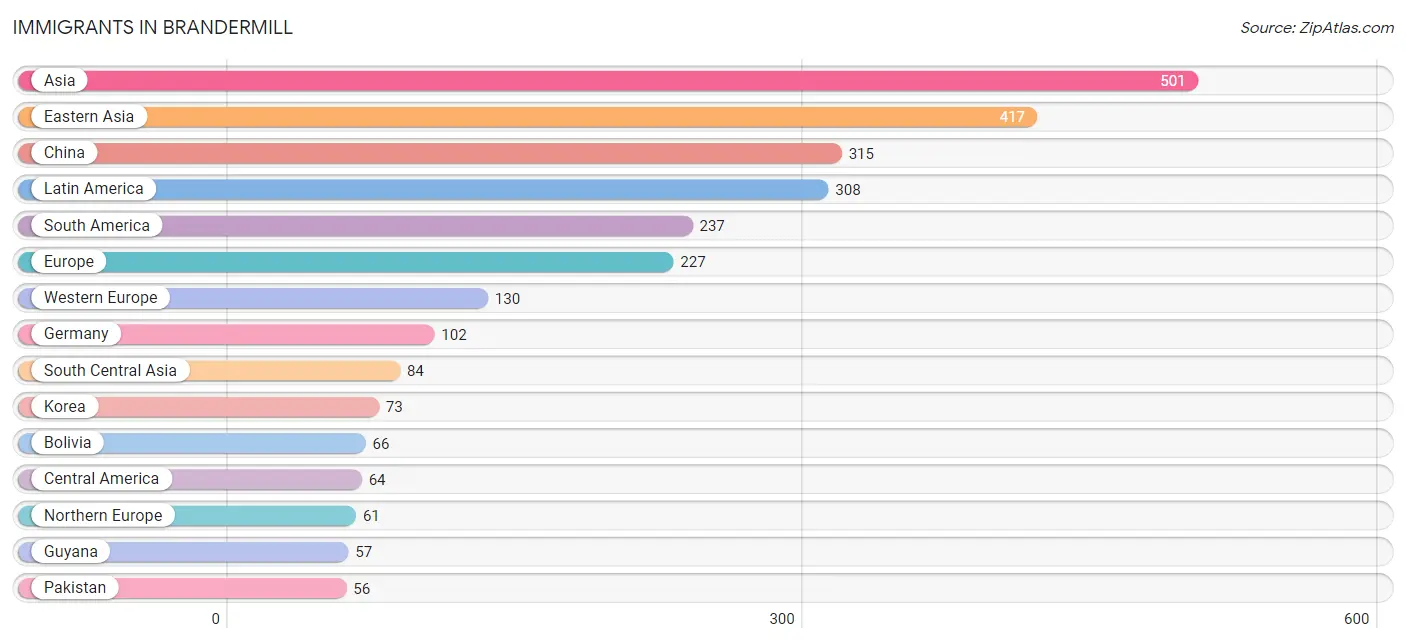
The most numerous immigrant groups reported in Brandermill came from Asia (501 | 3.5%), Eastern Asia (417 | 2.9%), China (315 | 2.2%), Latin America (308 | 2.2%), and South America (237 | 1.7%), together accounting for 12.5% of all Brandermill residents.
| Immigration Origin | # Population | % Population |
| Asia | 501 | 3.5% |
| Bolivia | 66 | 0.5% |
| Brazil | 33 | 0.2% |
| Canada | 16 | 0.1% |
| Caribbean | 7 | 0.1% |
| Central America | 64 | 0.4% |
| China | 315 | 2.2% |
| Colombia | 26 | 0.2% |
| Costa Rica | 4 | 0.0% |
| Eastern Asia | 417 | 2.9% |
| Eastern Europe | 36 | 0.3% |
| Ecuador | 21 | 0.2% |
| El Salvador | 29 | 0.2% |
| England | 33 | 0.2% |
| Europe | 227 | 1.6% |
| Germany | 102 | 0.7% |
| Guyana | 57 | 0.4% |
| India | 28 | 0.2% |
| Jamaica | 7 | 0.1% |
| Japan | 29 | 0.2% |
| Korea | 73 | 0.5% |
| Latin America | 308 | 2.2% |
| Netherlands | 28 | 0.2% |
| Nicaragua | 14 | 0.1% |
| Northern Europe | 61 | 0.4% |
| Pakistan | 56 | 0.4% |
| Panama | 17 | 0.1% |
| Peru | 34 | 0.2% |
| Romania | 16 | 0.1% |
| Russia | 20 | 0.1% |
| South America | 237 | 1.7% |
| South Central Asia | 84 | 0.6% |
| Sweden | 7 | 0.1% |
| Western Europe | 130 | 0.9% | View All 34 Rows |
Sex and Age in Brandermill
Sex and Age in Brandermill
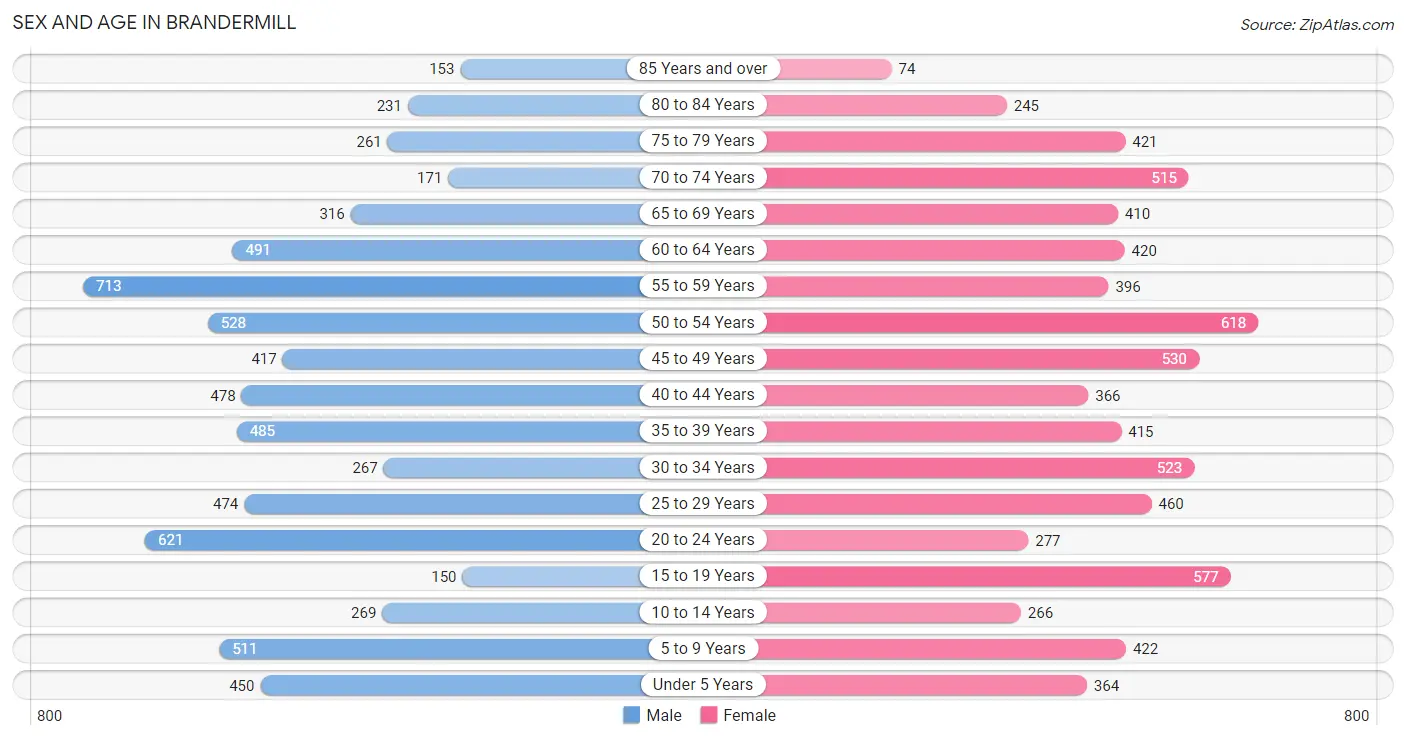
The most populous age groups in Brandermill are 55 to 59 Years (713 | 10.2%) for men and 50 to 54 Years (618 | 8.5%) for women.
| Age Bracket | Male | Female |
| Under 5 Years | 450 (6.4%) | 364 (5.0%) |
| 5 to 9 Years | 511 (7.3%) | 422 (5.8%) |
| 10 to 14 Years | 269 (3.8%) | 266 (3.6%) |
| 15 to 19 Years | 150 (2.1%) | 577 (7.9%) |
| 20 to 24 Years | 621 (8.9%) | 277 (3.8%) |
| 25 to 29 Years | 474 (6.8%) | 460 (6.3%) |
| 30 to 34 Years | 267 (3.8%) | 523 (7.2%) |
| 35 to 39 Years | 485 (6.9%) | 415 (5.7%) |
| 40 to 44 Years | 478 (6.8%) | 366 (5.0%) |
| 45 to 49 Years | 417 (6.0%) | 530 (7.3%) |
| 50 to 54 Years | 528 (7.6%) | 618 (8.5%) |
| 55 to 59 Years | 713 (10.2%) | 396 (5.4%) |
| 60 to 64 Years | 491 (7.0%) | 420 (5.8%) |
| 65 to 69 Years | 316 (4.5%) | 410 (5.6%) |
| 70 to 74 Years | 171 (2.5%) | 515 (7.1%) |
| 75 to 79 Years | 261 (3.7%) | 421 (5.8%) |
| 80 to 84 Years | 231 (3.3%) | 245 (3.4%) |
| 85 Years and over | 153 (2.2%) | 74 (1.0%) |
| Total | 6,986 (100.0%) | 7,299 (100.0%) |
Families and Households in Brandermill
Median Family Size in Brandermill
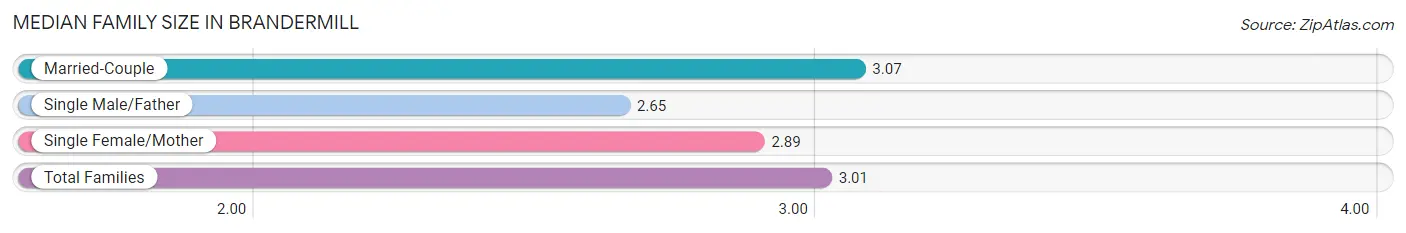
The median family size in Brandermill is 3.01 persons per family, with married-couple families (3,167 | 79.6%) accounting for the largest median family size of 3.07 persons per family. On the other hand, single male/father families (259 | 6.5%) represent the smallest median family size with 2.65 persons per family.
| Family Type | # Families | Family Size |
| Married-Couple | 3,167 (79.6%) | 3.07 |
| Single Male/Father | 259 (6.5%) | 2.65 |
| Single Female/Mother | 553 (13.9%) | 2.89 |
| Total Families | 3,979 (100.0%) | 3.01 |
Median Household Size in Brandermill
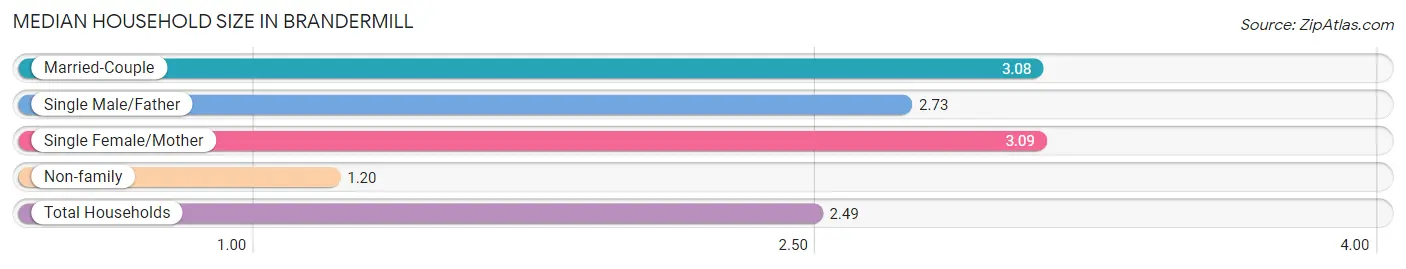
The median household size in Brandermill is 2.49 persons per household, with single female/mother households (553 | 9.6%) accounting for the largest median household size of 3.09 persons per household. non-family households (1,755 | 30.6%) represent the smallest median household size with 1.20 persons per household.
| Household Type | # Households | Household Size |
| Married-Couple | 3,167 (55.2%) | 3.08 |
| Single Male/Father | 259 (4.5%) | 2.73 |
| Single Female/Mother | 553 (9.6%) | 3.09 |
| Non-family | 1,755 (30.6%) | 1.20 |
| Total Households | 5,734 (100.0%) | 2.49 |
Household Size by Marriage Status in Brandermill
Out of a total of 5,734 households in Brandermill, 3,979 (69.4%) are family households, while 1,755 (30.6%) are nonfamily households. The most numerous type of family households are 2-person households, comprising 2,030, and the most common type of nonfamily households are 1-person households, comprising 1,485.
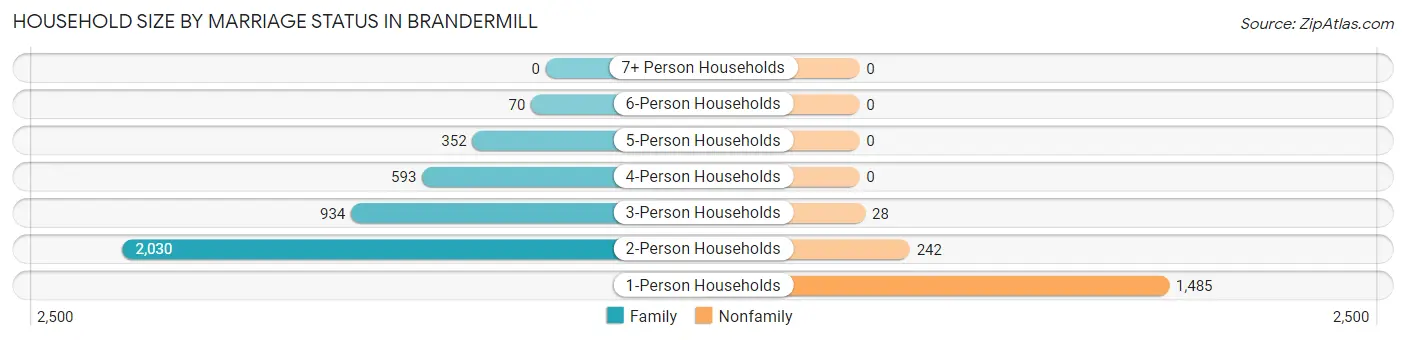
| Household Size | Family Households | Nonfamily Households |
| 1-Person Households | - | 1,485 (25.9%) |
| 2-Person Households | 2,030 (35.4%) | 242 (4.2%) |
| 3-Person Households | 934 (16.3%) | 28 (0.5%) |
| 4-Person Households | 593 (10.3%) | 0 (0.0%) |
| 5-Person Households | 352 (6.1%) | 0 (0.0%) |
| 6-Person Households | 70 (1.2%) | 0 (0.0%) |
| 7+ Person Households | 0 (0.0%) | 0 (0.0%) |
| Total | 3,979 (69.4%) | 1,755 (30.6%) |
Female Fertility in Brandermill
Fertility by Age in Brandermill
Average fertility rate in Brandermill is 45.0 births per 1,000 women. Women in the age bracket of 20 to 34 years have the highest fertility rate with 80.0 births per 1,000 women. Women in the age bracket of 20 to 34 years acount for 69.7% of all women with births.
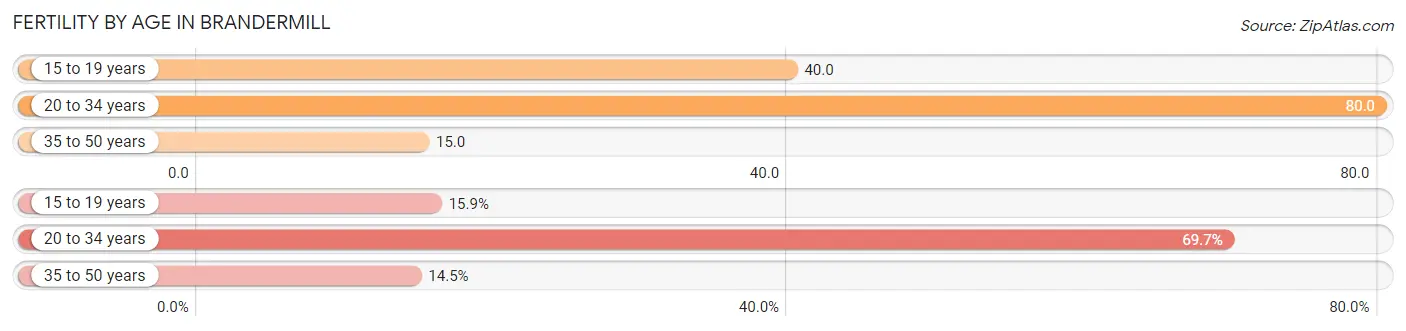
| Age Bracket | Women with Births | Births / 1,000 Women |
| 15 to 19 years | 23 (15.9%) | 40.0 |
| 20 to 34 years | 101 (69.7%) | 80.0 |
| 35 to 50 years | 21 (14.5%) | 15.0 |
| Total | 145 (100.0%) | 45.0 |
Fertility by Age by Marriage Status in Brandermill
66.2% of women with births (145) in Brandermill are married. The highest percentage of unmarried women with births falls into 15 to 19 years age bracket with 100.0% of them unmarried at the time of birth, while the lowest percentage of unmarried women with births belong to 35 to 50 years age bracket with 0.0% of them unmarried.
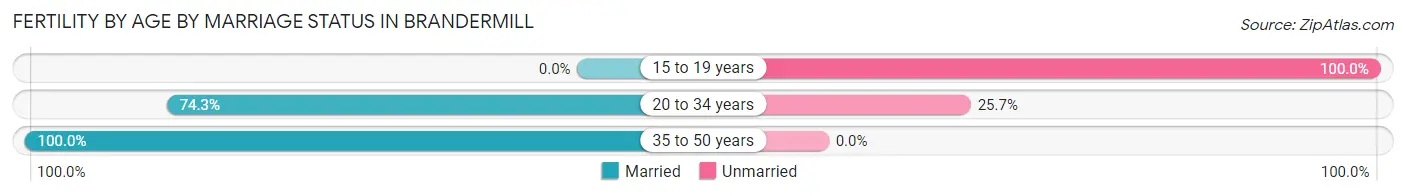
| Age Bracket | Married | Unmarried |
| 15 to 19 years | 0 (0.0%) | 23 (100.0%) |
| 20 to 34 years | 75 (74.3%) | 26 (25.7%) |
| 35 to 50 years | 21 (100.0%) | 0 (0.0%) |
| Total | 96 (66.2%) | 49 (33.8%) |
Fertility by Education in Brandermill
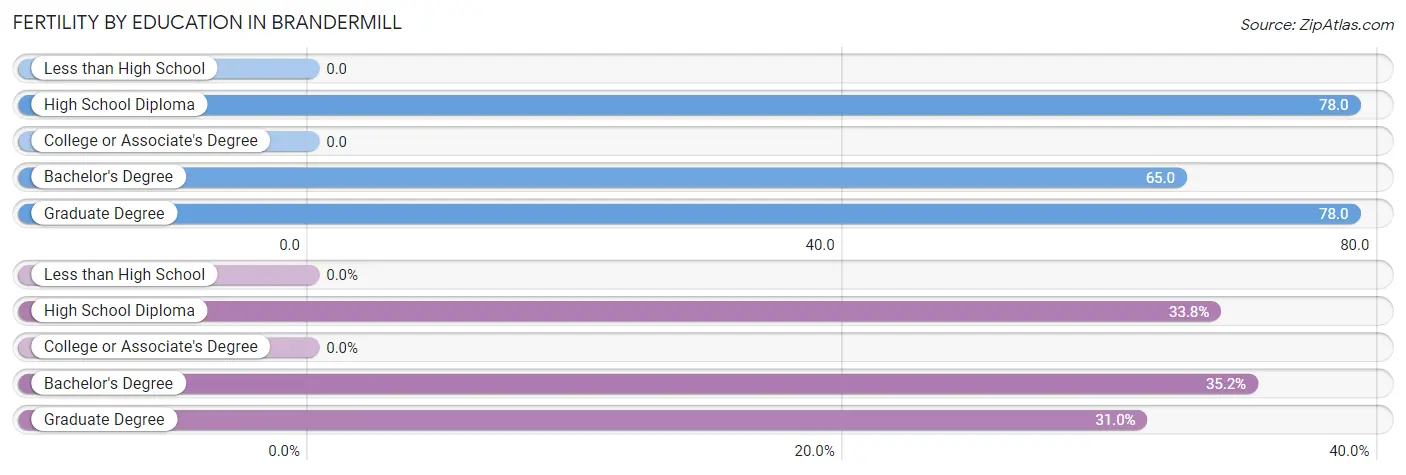
| Educational Attainment | Women with Births | Births / 1,000 Women |
| Less than High School | 0 (0.0%) | 0.0 |
| High School Diploma | 49 (33.8%) | 78.0 |
| College or Associate's Degree | 0 (0.0%) | 0.0 |
| Bachelor's Degree | 51 (35.2%) | 65.0 |
| Graduate Degree | 45 (31.0%) | 78.0 |
| Total | 145 (100.0%) | 45.0 |
Fertility by Education by Marriage Status in Brandermill
33.8% of women with births in Brandermill are unmarried. Women with the educational attainment of bachelor's degree are most likely to be married with 100.0% of them married at childbirth, while women with the educational attainment of high school diploma are least likely to be married with 100.0% of them unmarried at childbirth.
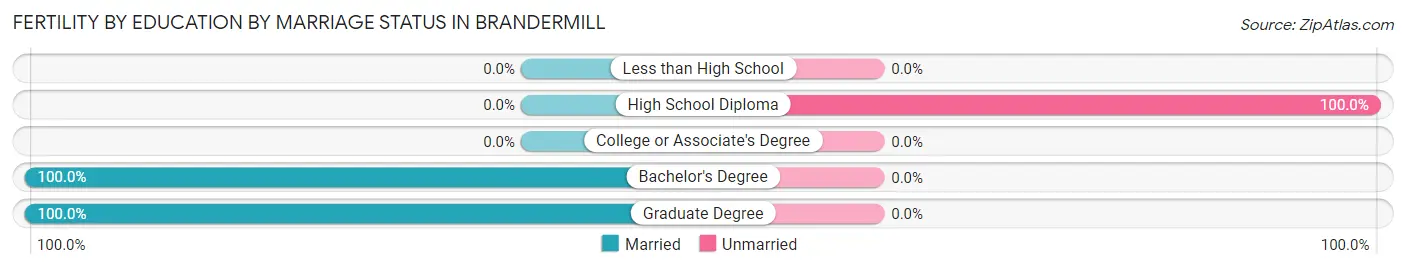
| Educational Attainment | Married | Unmarried |
| Less than High School | 0 (0.0%) | 0 (0.0%) |
| High School Diploma | 0 (0.0%) | 49 (100.0%) |
| College or Associate's Degree | 0 (0.0%) | 0 (0.0%) |
| Bachelor's Degree | 51 (100.0%) | 0 (0.0%) |
| Graduate Degree | 45 (100.0%) | 0 (0.0%) |
| Total | 96 (66.2%) | 49 (33.8%) |
Employment Characteristics in Brandermill
Employment by Class of Employer in Brandermill
Among the 7,764 employed individuals in Brandermill, private company employees (4,896 | 63.1%), not-for-profit organizations (822 | 10.6%), and local government employees (774 | 10.0%) make up the most common classes of employment.
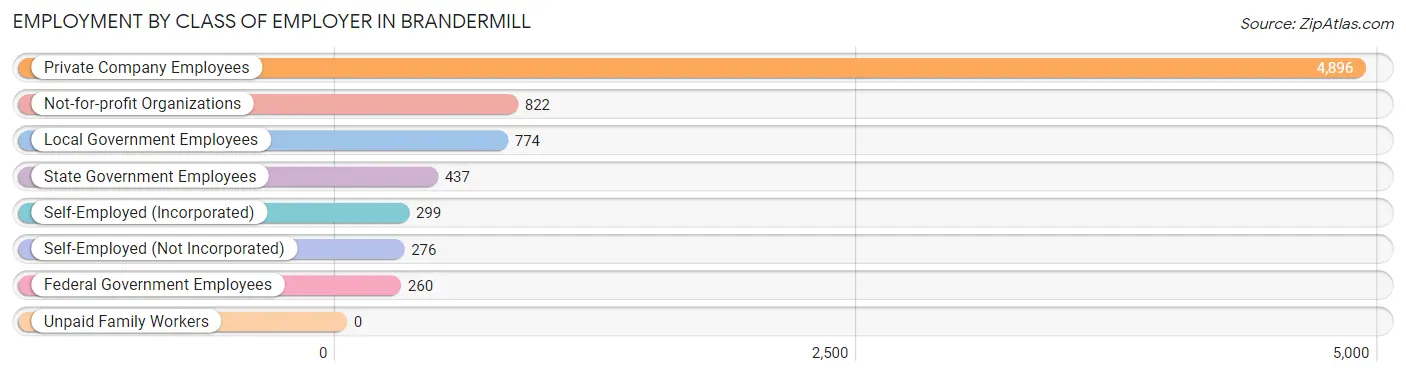
| Employer Class | # Employees | % Employees |
| Private Company Employees | 4,896 | 63.1% |
| Self-Employed (Incorporated) | 299 | 3.8% |
| Self-Employed (Not Incorporated) | 276 | 3.5% |
| Not-for-profit Organizations | 822 | 10.6% |
| Local Government Employees | 774 | 10.0% |
| State Government Employees | 437 | 5.6% |
| Federal Government Employees | 260 | 3.4% |
| Unpaid Family Workers | 0 | 0.0% |
| Total | 7,764 | 100.0% |
Employment Status by Age in Brandermill
According to the labor force statistics for Brandermill, out of the total population over 16 years of age (11,708), 69.4% or 8,125 individuals are in the labor force, with 4.2% or 341 of them unemployed. The age group with the highest labor force participation rate is 25 to 29 years, with 93.7% or 875 individuals in the labor force. Within the labor force, the 20 to 24 years age range has the highest percentage of unemployed individuals, with 19.8% or 158 of them being unemployed.
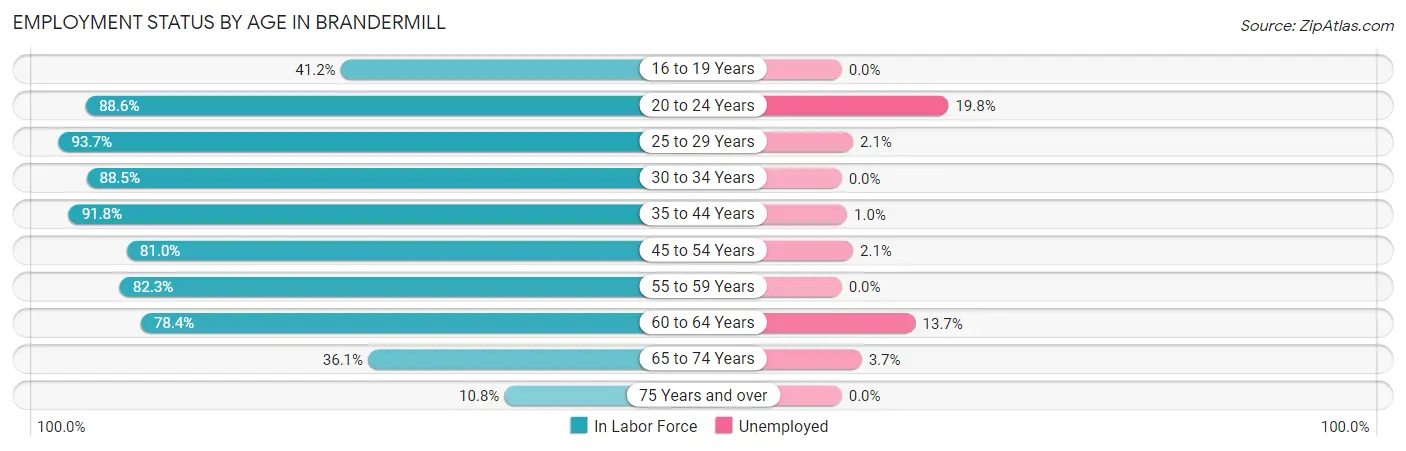
| Age Bracket | In Labor Force | Unemployed |
| 16 to 19 Years | 178 (41.2%) | 0 (0.0%) |
| 20 to 24 Years | 796 (88.6%) | 158 (19.8%) |
| 25 to 29 Years | 875 (93.7%) | 18 (2.1%) |
| 30 to 34 Years | 699 (88.5%) | 0 (0.0%) |
| 35 to 44 Years | 1,601 (91.8%) | 16 (1.0%) |
| 45 to 54 Years | 1,695 (81.0%) | 36 (2.1%) |
| 55 to 59 Years | 913 (82.3%) | 0 (0.0%) |
| 60 to 64 Years | 714 (78.4%) | 98 (13.7%) |
| 65 to 74 Years | 510 (36.1%) | 19 (3.7%) |
| 75 Years and over | 150 (10.8%) | 0 (0.0%) |
| Total | 8,125 (69.4%) | 341 (4.2%) |
Employment Status by Educational Attainment in Brandermill
According to labor force statistics for Brandermill, 85.7% of individuals (6,497) out of the total population between 25 and 64 years of age (7,581) are in the labor force, with 2.6% or 169 of them being unemployed. The group with the highest labor force participation rate are those with the educational attainment of bachelor's degree or higher, with 95.4% or 3,141 individuals in the labor force. Within the labor force, individuals with less than high school education have the highest percentage of unemployment, with 12.2% or 17 of them being unemployed.
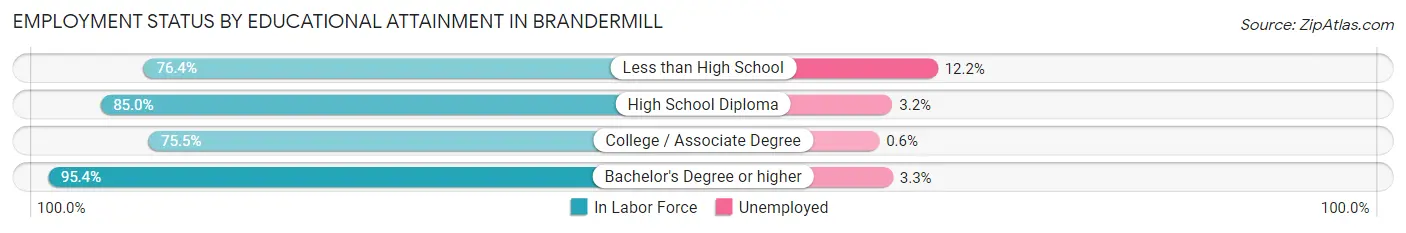
| Educational Attainment | In Labor Force | Unemployed |
| Less than High School | 139 (76.4%) | 22 (12.2%) |
| High School Diploma | 1,028 (85.0%) | 39 (3.2%) |
| College / Associate Degree | 2,188 (75.5%) | 17 (0.6%) |
| Bachelor's Degree or higher | 3,141 (95.4%) | 109 (3.3%) |
| Total | 6,497 (85.7%) | 197 (2.6%) |
Employment Occupations by Sex in Brandermill
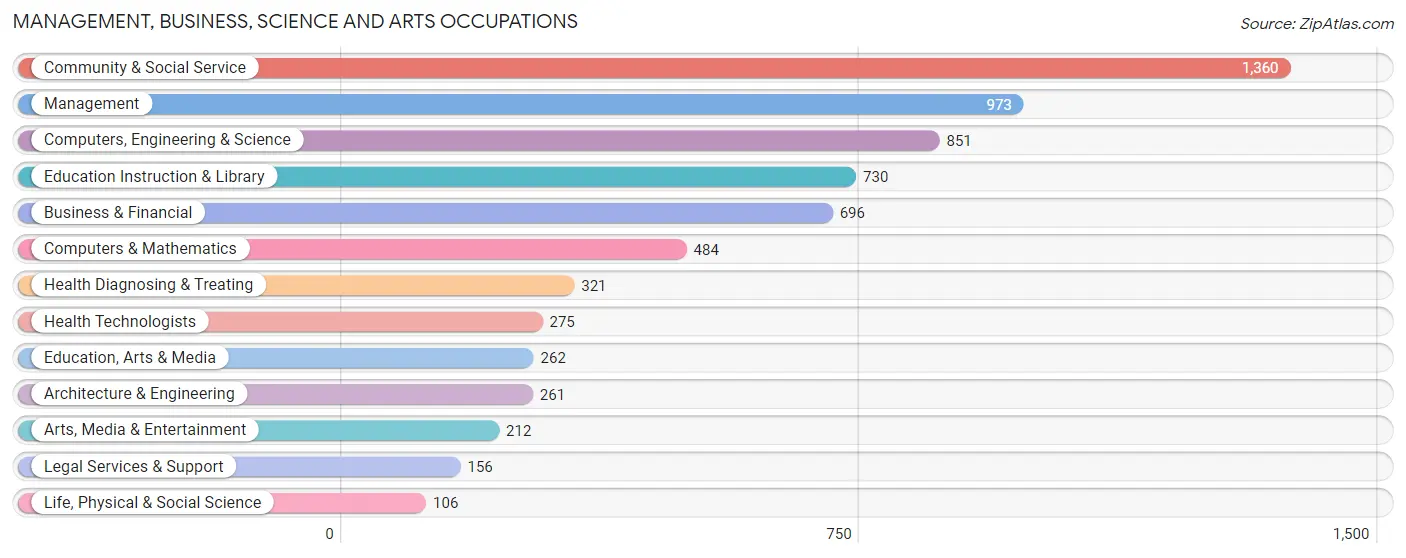
Management, Business, Science and Arts Occupations
The most common Management, Business, Science and Arts occupations in Brandermill are Community & Social Service (1,360 | 17.5%), Management (973 | 12.5%), Computers, Engineering & Science (851 | 10.9%), Education Instruction & Library (730 | 9.4%), and Business & Financial (696 | 8.9%).
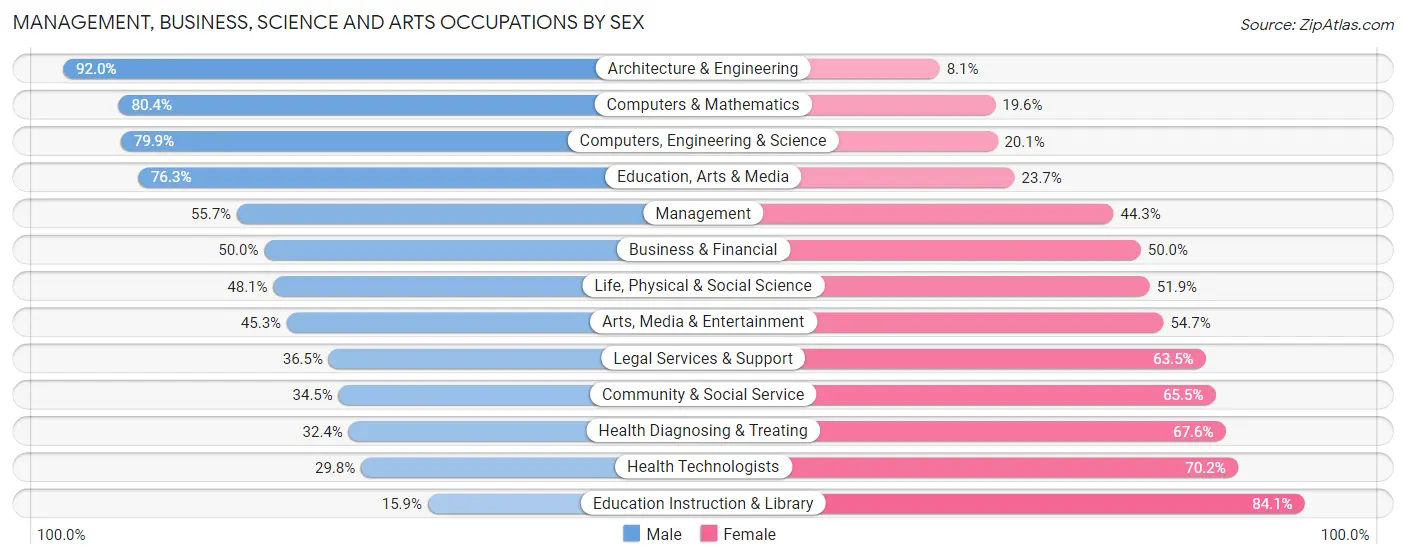
Management, Business, Science and Arts Occupations by Sex
Within the Management, Business, Science and Arts occupations in Brandermill, the most male-oriented occupations are Architecture & Engineering (91.9%), Computers & Mathematics (80.4%), and Computers, Engineering & Science (79.9%), while the most female-oriented occupations are Education Instruction & Library (84.1%), Health Technologists (70.2%), and Health Diagnosing & Treating (67.6%).
| Occupation | Male | Female |
| Management | 542 (55.7%) | 431 (44.3%) |
| Business & Financial | 348 (50.0%) | 348 (50.0%) |
| Computers, Engineering & Science | 680 (79.9%) | 171 (20.1%) |
| Computers & Mathematics | 389 (80.4%) | 95 (19.6%) |
| Architecture & Engineering | 240 (91.9%) | 21 (8.1%) |
| Life, Physical & Social Science | 51 (48.1%) | 55 (51.9%) |
| Community & Social Service | 469 (34.5%) | 891 (65.5%) |
| Education, Arts & Media | 200 (76.3%) | 62 (23.7%) |
| Legal Services & Support | 57 (36.5%) | 99 (63.5%) |
| Education Instruction & Library | 116 (15.9%) | 614 (84.1%) |
| Arts, Media & Entertainment | 96 (45.3%) | 116 (54.7%) |
| Health Diagnosing & Treating | 104 (32.4%) | 217 (67.6%) |
| Health Technologists | 82 (29.8%) | 193 (70.2%) |
| Total (Category) | 2,143 (51.0%) | 2,058 (49.0%) |
| Total (Overall) | 4,150 (53.3%) | 3,635 (46.7%) |
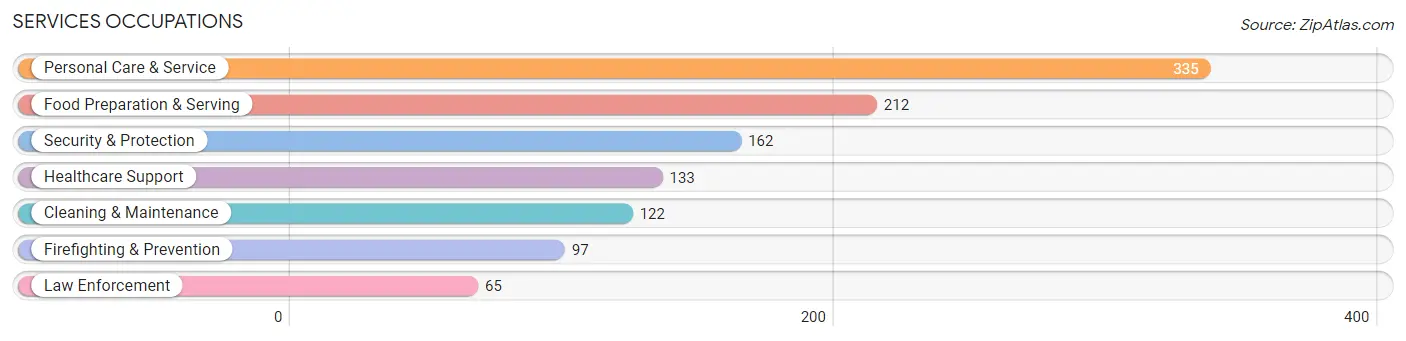
Services Occupations
The most common Services occupations in Brandermill are Personal Care & Service (335 | 4.3%), Food Preparation & Serving (212 | 2.7%), Security & Protection (162 | 2.1%), Healthcare Support (133 | 1.7%), and Cleaning & Maintenance (122 | 1.6%).
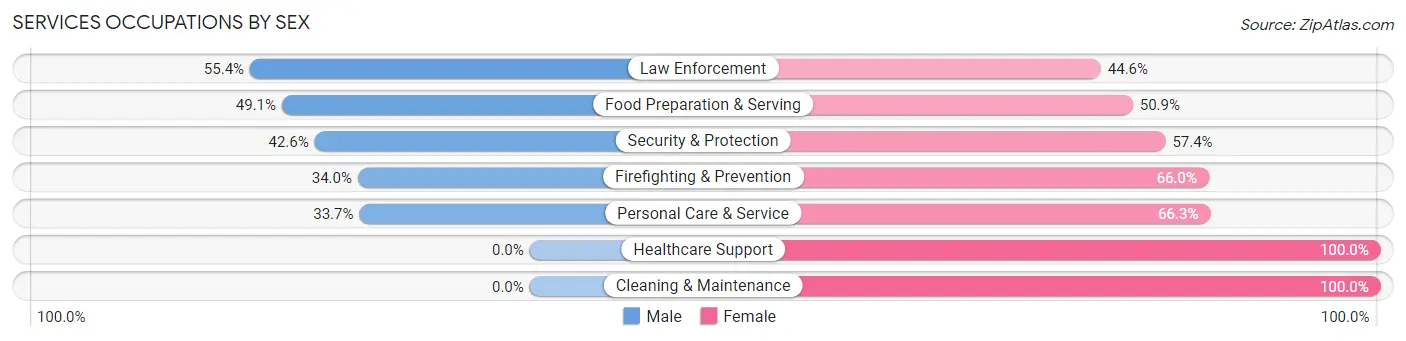
Services Occupations by Sex
Within the Services occupations in Brandermill, the most male-oriented occupations are Law Enforcement (55.4%), Food Preparation & Serving (49.1%), and Security & Protection (42.6%), while the most female-oriented occupations are Healthcare Support (100.0%), Cleaning & Maintenance (100.0%), and Personal Care & Service (66.3%).
| Occupation | Male | Female |
| Healthcare Support | 0 (0.0%) | 133 (100.0%) |
| Security & Protection | 69 (42.6%) | 93 (57.4%) |
| Firefighting & Prevention | 33 (34.0%) | 64 (66.0%) |
| Law Enforcement | 36 (55.4%) | 29 (44.6%) |
| Food Preparation & Serving | 104 (49.1%) | 108 (50.9%) |
| Cleaning & Maintenance | 0 (0.0%) | 122 (100.0%) |
| Personal Care & Service | 113 (33.7%) | 222 (66.3%) |
| Total (Category) | 286 (29.7%) | 678 (70.3%) |
| Total (Overall) | 4,150 (53.3%) | 3,635 (46.7%) |
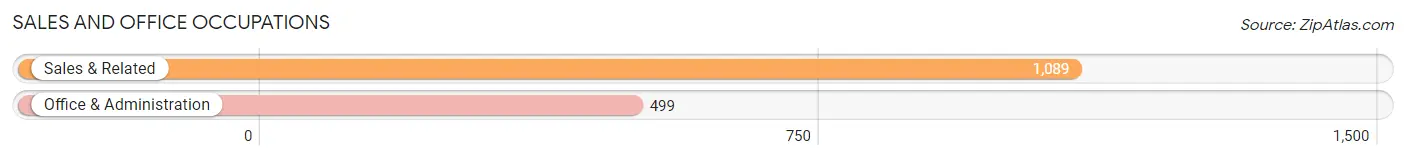
Sales and Office Occupations
The most common Sales and Office occupations in Brandermill are Sales & Related (1,089 | 14.0%), and Office & Administration (499 | 6.4%).
Sales and Office Occupations by Sex
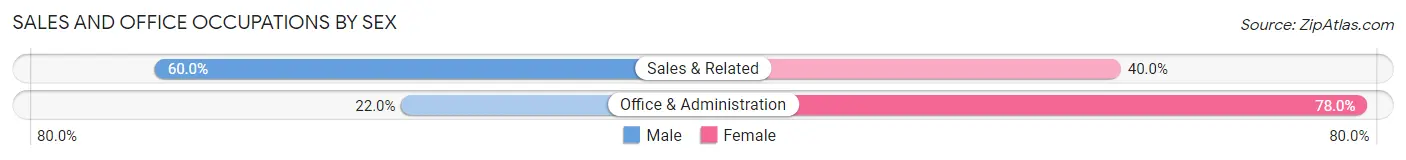
| Occupation | Male | Female |
| Sales & Related | 653 (60.0%) | 436 (40.0%) |
| Office & Administration | 110 (22.0%) | 389 (78.0%) |
| Total (Category) | 763 (48.0%) | 825 (51.9%) |
| Total (Overall) | 4,150 (53.3%) | 3,635 (46.7%) |
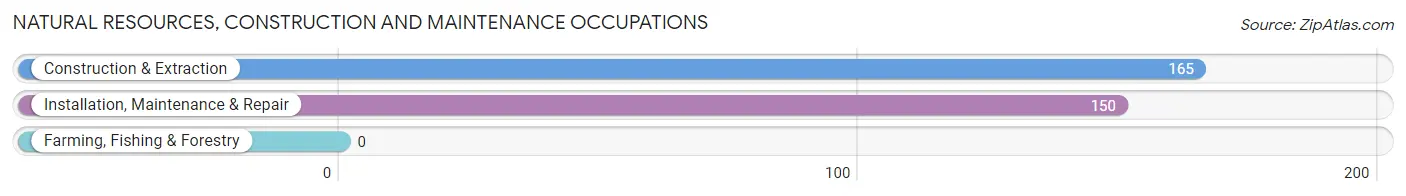
Natural Resources, Construction and Maintenance Occupations
The most common Natural Resources, Construction and Maintenance occupations in Brandermill are Construction & Extraction (165 | 2.1%), and Installation, Maintenance & Repair (150 | 1.9%).
Natural Resources, Construction and Maintenance Occupations by Sex
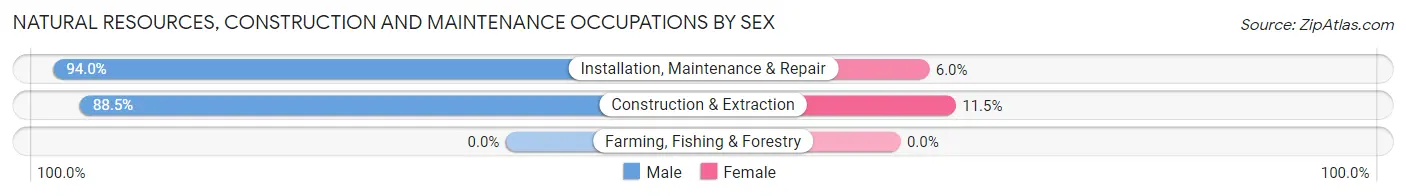
| Occupation | Male | Female |
| Farming, Fishing & Forestry | 0 (0.0%) | 0 (0.0%) |
| Construction & Extraction | 146 (88.5%) | 19 (11.5%) |
| Installation, Maintenance & Repair | 141 (94.0%) | 9 (6.0%) |
| Total (Category) | 287 (91.1%) | 28 (8.9%) |
| Total (Overall) | 4,150 (53.3%) | 3,635 (46.7%) |
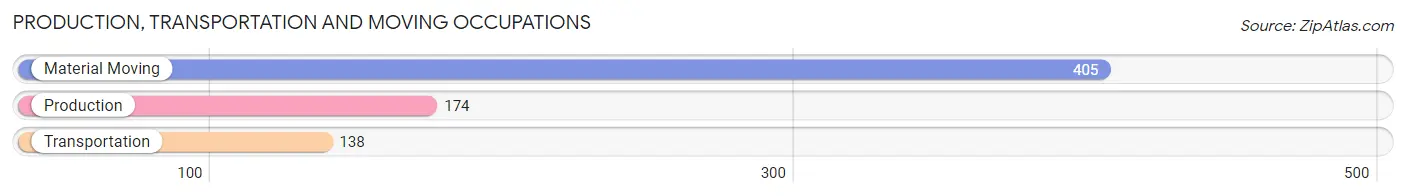
Production, Transportation and Moving Occupations
The most common Production, Transportation and Moving occupations in Brandermill are Material Moving (405 | 5.2%), Production (174 | 2.2%), and Transportation (138 | 1.8%).
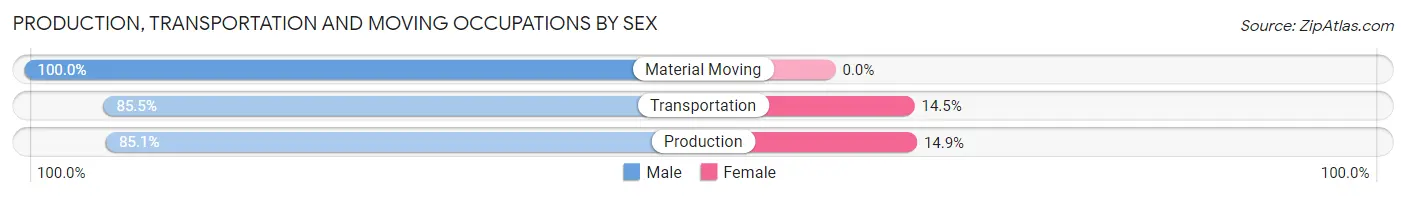
Production, Transportation and Moving Occupations by Sex
| Occupation | Male | Female |
| Production | 148 (85.1%) | 26 (14.9%) |
| Transportation | 118 (85.5%) | 20 (14.5%) |
| Material Moving | 405 (100.0%) | 0 (0.0%) |
| Total (Category) | 671 (93.6%) | 46 (6.4%) |
| Total (Overall) | 4,150 (53.3%) | 3,635 (46.7%) |
Employment Industries by Sex in Brandermill
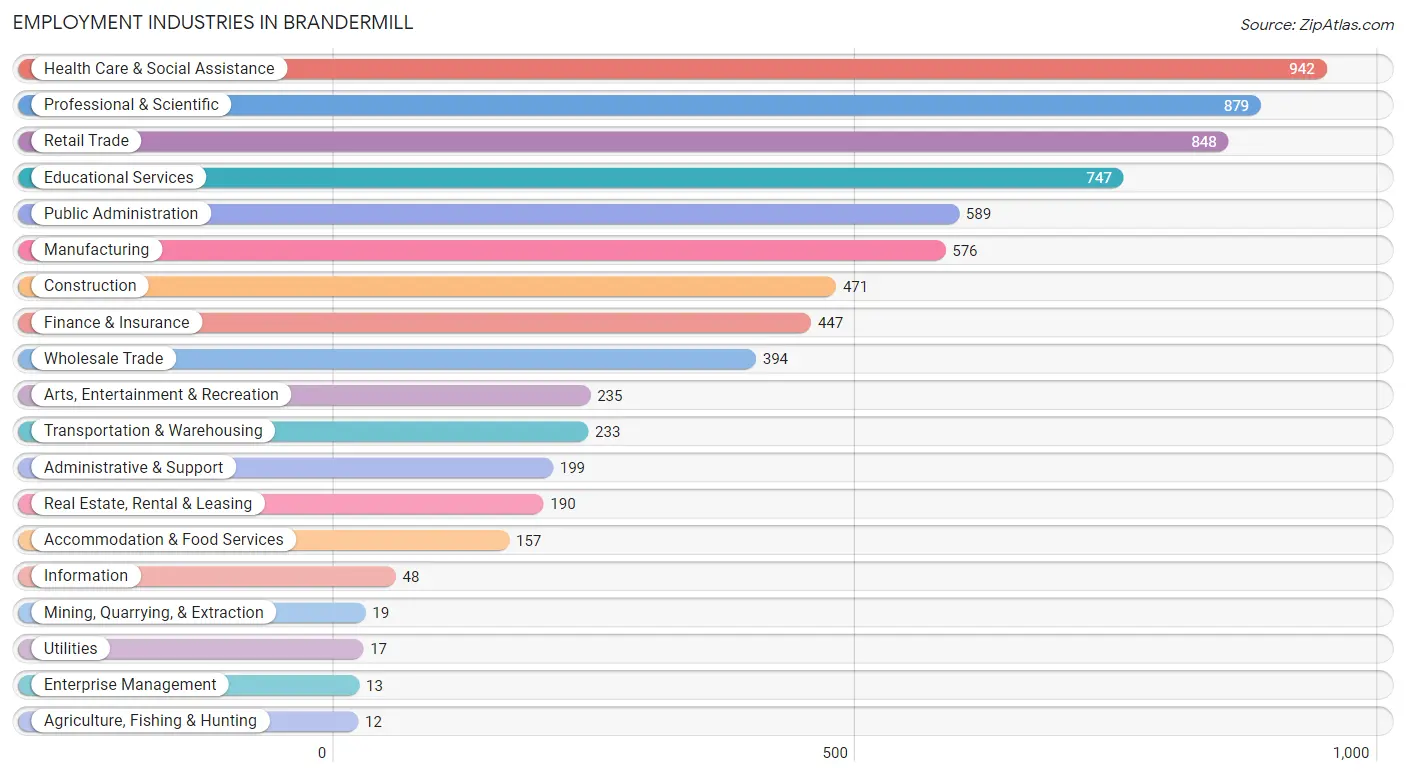
Employment Industries in Brandermill
The major employment industries in Brandermill include Health Care & Social Assistance (942 | 12.1%), Professional & Scientific (879 | 11.3%), Retail Trade (848 | 10.9%), Educational Services (747 | 9.6%), and Public Administration (589 | 7.6%).
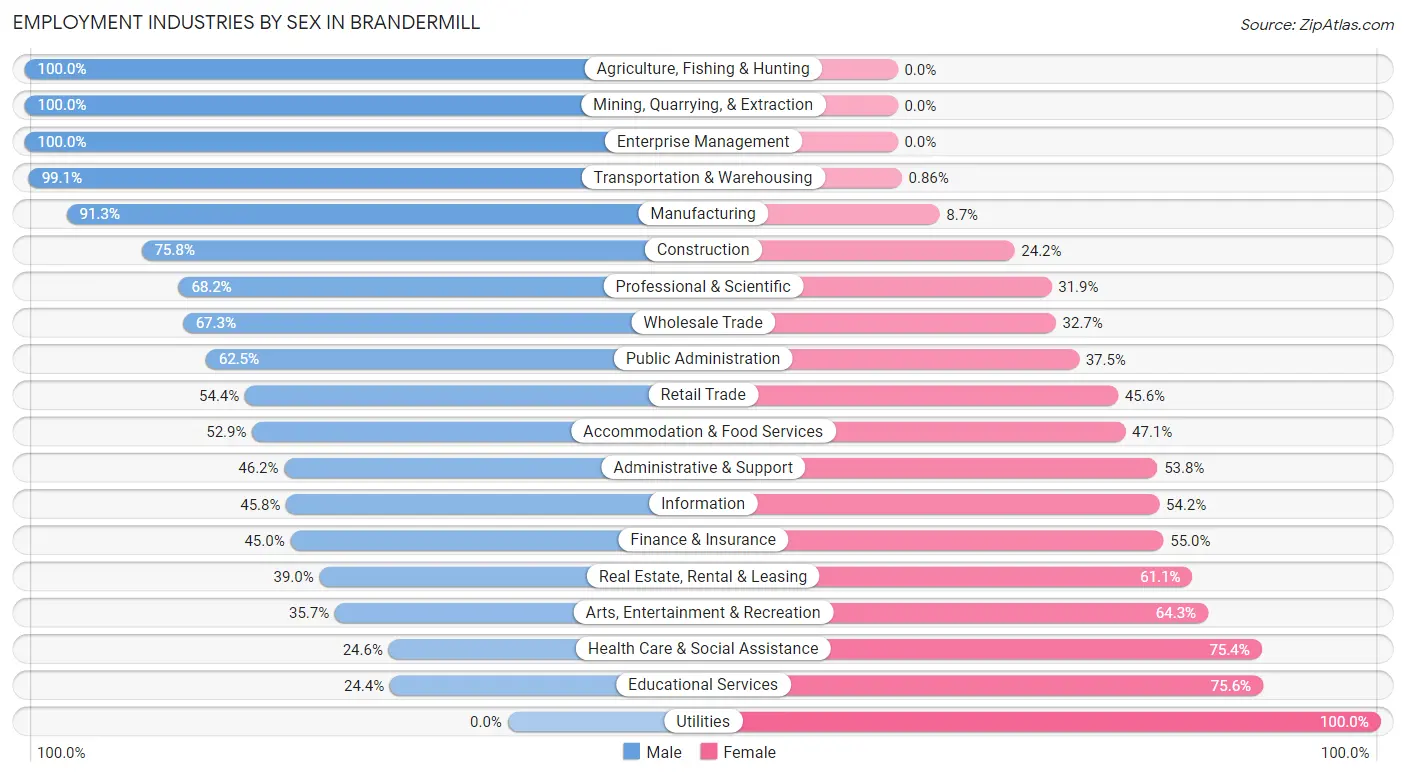
Employment Industries by Sex in Brandermill
The Brandermill industries that see more men than women are Agriculture, Fishing & Hunting (100.0%), Mining, Quarrying, & Extraction (100.0%), and Enterprise Management (100.0%), whereas the industries that tend to have a higher number of women are Utilities (100.0%), Educational Services (75.6%), and Health Care & Social Assistance (75.4%).
| Industry | Male | Female |
| Agriculture, Fishing & Hunting | 12 (100.0%) | 0 (0.0%) |
| Mining, Quarrying, & Extraction | 19 (100.0%) | 0 (0.0%) |
| Construction | 357 (75.8%) | 114 (24.2%) |
| Manufacturing | 526 (91.3%) | 50 (8.7%) |
| Wholesale Trade | 265 (67.3%) | 129 (32.7%) |
| Retail Trade | 461 (54.4%) | 387 (45.6%) |
| Transportation & Warehousing | 231 (99.1%) | 2 (0.9%) |
| Utilities | 0 (0.0%) | 17 (100.0%) |
| Information | 22 (45.8%) | 26 (54.2%) |
| Finance & Insurance | 201 (45.0%) | 246 (55.0%) |
| Real Estate, Rental & Leasing | 74 (39.0%) | 116 (61.1%) |
| Professional & Scientific | 599 (68.1%) | 280 (31.9%) |
| Enterprise Management | 13 (100.0%) | 0 (0.0%) |
| Administrative & Support | 92 (46.2%) | 107 (53.8%) |
| Educational Services | 182 (24.4%) | 565 (75.6%) |
| Health Care & Social Assistance | 232 (24.6%) | 710 (75.4%) |
| Arts, Entertainment & Recreation | 84 (35.7%) | 151 (64.3%) |
| Accommodation & Food Services | 83 (52.9%) | 74 (47.1%) |
| Public Administration | 368 (62.5%) | 221 (37.5%) |
| Total | 4,150 (53.3%) | 3,635 (46.7%) |
Education in Brandermill
School Enrollment in Brandermill
The most common levels of schooling among the 2,228 students in Brandermill are high school (670 | 30.1%), elementary school (502 | 22.5%), and college / undergraduate (473 | 21.2%).
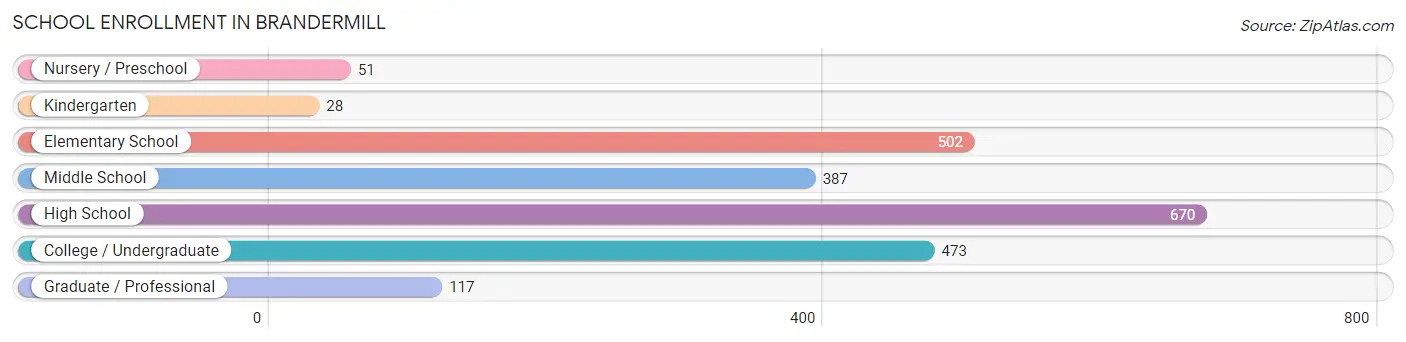
| School Level | # Students | % Students |
| Nursery / Preschool | 51 | 2.3% |
| Kindergarten | 28 | 1.3% |
| Elementary School | 502 | 22.5% |
| Middle School | 387 | 17.4% |
| High School | 670 | 30.1% |
| College / Undergraduate | 473 | 21.2% |
| Graduate / Professional | 117 | 5.2% |
| Total | 2,228 | 100.0% |
School Enrollment by Age by Funding Source in Brandermill
Out of a total of 2,228 students who are enrolled in schools in Brandermill, 281 (12.6%) attend a private institution, while the remaining 1,947 (87.4%) are enrolled in public schools. The age group of 3 to 4 year olds has the highest likelihood of being enrolled in private schools, with 38 (100.0% in the age bracket) enrolled. Conversely, the age group of 5 to 9 year old has the lowest likelihood of being enrolled in a private school, with 487 (97.4% in the age bracket) attending a public institution.
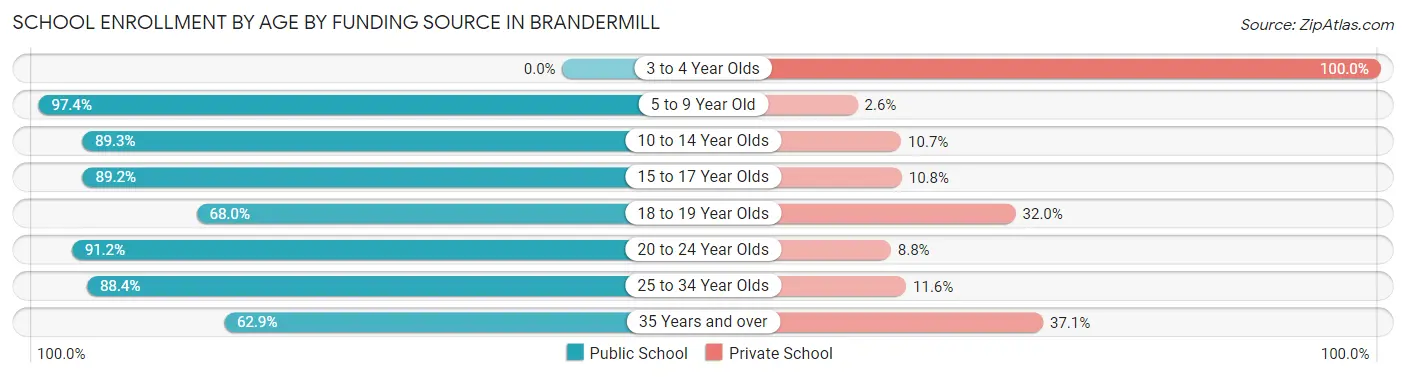
| Age Bracket | Public School | Private School |
| 3 to 4 Year Olds | 0 (0.0%) | 38 (100.0%) |
| 5 to 9 Year Old | 487 (97.4%) | 13 (2.6%) |
| 10 to 14 Year Olds | 467 (89.3%) | 56 (10.7%) |
| 15 to 17 Year Olds | 437 (89.2%) | 53 (10.8%) |
| 18 to 19 Year Olds | 104 (68.0%) | 49 (32.0%) |
| 20 to 24 Year Olds | 218 (91.2%) | 21 (8.8%) |
| 25 to 34 Year Olds | 190 (88.4%) | 25 (11.6%) |
| 35 Years and over | 44 (62.9%) | 26 (37.1%) |
| Total | 1,947 (87.4%) | 281 (12.6%) |
Educational Attainment by Field of Study in Brandermill
Business (973 | 19.2%), education (695 | 13.7%), social sciences (504 | 10.0%), psychology (405 | 8.0%), and engineering (398 | 7.9%) are the most common fields of study among 5,066 individuals in Brandermill who have obtained a bachelor's degree or higher.
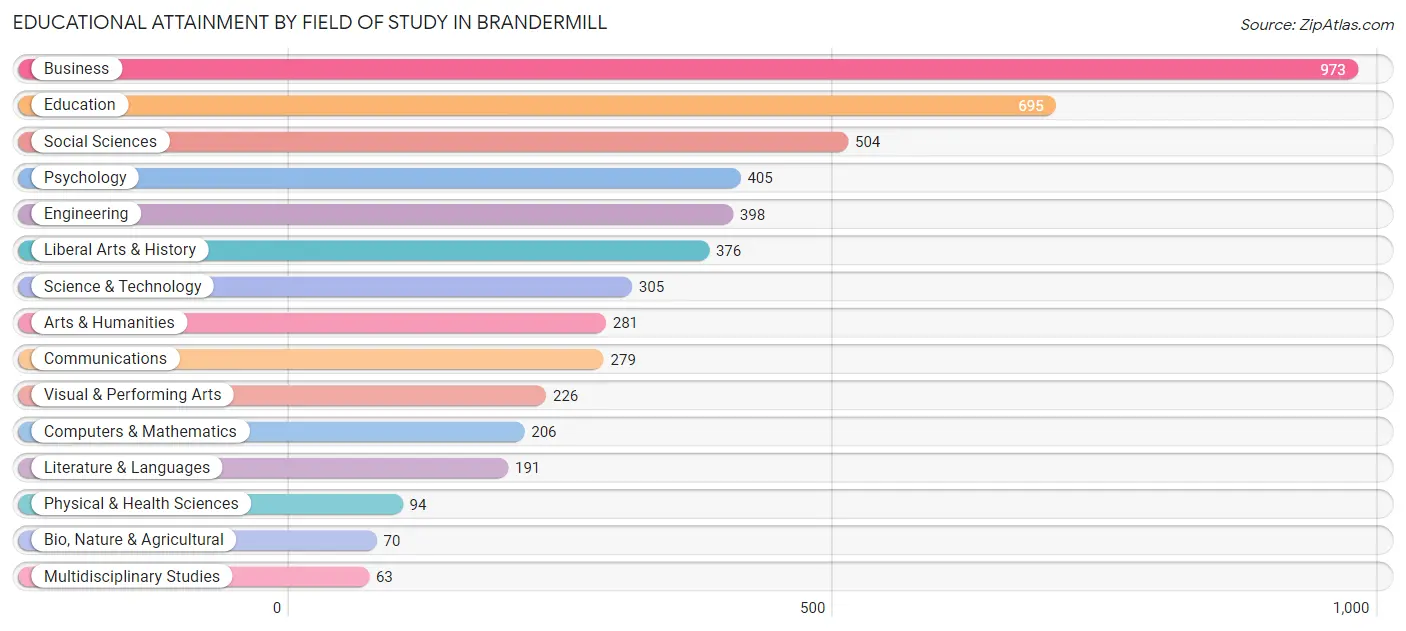
| Field of Study | # Graduates | % Graduates |
| Computers & Mathematics | 206 | 4.1% |
| Bio, Nature & Agricultural | 70 | 1.4% |
| Physical & Health Sciences | 94 | 1.9% |
| Psychology | 405 | 8.0% |
| Social Sciences | 504 | 10.0% |
| Engineering | 398 | 7.9% |
| Multidisciplinary Studies | 63 | 1.2% |
| Science & Technology | 305 | 6.0% |
| Business | 973 | 19.2% |
| Education | 695 | 13.7% |
| Literature & Languages | 191 | 3.8% |
| Liberal Arts & History | 376 | 7.4% |
| Visual & Performing Arts | 226 | 4.5% |
| Communications | 279 | 5.5% |
| Arts & Humanities | 281 | 5.6% |
| Total | 5,066 | 100.0% |
Transportation & Commute in Brandermill
Vehicle Availability by Sex in Brandermill
The most prevalent vehicle ownership categories in Brandermill are males with 2 vehicles (2,052, accounting for 49.4%) and females with 2 vehicles (1,484, making up 56.8%).
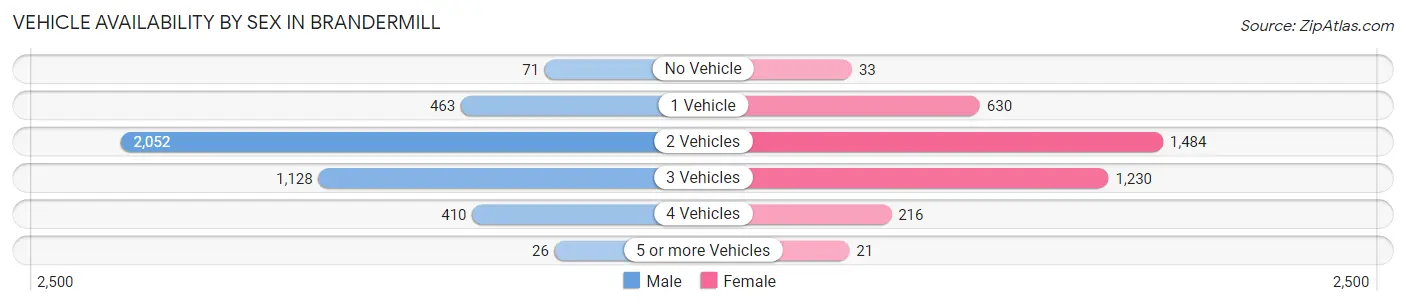
| Vehicles Available | Male | Female |
| No Vehicle | 71 (1.7%) | 33 (0.9%) |
| 1 Vehicle | 463 (11.2%) | 630 (17.4%) |
| 2 Vehicles | 2,052 (49.4%) | 1,484 (41.1%) |
| 3 Vehicles | 1,128 (27.2%) | 1,230 (34.0%) |
| 4 Vehicles | 410 (9.9%) | 216 (6.0%) |
| 5 or more Vehicles | 26 (0.6%) | 21 (0.6%) |
| Total | 4,150 (100.0%) | 3,614 (100.0%) |
Commute Time in Brandermill
The most frequently occuring commute durations in Brandermill are 30 to 34 minutes (1,297 commuters, 20.2%), 20 to 24 minutes (1,123 commuters, 17.4%), and 15 to 19 minutes (801 commuters, 12.4%).
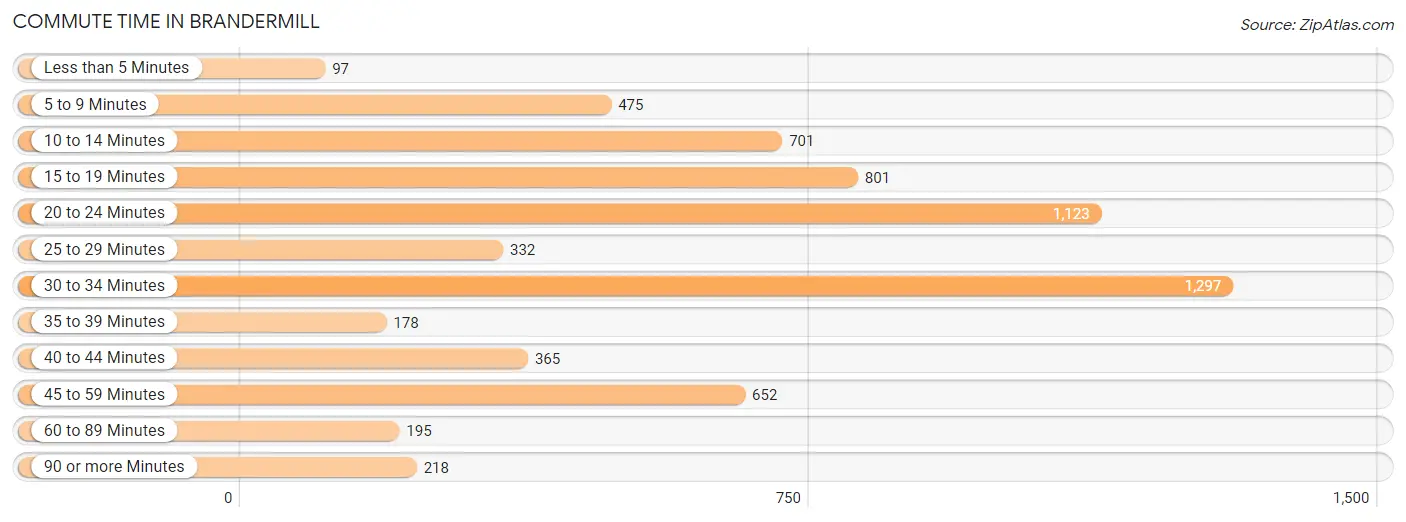
| Commute Time | # Commuters | % Commuters |
| Less than 5 Minutes | 97 | 1.5% |
| 5 to 9 Minutes | 475 | 7.4% |
| 10 to 14 Minutes | 701 | 10.9% |
| 15 to 19 Minutes | 801 | 12.4% |
| 20 to 24 Minutes | 1,123 | 17.4% |
| 25 to 29 Minutes | 332 | 5.2% |
| 30 to 34 Minutes | 1,297 | 20.2% |
| 35 to 39 Minutes | 178 | 2.8% |
| 40 to 44 Minutes | 365 | 5.7% |
| 45 to 59 Minutes | 652 | 10.1% |
| 60 to 89 Minutes | 195 | 3.0% |
| 90 or more Minutes | 218 | 3.4% |
Commute Time by Sex in Brandermill
The most common commute times in Brandermill are 30 to 34 minutes (822 commuters, 24.6%) for males and 10 to 14 minutes (538 commuters, 17.4%) for females.
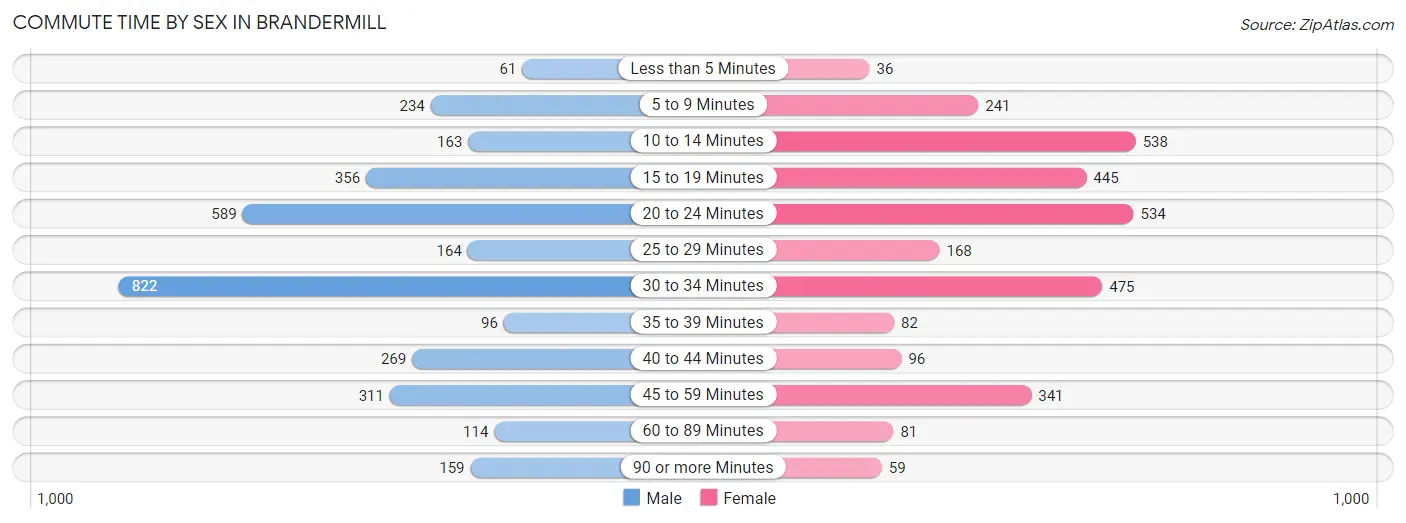
| Commute Time | Male | Female |
| Less than 5 Minutes | 61 (1.8%) | 36 (1.2%) |
| 5 to 9 Minutes | 234 (7.0%) | 241 (7.8%) |
| 10 to 14 Minutes | 163 (4.9%) | 538 (17.4%) |
| 15 to 19 Minutes | 356 (10.7%) | 445 (14.4%) |
| 20 to 24 Minutes | 589 (17.6%) | 534 (17.2%) |
| 25 to 29 Minutes | 164 (4.9%) | 168 (5.4%) |
| 30 to 34 Minutes | 822 (24.6%) | 475 (15.3%) |
| 35 to 39 Minutes | 96 (2.9%) | 82 (2.6%) |
| 40 to 44 Minutes | 269 (8.1%) | 96 (3.1%) |
| 45 to 59 Minutes | 311 (9.3%) | 341 (11.0%) |
| 60 to 89 Minutes | 114 (3.4%) | 81 (2.6%) |
| 90 or more Minutes | 159 (4.8%) | 59 (1.9%) |
Time of Departure to Work by Sex in Brandermill
The most frequent times of departure to work in Brandermill are 6:30 AM to 6:59 AM (649, 19.4%) for males and 7:30 AM to 7:59 AM (591, 19.1%) for females.
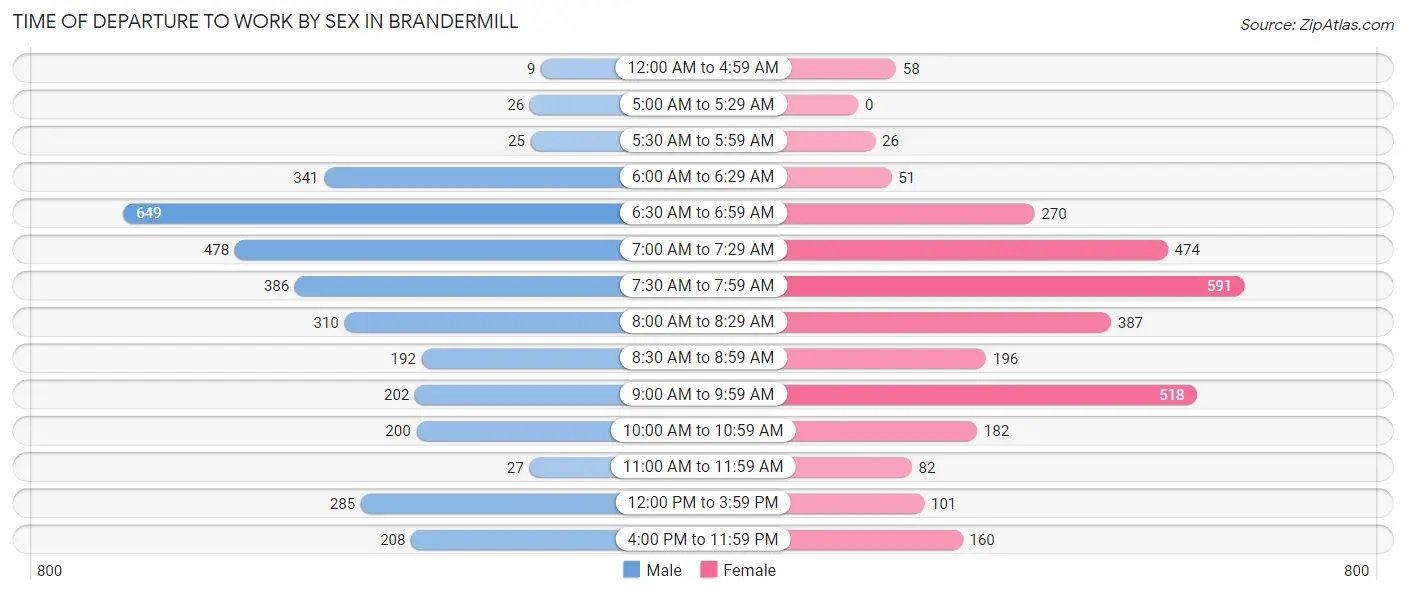
| Time of Departure | Male | Female |
| 12:00 AM to 4:59 AM | 9 (0.3%) | 58 (1.9%) |
| 5:00 AM to 5:29 AM | 26 (0.8%) | 0 (0.0%) |
| 5:30 AM to 5:59 AM | 25 (0.7%) | 26 (0.8%) |
| 6:00 AM to 6:29 AM | 341 (10.2%) | 51 (1.7%) |
| 6:30 AM to 6:59 AM | 649 (19.4%) | 270 (8.7%) |
| 7:00 AM to 7:29 AM | 478 (14.3%) | 474 (15.3%) |
| 7:30 AM to 7:59 AM | 386 (11.6%) | 591 (19.1%) |
| 8:00 AM to 8:29 AM | 310 (9.3%) | 387 (12.5%) |
| 8:30 AM to 8:59 AM | 192 (5.8%) | 196 (6.3%) |
| 9:00 AM to 9:59 AM | 202 (6.0%) | 518 (16.7%) |
| 10:00 AM to 10:59 AM | 200 (6.0%) | 182 (5.9%) |
| 11:00 AM to 11:59 AM | 27 (0.8%) | 82 (2.6%) |
| 12:00 PM to 3:59 PM | 285 (8.5%) | 101 (3.3%) |
| 4:00 PM to 11:59 PM | 208 (6.2%) | 160 (5.2%) |
| Total | 3,338 (100.0%) | 3,096 (100.0%) |
Housing Occupancy in Brandermill
Occupancy by Ownership in Brandermill
Of the total 5,734 dwellings in Brandermill, owner-occupied units account for 4,045 (70.5%), while renter-occupied units make up 1,689 (29.5%).
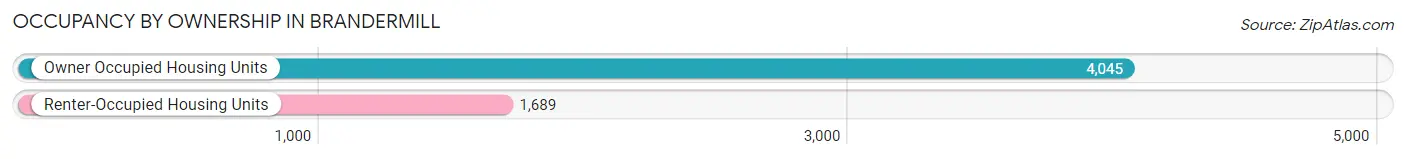
| Occupancy | # Housing Units | % Housing Units |
| Owner Occupied Housing Units | 4,045 | 70.5% |
| Renter-Occupied Housing Units | 1,689 | 29.5% |
| Total Occupied Housing Units | 5,734 | 100.0% |
Occupancy by Household Size in Brandermill
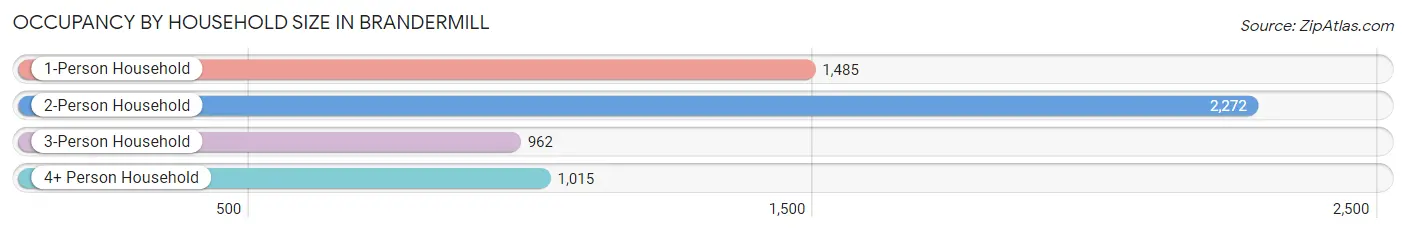
| Household Size | # Housing Units | % Housing Units |
| 1-Person Household | 1,485 | 25.9% |
| 2-Person Household | 2,272 | 39.6% |
| 3-Person Household | 962 | 16.8% |
| 4+ Person Household | 1,015 | 17.7% |
| Total Housing Units | 5,734 | 100.0% |
Occupancy by Ownership by Household Size in Brandermill
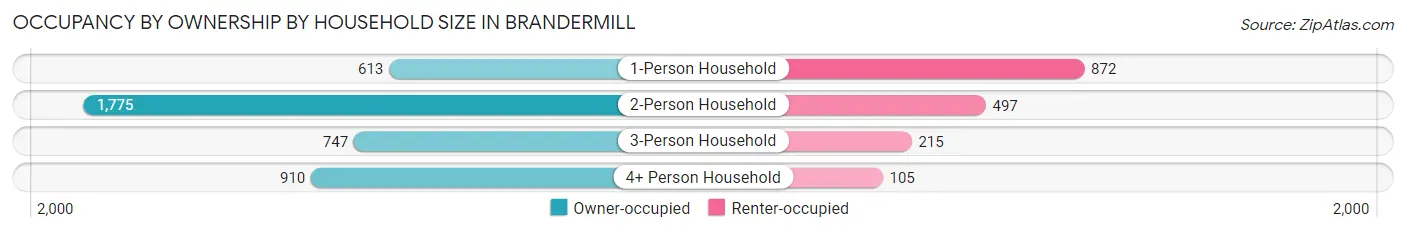
| Household Size | Owner-occupied | Renter-occupied |
| 1-Person Household | 613 (41.3%) | 872 (58.7%) |
| 2-Person Household | 1,775 (78.1%) | 497 (21.9%) |
| 3-Person Household | 747 (77.6%) | 215 (22.4%) |
| 4+ Person Household | 910 (89.7%) | 105 (10.3%) |
| Total Housing Units | 4,045 (70.5%) | 1,689 (29.5%) |
Occupancy by Educational Attainment in Brandermill
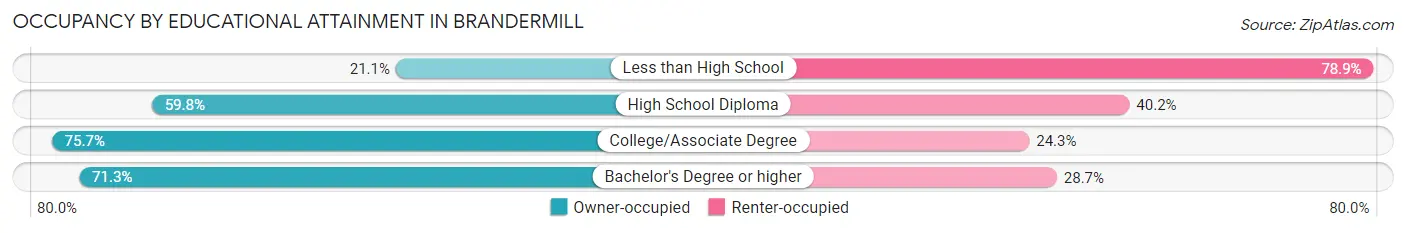
| Household Size | Owner-occupied | Renter-occupied |
| Less than High School | 15 (21.1%) | 56 (78.9%) |
| High School Diploma | 490 (59.8%) | 329 (40.2%) |
| College/Associate Degree | 1,462 (75.7%) | 469 (24.3%) |
| Bachelor's Degree or higher | 2,078 (71.3%) | 835 (28.7%) |
Occupancy by Age of Householder in Brandermill
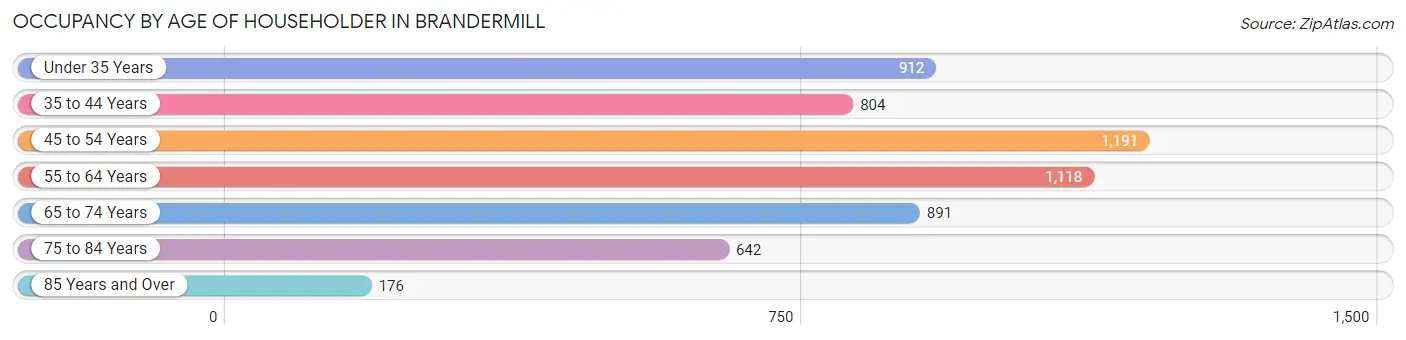
| Age Bracket | # Households | % Households |
| Under 35 Years | 912 | 15.9% |
| 35 to 44 Years | 804 | 14.0% |
| 45 to 54 Years | 1,191 | 20.8% |
| 55 to 64 Years | 1,118 | 19.5% |
| 65 to 74 Years | 891 | 15.5% |
| 75 to 84 Years | 642 | 11.2% |
| 85 Years and Over | 176 | 3.1% |
| Total | 5,734 | 100.0% |
Housing Finances in Brandermill
Median Income by Occupancy in Brandermill
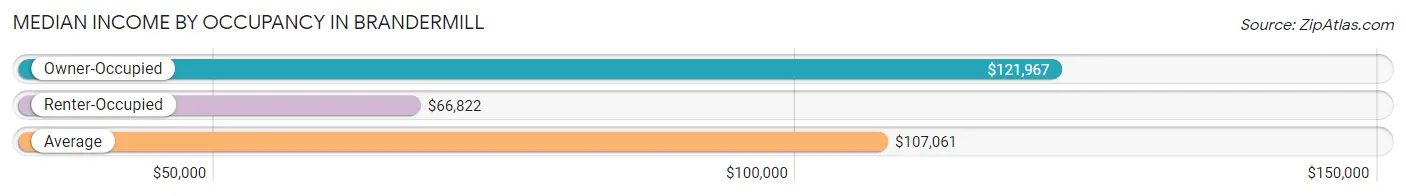
| Occupancy Type | # Households | Median Income |
| Owner-Occupied | 4,045 (70.5%) | $121,967 |
| Renter-Occupied | 1,689 (29.5%) | $66,822 |
| Average | 5,734 (100.0%) | $107,061 |
Occupancy by Householder Income Bracket in Brandermill
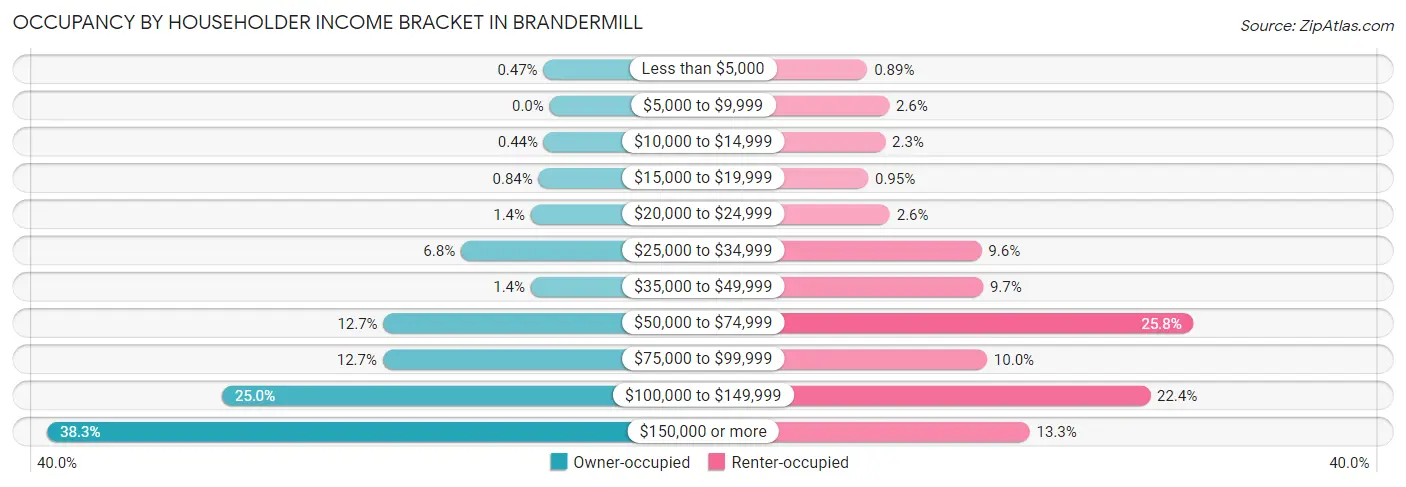
| Income Bracket | Owner-occupied | Renter-occupied |
| Less than $5,000 | 19 (0.5%) | 15 (0.9%) |
| $5,000 to $9,999 | 0 (0.0%) | 43 (2.5%) |
| $10,000 to $14,999 | 18 (0.4%) | 38 (2.2%) |
| $15,000 to $19,999 | 34 (0.8%) | 16 (0.9%) |
| $20,000 to $24,999 | 58 (1.4%) | 44 (2.6%) |
| $25,000 to $34,999 | 273 (6.8%) | 162 (9.6%) |
| $35,000 to $49,999 | 58 (1.4%) | 164 (9.7%) |
| $50,000 to $74,999 | 512 (12.7%) | 435 (25.8%) |
| $75,000 to $99,999 | 514 (12.7%) | 169 (10.0%) |
| $100,000 to $149,999 | 1,010 (25.0%) | 379 (22.4%) |
| $150,000 or more | 1,549 (38.3%) | 224 (13.3%) |
| Total | 4,045 (100.0%) | 1,689 (100.0%) |
Monthly Housing Cost Tiers in Brandermill
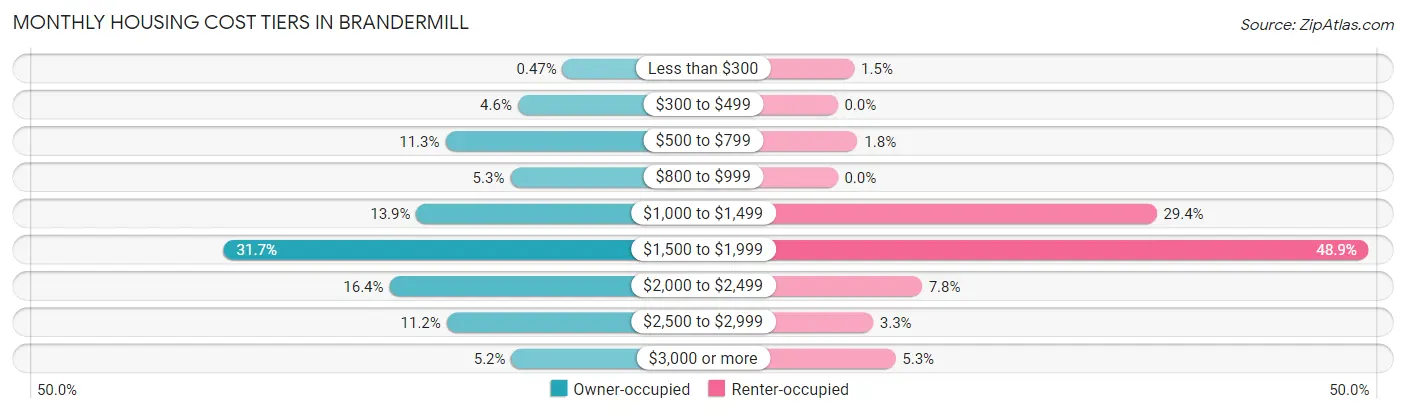
| Monthly Cost | Owner-occupied | Renter-occupied |
| Less than $300 | 19 (0.5%) | 26 (1.5%) |
| $300 to $499 | 186 (4.6%) | 0 (0.0%) |
| $500 to $799 | 456 (11.3%) | 31 (1.8%) |
| $800 to $999 | 214 (5.3%) | 0 (0.0%) |
| $1,000 to $1,499 | 564 (13.9%) | 496 (29.4%) |
| $1,500 to $1,999 | 1,281 (31.7%) | 826 (48.9%) |
| $2,000 to $2,499 | 664 (16.4%) | 131 (7.8%) |
| $2,500 to $2,999 | 451 (11.2%) | 55 (3.3%) |
| $3,000 or more | 210 (5.2%) | 90 (5.3%) |
| Total | 4,045 (100.0%) | 1,689 (100.0%) |
Physical Housing Characteristics in Brandermill
Housing Structures in Brandermill
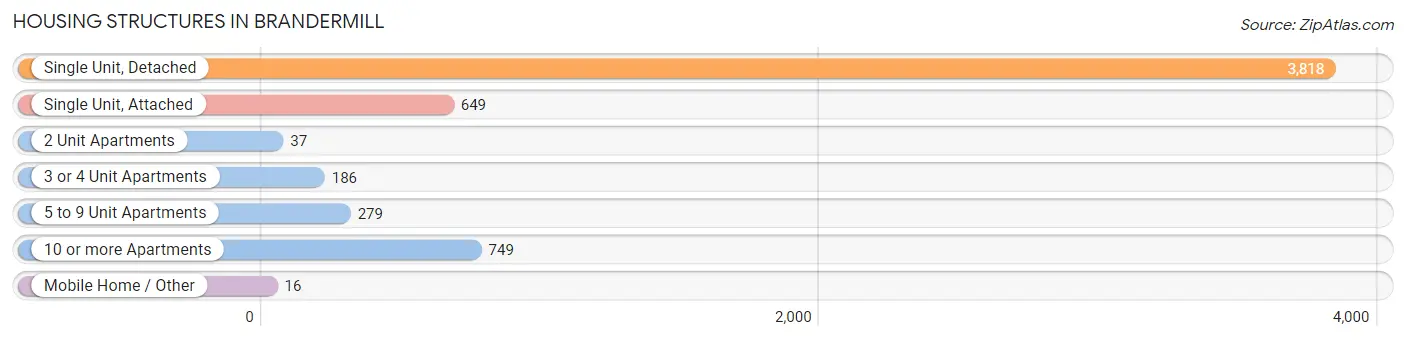
| Structure Type | # Housing Units | % Housing Units |
| Single Unit, Detached | 3,818 | 66.6% |
| Single Unit, Attached | 649 | 11.3% |
| 2 Unit Apartments | 37 | 0.6% |
| 3 or 4 Unit Apartments | 186 | 3.2% |
| 5 to 9 Unit Apartments | 279 | 4.9% |
| 10 or more Apartments | 749 | 13.1% |
| Mobile Home / Other | 16 | 0.3% |
| Total | 5,734 | 100.0% |
Housing Structures by Occupancy in Brandermill
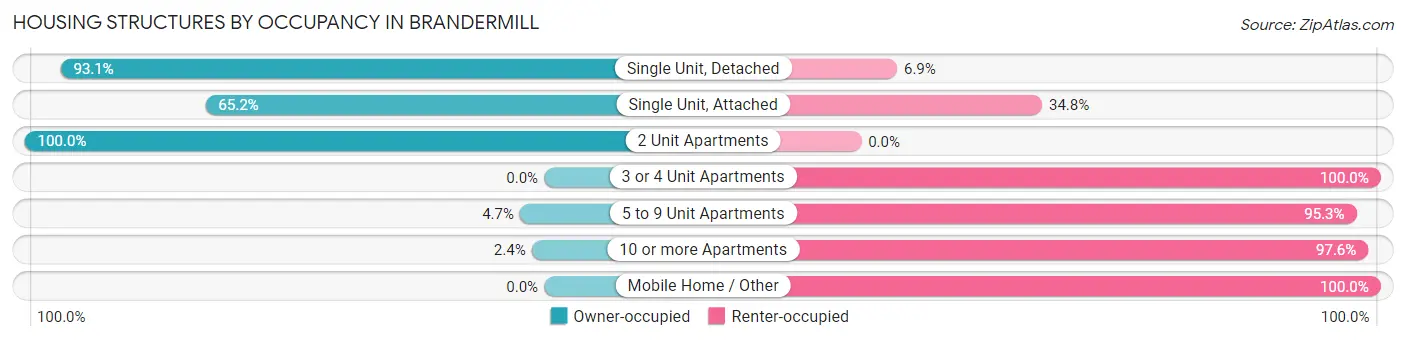
| Structure Type | Owner-occupied | Renter-occupied |
| Single Unit, Detached | 3,554 (93.1%) | 264 (6.9%) |
| Single Unit, Attached | 423 (65.2%) | 226 (34.8%) |
| 2 Unit Apartments | 37 (100.0%) | 0 (0.0%) |
| 3 or 4 Unit Apartments | 0 (0.0%) | 186 (100.0%) |
| 5 to 9 Unit Apartments | 13 (4.7%) | 266 (95.3%) |
| 10 or more Apartments | 18 (2.4%) | 731 (97.6%) |
| Mobile Home / Other | 0 (0.0%) | 16 (100.0%) |
| Total | 4,045 (70.5%) | 1,689 (29.5%) |
Housing Structures by Number of Rooms in Brandermill
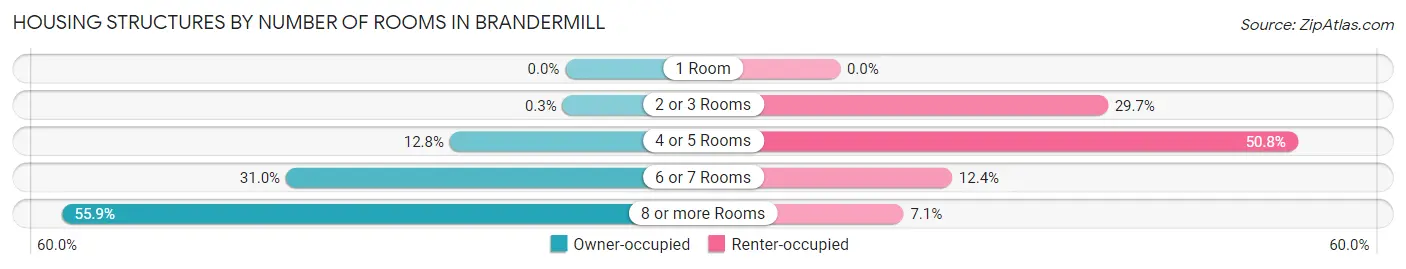
| Number of Rooms | Owner-occupied | Renter-occupied |
| 1 Room | 0 (0.0%) | 0 (0.0%) |
| 2 or 3 Rooms | 12 (0.3%) | 502 (29.7%) |
| 4 or 5 Rooms | 518 (12.8%) | 858 (50.8%) |
| 6 or 7 Rooms | 1,254 (31.0%) | 210 (12.4%) |
| 8 or more Rooms | 2,261 (55.9%) | 119 (7.0%) |
| Total | 4,045 (100.0%) | 1,689 (100.0%) |
Housing Structure by Heating Type in Brandermill
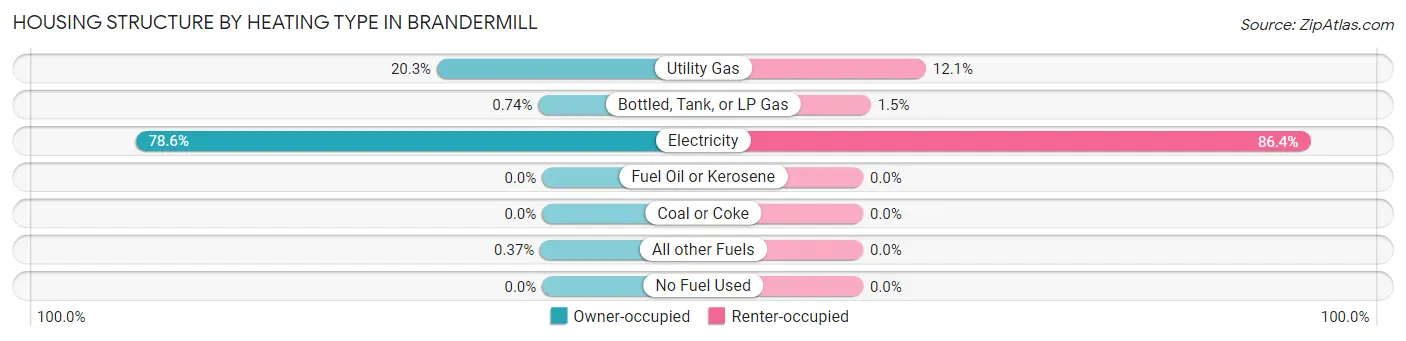
| Heating Type | Owner-occupied | Renter-occupied |
| Utility Gas | 822 (20.3%) | 205 (12.1%) |
| Bottled, Tank, or LP Gas | 30 (0.7%) | 25 (1.5%) |
| Electricity | 3,178 (78.6%) | 1,459 (86.4%) |
| Fuel Oil or Kerosene | 0 (0.0%) | 0 (0.0%) |
| Coal or Coke | 0 (0.0%) | 0 (0.0%) |
| All other Fuels | 15 (0.4%) | 0 (0.0%) |
| No Fuel Used | 0 (0.0%) | 0 (0.0%) |
| Total | 4,045 (100.0%) | 1,689 (100.0%) |
Household Vehicle Usage in Brandermill
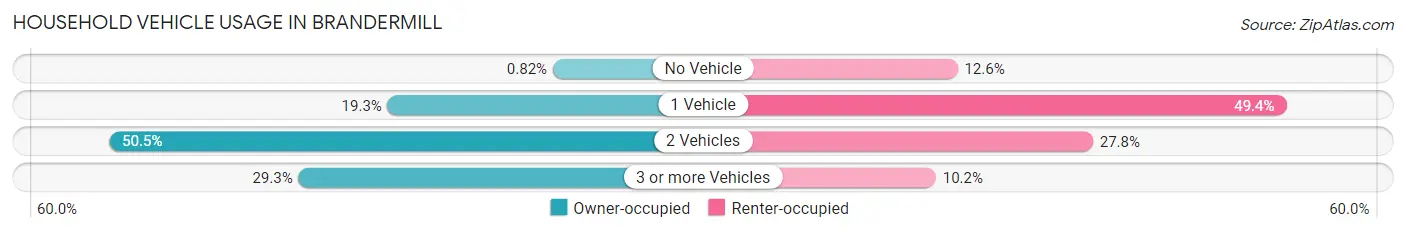
| Vehicles per Household | Owner-occupied | Renter-occupied |
| No Vehicle | 33 (0.8%) | 213 (12.6%) |
| 1 Vehicle | 782 (19.3%) | 835 (49.4%) |
| 2 Vehicles | 2,044 (50.5%) | 469 (27.8%) |
| 3 or more Vehicles | 1,186 (29.3%) | 172 (10.2%) |
| Total | 4,045 (100.0%) | 1,689 (100.0%) |
Real Estate & Mortgages in Brandermill
Real Estate and Mortgage Overview in Brandermill
| Characteristic | Without Mortgage | With Mortgage |
| Housing Units | 919 | 3,126 |
| Median Property Value | $355,000 | $334,000 |
| Median Household Income | $112,109 | $1,185 |
| Monthly Housing Costs | $584 | $210 |
| Real Estate Taxes | $2,728 | $47 |
Property Value by Mortgage Status in Brandermill
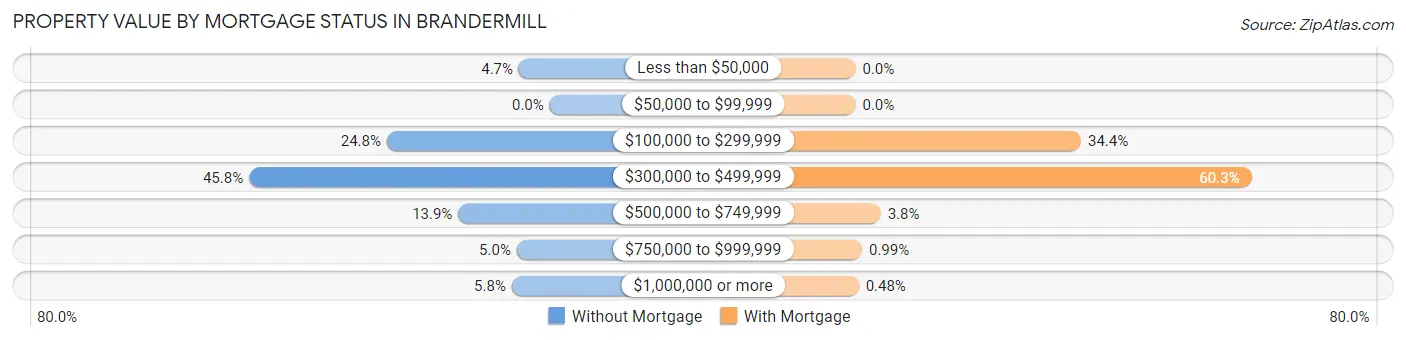
| Property Value | Without Mortgage | With Mortgage |
| Less than $50,000 | 43 (4.7%) | 0 (0.0%) |
| $50,000 to $99,999 | 0 (0.0%) | 0 (0.0%) |
| $100,000 to $299,999 | 228 (24.8%) | 1,074 (34.4%) |
| $300,000 to $499,999 | 421 (45.8%) | 1,886 (60.3%) |
| $500,000 to $749,999 | 128 (13.9%) | 120 (3.8%) |
| $750,000 to $999,999 | 46 (5.0%) | 31 (1.0%) |
| $1,000,000 or more | 53 (5.8%) | 15 (0.5%) |
| Total | 919 (100.0%) | 3,126 (100.0%) |
Household Income by Mortgage Status in Brandermill
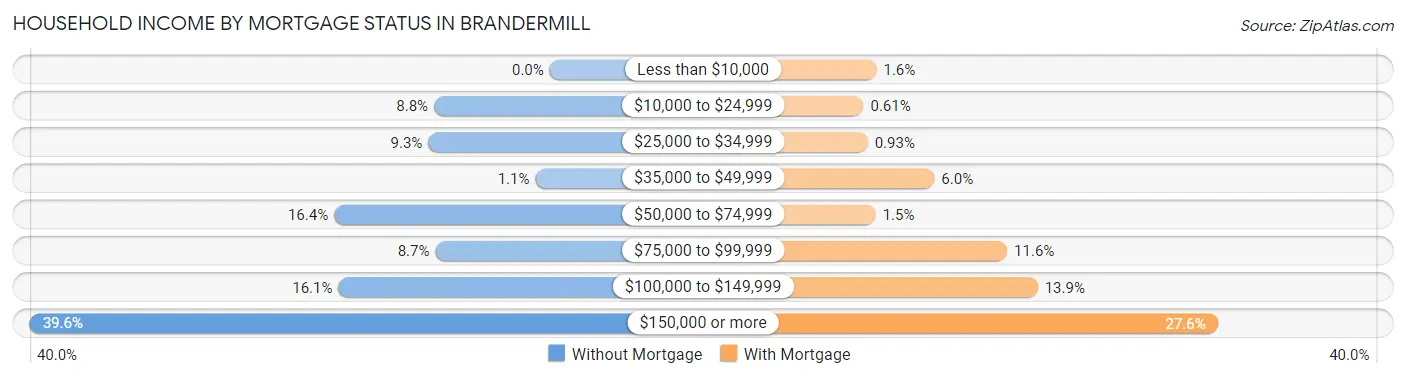
| Household Income | Without Mortgage | With Mortgage |
| Less than $10,000 | 0 (0.0%) | 50 (1.6%) |
| $10,000 to $24,999 | 81 (8.8%) | 19 (0.6%) |
| $25,000 to $34,999 | 85 (9.2%) | 29 (0.9%) |
| $35,000 to $49,999 | 10 (1.1%) | 188 (6.0%) |
| $50,000 to $74,999 | 151 (16.4%) | 48 (1.5%) |
| $75,000 to $99,999 | 80 (8.7%) | 361 (11.6%) |
| $100,000 to $149,999 | 148 (16.1%) | 434 (13.9%) |
| $150,000 or more | 364 (39.6%) | 862 (27.6%) |
| Total | 919 (100.0%) | 3,126 (100.0%) |
Property Value to Household Income Ratio in Brandermill
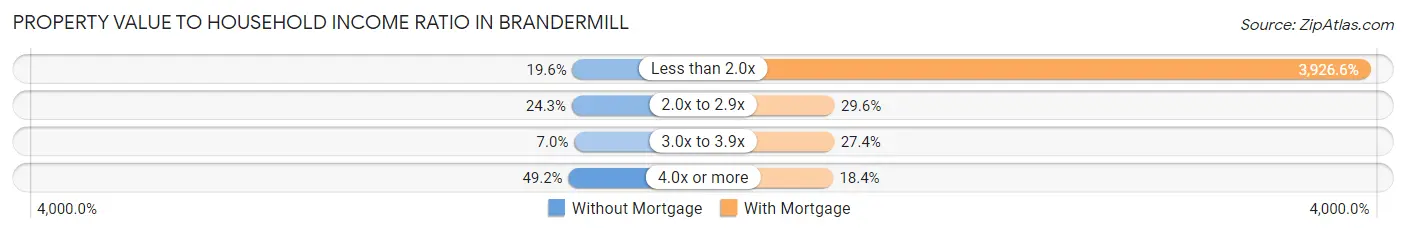
| Value-to-Income Ratio | Without Mortgage | With Mortgage |
| Less than 2.0x | 180 (19.6%) | 122,744 (3,926.6%) |
| 2.0x to 2.9x | 223 (24.3%) | 924 (29.6%) |
| 3.0x to 3.9x | 64 (7.0%) | 856 (27.4%) |
| 4.0x or more | 452 (49.2%) | 575 (18.4%) |
| Total | 919 (100.0%) | 3,126 (100.0%) |
Real Estate Taxes by Mortgage Status in Brandermill
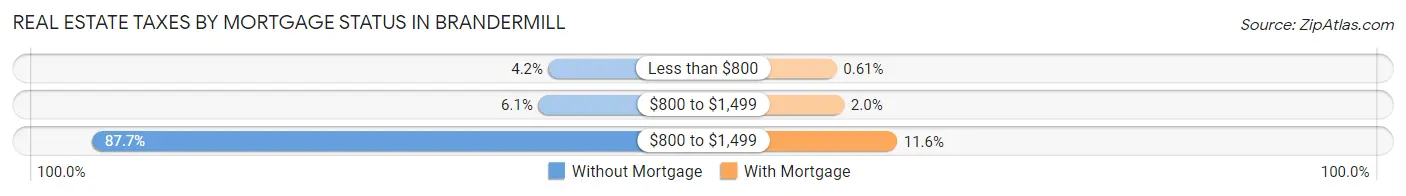
| Property Taxes | Without Mortgage | With Mortgage |
| Less than $800 | 39 (4.2%) | 19 (0.6%) |
| $800 to $1,499 | 56 (6.1%) | 62 (2.0%) |
| $800 to $1,499 | 806 (87.7%) | 364 (11.6%) |
| Total | 919 (100.0%) | 3,126 (100.0%) |
Health & Disability in Brandermill
Health Insurance Coverage by Age in Brandermill
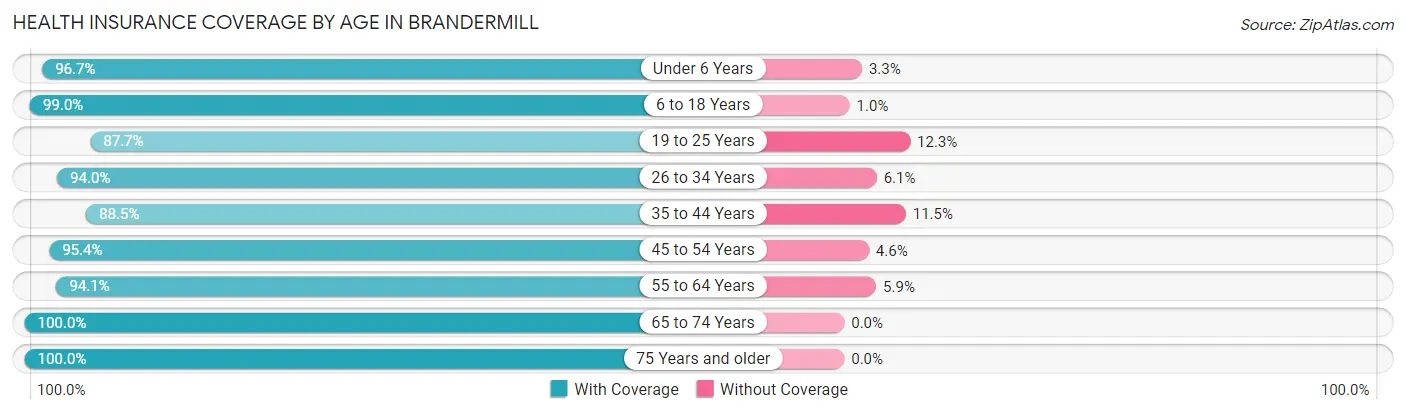
| Age Bracket | With Coverage | Without Coverage |
| Under 6 Years | 911 (96.7%) | 31 (3.3%) |
| 6 to 18 Years | 1,873 (99.0%) | 19 (1.0%) |
| 19 to 25 Years | 1,001 (87.7%) | 140 (12.3%) |
| 26 to 34 Years | 1,553 (94.0%) | 100 (6.0%) |
| 35 to 44 Years | 1,544 (88.5%) | 200 (11.5%) |
| 45 to 54 Years | 1,997 (95.4%) | 96 (4.6%) |
| 55 to 64 Years | 1,900 (94.1%) | 120 (5.9%) |
| 65 to 74 Years | 1,412 (100.0%) | 0 (0.0%) |
| 75 Years and older | 1,385 (100.0%) | 0 (0.0%) |
| Total | 13,576 (95.1%) | 706 (4.9%) |
Health Insurance Coverage by Citizenship Status in Brandermill
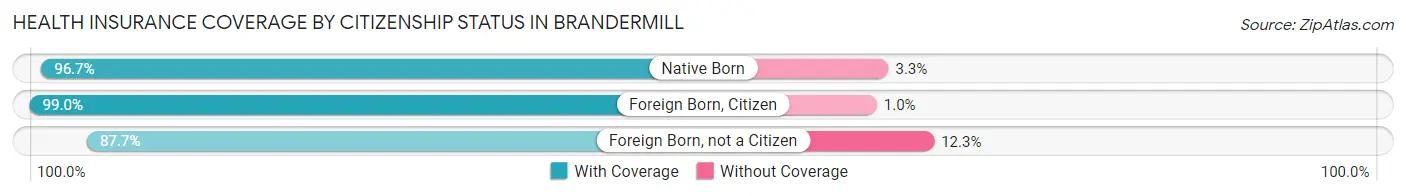
| Citizenship Status | With Coverage | Without Coverage |
| Native Born | 911 (96.7%) | 31 (3.3%) |
| Foreign Born, Citizen | 1,873 (99.0%) | 19 (1.0%) |
| Foreign Born, not a Citizen | 1,001 (87.7%) | 140 (12.3%) |
Health Insurance Coverage by Household Income in Brandermill
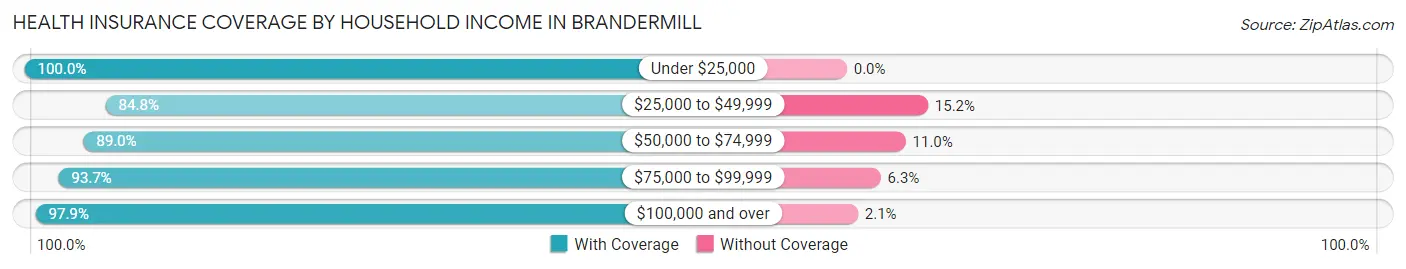
| Household Income | With Coverage | Without Coverage |
| Under $25,000 | 408 (100.0%) | 0 (0.0%) |
| $25,000 to $49,999 | 1,340 (84.8%) | 240 (15.2%) |
| $50,000 to $74,999 | 1,324 (89.0%) | 164 (11.0%) |
| $75,000 to $99,999 | 1,582 (93.7%) | 107 (6.3%) |
| $100,000 and over | 8,920 (97.9%) | 189 (2.1%) |
Public vs Private Health Insurance Coverage by Age in Brandermill
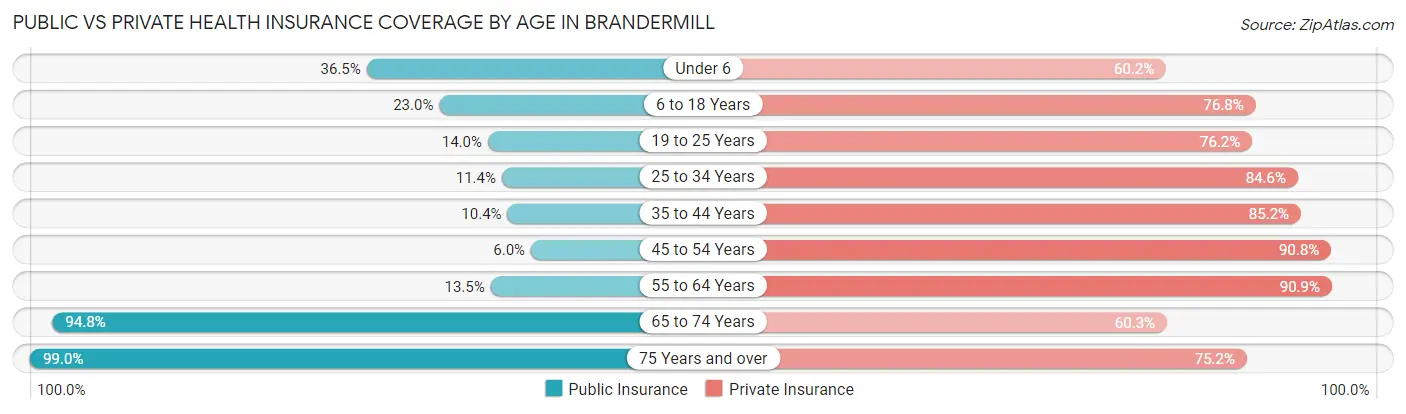
| Age Bracket | Public Insurance | Private Insurance |
| Under 6 | 344 (36.5%) | 567 (60.2%) |
| 6 to 18 Years | 436 (23.0%) | 1,453 (76.8%) |
| 19 to 25 Years | 160 (14.0%) | 869 (76.2%) |
| 25 to 34 Years | 189 (11.4%) | 1,399 (84.6%) |
| 35 to 44 Years | 181 (10.4%) | 1,486 (85.2%) |
| 45 to 54 Years | 126 (6.0%) | 1,901 (90.8%) |
| 55 to 64 Years | 273 (13.5%) | 1,837 (90.9%) |
| 65 to 74 Years | 1,339 (94.8%) | 852 (60.3%) |
| 75 Years and over | 1,371 (99.0%) | 1,041 (75.2%) |
| Total | 4,419 (30.9%) | 11,405 (79.9%) |
Disability Status by Sex by Age in Brandermill
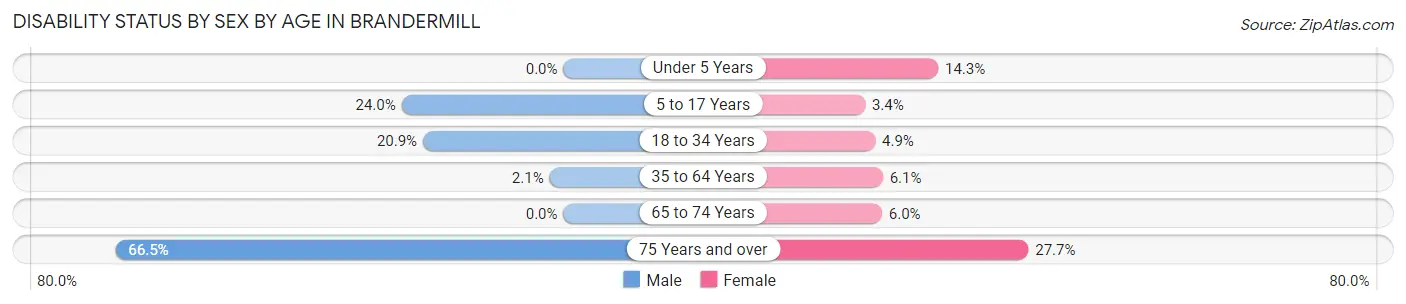
| Age Bracket | Male | Female |
| Under 5 Years | 0 (0.0%) | 52 (14.3%) |
| 5 to 17 Years | 223 (24.0%) | 36 (3.4%) |
| 18 to 34 Years | 284 (20.8%) | 73 (4.9%) |
| 35 to 64 Years | 64 (2.1%) | 167 (6.1%) |
| 65 to 74 Years | 0 (0.0%) | 55 (5.9%) |
| 75 Years and over | 429 (66.5%) | 205 (27.7%) |
Disability Class by Sex by Age in Brandermill
Disability Class: Hearing Difficulty
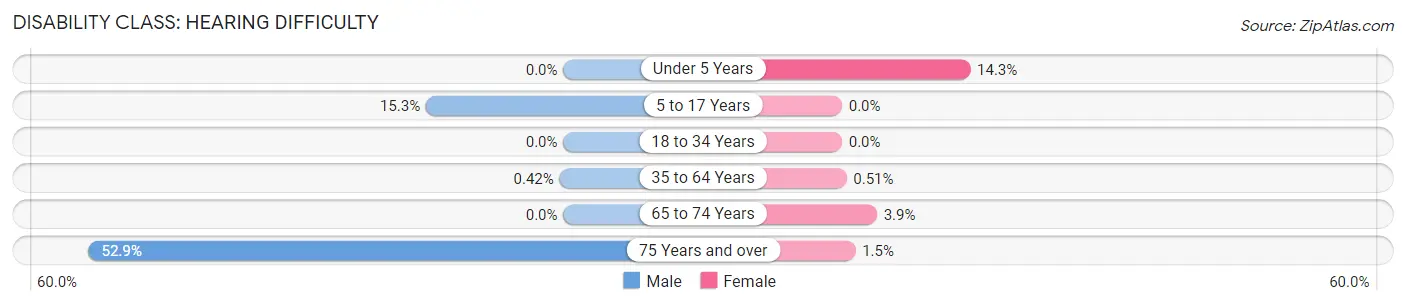
| Age Bracket | Male | Female |
| Under 5 Years | 0 (0.0%) | 52 (14.3%) |
| 5 to 17 Years | 142 (15.3%) | 0 (0.0%) |
| 18 to 34 Years | 0 (0.0%) | 0 (0.0%) |
| 35 to 64 Years | 13 (0.4%) | 14 (0.5%) |
| 65 to 74 Years | 0 (0.0%) | 36 (3.9%) |
| 75 Years and over | 341 (52.9%) | 11 (1.5%) |
Disability Class: Vision Difficulty
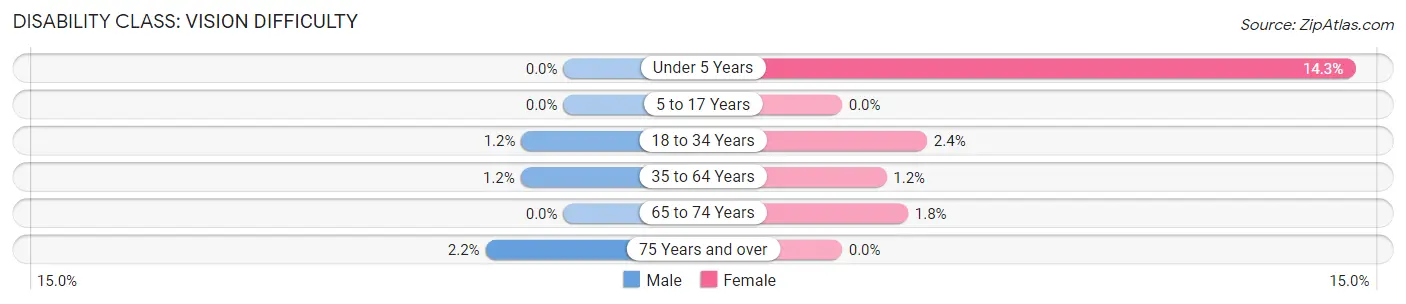
| Age Bracket | Male | Female |
| Under 5 Years | 0 (0.0%) | 52 (14.3%) |
| 5 to 17 Years | 0 (0.0%) | 0 (0.0%) |
| 18 to 34 Years | 16 (1.2%) | 35 (2.4%) |
| 35 to 64 Years | 37 (1.2%) | 34 (1.2%) |
| 65 to 74 Years | 0 (0.0%) | 17 (1.8%) |
| 75 Years and over | 14 (2.2%) | 0 (0.0%) |
Disability Class: Cognitive Difficulty
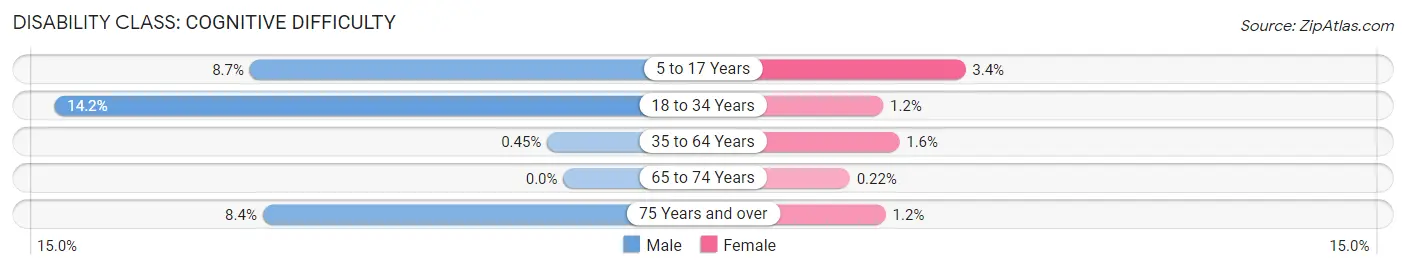
| Age Bracket | Male | Female |
| 5 to 17 Years | 81 (8.7%) | 36 (3.4%) |
| 18 to 34 Years | 193 (14.2%) | 17 (1.1%) |
| 35 to 64 Years | 14 (0.4%) | 44 (1.6%) |
| 65 to 74 Years | 0 (0.0%) | 2 (0.2%) |
| 75 Years and over | 54 (8.4%) | 9 (1.2%) |
Disability Class: Ambulatory Difficulty
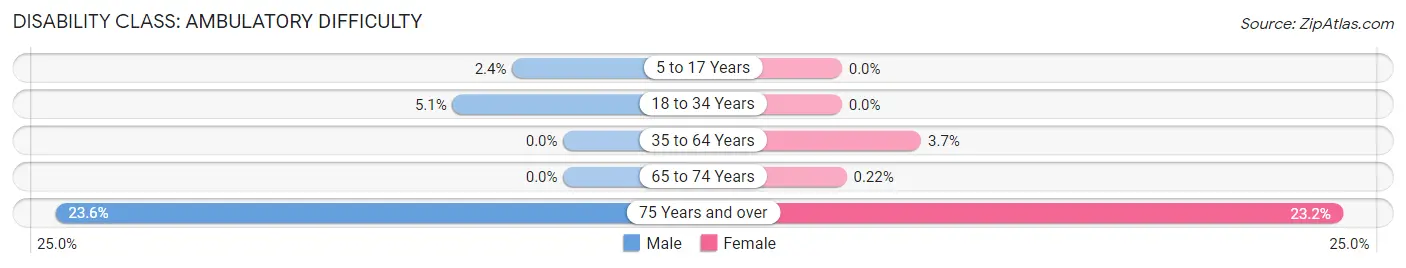
| Age Bracket | Male | Female |
| 5 to 17 Years | 22 (2.4%) | 0 (0.0%) |
| 18 to 34 Years | 70 (5.1%) | 0 (0.0%) |
| 35 to 64 Years | 0 (0.0%) | 101 (3.7%) |
| 65 to 74 Years | 0 (0.0%) | 2 (0.2%) |
| 75 Years and over | 152 (23.6%) | 172 (23.2%) |
Disability Class: Self-Care Difficulty
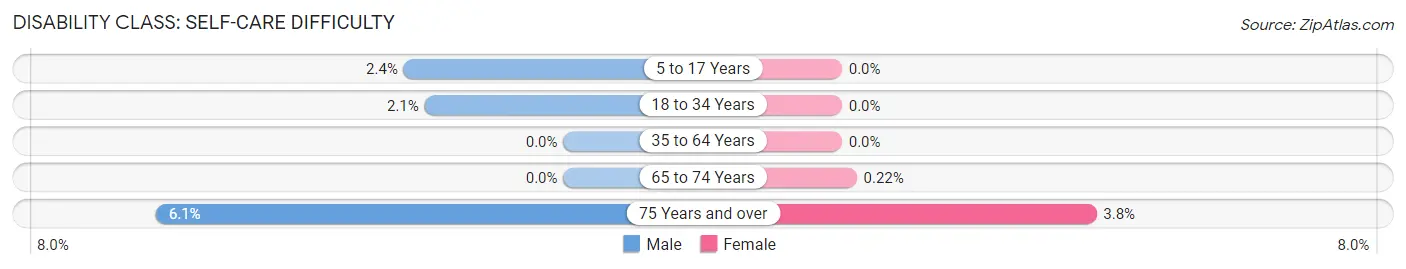
| Age Bracket | Male | Female |
| 5 to 17 Years | 22 (2.4%) | 0 (0.0%) |
| 18 to 34 Years | 28 (2.1%) | 0 (0.0%) |
| 35 to 64 Years | 0 (0.0%) | 0 (0.0%) |
| 65 to 74 Years | 0 (0.0%) | 2 (0.2%) |
| 75 Years and over | 39 (6.0%) | 28 (3.8%) |
Technology Access in Brandermill
Computing Device Access in Brandermill
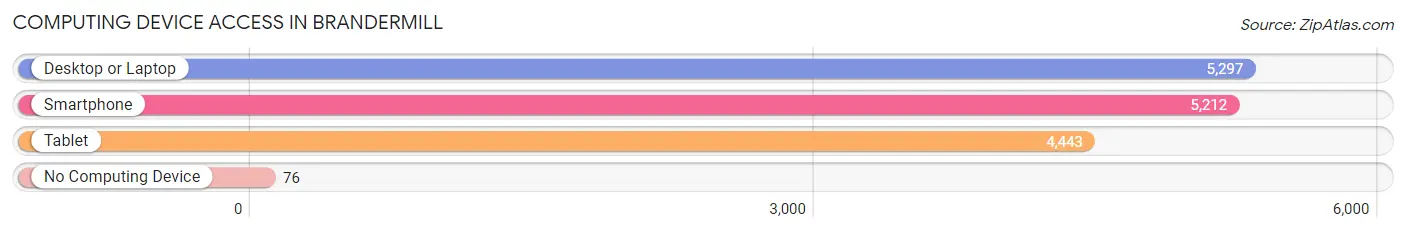
| Device Type | # Households | % Households |
| Desktop or Laptop | 5,297 | 92.4% |
| Smartphone | 5,212 | 90.9% |
| Tablet | 4,443 | 77.5% |
| No Computing Device | 76 | 1.3% |
| Total | 5,734 | 100.0% |
Internet Access in Brandermill
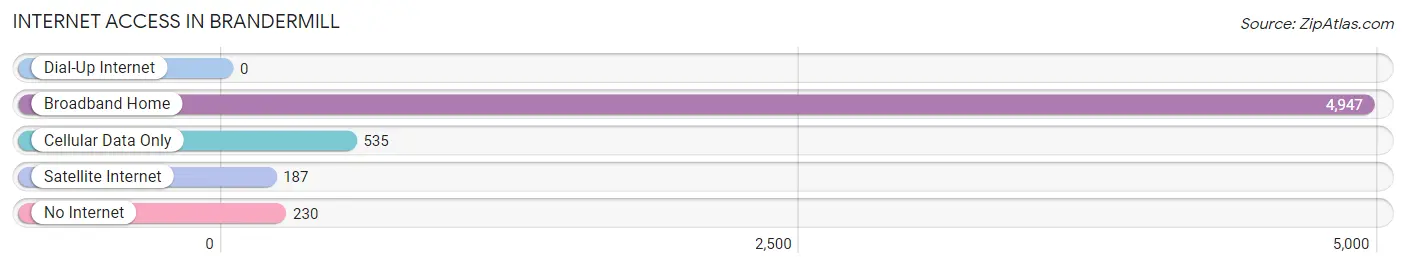
| Internet Type | # Households | % Households |
| Dial-Up Internet | 0 | 0.0% |
| Broadband Home | 4,947 | 86.3% |
| Cellular Data Only | 535 | 9.3% |
| Satellite Internet | 187 | 3.3% |
| No Internet | 230 | 4.0% |
| Total | 5,734 | 100.0% |
Brandermill Summary
Brandermill, Virginia is a census-designated place located in Chesterfield County, Virginia. It is a suburban community located just south of Richmond, Virginia. The population of Brandermill was 8,945 at the 2010 census.
History
Brandermill was founded in the late 1970s by the Brandermill Corporation, a real estate development company. The company was founded by the late William H. Goodwin, Jr., a prominent Richmond businessman. The company purchased a large tract of land in Chesterfield County and developed it into a planned community. The community was named after the Brandermill Corporation.
The first homes in Brandermill were built in 1979. The community was designed to be a self-contained community with its own shopping centers, schools, churches, and recreational facilities. The community was designed to be a safe and secure place to live, with a strong sense of community.
Geography
Brandermill is located in Chesterfield County, Virginia. It is situated on the south side of Richmond, Virginia, and is bordered by the James River to the east and the Appomattox River to the west. The community is located in the Piedmont region of Virginia, and is characterized by rolling hills and wooded areas.
The climate in Brandermill is humid subtropical, with hot, humid summers and mild winters. The average annual temperature is around 60 degrees Fahrenheit. The average annual precipitation is around 45 inches.
Economy
Brandermill is a primarily residential community, with most of its residents employed in the nearby cities of Richmond and Petersburg. The community is home to several small businesses, including restaurants, retail stores, and professional services.
The largest employer in Brandermill is the Brandermill Corporation, which is the developer of the community. The company employs a large number of people in the community, including engineers, architects, and construction workers.
Demographics
As of the 2010 census, the population of Brandermill was 8,945. The racial makeup of the community was 79.3% White, 14.2% African American, 0.7% Asian, 0.2% Native American, and 5.8% from other races. The median household income was $76,945, and the median family income was $86,945.
Brandermill is a diverse community, with a variety of religious and cultural backgrounds. The community is home to a variety of churches, including Baptist, Methodist, Presbyterian, and Catholic. The community is also home to a variety of cultural organizations, including the Brandermill Cultural Arts Council and the Brandermill International Festival.
Conclusion
Brandermill, Virginia is a suburban community located just south of Richmond, Virginia. The community was founded in the late 1970s by the Brandermill Corporation, and has since grown into a vibrant and diverse community. The community is home to a variety of businesses, churches, and cultural organizations, and is a safe and secure place to live. The population of Brandermill was 8,945 at the 2010 census, and the median household income was $76,945.
Common Questions
What is Per Capita Income in Brandermill?
Per Capita income in Brandermill is $52,234.
What is the Median Family Income in Brandermill?
Median Family Income in Brandermill is $126,477.
What is the Median Household income in Brandermill?
Median Household Income in Brandermill is $107,061.
What is Income or Wage Gap in Brandermill?
Income or Wage Gap in Brandermill is 28.0%.
Women in Brandermill earn 72.0 cents for every dollar earned by a man.
What is Family Income Deficit in Brandermill?
Family Income Deficit in Brandermill is $10,166.
Families that are below poverty line in Brandermill earn $10,166 less on average than the poverty threshold level.
What is Inequality or Gini Index in Brandermill?
Inequality or Gini Index in Brandermill is 0.36.
What is the Total Population of Brandermill?
Total Population of Brandermill is 14,285.
What is the Total Male Population of Brandermill?
Total Male Population of Brandermill is 6,986.
What is the Total Female Population of Brandermill?
Total Female Population of Brandermill is 7,299.
What is the Ratio of Males per 100 Females in Brandermill?
There are 95.71 Males per 100 Females in Brandermill.
What is the Ratio of Females per 100 Males in Brandermill?
There are 104.48 Females per 100 Males in Brandermill.
What is the Median Population Age in Brandermill?
Median Population Age in Brandermill is 43.5 Years.
What is the Average Family Size in Brandermill
Average Family Size in Brandermill is 3.0 People.
What is the Average Household Size in Brandermill
Average Household Size in Brandermill is 2.5 People.
How Large is the Labor Force in Brandermill?
There are 8,125 People in the Labor Forcein in Brandermill.
What is the Percentage of People in the Labor Force in Brandermill?
69.4% of People are in the Labor Force in Brandermill.
What is the Unemployment Rate in Brandermill?
Unemployment Rate in Brandermill is 4.2%.