Cities with the Highest Percentage of Sri Lankan Population in Virginia
RELATED REPORTS & OPTIONS
Sri Lankan
Virginia
Compare Cities
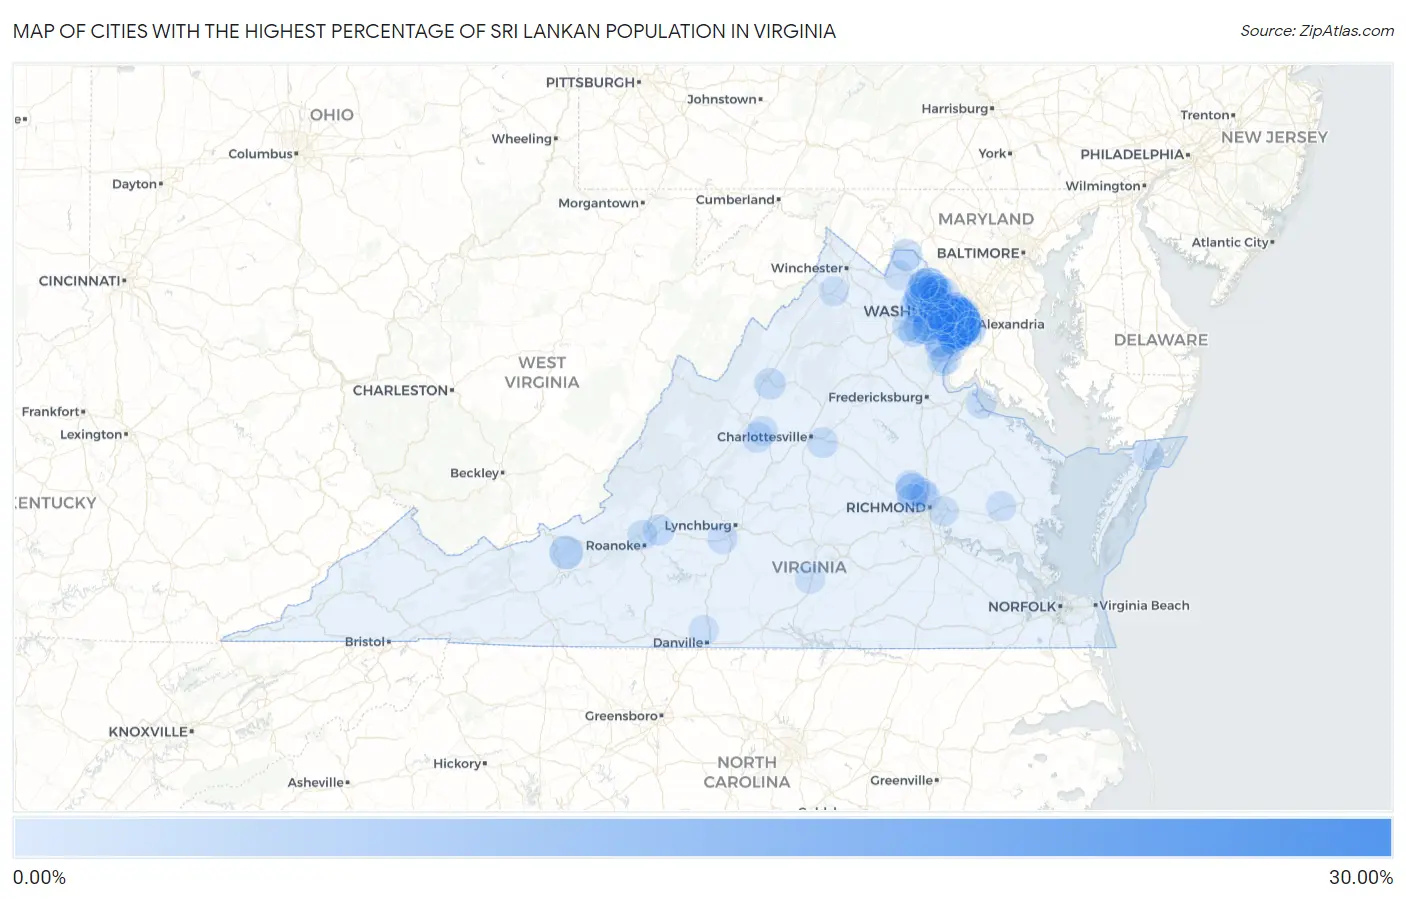
Map of Cities with the Highest Percentage of Sri Lankan Population in Virginia
0.00%
30.00%
Cities with the Highest Percentage of Sri Lankan Population in Virginia
| City | Sri Lankan | vs State | vs National | |
| 1. | North Springfield | 26.04% | 0.89%(+25.2)#1 | 0.68%(+25.4)#12 |
| 2. | Ravensworth | 19.13% | 0.89%(+18.2)#2 | 0.68%(+18.4)#19 |
| 3. | Springfield | 11.12% | 0.89%(+10.2)#3 | 0.68%(+10.4)#46 |
| 4. | Union Mill | 10.60% | 0.89%(+9.71)#4 | 0.68%(+9.92)#49 |
| 5. | University Center | 9.80% | 0.89%(+8.92)#5 | 0.68%(+9.12)#57 |
| 6. | West Falls Church | 8.60% | 0.89%(+7.71)#6 | 0.68%(+7.92)#65 |
| 7. | Annandale | 8.32% | 0.89%(+7.43)#7 | 0.68%(+7.64)#72 |
| 8. | Seven Corners | 6.38% | 0.89%(+5.49)#8 | 0.68%(+5.70)#98 |
| 9. | Franconia | 5.91% | 0.89%(+5.03)#9 | 0.68%(+5.24)#119 |
| 10. | Fair Lakes | 5.61% | 0.89%(+4.72)#10 | 0.68%(+4.93)#134 |
| 11. | County Center | 5.47% | 0.89%(+4.58)#11 | 0.68%(+4.79)#136 |
| 12. | Innsbrook | 5.44% | 0.89%(+4.55)#12 | 0.68%(+4.76)#137 |
| 13. | Parrott | 5.43% | 0.89%(+4.54)#13 | 0.68%(+4.75)#139 |
| 14. | Newington | 5.38% | 0.89%(+4.50)#14 | 0.68%(+4.70)#143 |
| 15. | Woodburn | 5.32% | 0.89%(+4.43)#15 | 0.68%(+4.64)#145 |
| 16. | Chantilly | 5.28% | 0.89%(+4.39)#16 | 0.68%(+4.60)#146 |
| 17. | Kings Park | 5.17% | 0.89%(+4.28)#17 | 0.68%(+4.49)#151 |
| 18. | Lake Barcroft | 5.05% | 0.89%(+4.17)#18 | 0.68%(+4.37)#162 |
| 19. | Braddock | 4.94% | 0.89%(+4.05)#19 | 0.68%(+4.26)#167 |
| 20. | Pimmit Hills | 4.51% | 0.89%(+3.62)#20 | 0.68%(+3.83)#196 |
| 21. | Newington Forest | 4.51% | 0.89%(+3.62)#21 | 0.68%(+3.83)#197 |
| 22. | Great Falls Crossing | 4.31% | 0.89%(+3.42)#22 | 0.68%(+3.63)#208 |
| 23. | Idylwood | 3.87% | 0.89%(+2.99)#23 | 0.68%(+3.19)#248 |
| 24. | One Loudoun | 3.85% | 0.89%(+2.96)#24 | 0.68%(+3.17)#251 |
| 25. | Goose Creek | 3.82% | 0.89%(+2.93)#25 | 0.68%(+3.14)#257 |
| 26. | Manassas Park | 3.78% | 0.89%(+2.90)#26 | 0.68%(+3.11)#261 |
| 27. | Fairfax | 3.60% | 0.89%(+2.71)#27 | 0.68%(+2.92)#283 |
| 28. | Loudoun Valley Estates | 3.59% | 0.89%(+2.70)#28 | 0.68%(+2.91)#286 |
| 29. | South Riding | 3.57% | 0.89%(+2.68)#29 | 0.68%(+2.89)#290 |
| 30. | Bull Run | 3.56% | 0.89%(+2.67)#30 | 0.68%(+2.88)#293 |
| 31. | Oakton | 3.53% | 0.89%(+2.64)#31 | 0.68%(+2.85)#299 |
| 32. | Stone Ridge | 3.50% | 0.89%(+2.61)#32 | 0.68%(+2.82)#301 |
| 33. | Rose Hill Cdp Fairfax County | 3.41% | 0.89%(+2.53)#33 | 0.68%(+2.74)#313 |
| 34. | Dunn Loring | 3.37% | 0.89%(+2.48)#34 | 0.68%(+2.69)#319 |
| 35. | Lovettsville | 3.34% | 0.89%(+2.45)#35 | 0.68%(+2.66)#324 |
| 36. | Merrifield | 3.24% | 0.89%(+2.35)#36 | 0.68%(+2.56)#344 |
| 37. | Burke Centre | 3.21% | 0.89%(+2.33)#37 | 0.68%(+2.53)#346 |
| 38. | West Springfield | 3.20% | 0.89%(+2.32)#38 | 0.68%(+2.53)#347 |
| 39. | Lorton | 3.13% | 0.89%(+2.24)#39 | 0.68%(+2.45)#362 |
| 40. | Dulles Town Center | 3.09% | 0.89%(+2.21)#40 | 0.68%(+2.41)#368 |
| 41. | Oak Grove | 3.08% | 0.89%(+2.19)#41 | 0.68%(+2.40)#370 |
| 42. | Sterling | 3.01% | 0.89%(+2.13)#42 | 0.68%(+2.34)#383 |
| 43. | Navy | 3.00% | 0.89%(+2.11)#43 | 0.68%(+2.32)#392 |
| 44. | Kings Park West | 2.93% | 0.89%(+2.04)#44 | 0.68%(+2.25)#406 |
| 45. | Lincolnia | 2.89% | 0.89%(+2.00)#45 | 0.68%(+2.21)#414 |
| 46. | Centreville | 2.87% | 0.89%(+1.98)#46 | 0.68%(+2.19)#415 |
| 47. | Brambleton | 2.85% | 0.89%(+1.96)#47 | 0.68%(+2.17)#419 |
| 48. | Burke | 2.84% | 0.89%(+1.96)#48 | 0.68%(+2.17)#421 |
| 49. | Linton Hall | 2.71% | 0.89%(+1.82)#49 | 0.68%(+2.03)#456 |
| 50. | Massanetta Springs | 2.57% | 0.89%(+1.69)#50 | 0.68%(+1.90)#479 |
| 51. | Blue Ridge | 2.40% | 0.89%(+1.52)#51 | 0.68%(+1.73)#526 |
| 52. | Cascades | 2.14% | 0.89%(+1.26)#52 | 0.68%(+1.47)#627 |
| 53. | Floris | 2.10% | 0.89%(+1.22)#53 | 0.68%(+1.42)#639 |
| 54. | Greenbriar | 2.08% | 0.89%(+1.19)#54 | 0.68%(+1.40)#649 |
| 55. | Rivanna | 2.01% | 0.89%(+1.13)#55 | 0.68%(+1.33)#665 |
| 56. | Falls Church | 1.99% | 0.89%(+1.10)#56 | 0.68%(+1.31)#677 |
| 57. | Lowes Island | 1.99% | 0.89%(+1.10)#57 | 0.68%(+1.31)#679 |
| 58. | Broadlands | 1.96% | 0.89%(+1.07)#58 | 0.68%(+1.28)#693 |
| 59. | Ashburn | 1.92% | 0.89%(+1.03)#59 | 0.68%(+1.24)#719 |
| 60. | Vienna | 1.91% | 0.89%(+1.02)#60 | 0.68%(+1.23)#721 |
| 61. | Woodlawn Cdp Fairfax County | 1.89% | 0.89%(+1.00)#61 | 0.68%(+1.21)#732 |
| 62. | Mantua | 1.89% | 0.89%(+0.999)#62 | 0.68%(+1.21)#736 |
| 63. | Sugarland Run | 1.86% | 0.89%(+0.970)#63 | 0.68%(+1.18)#753 |
| 64. | Reston | 1.80% | 0.89%(+0.914)#64 | 0.68%(+1.12)#787 |
| 65. | Lyndhurst | 1.71% | 0.89%(+0.828)#65 | 0.68%(+1.04)#836 |
| 66. | Franklin Farm | 1.71% | 0.89%(+0.822)#66 | 0.68%(+1.03)#838 |
| 67. | Gainesville | 1.71% | 0.89%(+0.822)#67 | 0.68%(+1.03)#839 |
| 68. | Long Branch | 1.66% | 0.89%(+0.777)#68 | 0.68%(+0.985)#872 |
| 69. | Midlothian | 1.65% | 0.89%(+0.766)#69 | 0.68%(+0.974)#879 |
| 70. | Laurel | 1.61% | 0.89%(+0.721)#70 | 0.68%(+0.929)#917 |
| 71. | Atlantic | 1.61% | 0.89%(+0.721)#71 | 0.68%(+0.929)#918 |
| 72. | Herndon | 1.58% | 0.89%(+0.692)#72 | 0.68%(+0.900)#943 |
| 73. | Fairfax Station | 1.57% | 0.89%(+0.686)#73 | 0.68%(+0.894)#953 |
| 74. | Tysons | 1.56% | 0.89%(+0.674)#74 | 0.68%(+0.882)#965 |
| 75. | Laurel Hill | 1.50% | 0.89%(+0.613)#75 | 0.68%(+0.821)#1,006 |
| 76. | Yorkshire | 1.49% | 0.89%(+0.600)#76 | 0.68%(+0.808)#1,014 |
| 77. | Timberlake | 1.45% | 0.89%(+0.568)#77 | 0.68%(+0.775)#1,045 |
| 78. | Huntington | 1.43% | 0.89%(+0.544)#78 | 0.68%(+0.752)#1,065 |
| 79. | Fair Oaks | 1.42% | 0.89%(+0.531)#79 | 0.68%(+0.739)#1,079 |
| 80. | Cherry Hill | 1.40% | 0.89%(+0.513)#80 | 0.68%(+0.721)#1,100 |
| 81. | Belmont | 1.40% | 0.89%(+0.509)#81 | 0.68%(+0.717)#1,103 |
| 82. | Lakeside | 1.39% | 0.89%(+0.499)#82 | 0.68%(+0.707)#1,109 |
| 83. | Tuckahoe | 1.37% | 0.89%(+0.481)#83 | 0.68%(+0.689)#1,126 |
| 84. | Hollins | 1.35% | 0.89%(+0.468)#84 | 0.68%(+0.676)#1,138 |
| 85. | Countryside | 1.34% | 0.89%(+0.451)#85 | 0.68%(+0.659)#1,150 |
| 86. | Sandston | 1.31% | 0.89%(+0.428)#86 | 0.68%(+0.636)#1,169 |
| 87. | Colonial Beach | 1.31% | 0.89%(+0.423)#87 | 0.68%(+0.631)#1,177 |
| 88. | Dale City | 1.30% | 0.89%(+0.411)#88 | 0.68%(+0.619)#1,195 |
| 89. | Triangle | 1.30% | 0.89%(+0.409)#89 | 0.68%(+0.617)#1,200 |
| 90. | Waynesboro | 1.29% | 0.89%(+0.403)#90 | 0.68%(+0.611)#1,210 |
| 91. | West Point | 1.27% | 0.89%(+0.380)#91 | 0.68%(+0.588)#1,238 |
| 92. | George Mason | 1.24% | 0.89%(+0.352)#92 | 0.68%(+0.559)#1,272 |
| 93. | Great Falls | 1.21% | 0.89%(+0.323)#93 | 0.68%(+0.531)#1,304 |
| 94. | Mount Hermon | 1.20% | 0.89%(+0.309)#94 | 0.68%(+0.517)#1,321 |
| 95. | Keysville | 1.18% | 0.89%(+0.298)#95 | 0.68%(+0.506)#1,332 |
| 96. | Lansdowne | 1.18% | 0.89%(+0.297)#96 | 0.68%(+0.505)#1,333 |
| 97. | Purcellville | 1.15% | 0.89%(+0.267)#97 | 0.68%(+0.475)#1,365 |
| 98. | Middletown | 1.09% | 0.89%(+0.205)#98 | 0.68%(+0.413)#1,440 |
| 99. | Wyndham | 1.09% | 0.89%(+0.204)#99 | 0.68%(+0.412)#1,442 |
| 100. | Hybla Valley | 1.08% | 0.89%(+0.191)#100 | 0.68%(+0.399)#1,458 |
Common Questions
What are the Top 10 Cities with the Highest Percentage of Sri Lankan Population in Virginia?
Top 10 Cities with the Highest Percentage of Sri Lankan Population in Virginia are:
#1
26.04%
#2
19.13%
#3
11.12%
#4
9.80%
#5
8.60%
#6
8.32%
#7
6.38%
#8
5.91%
#9
5.61%
#10
5.47%
What city has the Highest Percentage of Sri Lankan Population in Virginia?
North Springfield has the Highest Percentage of Sri Lankan Population in Virginia with 26.04%.
What is the Percentage of Sri Lankan Population in the State of Virginia?
Percentage of Sri Lankan Population in Virginia is 0.89%.
What is the Percentage of Sri Lankan Population in the United States?
Percentage of Sri Lankan Population in the United States is 0.68%.