Greenbriar, VA Map & Demographics
Greenbriar Map
Greenbriar Overview
$57,232
PER CAPITA INCOME
$159,412
AVG FAMILY INCOME
$127,100
AVG HOUSEHOLD INCOME
24.5%
WAGE / INCOME GAP [ % ]
75.5¢/ $1
WAGE / INCOME GAP [ $ ]
0.35
INEQUALITY / GINI INDEX
7,945
TOTAL POPULATION
4,243
MALE POPULATION
3,702
FEMALE POPULATION
114.61
MALES / 100 FEMALES
87.25
FEMALES / 100 MALES
40.3
MEDIAN AGE
3.2
AVG FAMILY SIZE
2.6
AVG HOUSEHOLD SIZE
4,219
LABOR FORCE [ PEOPLE ]
66.5%
PERCENT IN LABOR FORCE
1.9%
UNEMPLOYMENT RATE
Income in Greenbriar
Income Overview in Greenbriar
Per Capita Income in Greenbriar is $57,232, while median incomes of families and households are $159,412 and $127,100 respectively.
| Characteristic | Number | Measure |
| Per Capita Income | 7,945 | $57,232 |
| Median Family Income | 2,144 | $159,412 |
| Mean Family Income | 2,144 | $167,526 |
| Median Household Income | 3,021 | $127,100 |
| Mean Household Income | 3,021 | $149,603 |
| Income Deficit | 2,144 | $0 |
| Wage / Income Gap (%) | 7,945 | 24.52% |
| Wage / Income Gap ($) | 7,945 | 75.48¢ per $1 |
| Gini / Inequality Index | 7,945 | 0.35 |
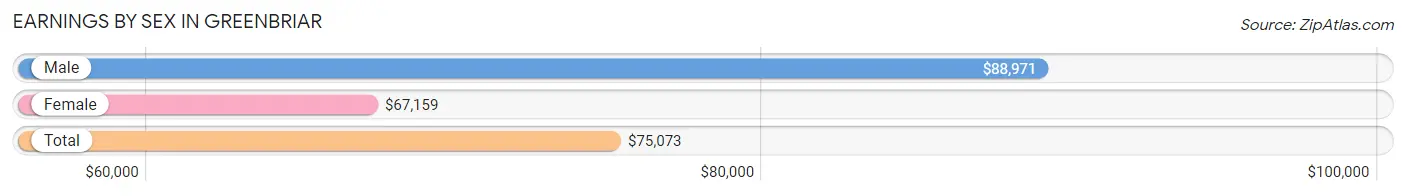
Earnings by Sex in Greenbriar
Average Earnings in Greenbriar are $75,073, $88,971 for men and $67,159 for women, a difference of 24.5%.
| Sex | Number | Average Earnings |
| Male | 2,436 (54.6%) | $88,971 |
| Female | 2,025 (45.4%) | $67,159 |
| Total | 4,461 (100.0%) | $75,073 |
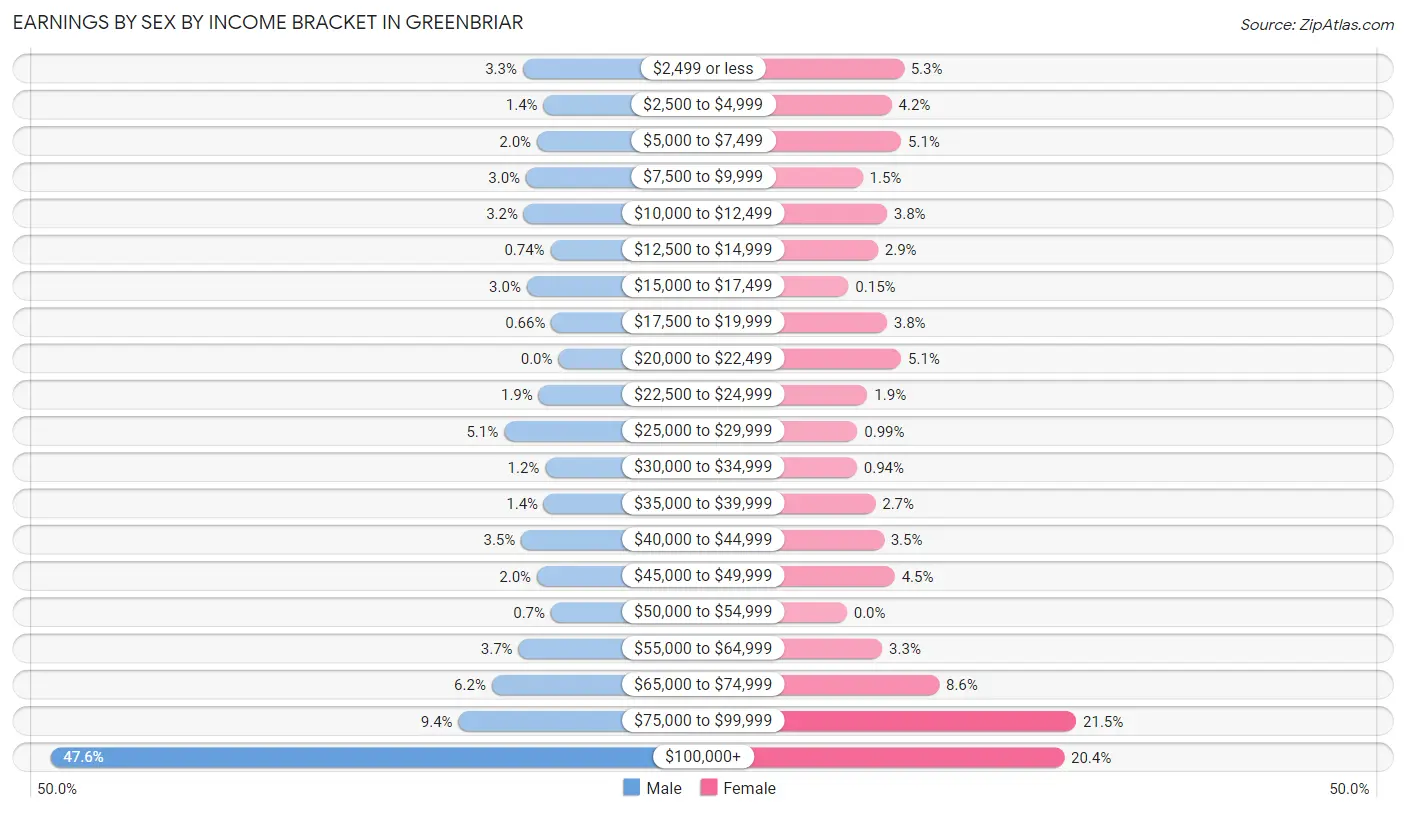
Earnings by Sex by Income Bracket in Greenbriar
The most common earnings brackets in Greenbriar are $100,000+ for men (1,159 | 47.6%) and $75,000 to $99,999 for women (435 | 21.5%).
| Income | Male | Female |
| $2,499 or less | 81 (3.3%) | 108 (5.3%) |
| $2,500 to $4,999 | 34 (1.4%) | 85 (4.2%) |
| $5,000 to $7,499 | 49 (2.0%) | 103 (5.1%) |
| $7,500 to $9,999 | 74 (3.0%) | 30 (1.5%) |
| $10,000 to $12,499 | 79 (3.2%) | 76 (3.7%) |
| $12,500 to $14,999 | 18 (0.7%) | 59 (2.9%) |
| $15,000 to $17,499 | 72 (3.0%) | 3 (0.2%) |
| $17,500 to $19,999 | 16 (0.7%) | 76 (3.7%) |
| $20,000 to $22,499 | 0 (0.0%) | 103 (5.1%) |
| $22,500 to $24,999 | 45 (1.8%) | 39 (1.9%) |
| $25,000 to $29,999 | 124 (5.1%) | 20 (1.0%) |
| $30,000 to $34,999 | 30 (1.2%) | 19 (0.9%) |
| $35,000 to $39,999 | 33 (1.3%) | 54 (2.7%) |
| $40,000 to $44,999 | 85 (3.5%) | 70 (3.5%) |
| $45,000 to $49,999 | 49 (2.0%) | 91 (4.5%) |
| $50,000 to $54,999 | 17 (0.7%) | 0 (0.0%) |
| $55,000 to $64,999 | 91 (3.7%) | 67 (3.3%) |
| $65,000 to $74,999 | 152 (6.2%) | 175 (8.6%) |
| $75,000 to $99,999 | 228 (9.4%) | 435 (21.5%) |
| $100,000+ | 1,159 (47.6%) | 412 (20.3%) |
| Total | 2,436 (100.0%) | 2,025 (100.0%) |
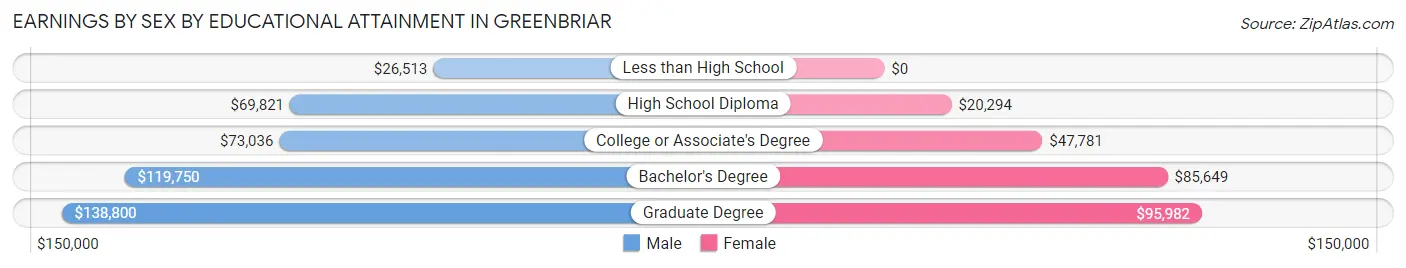
Earnings by Sex by Educational Attainment in Greenbriar
Average earnings in Greenbriar are $113,239 for men and $74,031 for women, a difference of 34.6%. Men with an educational attainment of graduate degree enjoy the highest average annual earnings of $138,800, while those with less than high school education earn the least with $26,513. Women with an educational attainment of graduate degree earn the most with the average annual earnings of $95,982, while those with high school diploma education have the smallest earnings of $20,294.
| Educational Attainment | Male Income | Female Income |
| Less than High School | $26,513 | $0 |
| High School Diploma | $69,821 | $20,294 |
| College or Associate's Degree | $73,036 | $47,781 |
| Bachelor's Degree | $119,750 | $85,649 |
| Graduate Degree | $138,800 | $95,982 |
| Total | $113,239 | $74,031 |
Family Income in Greenbriar
Family Income Brackets in Greenbriar
According to the Greenbriar family income data, there are 701 families falling into the $200,000+ income range, which is the most common income bracket and makes up 32.7% of all families.
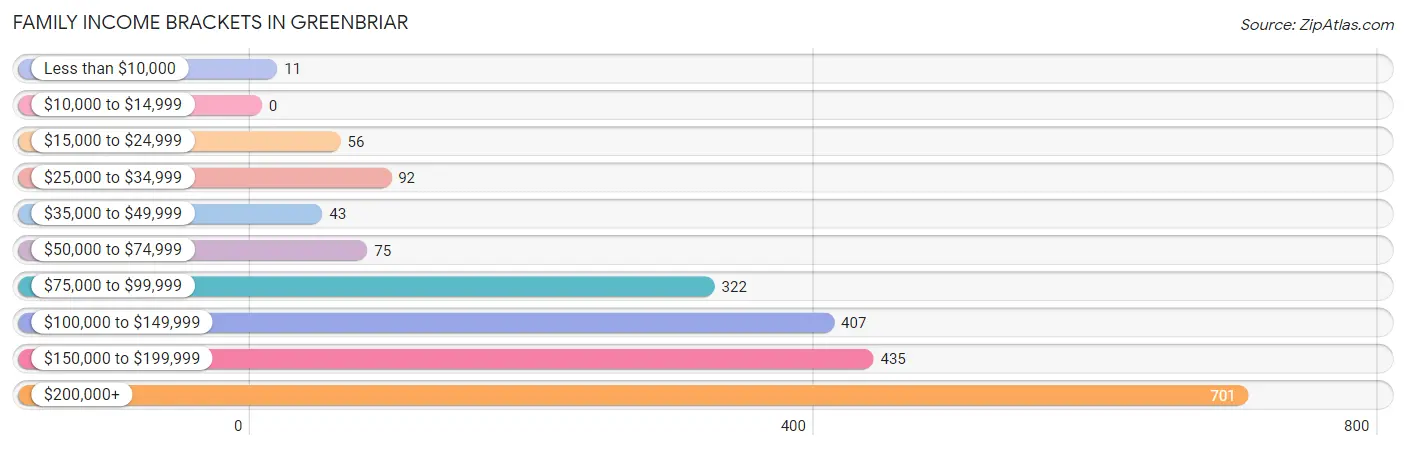
| Income Bracket | # Families | % Families |
| Less than $10,000 | 11 | 0.5% |
| $10,000 to $14,999 | 0 | 0.0% |
| $15,000 to $24,999 | 56 | 2.6% |
| $25,000 to $34,999 | 92 | 4.3% |
| $35,000 to $49,999 | 43 | 2.0% |
| $50,000 to $74,999 | 75 | 3.5% |
| $75,000 to $99,999 | 322 | 15.0% |
| $100,000 to $149,999 | 407 | 19.0% |
| $150,000 to $199,999 | 435 | 20.3% |
| $200,000+ | 701 | 32.7% |
Family Income by Famaliy Size in Greenbriar
5-person families (162 | 7.6%) account for the highest median family income in Greenbriar with $209,028 per family, while 2-person families (864 | 40.3%) have the highest median income of $66,932 per family member.
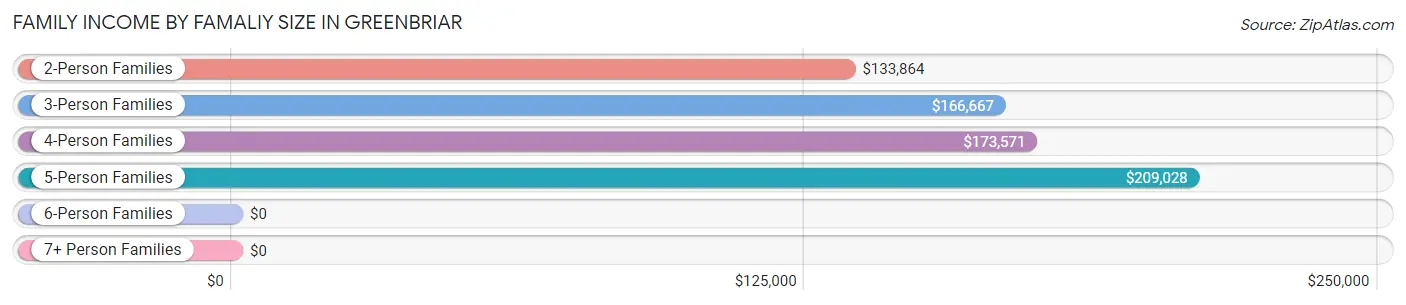
| Income Bracket | # Families | Median Income |
| 2-Person Families | 864 (40.3%) | $133,864 |
| 3-Person Families | 490 (22.9%) | $166,667 |
| 4-Person Families | 610 (28.4%) | $173,571 |
| 5-Person Families | 162 (7.6%) | $209,028 |
| 6-Person Families | 18 (0.8%) | $0 |
| 7+ Person Families | 0 (0.0%) | $0 |
| Total | 2,144 (100.0%) | $159,412 |
Family Income by Number of Earners in Greenbriar
The median family income in Greenbriar is $159,412, with families comprising 3+ earners (229) having the highest median family income of $216,417, while families with 1 earner (650) have the lowest median family income of $118,409, accounting for 10.7% and 30.3% of families, respectively.
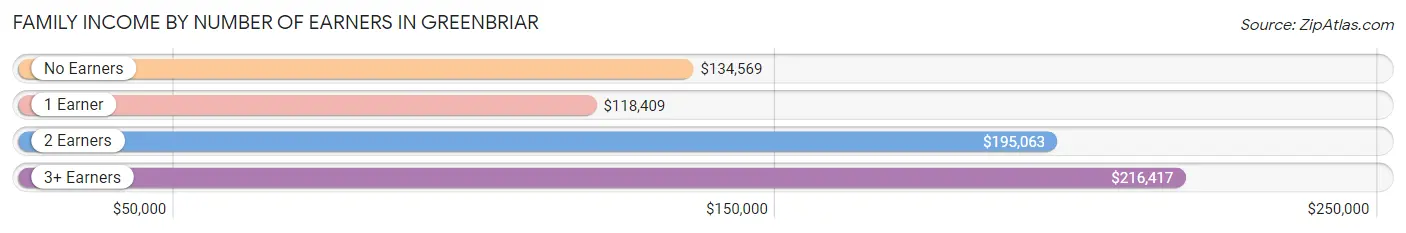
| Number of Earners | # Families | Median Income |
| No Earners | 246 (11.5%) | $134,569 |
| 1 Earner | 650 (30.3%) | $118,409 |
| 2 Earners | 1,019 (47.5%) | $195,063 |
| 3+ Earners | 229 (10.7%) | $216,417 |
| Total | 2,144 (100.0%) | $159,412 |
Household Income in Greenbriar
Household Income Brackets in Greenbriar
With 810 households falling in the category, the $200,000+ income range is the most frequent in Greenbriar, accounting for 26.8% of all households.
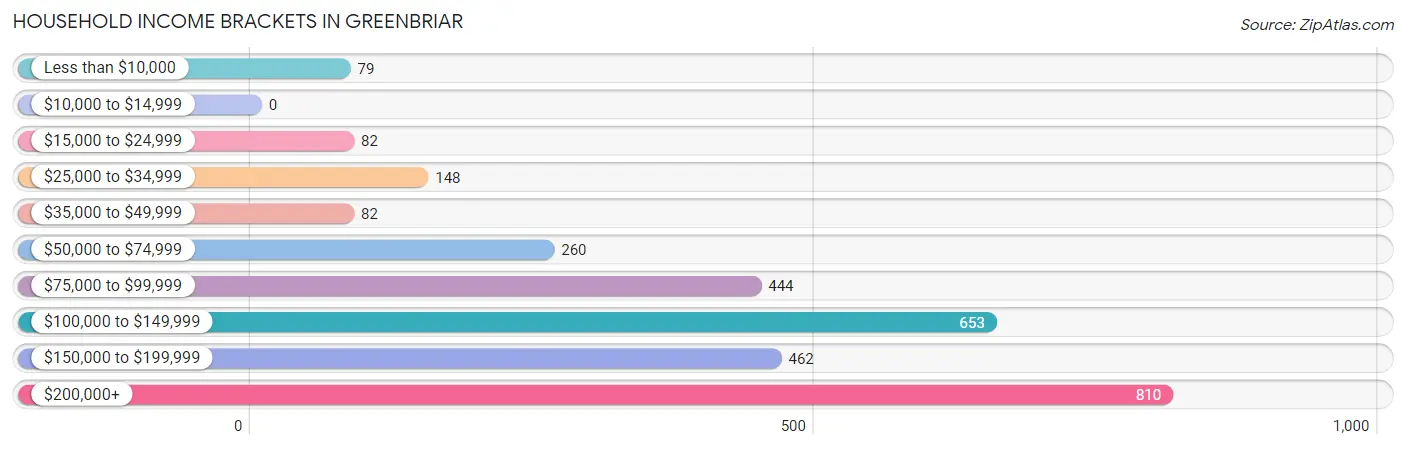
| Income Bracket | # Households | % Households |
| Less than $10,000 | 79 | 2.6% |
| $10,000 to $14,999 | 0 | 0.0% |
| $15,000 to $24,999 | 82 | 2.7% |
| $25,000 to $34,999 | 148 | 4.9% |
| $35,000 to $49,999 | 82 | 2.7% |
| $50,000 to $74,999 | 260 | 8.6% |
| $75,000 to $99,999 | 444 | 14.7% |
| $100,000 to $149,999 | 653 | 21.6% |
| $150,000 to $199,999 | 462 | 15.3% |
| $200,000+ | 810 | 26.8% |
Household Income by Householder Age in Greenbriar
The median household income in Greenbriar is $127,100, with the highest median household income of $195,037 found in the 25 to 44 years age bracket for the primary householder. A total of 908 households (30.1%) fall into this category. Meanwhile, the 15 to 24 years age bracket for the primary householder has the lowest median household income of $0, with 221 households (7.3%) in this group.
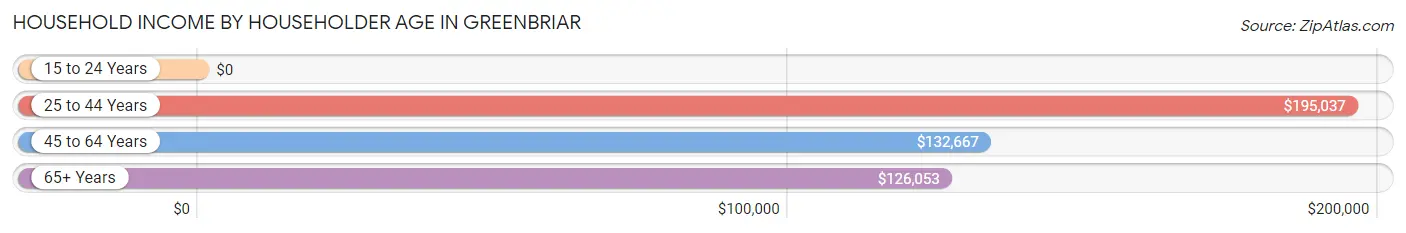
| Income Bracket | # Households | Median Income |
| 15 to 24 Years | 221 (7.3%) | $0 |
| 25 to 44 Years | 908 (30.1%) | $195,037 |
| 45 to 64 Years | 1,156 (38.3%) | $132,667 |
| 65+ Years | 736 (24.4%) | $126,053 |
| Total | 3,021 (100.0%) | $127,100 |
Poverty in Greenbriar
Income Below Poverty by Sex and Age in Greenbriar
With 8.6% poverty level for males and 5.6% for females among the residents of Greenbriar, 16 and 17 year old males and under 5 year old females are the most vulnerable to poverty, with 36 males (22.2%) and 63 females (26.5%) in their respective age groups living below the poverty level.
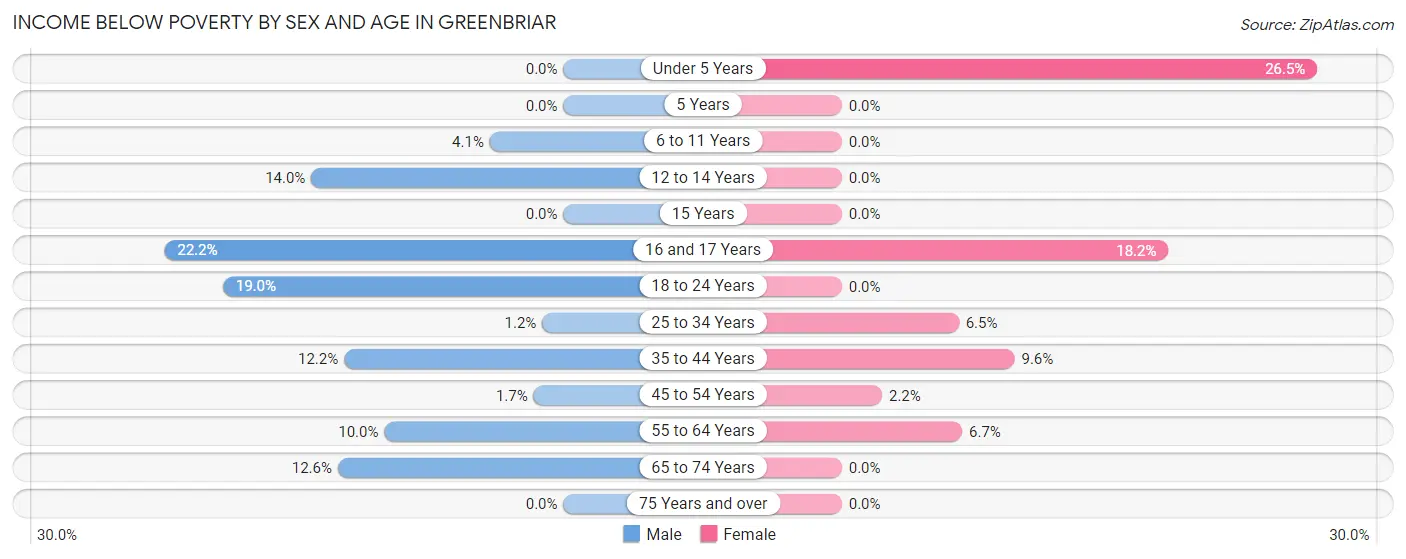
| Age Bracket | Male | Female |
| Under 5 Years | 0 (0.0%) | 63 (26.5%) |
| 5 Years | 0 (0.0%) | 0 (0.0%) |
| 6 to 11 Years | 10 (4.1%) | 0 (0.0%) |
| 12 to 14 Years | 33 (14.0%) | 0 (0.0%) |
| 15 Years | 0 (0.0%) | 0 (0.0%) |
| 16 and 17 Years | 36 (22.2%) | 18 (18.2%) |
| 18 to 24 Years | 98 (19.0%) | 0 (0.0%) |
| 25 to 34 Years | 3 (1.2%) | 31 (6.5%) |
| 35 to 44 Years | 79 (12.2%) | 55 (9.6%) |
| 45 to 54 Years | 12 (1.7%) | 11 (2.2%) |
| 55 to 64 Years | 38 (10.0%) | 28 (6.7%) |
| 65 to 74 Years | 52 (12.6%) | 0 (0.0%) |
| 75 Years and over | 0 (0.0%) | 0 (0.0%) |
| Total | 361 (8.6%) | 206 (5.6%) |
Income Above Poverty by Sex and Age in Greenbriar
According to the poverty statistics in Greenbriar, males aged under 5 years and females aged 6 to 11 years are the age groups that are most secure financially, with 100.0% of males and 100.0% of females in these age groups living above the poverty line.
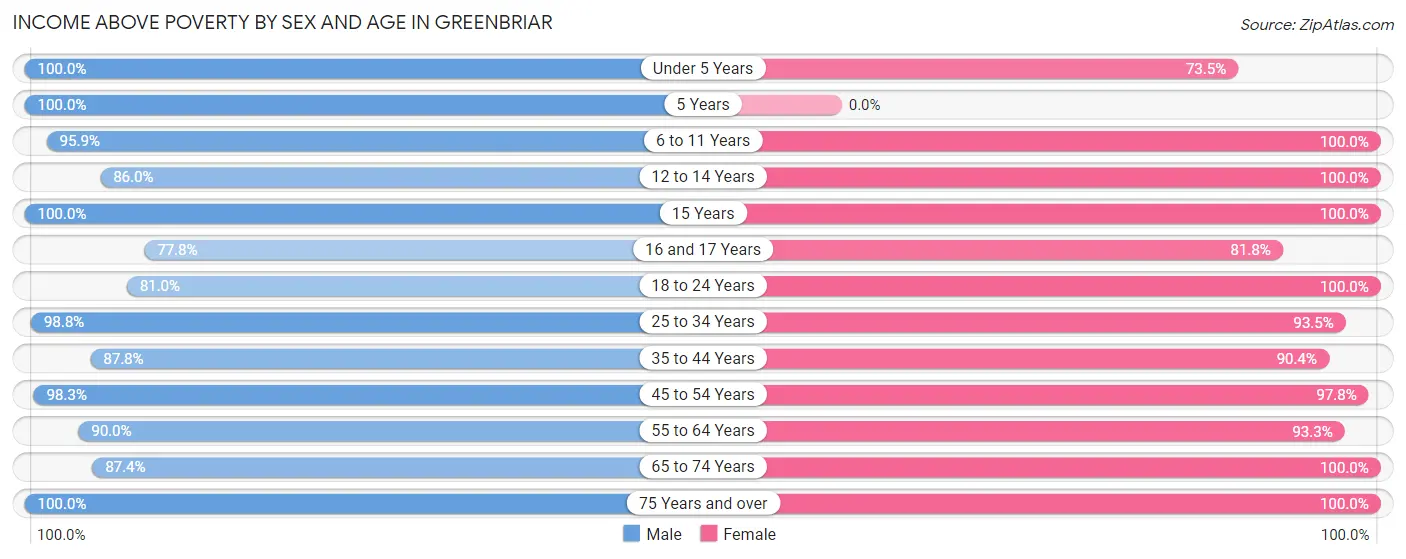
| Age Bracket | Male | Female |
| Under 5 Years | 314 (100.0%) | 175 (73.5%) |
| 5 Years | 8 (100.0%) | 0 (0.0%) |
| 6 to 11 Years | 234 (95.9%) | 184 (100.0%) |
| 12 to 14 Years | 202 (86.0%) | 194 (100.0%) |
| 15 Years | 78 (100.0%) | 34 (100.0%) |
| 16 and 17 Years | 126 (77.8%) | 81 (81.8%) |
| 18 to 24 Years | 419 (81.0%) | 395 (100.0%) |
| 25 to 34 Years | 251 (98.8%) | 445 (93.5%) |
| 35 to 44 Years | 568 (87.8%) | 517 (90.4%) |
| 45 to 54 Years | 713 (98.3%) | 480 (97.8%) |
| 55 to 64 Years | 343 (90.0%) | 390 (93.3%) |
| 65 to 74 Years | 362 (87.4%) | 347 (100.0%) |
| 75 Years and over | 208 (100.0%) | 238 (100.0%) |
| Total | 3,826 (91.4%) | 3,480 (94.4%) |
Income Below Poverty Among Married-Couple Families in Greenbriar
The poverty statistics for married-couple families in Greenbriar show that 1.1% or 18 of the total 1,720 families live below the poverty line. Families with 1 or 2 children have the highest poverty rate of 2.2%, comprising of 18 families. On the other hand, families with no children have the lowest poverty rate of 0.0%, which includes 0 families.
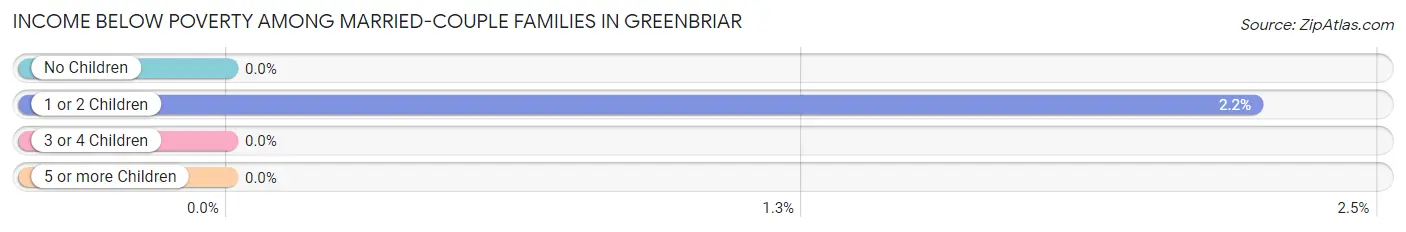
| Children | Above Poverty | Below Poverty |
| No Children | 829 (100.0%) | 0 (0.0%) |
| 1 or 2 Children | 788 (97.8%) | 18 (2.2%) |
| 3 or 4 Children | 85 (100.0%) | 0 (0.0%) |
| 5 or more Children | 0 (0.0%) | 0 (0.0%) |
| Total | 1,702 (99.0%) | 18 (1.1%) |
Income Below Poverty Among Single-Parent Households in Greenbriar
According to the poverty data in Greenbriar, 40.8% or 93 single-father households and 5.6% or 11 single-mother households are living below the poverty line. Among single-father households, those with 1 or 2 children have the highest poverty rate, with 93 households (67.9%) experiencing poverty. Likewise, among single-mother households, those with 1 or 2 children have the highest poverty rate, with 11 households (15.1%) falling below the poverty line.
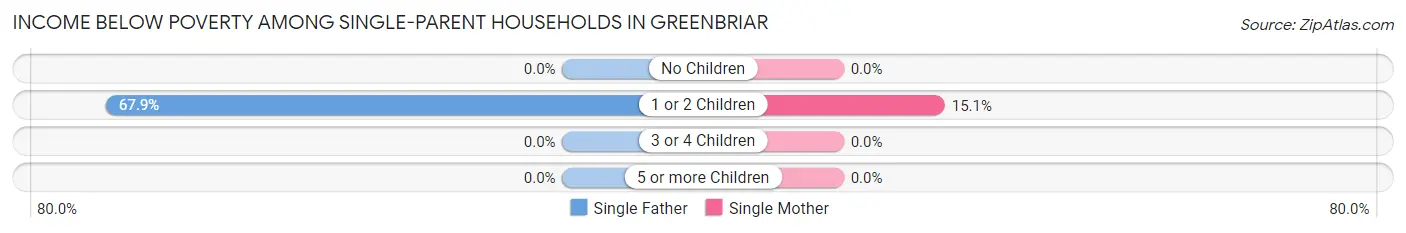
| Children | Single Father | Single Mother |
| No Children | 0 (0.0%) | 0 (0.0%) |
| 1 or 2 Children | 93 (67.9%) | 11 (15.1%) |
| 3 or 4 Children | 0 (0.0%) | 0 (0.0%) |
| 5 or more Children | 0 (0.0%) | 0 (0.0%) |
| Total | 93 (40.8%) | 11 (5.6%) |
Income Below Poverty Among Married-Couple vs Single-Parent Households in Greenbriar
The poverty data for Greenbriar shows that 18 of the married-couple family households (1.1%) and 104 of the single-parent households (24.5%) are living below the poverty level. Within the married-couple family households, those with 1 or 2 children have the highest poverty rate, with 18 households (2.2%) falling below the poverty line. Among the single-parent households, those with 1 or 2 children have the highest poverty rate, with 104 household (49.5%) living below poverty.
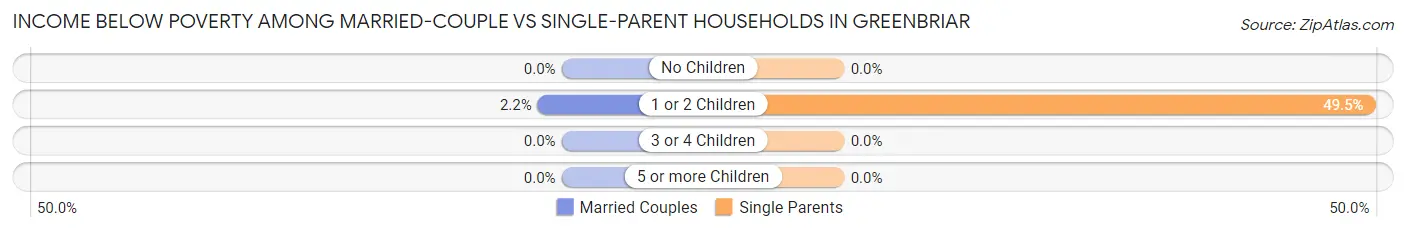
| Children | Married-Couple Families | Single-Parent Households |
| No Children | 0 (0.0%) | 0 (0.0%) |
| 1 or 2 Children | 18 (2.2%) | 104 (49.5%) |
| 3 or 4 Children | 0 (0.0%) | 0 (0.0%) |
| 5 or more Children | 0 (0.0%) | 0 (0.0%) |
| Total | 18 (1.1%) | 104 (24.5%) |
Race in Greenbriar
The most populous races in Greenbriar are White / Caucasian (4,747 | 59.8%), Asian (1,956 | 24.6%), and Two or more Races (787 | 9.9%).
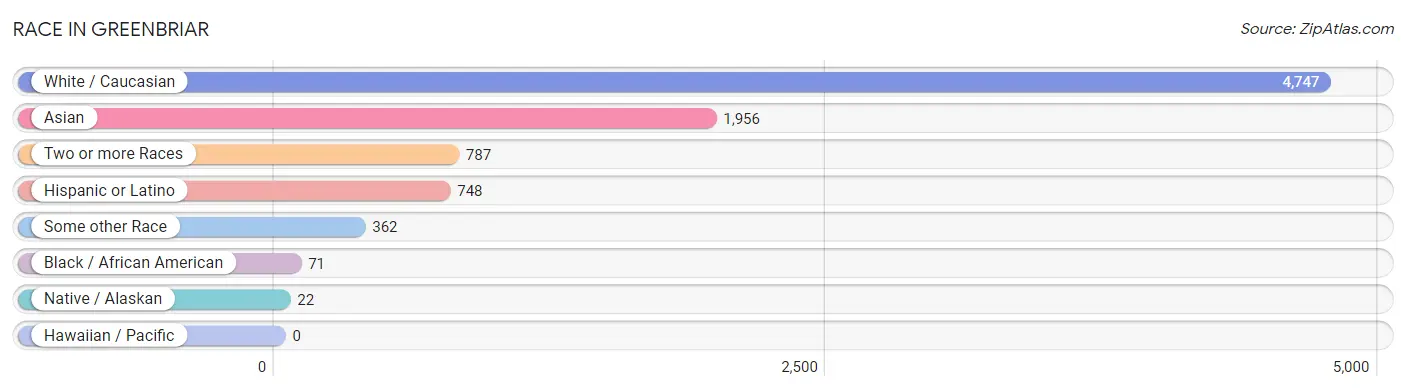
| Race | # Population | % Population |
| Asian | 1,956 | 24.6% |
| Black / African American | 71 | 0.9% |
| Hawaiian / Pacific | 0 | 0.0% |
| Hispanic or Latino | 748 | 9.4% |
| Native / Alaskan | 22 | 0.3% |
| White / Caucasian | 4,747 | 59.8% |
| Two or more Races | 787 | 9.9% |
| Some other Race | 362 | 4.6% |
| Total | 7,945 | 100.0% |
Ancestry in Greenbriar
The most populous ancestries reported in Greenbriar are Thai (999 | 12.6%), German (935 | 11.8%), English (866 | 10.9%), Irish (595 | 7.5%), and Burmese (377 | 4.8%), together accounting for 47.5% of all Greenbriar residents.
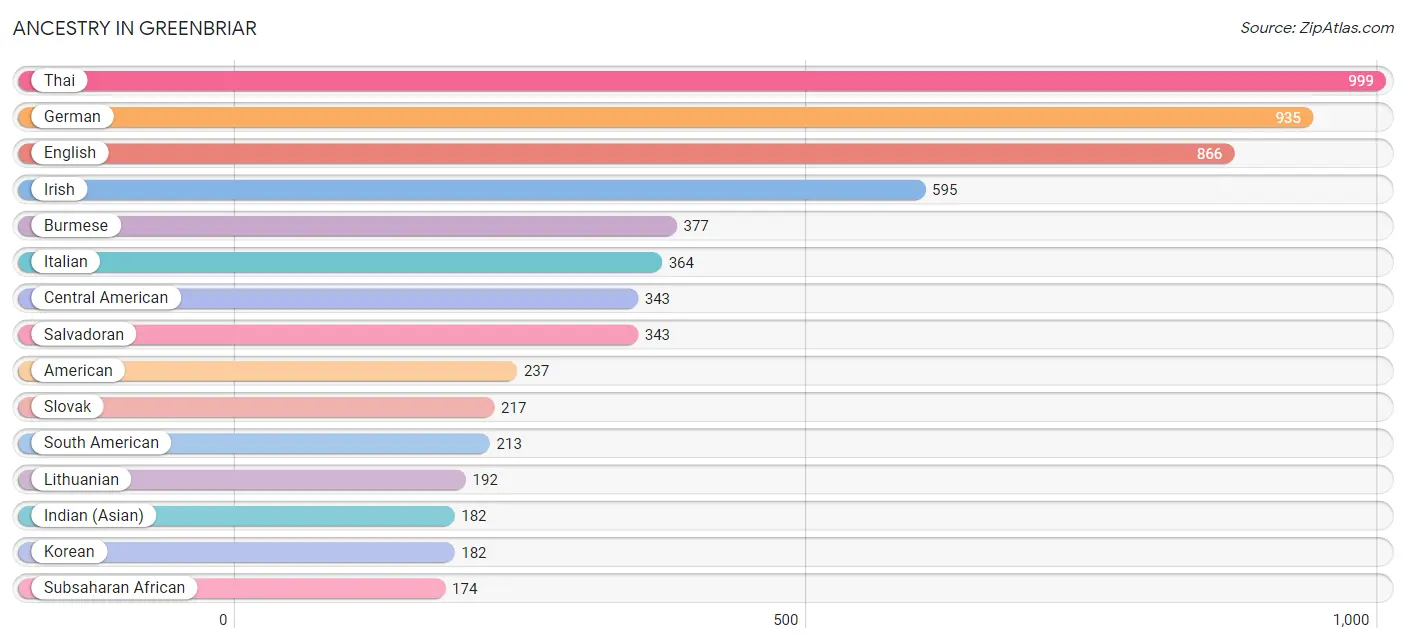
| Ancestry | # Population | % Population |
| Afghan | 7 | 0.1% |
| African | 19 | 0.2% |
| American | 237 | 3.0% |
| Arab | 140 | 1.8% |
| Belgian | 16 | 0.2% |
| Bhutanese | 95 | 1.2% |
| Blackfeet | 29 | 0.4% |
| Bolivian | 26 | 0.3% |
| British | 125 | 1.6% |
| Burmese | 377 | 4.8% |
| Cajun | 16 | 0.2% |
| Canadian | 19 | 0.2% |
| Cape Verdean | 10 | 0.1% |
| Central American | 343 | 4.3% |
| Chilean | 65 | 0.8% |
| Colombian | 70 | 0.9% |
| Croatian | 8 | 0.1% |
| Czech | 58 | 0.7% |
| Danish | 28 | 0.4% |
| Dutch | 53 | 0.7% |
| Eastern European | 163 | 2.1% |
| English | 866 | 10.9% |
| European | 149 | 1.9% |
| French | 88 | 1.1% |
| French Canadian | 60 | 0.8% |
| German | 935 | 11.8% |
| Greek | 13 | 0.2% |
| Hungarian | 37 | 0.5% |
| Indian (Asian) | 182 | 2.3% |
| Iranian | 13 | 0.2% |
| Irish | 595 | 7.5% |
| Italian | 364 | 4.6% |
| Japanese | 23 | 0.3% |
| Kenyan | 119 | 1.5% |
| Korean | 182 | 2.3% |
| Latvian | 22 | 0.3% |
| Lebanese | 116 | 1.5% |
| Lithuanian | 192 | 2.4% |
| Mexican | 137 | 1.7% |
| Mexican American Indian | 6 | 0.1% |
| Native Hawaiian | 28 | 0.4% |
| Norwegian | 108 | 1.4% |
| Palestinian | 10 | 0.1% |
| Peruvian | 52 | 0.6% |
| Polish | 90 | 1.1% |
| Portuguese | 47 | 0.6% |
| Puerto Rican | 16 | 0.2% |
| Romanian | 18 | 0.2% |
| Russian | 17 | 0.2% |
| Salvadoran | 343 | 4.3% |
| Scandinavian | 48 | 0.6% |
| Scotch-Irish | 127 | 1.6% |
| Scottish | 59 | 0.7% |
| Slovak | 217 | 2.7% |
| South African | 36 | 0.4% |
| South American | 213 | 2.7% |
| Spanish | 16 | 0.2% |
| Sri Lankan | 165 | 2.1% |
| Subsaharan African | 174 | 2.2% |
| Swedish | 105 | 1.3% |
| Thai | 999 | 12.6% |
| Turkish | 109 | 1.4% |
| Ukrainian | 12 | 0.2% |
| Vietnamese | 1 | 0.0% | View All 64 Rows |
Immigrants in Greenbriar
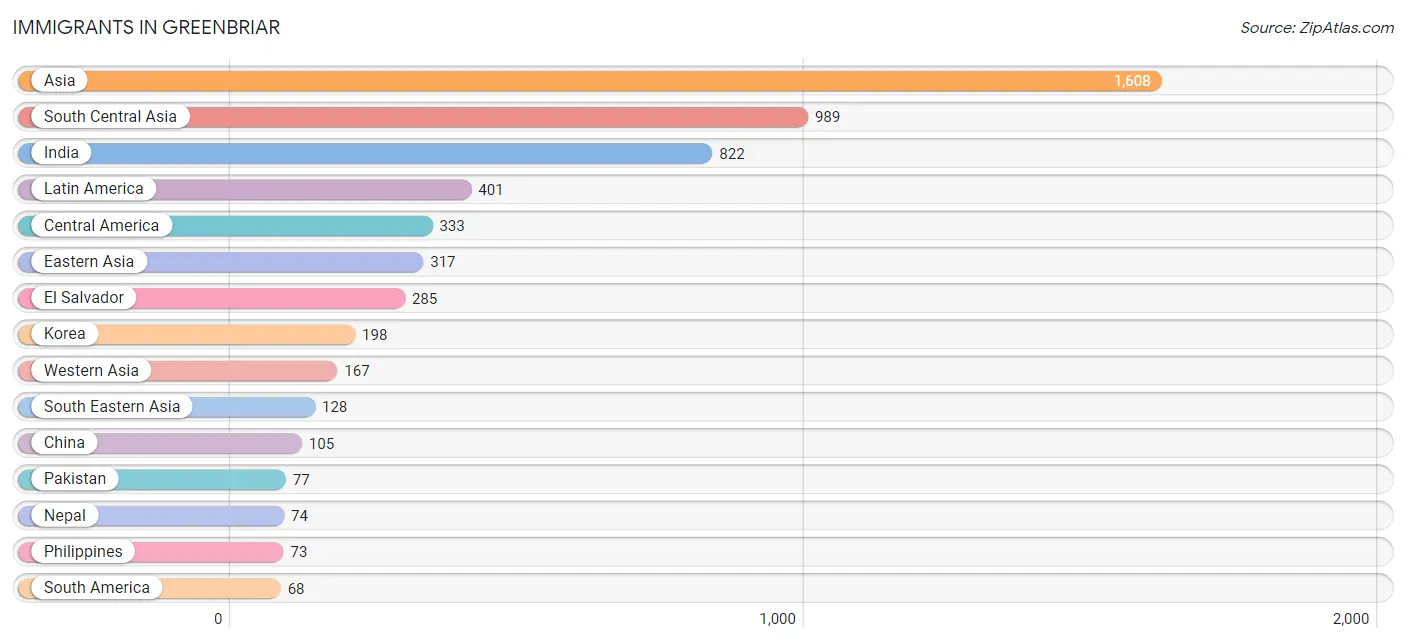
The most numerous immigrant groups reported in Greenbriar came from Asia (1,608 | 20.2%), South Central Asia (989 | 12.4%), India (822 | 10.3%), Latin America (401 | 5.1%), and Central America (333 | 4.2%), together accounting for 52.3% of all Greenbriar residents.
| Immigration Origin | # Population | % Population |
| Afghanistan | 2 | 0.0% |
| Africa | 55 | 0.7% |
| Asia | 1,608 | 20.2% |
| Bangladesh | 1 | 0.0% |
| Bolivia | 26 | 0.3% |
| Cambodia | 8 | 0.1% |
| Canada | 12 | 0.2% |
| Central America | 333 | 4.2% |
| China | 105 | 1.3% |
| Colombia | 23 | 0.3% |
| Eastern Asia | 317 | 4.0% |
| Eastern Europe | 14 | 0.2% |
| El Salvador | 285 | 3.6% |
| Europe | 26 | 0.3% |
| Germany | 12 | 0.2% |
| Ghana | 19 | 0.2% |
| India | 822 | 10.3% |
| Iran | 13 | 0.2% |
| Japan | 14 | 0.2% |
| Jordan | 7 | 0.1% |
| Korea | 198 | 2.5% |
| Latin America | 401 | 5.1% |
| Lebanon | 51 | 0.6% |
| Mexico | 48 | 0.6% |
| Moldova | 14 | 0.2% |
| Nepal | 74 | 0.9% |
| Pakistan | 77 | 1.0% |
| Peru | 19 | 0.2% |
| Philippines | 73 | 0.9% |
| South Africa | 36 | 0.4% |
| South America | 68 | 0.9% |
| South Central Asia | 989 | 12.4% |
| South Eastern Asia | 128 | 1.6% |
| Turkey | 56 | 0.7% |
| Vietnam | 47 | 0.6% |
| Western Africa | 19 | 0.2% |
| Western Asia | 167 | 2.1% |
| Western Europe | 12 | 0.2% | View All 38 Rows |
Sex and Age in Greenbriar
Sex and Age in Greenbriar
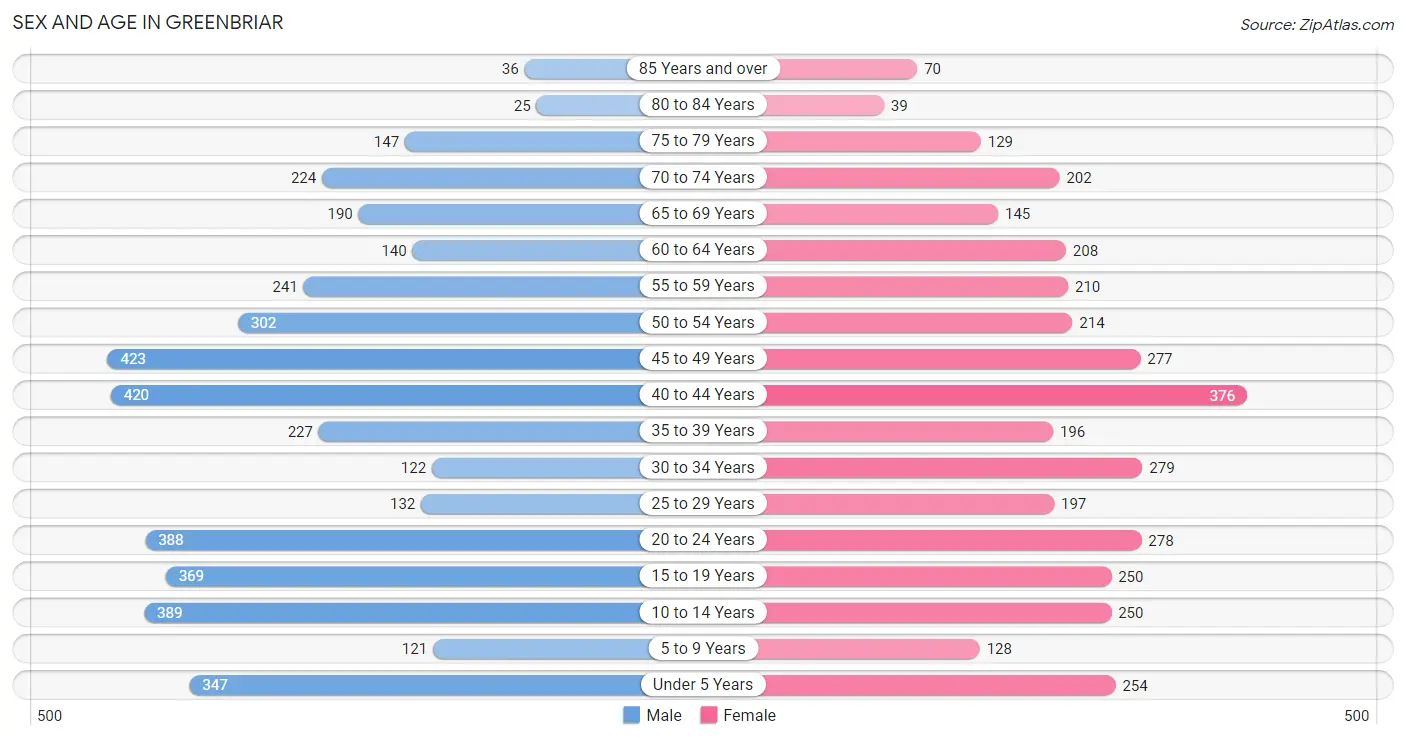
The most populous age groups in Greenbriar are 45 to 49 Years (423 | 10.0%) for men and 40 to 44 Years (376 | 10.2%) for women.
| Age Bracket | Male | Female |
| Under 5 Years | 347 (8.2%) | 254 (6.9%) |
| 5 to 9 Years | 121 (2.9%) | 128 (3.5%) |
| 10 to 14 Years | 389 (9.2%) | 250 (6.8%) |
| 15 to 19 Years | 369 (8.7%) | 250 (6.8%) |
| 20 to 24 Years | 388 (9.1%) | 278 (7.5%) |
| 25 to 29 Years | 132 (3.1%) | 197 (5.3%) |
| 30 to 34 Years | 122 (2.9%) | 279 (7.5%) |
| 35 to 39 Years | 227 (5.3%) | 196 (5.3%) |
| 40 to 44 Years | 420 (9.9%) | 376 (10.2%) |
| 45 to 49 Years | 423 (10.0%) | 277 (7.5%) |
| 50 to 54 Years | 302 (7.1%) | 214 (5.8%) |
| 55 to 59 Years | 241 (5.7%) | 210 (5.7%) |
| 60 to 64 Years | 140 (3.3%) | 208 (5.6%) |
| 65 to 69 Years | 190 (4.5%) | 145 (3.9%) |
| 70 to 74 Years | 224 (5.3%) | 202 (5.5%) |
| 75 to 79 Years | 147 (3.5%) | 129 (3.5%) |
| 80 to 84 Years | 25 (0.6%) | 39 (1.1%) |
| 85 Years and over | 36 (0.9%) | 70 (1.9%) |
| Total | 4,243 (100.0%) | 3,702 (100.0%) |
Families and Households in Greenbriar
Median Family Size in Greenbriar
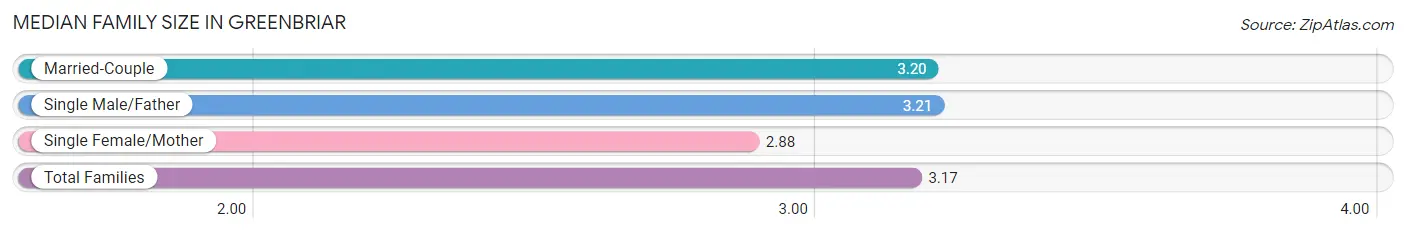
The median family size in Greenbriar is 3.17 persons per family, with single male/father families (228 | 10.6%) accounting for the largest median family size of 3.21 persons per family. On the other hand, single female/mother families (196 | 9.1%) represent the smallest median family size with 2.88 persons per family.
| Family Type | # Families | Family Size |
| Married-Couple | 1,720 (80.2%) | 3.20 |
| Single Male/Father | 228 (10.6%) | 3.21 |
| Single Female/Mother | 196 (9.1%) | 2.88 |
| Total Families | 2,144 (100.0%) | 3.17 |
Median Household Size in Greenbriar
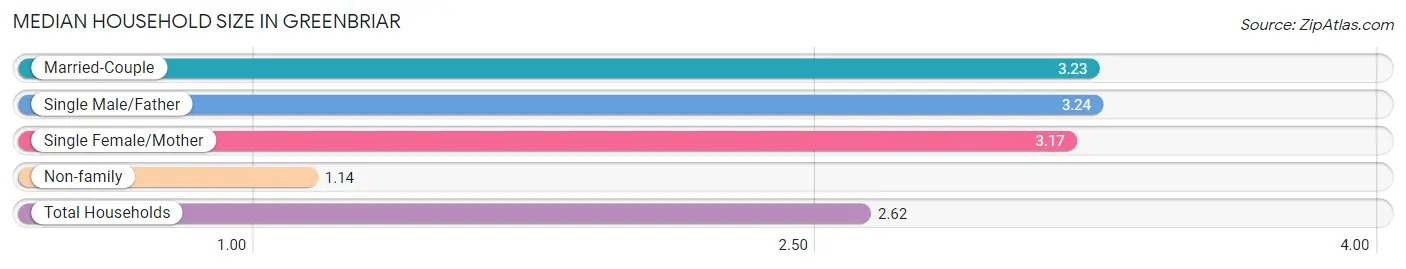
The median household size in Greenbriar is 2.62 persons per household, with single male/father households (228 | 7.5%) accounting for the largest median household size of 3.24 persons per household. non-family households (877 | 29.0%) represent the smallest median household size with 1.14 persons per household.
| Household Type | # Households | Household Size |
| Married-Couple | 1,720 (56.9%) | 3.23 |
| Single Male/Father | 228 (7.5%) | 3.24 |
| Single Female/Mother | 196 (6.5%) | 3.17 |
| Non-family | 877 (29.0%) | 1.14 |
| Total Households | 3,021 (100.0%) | 2.62 |
Household Size by Marriage Status in Greenbriar
Out of a total of 3,021 households in Greenbriar, 2,144 (71.0%) are family households, while 877 (29.0%) are nonfamily households. The most numerous type of family households are 2-person households, comprising 806, and the most common type of nonfamily households are 1-person households, comprising 758.
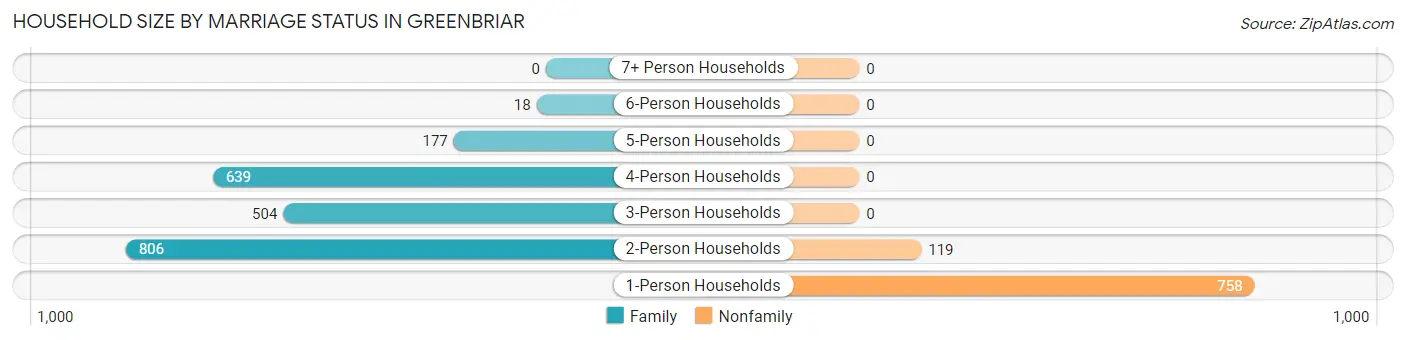
| Household Size | Family Households | Nonfamily Households |
| 1-Person Households | - | 758 (25.1%) |
| 2-Person Households | 806 (26.7%) | 119 (3.9%) |
| 3-Person Households | 504 (16.7%) | 0 (0.0%) |
| 4-Person Households | 639 (21.1%) | 0 (0.0%) |
| 5-Person Households | 177 (5.9%) | 0 (0.0%) |
| 6-Person Households | 18 (0.6%) | 0 (0.0%) |
| 7+ Person Households | 0 (0.0%) | 0 (0.0%) |
| Total | 2,144 (71.0%) | 877 (29.0%) |
Female Fertility in Greenbriar
Fertility by Age in Greenbriar
Average fertility rate in Greenbriar is 20.0 births per 1,000 women. Women in the age bracket of 35 to 50 years have the highest fertility rate with 25.0 births per 1,000 women. Women in the age bracket of 35 to 50 years acount for 57.9% of all women with births.
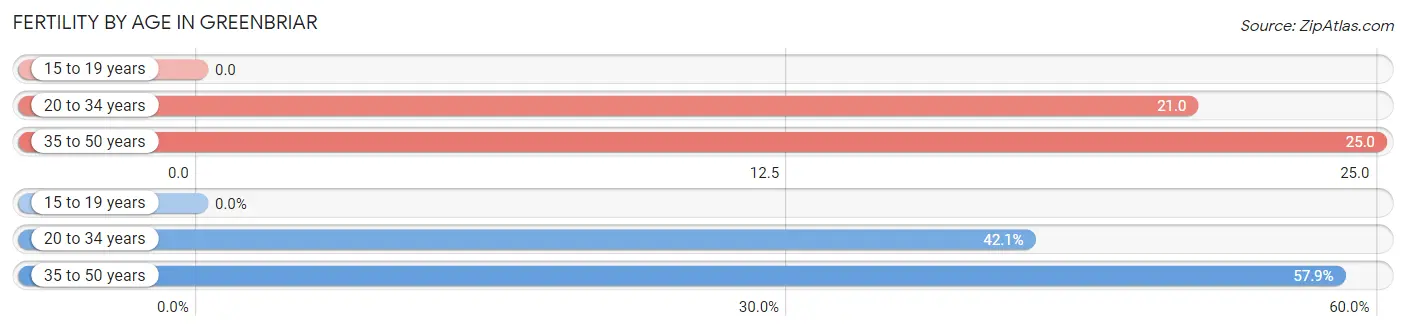
| Age Bracket | Women with Births | Births / 1,000 Women |
| 15 to 19 years | 0 (0.0%) | 0.0 |
| 20 to 34 years | 16 (42.1%) | 21.0 |
| 35 to 50 years | 22 (57.9%) | 25.0 |
| Total | 38 (100.0%) | 20.0 |
Fertility by Age by Marriage Status in Greenbriar
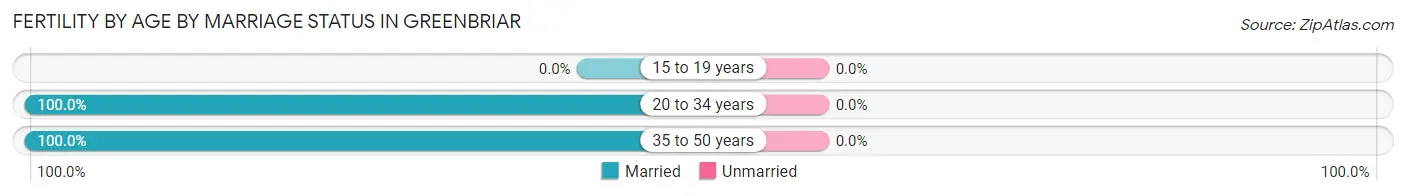
| Age Bracket | Married | Unmarried |
| 15 to 19 years | 0 (0.0%) | 0 (0.0%) |
| 20 to 34 years | 16 (100.0%) | 0 (0.0%) |
| 35 to 50 years | 22 (100.0%) | 0 (0.0%) |
| Total | 38 (100.0%) | 0 (0.0%) |
Fertility by Education in Greenbriar
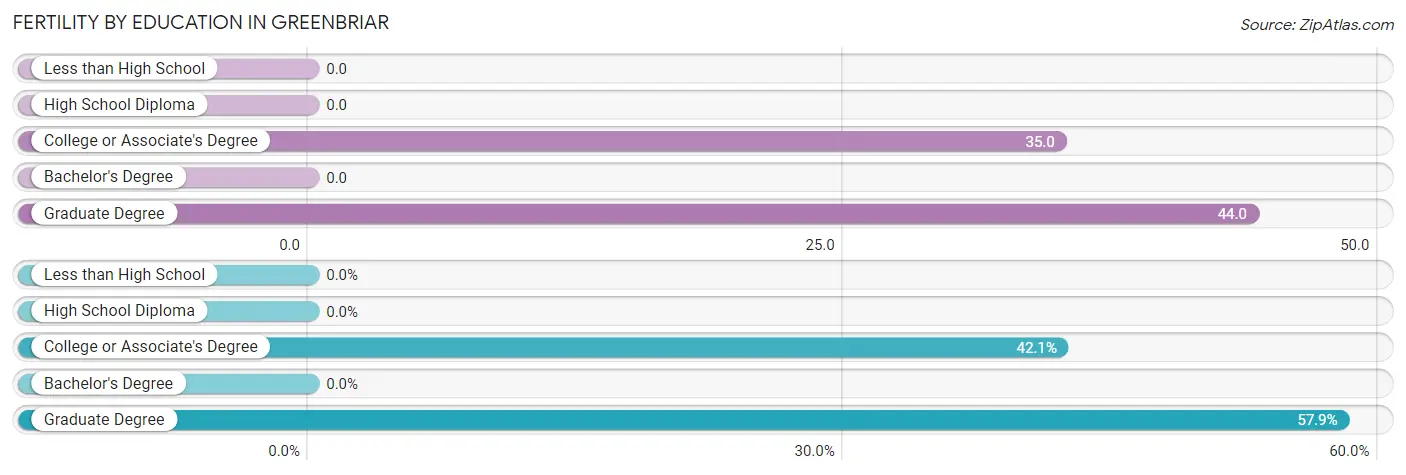
| Educational Attainment | Women with Births | Births / 1,000 Women |
| Less than High School | 0 (0.0%) | 0.0 |
| High School Diploma | 0 (0.0%) | 0.0 |
| College or Associate's Degree | 16 (42.1%) | 35.0 |
| Bachelor's Degree | 0 (0.0%) | 0.0 |
| Graduate Degree | 22 (57.9%) | 44.0 |
| Total | 38 (100.0%) | 20.0 |
Fertility by Education by Marriage Status in Greenbriar
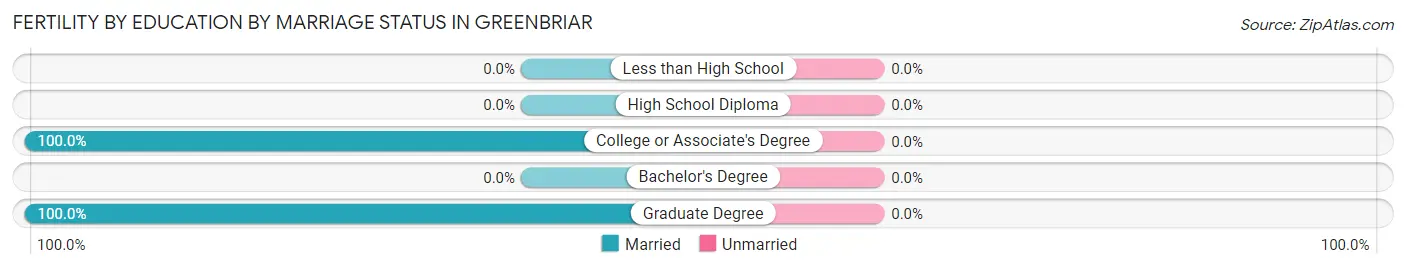
| Educational Attainment | Married | Unmarried |
| Less than High School | 0 (0.0%) | 0 (0.0%) |
| High School Diploma | 0 (0.0%) | 0 (0.0%) |
| College or Associate's Degree | 16 (100.0%) | 0 (0.0%) |
| Bachelor's Degree | 0 (0.0%) | 0 (0.0%) |
| Graduate Degree | 22 (100.0%) | 0 (0.0%) |
| Total | 38 (100.0%) | 0 (0.0%) |
Employment Characteristics in Greenbriar
Employment by Class of Employer in Greenbriar
Among the 4,061 employed individuals in Greenbriar, private company employees (2,463 | 60.7%), federal government employees (590 | 14.5%), and not-for-profit organizations (384 | 9.5%) make up the most common classes of employment.
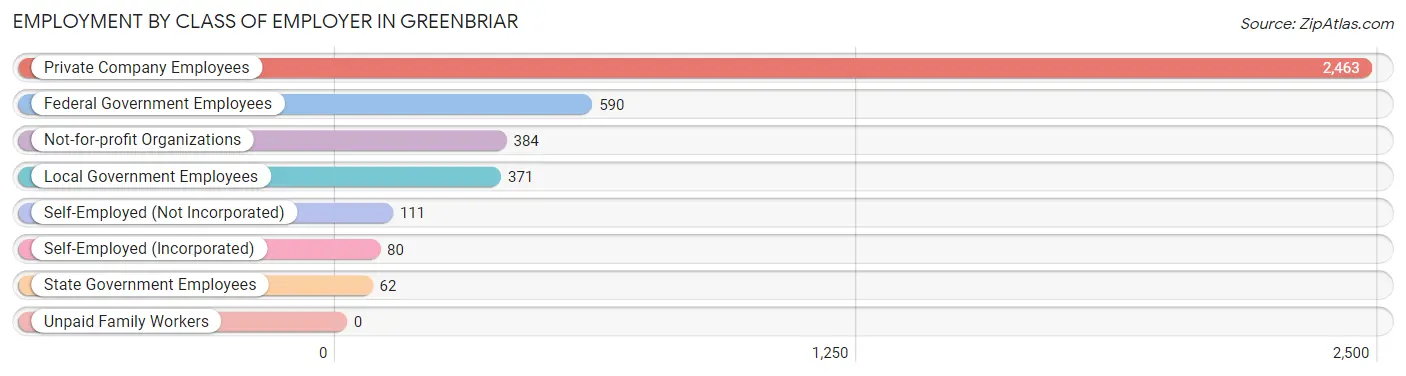
| Employer Class | # Employees | % Employees |
| Private Company Employees | 2,463 | 60.7% |
| Self-Employed (Incorporated) | 80 | 2.0% |
| Self-Employed (Not Incorporated) | 111 | 2.7% |
| Not-for-profit Organizations | 384 | 9.5% |
| Local Government Employees | 371 | 9.1% |
| State Government Employees | 62 | 1.5% |
| Federal Government Employees | 590 | 14.5% |
| Unpaid Family Workers | 0 | 0.0% |
| Total | 4,061 | 100.0% |
Employment Status by Age in Greenbriar
According to the labor force statistics for Greenbriar, out of the total population over 16 years of age (6,344), 66.5% or 4,219 individuals are in the labor force, with 1.9% or 80 of them unemployed. The age group with the highest labor force participation rate is 45 to 54 years, with 91.9% or 1,118 individuals in the labor force. Within the labor force, the 30 to 34 years age range has the highest percentage of unemployed individuals, with 5.3% or 16 of them being unemployed.
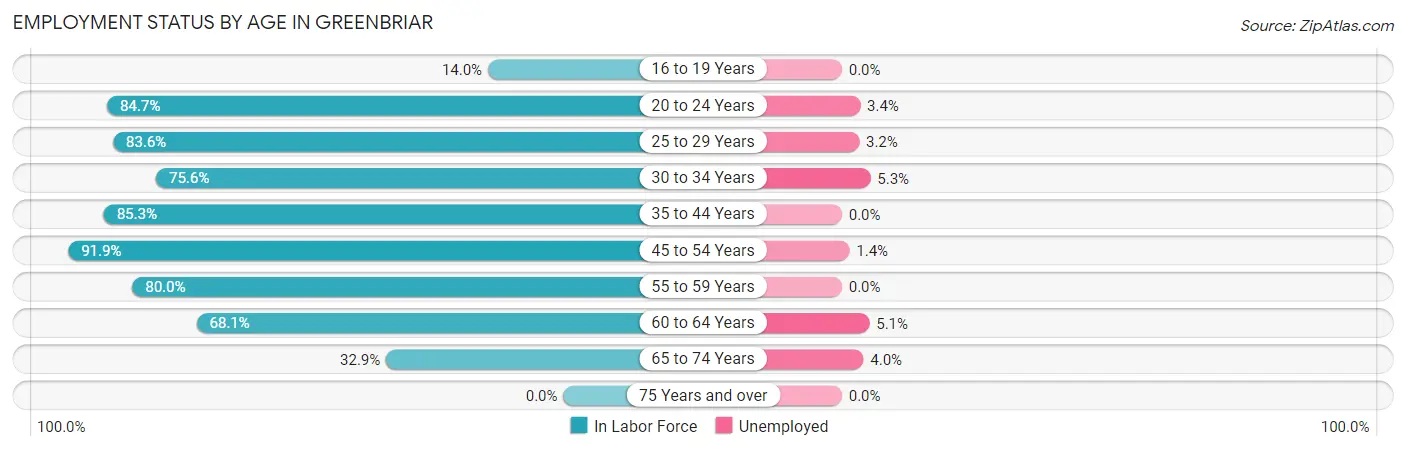
| Age Bracket | In Labor Force | Unemployed |
| 16 to 19 Years | 71 (14.0%) | 0 (0.0%) |
| 20 to 24 Years | 564 (84.7%) | 19 (3.4%) |
| 25 to 29 Years | 275 (83.6%) | 9 (3.2%) |
| 30 to 34 Years | 303 (75.6%) | 16 (5.3%) |
| 35 to 44 Years | 1,040 (85.3%) | 0 (0.0%) |
| 45 to 54 Years | 1,118 (91.9%) | 16 (1.4%) |
| 55 to 59 Years | 361 (80.0%) | 0 (0.0%) |
| 60 to 64 Years | 237 (68.1%) | 12 (5.1%) |
| 65 to 74 Years | 250 (32.9%) | 10 (4.0%) |
| 75 Years and over | 0 (0.0%) | 0 (0.0%) |
| Total | 4,219 (66.5%) | 80 (1.9%) |
Employment Status by Educational Attainment in Greenbriar
According to labor force statistics for Greenbriar, 84.1% of individuals (3,334) out of the total population between 25 and 64 years of age (3,964) are in the labor force, with 1.5% or 50 of them being unemployed. The group with the highest labor force participation rate are those with the educational attainment of bachelor's degree or higher, with 86.9% or 2,294 individuals in the labor force. Within the labor force, individuals with college / associate degree education have the highest percentage of unemployment, with 3.9% or 25 of them being unemployed.
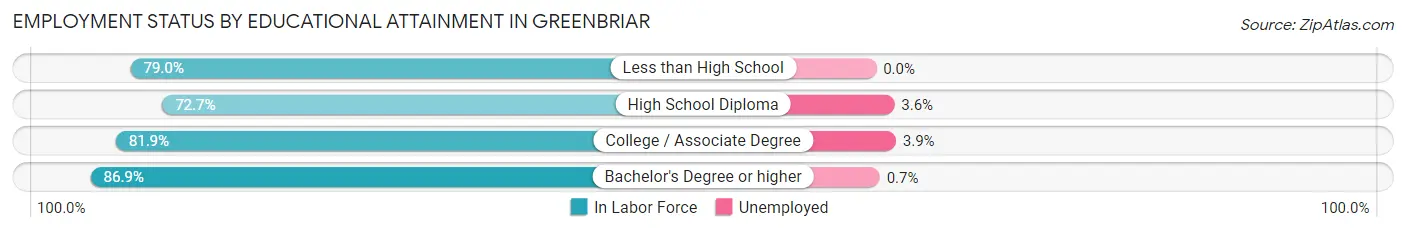
| Educational Attainment | In Labor Force | Unemployed |
| Less than High School | 64 (79.0%) | 0 (0.0%) |
| High School Diploma | 336 (72.7%) | 17 (3.6%) |
| College / Associate Degree | 640 (81.9%) | 30 (3.9%) |
| Bachelor's Degree or higher | 2,294 (86.9%) | 18 (0.7%) |
| Total | 3,334 (84.1%) | 59 (1.5%) |
Employment Occupations by Sex in Greenbriar
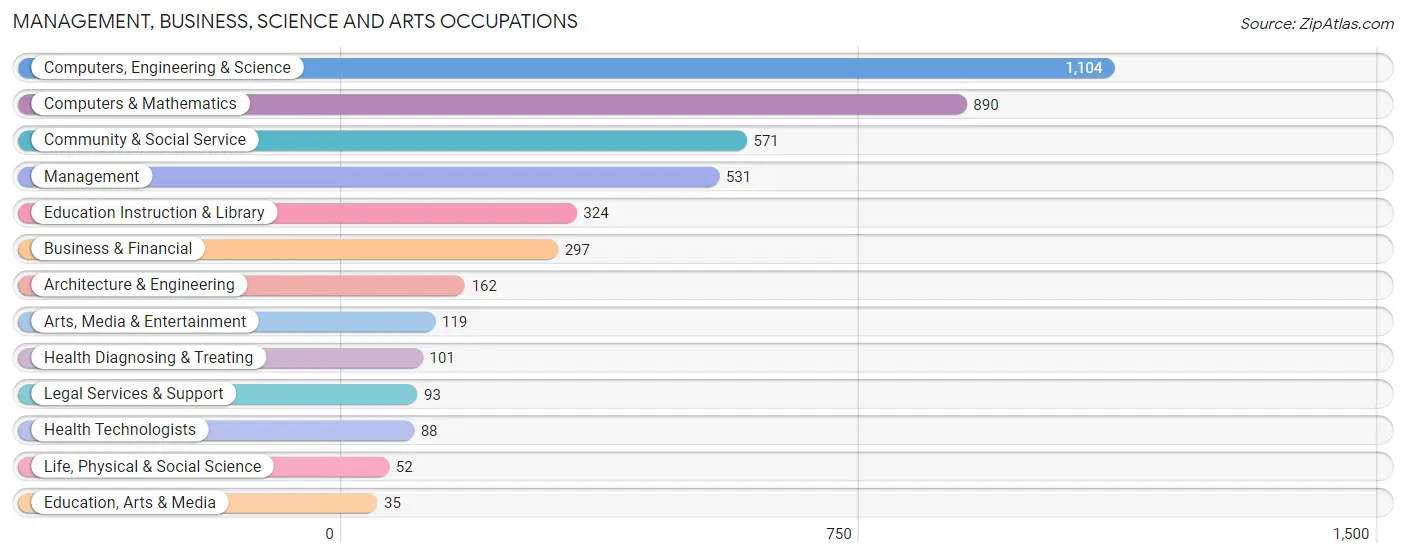
Management, Business, Science and Arts Occupations
The most common Management, Business, Science and Arts occupations in Greenbriar are Computers, Engineering & Science (1,104 | 27.0%), Computers & Mathematics (890 | 21.7%), Community & Social Service (571 | 13.9%), Management (531 | 13.0%), and Education Instruction & Library (324 | 7.9%).
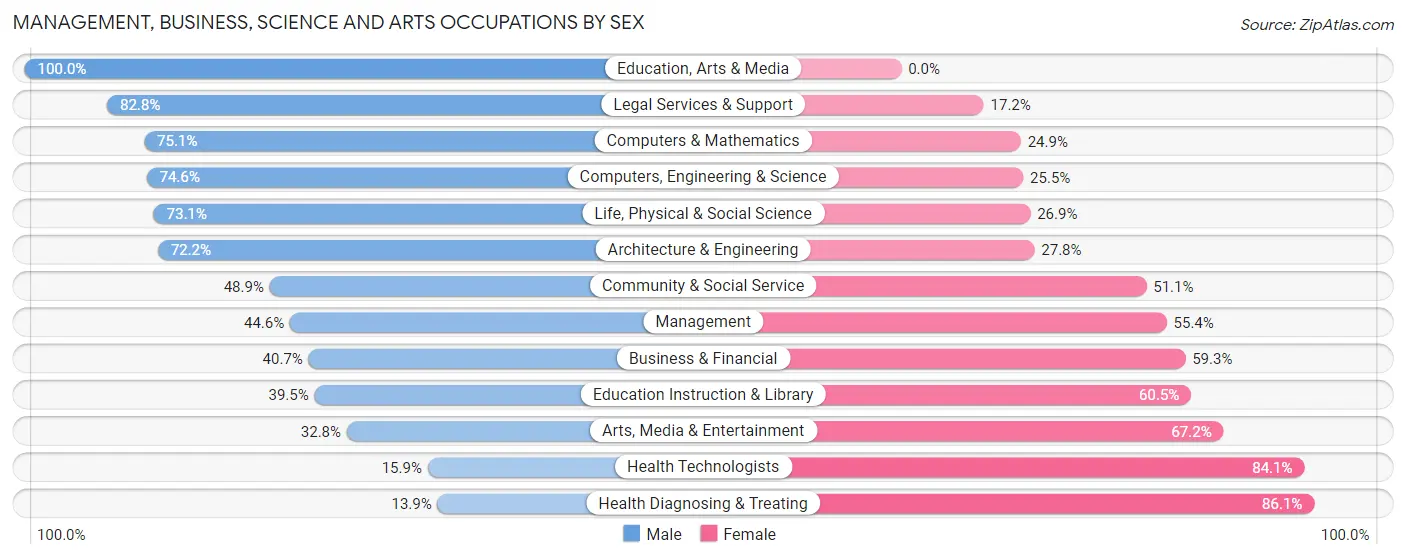
Management, Business, Science and Arts Occupations by Sex
Within the Management, Business, Science and Arts occupations in Greenbriar, the most male-oriented occupations are Education, Arts & Media (100.0%), Legal Services & Support (82.8%), and Computers & Mathematics (75.1%), while the most female-oriented occupations are Health Diagnosing & Treating (86.1%), Health Technologists (84.1%), and Arts, Media & Entertainment (67.2%).
| Occupation | Male | Female |
| Management | 237 (44.6%) | 294 (55.4%) |
| Business & Financial | 121 (40.7%) | 176 (59.3%) |
| Computers, Engineering & Science | 823 (74.6%) | 281 (25.5%) |
| Computers & Mathematics | 668 (75.1%) | 222 (24.9%) |
| Architecture & Engineering | 117 (72.2%) | 45 (27.8%) |
| Life, Physical & Social Science | 38 (73.1%) | 14 (26.9%) |
| Community & Social Service | 279 (48.9%) | 292 (51.1%) |
| Education, Arts & Media | 35 (100.0%) | 0 (0.0%) |
| Legal Services & Support | 77 (82.8%) | 16 (17.2%) |
| Education Instruction & Library | 128 (39.5%) | 196 (60.5%) |
| Arts, Media & Entertainment | 39 (32.8%) | 80 (67.2%) |
| Health Diagnosing & Treating | 14 (13.9%) | 87 (86.1%) |
| Health Technologists | 14 (15.9%) | 74 (84.1%) |
| Total (Category) | 1,474 (56.6%) | 1,130 (43.4%) |
| Total (Overall) | 2,263 (55.2%) | 1,833 (44.8%) |
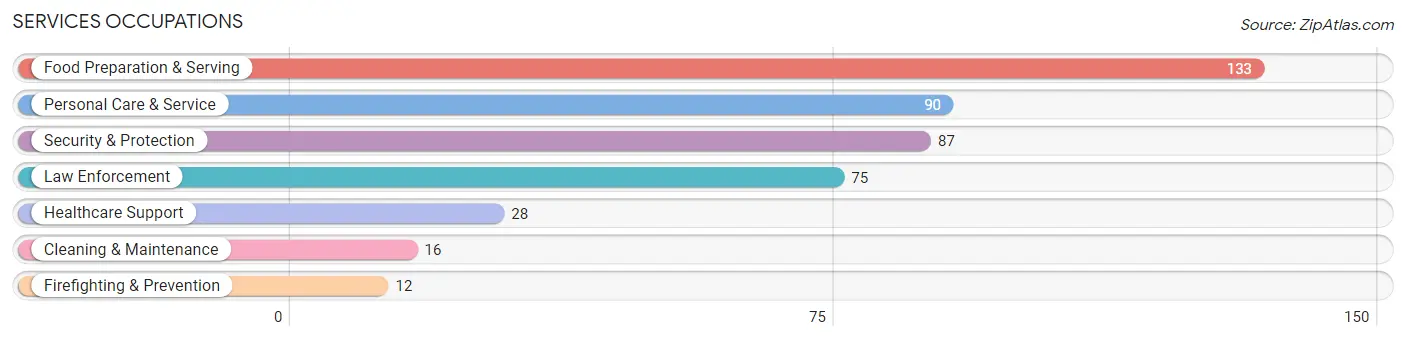
Services Occupations
The most common Services occupations in Greenbriar are Food Preparation & Serving (133 | 3.3%), Personal Care & Service (90 | 2.2%), Security & Protection (87 | 2.1%), Law Enforcement (75 | 1.8%), and Healthcare Support (28 | 0.7%).
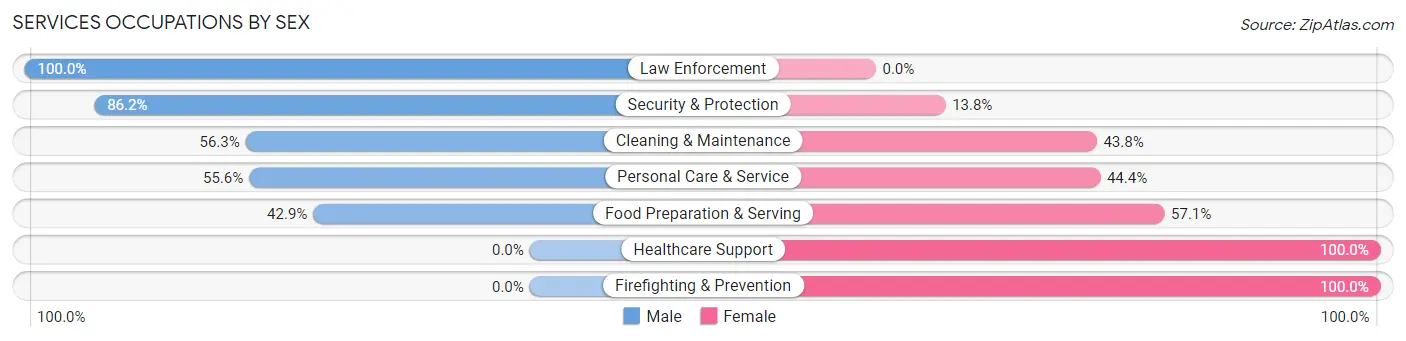
Services Occupations by Sex
Within the Services occupations in Greenbriar, the most male-oriented occupations are Law Enforcement (100.0%), Security & Protection (86.2%), and Cleaning & Maintenance (56.2%), while the most female-oriented occupations are Healthcare Support (100.0%), Firefighting & Prevention (100.0%), and Food Preparation & Serving (57.1%).
| Occupation | Male | Female |
| Healthcare Support | 0 (0.0%) | 28 (100.0%) |
| Security & Protection | 75 (86.2%) | 12 (13.8%) |
| Firefighting & Prevention | 0 (0.0%) | 12 (100.0%) |
| Law Enforcement | 75 (100.0%) | 0 (0.0%) |
| Food Preparation & Serving | 57 (42.9%) | 76 (57.1%) |
| Cleaning & Maintenance | 9 (56.2%) | 7 (43.8%) |
| Personal Care & Service | 50 (55.6%) | 40 (44.4%) |
| Total (Category) | 191 (53.9%) | 163 (46.1%) |
| Total (Overall) | 2,263 (55.2%) | 1,833 (44.8%) |
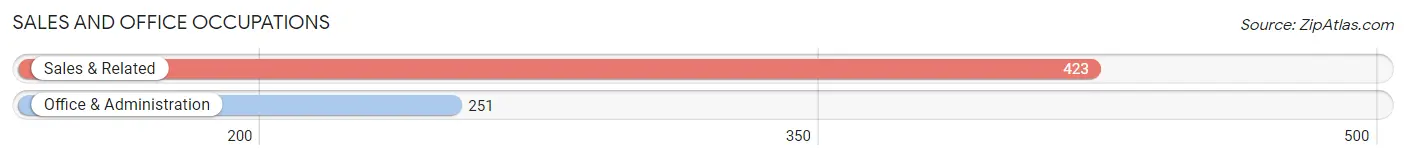
Sales and Office Occupations
The most common Sales and Office occupations in Greenbriar are Sales & Related (423 | 10.3%), and Office & Administration (251 | 6.1%).
Sales and Office Occupations by Sex
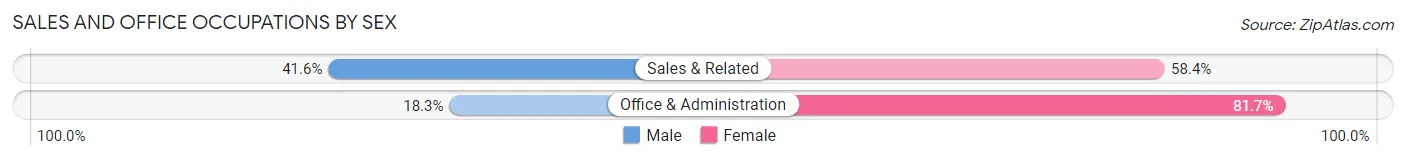
| Occupation | Male | Female |
| Sales & Related | 176 (41.6%) | 247 (58.4%) |
| Office & Administration | 46 (18.3%) | 205 (81.7%) |
| Total (Category) | 222 (32.9%) | 452 (67.1%) |
| Total (Overall) | 2,263 (55.2%) | 1,833 (44.8%) |
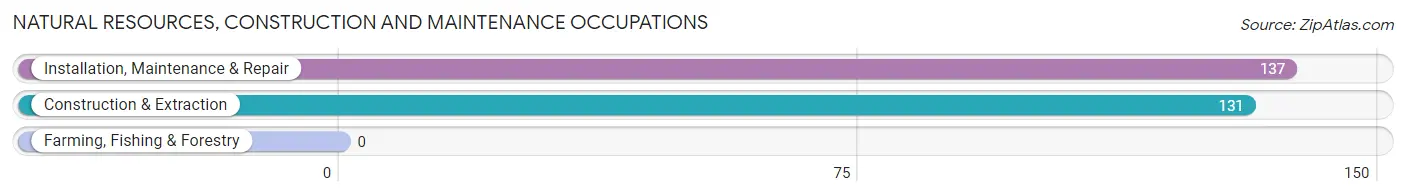
Natural Resources, Construction and Maintenance Occupations
The most common Natural Resources, Construction and Maintenance occupations in Greenbriar are Installation, Maintenance & Repair (137 | 3.3%), and Construction & Extraction (131 | 3.2%).
Natural Resources, Construction and Maintenance Occupations by Sex
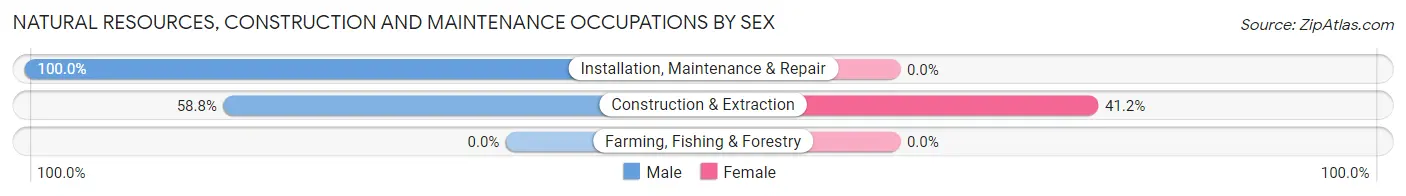
| Occupation | Male | Female |
| Farming, Fishing & Forestry | 0 (0.0%) | 0 (0.0%) |
| Construction & Extraction | 77 (58.8%) | 54 (41.2%) |
| Installation, Maintenance & Repair | 137 (100.0%) | 0 (0.0%) |
| Total (Category) | 214 (79.8%) | 54 (20.2%) |
| Total (Overall) | 2,263 (55.2%) | 1,833 (44.8%) |
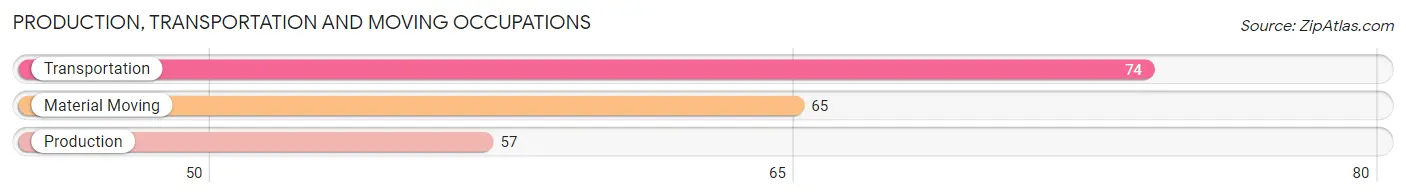
Production, Transportation and Moving Occupations
The most common Production, Transportation and Moving occupations in Greenbriar are Transportation (74 | 1.8%), Material Moving (65 | 1.6%), and Production (57 | 1.4%).
Production, Transportation and Moving Occupations by Sex
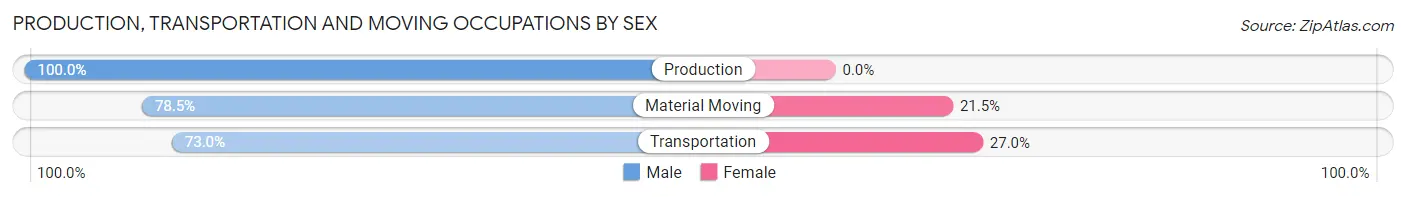
| Occupation | Male | Female |
| Production | 57 (100.0%) | 0 (0.0%) |
| Transportation | 54 (73.0%) | 20 (27.0%) |
| Material Moving | 51 (78.5%) | 14 (21.5%) |
| Total (Category) | 162 (82.7%) | 34 (17.3%) |
| Total (Overall) | 2,263 (55.2%) | 1,833 (44.8%) |
Employment Industries by Sex in Greenbriar
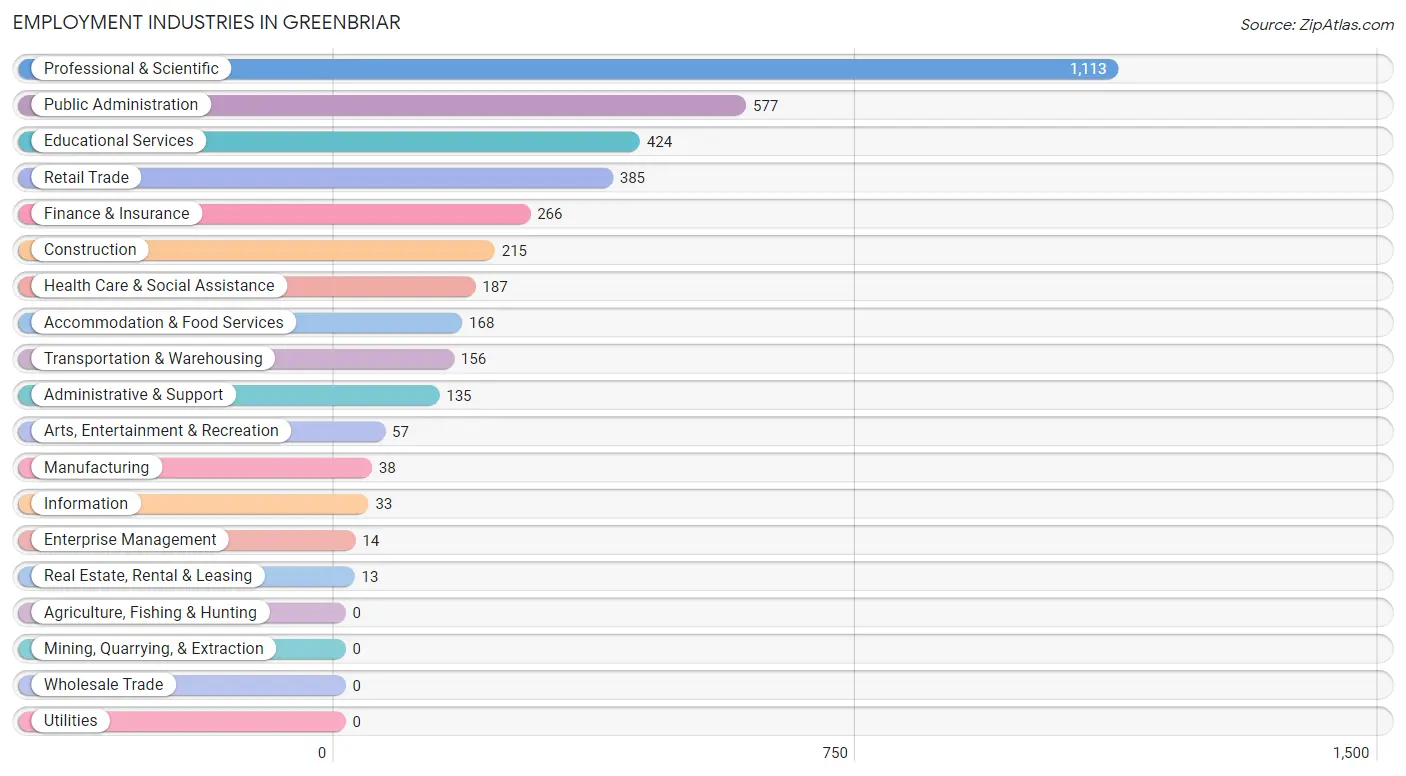
Employment Industries in Greenbriar
The major employment industries in Greenbriar include Professional & Scientific (1,113 | 27.2%), Public Administration (577 | 14.1%), Educational Services (424 | 10.3%), Retail Trade (385 | 9.4%), and Finance & Insurance (266 | 6.5%).
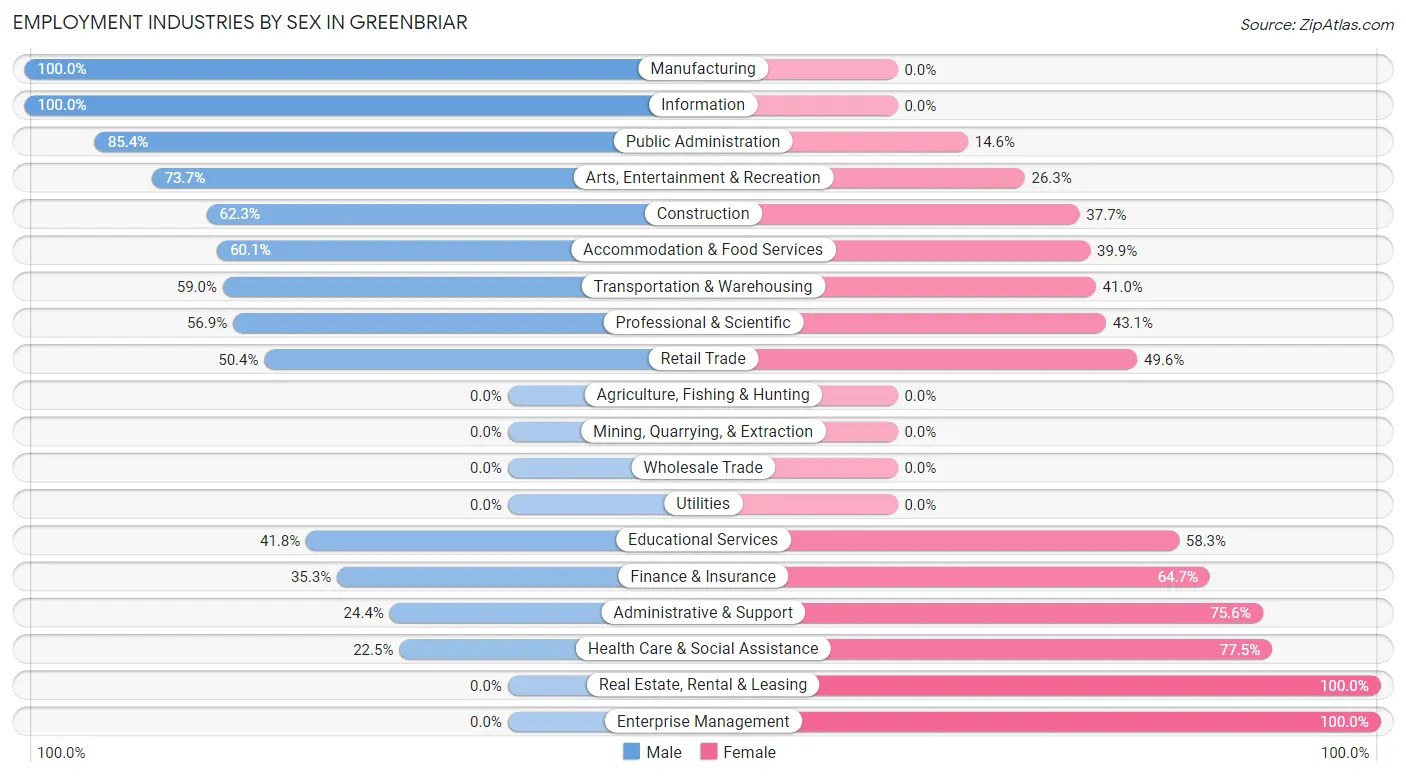
Employment Industries by Sex in Greenbriar
The Greenbriar industries that see more men than women are Manufacturing (100.0%), Information (100.0%), and Public Administration (85.4%), whereas the industries that tend to have a higher number of women are Real Estate, Rental & Leasing (100.0%), Enterprise Management (100.0%), and Health Care & Social Assistance (77.5%).
| Industry | Male | Female |
| Agriculture, Fishing & Hunting | 0 (0.0%) | 0 (0.0%) |
| Mining, Quarrying, & Extraction | 0 (0.0%) | 0 (0.0%) |
| Construction | 134 (62.3%) | 81 (37.7%) |
| Manufacturing | 38 (100.0%) | 0 (0.0%) |
| Wholesale Trade | 0 (0.0%) | 0 (0.0%) |
| Retail Trade | 194 (50.4%) | 191 (49.6%) |
| Transportation & Warehousing | 92 (59.0%) | 64 (41.0%) |
| Utilities | 0 (0.0%) | 0 (0.0%) |
| Information | 33 (100.0%) | 0 (0.0%) |
| Finance & Insurance | 94 (35.3%) | 172 (64.7%) |
| Real Estate, Rental & Leasing | 0 (0.0%) | 13 (100.0%) |
| Professional & Scientific | 633 (56.9%) | 480 (43.1%) |
| Enterprise Management | 0 (0.0%) | 14 (100.0%) |
| Administrative & Support | 33 (24.4%) | 102 (75.6%) |
| Educational Services | 177 (41.7%) | 247 (58.3%) |
| Health Care & Social Assistance | 42 (22.5%) | 145 (77.5%) |
| Arts, Entertainment & Recreation | 42 (73.7%) | 15 (26.3%) |
| Accommodation & Food Services | 101 (60.1%) | 67 (39.9%) |
| Public Administration | 493 (85.4%) | 84 (14.6%) |
| Total | 2,263 (55.2%) | 1,833 (44.8%) |
Education in Greenbriar
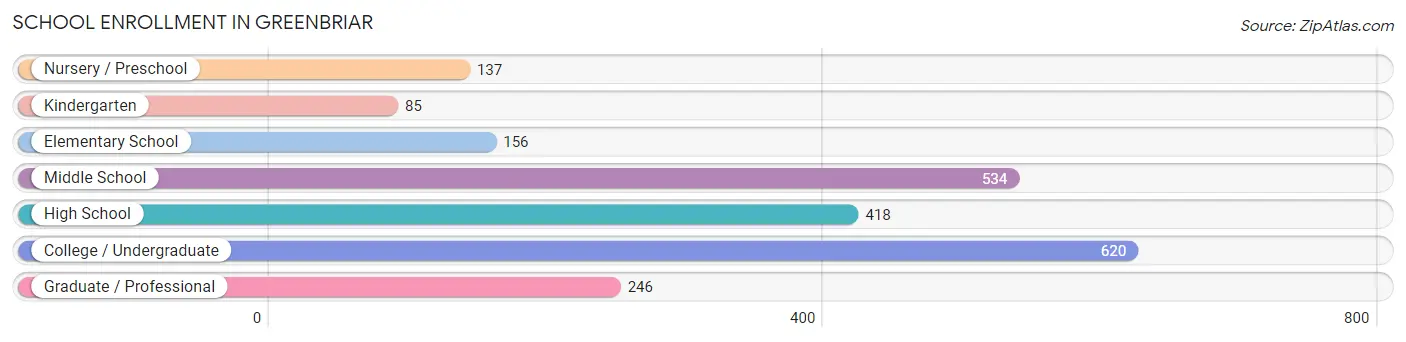
School Enrollment in Greenbriar
The most common levels of schooling among the 2,196 students in Greenbriar are college / undergraduate (620 | 28.2%), middle school (534 | 24.3%), and high school (418 | 19.0%).
| School Level | # Students | % Students |
| Nursery / Preschool | 137 | 6.2% |
| Kindergarten | 85 | 3.9% |
| Elementary School | 156 | 7.1% |
| Middle School | 534 | 24.3% |
| High School | 418 | 19.0% |
| College / Undergraduate | 620 | 28.2% |
| Graduate / Professional | 246 | 11.2% |
| Total | 2,196 | 100.0% |
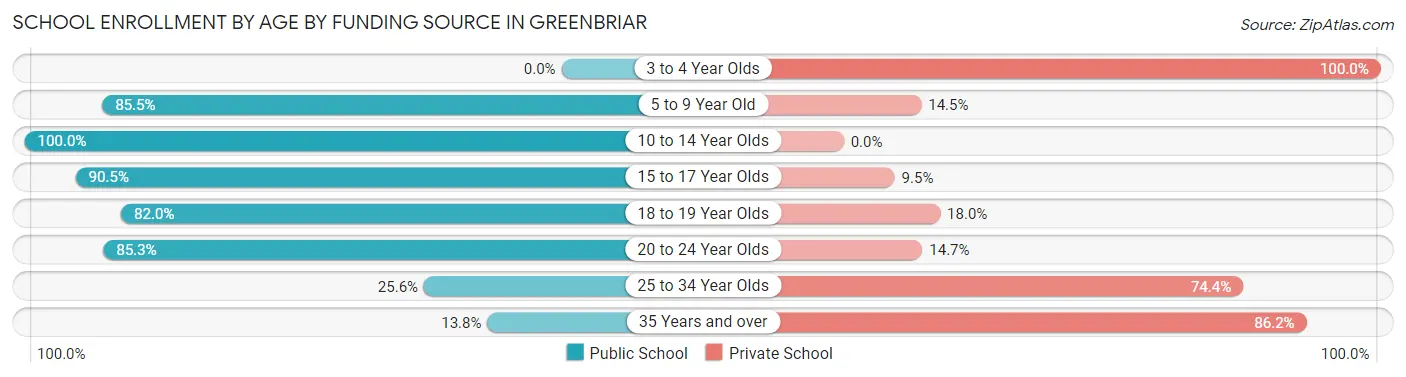
School Enrollment by Age by Funding Source in Greenbriar
Out of a total of 2,196 students who are enrolled in schools in Greenbriar, 582 (26.5%) attend a private institution, while the remaining 1,614 (73.5%) are enrolled in public schools. The age group of 3 to 4 year olds has the highest likelihood of being enrolled in private schools, with 110 (100.0% in the age bracket) enrolled. Conversely, the age group of 10 to 14 year olds has the lowest likelihood of being enrolled in a private school, with 587 (100.0% in the age bracket) attending a public institution.
| Age Bracket | Public School | Private School |
| 3 to 4 Year Olds | 0 (0.0%) | 110 (100.0%) |
| 5 to 9 Year Old | 213 (85.5%) | 36 (14.5%) |
| 10 to 14 Year Olds | 587 (100.0%) | 0 (0.0%) |
| 15 to 17 Year Olds | 305 (90.5%) | 32 (9.5%) |
| 18 to 19 Year Olds | 178 (82.0%) | 39 (18.0%) |
| 20 to 24 Year Olds | 262 (85.3%) | 45 (14.7%) |
| 25 to 34 Year Olds | 31 (25.6%) | 90 (74.4%) |
| 35 Years and over | 37 (13.8%) | 231 (86.2%) |
| Total | 1,614 (73.5%) | 582 (26.5%) |
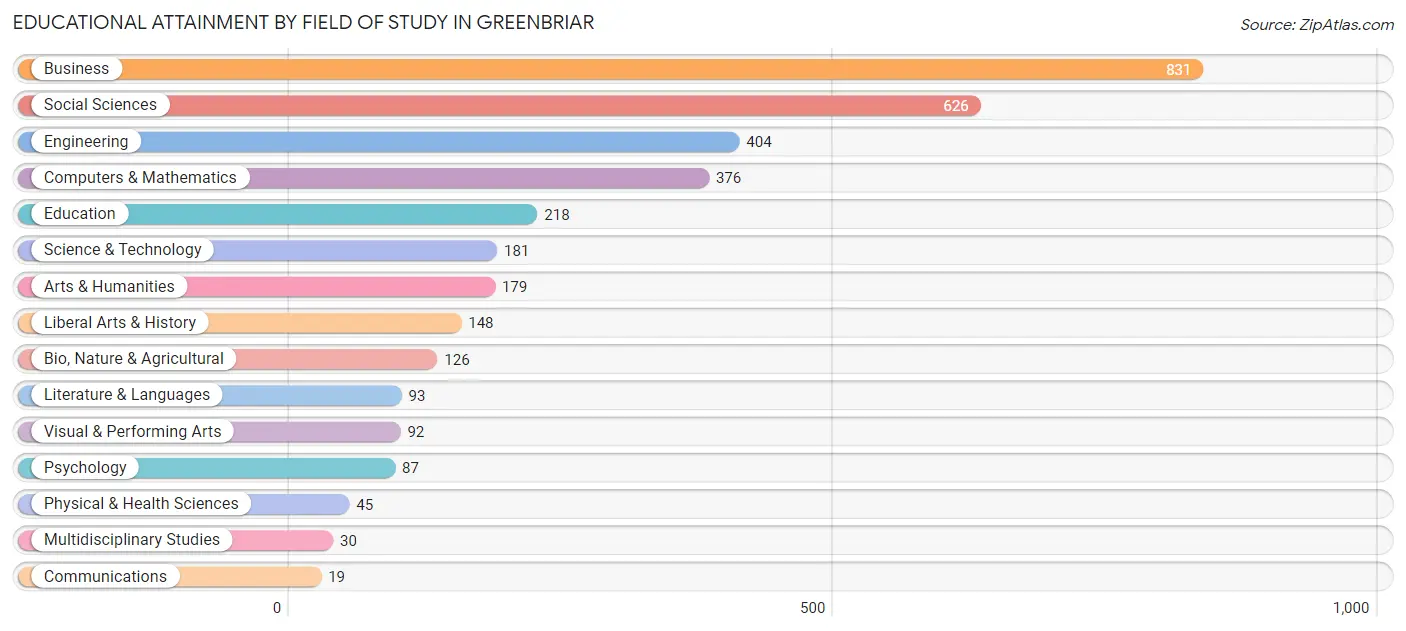
Educational Attainment by Field of Study in Greenbriar
Business (831 | 24.0%), social sciences (626 | 18.1%), engineering (404 | 11.7%), computers & mathematics (376 | 10.9%), and education (218 | 6.3%) are the most common fields of study among 3,455 individuals in Greenbriar who have obtained a bachelor's degree or higher.
| Field of Study | # Graduates | % Graduates |
| Computers & Mathematics | 376 | 10.9% |
| Bio, Nature & Agricultural | 126 | 3.6% |
| Physical & Health Sciences | 45 | 1.3% |
| Psychology | 87 | 2.5% |
| Social Sciences | 626 | 18.1% |
| Engineering | 404 | 11.7% |
| Multidisciplinary Studies | 30 | 0.9% |
| Science & Technology | 181 | 5.2% |
| Business | 831 | 24.0% |
| Education | 218 | 6.3% |
| Literature & Languages | 93 | 2.7% |
| Liberal Arts & History | 148 | 4.3% |
| Visual & Performing Arts | 92 | 2.7% |
| Communications | 19 | 0.5% |
| Arts & Humanities | 179 | 5.2% |
| Total | 3,455 | 100.0% |
Transportation & Commute in Greenbriar
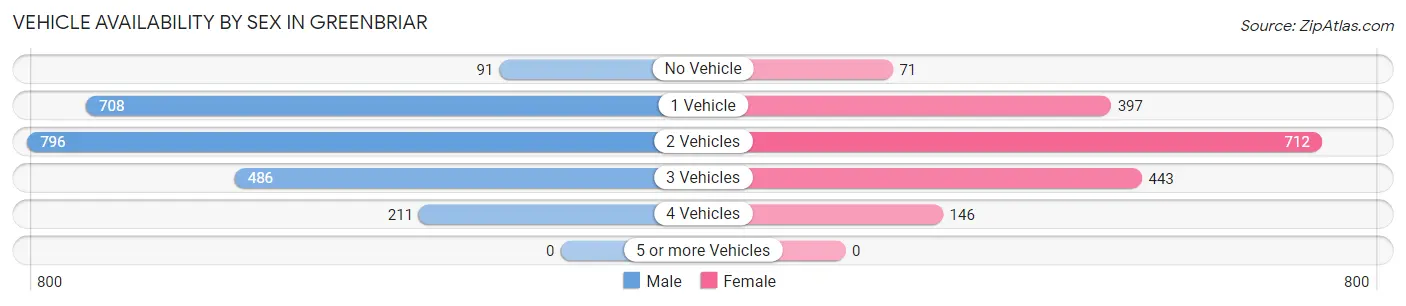
Vehicle Availability by Sex in Greenbriar
The most prevalent vehicle ownership categories in Greenbriar are males with 2 vehicles (796, accounting for 34.7%) and females with 2 vehicles (712, making up 45.0%).
| Vehicles Available | Male | Female |
| No Vehicle | 91 (4.0%) | 71 (4.0%) |
| 1 Vehicle | 708 (30.9%) | 397 (22.4%) |
| 2 Vehicles | 796 (34.7%) | 712 (40.3%) |
| 3 Vehicles | 486 (21.2%) | 443 (25.0%) |
| 4 Vehicles | 211 (9.2%) | 146 (8.3%) |
| 5 or more Vehicles | 0 (0.0%) | 0 (0.0%) |
| Total | 2,292 (100.0%) | 1,769 (100.0%) |
Commute Time in Greenbriar
The most frequently occuring commute durations in Greenbriar are 20 to 24 minutes (579 commuters, 17.6%), 15 to 19 minutes (517 commuters, 15.7%), and 30 to 34 minutes (514 commuters, 15.6%).
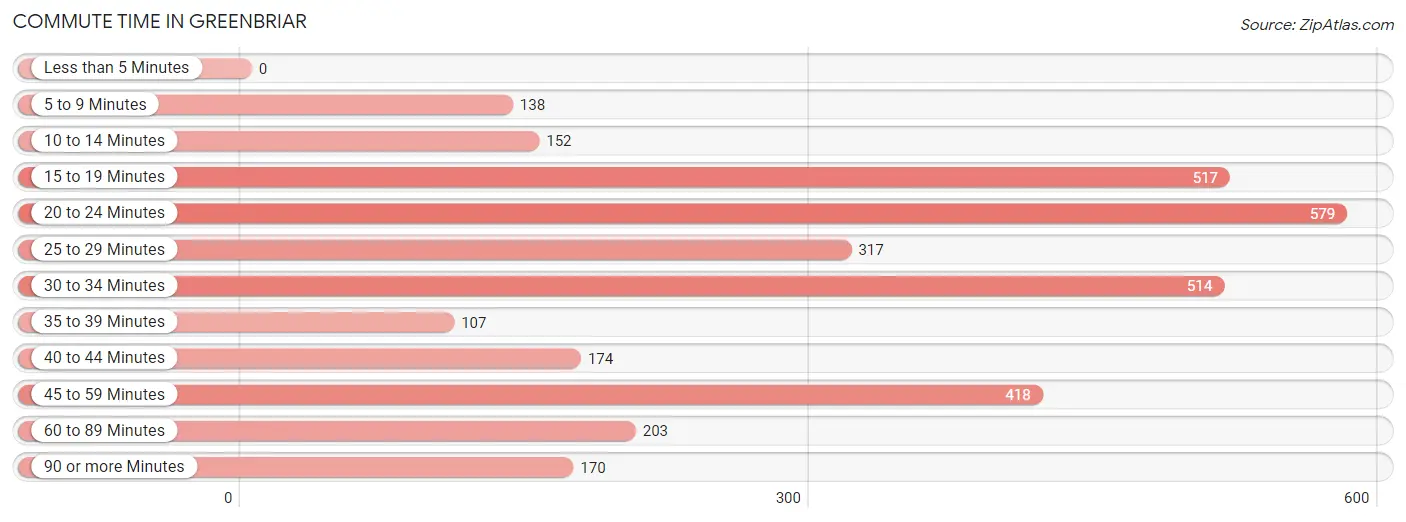
| Commute Time | # Commuters | % Commuters |
| Less than 5 Minutes | 0 | 0.0% |
| 5 to 9 Minutes | 138 | 4.2% |
| 10 to 14 Minutes | 152 | 4.6% |
| 15 to 19 Minutes | 517 | 15.7% |
| 20 to 24 Minutes | 579 | 17.6% |
| 25 to 29 Minutes | 317 | 9.6% |
| 30 to 34 Minutes | 514 | 15.6% |
| 35 to 39 Minutes | 107 | 3.3% |
| 40 to 44 Minutes | 174 | 5.3% |
| 45 to 59 Minutes | 418 | 12.7% |
| 60 to 89 Minutes | 203 | 6.2% |
| 90 or more Minutes | 170 | 5.2% |
Commute Time by Sex in Greenbriar
The most common commute times in Greenbriar are 20 to 24 minutes (347 commuters, 18.5%) for males and 20 to 24 minutes (232 commuters, 16.4%) for females.
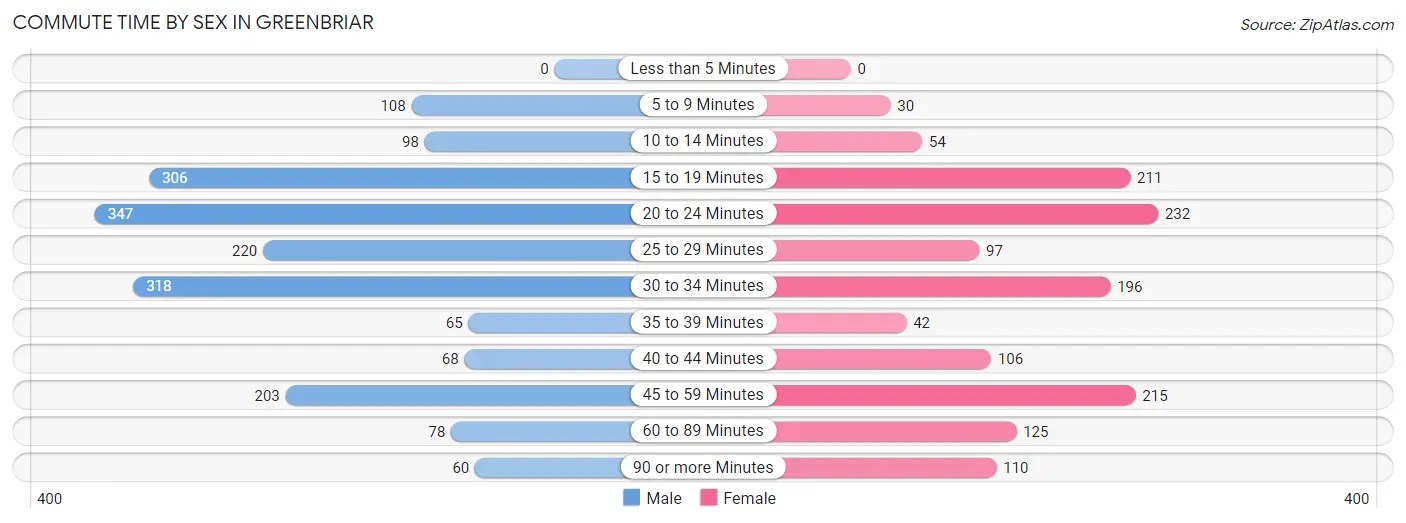
| Commute Time | Male | Female |
| Less than 5 Minutes | 0 (0.0%) | 0 (0.0%) |
| 5 to 9 Minutes | 108 (5.8%) | 30 (2.1%) |
| 10 to 14 Minutes | 98 (5.2%) | 54 (3.8%) |
| 15 to 19 Minutes | 306 (16.4%) | 211 (14.9%) |
| 20 to 24 Minutes | 347 (18.5%) | 232 (16.4%) |
| 25 to 29 Minutes | 220 (11.8%) | 97 (6.8%) |
| 30 to 34 Minutes | 318 (17.0%) | 196 (13.8%) |
| 35 to 39 Minutes | 65 (3.5%) | 42 (3.0%) |
| 40 to 44 Minutes | 68 (3.6%) | 106 (7.5%) |
| 45 to 59 Minutes | 203 (10.8%) | 215 (15.2%) |
| 60 to 89 Minutes | 78 (4.2%) | 125 (8.8%) |
| 90 or more Minutes | 60 (3.2%) | 110 (7.8%) |
Time of Departure to Work by Sex in Greenbriar
The most frequent times of departure to work in Greenbriar are 9:00 AM to 9:59 AM (368, 19.7%) for males and 9:00 AM to 9:59 AM (283, 20.0%) for females.
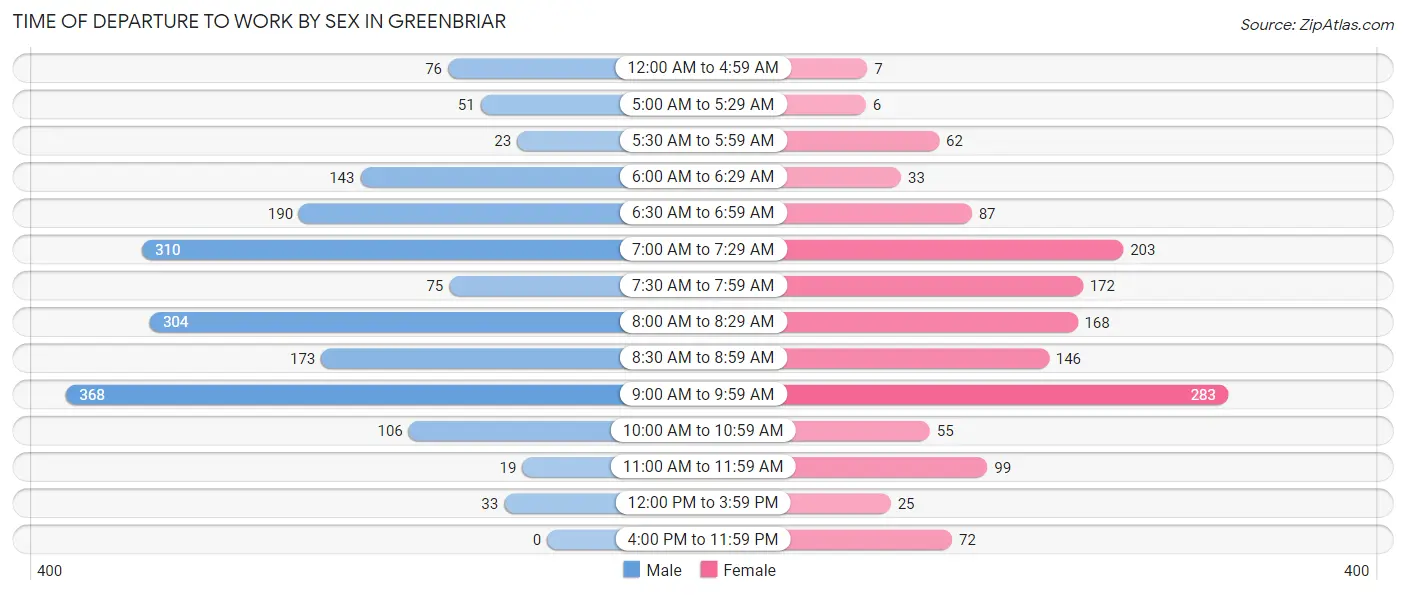
| Time of Departure | Male | Female |
| 12:00 AM to 4:59 AM | 76 (4.1%) | 7 (0.5%) |
| 5:00 AM to 5:29 AM | 51 (2.7%) | 6 (0.4%) |
| 5:30 AM to 5:59 AM | 23 (1.2%) | 62 (4.4%) |
| 6:00 AM to 6:29 AM | 143 (7.6%) | 33 (2.3%) |
| 6:30 AM to 6:59 AM | 190 (10.2%) | 87 (6.1%) |
| 7:00 AM to 7:29 AM | 310 (16.6%) | 203 (14.3%) |
| 7:30 AM to 7:59 AM | 75 (4.0%) | 172 (12.1%) |
| 8:00 AM to 8:29 AM | 304 (16.3%) | 168 (11.8%) |
| 8:30 AM to 8:59 AM | 173 (9.2%) | 146 (10.3%) |
| 9:00 AM to 9:59 AM | 368 (19.7%) | 283 (20.0%) |
| 10:00 AM to 10:59 AM | 106 (5.7%) | 55 (3.9%) |
| 11:00 AM to 11:59 AM | 19 (1.0%) | 99 (7.0%) |
| 12:00 PM to 3:59 PM | 33 (1.8%) | 25 (1.8%) |
| 4:00 PM to 11:59 PM | 0 (0.0%) | 72 (5.1%) |
| Total | 1,871 (100.0%) | 1,418 (100.0%) |
Housing Occupancy in Greenbriar
Occupancy by Ownership in Greenbriar
Of the total 3,021 dwellings in Greenbriar, owner-occupied units account for 1,975 (65.4%), while renter-occupied units make up 1,046 (34.6%).
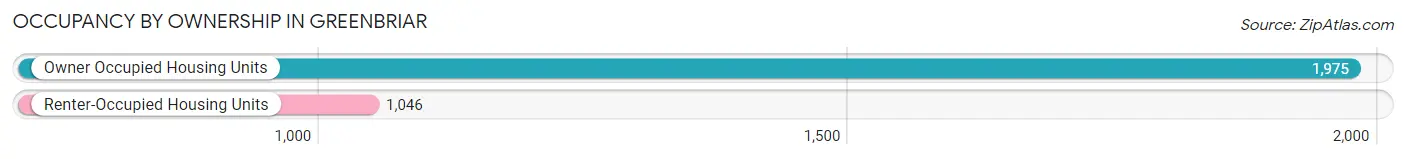
| Occupancy | # Housing Units | % Housing Units |
| Owner Occupied Housing Units | 1,975 | 65.4% |
| Renter-Occupied Housing Units | 1,046 | 34.6% |
| Total Occupied Housing Units | 3,021 | 100.0% |
Occupancy by Household Size in Greenbriar
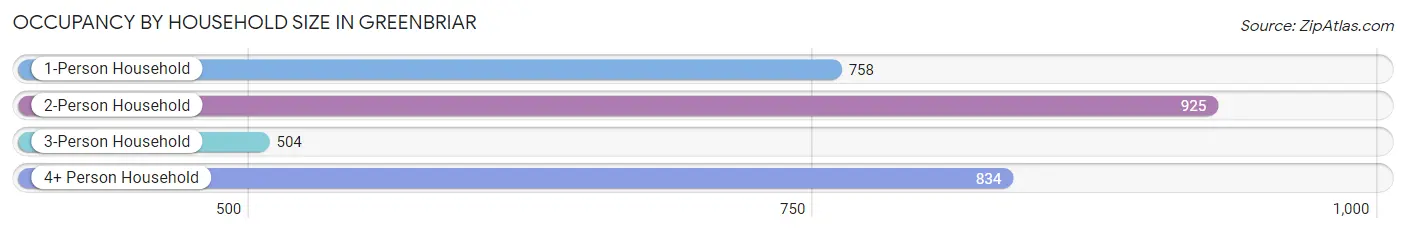
| Household Size | # Housing Units | % Housing Units |
| 1-Person Household | 758 | 25.1% |
| 2-Person Household | 925 | 30.6% |
| 3-Person Household | 504 | 16.7% |
| 4+ Person Household | 834 | 27.6% |
| Total Housing Units | 3,021 | 100.0% |
Occupancy by Ownership by Household Size in Greenbriar
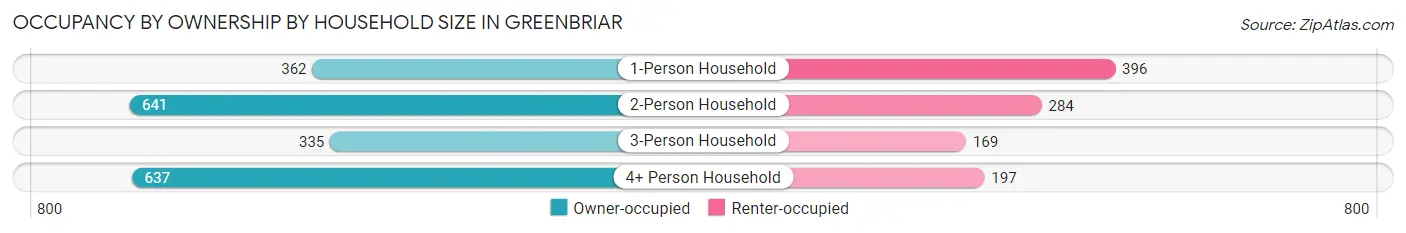
| Household Size | Owner-occupied | Renter-occupied |
| 1-Person Household | 362 (47.8%) | 396 (52.2%) |
| 2-Person Household | 641 (69.3%) | 284 (30.7%) |
| 3-Person Household | 335 (66.5%) | 169 (33.5%) |
| 4+ Person Household | 637 (76.4%) | 197 (23.6%) |
| Total Housing Units | 1,975 (65.4%) | 1,046 (34.6%) |
Occupancy by Educational Attainment in Greenbriar
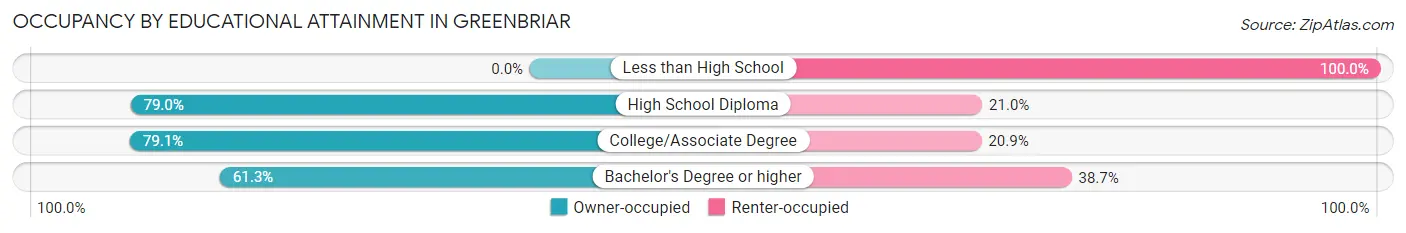
| Household Size | Owner-occupied | Renter-occupied |
| Less than High School | 0 (0.0%) | 53 (100.0%) |
| High School Diploma | 282 (79.0%) | 75 (21.0%) |
| College/Associate Degree | 413 (79.1%) | 109 (20.9%) |
| Bachelor's Degree or higher | 1,280 (61.3%) | 809 (38.7%) |
Occupancy by Age of Householder in Greenbriar
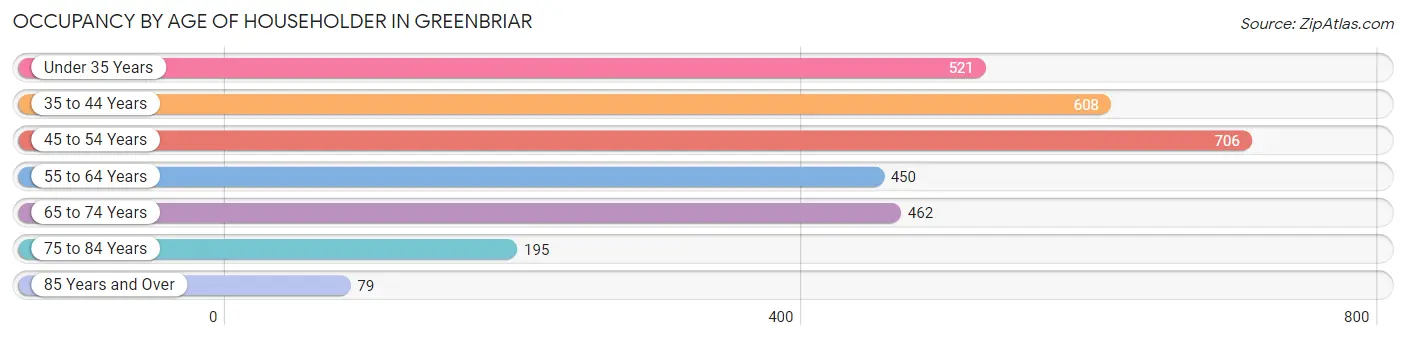
| Age Bracket | # Households | % Households |
| Under 35 Years | 521 | 17.2% |
| 35 to 44 Years | 608 | 20.1% |
| 45 to 54 Years | 706 | 23.4% |
| 55 to 64 Years | 450 | 14.9% |
| 65 to 74 Years | 462 | 15.3% |
| 75 to 84 Years | 195 | 6.5% |
| 85 Years and Over | 79 | 2.6% |
| Total | 3,021 | 100.0% |
Housing Finances in Greenbriar
Median Income by Occupancy in Greenbriar
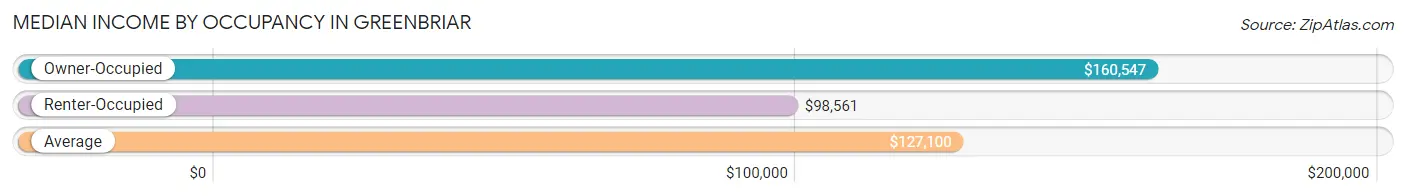
| Occupancy Type | # Households | Median Income |
| Owner-Occupied | 1,975 (65.4%) | $160,547 |
| Renter-Occupied | 1,046 (34.6%) | $98,561 |
| Average | 3,021 (100.0%) | $127,100 |
Occupancy by Householder Income Bracket in Greenbriar
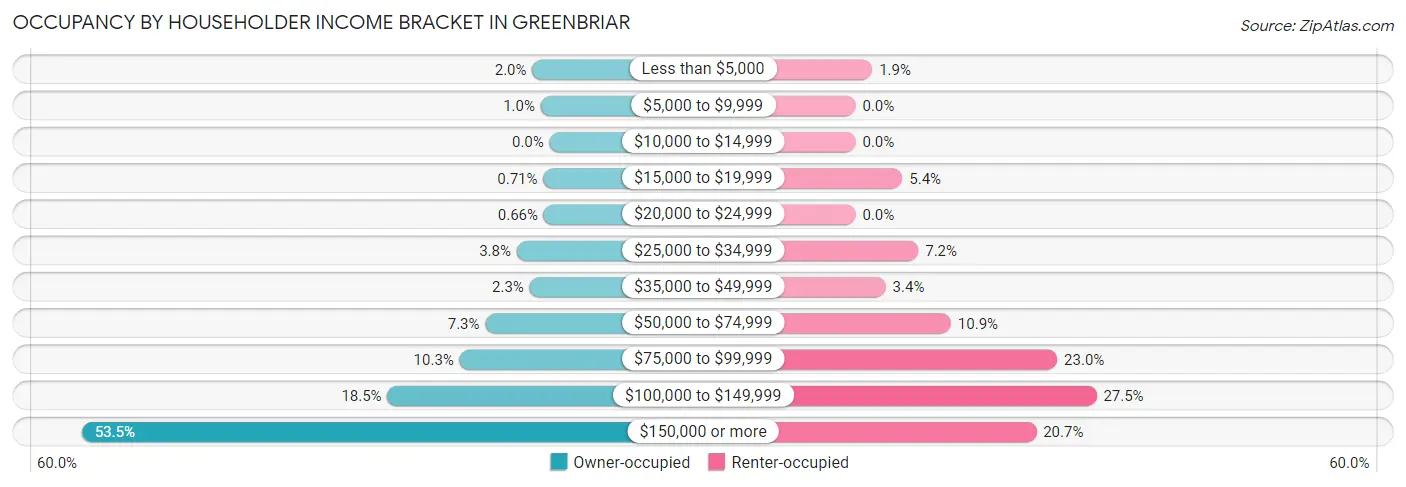
| Income Bracket | Owner-occupied | Renter-occupied |
| Less than $5,000 | 39 (2.0%) | 20 (1.9%) |
| $5,000 to $9,999 | 20 (1.0%) | 0 (0.0%) |
| $10,000 to $14,999 | 0 (0.0%) | 0 (0.0%) |
| $15,000 to $19,999 | 14 (0.7%) | 56 (5.3%) |
| $20,000 to $24,999 | 13 (0.7%) | 0 (0.0%) |
| $25,000 to $34,999 | 74 (3.7%) | 75 (7.2%) |
| $35,000 to $49,999 | 45 (2.3%) | 36 (3.4%) |
| $50,000 to $74,999 | 145 (7.3%) | 114 (10.9%) |
| $75,000 to $99,999 | 203 (10.3%) | 241 (23.0%) |
| $100,000 to $149,999 | 366 (18.5%) | 288 (27.5%) |
| $150,000 or more | 1,056 (53.5%) | 216 (20.6%) |
| Total | 1,975 (100.0%) | 1,046 (100.0%) |
Monthly Housing Cost Tiers in Greenbriar
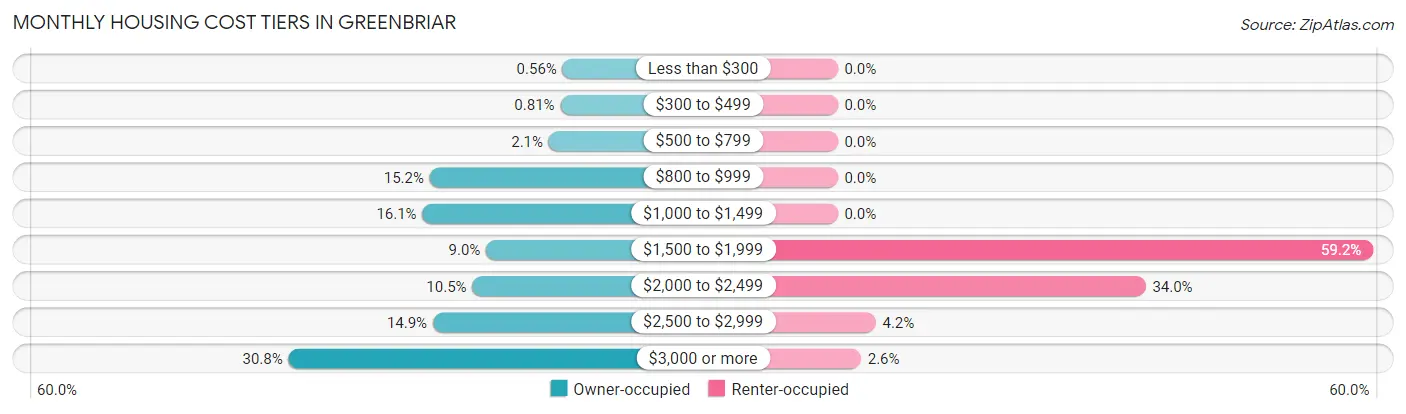
| Monthly Cost | Owner-occupied | Renter-occupied |
| Less than $300 | 11 (0.6%) | 0 (0.0%) |
| $300 to $499 | 16 (0.8%) | 0 (0.0%) |
| $500 to $799 | 41 (2.1%) | 0 (0.0%) |
| $800 to $999 | 301 (15.2%) | 0 (0.0%) |
| $1,000 to $1,499 | 317 (16.1%) | 0 (0.0%) |
| $1,500 to $1,999 | 178 (9.0%) | 619 (59.2%) |
| $2,000 to $2,499 | 208 (10.5%) | 356 (34.0%) |
| $2,500 to $2,999 | 294 (14.9%) | 44 (4.2%) |
| $3,000 or more | 609 (30.8%) | 27 (2.6%) |
| Total | 1,975 (100.0%) | 1,046 (100.0%) |
Physical Housing Characteristics in Greenbriar
Housing Structures in Greenbriar
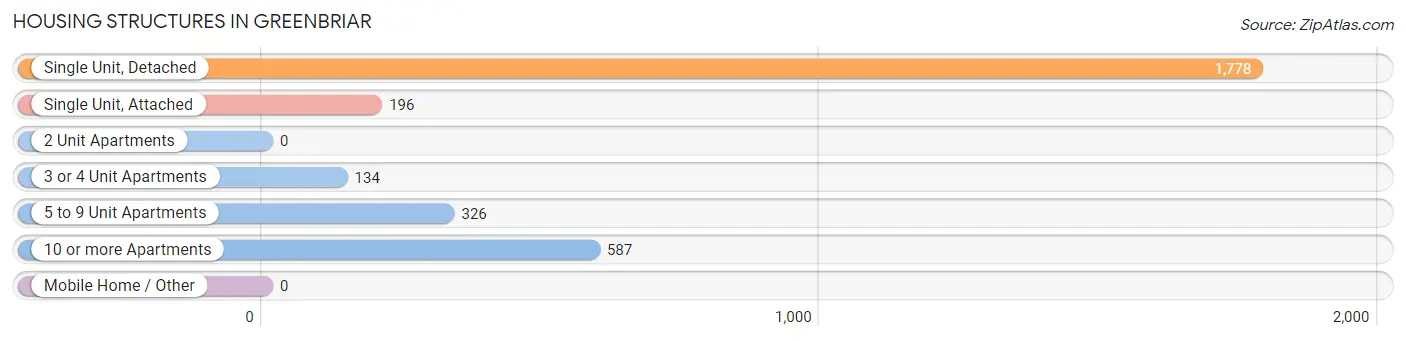
| Structure Type | # Housing Units | % Housing Units |
| Single Unit, Detached | 1,778 | 58.9% |
| Single Unit, Attached | 196 | 6.5% |
| 2 Unit Apartments | 0 | 0.0% |
| 3 or 4 Unit Apartments | 134 | 4.4% |
| 5 to 9 Unit Apartments | 326 | 10.8% |
| 10 or more Apartments | 587 | 19.4% |
| Mobile Home / Other | 0 | 0.0% |
| Total | 3,021 | 100.0% |
Housing Structures by Occupancy in Greenbriar
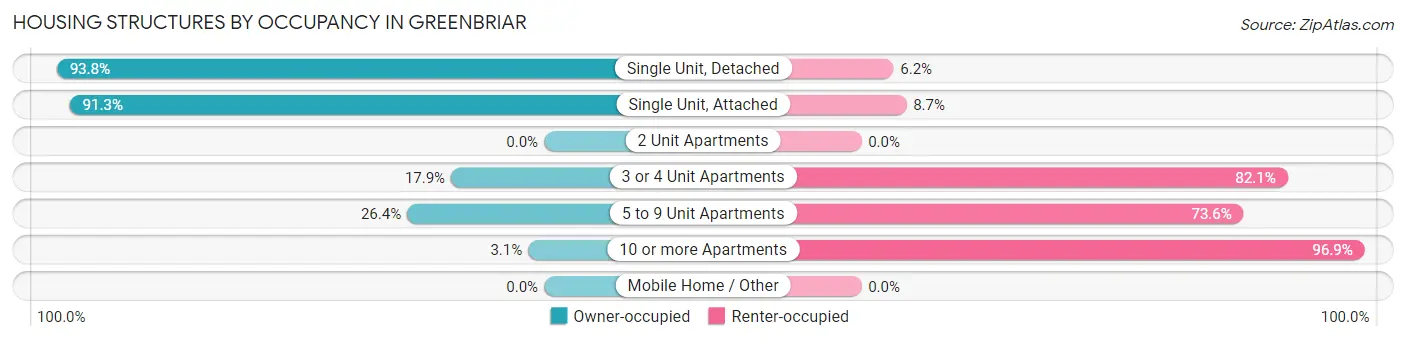
| Structure Type | Owner-occupied | Renter-occupied |
| Single Unit, Detached | 1,668 (93.8%) | 110 (6.2%) |
| Single Unit, Attached | 179 (91.3%) | 17 (8.7%) |
| 2 Unit Apartments | 0 (0.0%) | 0 (0.0%) |
| 3 or 4 Unit Apartments | 24 (17.9%) | 110 (82.1%) |
| 5 to 9 Unit Apartments | 86 (26.4%) | 240 (73.6%) |
| 10 or more Apartments | 18 (3.1%) | 569 (96.9%) |
| Mobile Home / Other | 0 (0.0%) | 0 (0.0%) |
| Total | 1,975 (65.4%) | 1,046 (34.6%) |
Housing Structures by Number of Rooms in Greenbriar
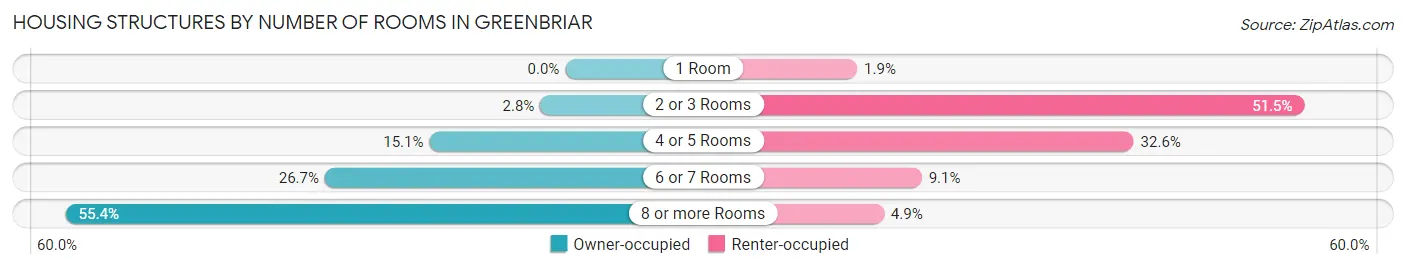
| Number of Rooms | Owner-occupied | Renter-occupied |
| 1 Room | 0 (0.0%) | 20 (1.9%) |
| 2 or 3 Rooms | 55 (2.8%) | 539 (51.5%) |
| 4 or 5 Rooms | 298 (15.1%) | 341 (32.6%) |
| 6 or 7 Rooms | 527 (26.7%) | 95 (9.1%) |
| 8 or more Rooms | 1,095 (55.4%) | 51 (4.9%) |
| Total | 1,975 (100.0%) | 1,046 (100.0%) |
Housing Structure by Heating Type in Greenbriar
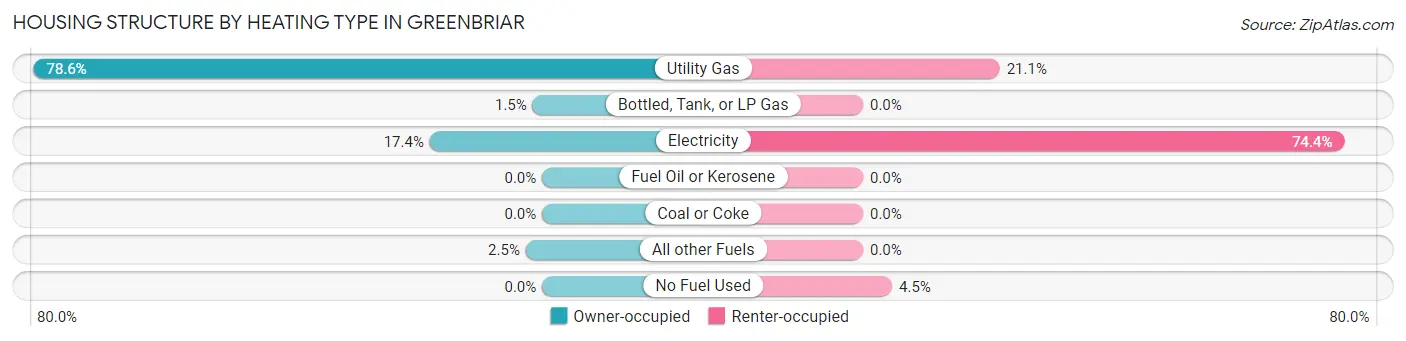
| Heating Type | Owner-occupied | Renter-occupied |
| Utility Gas | 1,553 (78.6%) | 221 (21.1%) |
| Bottled, Tank, or LP Gas | 29 (1.5%) | 0 (0.0%) |
| Electricity | 343 (17.4%) | 778 (74.4%) |
| Fuel Oil or Kerosene | 0 (0.0%) | 0 (0.0%) |
| Coal or Coke | 0 (0.0%) | 0 (0.0%) |
| All other Fuels | 50 (2.5%) | 0 (0.0%) |
| No Fuel Used | 0 (0.0%) | 47 (4.5%) |
| Total | 1,975 (100.0%) | 1,046 (100.0%) |
Household Vehicle Usage in Greenbriar
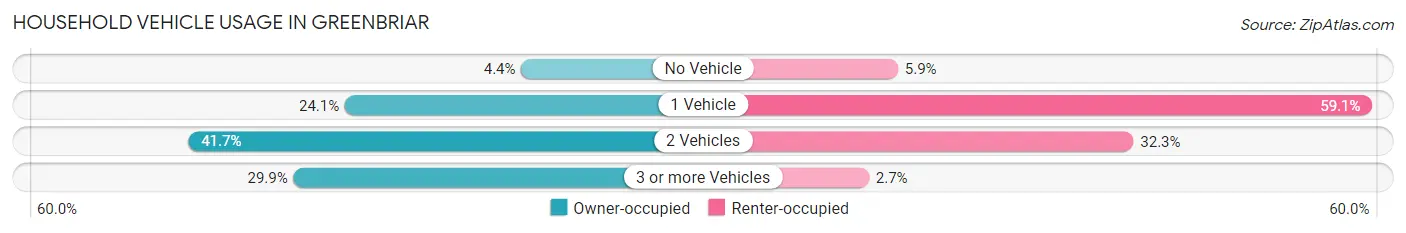
| Vehicles per Household | Owner-occupied | Renter-occupied |
| No Vehicle | 86 (4.3%) | 62 (5.9%) |
| 1 Vehicle | 476 (24.1%) | 618 (59.1%) |
| 2 Vehicles | 823 (41.7%) | 338 (32.3%) |
| 3 or more Vehicles | 590 (29.9%) | 28 (2.7%) |
| Total | 1,975 (100.0%) | 1,046 (100.0%) |
Real Estate & Mortgages in Greenbriar
Real Estate and Mortgage Overview in Greenbriar
| Characteristic | Without Mortgage | With Mortgage |
| Housing Units | 568 | 1,407 |
| Median Property Value | $622,800 | $627,000 |
| Median Household Income | $125,526 | $816 |
| Monthly Housing Costs | $960 | $609 |
| Real Estate Taxes | $6,332 | $20 |
Property Value by Mortgage Status in Greenbriar
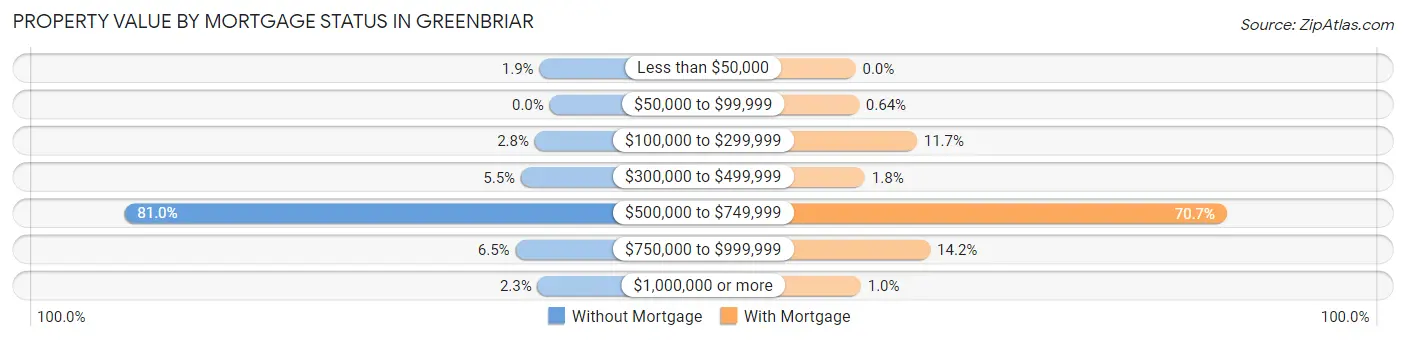
| Property Value | Without Mortgage | With Mortgage |
| Less than $50,000 | 11 (1.9%) | 0 (0.0%) |
| $50,000 to $99,999 | 0 (0.0%) | 9 (0.6%) |
| $100,000 to $299,999 | 16 (2.8%) | 164 (11.7%) |
| $300,000 to $499,999 | 31 (5.5%) | 25 (1.8%) |
| $500,000 to $749,999 | 460 (81.0%) | 995 (70.7%) |
| $750,000 to $999,999 | 37 (6.5%) | 200 (14.2%) |
| $1,000,000 or more | 13 (2.3%) | 14 (1.0%) |
| Total | 568 (100.0%) | 1,407 (100.0%) |
Household Income by Mortgage Status in Greenbriar
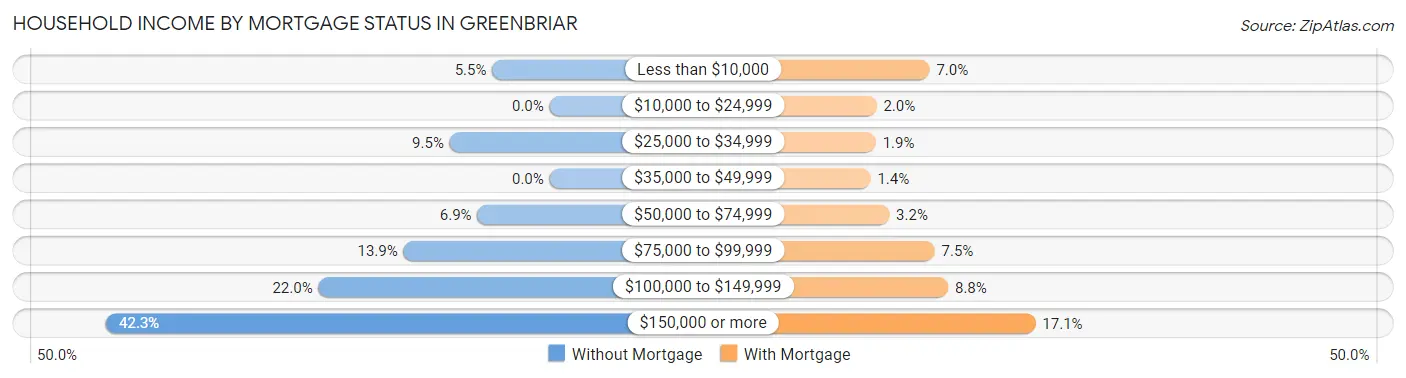
| Household Income | Without Mortgage | With Mortgage |
| Less than $10,000 | 31 (5.5%) | 99 (7.0%) |
| $10,000 to $24,999 | 0 (0.0%) | 28 (2.0%) |
| $25,000 to $34,999 | 54 (9.5%) | 27 (1.9%) |
| $35,000 to $49,999 | 0 (0.0%) | 20 (1.4%) |
| $50,000 to $74,999 | 39 (6.9%) | 45 (3.2%) |
| $75,000 to $99,999 | 79 (13.9%) | 106 (7.5%) |
| $100,000 to $149,999 | 125 (22.0%) | 124 (8.8%) |
| $150,000 or more | 240 (42.2%) | 241 (17.1%) |
| Total | 568 (100.0%) | 1,407 (100.0%) |
Property Value to Household Income Ratio in Greenbriar
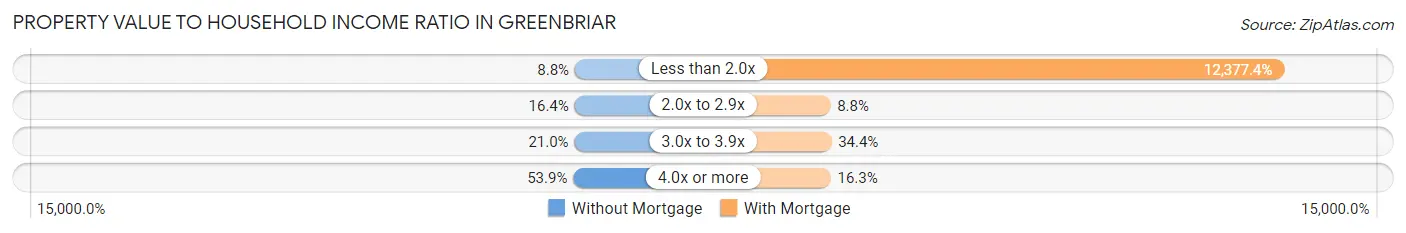
| Value-to-Income Ratio | Without Mortgage | With Mortgage |
| Less than 2.0x | 50 (8.8%) | 174,150 (12,377.4%) |
| 2.0x to 2.9x | 93 (16.4%) | 124 (8.8%) |
| 3.0x to 3.9x | 119 (20.9%) | 484 (34.4%) |
| 4.0x or more | 306 (53.9%) | 229 (16.3%) |
| Total | 568 (100.0%) | 1,407 (100.0%) |
Real Estate Taxes by Mortgage Status in Greenbriar
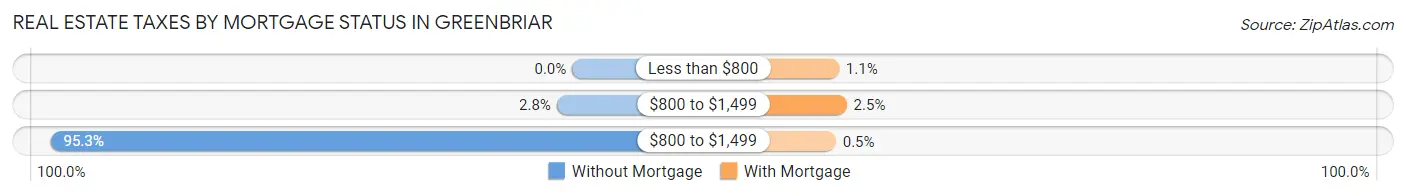
| Property Taxes | Without Mortgage | With Mortgage |
| Less than $800 | 0 (0.0%) | 15 (1.1%) |
| $800 to $1,499 | 16 (2.8%) | 35 (2.5%) |
| $800 to $1,499 | 541 (95.3%) | 7 (0.5%) |
| Total | 568 (100.0%) | 1,407 (100.0%) |
Health & Disability in Greenbriar
Health Insurance Coverage by Age in Greenbriar
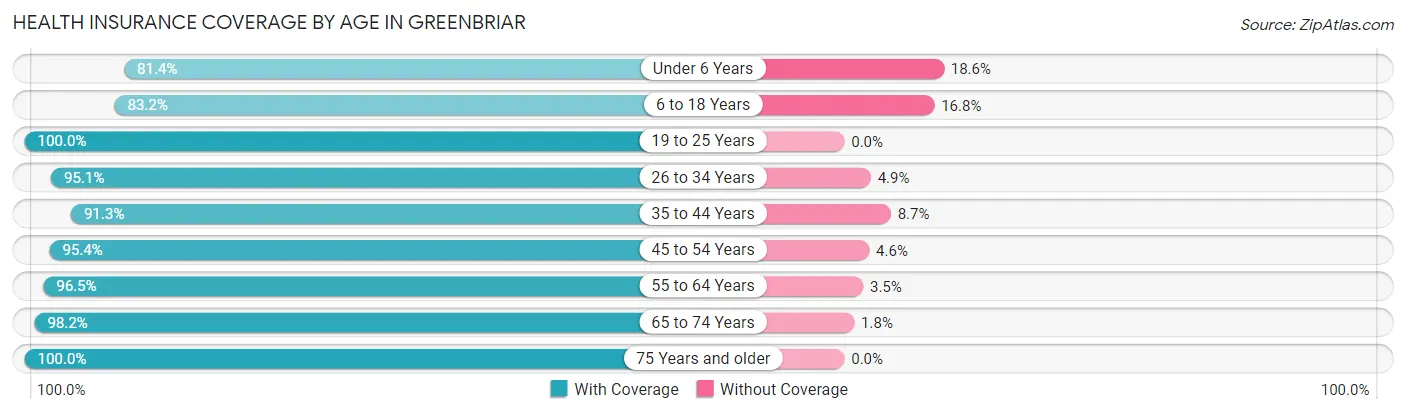
| Age Bracket | With Coverage | Without Coverage |
| Under 6 Years | 496 (81.4%) | 113 (18.6%) |
| 6 to 18 Years | 1,127 (83.2%) | 227 (16.8%) |
| 19 to 25 Years | 884 (100.0%) | 0 (0.0%) |
| 26 to 34 Years | 598 (95.1%) | 31 (4.9%) |
| 35 to 44 Years | 1,107 (91.3%) | 105 (8.7%) |
| 45 to 54 Years | 1,152 (95.4%) | 56 (4.6%) |
| 55 to 64 Years | 771 (96.5%) | 28 (3.5%) |
| 65 to 74 Years | 747 (98.2%) | 14 (1.8%) |
| 75 Years and older | 446 (100.0%) | 0 (0.0%) |
| Total | 7,328 (92.7%) | 574 (7.3%) |
Health Insurance Coverage by Citizenship Status in Greenbriar
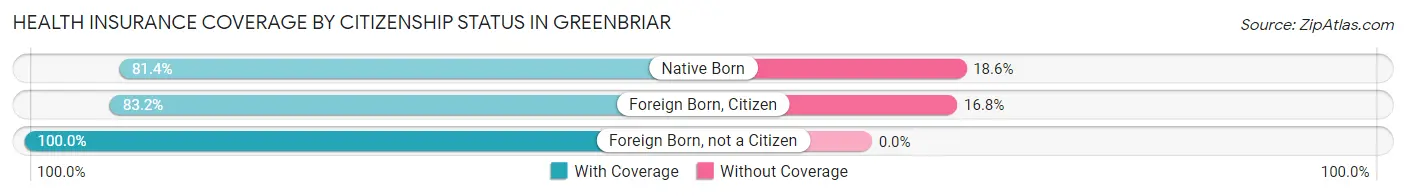
| Citizenship Status | With Coverage | Without Coverage |
| Native Born | 496 (81.4%) | 113 (18.6%) |
| Foreign Born, Citizen | 1,127 (83.2%) | 227 (16.8%) |
| Foreign Born, not a Citizen | 884 (100.0%) | 0 (0.0%) |
Health Insurance Coverage by Household Income in Greenbriar
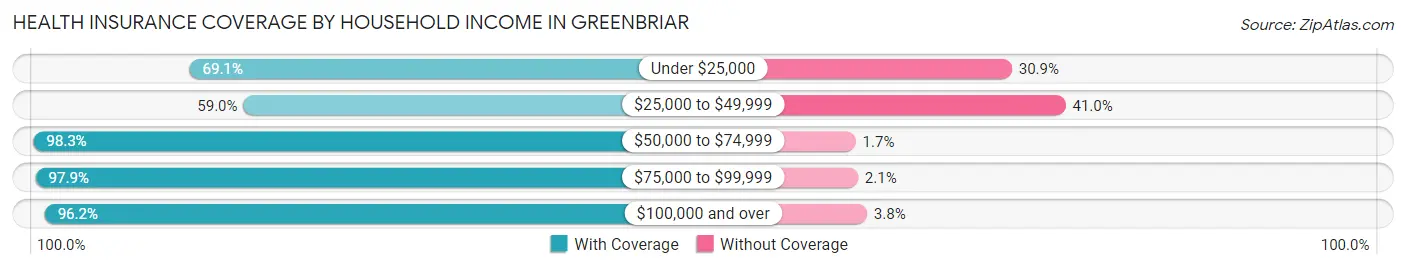
| Household Income | With Coverage | Without Coverage |
| Under $25,000 | 172 (69.1%) | 77 (30.9%) |
| $25,000 to $49,999 | 373 (59.0%) | 259 (41.0%) |
| $50,000 to $74,999 | 415 (98.3%) | 7 (1.7%) |
| $75,000 to $99,999 | 991 (97.9%) | 21 (2.1%) |
| $100,000 and over | 5,354 (96.2%) | 210 (3.8%) |
Public vs Private Health Insurance Coverage by Age in Greenbriar
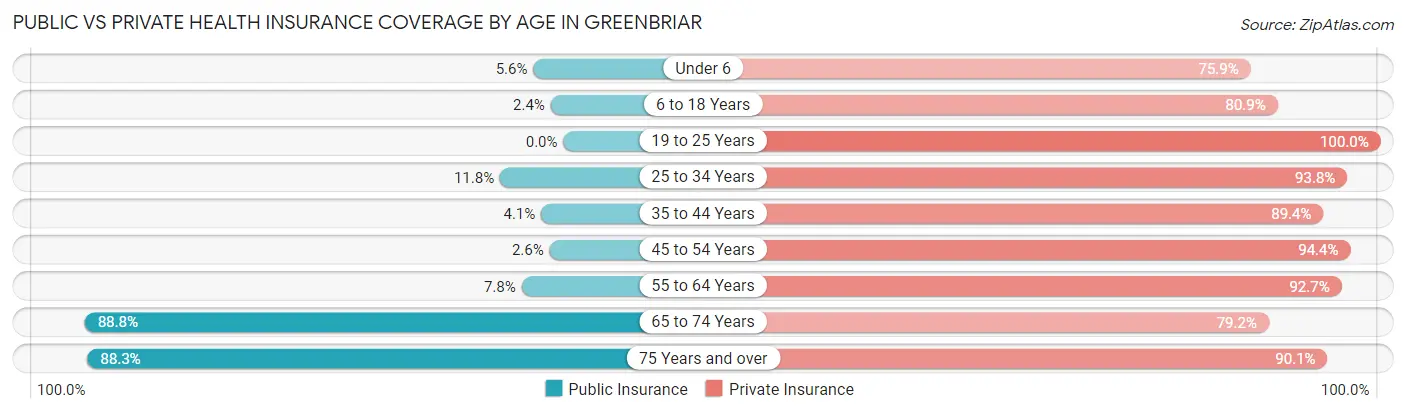
| Age Bracket | Public Insurance | Private Insurance |
| Under 6 | 34 (5.6%) | 462 (75.9%) |
| 6 to 18 Years | 32 (2.4%) | 1,095 (80.9%) |
| 19 to 25 Years | 0 (0.0%) | 884 (100.0%) |
| 25 to 34 Years | 74 (11.8%) | 590 (93.8%) |
| 35 to 44 Years | 50 (4.1%) | 1,083 (89.4%) |
| 45 to 54 Years | 31 (2.6%) | 1,140 (94.4%) |
| 55 to 64 Years | 62 (7.8%) | 741 (92.7%) |
| 65 to 74 Years | 676 (88.8%) | 603 (79.2%) |
| 75 Years and over | 394 (88.3%) | 402 (90.1%) |
| Total | 1,353 (17.1%) | 7,000 (88.6%) |
Disability Status by Sex by Age in Greenbriar
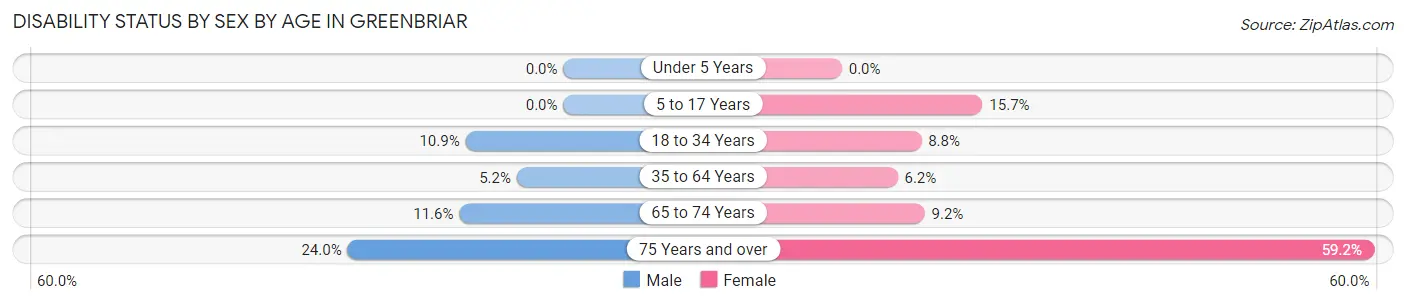
| Age Bracket | Male | Female |
| Under 5 Years | 0 (0.0%) | 0 (0.0%) |
| 5 to 17 Years | 0 (0.0%) | 80 (15.7%) |
| 18 to 34 Years | 81 (10.9%) | 77 (8.8%) |
| 35 to 64 Years | 90 (5.2%) | 92 (6.2%) |
| 65 to 74 Years | 48 (11.6%) | 32 (9.2%) |
| 75 Years and over | 50 (24.0%) | 141 (59.2%) |
Disability Class by Sex by Age in Greenbriar
Disability Class: Hearing Difficulty
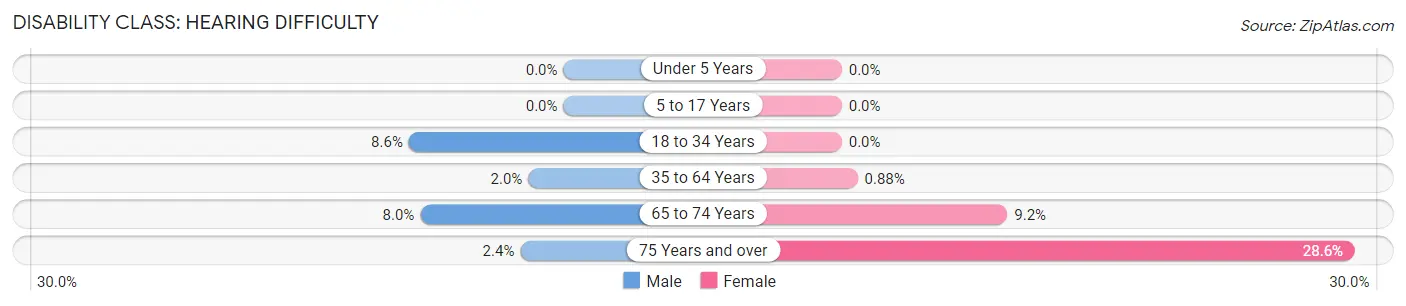
| Age Bracket | Male | Female |
| Under 5 Years | 0 (0.0%) | 0 (0.0%) |
| 5 to 17 Years | 0 (0.0%) | 0 (0.0%) |
| 18 to 34 Years | 64 (8.6%) | 0 (0.0%) |
| 35 to 64 Years | 34 (2.0%) | 13 (0.9%) |
| 65 to 74 Years | 33 (8.0%) | 32 (9.2%) |
| 75 Years and over | 5 (2.4%) | 68 (28.6%) |
Disability Class: Vision Difficulty
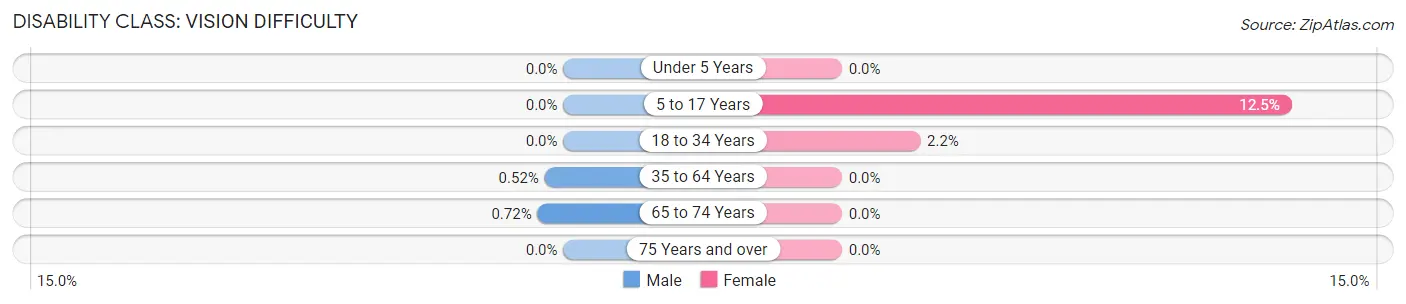
| Age Bracket | Male | Female |
| Under 5 Years | 0 (0.0%) | 0 (0.0%) |
| 5 to 17 Years | 0 (0.0%) | 64 (12.5%) |
| 18 to 34 Years | 0 (0.0%) | 19 (2.2%) |
| 35 to 64 Years | 9 (0.5%) | 0 (0.0%) |
| 65 to 74 Years | 3 (0.7%) | 0 (0.0%) |
| 75 Years and over | 0 (0.0%) | 0 (0.0%) |
Disability Class: Cognitive Difficulty
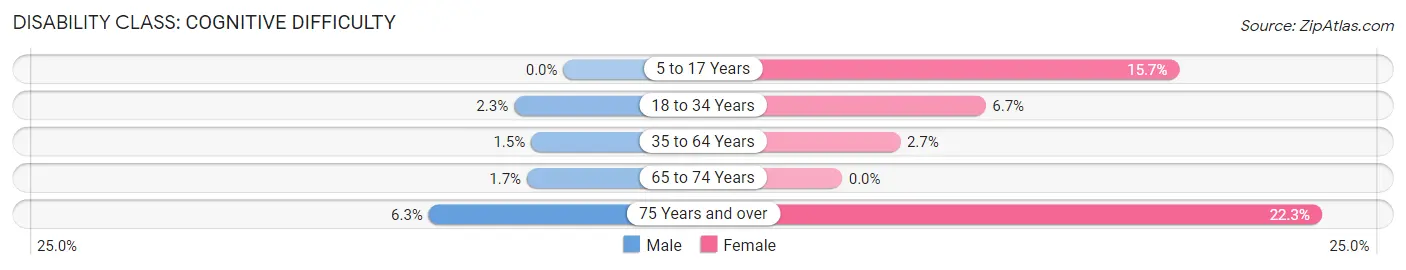
| Age Bracket | Male | Female |
| 5 to 17 Years | 0 (0.0%) | 80 (15.7%) |
| 18 to 34 Years | 17 (2.3%) | 58 (6.7%) |
| 35 to 64 Years | 26 (1.5%) | 40 (2.7%) |
| 65 to 74 Years | 7 (1.7%) | 0 (0.0%) |
| 75 Years and over | 13 (6.2%) | 53 (22.3%) |
Disability Class: Ambulatory Difficulty
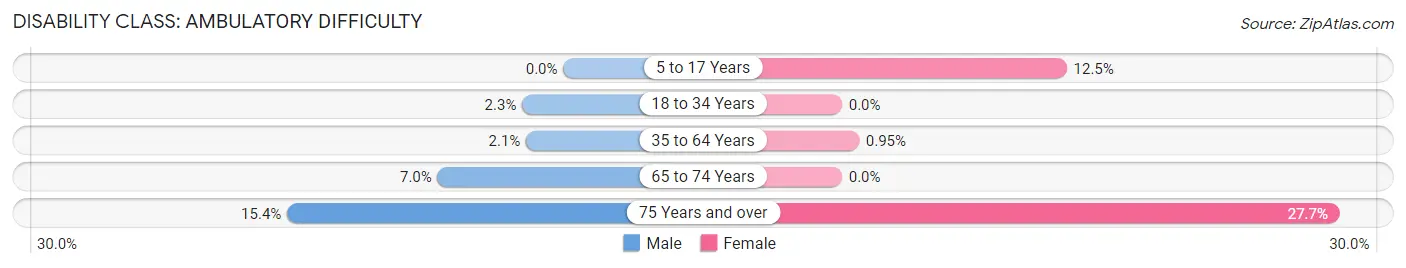
| Age Bracket | Male | Female |
| 5 to 17 Years | 0 (0.0%) | 64 (12.5%) |
| 18 to 34 Years | 17 (2.3%) | 0 (0.0%) |
| 35 to 64 Years | 36 (2.1%) | 14 (0.9%) |
| 65 to 74 Years | 29 (7.0%) | 0 (0.0%) |
| 75 Years and over | 32 (15.4%) | 66 (27.7%) |
Disability Class: Self-Care Difficulty
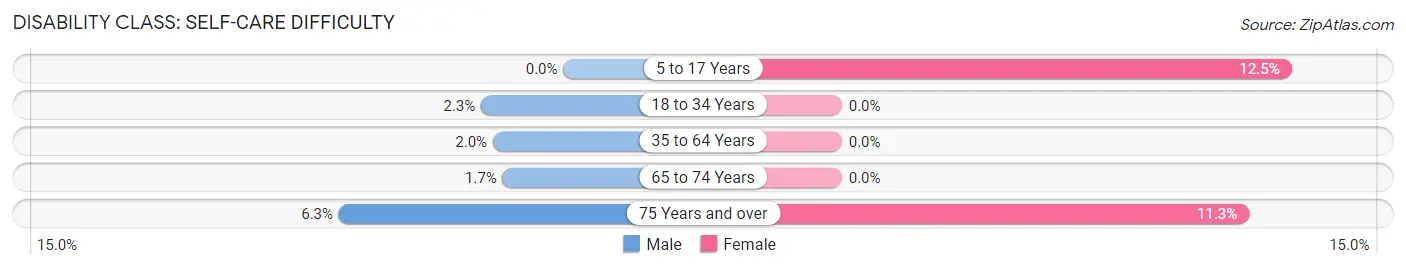
| Age Bracket | Male | Female |
| 5 to 17 Years | 0 (0.0%) | 64 (12.5%) |
| 18 to 34 Years | 17 (2.3%) | 0 (0.0%) |
| 35 to 64 Years | 34 (2.0%) | 0 (0.0%) |
| 65 to 74 Years | 7 (1.7%) | 0 (0.0%) |
| 75 Years and over | 13 (6.2%) | 27 (11.3%) |
Technology Access in Greenbriar
Computing Device Access in Greenbriar
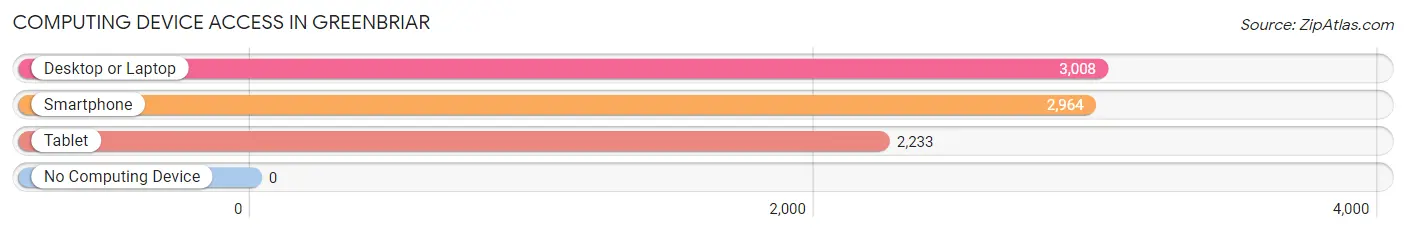
| Device Type | # Households | % Households |
| Desktop or Laptop | 3,008 | 99.6% |
| Smartphone | 2,964 | 98.1% |
| Tablet | 2,233 | 73.9% |
| No Computing Device | 0 | 0.0% |
| Total | 3,021 | 100.0% |
Internet Access in Greenbriar
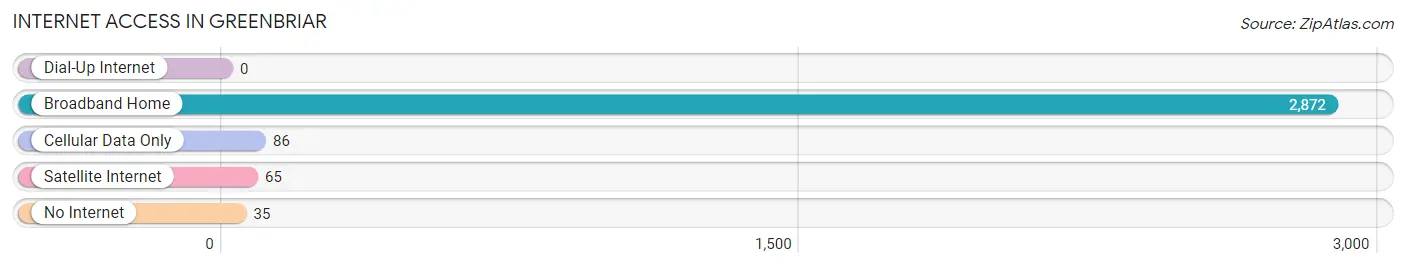
| Internet Type | # Households | % Households |
| Dial-Up Internet | 0 | 0.0% |
| Broadband Home | 2,872 | 95.1% |
| Cellular Data Only | 86 | 2.9% |
| Satellite Internet | 65 | 2.1% |
| No Internet | 35 | 1.2% |
| Total | 3,021 | 100.0% |
Greenbriar Summary
Greenbriar, Virginia is a small town located in the foothills of the Blue Ridge Mountains in the Shenandoah Valley. It is situated in the northern part of the state, about 25 miles west of Charlottesville. The town is home to approximately 1,500 people and is part of the larger Greenbriar County.
History
Greenbriar was first settled in the late 1700s by a group of German immigrants. The town was originally known as “Greenbriar” due to the abundance of greenbriar vines that grew in the area. The town was officially incorporated in 1820 and was named after the greenbriar vines.
In the early 1800s, Greenbriar was a thriving agricultural community. The town was known for its production of tobacco, corn, wheat, and other crops. The town also had a thriving lumber industry, with several sawmills located in the area.
In the late 1800s, the town began to experience a decline in its agricultural industry. This was due to the introduction of new farming techniques and the introduction of new crops. As a result, many of the town’s residents began to look for other sources of income.
In the early 1900s, the town began to experience a resurgence in its economy. This was due to the introduction of the railroad, which allowed for the transportation of goods and people to and from the town. The railroad also allowed for the development of new industries, such as the production of furniture and textiles.
Geography
Greenbriar is located in the northern part of Virginia, in the foothills of the Blue Ridge Mountains. The town is situated in the Shenandoah Valley, which is known for its rolling hills and lush forests. The town is located about 25 miles west of Charlottesville and is part of the larger Greenbriar County.
The town is surrounded by several small towns and villages, including White Hall, Madison, and Staunton. The town is also located near several state parks, including the Shenandoah National Park and the George Washington National Forest.
Economy
Greenbriar’s economy is largely based on agriculture and tourism. The town is home to several farms, which produce a variety of crops, including corn, wheat, and tobacco. The town is also home to several wineries, which produce a variety of wines.
The town is also home to several small businesses, including restaurants, shops, and galleries. The town is also home to several bed and breakfasts, which attract tourists from all over the world.
Demographics
As of the 2010 census, Greenbriar had a population of 1,500 people. The town is predominantly white, with approximately 95% of the population being white. The town also has a small African American population, with approximately 4% of the population being African American.
The town has a median household income of $45,000, which is slightly lower than the national average. The town also has a poverty rate of approximately 10%, which is slightly higher than the national average.
Conclusion
Greenbriar, Virginia is a small town located in the foothills of the Blue Ridge Mountains in the Shenandoah Valley. The town is home to approximately 1,500 people and is part of the larger Greenbriar County. The town’s economy is largely based on agriculture and tourism, with several farms, wineries, and small businesses located in the area. The town is predominantly white, with a small African American population. The town has a median household income of $45,000 and a poverty rate of approximately 10%.
Common Questions
What is Per Capita Income in Greenbriar?
Per Capita income in Greenbriar is $57,232.
What is the Median Family Income in Greenbriar?
Median Family Income in Greenbriar is $159,412.
What is the Median Household income in Greenbriar?
Median Household Income in Greenbriar is $127,100.
What is Income or Wage Gap in Greenbriar?
Income or Wage Gap in Greenbriar is 24.5%.
Women in Greenbriar earn 75.5 cents for every dollar earned by a man.
What is Inequality or Gini Index in Greenbriar?
Inequality or Gini Index in Greenbriar is 0.35.
What is the Total Population of Greenbriar?
Total Population of Greenbriar is 7,945.
What is the Total Male Population of Greenbriar?
Total Male Population of Greenbriar is 4,243.
What is the Total Female Population of Greenbriar?
Total Female Population of Greenbriar is 3,702.
What is the Ratio of Males per 100 Females in Greenbriar?
There are 114.61 Males per 100 Females in Greenbriar.
What is the Ratio of Females per 100 Males in Greenbriar?
There are 87.25 Females per 100 Males in Greenbriar.
What is the Median Population Age in Greenbriar?
Median Population Age in Greenbriar is 40.3 Years.
What is the Average Family Size in Greenbriar
Average Family Size in Greenbriar is 3.2 People.
What is the Average Household Size in Greenbriar
Average Household Size in Greenbriar is 2.6 People.
How Large is the Labor Force in Greenbriar?
There are 4,219 People in the Labor Forcein in Greenbriar.
What is the Percentage of People in the Labor Force in Greenbriar?
66.5% of People are in the Labor Force in Greenbriar.
What is the Unemployment Rate in Greenbriar?
Unemployment Rate in Greenbriar is 1.9%.