Short Pump, VA Map & Demographics
Short Pump Map
Short Pump Overview
$64,337
PER CAPITA INCOME
$163,493
AVG FAMILY INCOME
$130,899
AVG HOUSEHOLD INCOME
48.0%
WAGE / INCOME GAP [ % ]
52.0¢/ $1
WAGE / INCOME GAP [ $ ]
0.40
INEQUALITY / GINI INDEX
28,400
TOTAL POPULATION
14,193
MALE POPULATION
14,207
FEMALE POPULATION
99.90
MALES / 100 FEMALES
100.10
FEMALES / 100 MALES
38.8
MEDIAN AGE
3.1
AVG FAMILY SIZE
2.5
AVG HOUSEHOLD SIZE
15,492
LABOR FORCE [ PEOPLE ]
70.7%
PERCENT IN LABOR FORCE
1.8%
UNEMPLOYMENT RATE
Income in Short Pump
Income Overview in Short Pump
Per Capita Income in Short Pump is $64,337, while median incomes of families and households are $163,493 and $130,899 respectively.
| Characteristic | Number | Measure |
| Per Capita Income | 28,400 | $64,337 |
| Median Family Income | 7,688 | $163,493 |
| Mean Family Income | 7,688 | $192,080 |
| Median Household Income | 11,161 | $130,899 |
| Mean Household Income | 11,161 | $163,002 |
| Income Deficit | 7,688 | $0 |
| Wage / Income Gap (%) | 28,400 | 48.01% |
| Wage / Income Gap ($) | 28,400 | 51.99¢ per $1 |
| Gini / Inequality Index | 28,400 | 0.40 |
Earnings by Sex in Short Pump
Average Earnings in Short Pump are $76,778, $100,080 for men and $52,027 for women, a difference of 48.0%.
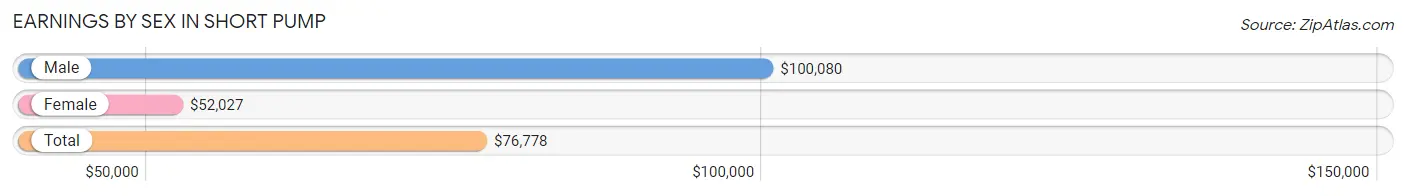
| Sex | Number | Average Earnings |
| Male | 8,674 (54.0%) | $100,080 |
| Female | 7,395 (46.0%) | $52,027 |
| Total | 16,069 (100.0%) | $76,778 |
Earnings by Sex by Income Bracket in Short Pump
The most common earnings brackets in Short Pump are $100,000+ for men (4,343 | 50.1%) and $100,000+ for women (1,710 | 23.1%).
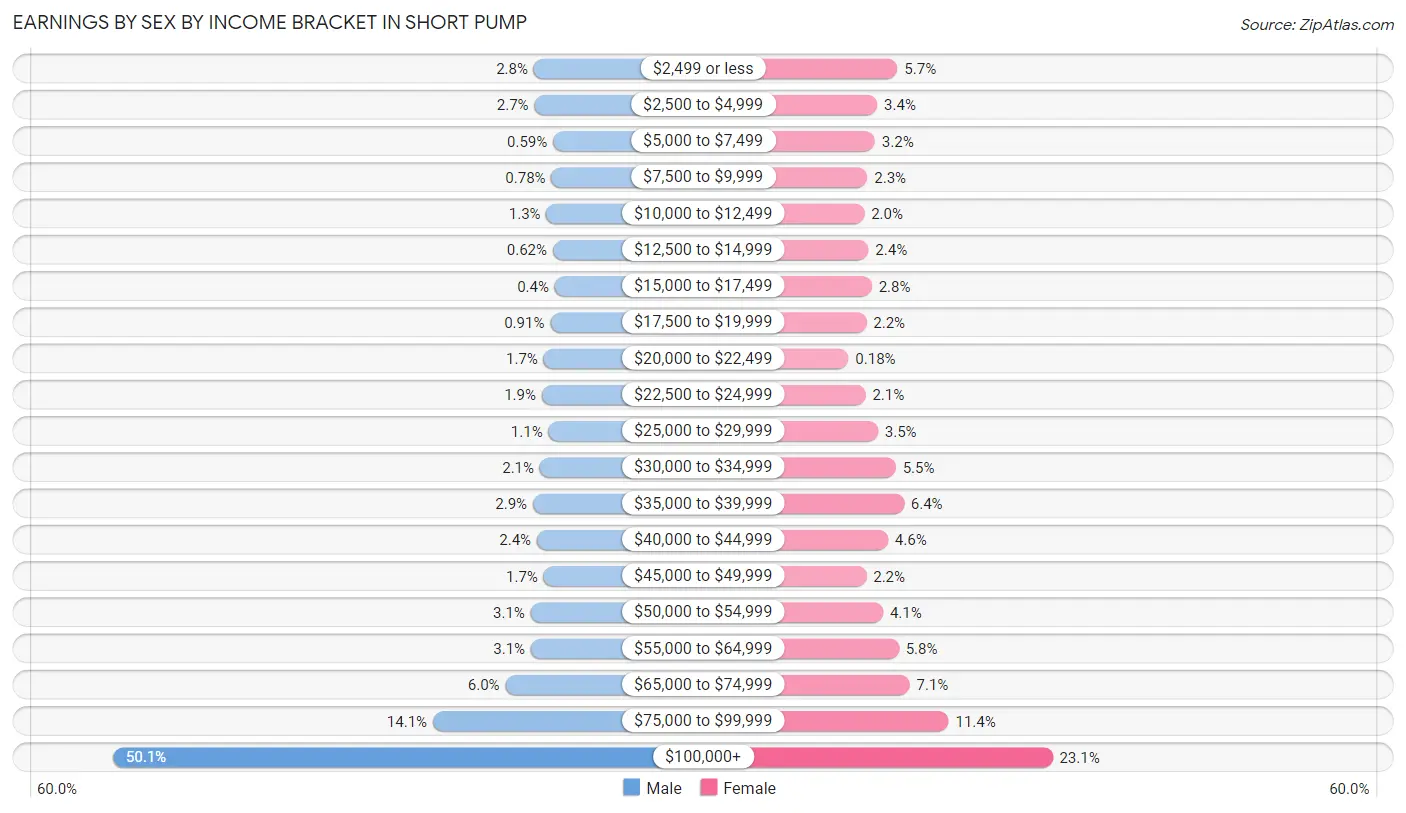
| Income | Male | Female |
| $2,499 or less | 239 (2.8%) | 421 (5.7%) |
| $2,500 to $4,999 | 233 (2.7%) | 252 (3.4%) |
| $5,000 to $7,499 | 51 (0.6%) | 234 (3.2%) |
| $7,500 to $9,999 | 68 (0.8%) | 171 (2.3%) |
| $10,000 to $12,499 | 116 (1.3%) | 145 (2.0%) |
| $12,500 to $14,999 | 54 (0.6%) | 180 (2.4%) |
| $15,000 to $17,499 | 35 (0.4%) | 207 (2.8%) |
| $17,500 to $19,999 | 79 (0.9%) | 163 (2.2%) |
| $20,000 to $22,499 | 143 (1.7%) | 13 (0.2%) |
| $22,500 to $24,999 | 161 (1.9%) | 155 (2.1%) |
| $25,000 to $29,999 | 96 (1.1%) | 258 (3.5%) |
| $30,000 to $34,999 | 180 (2.1%) | 407 (5.5%) |
| $35,000 to $39,999 | 248 (2.9%) | 474 (6.4%) |
| $40,000 to $44,999 | 209 (2.4%) | 342 (4.6%) |
| $45,000 to $49,999 | 143 (1.7%) | 162 (2.2%) |
| $50,000 to $54,999 | 270 (3.1%) | 301 (4.1%) |
| $55,000 to $64,999 | 267 (3.1%) | 432 (5.8%) |
| $65,000 to $74,999 | 516 (5.9%) | 522 (7.1%) |
| $75,000 to $99,999 | 1,223 (14.1%) | 846 (11.4%) |
| $100,000+ | 4,343 (50.1%) | 1,710 (23.1%) |
| Total | 8,674 (100.0%) | 7,395 (100.0%) |
Earnings by Sex by Educational Attainment in Short Pump
Average earnings in Short Pump are $107,579 for men and $56,869 for women, a difference of 47.1%. Men with an educational attainment of graduate degree enjoy the highest average annual earnings of $125,653, while those with high school diploma education earn the least with $71,250. Women with an educational attainment of graduate degree earn the most with the average annual earnings of $79,466, while those with high school diploma education have the smallest earnings of $23,509.
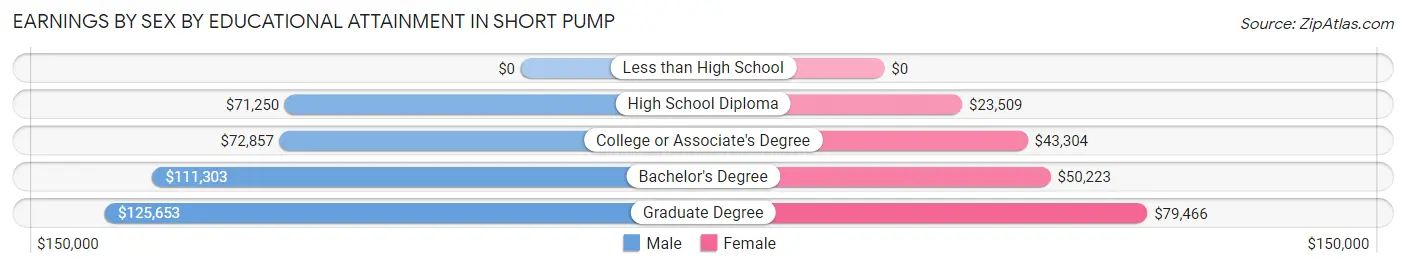
| Educational Attainment | Male Income | Female Income |
| Less than High School | - | - |
| High School Diploma | $71,250 | $23,509 |
| College or Associate's Degree | $72,857 | $43,304 |
| Bachelor's Degree | $111,303 | $50,223 |
| Graduate Degree | $125,653 | $79,466 |
| Total | $107,579 | $56,869 |
Family Income in Short Pump
Family Income Brackets in Short Pump
According to the Short Pump family income data, there are 2,775 families falling into the $200,000+ income range, which is the most common income bracket and makes up 36.1% of all families. Conversely, the $10,000 to $14,999 income bracket is the least frequent group with only 23 families (0.3%) belonging to this category.
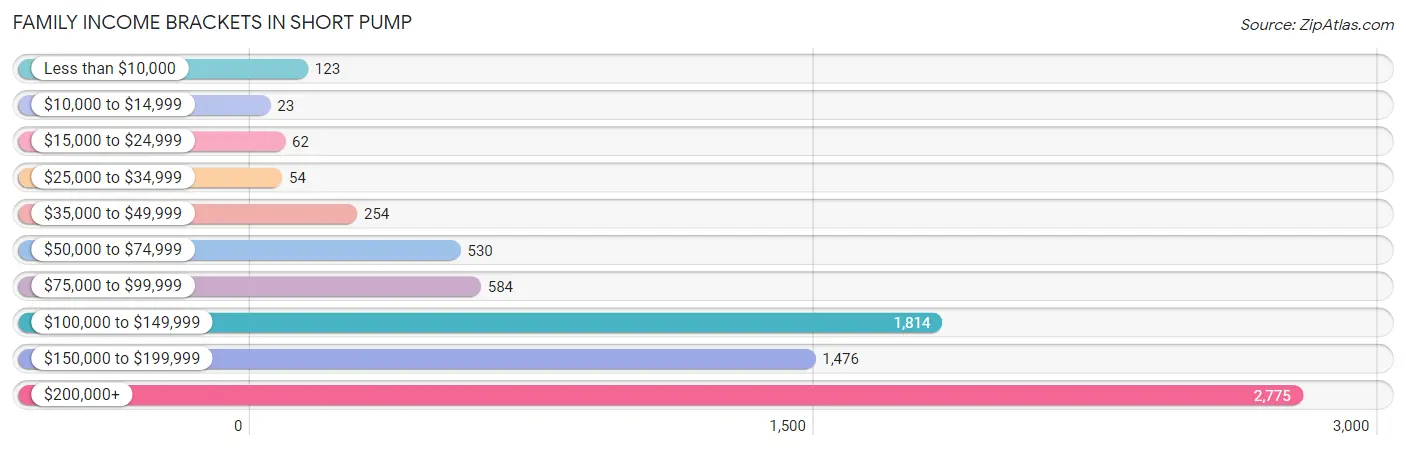
| Income Bracket | # Families | % Families |
| Less than $10,000 | 123 | 1.6% |
| $10,000 to $14,999 | 23 | 0.3% |
| $15,000 to $24,999 | 62 | 0.8% |
| $25,000 to $34,999 | 54 | 0.7% |
| $35,000 to $49,999 | 254 | 3.3% |
| $50,000 to $74,999 | 530 | 6.9% |
| $75,000 to $99,999 | 584 | 7.6% |
| $100,000 to $149,999 | 1,814 | 23.6% |
| $150,000 to $199,999 | 1,476 | 19.2% |
| $200,000+ | 2,775 | 36.1% |
Family Income by Famaliy Size in Short Pump
6-person families (166 | 2.2%) account for the highest median family income in Short Pump with $248,571 per family, while 2-person families (3,317 | 43.1%) have the highest median income of $69,560 per family member.
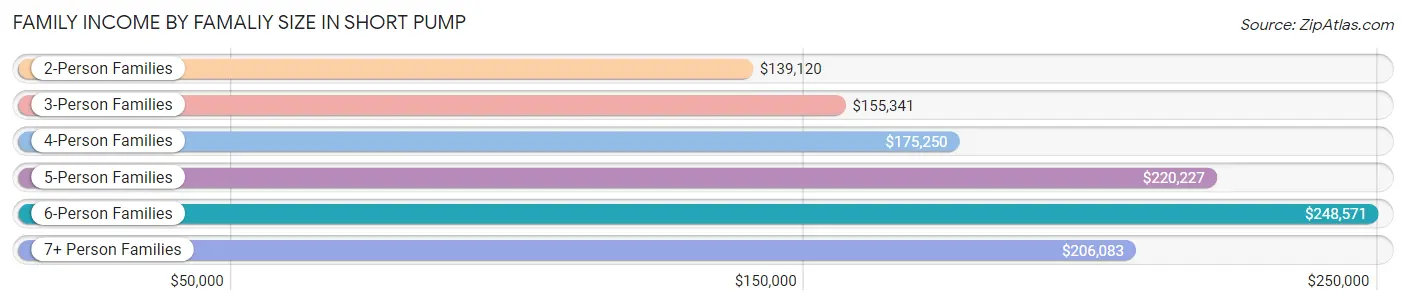
| Income Bracket | # Families | Median Income |
| 2-Person Families | 3,317 (43.1%) | $139,120 |
| 3-Person Families | 1,683 (21.9%) | $155,341 |
| 4-Person Families | 1,907 (24.8%) | $175,250 |
| 5-Person Families | 540 (7.0%) | $220,227 |
| 6-Person Families | 166 (2.2%) | $248,571 |
| 7+ Person Families | 75 (1.0%) | $206,083 |
| Total | 7,688 (100.0%) | $163,493 |
Family Income by Number of Earners in Short Pump
The median family income in Short Pump is $163,493, with families comprising 2 earners (3,932) having the highest median family income of $197,500, while families with no earners (656) have the lowest median family income of $66,768, accounting for 51.1% and 8.5% of families, respectively.
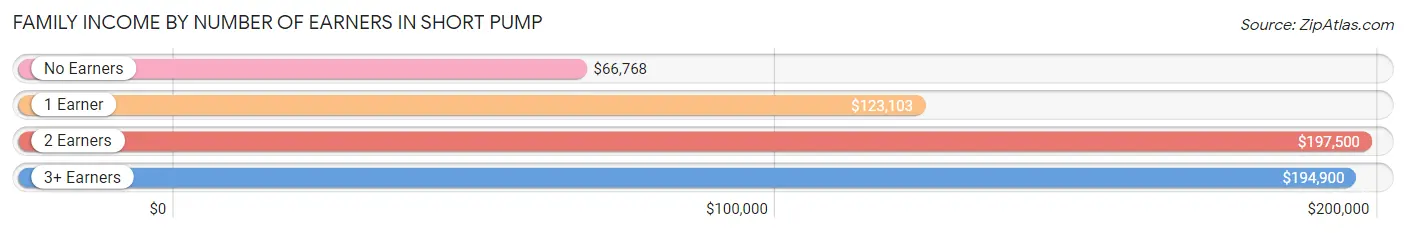
| Number of Earners | # Families | Median Income |
| No Earners | 656 (8.5%) | $66,768 |
| 1 Earner | 2,298 (29.9%) | $123,103 |
| 2 Earners | 3,932 (51.1%) | $197,500 |
| 3+ Earners | 802 (10.4%) | $194,900 |
| Total | 7,688 (100.0%) | $163,493 |
Household Income in Short Pump
Household Income Brackets in Short Pump
With 3,136 households falling in the category, the $200,000+ income range is the most frequent in Short Pump, accounting for 28.1% of all households. In contrast, only 100 households (0.9%) fall into the $10,000 to $14,999 income bracket, making it the least populous group.
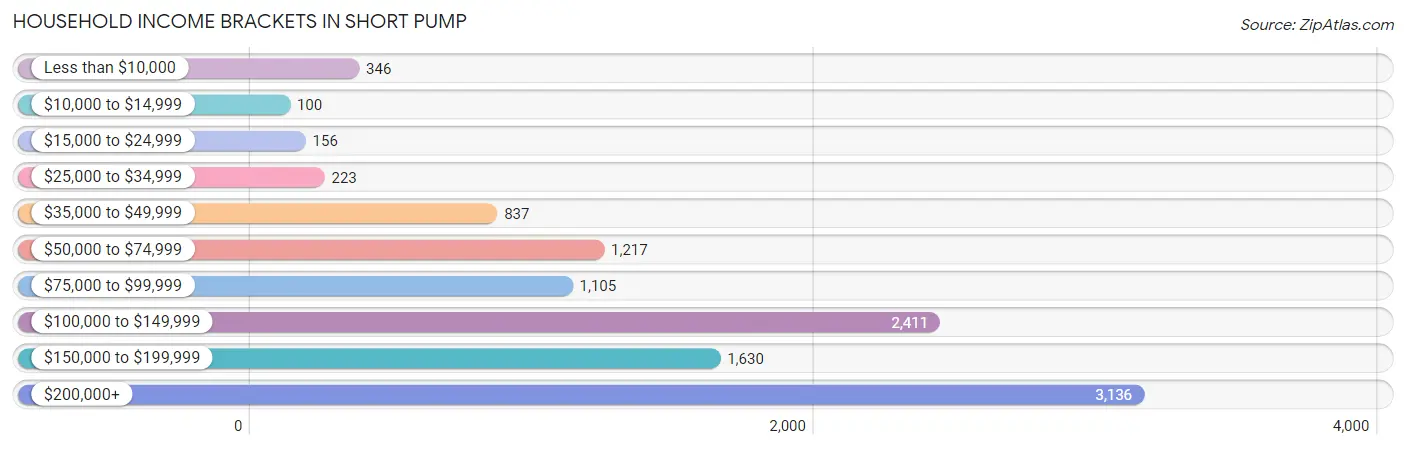
| Income Bracket | # Households | % Households |
| Less than $10,000 | 346 | 3.1% |
| $10,000 to $14,999 | 100 | 0.9% |
| $15,000 to $24,999 | 156 | 1.4% |
| $25,000 to $34,999 | 223 | 2.0% |
| $35,000 to $49,999 | 837 | 7.5% |
| $50,000 to $74,999 | 1,217 | 10.9% |
| $75,000 to $99,999 | 1,105 | 9.9% |
| $100,000 to $149,999 | 2,411 | 21.6% |
| $150,000 to $199,999 | 1,630 | 14.6% |
| $200,000+ | 3,136 | 28.1% |
Household Income by Householder Age in Short Pump
The median household income in Short Pump is $130,899, with the highest median household income of $182,545 found in the 45 to 64 years age bracket for the primary householder. A total of 4,459 households (40.0%) fall into this category. Meanwhile, the 15 to 24 years age bracket for the primary householder has the lowest median household income of $60,118, with 279 households (2.5%) in this group.
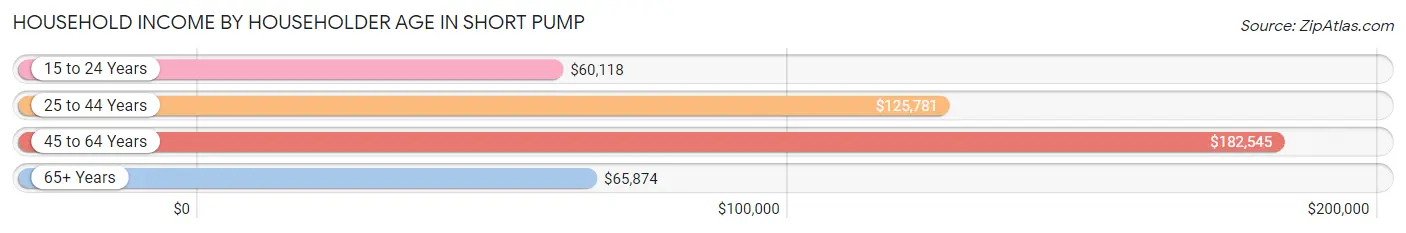
| Income Bracket | # Households | Median Income |
| 15 to 24 Years | 279 (2.5%) | $60,118 |
| 25 to 44 Years | 4,537 (40.6%) | $125,781 |
| 45 to 64 Years | 4,459 (40.0%) | $182,545 |
| 65+ Years | 1,886 (16.9%) | $65,874 |
| Total | 11,161 (100.0%) | $130,899 |
Poverty in Short Pump
Income Below Poverty by Sex and Age in Short Pump
With 4.2% poverty level for males and 4.8% for females among the residents of Short Pump, 75 year old and over males and 75 year old and over females are the most vulnerable to poverty, with 65 males (15.3%) and 196 females (26.2%) in their respective age groups living below the poverty level.
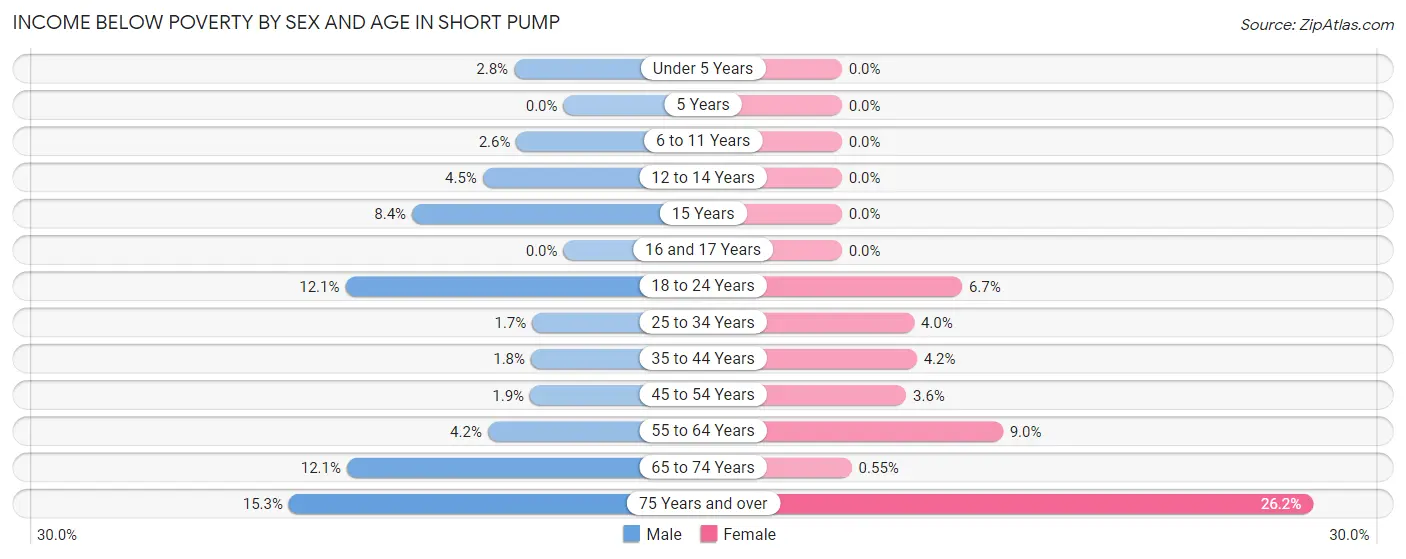
| Age Bracket | Male | Female |
| Under 5 Years | 31 (2.8%) | 0 (0.0%) |
| 5 Years | 0 (0.0%) | 0 (0.0%) |
| 6 to 11 Years | 36 (2.6%) | 0 (0.0%) |
| 12 to 14 Years | 33 (4.5%) | 0 (0.0%) |
| 15 Years | 28 (8.4%) | 0 (0.0%) |
| 16 and 17 Years | 0 (0.0%) | 0 (0.0%) |
| 18 to 24 Years | 105 (12.1%) | 48 (6.7%) |
| 25 to 34 Years | 29 (1.7%) | 84 (4.0%) |
| 35 to 44 Years | 41 (1.8%) | 94 (4.2%) |
| 45 to 54 Years | 39 (1.9%) | 73 (3.6%) |
| 55 to 64 Years | 77 (4.2%) | 172 (9.0%) |
| 65 to 74 Years | 106 (12.1%) | 7 (0.5%) |
| 75 Years and over | 65 (15.3%) | 196 (26.2%) |
| Total | 590 (4.2%) | 674 (4.8%) |
Income Above Poverty by Sex and Age in Short Pump
According to the poverty statistics in Short Pump, males aged 5 years and females aged under 5 years are the age groups that are most secure financially, with 100.0% of males and 100.0% of females in these age groups living above the poverty line.
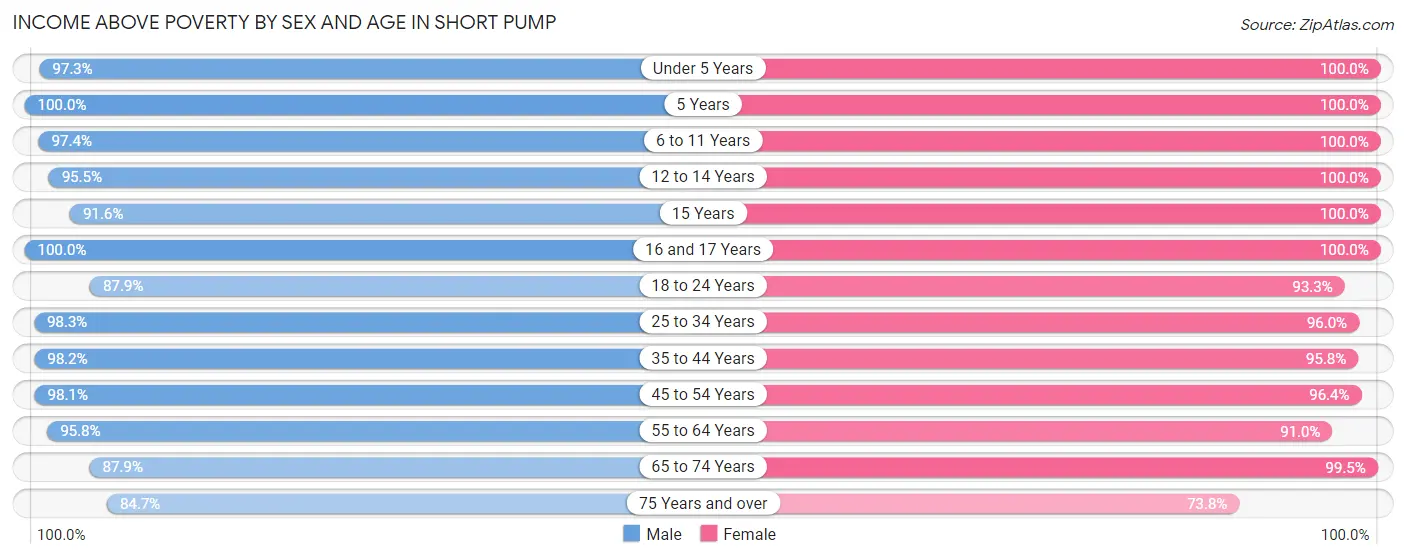
| Age Bracket | Male | Female |
| Under 5 Years | 1,097 (97.3%) | 627 (100.0%) |
| 5 Years | 159 (100.0%) | 166 (100.0%) |
| 6 to 11 Years | 1,339 (97.4%) | 1,098 (100.0%) |
| 12 to 14 Years | 702 (95.5%) | 664 (100.0%) |
| 15 Years | 304 (91.6%) | 204 (100.0%) |
| 16 and 17 Years | 415 (100.0%) | 292 (100.0%) |
| 18 to 24 Years | 760 (87.9%) | 670 (93.3%) |
| 25 to 34 Years | 1,635 (98.3%) | 2,008 (96.0%) |
| 35 to 44 Years | 2,222 (98.2%) | 2,162 (95.8%) |
| 45 to 54 Years | 2,055 (98.1%) | 1,966 (96.4%) |
| 55 to 64 Years | 1,754 (95.8%) | 1,747 (91.0%) |
| 65 to 74 Years | 773 (87.9%) | 1,261 (99.5%) |
| 75 Years and over | 360 (84.7%) | 551 (73.8%) |
| Total | 13,575 (95.8%) | 13,416 (95.2%) |
Income Below Poverty Among Married-Couple Families in Short Pump
The poverty statistics for married-couple families in Short Pump show that 2.1% or 141 of the total 6,723 families live below the poverty line. Families with no children have the highest poverty rate of 3.2%, comprising of 101 families. On the other hand, families with 3 or 4 children have the lowest poverty rate of 0.0%, which includes 0 families.
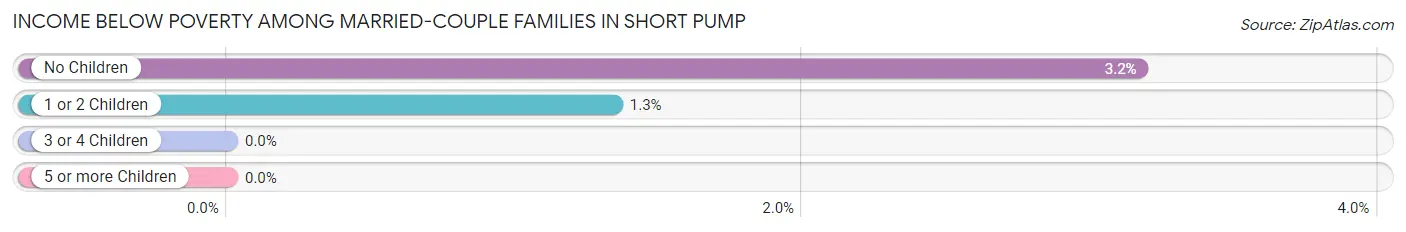
| Children | Above Poverty | Below Poverty |
| No Children | 3,084 (96.8%) | 101 (3.2%) |
| 1 or 2 Children | 2,945 (98.7%) | 40 (1.3%) |
| 3 or 4 Children | 537 (100.0%) | 0 (0.0%) |
| 5 or more Children | 16 (100.0%) | 0 (0.0%) |
| Total | 6,582 (97.9%) | 141 (2.1%) |
Income Below Poverty Among Single-Parent Households in Short Pump
According to the poverty data in Short Pump, 6.8% or 21 single-father households and 5.8% or 38 single-mother households are living below the poverty line. Among single-father households, those with 1 or 2 children have the highest poverty rate, with 21 households (10.2%) experiencing poverty. Likewise, among single-mother households, those with 3 or 4 children have the highest poverty rate, with 16 households (44.4%) falling below the poverty line.
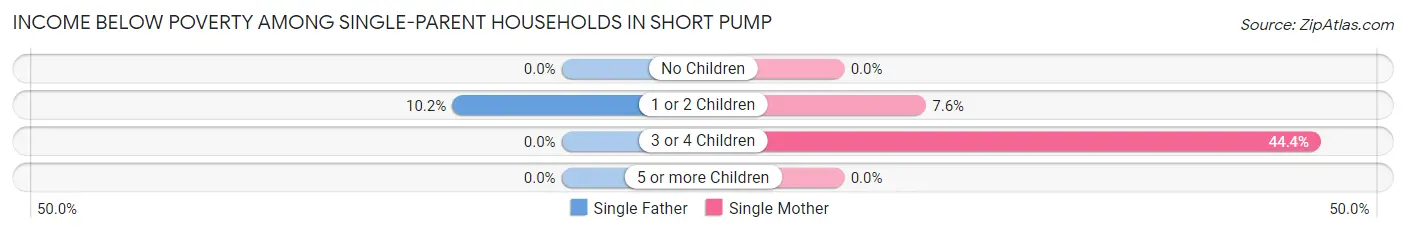
| Children | Single Father | Single Mother |
| No Children | 0 (0.0%) | 0 (0.0%) |
| 1 or 2 Children | 21 (10.2%) | 22 (7.6%) |
| 3 or 4 Children | 0 (0.0%) | 16 (44.4%) |
| 5 or more Children | 0 (0.0%) | 0 (0.0%) |
| Total | 21 (6.8%) | 38 (5.8%) |
Income Below Poverty Among Married-Couple vs Single-Parent Households in Short Pump
The poverty data for Short Pump shows that 141 of the married-couple family households (2.1%) and 59 of the single-parent households (6.1%) are living below the poverty level. Within the married-couple family households, those with no children have the highest poverty rate, with 101 households (3.2%) falling below the poverty line. Among the single-parent households, those with 3 or 4 children have the highest poverty rate, with 16 household (44.4%) living below poverty.
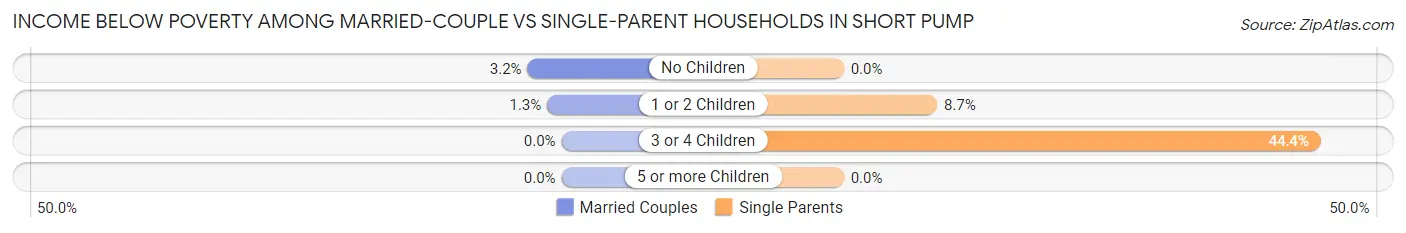
| Children | Married-Couple Families | Single-Parent Households |
| No Children | 101 (3.2%) | 0 (0.0%) |
| 1 or 2 Children | 40 (1.3%) | 43 (8.7%) |
| 3 or 4 Children | 0 (0.0%) | 16 (44.4%) |
| 5 or more Children | 0 (0.0%) | 0 (0.0%) |
| Total | 141 (2.1%) | 59 (6.1%) |
Race in Short Pump
The most populous races in Short Pump are White / Caucasian (17,541 | 61.8%), Asian (7,472 | 26.3%), and Black / African American (1,888 | 6.7%).
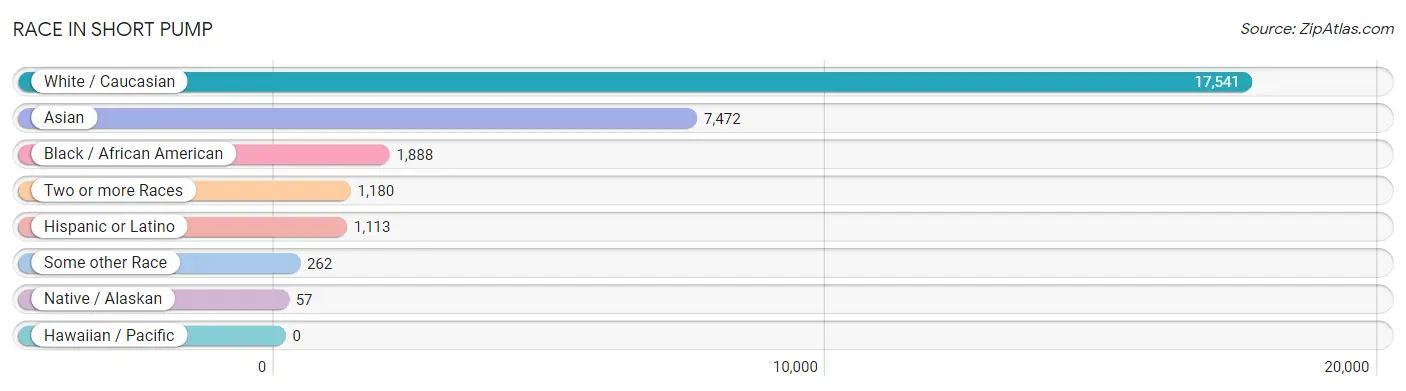
| Race | # Population | % Population |
| Asian | 7,472 | 26.3% |
| Black / African American | 1,888 | 6.7% |
| Hawaiian / Pacific | 0 | 0.0% |
| Hispanic or Latino | 1,113 | 3.9% |
| Native / Alaskan | 57 | 0.2% |
| White / Caucasian | 17,541 | 61.8% |
| Two or more Races | 1,180 | 4.2% |
| Some other Race | 262 | 0.9% |
| Total | 28,400 | 100.0% |
Ancestry in Short Pump
The most populous ancestries reported in Short Pump are Thai (4,717 | 16.6%), German (3,680 | 13.0%), English (3,422 | 12.0%), Irish (2,903 | 10.2%), and American (1,715 | 6.0%), together accounting for 57.9% of all Short Pump residents.
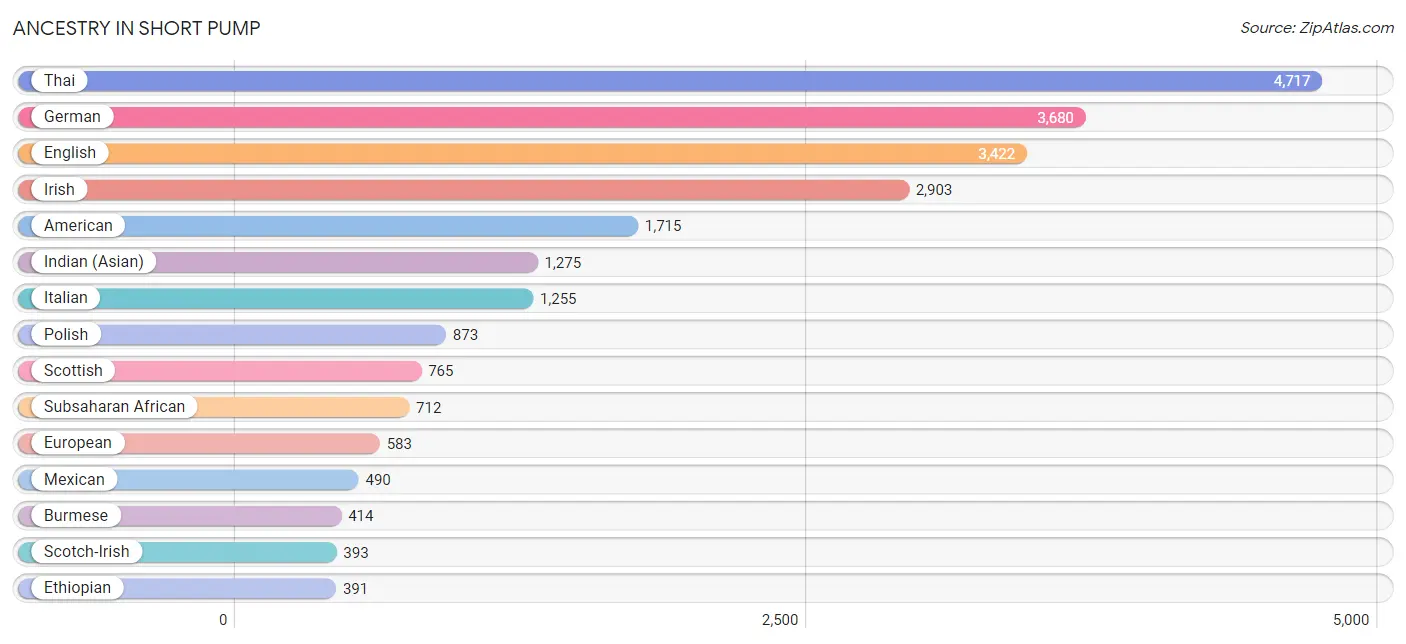
| Ancestry | # Population | % Population |
| Afghan | 15 | 0.1% |
| Albanian | 29 | 0.1% |
| American | 1,715 | 6.0% |
| Apache | 55 | 0.2% |
| Arab | 338 | 1.2% |
| Armenian | 47 | 0.2% |
| Austrian | 175 | 0.6% |
| Barbadian | 12 | 0.0% |
| Belgian | 39 | 0.1% |
| Bhutanese | 180 | 0.6% |
| Brazilian | 48 | 0.2% |
| British | 153 | 0.5% |
| British West Indian | 24 | 0.1% |
| Bulgarian | 20 | 0.1% |
| Burmese | 414 | 1.5% |
| Canadian | 105 | 0.4% |
| Cape Verdean | 13 | 0.1% |
| Central American | 131 | 0.5% |
| Cherokee | 58 | 0.2% |
| Choctaw | 35 | 0.1% |
| Colombian | 123 | 0.4% |
| Croatian | 16 | 0.1% |
| Crow | 48 | 0.2% |
| Cuban | 117 | 0.4% |
| Czech | 74 | 0.3% |
| Czechoslovakian | 72 | 0.3% |
| Danish | 85 | 0.3% |
| Dutch | 265 | 0.9% |
| Eastern European | 298 | 1.1% |
| Egyptian | 104 | 0.4% |
| English | 3,422 | 12.0% |
| Ethiopian | 391 | 1.4% |
| European | 583 | 2.1% |
| Filipino | 5 | 0.0% |
| French | 370 | 1.3% |
| French Canadian | 149 | 0.5% |
| German | 3,680 | 13.0% |
| Ghanaian | 25 | 0.1% |
| Greek | 107 | 0.4% |
| Haitian | 49 | 0.2% |
| Hungarian | 177 | 0.6% |
| Indian (Asian) | 1,275 | 4.5% |
| Iranian | 127 | 0.4% |
| Irish | 2,903 | 10.2% |
| Israeli | 60 | 0.2% |
| Italian | 1,255 | 4.4% |
| Jamaican | 19 | 0.1% |
| Kenyan | 9 | 0.0% |
| Korean | 361 | 1.3% |
| Latvian | 18 | 0.1% |
| Lebanese | 193 | 0.7% |
| Lithuanian | 32 | 0.1% |
| Malaysian | 11 | 0.0% |
| Mexican | 490 | 1.7% |
| Mexican American Indian | 33 | 0.1% |
| Navajo | 1 | 0.0% |
| Nicaraguan | 33 | 0.1% |
| Nigerian | 94 | 0.3% |
| Northern European | 46 | 0.2% |
| Norwegian | 114 | 0.4% |
| Pakistani | 46 | 0.2% |
| Palestinian | 23 | 0.1% |
| Panamanian | 98 | 0.4% |
| Peruvian | 71 | 0.3% |
| Polish | 873 | 3.1% |
| Portuguese | 54 | 0.2% |
| Potawatomi | 15 | 0.1% |
| Puerto Rican | 53 | 0.2% |
| Romanian | 20 | 0.1% |
| Russian | 207 | 0.7% |
| Scandinavian | 18 | 0.1% |
| Scotch-Irish | 393 | 1.4% |
| Scottish | 765 | 2.7% |
| Slovak | 32 | 0.1% |
| South American | 255 | 0.9% |
| Spaniard | 14 | 0.1% |
| Spanish | 19 | 0.1% |
| Sri Lankan | 153 | 0.5% |
| Subsaharan African | 712 | 2.5% |
| Sudanese | 118 | 0.4% |
| Swedish | 284 | 1.0% |
| Swiss | 3 | 0.0% |
| Thai | 4,717 | 16.6% |
| Trinidadian and Tobagonian | 12 | 0.0% |
| Turkish | 57 | 0.2% |
| Ukrainian | 121 | 0.4% |
| Venezuelan | 61 | 0.2% |
| Vietnamese | 119 | 0.4% |
| Welsh | 69 | 0.2% |
| West Indian | 10 | 0.0% | View All 90 Rows |
Immigrants in Short Pump
The most numerous immigrant groups reported in Short Pump came from Asia (5,457 | 19.2%), South Central Asia (3,836 | 13.5%), India (3,361 | 11.8%), Eastern Asia (1,194 | 4.2%), and China (801 | 2.8%), together accounting for 51.6% of all Short Pump residents.
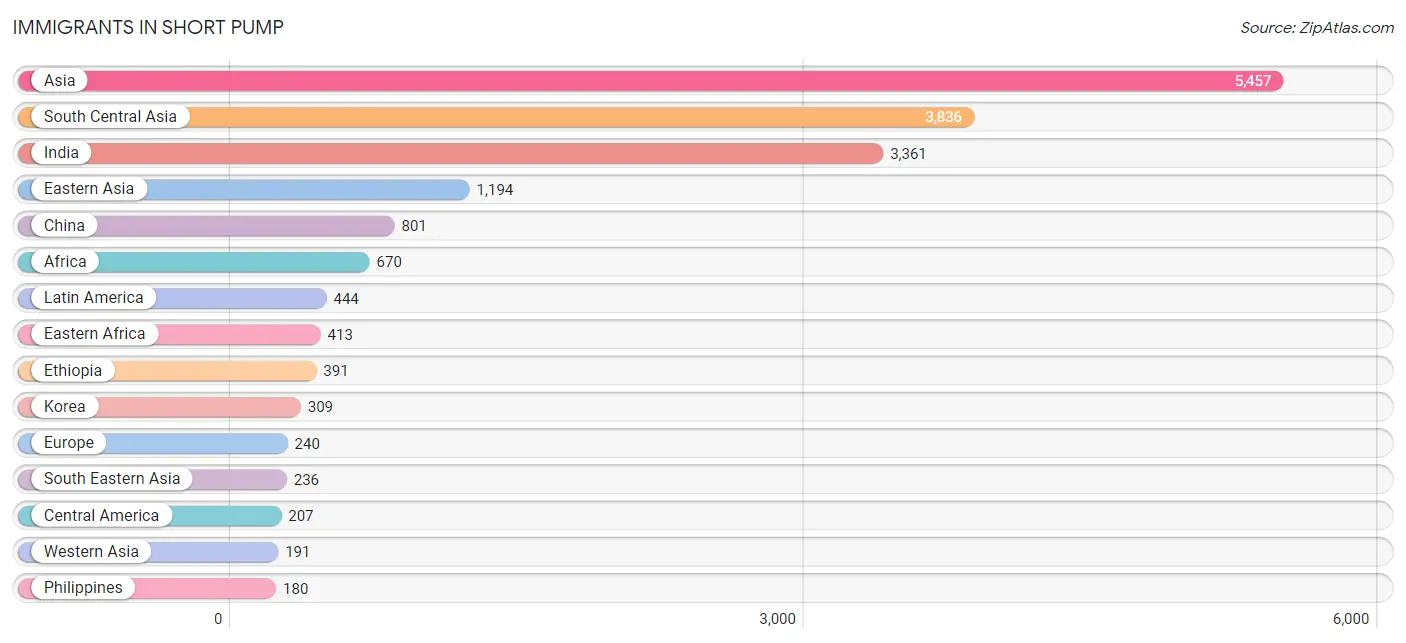
| Immigration Origin | # Population | % Population |
| Afghanistan | 40 | 0.1% |
| Africa | 670 | 2.4% |
| Asia | 5,457 | 19.2% |
| Australia | 11 | 0.0% |
| Bangladesh | 45 | 0.2% |
| Barbados | 12 | 0.0% |
| Bulgaria | 12 | 0.0% |
| Canada | 121 | 0.4% |
| Caribbean | 118 | 0.4% |
| Central America | 207 | 0.7% |
| China | 801 | 2.8% |
| Colombia | 7 | 0.0% |
| Croatia | 16 | 0.1% |
| Eastern Africa | 413 | 1.5% |
| Eastern Asia | 1,194 | 4.2% |
| Eastern Europe | 53 | 0.2% |
| Egypt | 103 | 0.4% |
| El Salvador | 20 | 0.1% |
| England | 49 | 0.2% |
| Ethiopia | 391 | 1.4% |
| Europe | 240 | 0.9% |
| Germany | 30 | 0.1% |
| Ghana | 25 | 0.1% |
| Greece | 36 | 0.1% |
| Haiti | 49 | 0.2% |
| Hong Kong | 16 | 0.1% |
| India | 3,361 | 11.8% |
| Iran | 69 | 0.2% |
| Ireland | 10 | 0.0% |
| Israel | 44 | 0.2% |
| Italy | 17 | 0.1% |
| Japan | 84 | 0.3% |
| Kenya | 9 | 0.0% |
| Korea | 309 | 1.1% |
| Laos | 11 | 0.0% |
| Latin America | 444 | 1.6% |
| Lebanon | 57 | 0.2% |
| Mexico | 168 | 0.6% |
| Middle Africa | 62 | 0.2% |
| Nepal | 75 | 0.3% |
| Nicaragua | 19 | 0.1% |
| Nigeria | 25 | 0.1% |
| Northern Africa | 145 | 0.5% |
| Northern Europe | 104 | 0.4% |
| Norway | 21 | 0.1% |
| Oceania | 11 | 0.0% |
| Pakistan | 151 | 0.5% |
| Peru | 51 | 0.2% |
| Philippines | 180 | 0.6% |
| Romania | 14 | 0.1% |
| South America | 119 | 0.4% |
| South Central Asia | 3,836 | 13.5% |
| South Eastern Asia | 236 | 0.8% |
| Southern Europe | 53 | 0.2% |
| Sri Lanka | 95 | 0.3% |
| Sudan | 42 | 0.2% |
| Taiwan | 121 | 0.4% |
| Trinidad and Tobago | 57 | 0.2% |
| Turkey | 47 | 0.2% |
| Venezuela | 61 | 0.2% |
| Vietnam | 45 | 0.2% |
| Western Africa | 50 | 0.2% |
| Western Asia | 191 | 0.7% |
| Western Europe | 30 | 0.1% |
| Zaire | 62 | 0.2% |
| Zimbabwe | 13 | 0.1% | View All 66 Rows |
Sex and Age in Short Pump
Sex and Age in Short Pump
The most populous age groups in Short Pump are 10 to 14 Years (1,221 | 8.6%) for men and 30 to 34 Years (1,298 | 9.1%) for women.
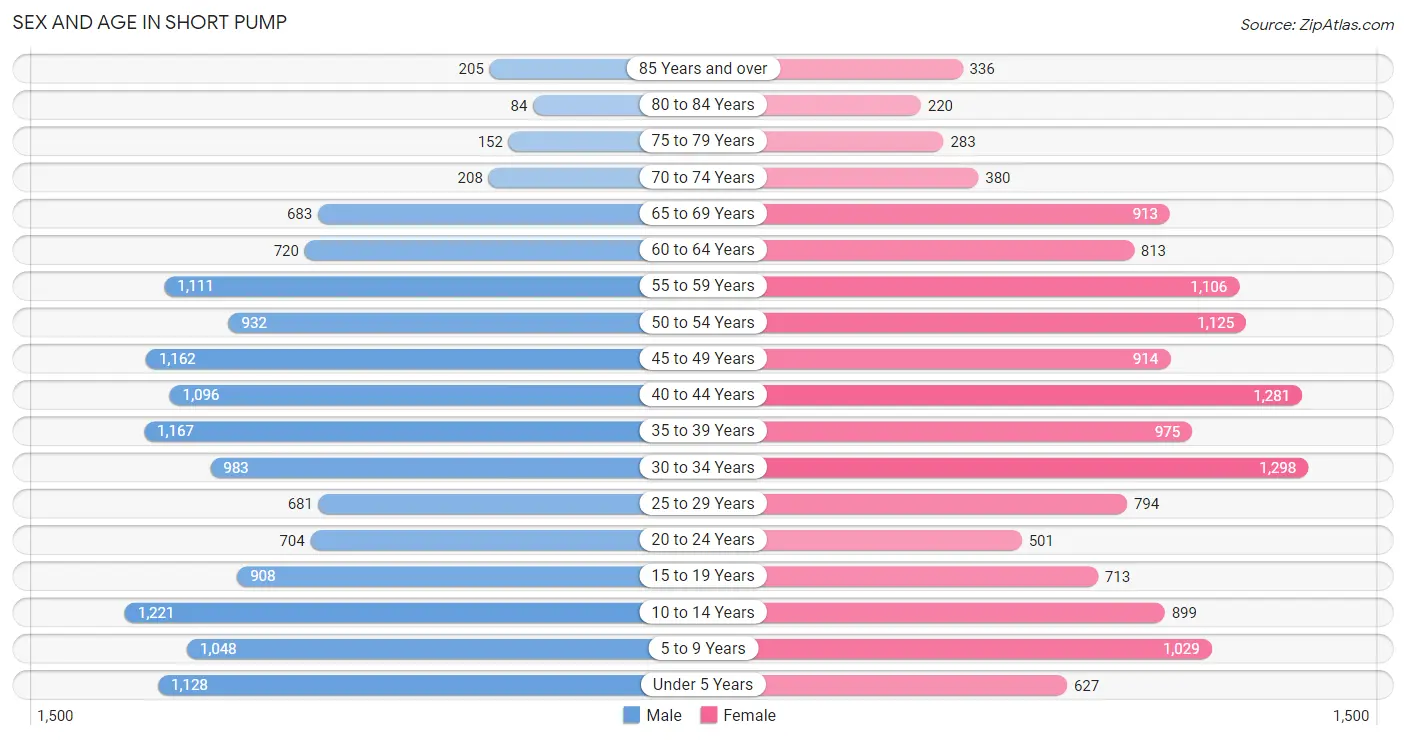
| Age Bracket | Male | Female |
| Under 5 Years | 1,128 (8.0%) | 627 (4.4%) |
| 5 to 9 Years | 1,048 (7.4%) | 1,029 (7.2%) |
| 10 to 14 Years | 1,221 (8.6%) | 899 (6.3%) |
| 15 to 19 Years | 908 (6.4%) | 713 (5.0%) |
| 20 to 24 Years | 704 (5.0%) | 501 (3.5%) |
| 25 to 29 Years | 681 (4.8%) | 794 (5.6%) |
| 30 to 34 Years | 983 (6.9%) | 1,298 (9.1%) |
| 35 to 39 Years | 1,167 (8.2%) | 975 (6.9%) |
| 40 to 44 Years | 1,096 (7.7%) | 1,281 (9.0%) |
| 45 to 49 Years | 1,162 (8.2%) | 914 (6.4%) |
| 50 to 54 Years | 932 (6.6%) | 1,125 (7.9%) |
| 55 to 59 Years | 1,111 (7.8%) | 1,106 (7.8%) |
| 60 to 64 Years | 720 (5.1%) | 813 (5.7%) |
| 65 to 69 Years | 683 (4.8%) | 913 (6.4%) |
| 70 to 74 Years | 208 (1.5%) | 380 (2.7%) |
| 75 to 79 Years | 152 (1.1%) | 283 (2.0%) |
| 80 to 84 Years | 84 (0.6%) | 220 (1.5%) |
| 85 Years and over | 205 (1.4%) | 336 (2.4%) |
| Total | 14,193 (100.0%) | 14,207 (100.0%) |
Families and Households in Short Pump
Median Family Size in Short Pump
The median family size in Short Pump is 3.08 persons per family, with married-couple families (6,723 | 87.5%) accounting for the largest median family size of 3.15 persons per family. On the other hand, single male/father families (307 | 4.0%) represent the smallest median family size with 2.39 persons per family.
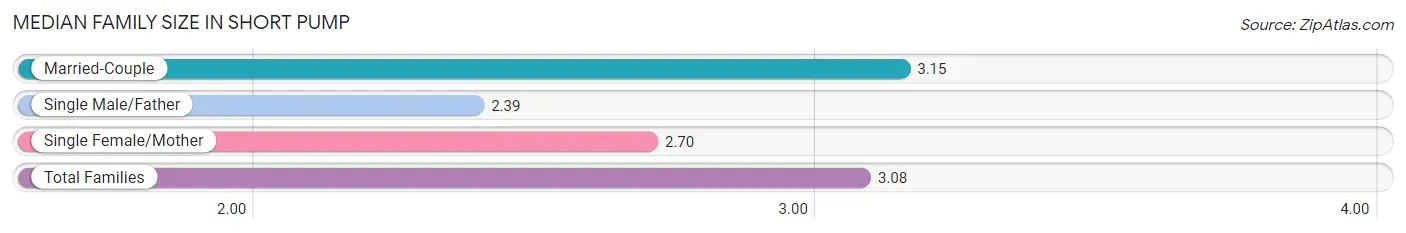
| Family Type | # Families | Family Size |
| Married-Couple | 6,723 (87.5%) | 3.15 |
| Single Male/Father | 307 (4.0%) | 2.39 |
| Single Female/Mother | 658 (8.6%) | 2.70 |
| Total Families | 7,688 (100.0%) | 3.08 |
Median Household Size in Short Pump
The median household size in Short Pump is 2.53 persons per household, with married-couple households (6,723 | 60.2%) accounting for the largest median household size of 3.16 persons per household. non-family households (3,473 | 31.1%) represent the smallest median household size with 1.23 persons per household.
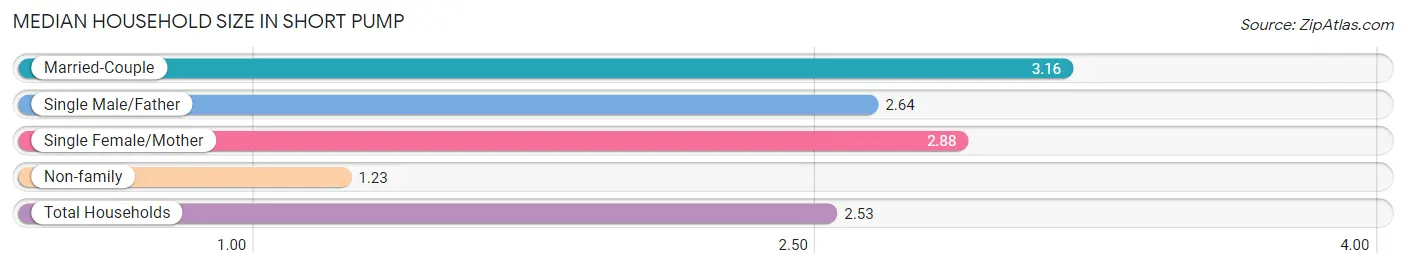
| Household Type | # Households | Household Size |
| Married-Couple | 6,723 (60.2%) | 3.16 |
| Single Male/Father | 307 (2.8%) | 2.64 |
| Single Female/Mother | 658 (5.9%) | 2.88 |
| Non-family | 3,473 (31.1%) | 1.23 |
| Total Households | 11,161 (100.0%) | 2.53 |
Household Size by Marriage Status in Short Pump
Out of a total of 11,161 households in Short Pump, 7,688 (68.9%) are family households, while 3,473 (31.1%) are nonfamily households. The most numerous type of family households are 2-person households, comprising 3,148, and the most common type of nonfamily households are 1-person households, comprising 2,752.
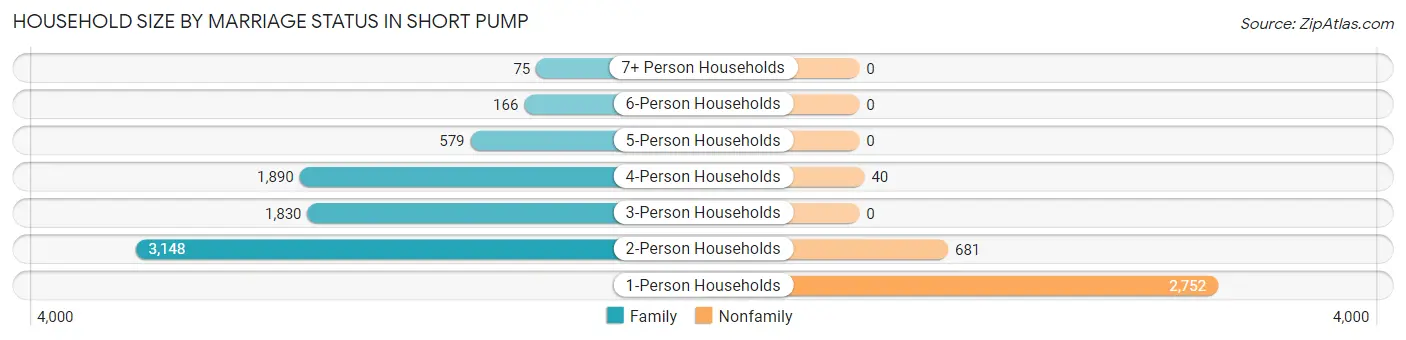
| Household Size | Family Households | Nonfamily Households |
| 1-Person Households | - | 2,752 (24.7%) |
| 2-Person Households | 3,148 (28.2%) | 681 (6.1%) |
| 3-Person Households | 1,830 (16.4%) | 0 (0.0%) |
| 4-Person Households | 1,890 (16.9%) | 40 (0.4%) |
| 5-Person Households | 579 (5.2%) | 0 (0.0%) |
| 6-Person Households | 166 (1.5%) | 0 (0.0%) |
| 7+ Person Households | 75 (0.7%) | 0 (0.0%) |
| Total | 7,688 (68.9%) | 3,473 (31.1%) |
Female Fertility in Short Pump
Fertility by Age in Short Pump
Average fertility rate in Short Pump is 45.0 births per 1,000 women. Women in the age bracket of 20 to 34 years have the highest fertility rate with 82.0 births per 1,000 women. Women in the age bracket of 20 to 34 years acount for 72.0% of all women with births.
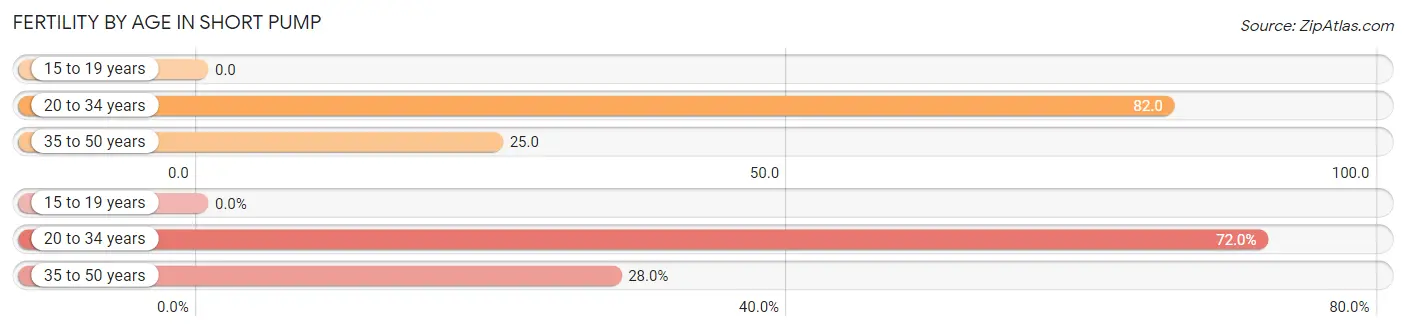
| Age Bracket | Women with Births | Births / 1,000 Women |
| 15 to 19 years | 0 (0.0%) | 0.0 |
| 20 to 34 years | 213 (72.0%) | 82.0 |
| 35 to 50 years | 83 (28.0%) | 25.0 |
| Total | 296 (100.0%) | 45.0 |
Fertility by Age by Marriage Status in Short Pump
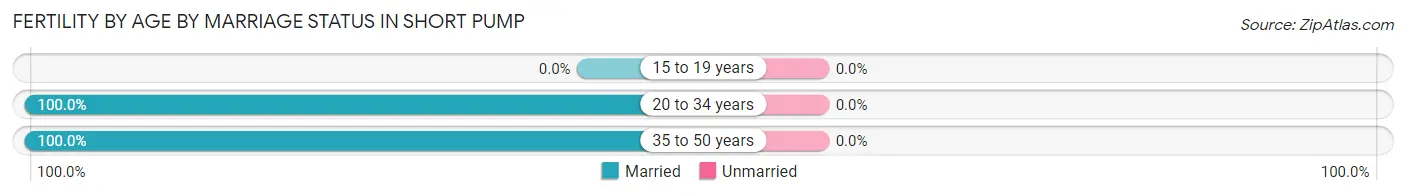
| Age Bracket | Married | Unmarried |
| 15 to 19 years | 0 (0.0%) | 0 (0.0%) |
| 20 to 34 years | 213 (100.0%) | 0 (0.0%) |
| 35 to 50 years | 83 (100.0%) | 0 (0.0%) |
| Total | 296 (100.0%) | 0 (0.0%) |
Fertility by Education in Short Pump
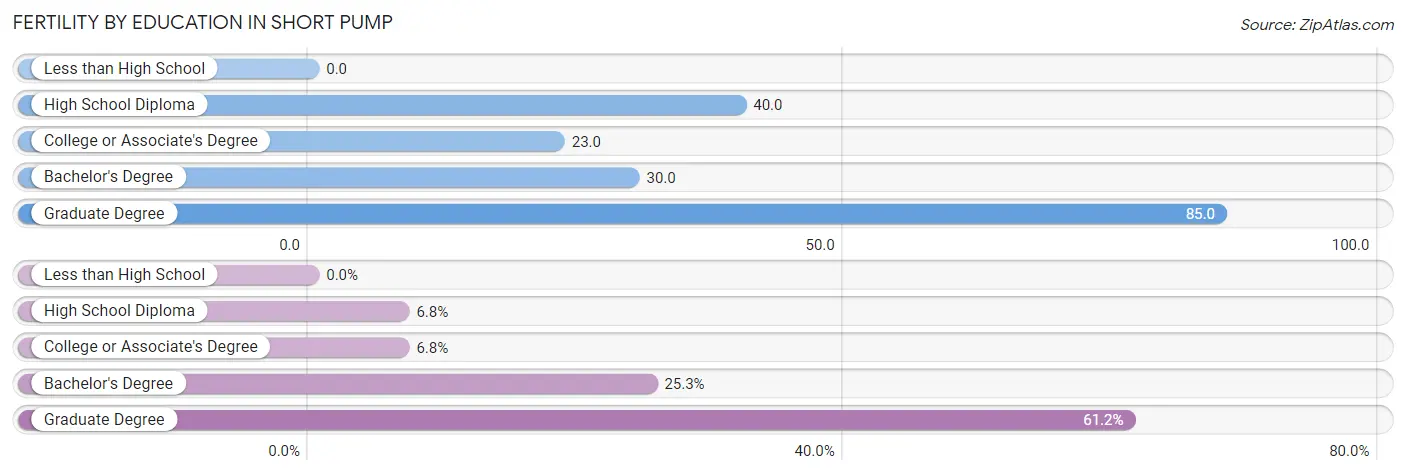
| Educational Attainment | Women with Births | Births / 1,000 Women |
| Less than High School | 0 (0.0%) | 0.0 |
| High School Diploma | 20 (6.8%) | 40.0 |
| College or Associate's Degree | 20 (6.8%) | 23.0 |
| Bachelor's Degree | 75 (25.3%) | 30.0 |
| Graduate Degree | 181 (61.2%) | 85.0 |
| Total | 296 (100.0%) | 45.0 |
Fertility by Education by Marriage Status in Short Pump
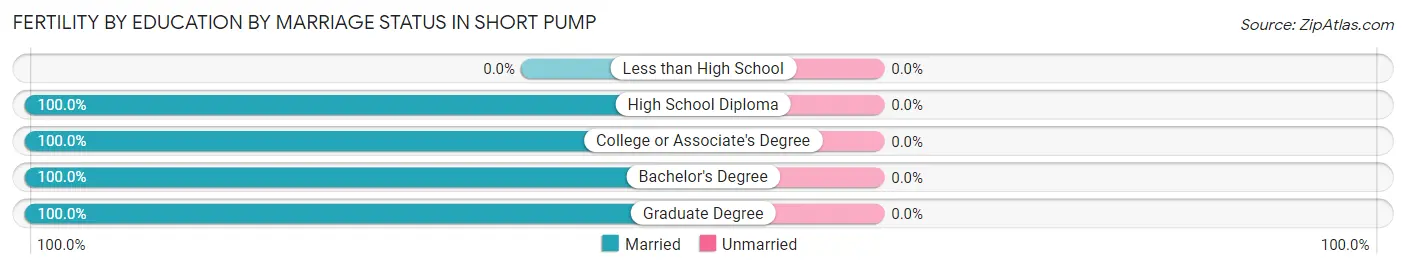
| Educational Attainment | Married | Unmarried |
| Less than High School | 0 (0.0%) | 0 (0.0%) |
| High School Diploma | 20 (100.0%) | 0 (0.0%) |
| College or Associate's Degree | 20 (100.0%) | 0 (0.0%) |
| Bachelor's Degree | 75 (100.0%) | 0 (0.0%) |
| Graduate Degree | 181 (100.0%) | 0 (0.0%) |
| Total | 296 (100.0%) | 0 (0.0%) |
Employment Characteristics in Short Pump
Employment by Class of Employer in Short Pump
Among the 14,669 employed individuals in Short Pump, private company employees (9,341 | 63.7%), state government employees (1,247 | 8.5%), and self-employed (incorporated) (1,028 | 7.0%) make up the most common classes of employment.
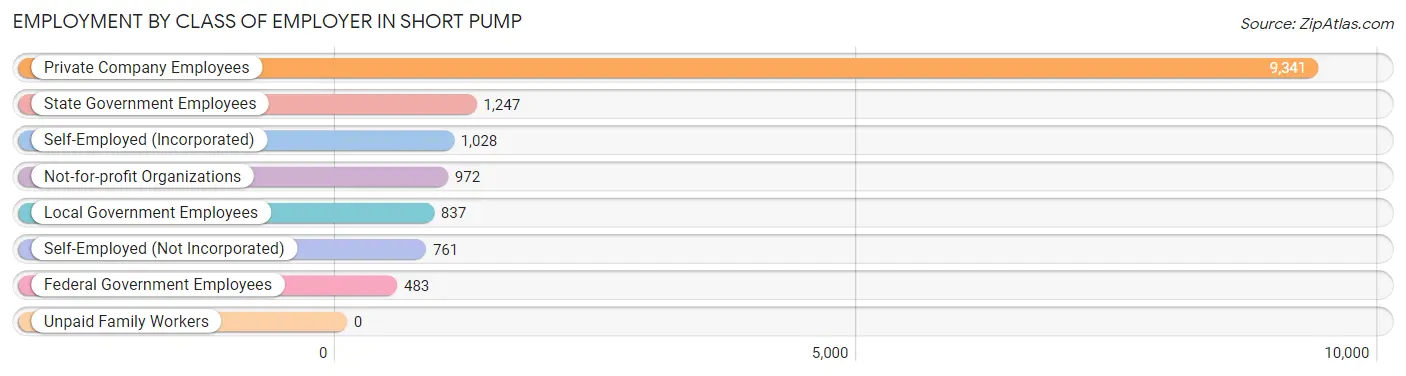
| Employer Class | # Employees | % Employees |
| Private Company Employees | 9,341 | 63.7% |
| Self-Employed (Incorporated) | 1,028 | 7.0% |
| Self-Employed (Not Incorporated) | 761 | 5.2% |
| Not-for-profit Organizations | 972 | 6.6% |
| Local Government Employees | 837 | 5.7% |
| State Government Employees | 1,247 | 8.5% |
| Federal Government Employees | 483 | 3.3% |
| Unpaid Family Workers | 0 | 0.0% |
| Total | 14,669 | 100.0% |
Employment Status by Age in Short Pump
According to the labor force statistics for Short Pump, out of the total population over 16 years of age (21,912), 70.7% or 15,492 individuals are in the labor force, with 1.8% or 279 of them unemployed. The age group with the highest labor force participation rate is 30 to 34 years, with 88.1% or 2,010 individuals in the labor force. Within the labor force, the 16 to 19 years age range has the highest percentage of unemployed individuals, with 8.4% or 34 of them being unemployed.
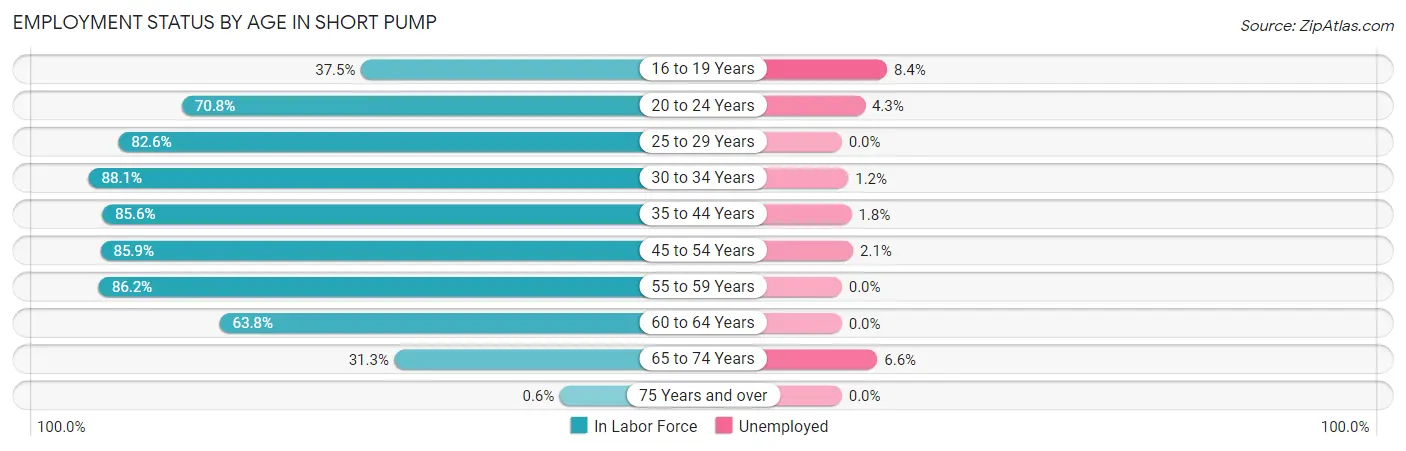
| Age Bracket | In Labor Force | Unemployed |
| 16 to 19 Years | 407 (37.5%) | 34 (8.4%) |
| 20 to 24 Years | 853 (70.8%) | 37 (4.3%) |
| 25 to 29 Years | 1,218 (82.6%) | 0 (0.0%) |
| 30 to 34 Years | 2,010 (88.1%) | 24 (1.2%) |
| 35 to 44 Years | 3,868 (85.6%) | 70 (1.8%) |
| 45 to 54 Years | 3,550 (85.9%) | 75 (2.1%) |
| 55 to 59 Years | 1,911 (86.2%) | 0 (0.0%) |
| 60 to 64 Years | 978 (63.8%) | 0 (0.0%) |
| 65 to 74 Years | 684 (31.3%) | 45 (6.6%) |
| 75 Years and over | 8 (0.6%) | 0 (0.0%) |
| Total | 15,492 (70.7%) | 279 (1.8%) |
Employment Status by Educational Attainment in Short Pump
According to labor force statistics for Short Pump, 83.8% of individuals (13,540) out of the total population between 25 and 64 years of age (16,158) are in the labor force, with 1.2% or 162 of them being unemployed. The group with the highest labor force participation rate are those with the educational attainment of college / associate degree, with 87.0% or 2,288 individuals in the labor force. Within the labor force, individuals with less than high school education have the highest percentage of unemployment, with 15.4% or 8 of them being unemployed.
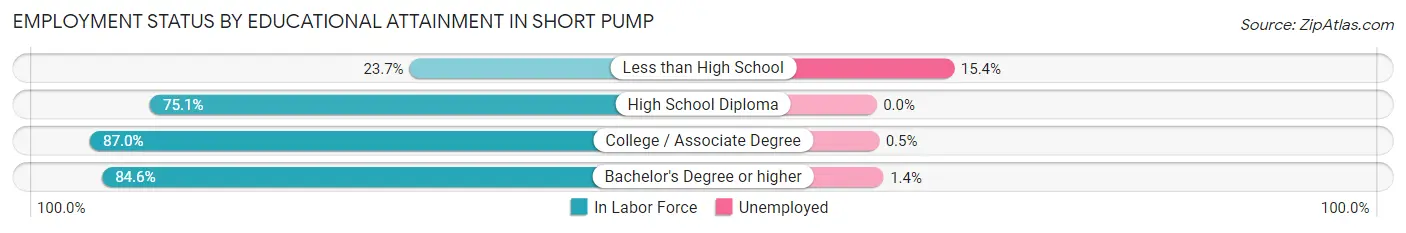
| Educational Attainment | In Labor Force | Unemployed |
| Less than High School | 52 (23.7%) | 34 (15.4%) |
| High School Diploma | 486 (75.1%) | 0 (0.0%) |
| College / Associate Degree | 2,288 (87.0%) | 13 (0.5%) |
| Bachelor's Degree or higher | 10,712 (84.6%) | 177 (1.4%) |
| Total | 13,540 (83.8%) | 194 (1.2%) |
Employment Occupations by Sex in Short Pump
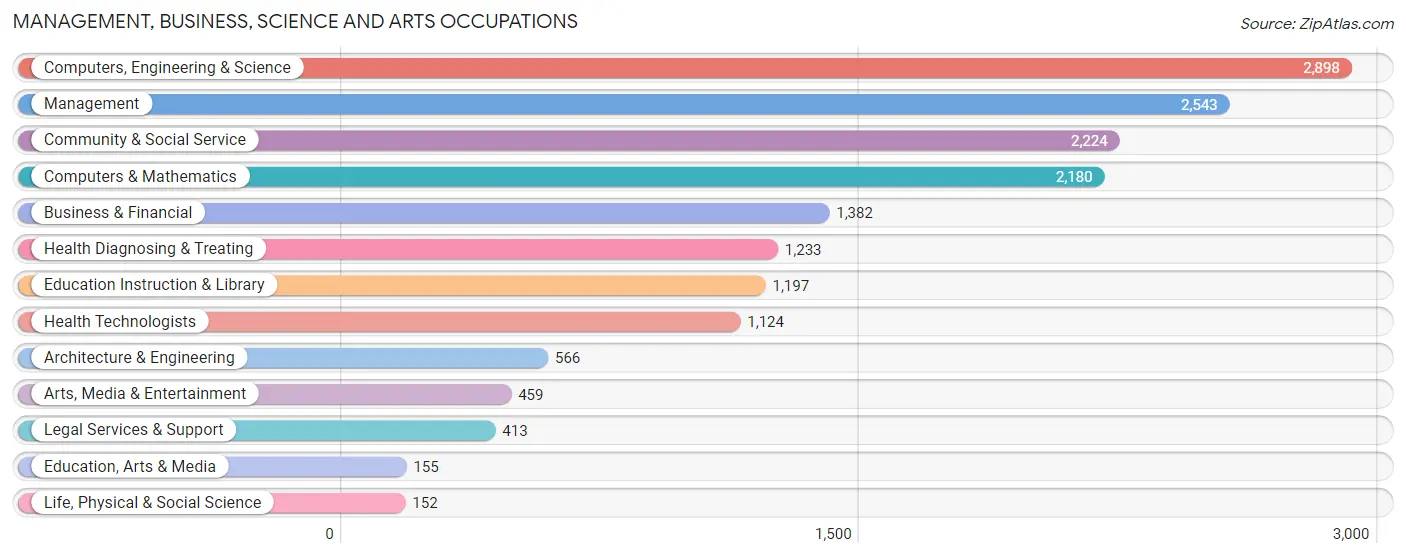
Management, Business, Science and Arts Occupations
The most common Management, Business, Science and Arts occupations in Short Pump are Computers, Engineering & Science (2,898 | 19.2%), Management (2,543 | 16.8%), Community & Social Service (2,224 | 14.7%), Computers & Mathematics (2,180 | 14.4%), and Business & Financial (1,382 | 9.1%).
Management, Business, Science and Arts Occupations by Sex
Within the Management, Business, Science and Arts occupations in Short Pump, the most male-oriented occupations are Architecture & Engineering (86.6%), Computers, Engineering & Science (72.2%), and Computers & Mathematics (69.6%), while the most female-oriented occupations are Education, Arts & Media (91.6%), Education Instruction & Library (71.7%), and Community & Social Service (63.6%).
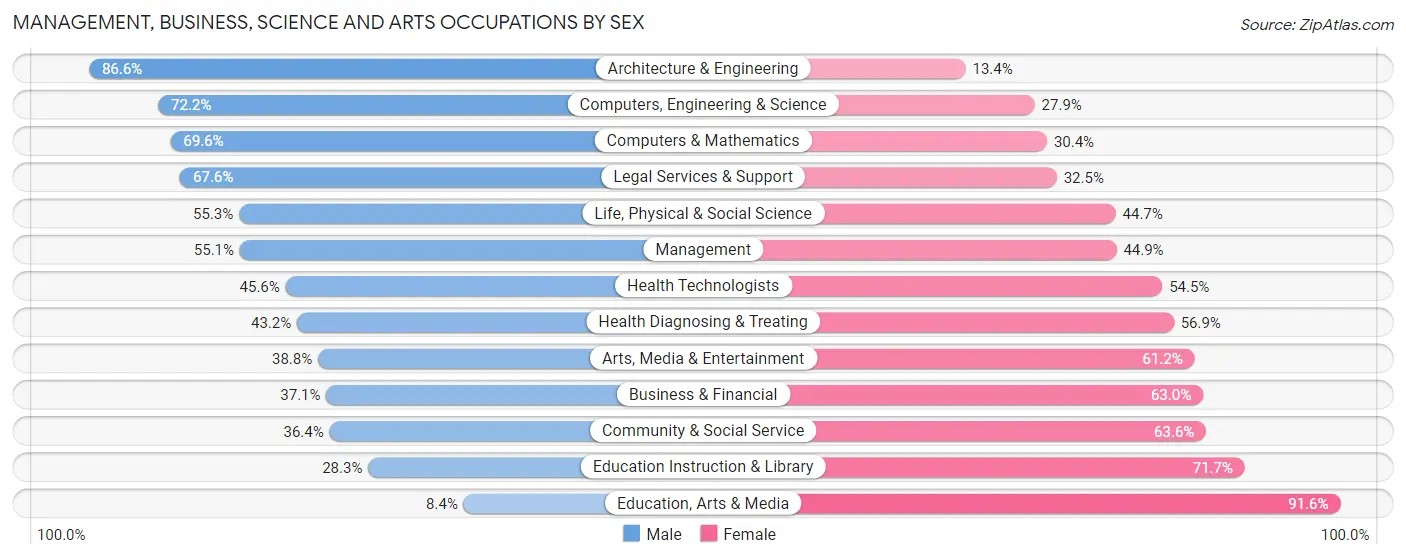
| Occupation | Male | Female |
| Management | 1,401 (55.1%) | 1,142 (44.9%) |
| Business & Financial | 512 (37.0%) | 870 (62.9%) |
| Computers, Engineering & Science | 2,091 (72.2%) | 807 (27.9%) |
| Computers & Mathematics | 1,517 (69.6%) | 663 (30.4%) |
| Architecture & Engineering | 490 (86.6%) | 76 (13.4%) |
| Life, Physical & Social Science | 84 (55.3%) | 68 (44.7%) |
| Community & Social Service | 809 (36.4%) | 1,415 (63.6%) |
| Education, Arts & Media | 13 (8.4%) | 142 (91.6%) |
| Legal Services & Support | 279 (67.5%) | 134 (32.5%) |
| Education Instruction & Library | 339 (28.3%) | 858 (71.7%) |
| Arts, Media & Entertainment | 178 (38.8%) | 281 (61.2%) |
| Health Diagnosing & Treating | 532 (43.1%) | 701 (56.9%) |
| Health Technologists | 512 (45.6%) | 612 (54.4%) |
| Total (Category) | 5,345 (52.0%) | 4,935 (48.0%) |
| Total (Overall) | 8,185 (54.1%) | 6,946 (45.9%) |
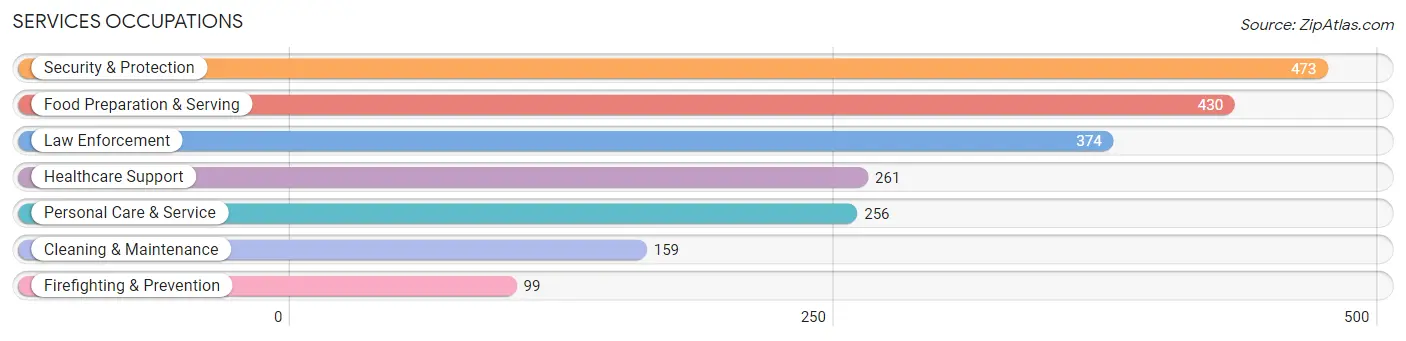
Services Occupations
The most common Services occupations in Short Pump are Security & Protection (473 | 3.1%), Food Preparation & Serving (430 | 2.8%), Law Enforcement (374 | 2.5%), Healthcare Support (261 | 1.7%), and Personal Care & Service (256 | 1.7%).
Services Occupations by Sex
Within the Services occupations in Short Pump, the most male-oriented occupations are Firefighting & Prevention (100.0%), Cleaning & Maintenance (90.6%), and Security & Protection (52.0%), while the most female-oriented occupations are Healthcare Support (82.8%), Personal Care & Service (77.7%), and Law Enforcement (60.7%).
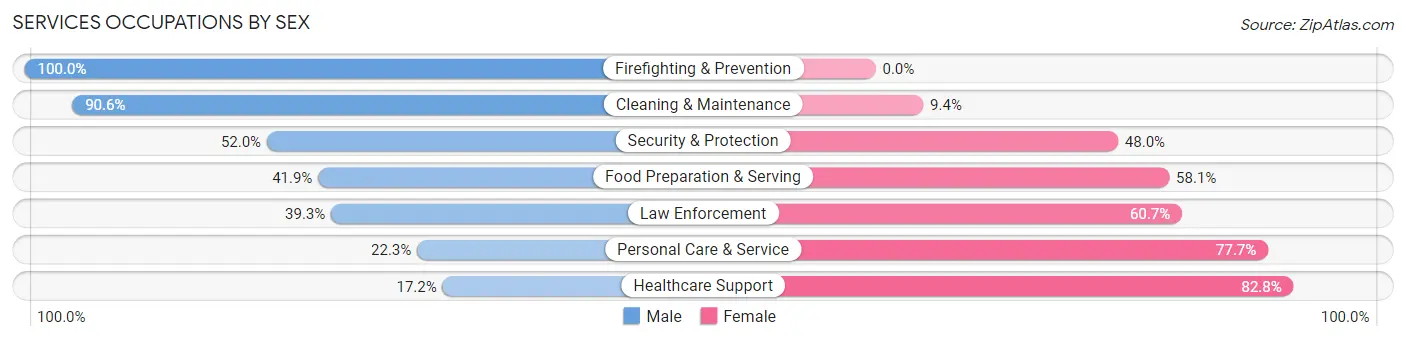
| Occupation | Male | Female |
| Healthcare Support | 45 (17.2%) | 216 (82.8%) |
| Security & Protection | 246 (52.0%) | 227 (48.0%) |
| Firefighting & Prevention | 99 (100.0%) | 0 (0.0%) |
| Law Enforcement | 147 (39.3%) | 227 (60.7%) |
| Food Preparation & Serving | 180 (41.9%) | 250 (58.1%) |
| Cleaning & Maintenance | 144 (90.6%) | 15 (9.4%) |
| Personal Care & Service | 57 (22.3%) | 199 (77.7%) |
| Total (Category) | 672 (42.6%) | 907 (57.4%) |
| Total (Overall) | 8,185 (54.1%) | 6,946 (45.9%) |
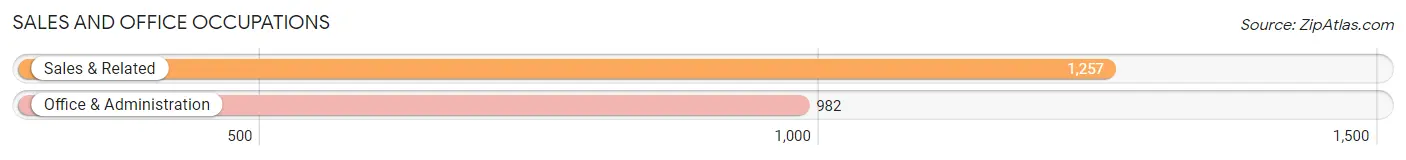
Sales and Office Occupations
The most common Sales and Office occupations in Short Pump are Sales & Related (1,257 | 8.3%), and Office & Administration (982 | 6.5%).
Sales and Office Occupations by Sex
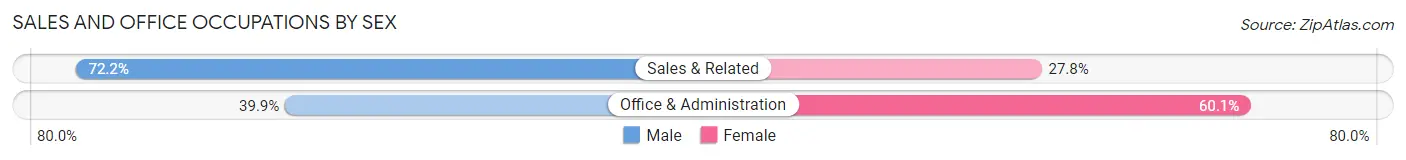
| Occupation | Male | Female |
| Sales & Related | 907 (72.2%) | 350 (27.8%) |
| Office & Administration | 392 (39.9%) | 590 (60.1%) |
| Total (Category) | 1,299 (58.0%) | 940 (42.0%) |
| Total (Overall) | 8,185 (54.1%) | 6,946 (45.9%) |
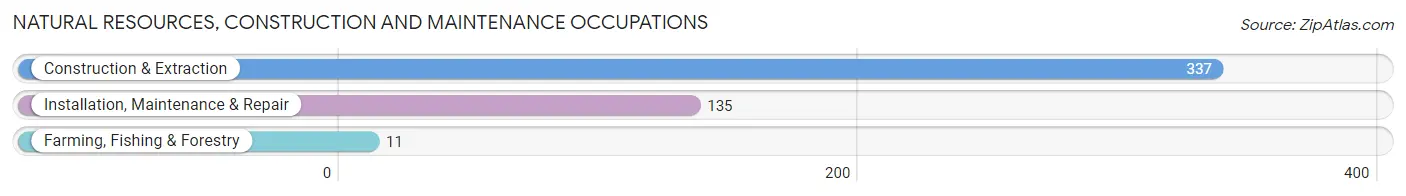
Natural Resources, Construction and Maintenance Occupations
The most common Natural Resources, Construction and Maintenance occupations in Short Pump are Construction & Extraction (337 | 2.2%), Installation, Maintenance & Repair (135 | 0.9%), and Farming, Fishing & Forestry (11 | 0.1%).
Natural Resources, Construction and Maintenance Occupations by Sex
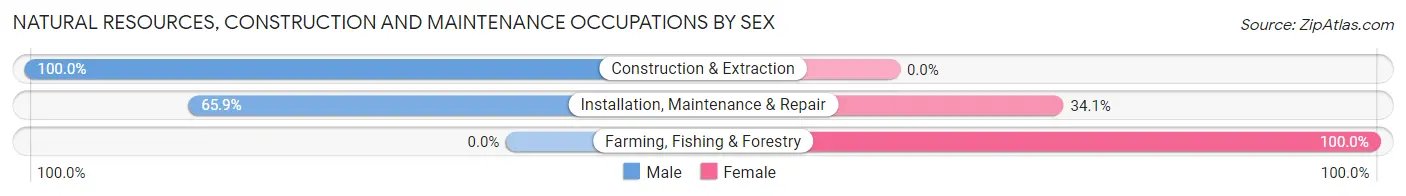
| Occupation | Male | Female |
| Farming, Fishing & Forestry | 0 (0.0%) | 11 (100.0%) |
| Construction & Extraction | 337 (100.0%) | 0 (0.0%) |
| Installation, Maintenance & Repair | 89 (65.9%) | 46 (34.1%) |
| Total (Category) | 426 (88.2%) | 57 (11.8%) |
| Total (Overall) | 8,185 (54.1%) | 6,946 (45.9%) |
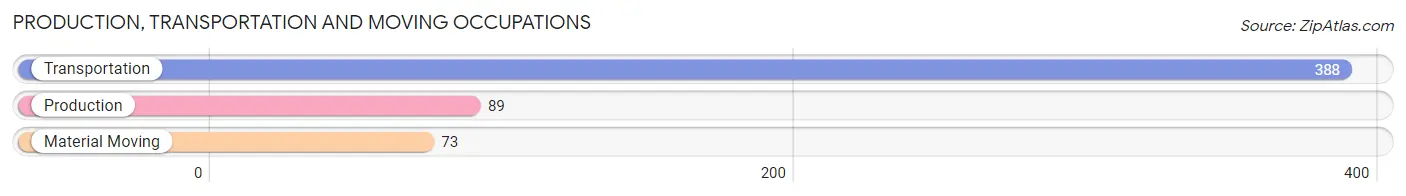
Production, Transportation and Moving Occupations
The most common Production, Transportation and Moving occupations in Short Pump are Transportation (388 | 2.6%), Production (89 | 0.6%), and Material Moving (73 | 0.5%).
Production, Transportation and Moving Occupations by Sex
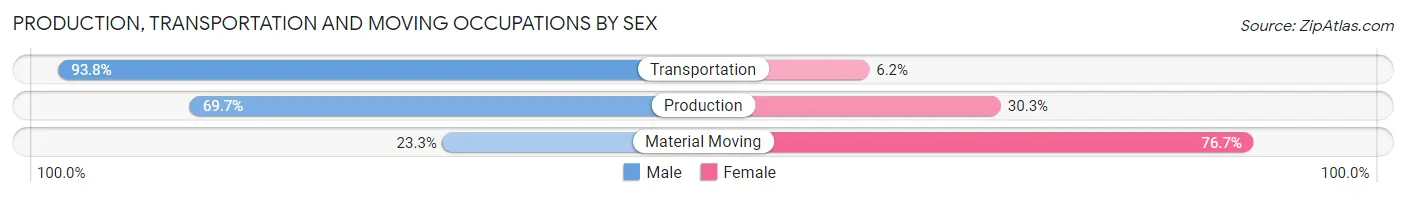
| Occupation | Male | Female |
| Production | 62 (69.7%) | 27 (30.3%) |
| Transportation | 364 (93.8%) | 24 (6.2%) |
| Material Moving | 17 (23.3%) | 56 (76.7%) |
| Total (Category) | 443 (80.5%) | 107 (19.5%) |
| Total (Overall) | 8,185 (54.1%) | 6,946 (45.9%) |
Employment Industries by Sex in Short Pump
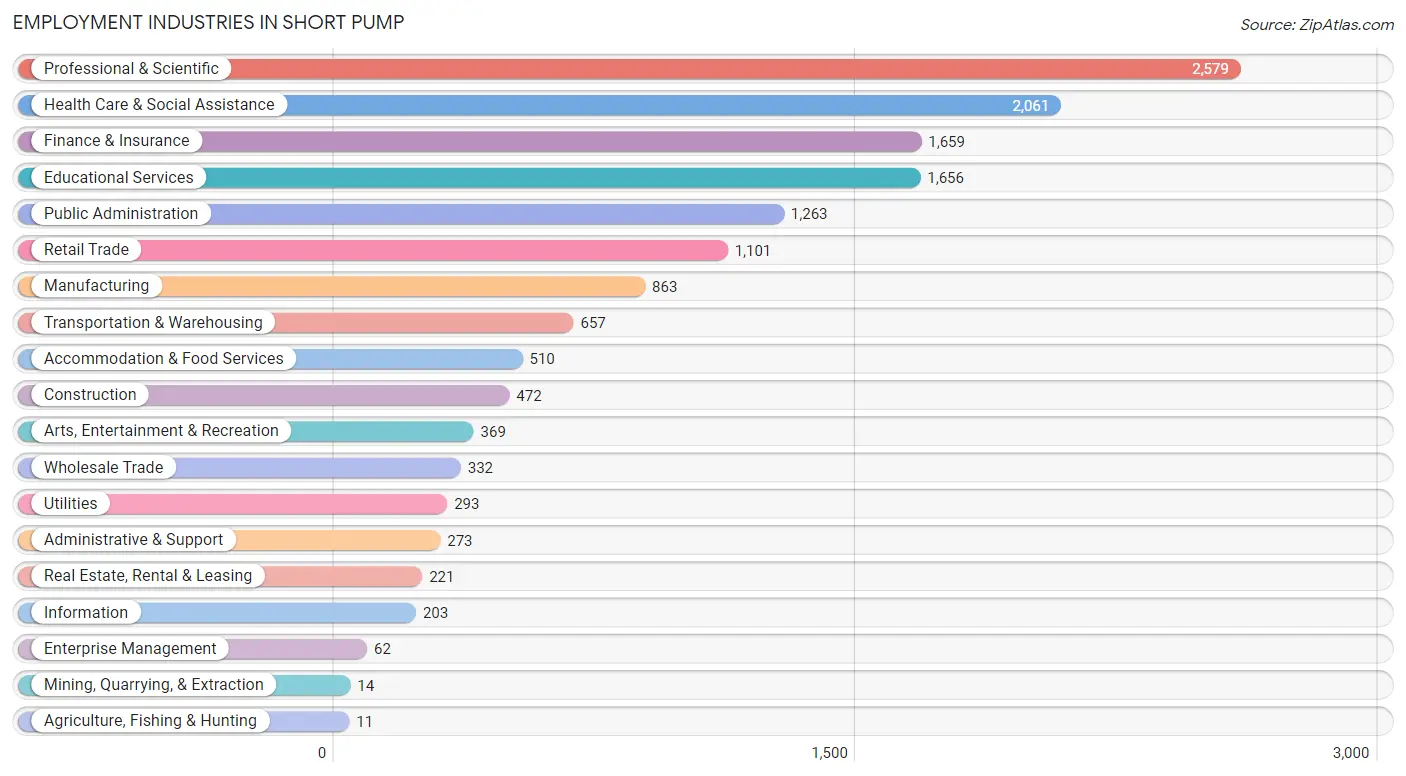
Employment Industries in Short Pump
The major employment industries in Short Pump include Professional & Scientific (2,579 | 17.0%), Health Care & Social Assistance (2,061 | 13.6%), Finance & Insurance (1,659 | 11.0%), Educational Services (1,656 | 10.9%), and Public Administration (1,263 | 8.4%).
Employment Industries by Sex in Short Pump
The Short Pump industries that see more men than women are Mining, Quarrying, & Extraction (100.0%), Construction (82.2%), and Transportation & Warehousing (77.3%), whereas the industries that tend to have a higher number of women are Agriculture, Fishing & Hunting (100.0%), Real Estate, Rental & Leasing (79.6%), and Health Care & Social Assistance (71.4%).
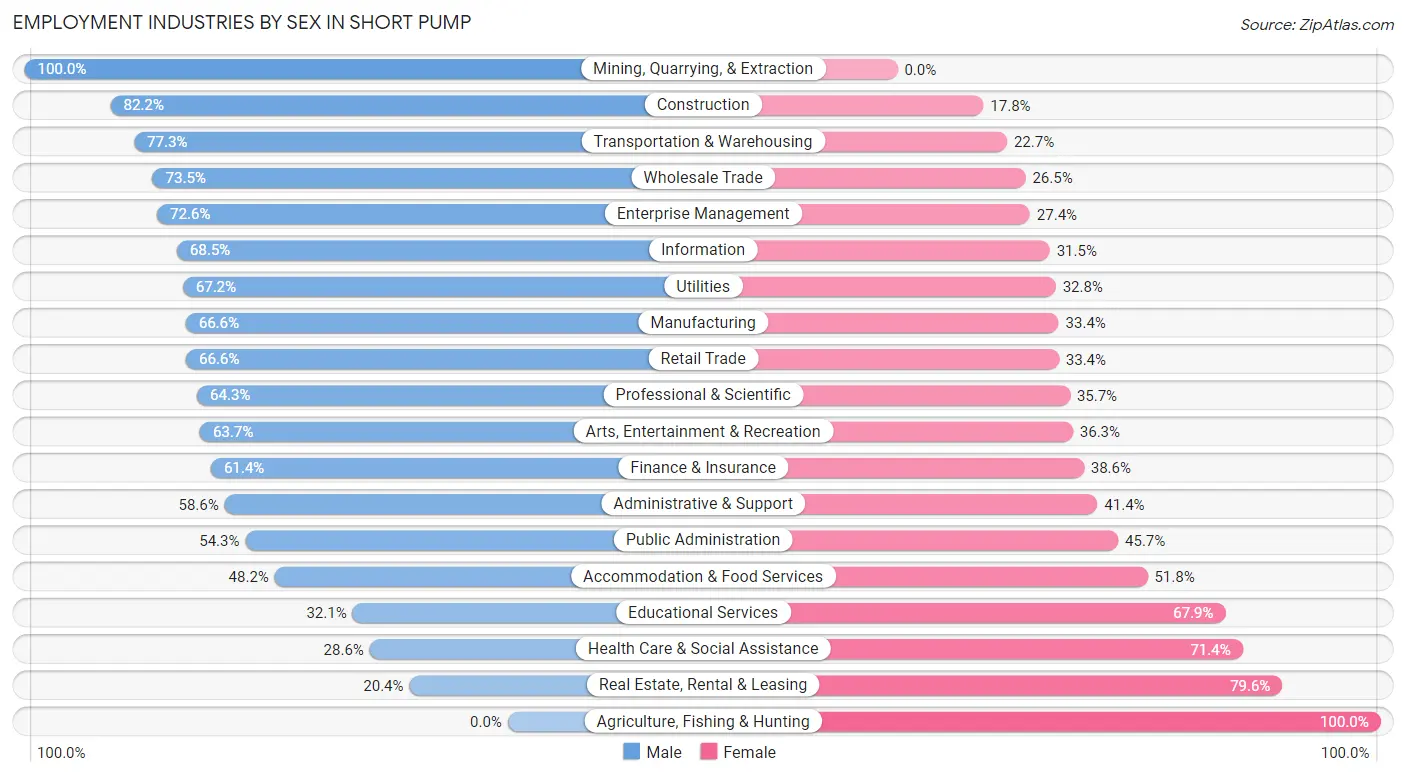
| Industry | Male | Female |
| Agriculture, Fishing & Hunting | 0 (0.0%) | 11 (100.0%) |
| Mining, Quarrying, & Extraction | 14 (100.0%) | 0 (0.0%) |
| Construction | 388 (82.2%) | 84 (17.8%) |
| Manufacturing | 575 (66.6%) | 288 (33.4%) |
| Wholesale Trade | 244 (73.5%) | 88 (26.5%) |
| Retail Trade | 733 (66.6%) | 368 (33.4%) |
| Transportation & Warehousing | 508 (77.3%) | 149 (22.7%) |
| Utilities | 197 (67.2%) | 96 (32.8%) |
| Information | 139 (68.5%) | 64 (31.5%) |
| Finance & Insurance | 1,019 (61.4%) | 640 (38.6%) |
| Real Estate, Rental & Leasing | 45 (20.4%) | 176 (79.6%) |
| Professional & Scientific | 1,658 (64.3%) | 921 (35.7%) |
| Enterprise Management | 45 (72.6%) | 17 (27.4%) |
| Administrative & Support | 160 (58.6%) | 113 (41.4%) |
| Educational Services | 532 (32.1%) | 1,124 (67.9%) |
| Health Care & Social Assistance | 589 (28.6%) | 1,472 (71.4%) |
| Arts, Entertainment & Recreation | 235 (63.7%) | 134 (36.3%) |
| Accommodation & Food Services | 246 (48.2%) | 264 (51.8%) |
| Public Administration | 686 (54.3%) | 577 (45.7%) |
| Total | 8,185 (54.1%) | 6,946 (45.9%) |
Education in Short Pump
School Enrollment in Short Pump
The most common levels of schooling among the 7,578 students in Short Pump are middle school (1,747 | 23.1%), elementary school (1,621 | 21.4%), and high school (1,524 | 20.1%).
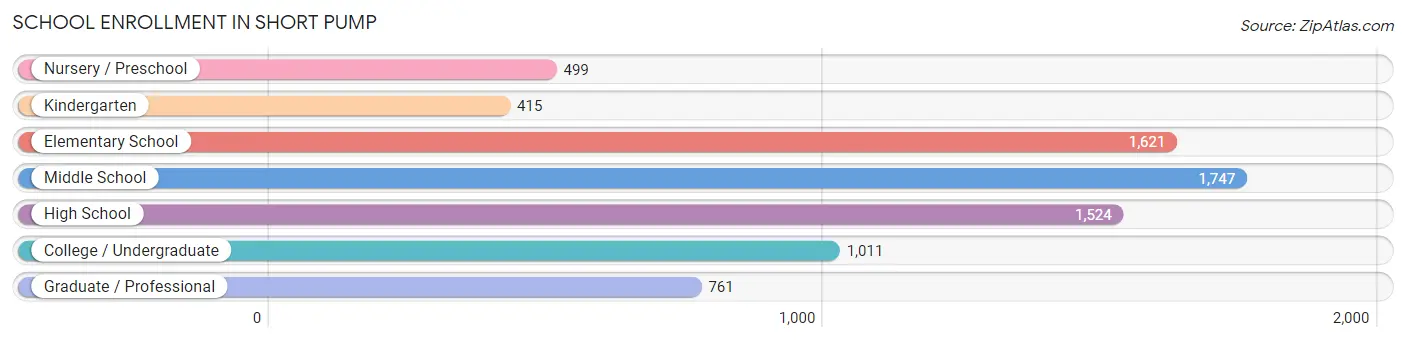
| School Level | # Students | % Students |
| Nursery / Preschool | 499 | 6.6% |
| Kindergarten | 415 | 5.5% |
| Elementary School | 1,621 | 21.4% |
| Middle School | 1,747 | 23.1% |
| High School | 1,524 | 20.1% |
| College / Undergraduate | 1,011 | 13.3% |
| Graduate / Professional | 761 | 10.0% |
| Total | 7,578 | 100.0% |
School Enrollment by Age by Funding Source in Short Pump
Out of a total of 7,578 students who are enrolled in schools in Short Pump, 1,387 (18.3%) attend a private institution, while the remaining 6,191 (81.7%) are enrolled in public schools. The age group of 3 to 4 year olds has the highest likelihood of being enrolled in private schools, with 323 (85.7% in the age bracket) enrolled. Conversely, the age group of 15 to 17 year olds has the lowest likelihood of being enrolled in a private school, with 1,212 (98.2% in the age bracket) attending a public institution.
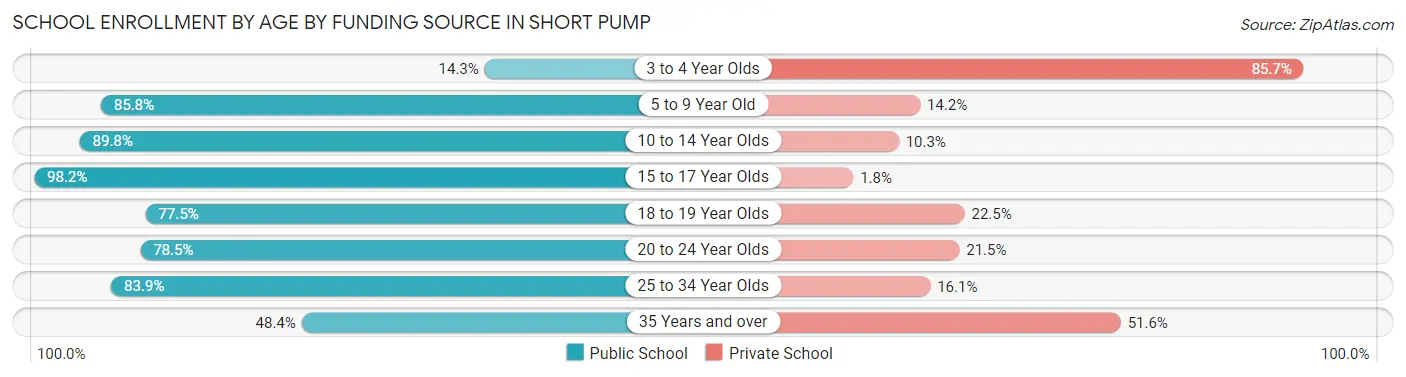
| Age Bracket | Public School | Private School |
| 3 to 4 Year Olds | 54 (14.3%) | 323 (85.7%) |
| 5 to 9 Year Old | 1,703 (85.8%) | 282 (14.2%) |
| 10 to 14 Year Olds | 1,891 (89.7%) | 216 (10.2%) |
| 15 to 17 Year Olds | 1,212 (98.2%) | 22 (1.8%) |
| 18 to 19 Year Olds | 272 (77.5%) | 79 (22.5%) |
| 20 to 24 Year Olds | 419 (78.5%) | 115 (21.5%) |
| 25 to 34 Year Olds | 385 (83.9%) | 74 (16.1%) |
| 35 Years and over | 257 (48.4%) | 274 (51.6%) |
| Total | 6,191 (81.7%) | 1,387 (18.3%) |
Educational Attainment by Field of Study in Short Pump
Business (3,049 | 19.0%), engineering (2,223 | 13.9%), computers & mathematics (1,433 | 8.9%), social sciences (1,279 | 8.0%), and science & technology (1,209 | 7.5%) are the most common fields of study among 16,028 individuals in Short Pump who have obtained a bachelor's degree or higher.
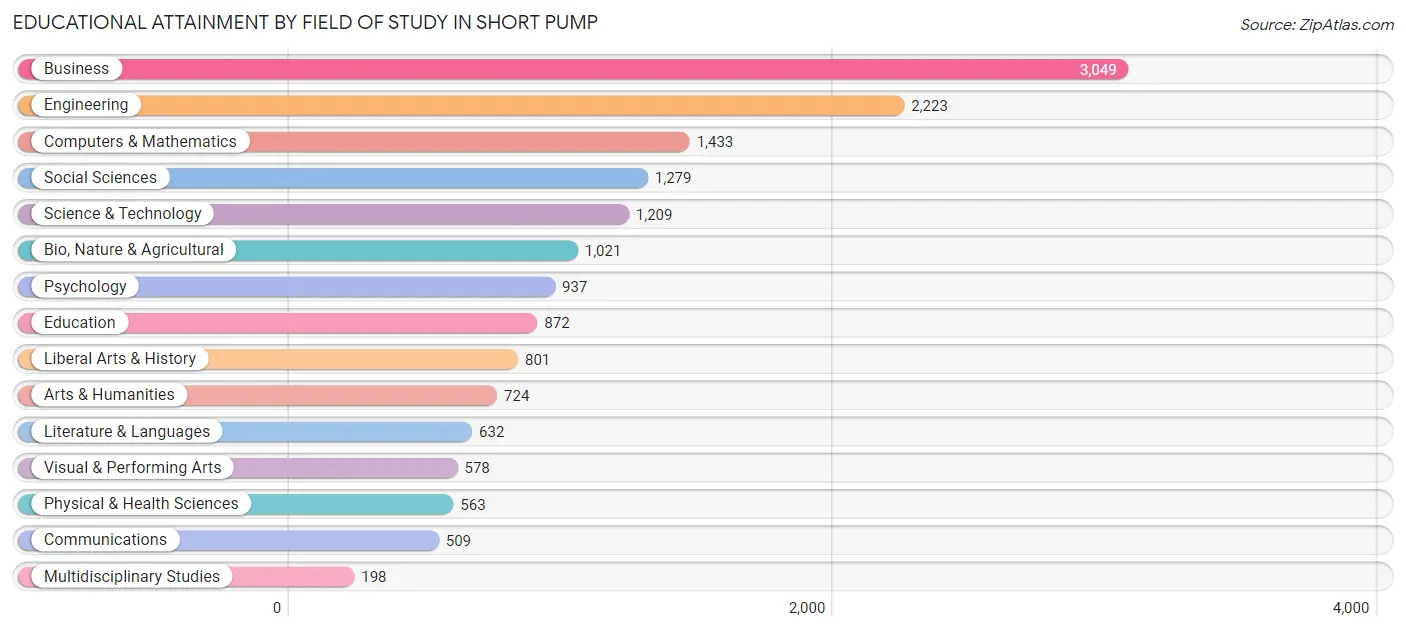
| Field of Study | # Graduates | % Graduates |
| Computers & Mathematics | 1,433 | 8.9% |
| Bio, Nature & Agricultural | 1,021 | 6.4% |
| Physical & Health Sciences | 563 | 3.5% |
| Psychology | 937 | 5.9% |
| Social Sciences | 1,279 | 8.0% |
| Engineering | 2,223 | 13.9% |
| Multidisciplinary Studies | 198 | 1.2% |
| Science & Technology | 1,209 | 7.5% |
| Business | 3,049 | 19.0% |
| Education | 872 | 5.4% |
| Literature & Languages | 632 | 3.9% |
| Liberal Arts & History | 801 | 5.0% |
| Visual & Performing Arts | 578 | 3.6% |
| Communications | 509 | 3.2% |
| Arts & Humanities | 724 | 4.5% |
| Total | 16,028 | 100.0% |
Transportation & Commute in Short Pump
Vehicle Availability by Sex in Short Pump
The most prevalent vehicle ownership categories in Short Pump are males with 2 vehicles (4,203, accounting for 51.5%) and females with 2 vehicles (3,229, making up 64.7%).
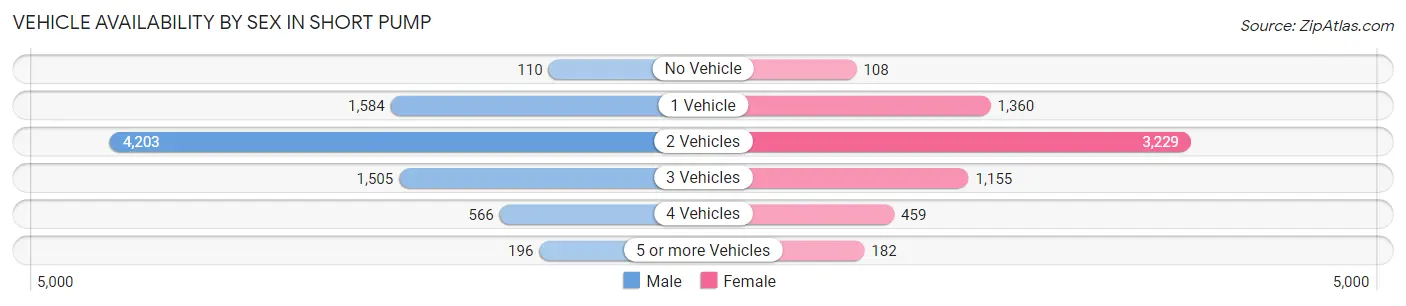
| Vehicles Available | Male | Female |
| No Vehicle | 110 (1.3%) | 108 (1.7%) |
| 1 Vehicle | 1,584 (19.4%) | 1,360 (20.9%) |
| 2 Vehicles | 4,203 (51.5%) | 3,229 (49.7%) |
| 3 Vehicles | 1,505 (18.4%) | 1,155 (17.8%) |
| 4 Vehicles | 566 (6.9%) | 459 (7.1%) |
| 5 or more Vehicles | 196 (2.4%) | 182 (2.8%) |
| Total | 8,164 (100.0%) | 6,493 (100.0%) |
Commute Time in Short Pump
The most frequently occuring commute durations in Short Pump are 15 to 19 minutes (2,249 commuters, 20.0%), 20 to 24 minutes (2,215 commuters, 19.7%), and 30 to 34 minutes (1,658 commuters, 14.7%).
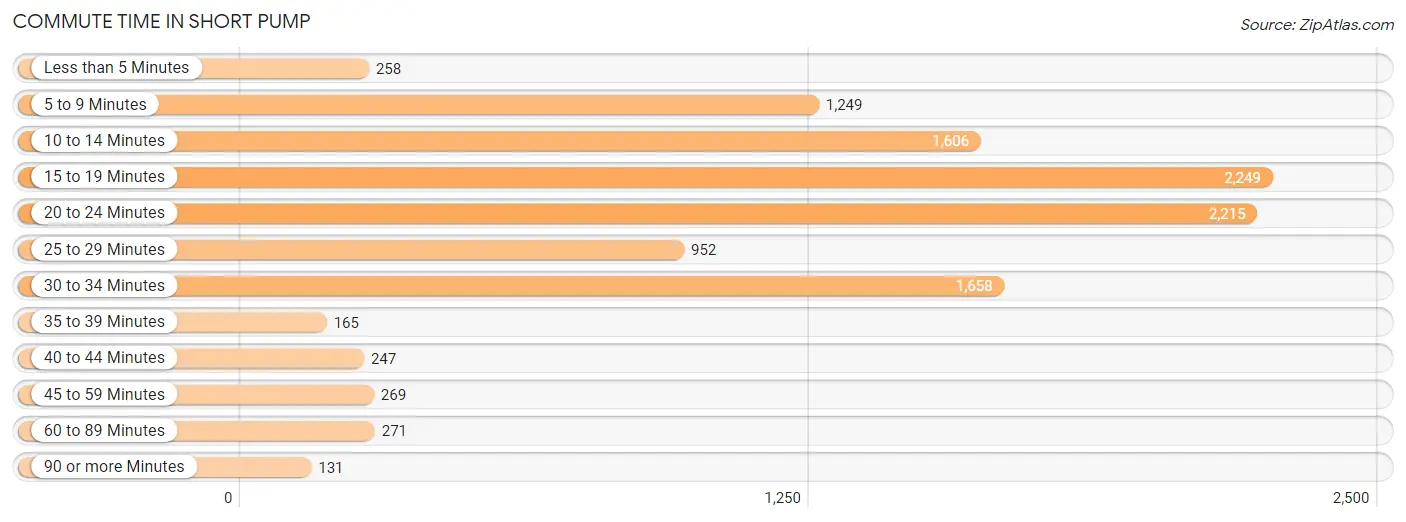
| Commute Time | # Commuters | % Commuters |
| Less than 5 Minutes | 258 | 2.3% |
| 5 to 9 Minutes | 1,249 | 11.1% |
| 10 to 14 Minutes | 1,606 | 14.2% |
| 15 to 19 Minutes | 2,249 | 20.0% |
| 20 to 24 Minutes | 2,215 | 19.7% |
| 25 to 29 Minutes | 952 | 8.5% |
| 30 to 34 Minutes | 1,658 | 14.7% |
| 35 to 39 Minutes | 165 | 1.5% |
| 40 to 44 Minutes | 247 | 2.2% |
| 45 to 59 Minutes | 269 | 2.4% |
| 60 to 89 Minutes | 271 | 2.4% |
| 90 or more Minutes | 131 | 1.2% |
Commute Time by Sex in Short Pump
The most common commute times in Short Pump are 20 to 24 minutes (1,373 commuters, 22.2%) for males and 15 to 19 minutes (952 commuters, 18.7%) for females.
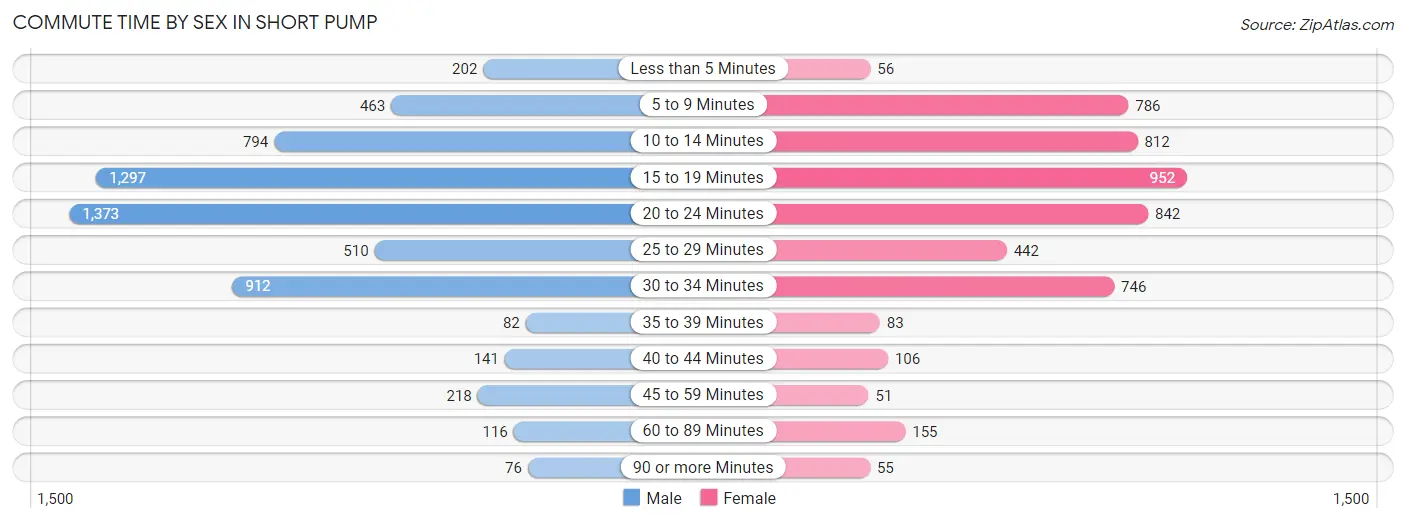
| Commute Time | Male | Female |
| Less than 5 Minutes | 202 (3.3%) | 56 (1.1%) |
| 5 to 9 Minutes | 463 (7.5%) | 786 (15.4%) |
| 10 to 14 Minutes | 794 (12.8%) | 812 (16.0%) |
| 15 to 19 Minutes | 1,297 (21.0%) | 952 (18.7%) |
| 20 to 24 Minutes | 1,373 (22.2%) | 842 (16.6%) |
| 25 to 29 Minutes | 510 (8.3%) | 442 (8.7%) |
| 30 to 34 Minutes | 912 (14.7%) | 746 (14.7%) |
| 35 to 39 Minutes | 82 (1.3%) | 83 (1.6%) |
| 40 to 44 Minutes | 141 (2.3%) | 106 (2.1%) |
| 45 to 59 Minutes | 218 (3.5%) | 51 (1.0%) |
| 60 to 89 Minutes | 116 (1.9%) | 155 (3.0%) |
| 90 or more Minutes | 76 (1.2%) | 55 (1.1%) |
Time of Departure to Work by Sex in Short Pump
The most frequent times of departure to work in Short Pump are 8:30 AM to 8:59 AM (1,056, 17.1%) for males and 7:30 AM to 7:59 AM (971, 19.1%) for females.
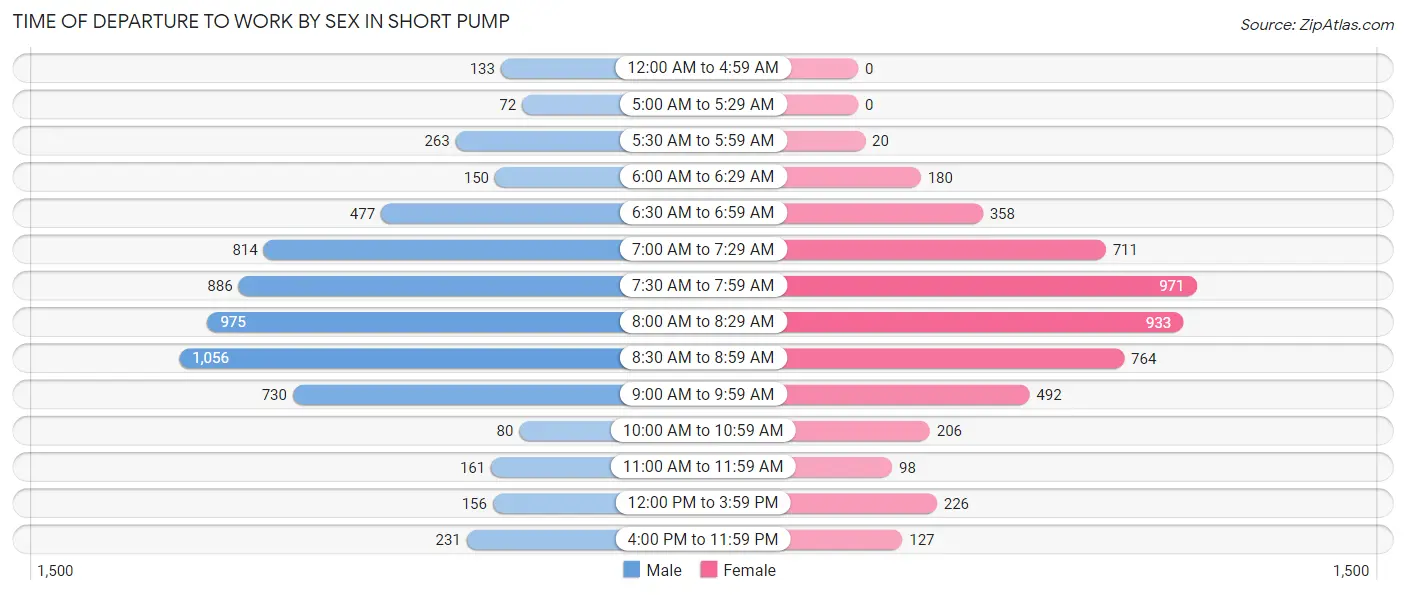
| Time of Departure | Male | Female |
| 12:00 AM to 4:59 AM | 133 (2.1%) | 0 (0.0%) |
| 5:00 AM to 5:29 AM | 72 (1.2%) | 0 (0.0%) |
| 5:30 AM to 5:59 AM | 263 (4.3%) | 20 (0.4%) |
| 6:00 AM to 6:29 AM | 150 (2.4%) | 180 (3.5%) |
| 6:30 AM to 6:59 AM | 477 (7.7%) | 358 (7.0%) |
| 7:00 AM to 7:29 AM | 814 (13.2%) | 711 (14.0%) |
| 7:30 AM to 7:59 AM | 886 (14.3%) | 971 (19.1%) |
| 8:00 AM to 8:29 AM | 975 (15.8%) | 933 (18.3%) |
| 8:30 AM to 8:59 AM | 1,056 (17.1%) | 764 (15.0%) |
| 9:00 AM to 9:59 AM | 730 (11.8%) | 492 (9.7%) |
| 10:00 AM to 10:59 AM | 80 (1.3%) | 206 (4.1%) |
| 11:00 AM to 11:59 AM | 161 (2.6%) | 98 (1.9%) |
| 12:00 PM to 3:59 PM | 156 (2.5%) | 226 (4.4%) |
| 4:00 PM to 11:59 PM | 231 (3.7%) | 127 (2.5%) |
| Total | 6,184 (100.0%) | 5,086 (100.0%) |
Housing Occupancy in Short Pump
Occupancy by Ownership in Short Pump
Of the total 11,161 dwellings in Short Pump, owner-occupied units account for 6,552 (58.7%), while renter-occupied units make up 4,609 (41.3%).
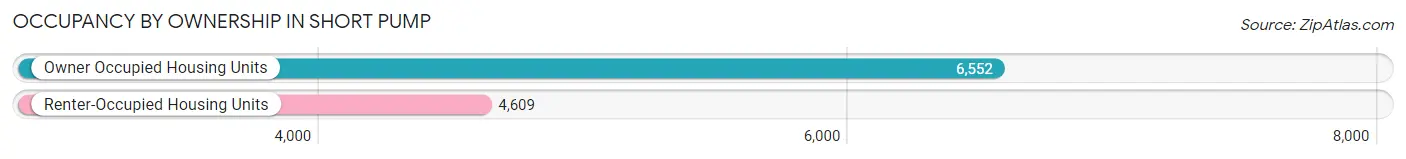
| Occupancy | # Housing Units | % Housing Units |
| Owner Occupied Housing Units | 6,552 | 58.7% |
| Renter-Occupied Housing Units | 4,609 | 41.3% |
| Total Occupied Housing Units | 11,161 | 100.0% |
Occupancy by Household Size in Short Pump
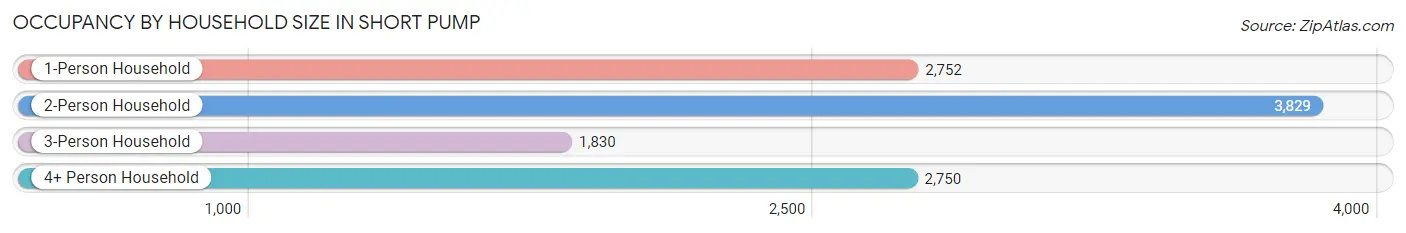
| Household Size | # Housing Units | % Housing Units |
| 1-Person Household | 2,752 | 24.7% |
| 2-Person Household | 3,829 | 34.3% |
| 3-Person Household | 1,830 | 16.4% |
| 4+ Person Household | 2,750 | 24.6% |
| Total Housing Units | 11,161 | 100.0% |
Occupancy by Ownership by Household Size in Short Pump
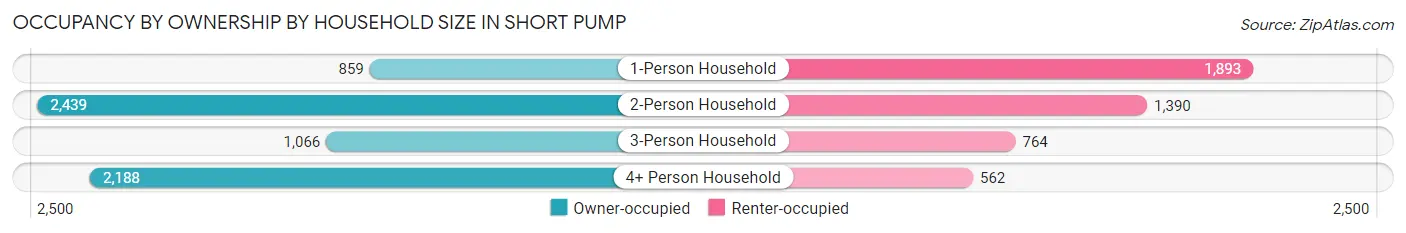
| Household Size | Owner-occupied | Renter-occupied |
| 1-Person Household | 859 (31.2%) | 1,893 (68.8%) |
| 2-Person Household | 2,439 (63.7%) | 1,390 (36.3%) |
| 3-Person Household | 1,066 (58.3%) | 764 (41.7%) |
| 4+ Person Household | 2,188 (79.6%) | 562 (20.4%) |
| Total Housing Units | 6,552 (58.7%) | 4,609 (41.3%) |
Occupancy by Educational Attainment in Short Pump
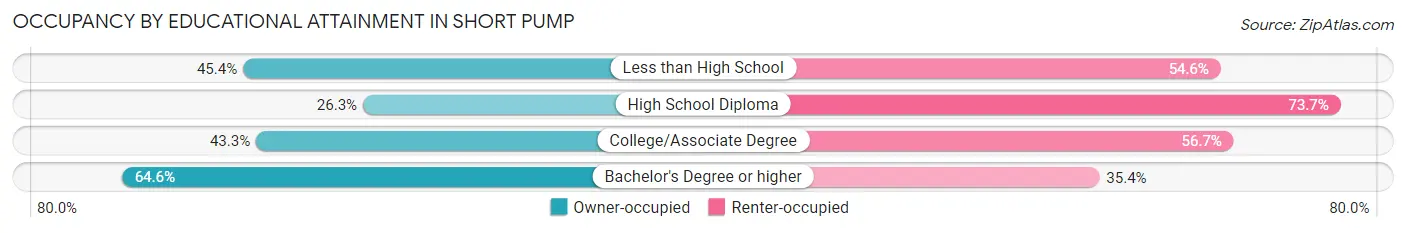
| Household Size | Owner-occupied | Renter-occupied |
| Less than High School | 88 (45.4%) | 106 (54.6%) |
| High School Diploma | 187 (26.3%) | 523 (73.7%) |
| College/Associate Degree | 708 (43.3%) | 927 (56.7%) |
| Bachelor's Degree or higher | 5,569 (64.6%) | 3,053 (35.4%) |
Occupancy by Age of Householder in Short Pump
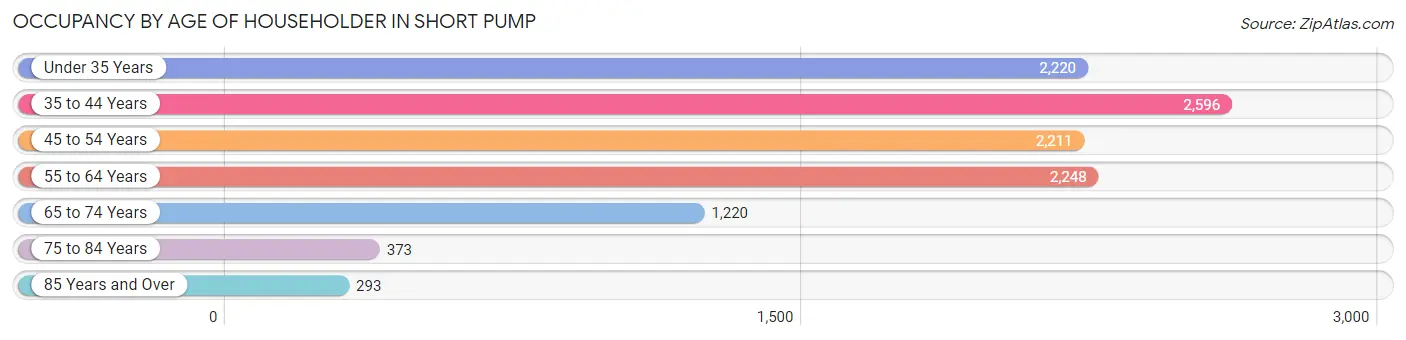
| Age Bracket | # Households | % Households |
| Under 35 Years | 2,220 | 19.9% |
| 35 to 44 Years | 2,596 | 23.3% |
| 45 to 54 Years | 2,211 | 19.8% |
| 55 to 64 Years | 2,248 | 20.1% |
| 65 to 74 Years | 1,220 | 10.9% |
| 75 to 84 Years | 373 | 3.3% |
| 85 Years and Over | 293 | 2.6% |
| Total | 11,161 | 100.0% |
Housing Finances in Short Pump
Median Income by Occupancy in Short Pump
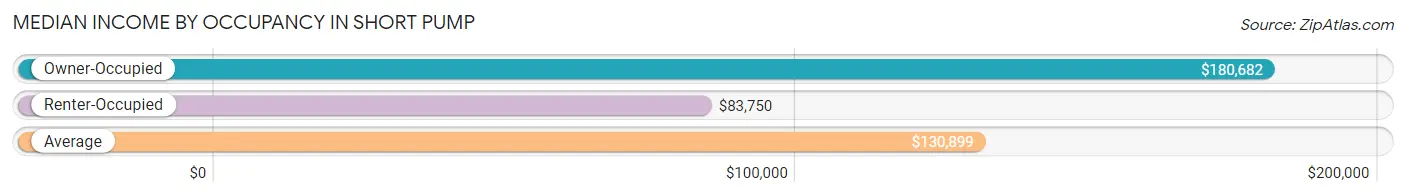
| Occupancy Type | # Households | Median Income |
| Owner-Occupied | 6,552 (58.7%) | $180,682 |
| Renter-Occupied | 4,609 (41.3%) | $83,750 |
| Average | 11,161 (100.0%) | $130,899 |
Occupancy by Householder Income Bracket in Short Pump
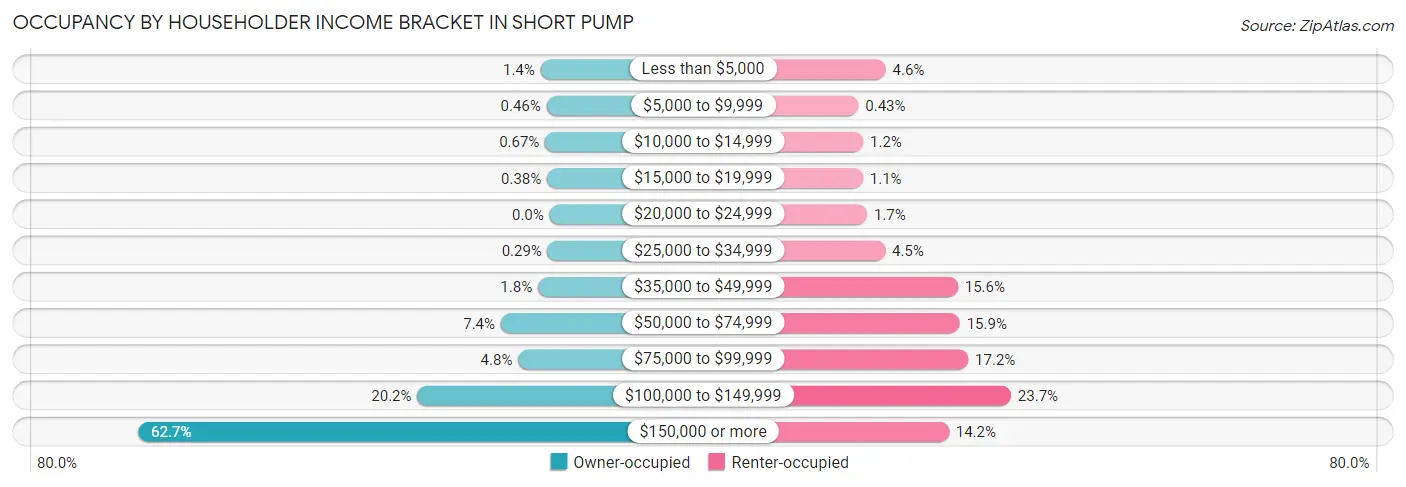
| Income Bracket | Owner-occupied | Renter-occupied |
| Less than $5,000 | 90 (1.4%) | 211 (4.6%) |
| $5,000 to $9,999 | 30 (0.5%) | 20 (0.4%) |
| $10,000 to $14,999 | 44 (0.7%) | 53 (1.1%) |
| $15,000 to $19,999 | 25 (0.4%) | 51 (1.1%) |
| $20,000 to $24,999 | 0 (0.0%) | 80 (1.7%) |
| $25,000 to $34,999 | 19 (0.3%) | 207 (4.5%) |
| $35,000 to $49,999 | 116 (1.8%) | 718 (15.6%) |
| $50,000 to $74,999 | 487 (7.4%) | 732 (15.9%) |
| $75,000 to $99,999 | 313 (4.8%) | 791 (17.2%) |
| $100,000 to $149,999 | 1,320 (20.2%) | 1,091 (23.7%) |
| $150,000 or more | 4,108 (62.7%) | 655 (14.2%) |
| Total | 6,552 (100.0%) | 4,609 (100.0%) |
Monthly Housing Cost Tiers in Short Pump
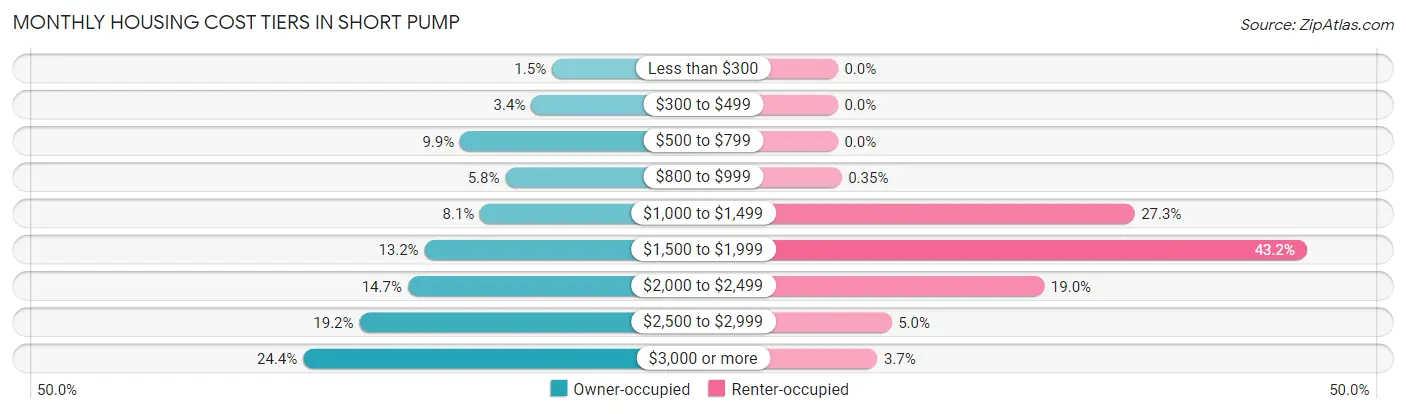
| Monthly Cost | Owner-occupied | Renter-occupied |
| Less than $300 | 95 (1.5%) | 0 (0.0%) |
| $300 to $499 | 220 (3.4%) | 0 (0.0%) |
| $500 to $799 | 649 (9.9%) | 0 (0.0%) |
| $800 to $999 | 377 (5.8%) | 16 (0.4%) |
| $1,000 to $1,499 | 528 (8.1%) | 1,259 (27.3%) |
| $1,500 to $1,999 | 864 (13.2%) | 1,991 (43.2%) |
| $2,000 to $2,499 | 965 (14.7%) | 876 (19.0%) |
| $2,500 to $2,999 | 1,257 (19.2%) | 228 (5.0%) |
| $3,000 or more | 1,597 (24.4%) | 168 (3.6%) |
| Total | 6,552 (100.0%) | 4,609 (100.0%) |
Physical Housing Characteristics in Short Pump
Housing Structures in Short Pump
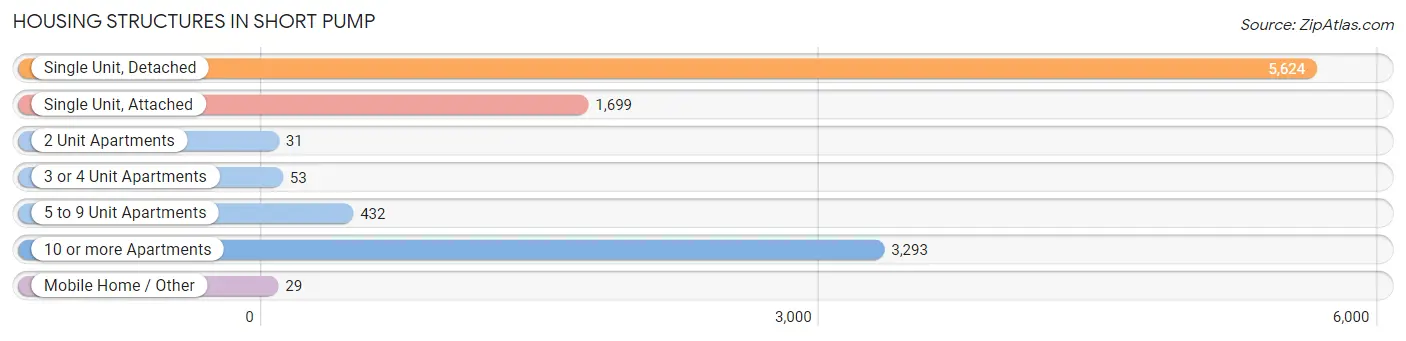
| Structure Type | # Housing Units | % Housing Units |
| Single Unit, Detached | 5,624 | 50.4% |
| Single Unit, Attached | 1,699 | 15.2% |
| 2 Unit Apartments | 31 | 0.3% |
| 3 or 4 Unit Apartments | 53 | 0.5% |
| 5 to 9 Unit Apartments | 432 | 3.9% |
| 10 or more Apartments | 3,293 | 29.5% |
| Mobile Home / Other | 29 | 0.3% |
| Total | 11,161 | 100.0% |
Housing Structures by Occupancy in Short Pump
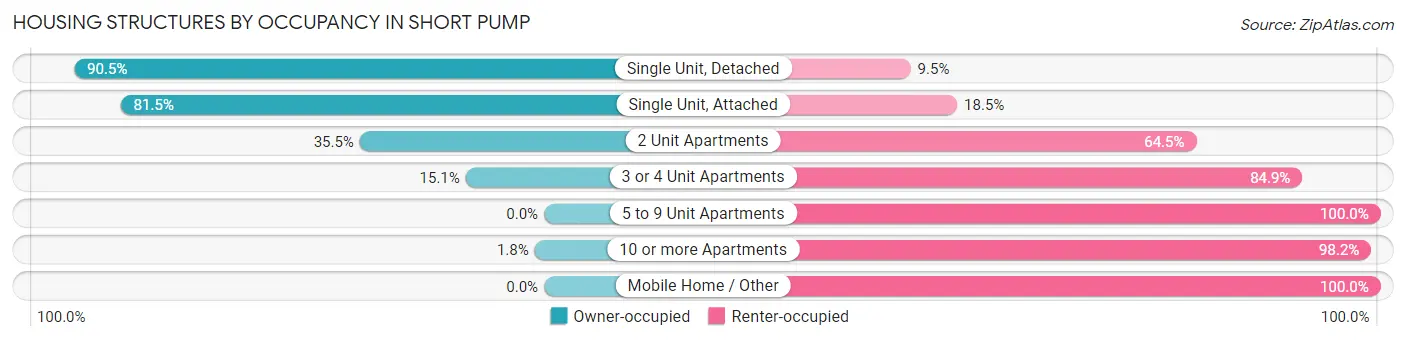
| Structure Type | Owner-occupied | Renter-occupied |
| Single Unit, Detached | 5,088 (90.5%) | 536 (9.5%) |
| Single Unit, Attached | 1,385 (81.5%) | 314 (18.5%) |
| 2 Unit Apartments | 11 (35.5%) | 20 (64.5%) |
| 3 or 4 Unit Apartments | 8 (15.1%) | 45 (84.9%) |
| 5 to 9 Unit Apartments | 0 (0.0%) | 432 (100.0%) |
| 10 or more Apartments | 60 (1.8%) | 3,233 (98.2%) |
| Mobile Home / Other | 0 (0.0%) | 29 (100.0%) |
| Total | 6,552 (58.7%) | 4,609 (41.3%) |
Housing Structures by Number of Rooms in Short Pump
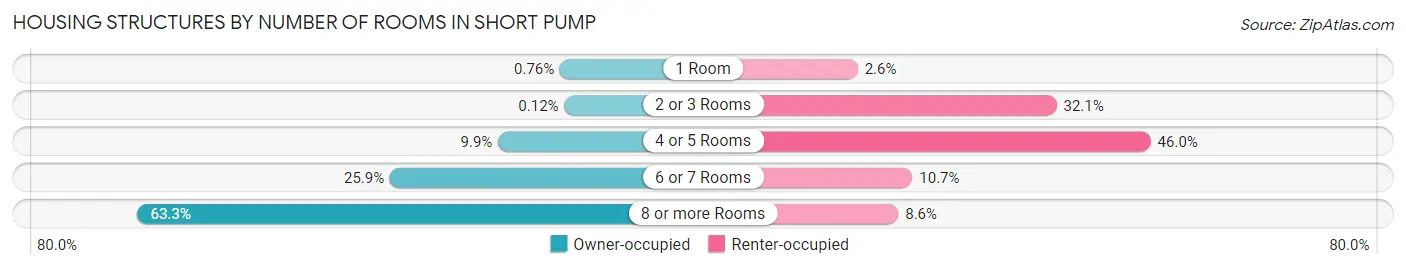
| Number of Rooms | Owner-occupied | Renter-occupied |
| 1 Room | 50 (0.8%) | 121 (2.6%) |
| 2 or 3 Rooms | 8 (0.1%) | 1,477 (32.1%) |
| 4 or 5 Rooms | 650 (9.9%) | 2,119 (46.0%) |
| 6 or 7 Rooms | 1,698 (25.9%) | 494 (10.7%) |
| 8 or more Rooms | 4,146 (63.3%) | 398 (8.6%) |
| Total | 6,552 (100.0%) | 4,609 (100.0%) |
Housing Structure by Heating Type in Short Pump
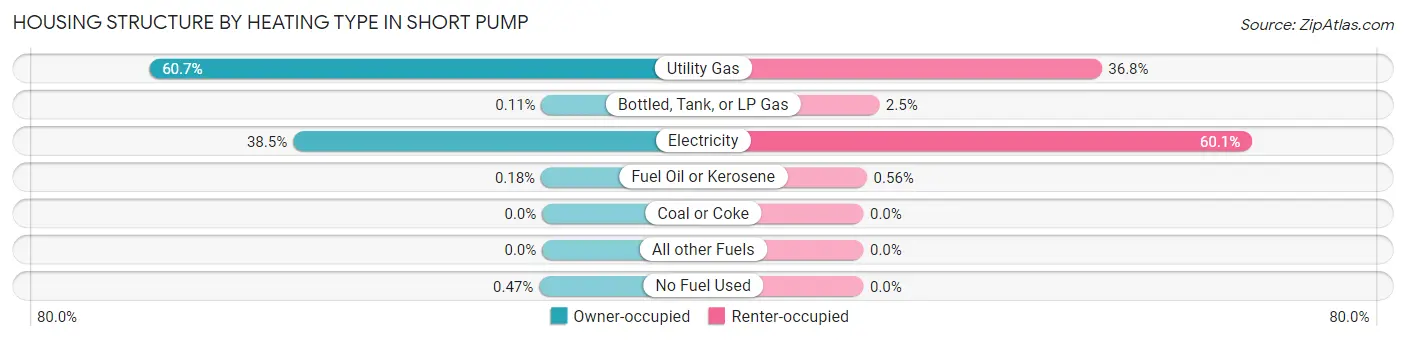
| Heating Type | Owner-occupied | Renter-occupied |
| Utility Gas | 3,979 (60.7%) | 1,698 (36.8%) |
| Bottled, Tank, or LP Gas | 7 (0.1%) | 113 (2.5%) |
| Electricity | 2,523 (38.5%) | 2,772 (60.1%) |
| Fuel Oil or Kerosene | 12 (0.2%) | 26 (0.6%) |
| Coal or Coke | 0 (0.0%) | 0 (0.0%) |
| All other Fuels | 0 (0.0%) | 0 (0.0%) |
| No Fuel Used | 31 (0.5%) | 0 (0.0%) |
| Total | 6,552 (100.0%) | 4,609 (100.0%) |
Household Vehicle Usage in Short Pump
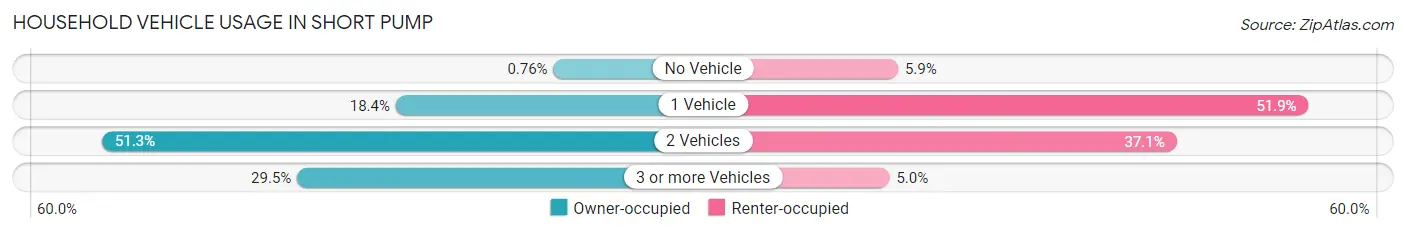
| Vehicles per Household | Owner-occupied | Renter-occupied |
| No Vehicle | 50 (0.8%) | 274 (5.9%) |
| 1 Vehicle | 1,207 (18.4%) | 2,393 (51.9%) |
| 2 Vehicles | 3,364 (51.3%) | 1,712 (37.1%) |
| 3 or more Vehicles | 1,931 (29.5%) | 230 (5.0%) |
| Total | 6,552 (100.0%) | 4,609 (100.0%) |
Real Estate & Mortgages in Short Pump
Real Estate and Mortgage Overview in Short Pump
| Characteristic | Without Mortgage | With Mortgage |
| Housing Units | 1,479 | 5,073 |
| Median Property Value | $506,600 | $517,500 |
| Median Household Income | $161,250 | $3,327 |
| Monthly Housing Costs | $737 | $1,578 |
| Real Estate Taxes | $4,071 | $9 |
Property Value by Mortgage Status in Short Pump
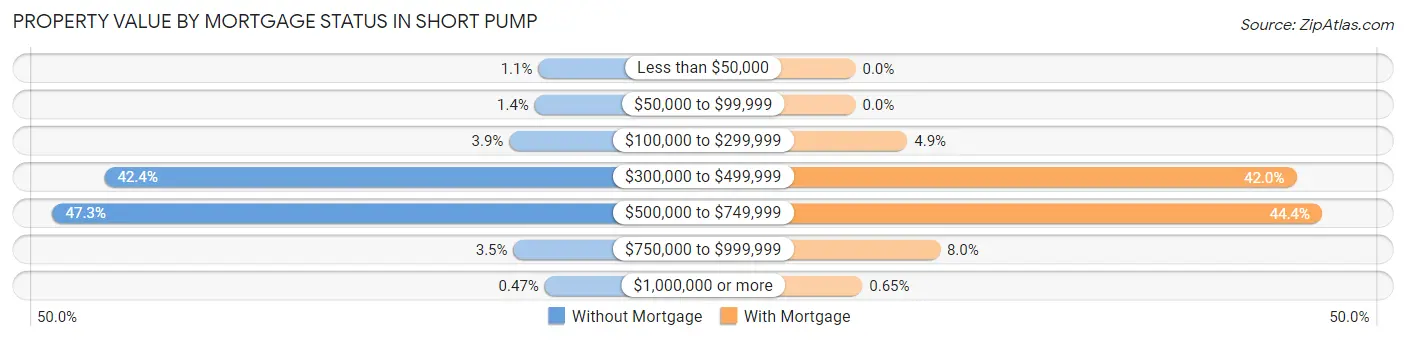
| Property Value | Without Mortgage | With Mortgage |
| Less than $50,000 | 16 (1.1%) | 0 (0.0%) |
| $50,000 to $99,999 | 21 (1.4%) | 0 (0.0%) |
| $100,000 to $299,999 | 57 (3.8%) | 250 (4.9%) |
| $300,000 to $499,999 | 627 (42.4%) | 2,129 (42.0%) |
| $500,000 to $749,999 | 700 (47.3%) | 2,253 (44.4%) |
| $750,000 to $999,999 | 51 (3.5%) | 408 (8.0%) |
| $1,000,000 or more | 7 (0.5%) | 33 (0.6%) |
| Total | 1,479 (100.0%) | 5,073 (100.0%) |
Household Income by Mortgage Status in Short Pump
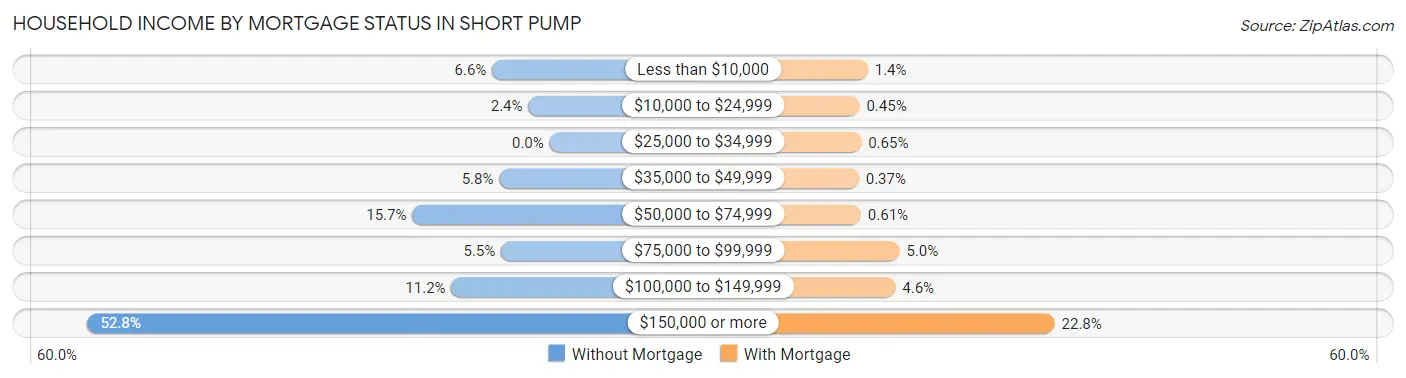
| Household Income | Without Mortgage | With Mortgage |
| Less than $10,000 | 97 (6.6%) | 71 (1.4%) |
| $10,000 to $24,999 | 36 (2.4%) | 23 (0.4%) |
| $25,000 to $34,999 | 0 (0.0%) | 33 (0.6%) |
| $35,000 to $49,999 | 85 (5.8%) | 19 (0.4%) |
| $50,000 to $74,999 | 232 (15.7%) | 31 (0.6%) |
| $75,000 to $99,999 | 82 (5.5%) | 255 (5.0%) |
| $100,000 to $149,999 | 166 (11.2%) | 231 (4.5%) |
| $150,000 or more | 781 (52.8%) | 1,154 (22.8%) |
| Total | 1,479 (100.0%) | 5,073 (100.0%) |
Property Value to Household Income Ratio in Short Pump
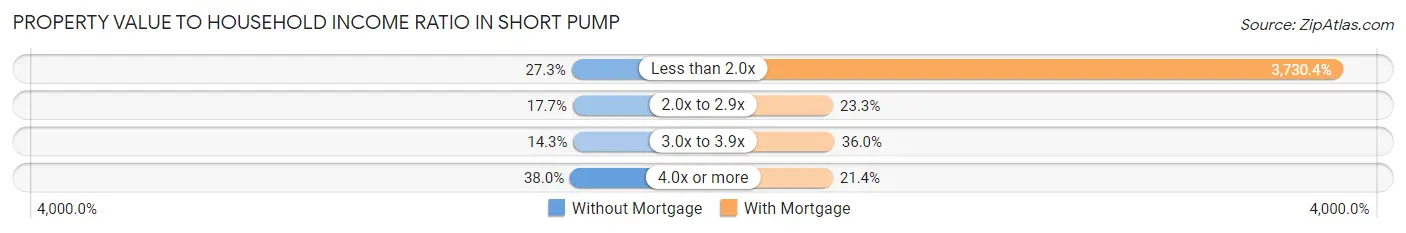
| Value-to-Income Ratio | Without Mortgage | With Mortgage |
| Less than 2.0x | 403 (27.3%) | 189,243 (3,730.4%) |
| 2.0x to 2.9x | 262 (17.7%) | 1,180 (23.3%) |
| 3.0x to 3.9x | 212 (14.3%) | 1,826 (36.0%) |
| 4.0x or more | 562 (38.0%) | 1,087 (21.4%) |
| Total | 1,479 (100.0%) | 5,073 (100.0%) |
Real Estate Taxes by Mortgage Status in Short Pump
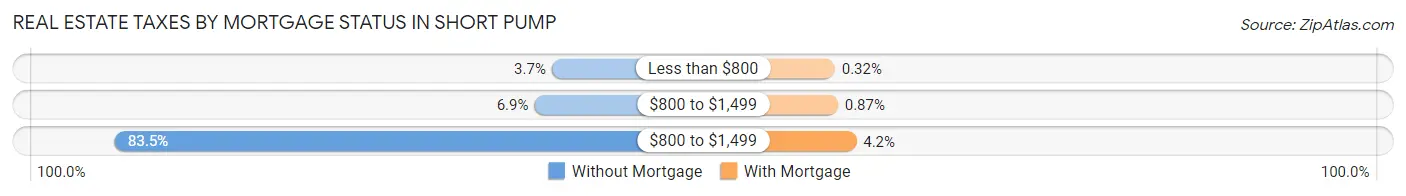
| Property Taxes | Without Mortgage | With Mortgage |
| Less than $800 | 55 (3.7%) | 16 (0.3%) |
| $800 to $1,499 | 102 (6.9%) | 44 (0.9%) |
| $800 to $1,499 | 1,235 (83.5%) | 215 (4.2%) |
| Total | 1,479 (100.0%) | 5,073 (100.0%) |
Health & Disability in Short Pump
Health Insurance Coverage by Age in Short Pump
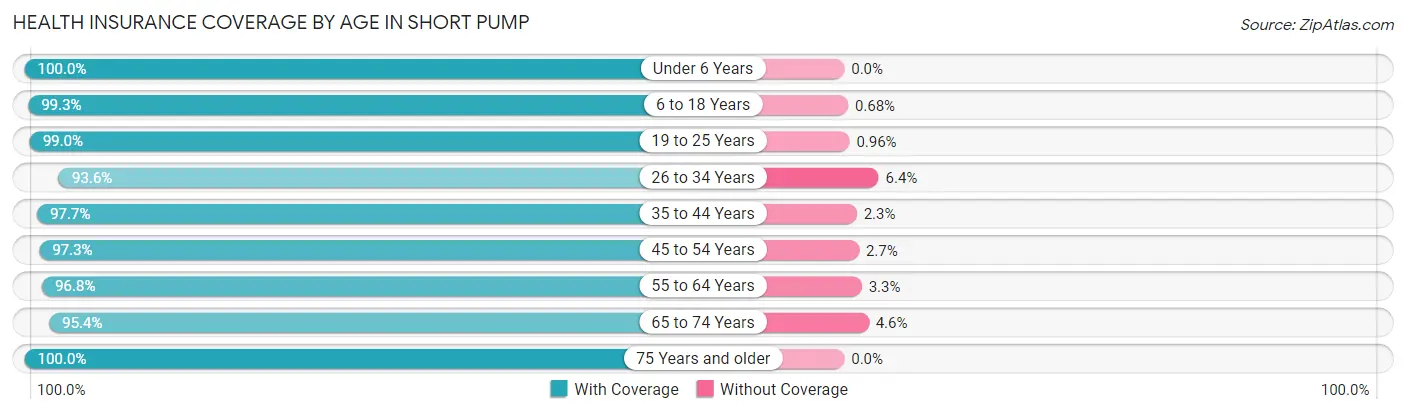
| Age Bracket | With Coverage | Without Coverage |
| Under 6 Years | 2,080 (100.0%) | 0 (0.0%) |
| 6 to 18 Years | 5,259 (99.3%) | 36 (0.7%) |
| 19 to 25 Years | 1,550 (99.0%) | 15 (1.0%) |
| 26 to 34 Years | 3,293 (93.6%) | 225 (6.4%) |
| 35 to 44 Years | 4,414 (97.7%) | 105 (2.3%) |
| 45 to 54 Years | 4,020 (97.3%) | 113 (2.7%) |
| 55 to 64 Years | 3,628 (96.8%) | 122 (3.3%) |
| 65 to 74 Years | 2,049 (95.4%) | 98 (4.6%) |
| 75 Years and older | 1,172 (100.0%) | 0 (0.0%) |
| Total | 27,465 (97.5%) | 714 (2.5%) |
Health Insurance Coverage by Citizenship Status in Short Pump
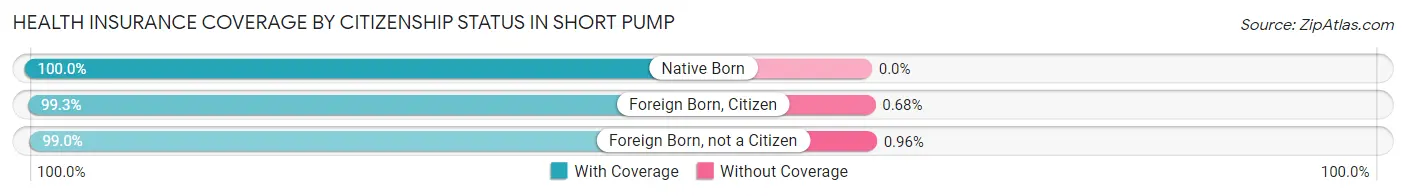
| Citizenship Status | With Coverage | Without Coverage |
| Native Born | 2,080 (100.0%) | 0 (0.0%) |
| Foreign Born, Citizen | 5,259 (99.3%) | 36 (0.7%) |
| Foreign Born, not a Citizen | 1,550 (99.0%) | 15 (1.0%) |
Health Insurance Coverage by Household Income in Short Pump
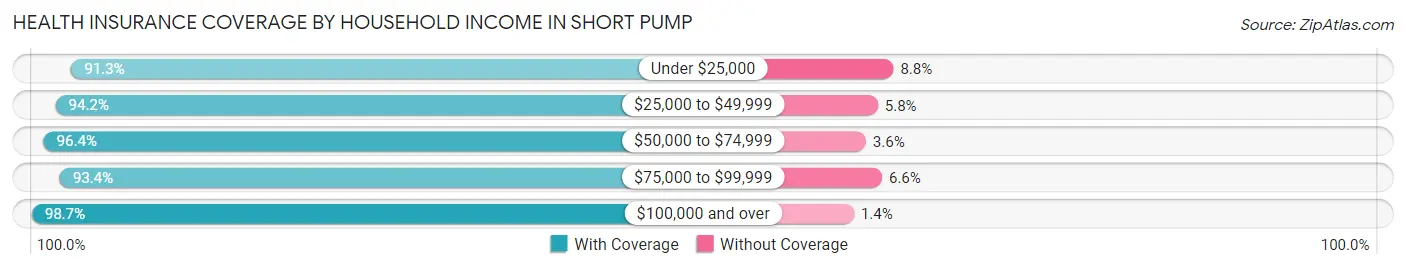
| Household Income | With Coverage | Without Coverage |
| Under $25,000 | 1,001 (91.2%) | 96 (8.7%) |
| $25,000 to $49,999 | 1,569 (94.2%) | 97 (5.8%) |
| $50,000 to $74,999 | 2,130 (96.4%) | 79 (3.6%) |
| $75,000 to $99,999 | 2,166 (93.4%) | 153 (6.6%) |
| $100,000 and over | 20,566 (98.7%) | 282 (1.3%) |
Public vs Private Health Insurance Coverage by Age in Short Pump
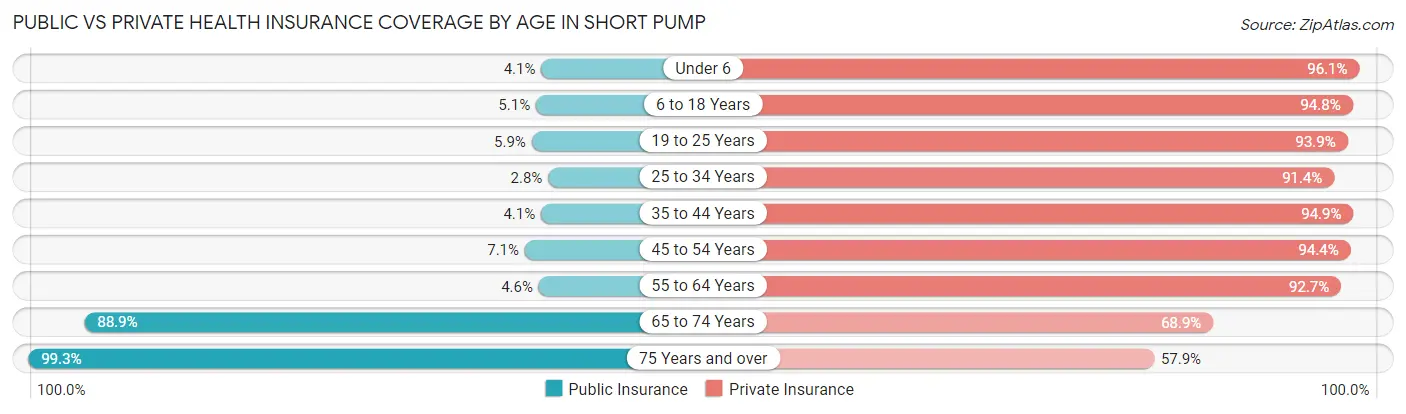
| Age Bracket | Public Insurance | Private Insurance |
| Under 6 | 85 (4.1%) | 1,998 (96.1%) |
| 6 to 18 Years | 269 (5.1%) | 5,019 (94.8%) |
| 19 to 25 Years | 92 (5.9%) | 1,469 (93.9%) |
| 25 to 34 Years | 99 (2.8%) | 3,215 (91.4%) |
| 35 to 44 Years | 187 (4.1%) | 4,290 (94.9%) |
| 45 to 54 Years | 295 (7.1%) | 3,903 (94.4%) |
| 55 to 64 Years | 171 (4.6%) | 3,475 (92.7%) |
| 65 to 74 Years | 1,909 (88.9%) | 1,480 (68.9%) |
| 75 Years and over | 1,164 (99.3%) | 679 (57.9%) |
| Total | 4,271 (15.2%) | 25,528 (90.6%) |
Disability Status by Sex by Age in Short Pump
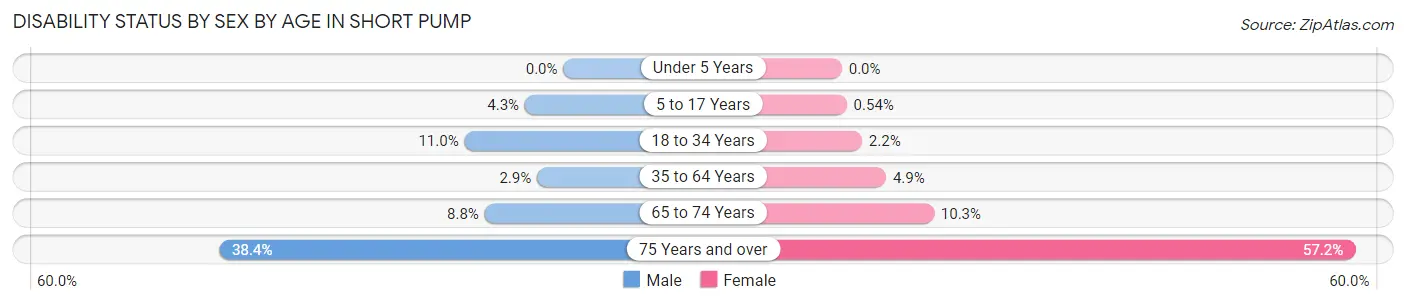
| Age Bracket | Male | Female |
| Under 5 Years | 0 (0.0%) | 0 (0.0%) |
| 5 to 17 Years | 129 (4.3%) | 13 (0.5%) |
| 18 to 34 Years | 270 (11.0%) | 63 (2.2%) |
| 35 to 64 Years | 181 (2.9%) | 306 (4.9%) |
| 65 to 74 Years | 77 (8.8%) | 130 (10.2%) |
| 75 Years and over | 163 (38.4%) | 427 (57.2%) |
Disability Class by Sex by Age in Short Pump
Disability Class: Hearing Difficulty
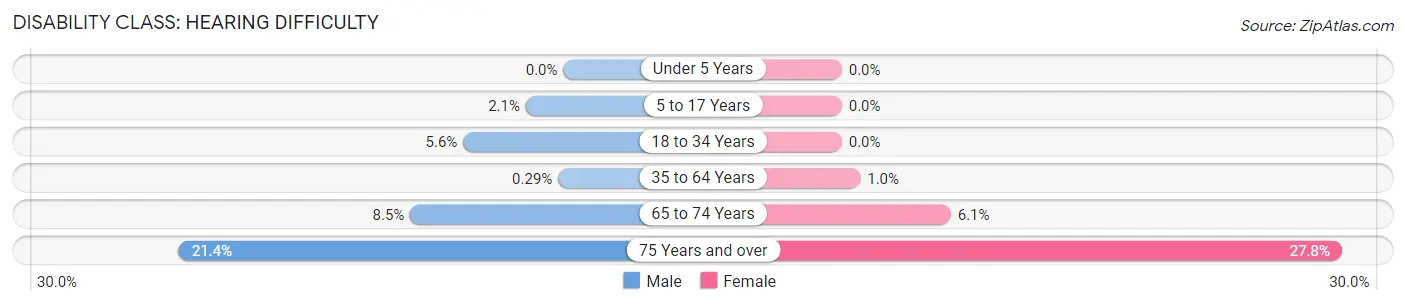
| Age Bracket | Male | Female |
| Under 5 Years | 0 (0.0%) | 0 (0.0%) |
| 5 to 17 Years | 63 (2.1%) | 0 (0.0%) |
| 18 to 34 Years | 137 (5.6%) | 0 (0.0%) |
| 35 to 64 Years | 18 (0.3%) | 64 (1.0%) |
| 65 to 74 Years | 75 (8.5%) | 77 (6.1%) |
| 75 Years and over | 91 (21.4%) | 208 (27.8%) |
Disability Class: Vision Difficulty
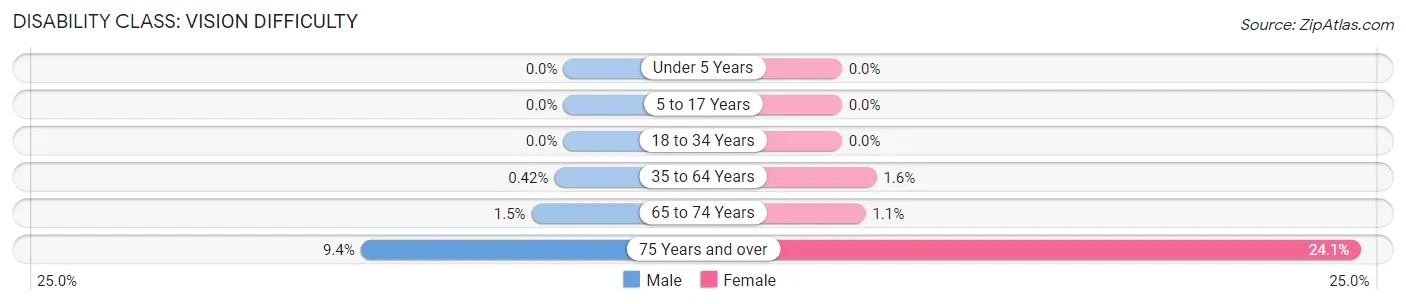
| Age Bracket | Male | Female |
| Under 5 Years | 0 (0.0%) | 0 (0.0%) |
| 5 to 17 Years | 0 (0.0%) | 0 (0.0%) |
| 18 to 34 Years | 0 (0.0%) | 0 (0.0%) |
| 35 to 64 Years | 26 (0.4%) | 100 (1.6%) |
| 65 to 74 Years | 13 (1.5%) | 14 (1.1%) |
| 75 Years and over | 40 (9.4%) | 180 (24.1%) |
Disability Class: Cognitive Difficulty
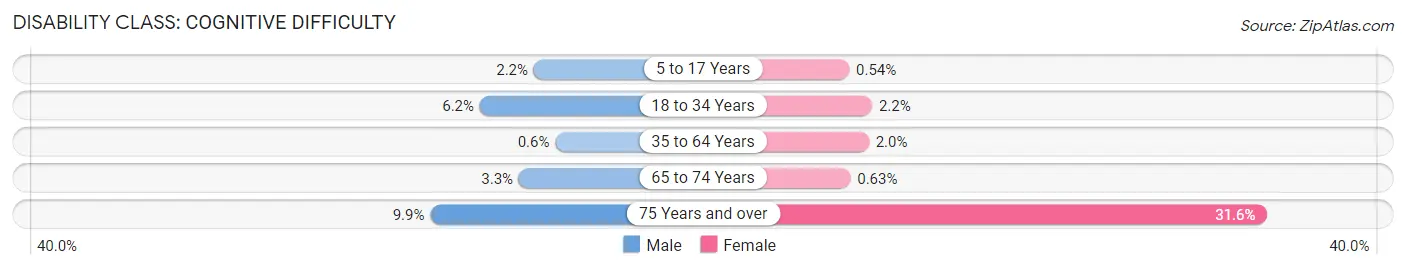
| Age Bracket | Male | Female |
| 5 to 17 Years | 66 (2.2%) | 13 (0.5%) |
| 18 to 34 Years | 152 (6.2%) | 63 (2.2%) |
| 35 to 64 Years | 37 (0.6%) | 124 (2.0%) |
| 65 to 74 Years | 29 (3.3%) | 8 (0.6%) |
| 75 Years and over | 42 (9.9%) | 236 (31.6%) |
Disability Class: Ambulatory Difficulty
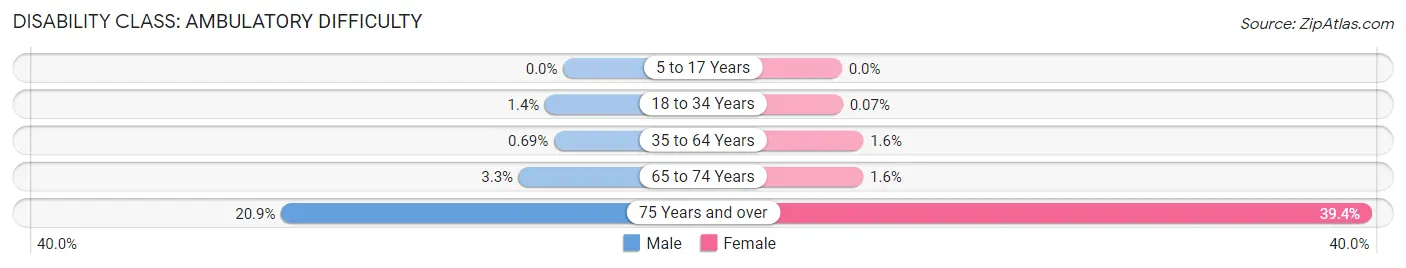
| Age Bracket | Male | Female |
| 5 to 17 Years | 0 (0.0%) | 0 (0.0%) |
| 18 to 34 Years | 33 (1.3%) | 2 (0.1%) |
| 35 to 64 Years | 43 (0.7%) | 99 (1.6%) |
| 65 to 74 Years | 29 (3.3%) | 20 (1.6%) |
| 75 Years and over | 89 (20.9%) | 294 (39.4%) |
Disability Class: Self-Care Difficulty
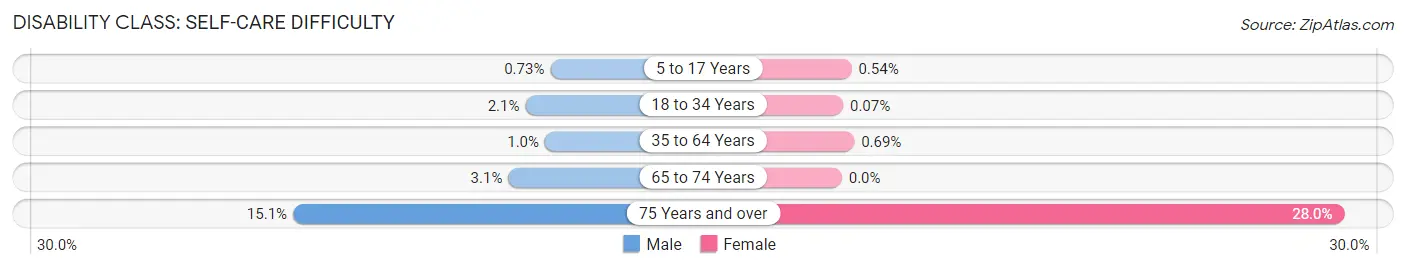
| Age Bracket | Male | Female |
| 5 to 17 Years | 22 (0.7%) | 13 (0.5%) |
| 18 to 34 Years | 52 (2.1%) | 2 (0.1%) |
| 35 to 64 Years | 64 (1.0%) | 43 (0.7%) |
| 65 to 74 Years | 27 (3.1%) | 0 (0.0%) |
| 75 Years and over | 64 (15.1%) | 209 (28.0%) |
Technology Access in Short Pump
Computing Device Access in Short Pump
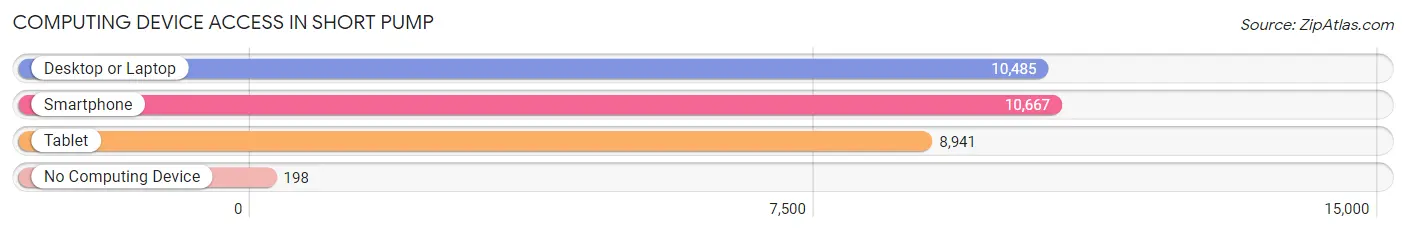
| Device Type | # Households | % Households |
| Desktop or Laptop | 10,485 | 93.9% |
| Smartphone | 10,667 | 95.6% |
| Tablet | 8,941 | 80.1% |
| No Computing Device | 198 | 1.8% |
| Total | 11,161 | 100.0% |
Internet Access in Short Pump
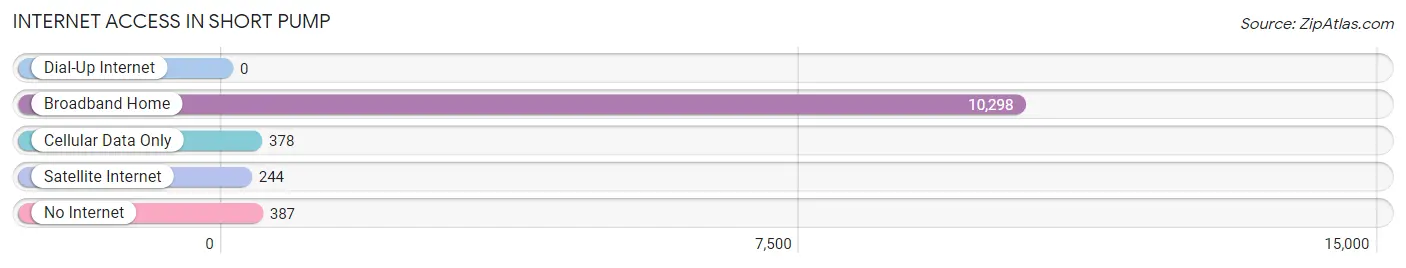
| Internet Type | # Households | % Households |
| Dial-Up Internet | 0 | 0.0% |
| Broadband Home | 10,298 | 92.3% |
| Cellular Data Only | 378 | 3.4% |
| Satellite Internet | 244 | 2.2% |
| No Internet | 387 | 3.5% |
| Total | 11,161 | 100.0% |
Short Pump Summary
History
Short Pump is an unincorporated community located in Henrico County, Virginia. It is situated approximately 20 miles west of Richmond, the state capital. The area was first settled in the late 1700s by the Short family, who owned a large tract of land in the area. The family built a grist mill and a store, and the area became known as Short’s Pump. The name was later shortened to Short Pump.
In the early 1800s, the area was a popular stop for travelers on the Richmond-Lynchburg stagecoach line. The stagecoach line ran through the area until the mid-1800s, when the railroad replaced it. The railroad brought more people to the area, and the population began to grow.
In the late 1800s, the area became a popular summer resort destination. The area was known for its mineral springs, which were believed to have healing properties. The area also had several hotels and resorts, which attracted visitors from all over the country.
In the early 1900s, the area began to develop into a residential community. The population continued to grow, and by the mid-1900s, Short Pump had become a thriving suburban community.
Geography
Short Pump is located in Henrico County, Virginia. It is situated approximately 20 miles west of Richmond, the state capital. The area is located in the Piedmont region of Virginia, and is characterized by rolling hills and wooded areas. The area is also home to several creeks and streams, including the Short Pump Creek.
The climate in Short Pump is humid subtropical, with hot, humid summers and mild winters. The average annual temperature is around 60 degrees Fahrenheit. The area receives an average of 45 inches of precipitation per year.
Economy
Short Pump is a thriving suburban community with a strong economy. The area is home to several large employers, including Capital One, WestRock, and Owens & Minor. The area is also home to several shopping centers, including Short Pump Town Center and West Broad Village.
The area is also home to several restaurants, bars, and entertainment venues. The area is known for its vibrant nightlife, and is home to several popular music venues, including The National and The Broadberry.
Demographics
As of the 2010 census, the population of Short Pump was 24,729. The population is predominantly white (83.3%), with African Americans making up 8.3% of the population. The median household income in the area is $90,845, and the median home value is $346,000.
The area is home to several schools, including Short Pump Elementary School, Short Pump Middle School, and Deep Run High School. The area is also home to several colleges and universities, including the University of Richmond and Virginia Commonwealth University.
Common Questions
What is Per Capita Income in Short Pump?
Per Capita income in Short Pump is $64,337.
What is the Median Family Income in Short Pump?
Median Family Income in Short Pump is $163,493.
What is the Median Household income in Short Pump?
Median Household Income in Short Pump is $130,899.
What is Income or Wage Gap in Short Pump?
Income or Wage Gap in Short Pump is 48.0%.
Women in Short Pump earn 52.0 cents for every dollar earned by a man.
What is Inequality or Gini Index in Short Pump?
Inequality or Gini Index in Short Pump is 0.40.
What is the Total Population of Short Pump?
Total Population of Short Pump is 28,400.
What is the Total Male Population of Short Pump?
Total Male Population of Short Pump is 14,193.
What is the Total Female Population of Short Pump?
Total Female Population of Short Pump is 14,207.
What is the Ratio of Males per 100 Females in Short Pump?
There are 99.90 Males per 100 Females in Short Pump.
What is the Ratio of Females per 100 Males in Short Pump?
There are 100.10 Females per 100 Males in Short Pump.
What is the Median Population Age in Short Pump?
Median Population Age in Short Pump is 38.8 Years.
What is the Average Family Size in Short Pump
Average Family Size in Short Pump is 3.1 People.
What is the Average Household Size in Short Pump
Average Household Size in Short Pump is 2.5 People.
How Large is the Labor Force in Short Pump?
There are 15,492 People in the Labor Forcein in Short Pump.
What is the Percentage of People in the Labor Force in Short Pump?
70.7% of People are in the Labor Force in Short Pump.
What is the Unemployment Rate in Short Pump?
Unemployment Rate in Short Pump is 1.8%.