Saluda, VA Map & Demographics
Saluda Map
Saluda Overview
$34,863
PER CAPITA INCOME
$115,221
AVG FAMILY INCOME
$115,221
AVG HOUSEHOLD INCOME
30.5%
WAGE / INCOME GAP [ % ]
69.5¢/ $1
WAGE / INCOME GAP [ $ ]
0.31
INEQUALITY / GINI INDEX
650
TOTAL POPULATION
383
MALE POPULATION
267
FEMALE POPULATION
143.45
MALES / 100 FEMALES
69.71
FEMALES / 100 MALES
39.4
MEDIAN AGE
2.6
AVG FAMILY SIZE
3.2
AVG HOUSEHOLD SIZE
349
LABOR FORCE [ PEOPLE ]
55.6%
PERCENT IN LABOR FORCE
Saluda Zip Codes
Saluda Area Codes
Income in Saluda
Income Overview in Saluda
Per Capita Income in Saluda is $34,863, while median incomes of families and households are $115,221 and $115,221 respectively.
| Characteristic | Number | Measure |
| Per Capita Income | 650 | $34,863 |
| Median Family Income | 125 | $115,221 |
| Mean Family Income | 125 | $149,678 |
| Median Household Income | 125 | $115,221 |
| Mean Household Income | 125 | $164,289 |
| Income Deficit | 125 | $0 |
| Wage / Income Gap (%) | 650 | 30.46% |
| Wage / Income Gap ($) | 650 | 69.54¢ per $1 |
| Gini / Inequality Index | 650 | 0.31 |
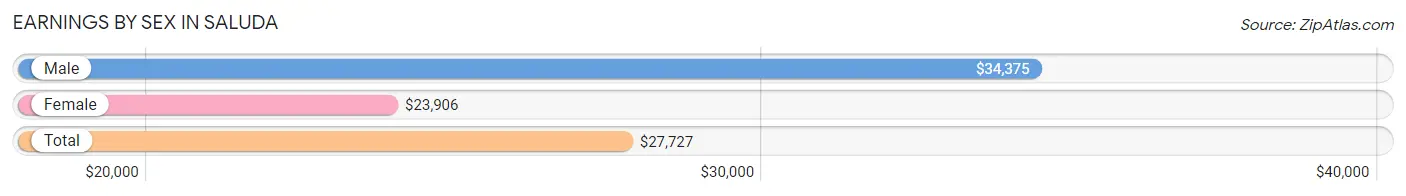
Earnings by Sex in Saluda
Average Earnings in Saluda are $27,727, $34,375 for men and $23,906 for women, a difference of 30.5%.
| Sex | Number | Average Earnings |
| Male | 287 (65.5%) | $34,375 |
| Female | 151 (34.5%) | $23,906 |
| Total | 438 (100.0%) | $27,727 |
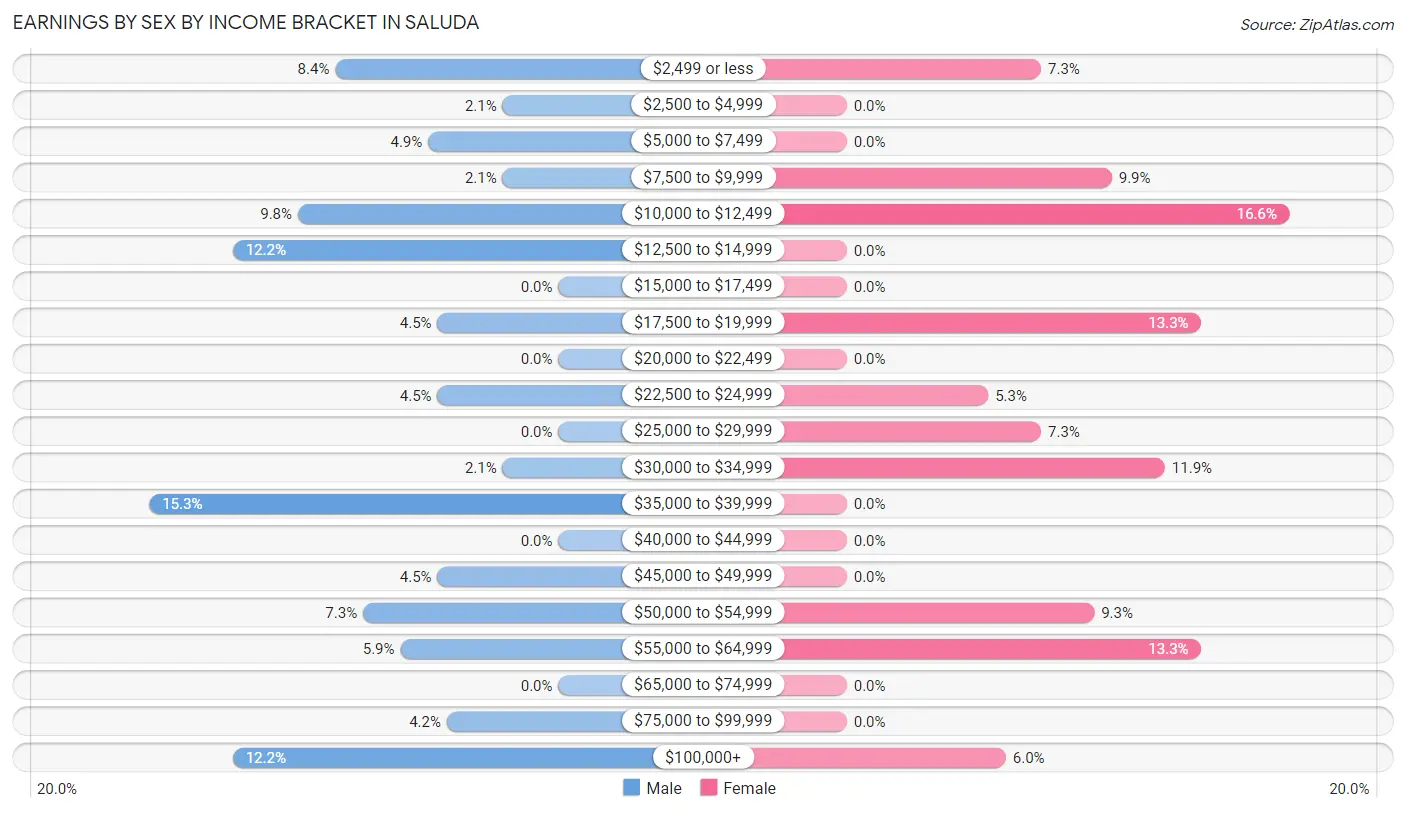
Earnings by Sex by Income Bracket in Saluda
The most common earnings brackets in Saluda are $35,000 to $39,999 for men (44 | 15.3%) and $10,000 to $12,499 for women (25 | 16.6%).
| Income | Male | Female |
| $2,499 or less | 24 (8.4%) | 11 (7.3%) |
| $2,500 to $4,999 | 6 (2.1%) | 0 (0.0%) |
| $5,000 to $7,499 | 14 (4.9%) | 0 (0.0%) |
| $7,500 to $9,999 | 6 (2.1%) | 15 (9.9%) |
| $10,000 to $12,499 | 28 (9.8%) | 25 (16.6%) |
| $12,500 to $14,999 | 35 (12.2%) | 0 (0.0%) |
| $15,000 to $17,499 | 0 (0.0%) | 0 (0.0%) |
| $17,500 to $19,999 | 13 (4.5%) | 20 (13.3%) |
| $20,000 to $22,499 | 0 (0.0%) | 0 (0.0%) |
| $22,500 to $24,999 | 13 (4.5%) | 8 (5.3%) |
| $25,000 to $29,999 | 0 (0.0%) | 11 (7.3%) |
| $30,000 to $34,999 | 6 (2.1%) | 18 (11.9%) |
| $35,000 to $39,999 | 44 (15.3%) | 0 (0.0%) |
| $40,000 to $44,999 | 0 (0.0%) | 0 (0.0%) |
| $45,000 to $49,999 | 13 (4.5%) | 0 (0.0%) |
| $50,000 to $54,999 | 21 (7.3%) | 14 (9.3%) |
| $55,000 to $64,999 | 17 (5.9%) | 20 (13.3%) |
| $65,000 to $74,999 | 0 (0.0%) | 0 (0.0%) |
| $75,000 to $99,999 | 12 (4.2%) | 0 (0.0%) |
| $100,000+ | 35 (12.2%) | 9 (6.0%) |
| Total | 287 (100.0%) | 151 (100.0%) |
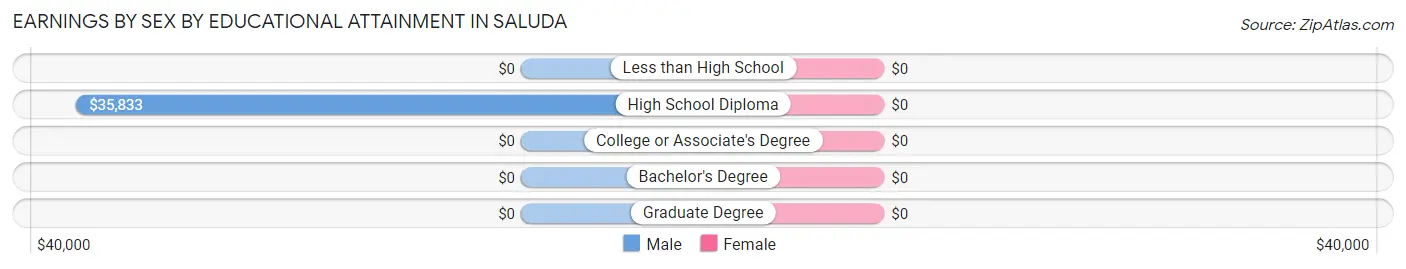
Earnings by Sex by Educational Attainment in Saluda
| Educational Attainment | Male Income | Female Income |
| Less than High School | - | - |
| High School Diploma | $35,833 | $0 |
| College or Associate's Degree | - | - |
| Bachelor's Degree | - | - |
| Graduate Degree | - | - |
| Total | $48,393 | $0 |
Family Income in Saluda
Family Income Brackets in Saluda
According to the Saluda family income data, there are 40 families falling into the $200,000+ income range, which is the most common income bracket and makes up 32.0% of all families.
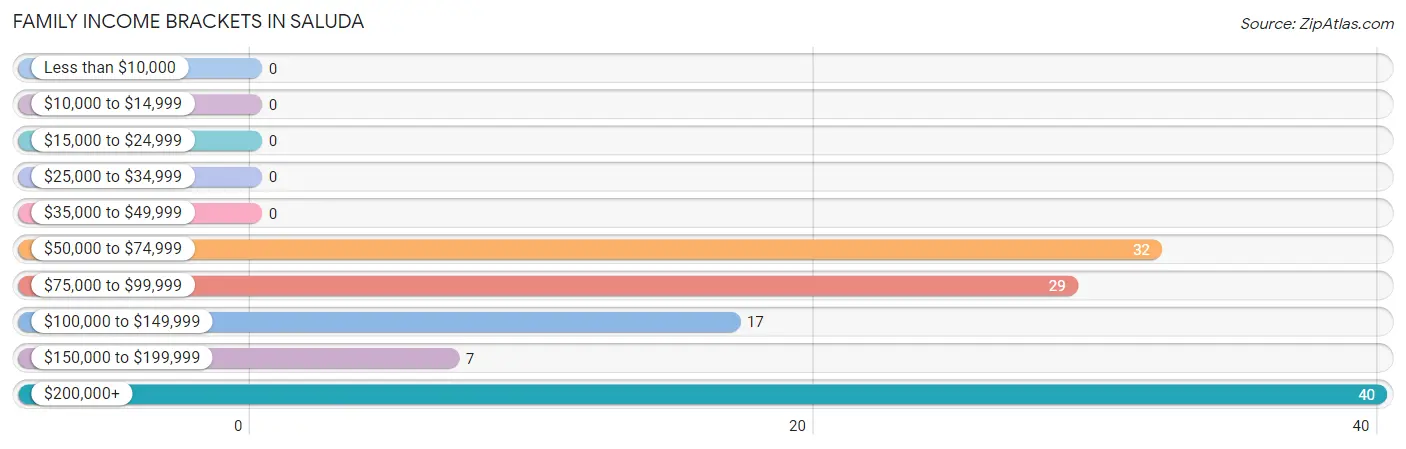
| Income Bracket | # Families | % Families |
| Less than $10,000 | 0 | 0.0% |
| $10,000 to $14,999 | 0 | 0.0% |
| $15,000 to $24,999 | 0 | 0.0% |
| $25,000 to $34,999 | 0 | 0.0% |
| $35,000 to $49,999 | 0 | 0.0% |
| $50,000 to $74,999 | 32 | 25.6% |
| $75,000 to $99,999 | 29 | 23.2% |
| $100,000 to $149,999 | 17 | 13.6% |
| $150,000 to $199,999 | 7 | 5.6% |
| $200,000+ | 40 | 32.0% |
Family Income by Famaliy Size in Saluda
2-person families (82 | 65.6%) account for the highest median family income in Saluda with $162,143 per family, while 2-person families (82 | 65.6%) have the highest median income of $81,072 per family member.
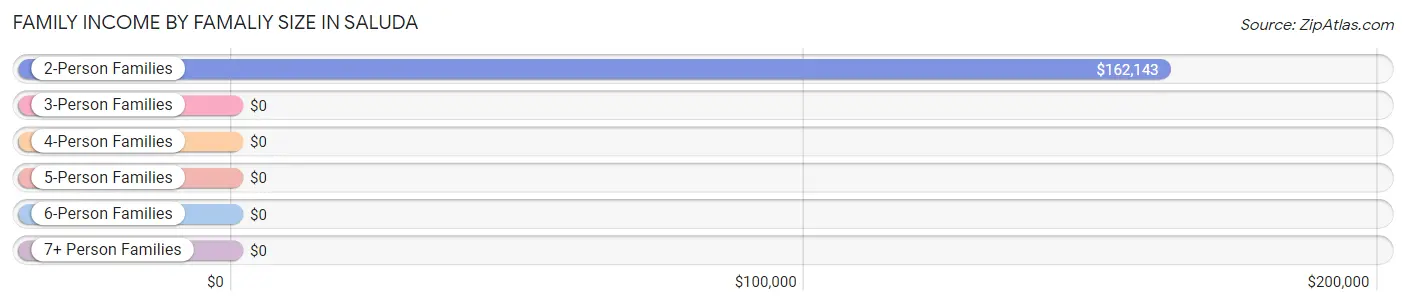
| Income Bracket | # Families | Median Income |
| 2-Person Families | 82 (65.6%) | $162,143 |
| 3-Person Families | 18 (14.4%) | $0 |
| 4-Person Families | 25 (20.0%) | $0 |
| 5-Person Families | 0 (0.0%) | $0 |
| 6-Person Families | 0 (0.0%) | $0 |
| 7+ Person Families | 0 (0.0%) | $0 |
| Total | 125 (100.0%) | $115,221 |
Family Income by Number of Earners in Saluda
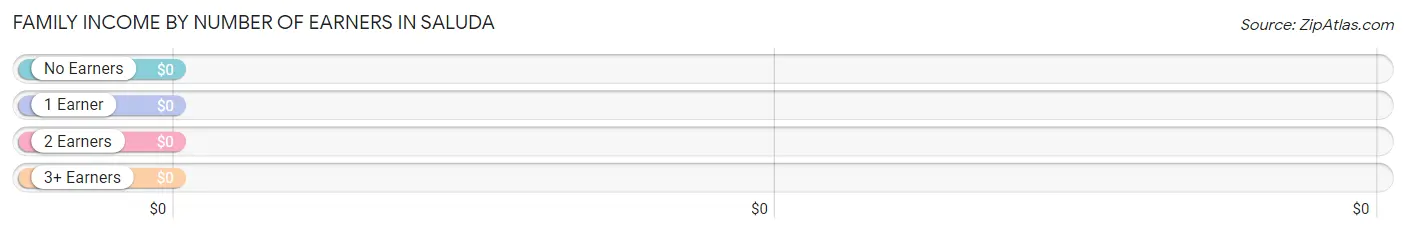
| Number of Earners | # Families | Median Income |
| No Earners | 0 (0.0%) | $0 |
| 1 Earner | 27 (21.6%) | $0 |
| 2 Earners | 55 (44.0%) | $0 |
| 3+ Earners | 43 (34.4%) | $0 |
| Total | 125 (100.0%) | $115,221 |
Household Income in Saluda
Household Income Brackets in Saluda
With 42 households falling in the category, the $100,000 to $149,999 income range is the most frequent in Saluda, accounting for 33.6% of all households.
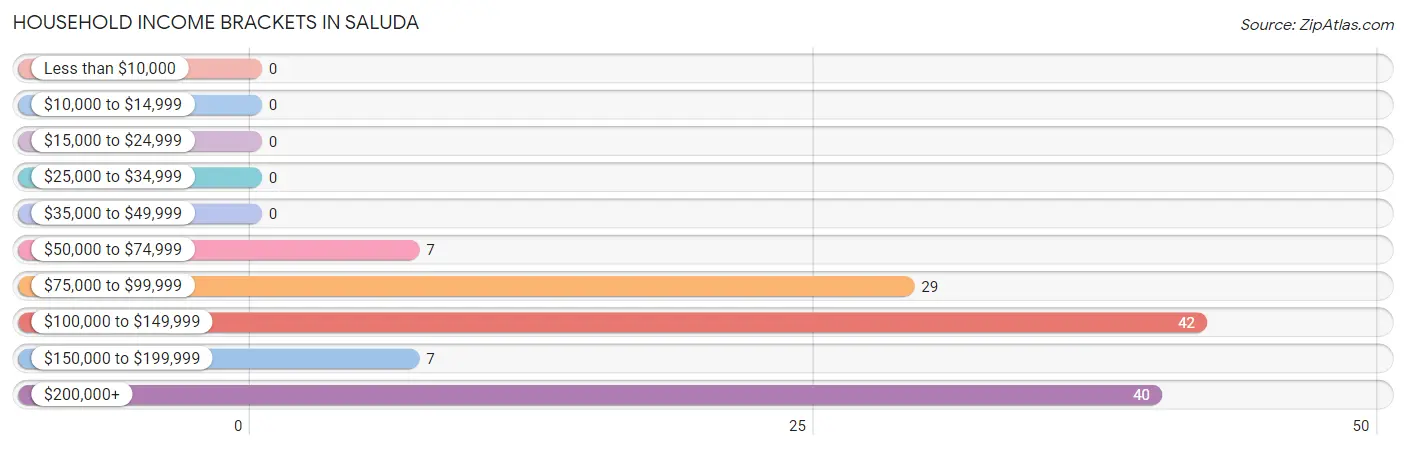
| Income Bracket | # Households | % Households |
| Less than $10,000 | 0 | 0.0% |
| $10,000 to $14,999 | 0 | 0.0% |
| $15,000 to $24,999 | 0 | 0.0% |
| $25,000 to $34,999 | 0 | 0.0% |
| $35,000 to $49,999 | 0 | 0.0% |
| $50,000 to $74,999 | 7 | 5.6% |
| $75,000 to $99,999 | 29 | 23.2% |
| $100,000 to $149,999 | 42 | 33.6% |
| $150,000 to $199,999 | 7 | 5.6% |
| $200,000+ | 40 | 32.0% |
Household Income by Householder Age in Saluda
The median household income in Saluda is $115,221, with the highest median household income of $225,729 found in the 45 to 64 years age bracket for the primary householder. A total of 57 households (45.6%) fall into this category.
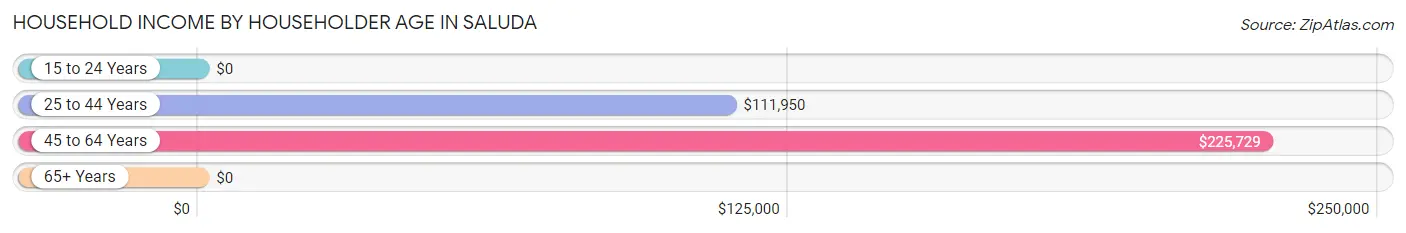
| Income Bracket | # Households | Median Income |
| 15 to 24 Years | 0 (0.0%) | $0 |
| 25 to 44 Years | 61 (48.8%) | $111,950 |
| 45 to 64 Years | 57 (45.6%) | $225,729 |
| 65+ Years | 7 (5.6%) | $0 |
| Total | 125 (100.0%) | $115,221 |
Poverty in Saluda
Income Below Poverty by Sex and Age in Saluda
With 8.6% poverty level for males and 12.7% for females among the residents of Saluda, 18 to 24 year old males and 18 to 24 year old females are the most vulnerable to poverty, with 17 males (25.8%) and 11 females (28.2%) in their respective age groups living below the poverty level.
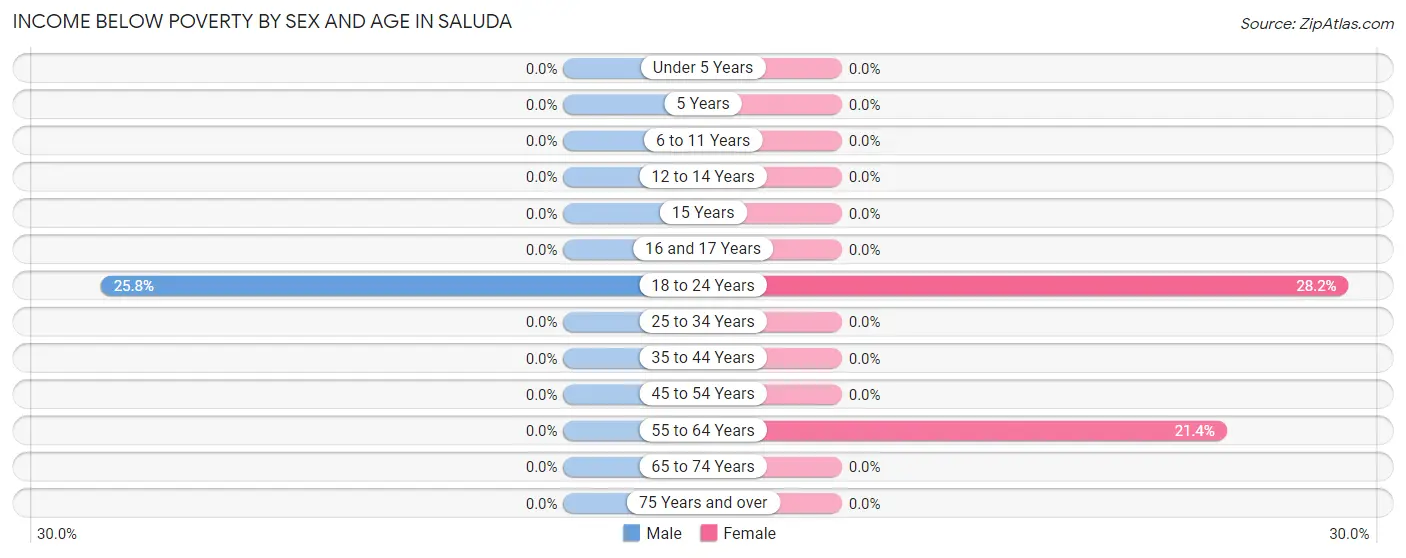
| Age Bracket | Male | Female |
| Under 5 Years | 0 (0.0%) | 0 (0.0%) |
| 5 Years | 0 (0.0%) | 0 (0.0%) |
| 6 to 11 Years | 0 (0.0%) | 0 (0.0%) |
| 12 to 14 Years | 0 (0.0%) | 0 (0.0%) |
| 15 Years | 0 (0.0%) | 0 (0.0%) |
| 16 and 17 Years | 0 (0.0%) | 0 (0.0%) |
| 18 to 24 Years | 17 (25.8%) | 11 (28.2%) |
| 25 to 34 Years | 0 (0.0%) | 0 (0.0%) |
| 35 to 44 Years | 0 (0.0%) | 0 (0.0%) |
| 45 to 54 Years | 0 (0.0%) | 0 (0.0%) |
| 55 to 64 Years | 0 (0.0%) | 15 (21.4%) |
| 65 to 74 Years | 0 (0.0%) | 0 (0.0%) |
| 75 Years and over | 0 (0.0%) | 0 (0.0%) |
| Total | 17 (8.6%) | 26 (12.7%) |
Income Above Poverty by Sex and Age in Saluda
According to the poverty statistics in Saluda, males aged 25 to 34 years and females aged 6 to 11 years are the age groups that are most secure financially, with 100.0% of males and 100.0% of females in these age groups living above the poverty line.
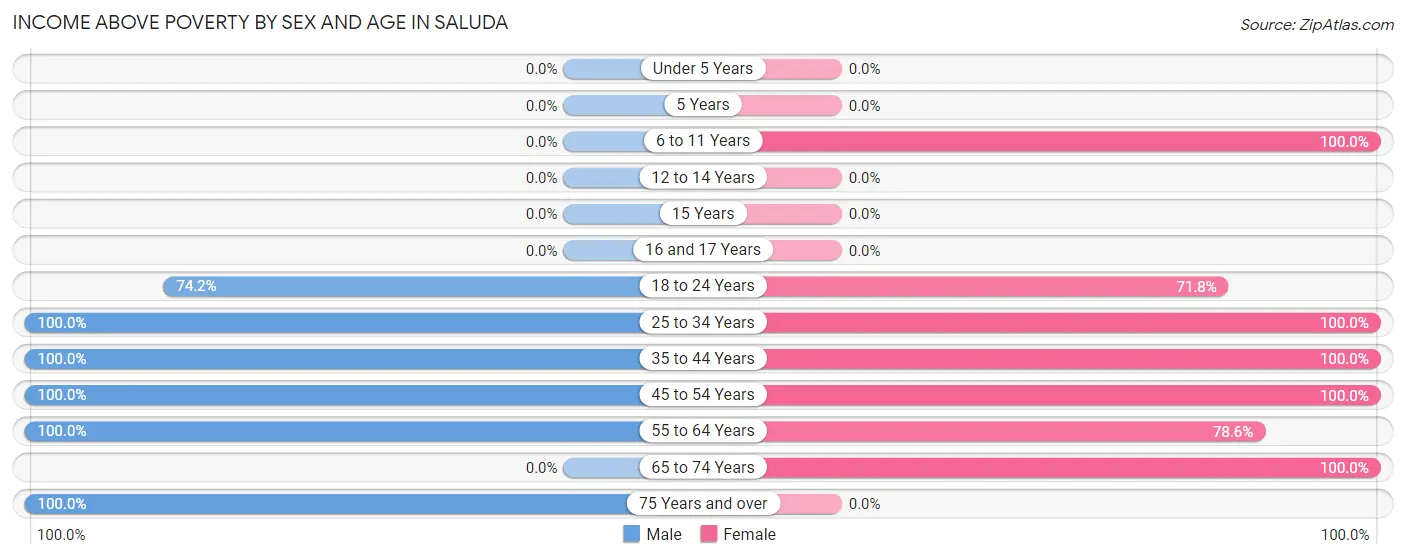
| Age Bracket | Male | Female |
| Under 5 Years | 0 (0.0%) | 0 (0.0%) |
| 5 Years | 0 (0.0%) | 0 (0.0%) |
| 6 to 11 Years | 0 (0.0%) | 22 (100.0%) |
| 12 to 14 Years | 0 (0.0%) | 0 (0.0%) |
| 15 Years | 0 (0.0%) | 0 (0.0%) |
| 16 and 17 Years | 0 (0.0%) | 0 (0.0%) |
| 18 to 24 Years | 49 (74.2%) | 28 (71.8%) |
| 25 to 34 Years | 8 (100.0%) | 9 (100.0%) |
| 35 to 44 Years | 38 (100.0%) | 50 (100.0%) |
| 45 to 54 Years | 59 (100.0%) | 9 (100.0%) |
| 55 to 64 Years | 20 (100.0%) | 55 (78.6%) |
| 65 to 74 Years | 0 (0.0%) | 6 (100.0%) |
| 75 Years and over | 7 (100.0%) | 0 (0.0%) |
| Total | 181 (91.4%) | 179 (87.3%) |
Income Below Poverty Among Married-Couple Families in Saluda
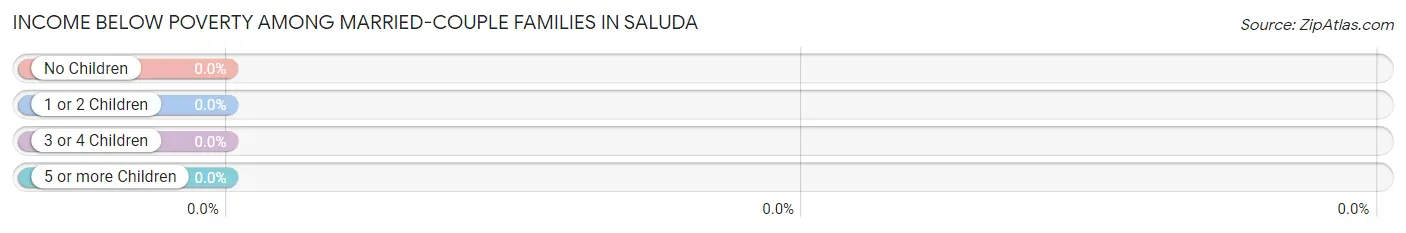
| Children | Above Poverty | Below Poverty |
| No Children | 89 (100.0%) | 0 (0.0%) |
| 1 or 2 Children | 0 (0.0%) | 0 (0.0%) |
| 3 or 4 Children | 0 (0.0%) | 0 (0.0%) |
| 5 or more Children | 0 (0.0%) | 0 (0.0%) |
| Total | 89 (100.0%) | 0 (0.0%) |
Income Below Poverty Among Single-Parent Households in Saluda
| Children | Single Father | Single Mother |
| No Children | 0 (0.0%) | 0 (0.0%) |
| 1 or 2 Children | 0 (0.0%) | 0 (0.0%) |
| 3 or 4 Children | 0 (0.0%) | 0 (0.0%) |
| 5 or more Children | 0 (0.0%) | 0 (0.0%) |
| Total | 0 (0.0%) | 0 (0.0%) |
Income Below Poverty Among Married-Couple vs Single-Parent Households in Saluda
| Children | Married-Couple Families | Single-Parent Households |
| No Children | 0 (0.0%) | 0 (0.0%) |
| 1 or 2 Children | 0 (0.0%) | 0 (0.0%) |
| 3 or 4 Children | 0 (0.0%) | 0 (0.0%) |
| 5 or more Children | 0 (0.0%) | 0 (0.0%) |
| Total | 0 (0.0%) | 0 (0.0%) |
Race in Saluda
The most populous races in Saluda are White / Caucasian (399 | 61.4%), Hispanic or Latino (133 | 20.5%), and Two or more Races (123 | 18.9%).
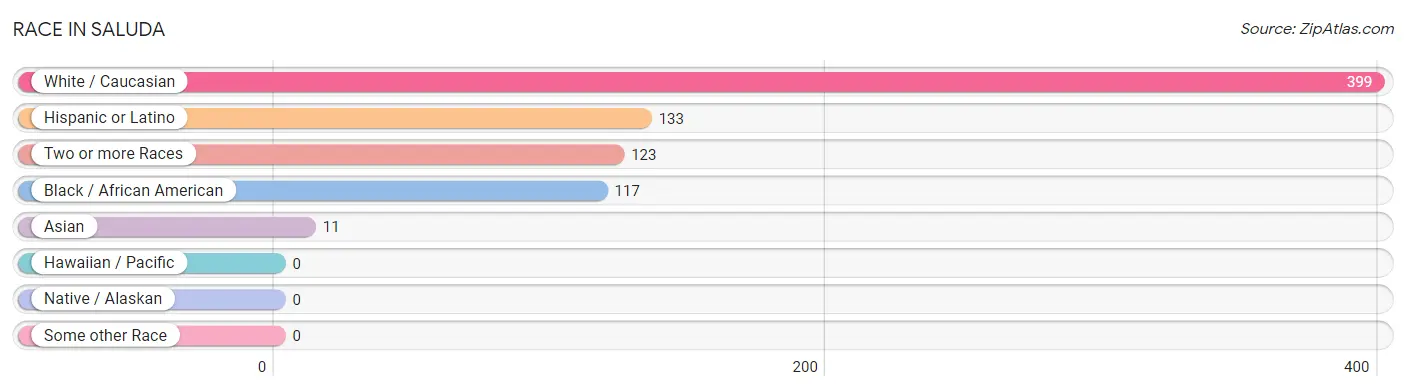
| Race | # Population | % Population |
| Asian | 11 | 1.7% |
| Black / African American | 117 | 18.0% |
| Hawaiian / Pacific | 0 | 0.0% |
| Hispanic or Latino | 133 | 20.5% |
| Native / Alaskan | 0 | 0.0% |
| White / Caucasian | 399 | 61.4% |
| Two or more Races | 123 | 18.9% |
| Some other Race | 0 | 0.0% |
| Total | 650 | 100.0% |
Ancestry in Saluda
The most populous ancestries reported in Saluda are Central American (90 | 13.9%), Salvadoran (90 | 13.9%), Irish (59 | 9.1%), English (42 | 6.5%), and Scotch-Irish (37 | 5.7%), together accounting for 48.9% of all Saluda residents.
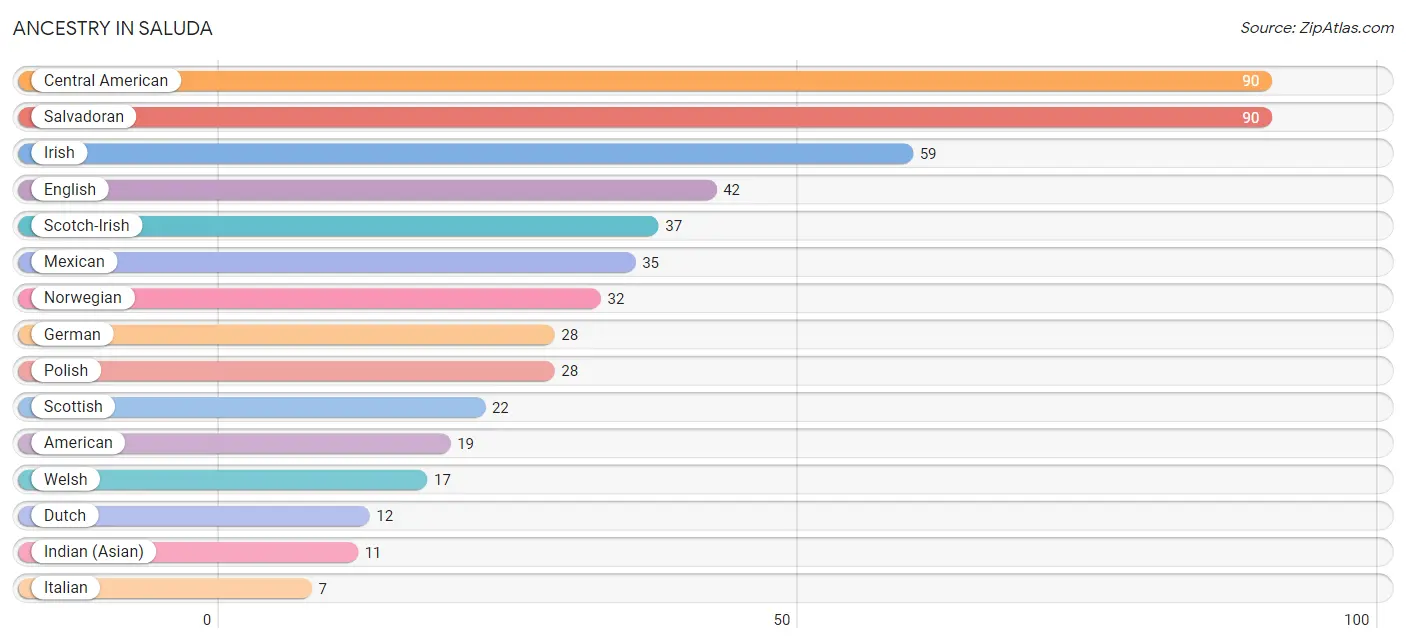
| Ancestry | # Population | % Population |
| African | 6 | 0.9% |
| American | 19 | 2.9% |
| Central American | 90 | 13.9% |
| Dutch | 12 | 1.8% |
| English | 42 | 6.5% |
| German | 28 | 4.3% |
| Indian (Asian) | 11 | 1.7% |
| Irish | 59 | 9.1% |
| Italian | 7 | 1.1% |
| Mexican | 35 | 5.4% |
| Norwegian | 32 | 4.9% |
| Polish | 28 | 4.3% |
| Salvadoran | 90 | 13.9% |
| Scotch-Irish | 37 | 5.7% |
| Scottish | 22 | 3.4% |
| Subsaharan African | 6 | 0.9% |
| Welsh | 17 | 2.6% | View All 17 Rows |
Immigrants in Saluda
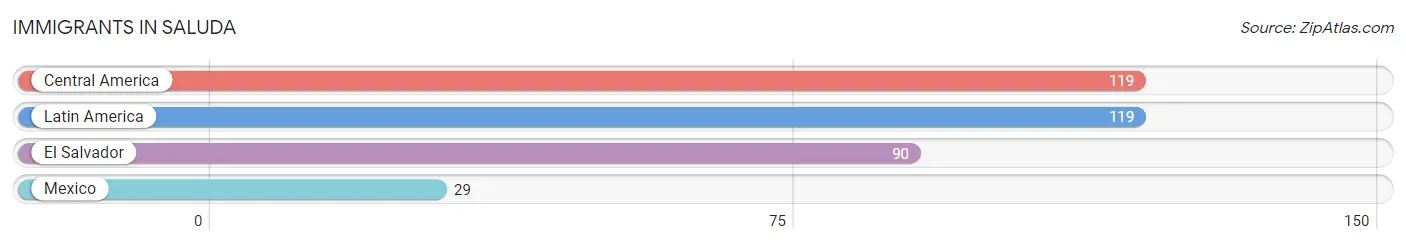
The most numerous immigrant groups reported in Saluda came from Central America (119 | 18.3%), Latin America (119 | 18.3%), El Salvador (90 | 13.9%), and Mexico (29 | 4.5%), together accounting for 54.9% of all Saluda residents.
| Immigration Origin | # Population | % Population |
| Central America | 119 | 18.3% |
| El Salvador | 90 | 13.9% |
| Latin America | 119 | 18.3% |
| Mexico | 29 | 4.5% | View All 4 Rows |
Sex and Age in Saluda
Sex and Age in Saluda
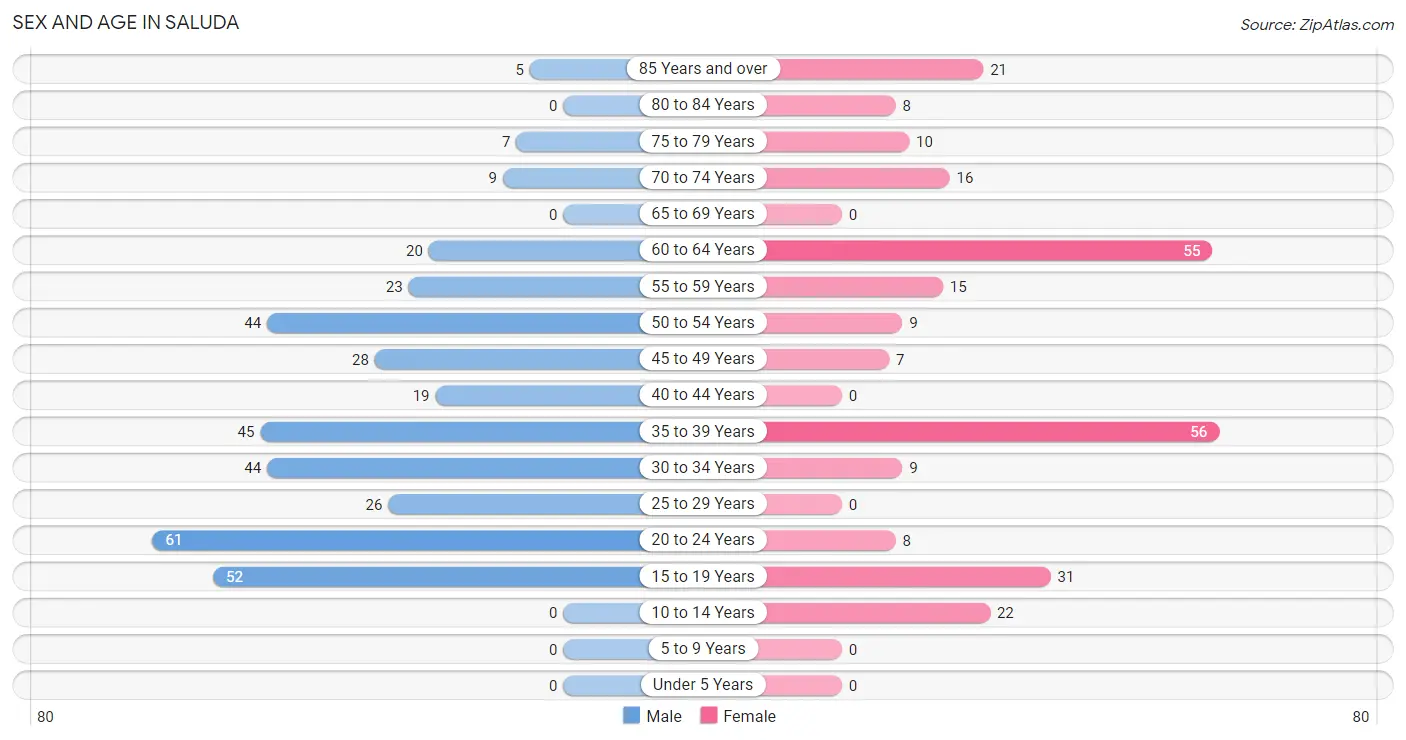
The most populous age groups in Saluda are 20 to 24 Years (61 | 15.9%) for men and 35 to 39 Years (56 | 21.0%) for women.
| Age Bracket | Male | Female |
| Under 5 Years | 0 (0.0%) | 0 (0.0%) |
| 5 to 9 Years | 0 (0.0%) | 0 (0.0%) |
| 10 to 14 Years | 0 (0.0%) | 22 (8.2%) |
| 15 to 19 Years | 52 (13.6%) | 31 (11.6%) |
| 20 to 24 Years | 61 (15.9%) | 8 (3.0%) |
| 25 to 29 Years | 26 (6.8%) | 0 (0.0%) |
| 30 to 34 Years | 44 (11.5%) | 9 (3.4%) |
| 35 to 39 Years | 45 (11.7%) | 56 (21.0%) |
| 40 to 44 Years | 19 (5.0%) | 0 (0.0%) |
| 45 to 49 Years | 28 (7.3%) | 7 (2.6%) |
| 50 to 54 Years | 44 (11.5%) | 9 (3.4%) |
| 55 to 59 Years | 23 (6.0%) | 15 (5.6%) |
| 60 to 64 Years | 20 (5.2%) | 55 (20.6%) |
| 65 to 69 Years | 0 (0.0%) | 0 (0.0%) |
| 70 to 74 Years | 9 (2.4%) | 16 (6.0%) |
| 75 to 79 Years | 7 (1.8%) | 10 (3.7%) |
| 80 to 84 Years | 0 (0.0%) | 8 (3.0%) |
| 85 Years and over | 5 (1.3%) | 21 (7.9%) |
| Total | 383 (100.0%) | 267 (100.0%) |
Families and Households in Saluda
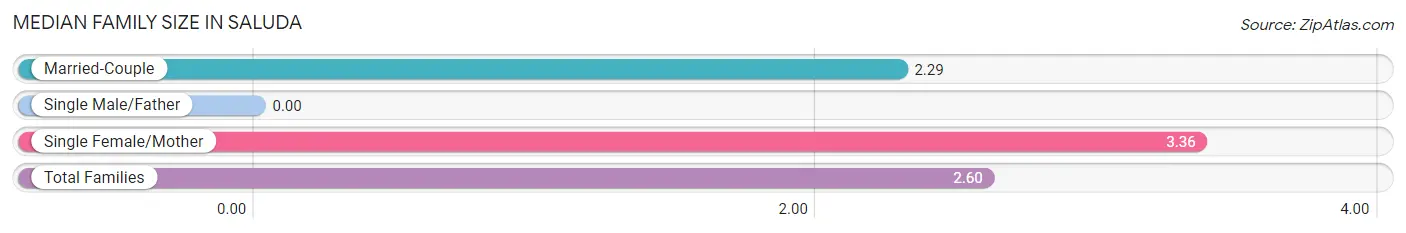
Median Family Size in Saluda
| Family Type | # Families | Family Size |
| Married-Couple | 89 (71.2%) | 2.29 |
| Single Male/Father | 0 (0.0%) | - |
| Single Female/Mother | 36 (28.8%) | 3.36 |
| Total Families | 125 (100.0%) | 2.60 |
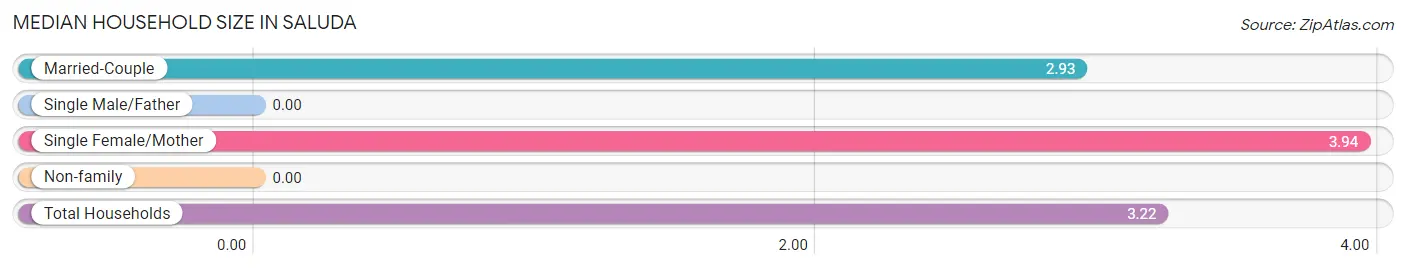
Median Household Size in Saluda
| Household Type | # Households | Household Size |
| Married-Couple | 89 (71.2%) | 2.93 |
| Single Male/Father | 0 (0.0%) | - |
| Single Female/Mother | 36 (28.8%) | 3.94 |
| Non-family | 0 (0.0%) | - |
| Total Households | 125 (100.0%) | 3.22 |
Household Size by Marriage Status in Saluda
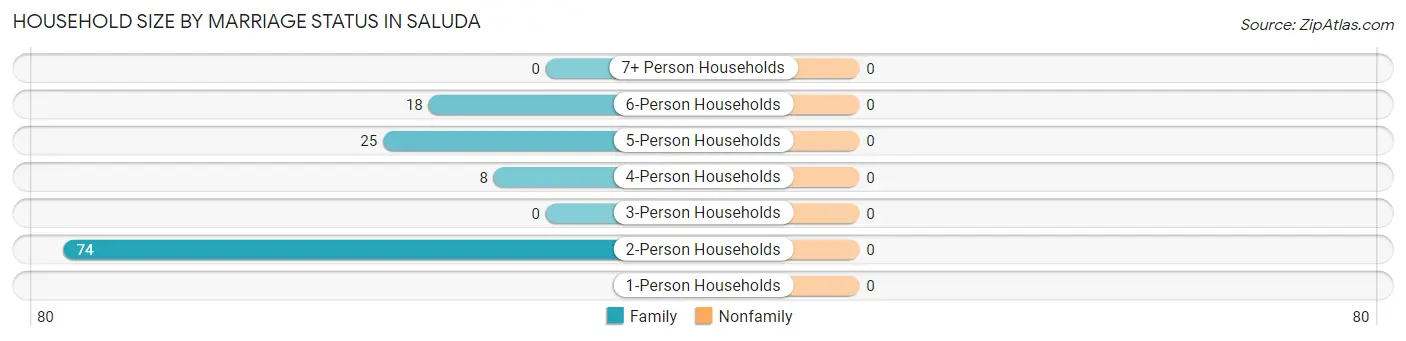
| Household Size | Family Households | Nonfamily Households |
| 1-Person Households | - | 0 (0.0%) |
| 2-Person Households | 74 (59.2%) | 0 (0.0%) |
| 3-Person Households | 0 (0.0%) | 0 (0.0%) |
| 4-Person Households | 8 (6.4%) | 0 (0.0%) |
| 5-Person Households | 25 (20.0%) | 0 (0.0%) |
| 6-Person Households | 18 (14.4%) | 0 (0.0%) |
| 7+ Person Households | 0 (0.0%) | 0 (0.0%) |
| Total | 125 (100.0%) | 0 (0.0%) |
Female Fertility in Saluda
Fertility by Age in Saluda
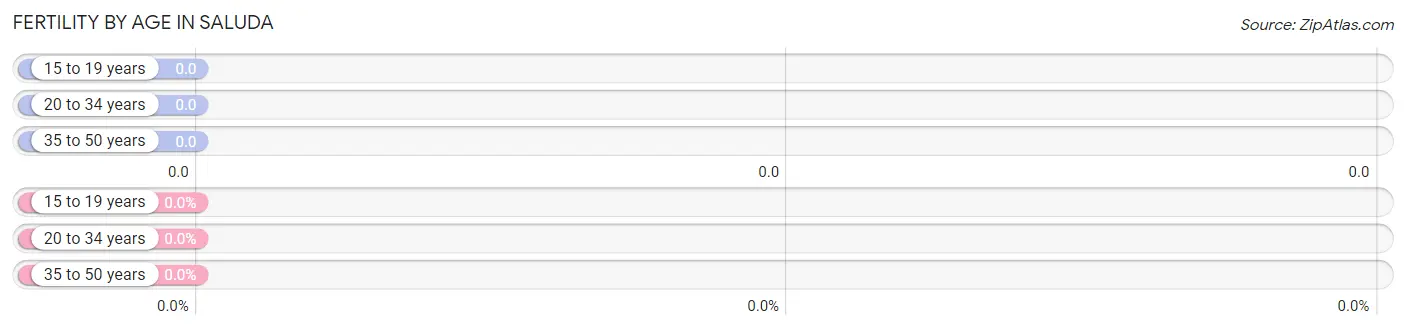
| Age Bracket | Women with Births | Births / 1,000 Women |
| 15 to 19 years | 0 (0.0%) | 0.0 |
| 20 to 34 years | 0 (0.0%) | 0.0 |
| 35 to 50 years | 0 (0.0%) | 0.0 |
| Total | 0 (0.0%) | 0.0 |
Fertility by Age by Marriage Status in Saluda
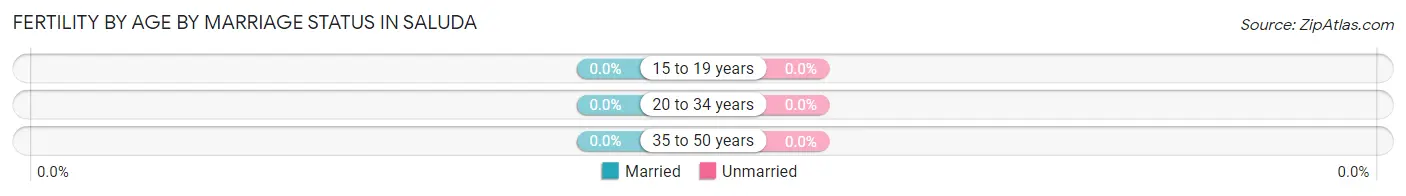
| Age Bracket | Married | Unmarried |
| 15 to 19 years | 0 (0.0%) | 0 (0.0%) |
| 20 to 34 years | 0 (0.0%) | 0 (0.0%) |
| 35 to 50 years | 0 (0.0%) | 0 (0.0%) |
| Total | 0 (0.0%) | 0 (0.0%) |
Fertility by Education in Saluda
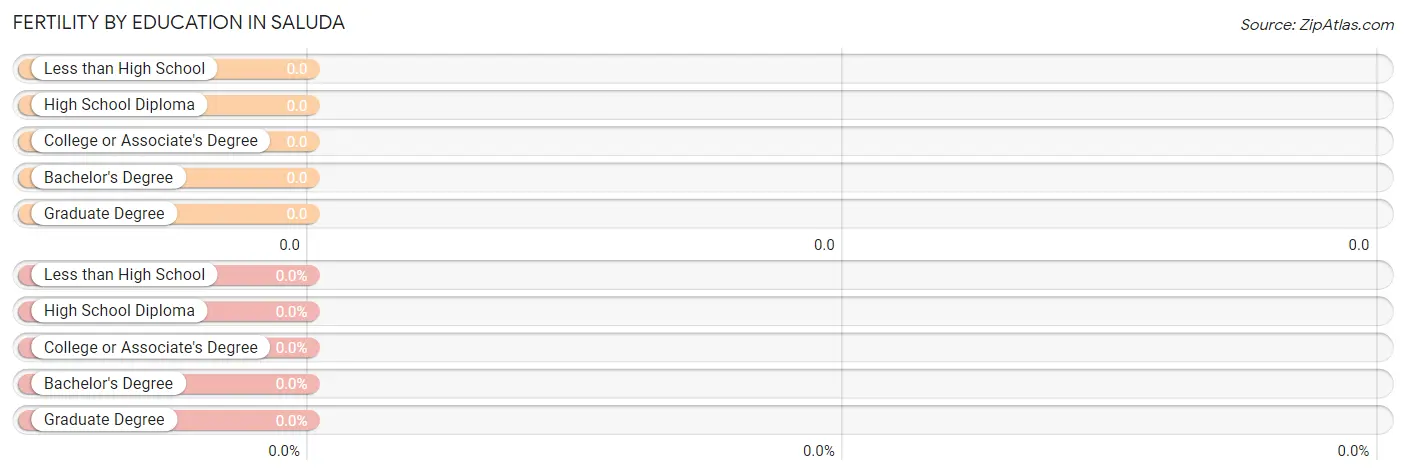
| Educational Attainment | Women with Births | Births / 1,000 Women |
| Less than High School | 0 (0.0%) | 0.0 |
| High School Diploma | 0 (0.0%) | 0.0 |
| College or Associate's Degree | 0 (0.0%) | 0.0 |
| Bachelor's Degree | 0 (0.0%) | 0.0 |
| Graduate Degree | 0 (0.0%) | 0.0 |
| Total | 0 (0.0%) | 0.0 |
Fertility by Education by Marriage Status in Saluda
| Educational Attainment | Married | Unmarried |
| Less than High School | 0 (0.0%) | 0 (0.0%) |
| High School Diploma | 0 (0.0%) | 0 (0.0%) |
| College or Associate's Degree | 0 (0.0%) | 0 (0.0%) |
| Bachelor's Degree | 0 (0.0%) | 0 (0.0%) |
| Graduate Degree | 0 (0.0%) | 0 (0.0%) |
| Total | 0 (0.0%) | 0 (0.0%) |
Employment Characteristics in Saluda
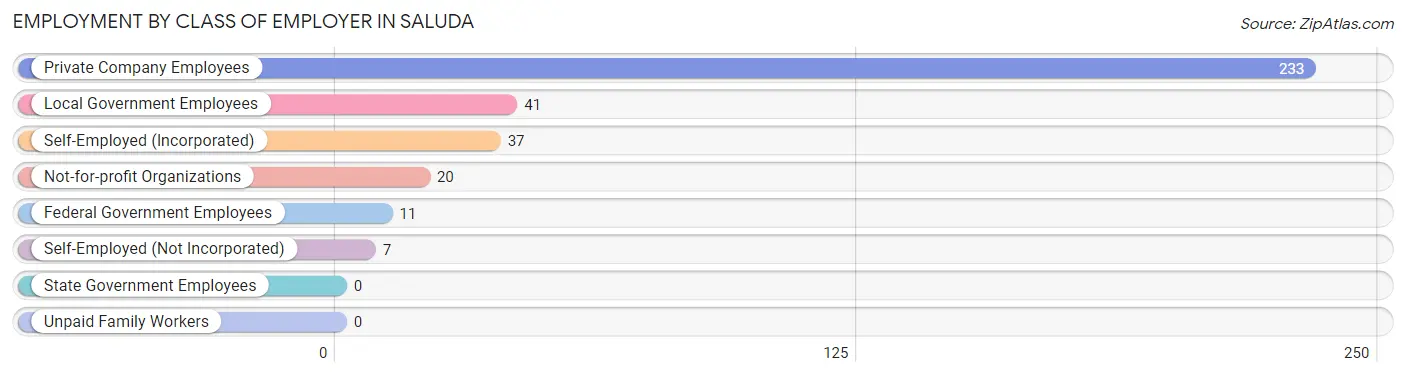
Employment by Class of Employer in Saluda
Among the 349 employed individuals in Saluda, private company employees (233 | 66.8%), local government employees (41 | 11.7%), and self-employed (incorporated) (37 | 10.6%) make up the most common classes of employment.
| Employer Class | # Employees | % Employees |
| Private Company Employees | 233 | 66.8% |
| Self-Employed (Incorporated) | 37 | 10.6% |
| Self-Employed (Not Incorporated) | 7 | 2.0% |
| Not-for-profit Organizations | 20 | 5.7% |
| Local Government Employees | 41 | 11.7% |
| State Government Employees | 0 | 0.0% |
| Federal Government Employees | 11 | 3.2% |
| Unpaid Family Workers | 0 | 0.0% |
| Total | 349 | 100.0% |
Employment Status by Age in Saluda
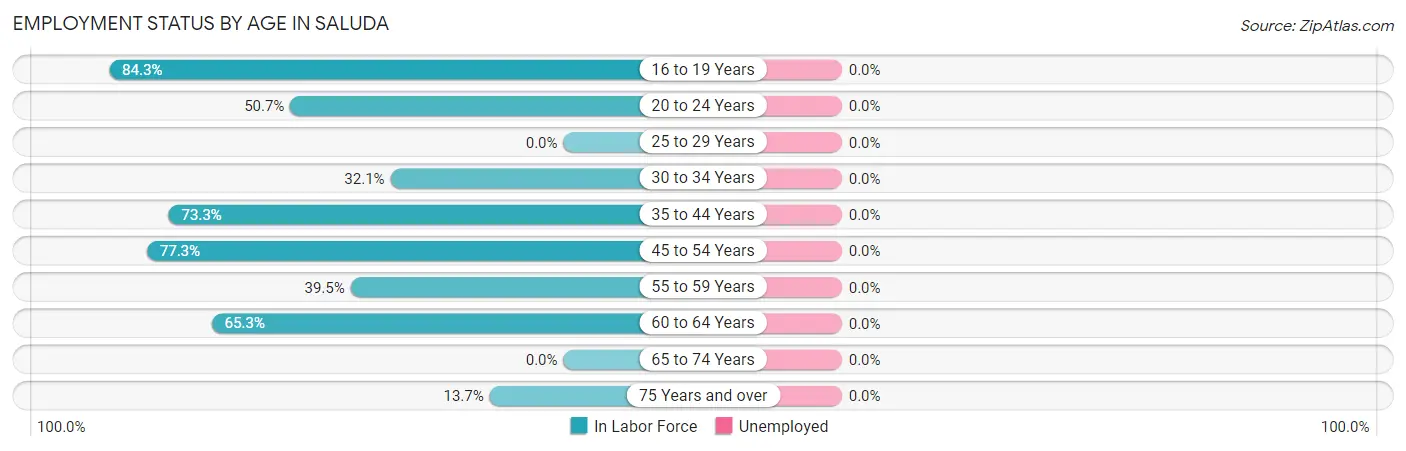
| Age Bracket | In Labor Force | Unemployed |
| 16 to 19 Years | 70 (84.3%) | 0 (0.0%) |
| 20 to 24 Years | 35 (50.7%) | 0 (0.0%) |
| 25 to 29 Years | 0 (0.0%) | 0 (0.0%) |
| 30 to 34 Years | 17 (32.1%) | 0 (0.0%) |
| 35 to 44 Years | 88 (73.3%) | 0 (0.0%) |
| 45 to 54 Years | 68 (77.3%) | 0 (0.0%) |
| 55 to 59 Years | 15 (39.5%) | 0 (0.0%) |
| 60 to 64 Years | 49 (65.3%) | 0 (0.0%) |
| 65 to 74 Years | 0 (0.0%) | 0 (0.0%) |
| 75 Years and over | 7 (13.7%) | 0 (0.0%) |
| Total | 349 (55.6%) | 0 (0.0%) |
Employment Status by Educational Attainment in Saluda
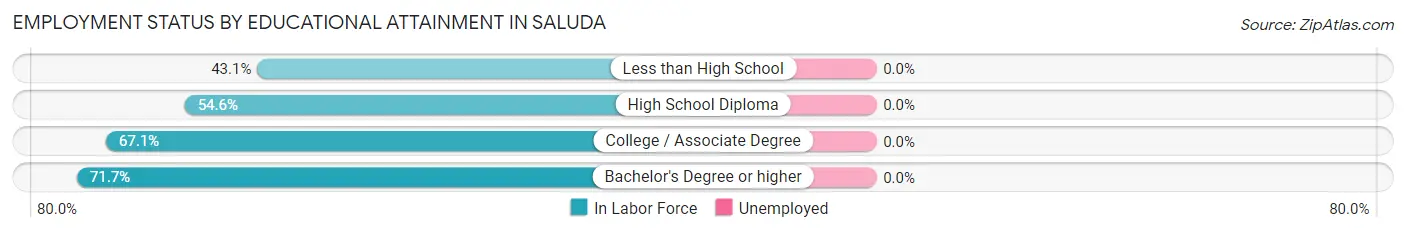
| Educational Attainment | In Labor Force | Unemployed |
| Less than High School | 25 (43.1%) | 0 (0.0%) |
| High School Diploma | 95 (54.6%) | 0 (0.0%) |
| College / Associate Degree | 51 (67.1%) | 0 (0.0%) |
| Bachelor's Degree or higher | 66 (71.7%) | 0 (0.0%) |
| Total | 237 (59.3%) | 0 (0.0%) |
Employment Occupations by Sex in Saluda
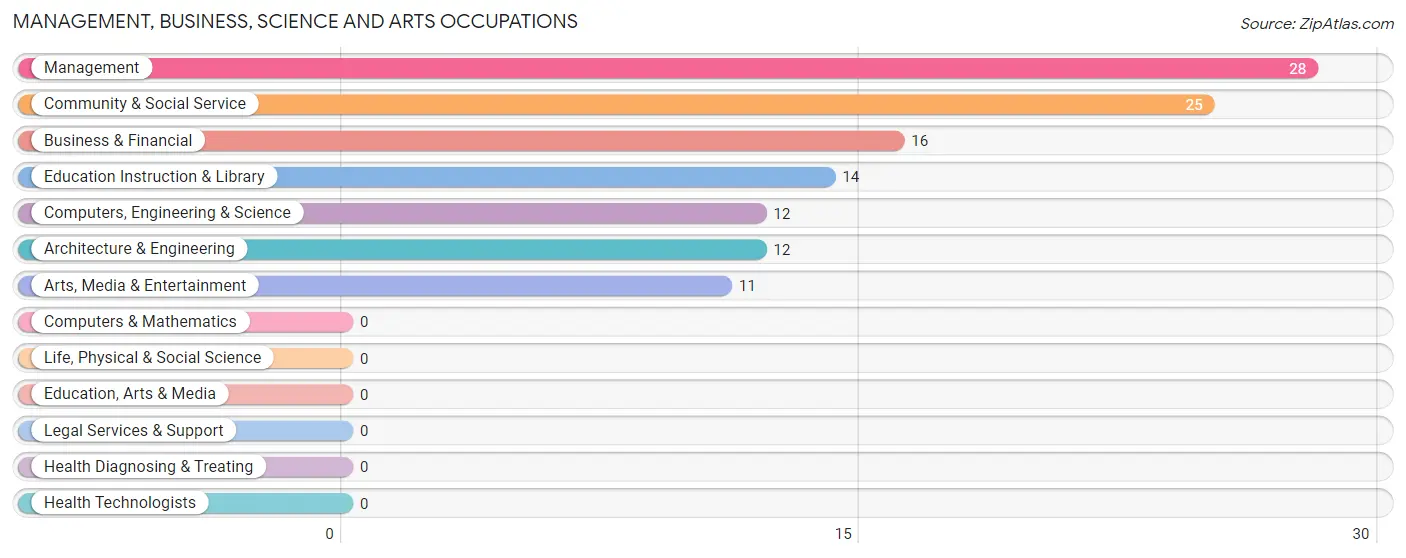
Management, Business, Science and Arts Occupations
The most common Management, Business, Science and Arts occupations in Saluda are Management (28 | 8.0%), Community & Social Service (25 | 7.2%), Business & Financial (16 | 4.6%), Education Instruction & Library (14 | 4.0%), and Computers, Engineering & Science (12 | 3.4%).
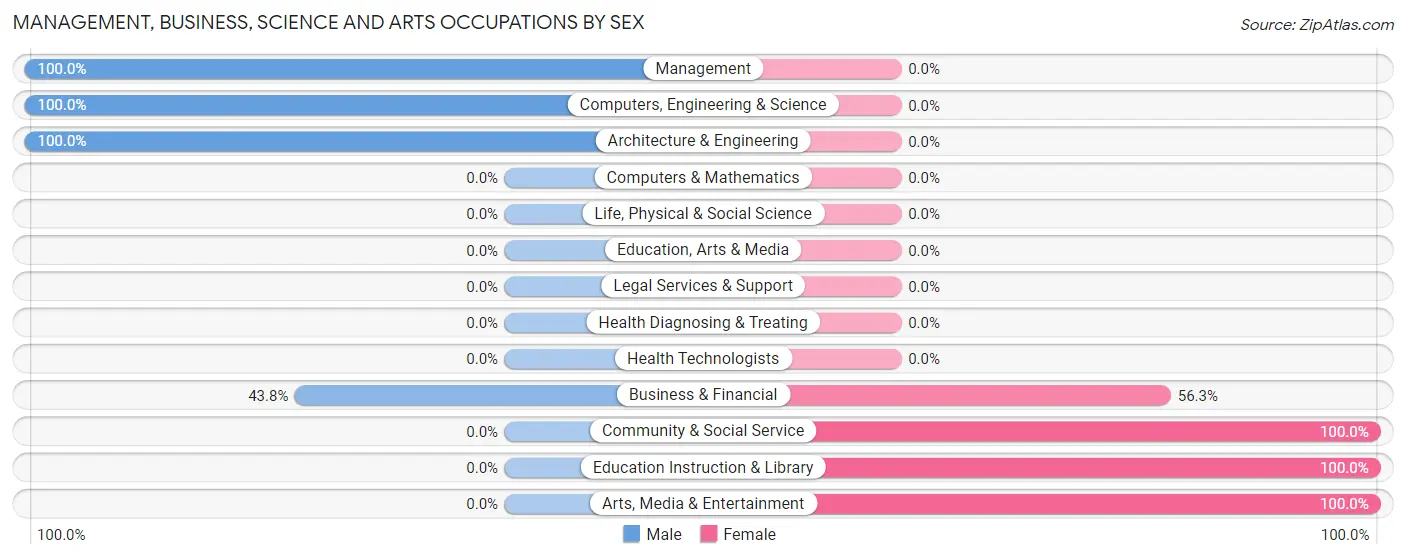
Management, Business, Science and Arts Occupations by Sex
Within the Management, Business, Science and Arts occupations in Saluda, the most male-oriented occupations are Management (100.0%), Computers, Engineering & Science (100.0%), and Architecture & Engineering (100.0%), while the most female-oriented occupations are Community & Social Service (100.0%), Education Instruction & Library (100.0%), and Arts, Media & Entertainment (100.0%).
| Occupation | Male | Female |
| Management | 28 (100.0%) | 0 (0.0%) |
| Business & Financial | 7 (43.8%) | 9 (56.2%) |
| Computers, Engineering & Science | 12 (100.0%) | 0 (0.0%) |
| Computers & Mathematics | 0 (0.0%) | 0 (0.0%) |
| Architecture & Engineering | 12 (100.0%) | 0 (0.0%) |
| Life, Physical & Social Science | 0 (0.0%) | 0 (0.0%) |
| Community & Social Service | 0 (0.0%) | 25 (100.0%) |
| Education, Arts & Media | 0 (0.0%) | 0 (0.0%) |
| Legal Services & Support | 0 (0.0%) | 0 (0.0%) |
| Education Instruction & Library | 0 (0.0%) | 14 (100.0%) |
| Arts, Media & Entertainment | 0 (0.0%) | 11 (100.0%) |
| Health Diagnosing & Treating | 0 (0.0%) | 0 (0.0%) |
| Health Technologists | 0 (0.0%) | 0 (0.0%) |
| Total (Category) | 47 (58.0%) | 34 (42.0%) |
| Total (Overall) | 198 (56.7%) | 151 (43.3%) |
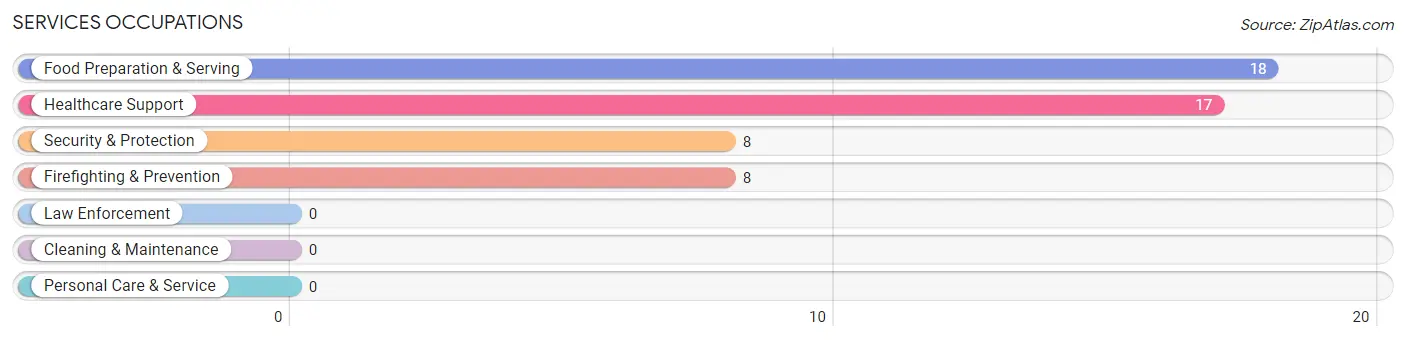
Services Occupations
The most common Services occupations in Saluda are Food Preparation & Serving (18 | 5.2%), Healthcare Support (17 | 4.9%), Security & Protection (8 | 2.3%), and Firefighting & Prevention (8 | 2.3%).
Services Occupations by Sex
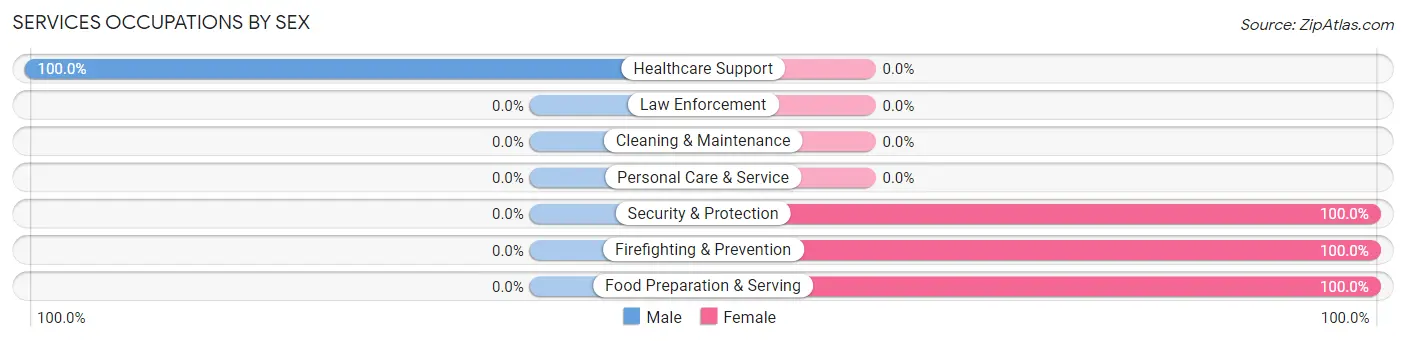
| Occupation | Male | Female |
| Healthcare Support | 17 (100.0%) | 0 (0.0%) |
| Security & Protection | 0 (0.0%) | 8 (100.0%) |
| Firefighting & Prevention | 0 (0.0%) | 8 (100.0%) |
| Law Enforcement | 0 (0.0%) | 0 (0.0%) |
| Food Preparation & Serving | 0 (0.0%) | 18 (100.0%) |
| Cleaning & Maintenance | 0 (0.0%) | 0 (0.0%) |
| Personal Care & Service | 0 (0.0%) | 0 (0.0%) |
| Total (Category) | 17 (39.5%) | 26 (60.5%) |
| Total (Overall) | 198 (56.7%) | 151 (43.3%) |
Sales and Office Occupations
The most common Sales and Office occupations in Saluda are Office & Administration (52 | 14.9%), and Sales & Related (27 | 7.7%).
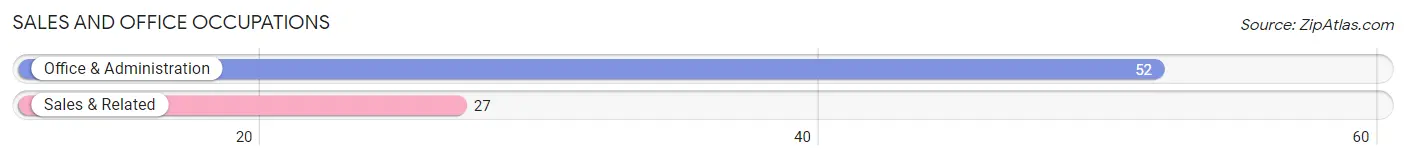
Sales and Office Occupations by Sex
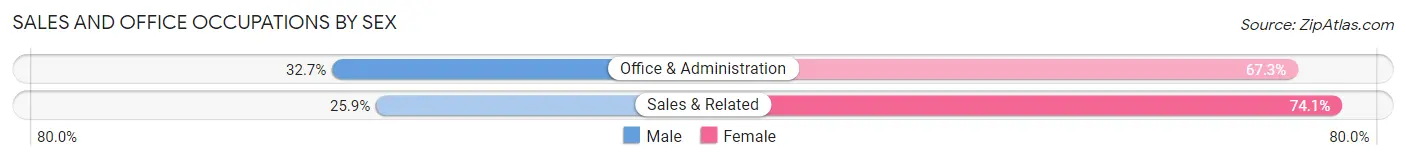
| Occupation | Male | Female |
| Sales & Related | 7 (25.9%) | 20 (74.1%) |
| Office & Administration | 17 (32.7%) | 35 (67.3%) |
| Total (Category) | 24 (30.4%) | 55 (69.6%) |
| Total (Overall) | 198 (56.7%) | 151 (43.3%) |
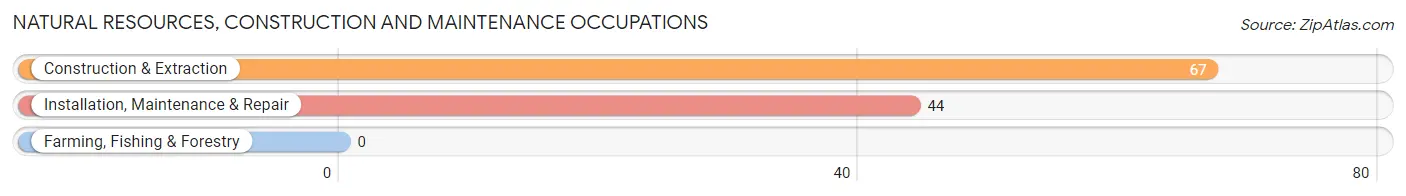
Natural Resources, Construction and Maintenance Occupations
The most common Natural Resources, Construction and Maintenance occupations in Saluda are Construction & Extraction (67 | 19.2%), and Installation, Maintenance & Repair (44 | 12.6%).
Natural Resources, Construction and Maintenance Occupations by Sex
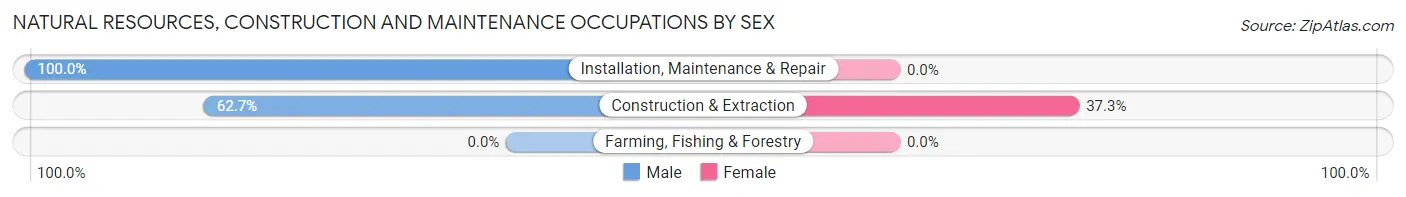
| Occupation | Male | Female |
| Farming, Fishing & Forestry | 0 (0.0%) | 0 (0.0%) |
| Construction & Extraction | 42 (62.7%) | 25 (37.3%) |
| Installation, Maintenance & Repair | 44 (100.0%) | 0 (0.0%) |
| Total (Category) | 86 (77.5%) | 25 (22.5%) |
| Total (Overall) | 198 (56.7%) | 151 (43.3%) |
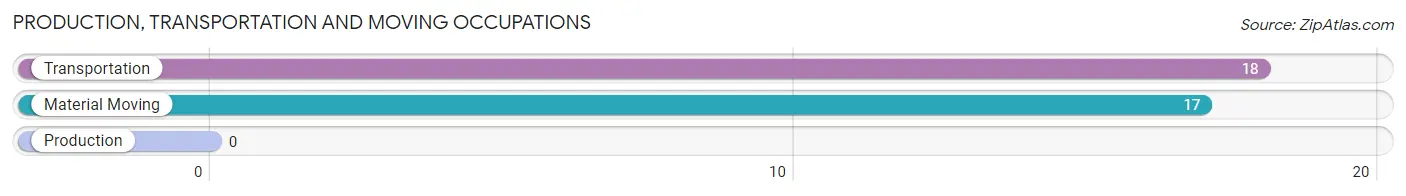
Production, Transportation and Moving Occupations
The most common Production, Transportation and Moving occupations in Saluda are Transportation (18 | 5.2%), and Material Moving (17 | 4.9%).
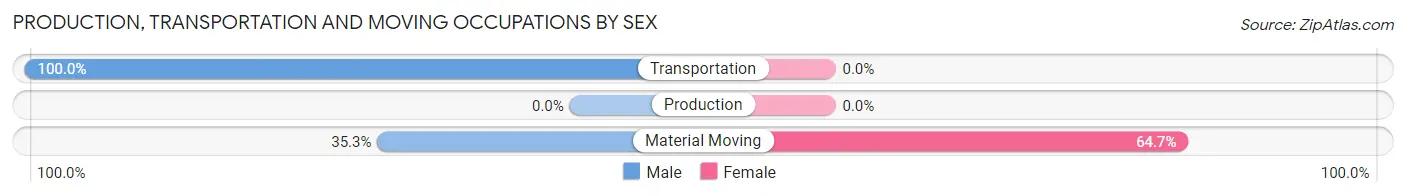
Production, Transportation and Moving Occupations by Sex
| Occupation | Male | Female |
| Production | 0 (0.0%) | 0 (0.0%) |
| Transportation | 18 (100.0%) | 0 (0.0%) |
| Material Moving | 6 (35.3%) | 11 (64.7%) |
| Total (Category) | 24 (68.6%) | 11 (31.4%) |
| Total (Overall) | 198 (56.7%) | 151 (43.3%) |
Employment Industries by Sex in Saluda
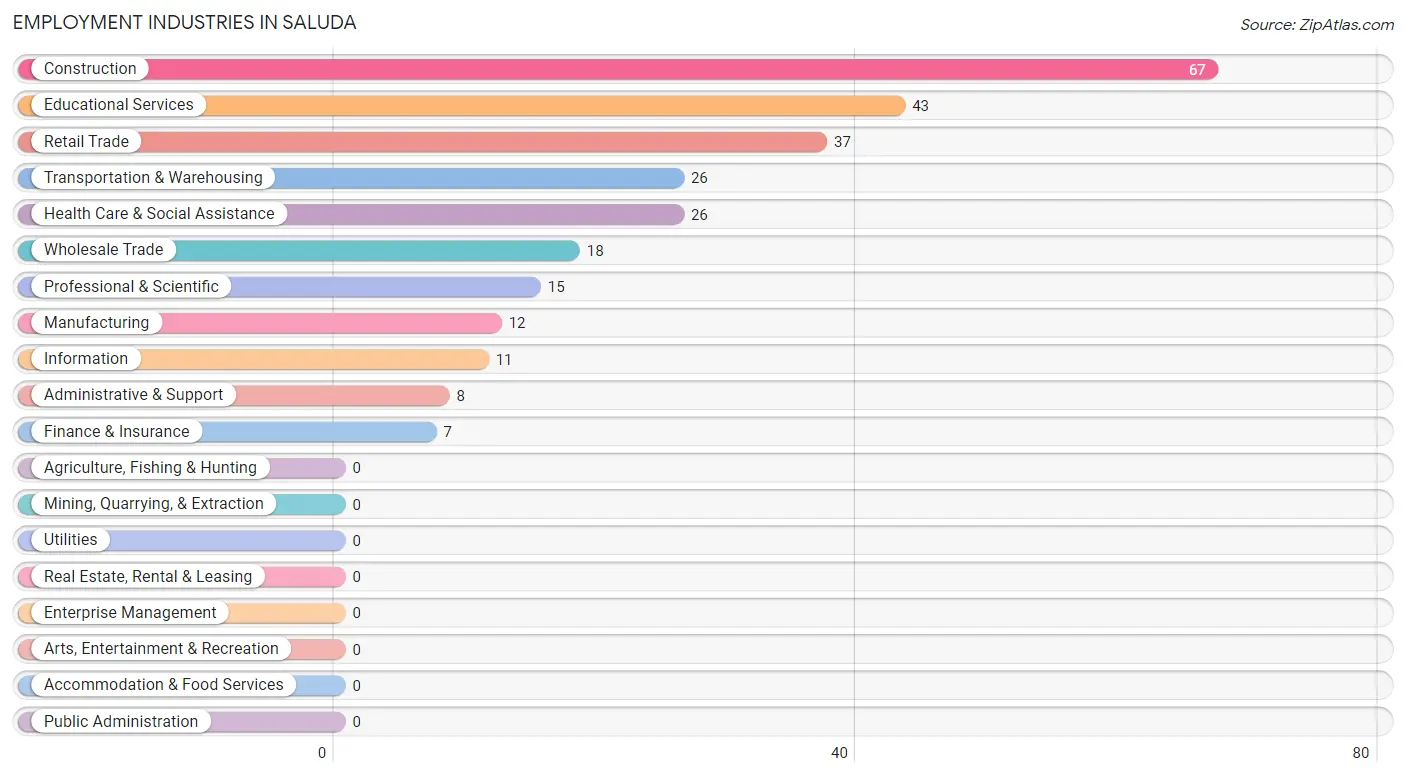
Employment Industries in Saluda
The major employment industries in Saluda include Construction (67 | 19.2%), Educational Services (43 | 12.3%), Retail Trade (37 | 10.6%), Transportation & Warehousing (26 | 7.4%), and Health Care & Social Assistance (26 | 7.4%).
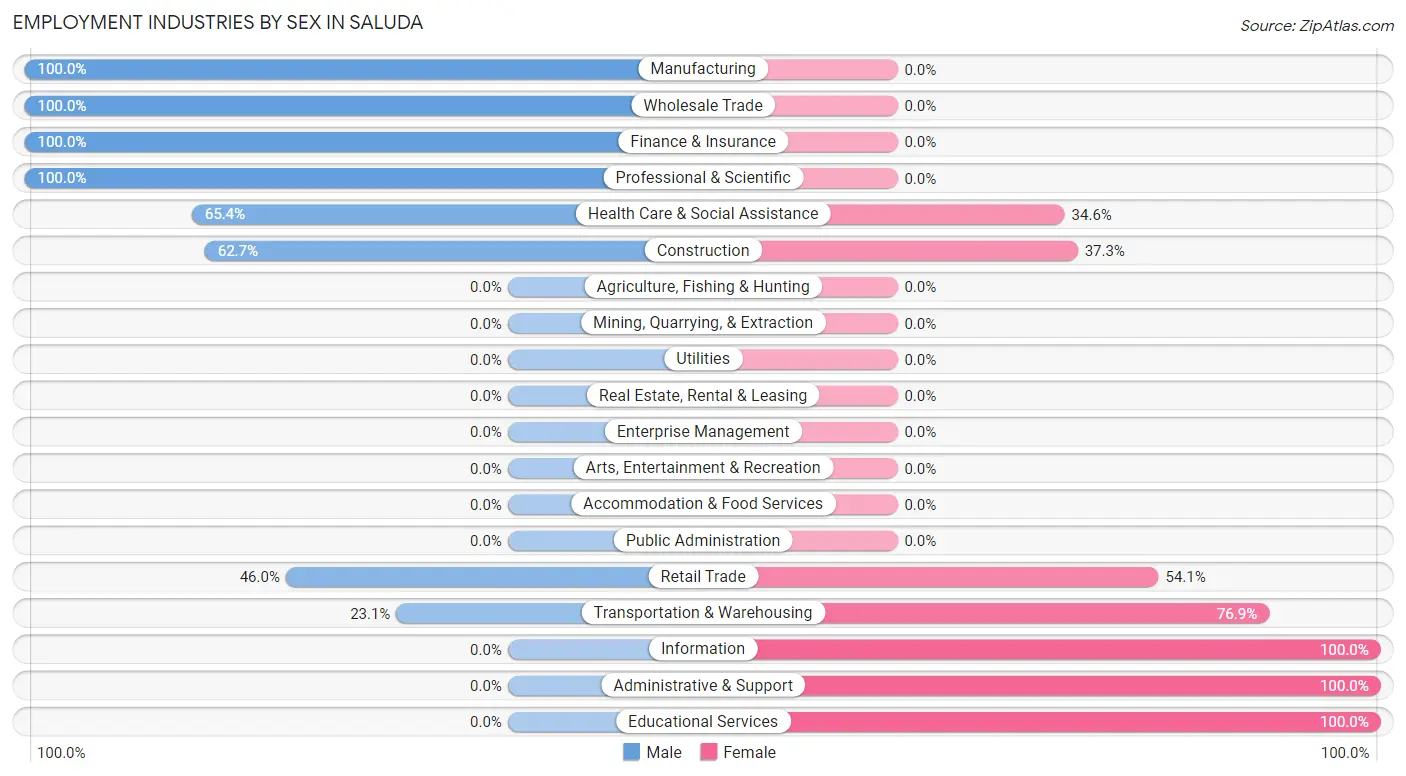
Employment Industries by Sex in Saluda
The Saluda industries that see more men than women are Manufacturing (100.0%), Wholesale Trade (100.0%), and Finance & Insurance (100.0%), whereas the industries that tend to have a higher number of women are Information (100.0%), Administrative & Support (100.0%), and Educational Services (100.0%).
| Industry | Male | Female |
| Agriculture, Fishing & Hunting | 0 (0.0%) | 0 (0.0%) |
| Mining, Quarrying, & Extraction | 0 (0.0%) | 0 (0.0%) |
| Construction | 42 (62.7%) | 25 (37.3%) |
| Manufacturing | 12 (100.0%) | 0 (0.0%) |
| Wholesale Trade | 18 (100.0%) | 0 (0.0%) |
| Retail Trade | 17 (46.0%) | 20 (54.0%) |
| Transportation & Warehousing | 6 (23.1%) | 20 (76.9%) |
| Utilities | 0 (0.0%) | 0 (0.0%) |
| Information | 0 (0.0%) | 11 (100.0%) |
| Finance & Insurance | 7 (100.0%) | 0 (0.0%) |
| Real Estate, Rental & Leasing | 0 (0.0%) | 0 (0.0%) |
| Professional & Scientific | 15 (100.0%) | 0 (0.0%) |
| Enterprise Management | 0 (0.0%) | 0 (0.0%) |
| Administrative & Support | 0 (0.0%) | 8 (100.0%) |
| Educational Services | 0 (0.0%) | 43 (100.0%) |
| Health Care & Social Assistance | 17 (65.4%) | 9 (34.6%) |
| Arts, Entertainment & Recreation | 0 (0.0%) | 0 (0.0%) |
| Accommodation & Food Services | 0 (0.0%) | 0 (0.0%) |
| Public Administration | 0 (0.0%) | 0 (0.0%) |
| Total | 198 (56.7%) | 151 (43.3%) |
Education in Saluda
School Enrollment in Saluda
The most common levels of schooling among the 101 students in Saluda are college / undergraduate (54 | 53.5%), elementary school (22 | 21.8%), and high school (17 | 16.8%).
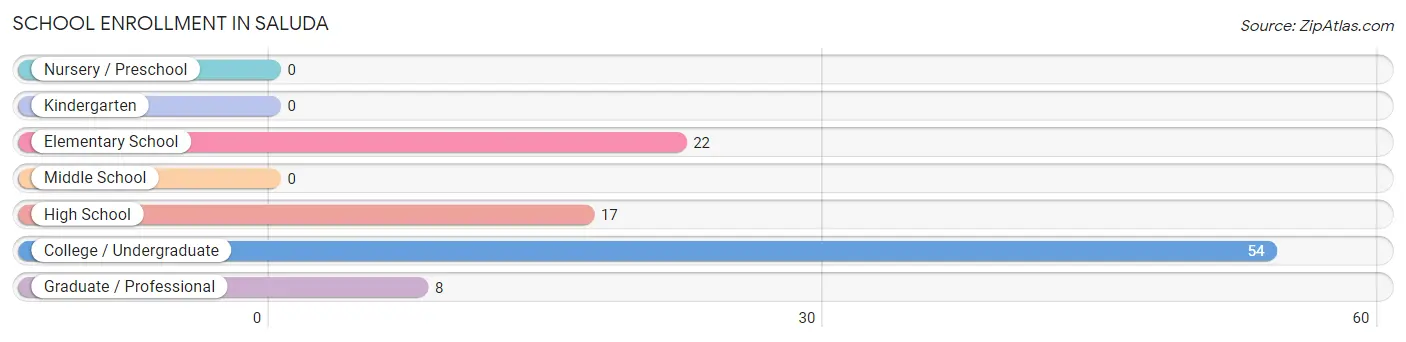
| School Level | # Students | % Students |
| Nursery / Preschool | 0 | 0.0% |
| Kindergarten | 0 | 0.0% |
| Elementary School | 22 | 21.8% |
| Middle School | 0 | 0.0% |
| High School | 17 | 16.8% |
| College / Undergraduate | 54 | 53.5% |
| Graduate / Professional | 8 | 7.9% |
| Total | 101 | 100.0% |
School Enrollment by Age by Funding Source in Saluda
Out of a total of 101 students who are enrolled in schools in Saluda, 25 (24.8%) attend a private institution, while the remaining 76 (75.2%) are enrolled in public schools. The age group of 25 to 34 year olds has the highest likelihood of being enrolled in private schools, with 8 (100.0% in the age bracket) enrolled. Conversely, the age group of 10 to 14 year olds has the lowest likelihood of being enrolled in a private school, with 22 (100.0% in the age bracket) attending a public institution.
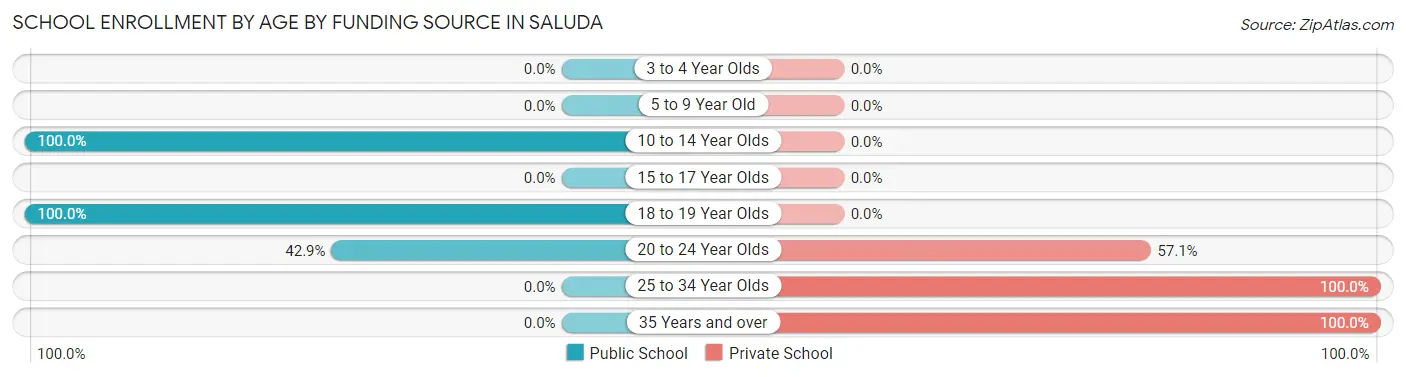
| Age Bracket | Public School | Private School |
| 3 to 4 Year Olds | 0 (0.0%) | 0 (0.0%) |
| 5 to 9 Year Old | 0 (0.0%) | 0 (0.0%) |
| 10 to 14 Year Olds | 22 (100.0%) | 0 (0.0%) |
| 15 to 17 Year Olds | 0 (0.0%) | 0 (0.0%) |
| 18 to 19 Year Olds | 48 (100.0%) | 0 (0.0%) |
| 20 to 24 Year Olds | 6 (42.9%) | 8 (57.1%) |
| 25 to 34 Year Olds | 0 (0.0%) | 8 (100.0%) |
| 35 Years and over | 0 (0.0%) | 9 (100.0%) |
| Total | 76 (75.2%) | 25 (24.8%) |
Educational Attainment by Field of Study in Saluda
Education (31 | 28.2%), psychology (21 | 19.1%), arts & humanities (20 | 18.2%), business (17 | 15.4%), and visual & performing arts (15 | 13.6%) are the most common fields of study among 110 individuals in Saluda who have obtained a bachelor's degree or higher.
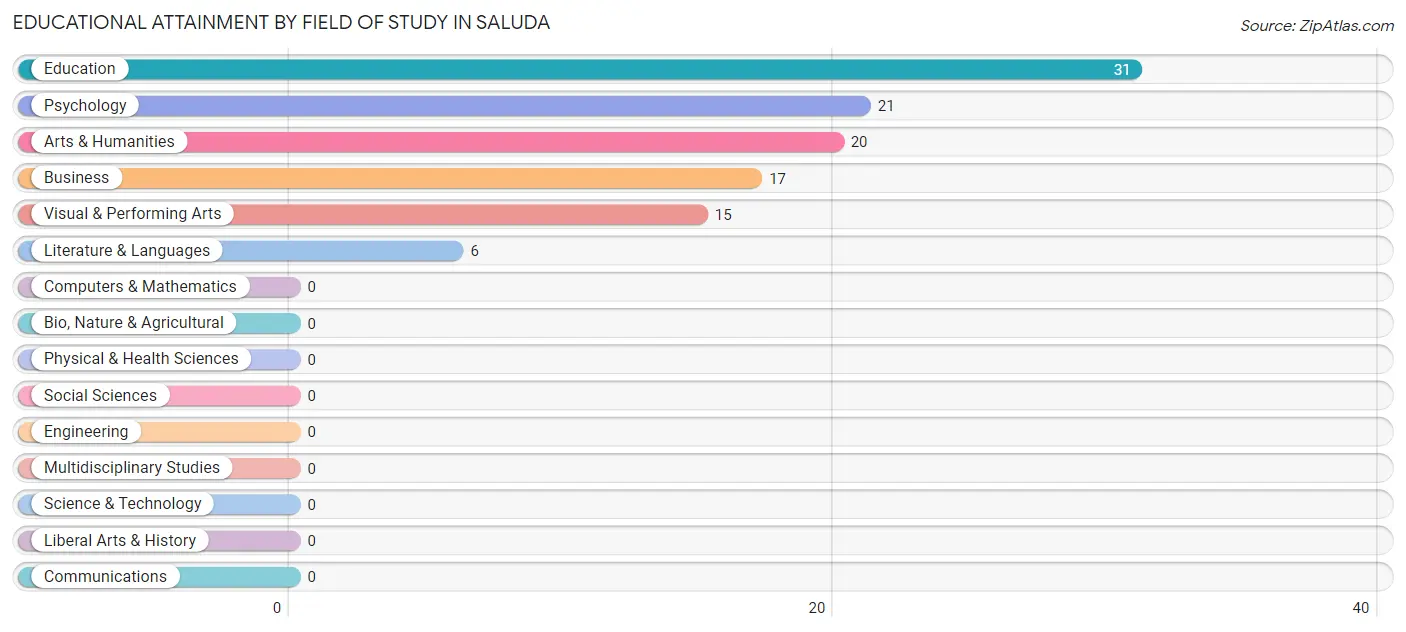
| Field of Study | # Graduates | % Graduates |
| Computers & Mathematics | 0 | 0.0% |
| Bio, Nature & Agricultural | 0 | 0.0% |
| Physical & Health Sciences | 0 | 0.0% |
| Psychology | 21 | 19.1% |
| Social Sciences | 0 | 0.0% |
| Engineering | 0 | 0.0% |
| Multidisciplinary Studies | 0 | 0.0% |
| Science & Technology | 0 | 0.0% |
| Business | 17 | 15.4% |
| Education | 31 | 28.2% |
| Literature & Languages | 6 | 5.4% |
| Liberal Arts & History | 0 | 0.0% |
| Visual & Performing Arts | 15 | 13.6% |
| Communications | 0 | 0.0% |
| Arts & Humanities | 20 | 18.2% |
| Total | 110 | 100.0% |
Transportation & Commute in Saluda
Vehicle Availability by Sex in Saluda
The most prevalent vehicle ownership categories in Saluda are males with 1 vehicle (64, accounting for 32.3%) and females with 1 vehicle (25, making up 42.4%).
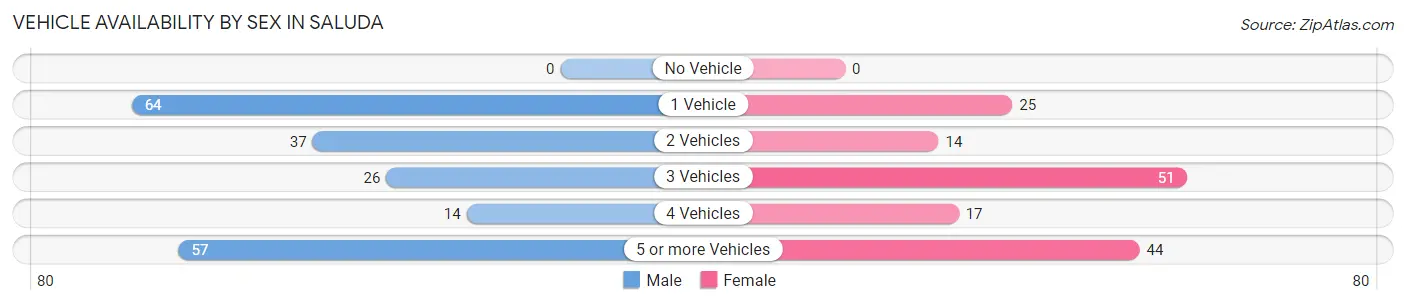
| Vehicles Available | Male | Female |
| No Vehicle | 0 (0.0%) | 0 (0.0%) |
| 1 Vehicle | 64 (32.3%) | 25 (16.6%) |
| 2 Vehicles | 37 (18.7%) | 14 (9.3%) |
| 3 Vehicles | 26 (13.1%) | 51 (33.8%) |
| 4 Vehicles | 14 (7.1%) | 17 (11.3%) |
| 5 or more Vehicles | 57 (28.8%) | 44 (29.1%) |
| Total | 198 (100.0%) | 151 (100.0%) |
Commute Time in Saluda
The most frequently occuring commute durations in Saluda are 15 to 19 minutes (71 commuters, 27.0%), 20 to 24 minutes (44 commuters, 16.7%), and 10 to 14 minutes (38 commuters, 14.4%).
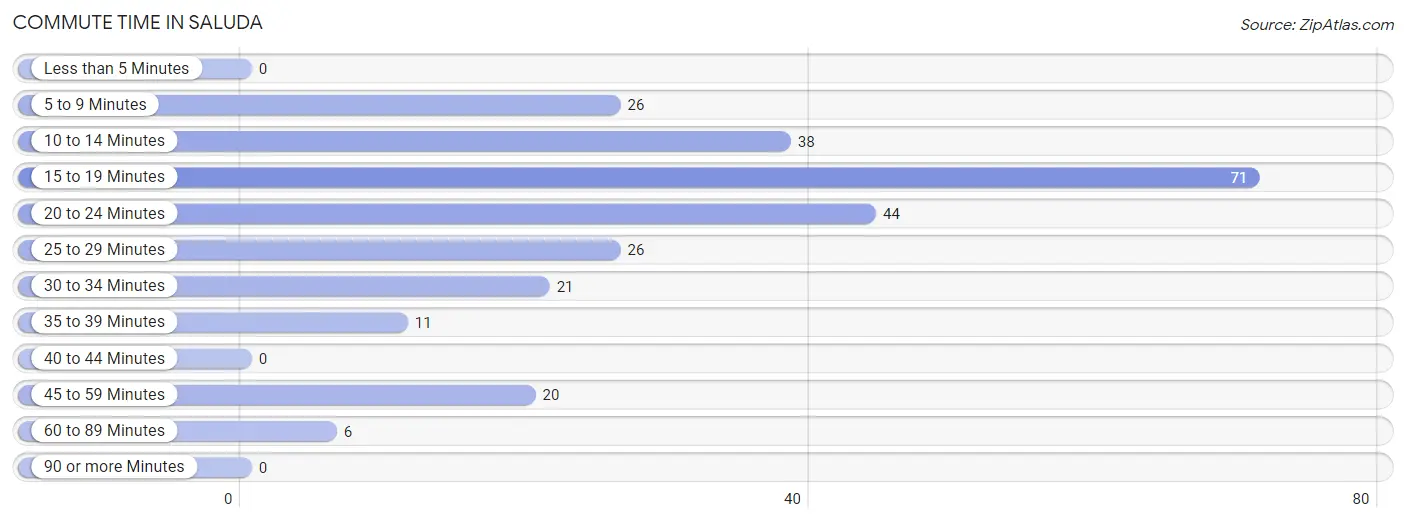
| Commute Time | # Commuters | % Commuters |
| Less than 5 Minutes | 0 | 0.0% |
| 5 to 9 Minutes | 26 | 9.9% |
| 10 to 14 Minutes | 38 | 14.4% |
| 15 to 19 Minutes | 71 | 27.0% |
| 20 to 24 Minutes | 44 | 16.7% |
| 25 to 29 Minutes | 26 | 9.9% |
| 30 to 34 Minutes | 21 | 8.0% |
| 35 to 39 Minutes | 11 | 4.2% |
| 40 to 44 Minutes | 0 | 0.0% |
| 45 to 59 Minutes | 20 | 7.6% |
| 60 to 89 Minutes | 6 | 2.3% |
| 90 or more Minutes | 0 | 0.0% |
Commute Time by Sex in Saluda
The most common commute times in Saluda are 10 to 14 minutes (38 commuters, 25.7%) for males and 15 to 19 minutes (41 commuters, 35.6%) for females.
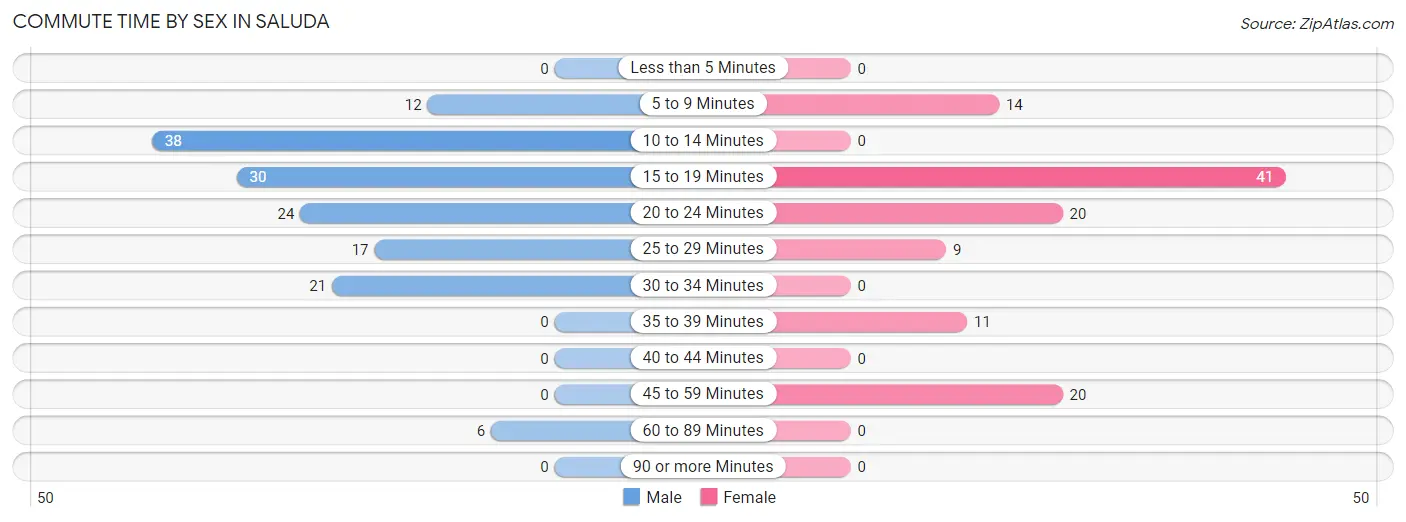
| Commute Time | Male | Female |
| Less than 5 Minutes | 0 (0.0%) | 0 (0.0%) |
| 5 to 9 Minutes | 12 (8.1%) | 14 (12.2%) |
| 10 to 14 Minutes | 38 (25.7%) | 0 (0.0%) |
| 15 to 19 Minutes | 30 (20.3%) | 41 (35.6%) |
| 20 to 24 Minutes | 24 (16.2%) | 20 (17.4%) |
| 25 to 29 Minutes | 17 (11.5%) | 9 (7.8%) |
| 30 to 34 Minutes | 21 (14.2%) | 0 (0.0%) |
| 35 to 39 Minutes | 0 (0.0%) | 11 (9.6%) |
| 40 to 44 Minutes | 0 (0.0%) | 0 (0.0%) |
| 45 to 59 Minutes | 0 (0.0%) | 20 (17.4%) |
| 60 to 89 Minutes | 6 (4.1%) | 0 (0.0%) |
| 90 or more Minutes | 0 (0.0%) | 0 (0.0%) |
Time of Departure to Work by Sex in Saluda
The most frequent times of departure to work in Saluda are 8:00 AM to 8:29 AM (38, 25.7%) for males and 7:30 AM to 7:59 AM (29, 25.2%) for females.
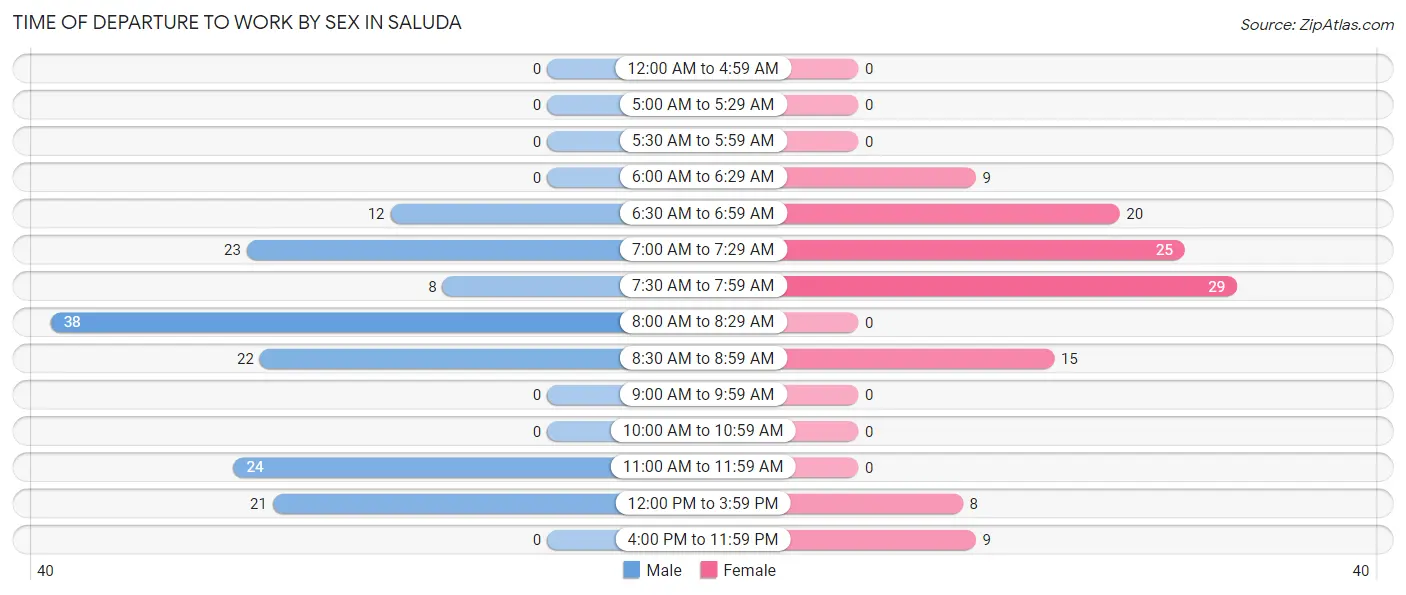
| Time of Departure | Male | Female |
| 12:00 AM to 4:59 AM | 0 (0.0%) | 0 (0.0%) |
| 5:00 AM to 5:29 AM | 0 (0.0%) | 0 (0.0%) |
| 5:30 AM to 5:59 AM | 0 (0.0%) | 0 (0.0%) |
| 6:00 AM to 6:29 AM | 0 (0.0%) | 9 (7.8%) |
| 6:30 AM to 6:59 AM | 12 (8.1%) | 20 (17.4%) |
| 7:00 AM to 7:29 AM | 23 (15.5%) | 25 (21.7%) |
| 7:30 AM to 7:59 AM | 8 (5.4%) | 29 (25.2%) |
| 8:00 AM to 8:29 AM | 38 (25.7%) | 0 (0.0%) |
| 8:30 AM to 8:59 AM | 22 (14.9%) | 15 (13.0%) |
| 9:00 AM to 9:59 AM | 0 (0.0%) | 0 (0.0%) |
| 10:00 AM to 10:59 AM | 0 (0.0%) | 0 (0.0%) |
| 11:00 AM to 11:59 AM | 24 (16.2%) | 0 (0.0%) |
| 12:00 PM to 3:59 PM | 21 (14.2%) | 8 (7.0%) |
| 4:00 PM to 11:59 PM | 0 (0.0%) | 9 (7.8%) |
| Total | 148 (100.0%) | 115 (100.0%) |
Housing Occupancy in Saluda
Occupancy by Ownership in Saluda
Of the total 125 dwellings in Saluda, owner-occupied units account for 88 (70.4%), while renter-occupied units make up 37 (29.6%).
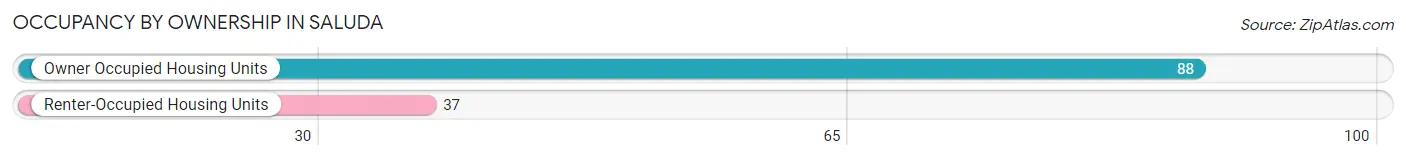
| Occupancy | # Housing Units | % Housing Units |
| Owner Occupied Housing Units | 88 | 70.4% |
| Renter-Occupied Housing Units | 37 | 29.6% |
| Total Occupied Housing Units | 125 | 100.0% |
Occupancy by Household Size in Saluda
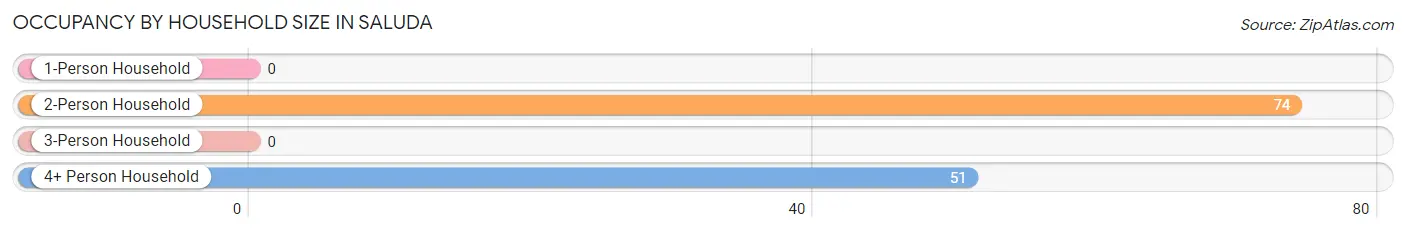
| Household Size | # Housing Units | % Housing Units |
| 1-Person Household | 0 | 0.0% |
| 2-Person Household | 74 | 59.2% |
| 3-Person Household | 0 | 0.0% |
| 4+ Person Household | 51 | 40.8% |
| Total Housing Units | 125 | 100.0% |
Occupancy by Ownership by Household Size in Saluda
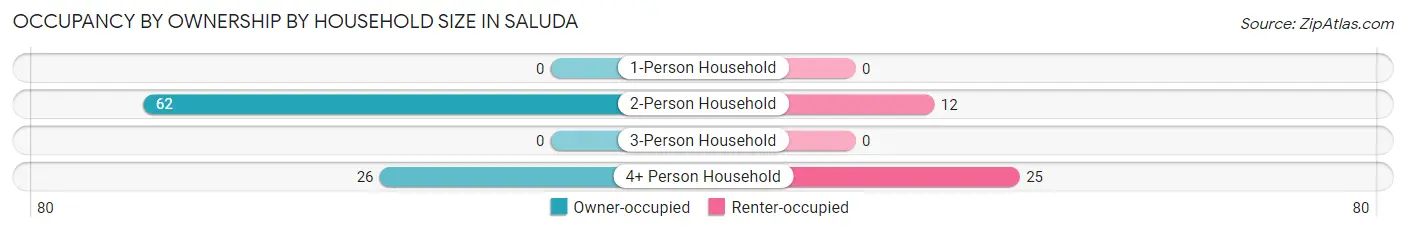
| Household Size | Owner-occupied | Renter-occupied |
| 1-Person Household | 0 (0.0%) | 0 (0.0%) |
| 2-Person Household | 62 (83.8%) | 12 (16.2%) |
| 3-Person Household | 0 (0.0%) | 0 (0.0%) |
| 4+ Person Household | 26 (51.0%) | 25 (49.0%) |
| Total Housing Units | 88 (70.4%) | 37 (29.6%) |
Occupancy by Educational Attainment in Saluda
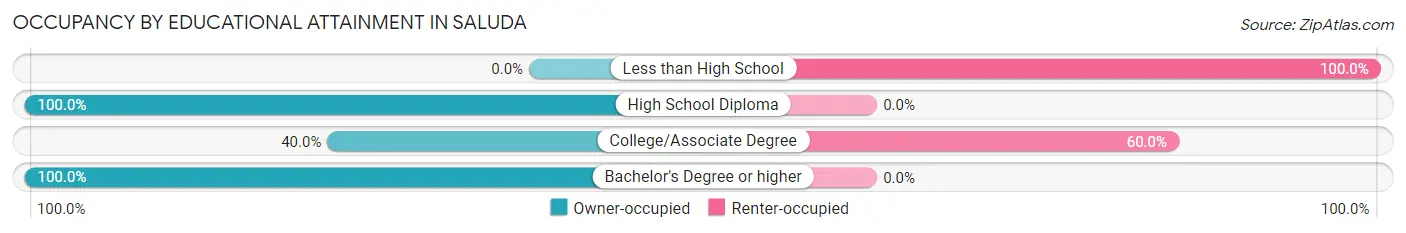
| Household Size | Owner-occupied | Renter-occupied |
| Less than High School | 0 (0.0%) | 25 (100.0%) |
| High School Diploma | 36 (100.0%) | 0 (0.0%) |
| College/Associate Degree | 8 (40.0%) | 12 (60.0%) |
| Bachelor's Degree or higher | 44 (100.0%) | 0 (0.0%) |
Occupancy by Age of Householder in Saluda
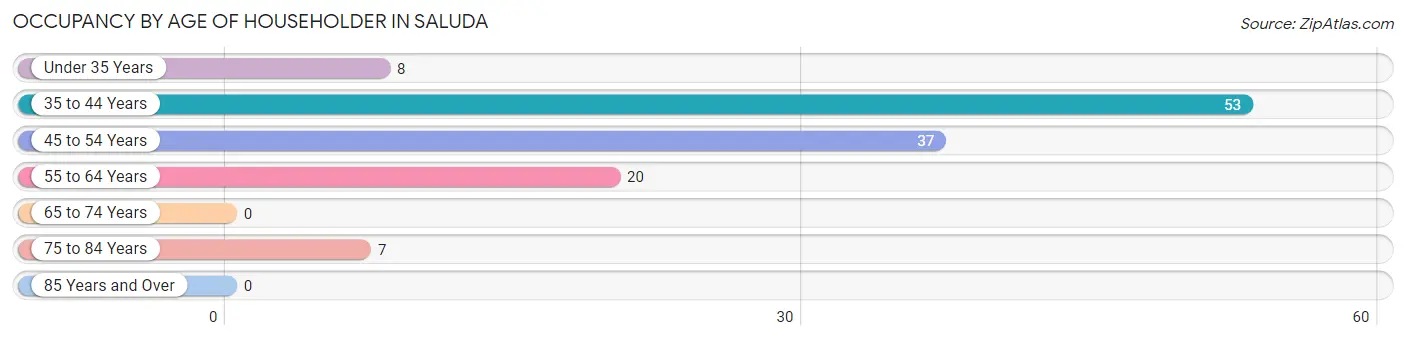
| Age Bracket | # Households | % Households |
| Under 35 Years | 8 | 6.4% |
| 35 to 44 Years | 53 | 42.4% |
| 45 to 54 Years | 37 | 29.6% |
| 55 to 64 Years | 20 | 16.0% |
| 65 to 74 Years | 0 | 0.0% |
| 75 to 84 Years | 7 | 5.6% |
| 85 Years and Over | 0 | 0.0% |
| Total | 125 | 100.0% |
Housing Finances in Saluda
Median Income by Occupancy in Saluda
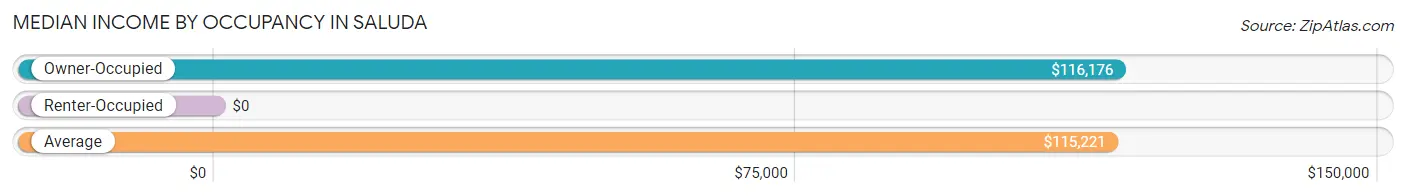
| Occupancy Type | # Households | Median Income |
| Owner-Occupied | 88 (70.4%) | $116,176 |
| Renter-Occupied | 37 (29.6%) | $0 |
| Average | 125 (100.0%) | $115,221 |
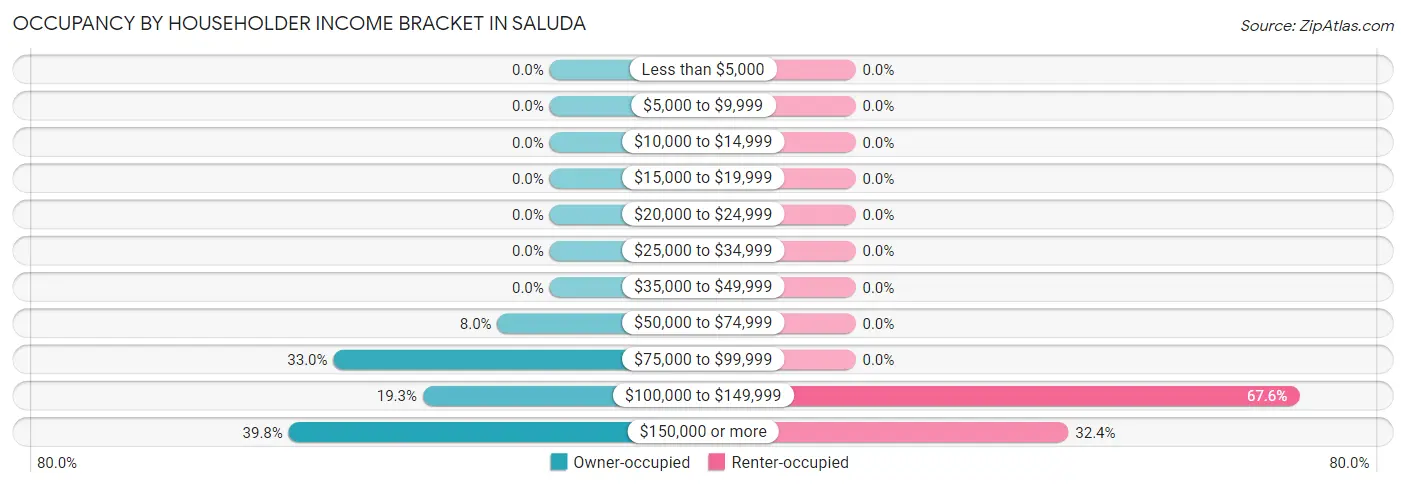
Occupancy by Householder Income Bracket in Saluda
| Income Bracket | Owner-occupied | Renter-occupied |
| Less than $5,000 | 0 (0.0%) | 0 (0.0%) |
| $5,000 to $9,999 | 0 (0.0%) | 0 (0.0%) |
| $10,000 to $14,999 | 0 (0.0%) | 0 (0.0%) |
| $15,000 to $19,999 | 0 (0.0%) | 0 (0.0%) |
| $20,000 to $24,999 | 0 (0.0%) | 0 (0.0%) |
| $25,000 to $34,999 | 0 (0.0%) | 0 (0.0%) |
| $35,000 to $49,999 | 0 (0.0%) | 0 (0.0%) |
| $50,000 to $74,999 | 7 (8.0%) | 0 (0.0%) |
| $75,000 to $99,999 | 29 (33.0%) | 0 (0.0%) |
| $100,000 to $149,999 | 17 (19.3%) | 25 (67.6%) |
| $150,000 or more | 35 (39.8%) | 12 (32.4%) |
| Total | 88 (100.0%) | 37 (100.0%) |
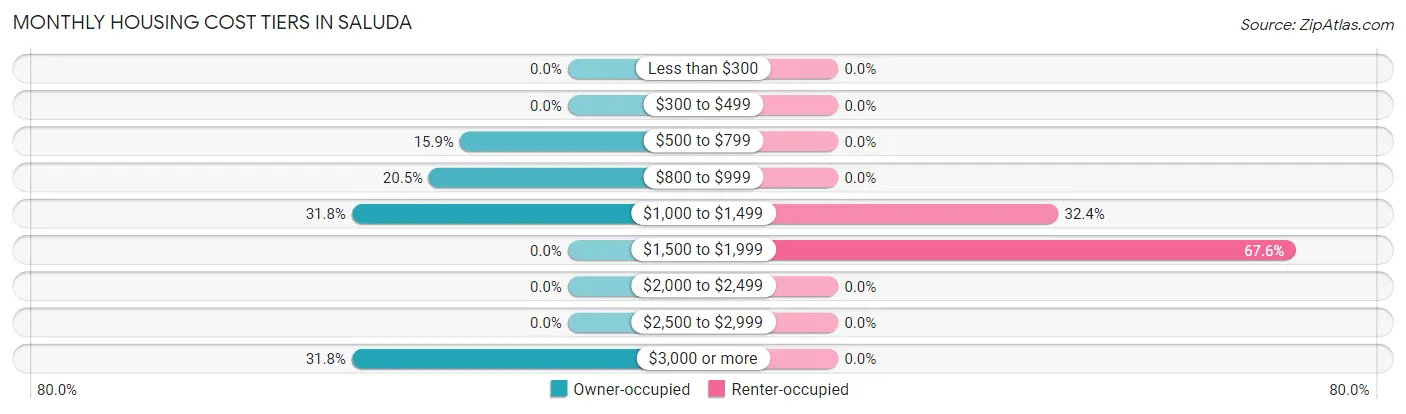
Monthly Housing Cost Tiers in Saluda
| Monthly Cost | Owner-occupied | Renter-occupied |
| Less than $300 | 0 (0.0%) | 0 (0.0%) |
| $300 to $499 | 0 (0.0%) | 0 (0.0%) |
| $500 to $799 | 14 (15.9%) | 0 (0.0%) |
| $800 to $999 | 18 (20.4%) | 0 (0.0%) |
| $1,000 to $1,499 | 28 (31.8%) | 12 (32.4%) |
| $1,500 to $1,999 | 0 (0.0%) | 25 (67.6%) |
| $2,000 to $2,499 | 0 (0.0%) | 0 (0.0%) |
| $2,500 to $2,999 | 0 (0.0%) | 0 (0.0%) |
| $3,000 or more | 28 (31.8%) | 0 (0.0%) |
| Total | 88 (100.0%) | 37 (100.0%) |
Physical Housing Characteristics in Saluda
Housing Structures in Saluda
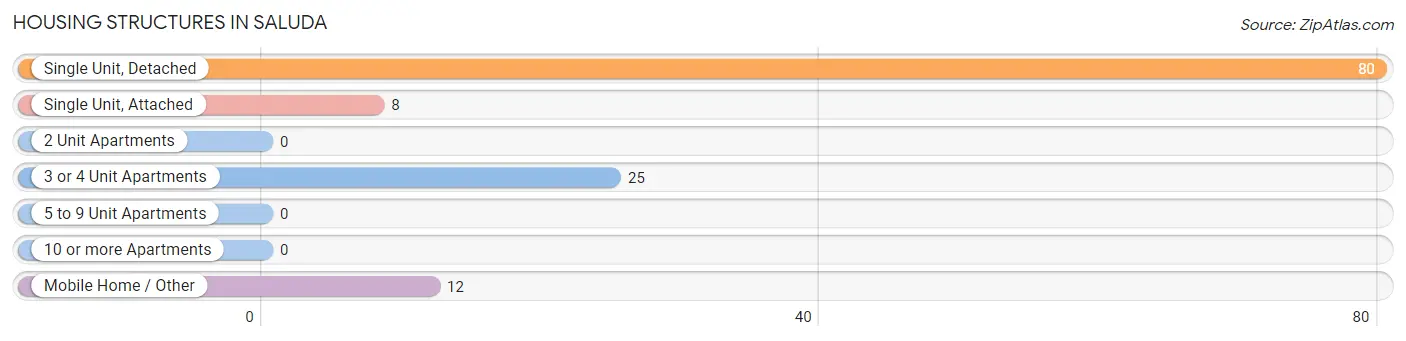
| Structure Type | # Housing Units | % Housing Units |
| Single Unit, Detached | 80 | 64.0% |
| Single Unit, Attached | 8 | 6.4% |
| 2 Unit Apartments | 0 | 0.0% |
| 3 or 4 Unit Apartments | 25 | 20.0% |
| 5 to 9 Unit Apartments | 0 | 0.0% |
| 10 or more Apartments | 0 | 0.0% |
| Mobile Home / Other | 12 | 9.6% |
| Total | 125 | 100.0% |
Housing Structures by Occupancy in Saluda
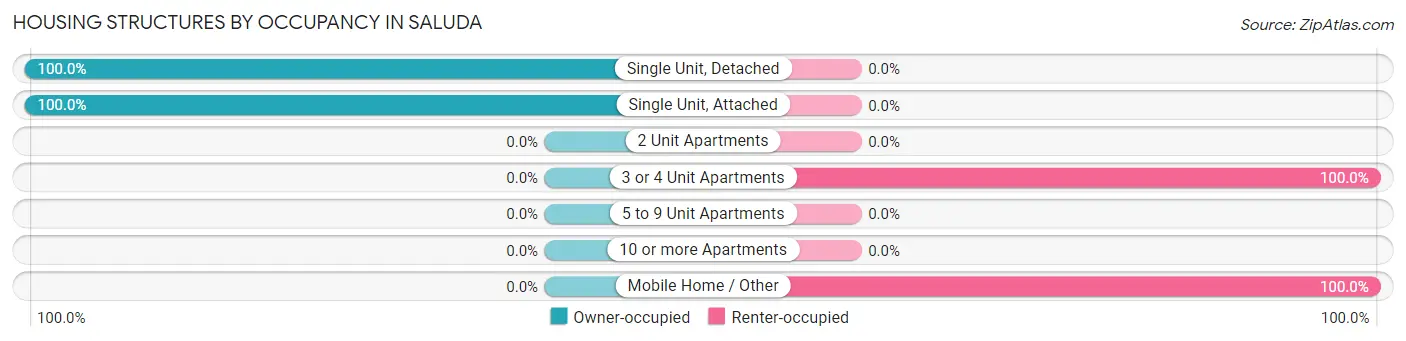
| Structure Type | Owner-occupied | Renter-occupied |
| Single Unit, Detached | 80 (100.0%) | 0 (0.0%) |
| Single Unit, Attached | 8 (100.0%) | 0 (0.0%) |
| 2 Unit Apartments | 0 (0.0%) | 0 (0.0%) |
| 3 or 4 Unit Apartments | 0 (0.0%) | 25 (100.0%) |
| 5 to 9 Unit Apartments | 0 (0.0%) | 0 (0.0%) |
| 10 or more Apartments | 0 (0.0%) | 0 (0.0%) |
| Mobile Home / Other | 0 (0.0%) | 12 (100.0%) |
| Total | 88 (70.4%) | 37 (29.6%) |
Housing Structures by Number of Rooms in Saluda
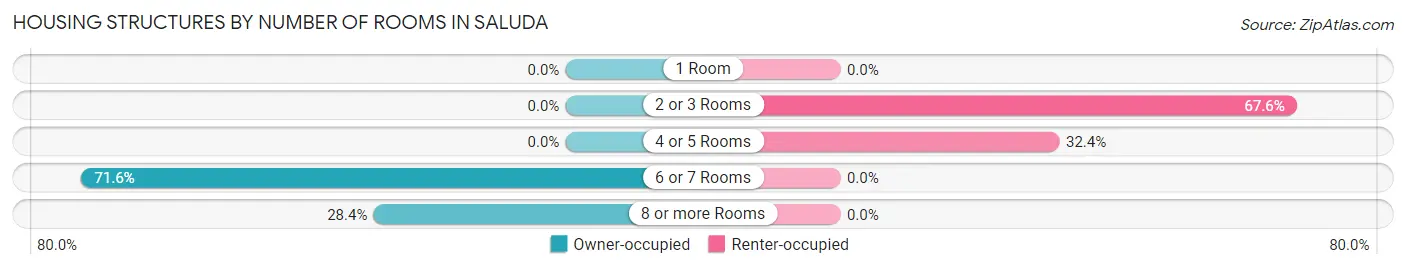
| Number of Rooms | Owner-occupied | Renter-occupied |
| 1 Room | 0 (0.0%) | 0 (0.0%) |
| 2 or 3 Rooms | 0 (0.0%) | 25 (67.6%) |
| 4 or 5 Rooms | 0 (0.0%) | 12 (32.4%) |
| 6 or 7 Rooms | 63 (71.6%) | 0 (0.0%) |
| 8 or more Rooms | 25 (28.4%) | 0 (0.0%) |
| Total | 88 (100.0%) | 37 (100.0%) |
Housing Structure by Heating Type in Saluda
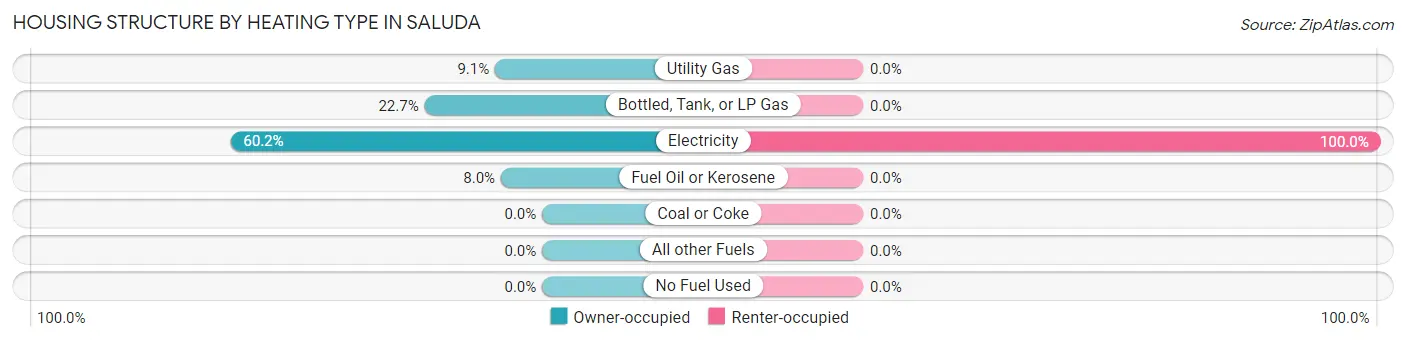
| Heating Type | Owner-occupied | Renter-occupied |
| Utility Gas | 8 (9.1%) | 0 (0.0%) |
| Bottled, Tank, or LP Gas | 20 (22.7%) | 0 (0.0%) |
| Electricity | 53 (60.2%) | 37 (100.0%) |
| Fuel Oil or Kerosene | 7 (8.0%) | 0 (0.0%) |
| Coal or Coke | 0 (0.0%) | 0 (0.0%) |
| All other Fuels | 0 (0.0%) | 0 (0.0%) |
| No Fuel Used | 0 (0.0%) | 0 (0.0%) |
| Total | 88 (100.0%) | 37 (100.0%) |
Household Vehicle Usage in Saluda
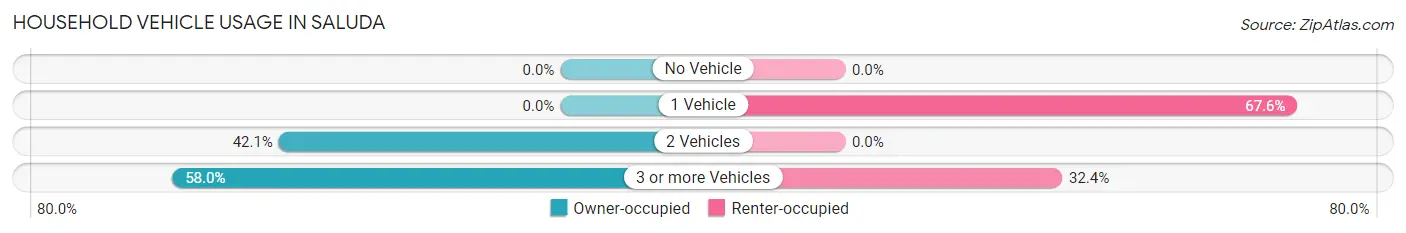
| Vehicles per Household | Owner-occupied | Renter-occupied |
| No Vehicle | 0 (0.0%) | 0 (0.0%) |
| 1 Vehicle | 0 (0.0%) | 25 (67.6%) |
| 2 Vehicles | 37 (42.0%) | 0 (0.0%) |
| 3 or more Vehicles | 51 (58.0%) | 12 (32.4%) |
| Total | 88 (100.0%) | 37 (100.0%) |
Real Estate & Mortgages in Saluda
Real Estate and Mortgage Overview in Saluda
| Characteristic | Without Mortgage | With Mortgage |
| Housing Units | 27 | 61 |
| Median Property Value | - | - |
| Median Household Income | - | - |
| Monthly Housing Costs | - | - |
| Real Estate Taxes | - | - |
Property Value by Mortgage Status in Saluda
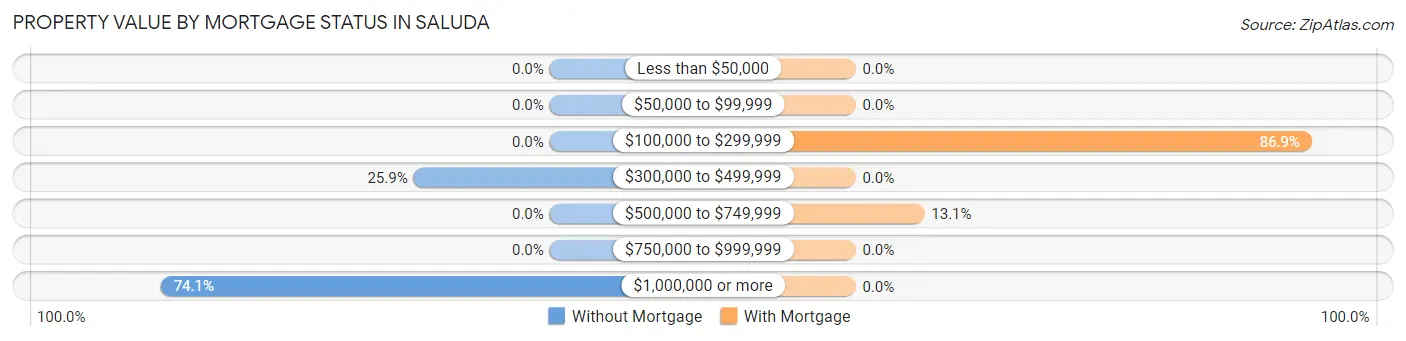
| Property Value | Without Mortgage | With Mortgage |
| Less than $50,000 | 0 (0.0%) | 0 (0.0%) |
| $50,000 to $99,999 | 0 (0.0%) | 0 (0.0%) |
| $100,000 to $299,999 | 0 (0.0%) | 53 (86.9%) |
| $300,000 to $499,999 | 7 (25.9%) | 0 (0.0%) |
| $500,000 to $749,999 | 0 (0.0%) | 8 (13.1%) |
| $750,000 to $999,999 | 0 (0.0%) | 0 (0.0%) |
| $1,000,000 or more | 20 (74.1%) | 0 (0.0%) |
| Total | 27 (100.0%) | 61 (100.0%) |
Household Income by Mortgage Status in Saluda
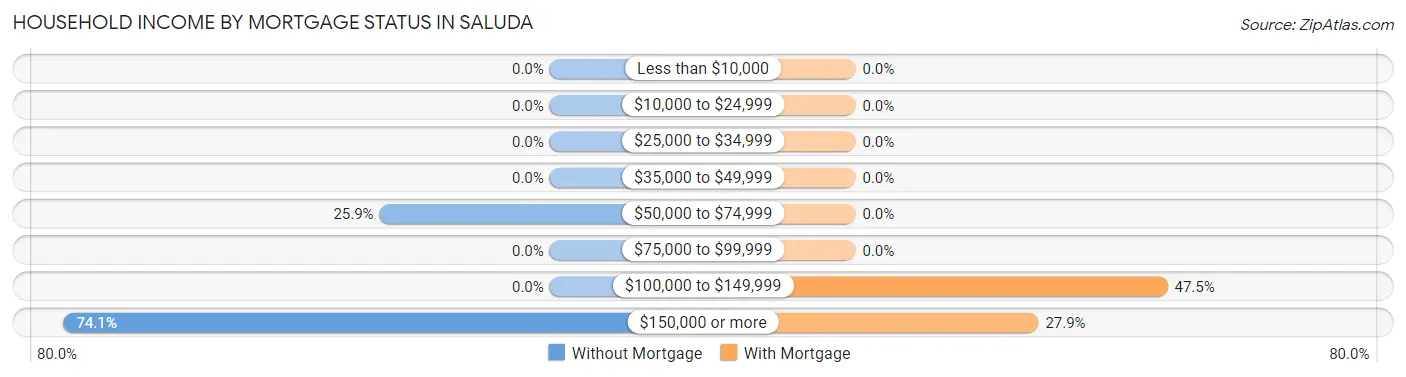
| Household Income | Without Mortgage | With Mortgage |
| Less than $10,000 | 0 (0.0%) | 0 (0.0%) |
| $10,000 to $24,999 | 0 (0.0%) | 0 (0.0%) |
| $25,000 to $34,999 | 0 (0.0%) | 0 (0.0%) |
| $35,000 to $49,999 | 0 (0.0%) | 0 (0.0%) |
| $50,000 to $74,999 | 7 (25.9%) | 0 (0.0%) |
| $75,000 to $99,999 | 0 (0.0%) | 0 (0.0%) |
| $100,000 to $149,999 | 0 (0.0%) | 29 (47.5%) |
| $150,000 or more | 20 (74.1%) | 17 (27.9%) |
| Total | 27 (100.0%) | 61 (100.0%) |
Property Value to Household Income Ratio in Saluda
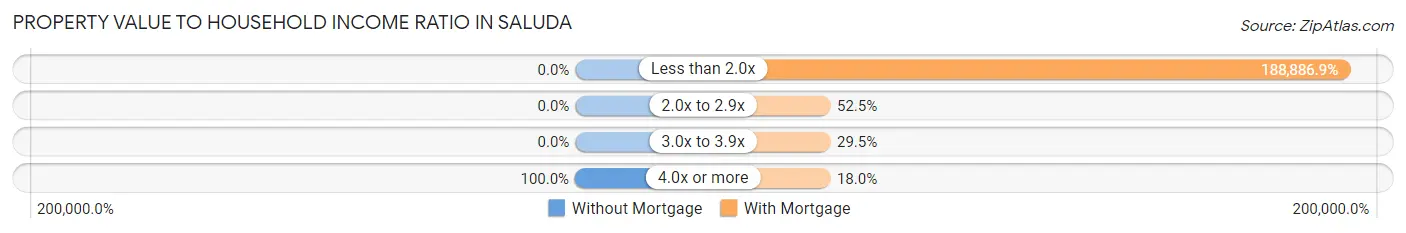
| Value-to-Income Ratio | Without Mortgage | With Mortgage |
| Less than 2.0x | 0 (0.0%) | 115,221 (188,886.9%) |
| 2.0x to 2.9x | 0 (0.0%) | 32 (52.5%) |
| 3.0x to 3.9x | 0 (0.0%) | 18 (29.5%) |
| 4.0x or more | 27 (100.0%) | 11 (18.0%) |
| Total | 27 (100.0%) | 61 (100.0%) |
Real Estate Taxes by Mortgage Status in Saluda
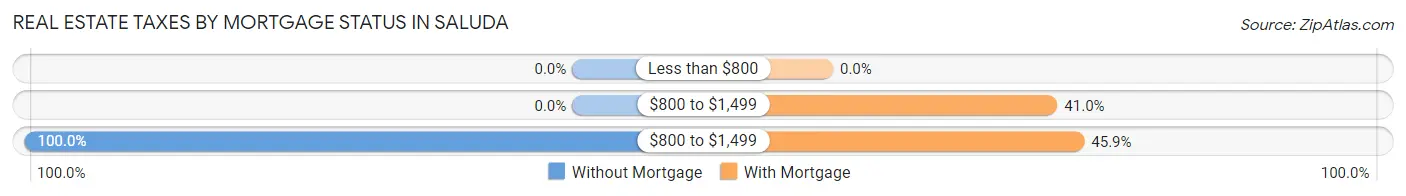
| Property Taxes | Without Mortgage | With Mortgage |
| Less than $800 | 0 (0.0%) | 0 (0.0%) |
| $800 to $1,499 | 0 (0.0%) | 25 (41.0%) |
| $800 to $1,499 | 27 (100.0%) | 28 (45.9%) |
| Total | 27 (100.0%) | 61 (100.0%) |
Health & Disability in Saluda
Health Insurance Coverage by Age in Saluda
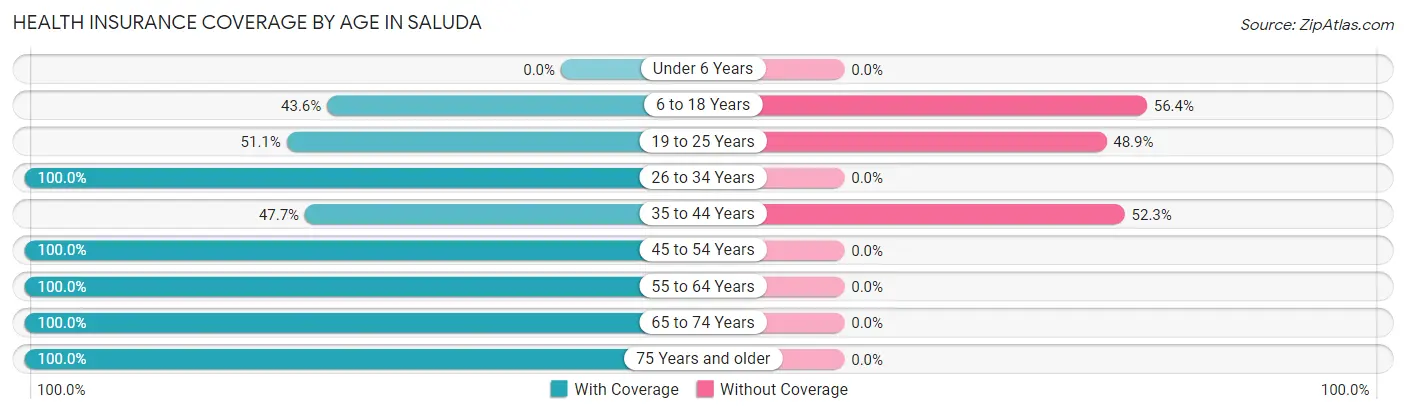
| Age Bracket | With Coverage | Without Coverage |
| Under 6 Years | 0 (0.0%) | 0 (0.0%) |
| 6 to 18 Years | 17 (43.6%) | 22 (56.4%) |
| 19 to 25 Years | 45 (51.1%) | 43 (48.9%) |
| 26 to 34 Years | 17 (100.0%) | 0 (0.0%) |
| 35 to 44 Years | 42 (47.7%) | 46 (52.3%) |
| 45 to 54 Years | 68 (100.0%) | 0 (0.0%) |
| 55 to 64 Years | 90 (100.0%) | 0 (0.0%) |
| 65 to 74 Years | 6 (100.0%) | 0 (0.0%) |
| 75 Years and older | 7 (100.0%) | 0 (0.0%) |
| Total | 292 (72.5%) | 111 (27.5%) |
Health Insurance Coverage by Citizenship Status in Saluda
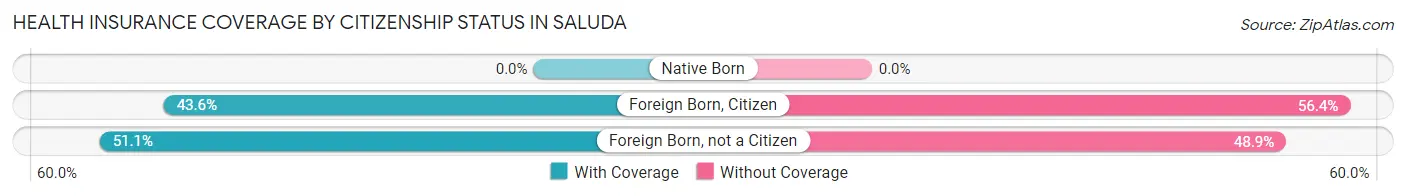
| Citizenship Status | With Coverage | Without Coverage |
| Native Born | 0 (0.0%) | 0 (0.0%) |
| Foreign Born, Citizen | 17 (43.6%) | 22 (56.4%) |
| Foreign Born, not a Citizen | 45 (51.1%) | 43 (48.9%) |
Health Insurance Coverage by Household Income in Saluda
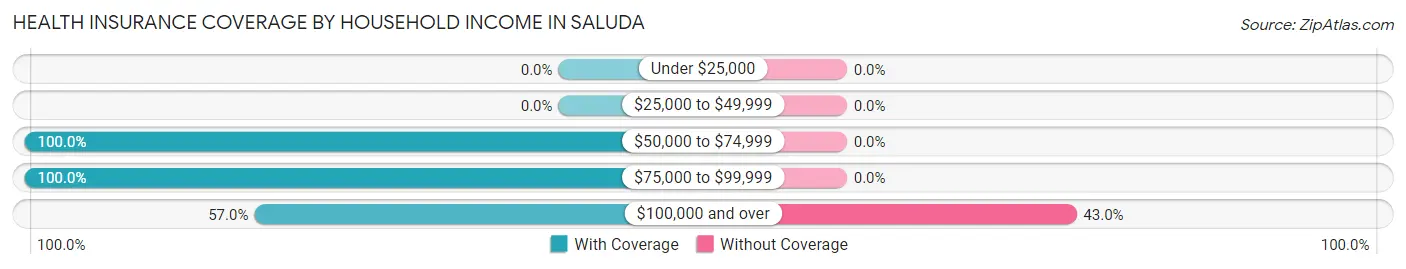
| Household Income | With Coverage | Without Coverage |
| Under $25,000 | 0 (0.0%) | 0 (0.0%) |
| $25,000 to $49,999 | 0 (0.0%) | 0 (0.0%) |
| $50,000 to $74,999 | 13 (100.0%) | 0 (0.0%) |
| $75,000 to $99,999 | 132 (100.0%) | 0 (0.0%) |
| $100,000 and over | 147 (57.0%) | 111 (43.0%) |
Public vs Private Health Insurance Coverage by Age in Saluda
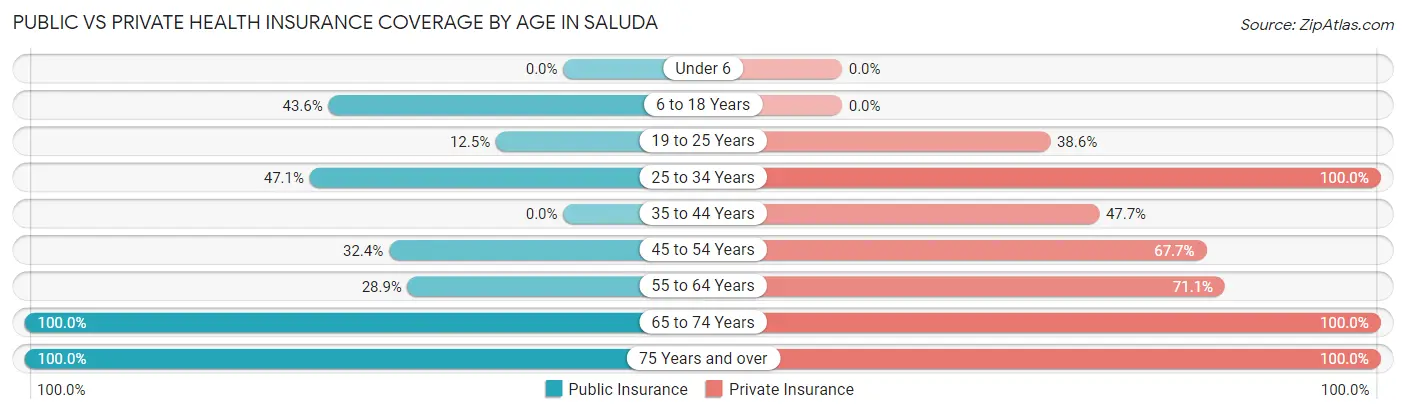
| Age Bracket | Public Insurance | Private Insurance |
| Under 6 | 0 (0.0%) | 0 (0.0%) |
| 6 to 18 Years | 17 (43.6%) | 0 (0.0%) |
| 19 to 25 Years | 11 (12.5%) | 34 (38.6%) |
| 25 to 34 Years | 8 (47.1%) | 17 (100.0%) |
| 35 to 44 Years | 0 (0.0%) | 42 (47.7%) |
| 45 to 54 Years | 22 (32.4%) | 46 (67.6%) |
| 55 to 64 Years | 26 (28.9%) | 64 (71.1%) |
| 65 to 74 Years | 6 (100.0%) | 6 (100.0%) |
| 75 Years and over | 7 (100.0%) | 7 (100.0%) |
| Total | 97 (24.1%) | 216 (53.6%) |
Disability Status by Sex by Age in Saluda
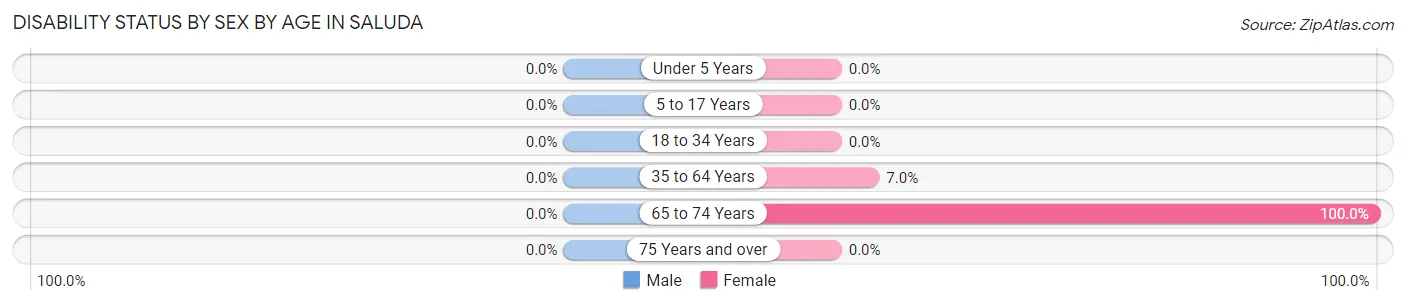
| Age Bracket | Male | Female |
| Under 5 Years | 0 (0.0%) | 0 (0.0%) |
| 5 to 17 Years | 0 (0.0%) | 0 (0.0%) |
| 18 to 34 Years | 0 (0.0%) | 0 (0.0%) |
| 35 to 64 Years | 0 (0.0%) | 9 (7.0%) |
| 65 to 74 Years | 0 (0.0%) | 6 (100.0%) |
| 75 Years and over | 0 (0.0%) | 0 (0.0%) |
Disability Class by Sex by Age in Saluda
Disability Class: Hearing Difficulty
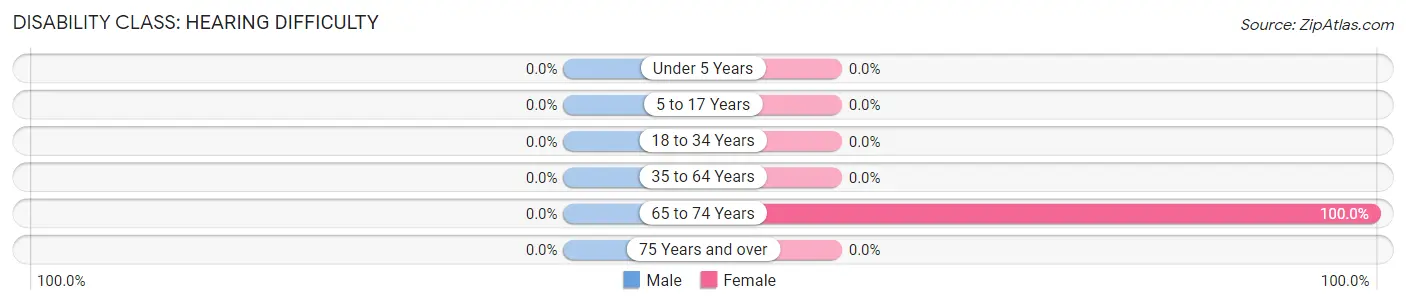
| Age Bracket | Male | Female |
| Under 5 Years | 0 (0.0%) | 0 (0.0%) |
| 5 to 17 Years | 0 (0.0%) | 0 (0.0%) |
| 18 to 34 Years | 0 (0.0%) | 0 (0.0%) |
| 35 to 64 Years | 0 (0.0%) | 0 (0.0%) |
| 65 to 74 Years | 0 (0.0%) | 6 (100.0%) |
| 75 Years and over | 0 (0.0%) | 0 (0.0%) |
Disability Class: Vision Difficulty
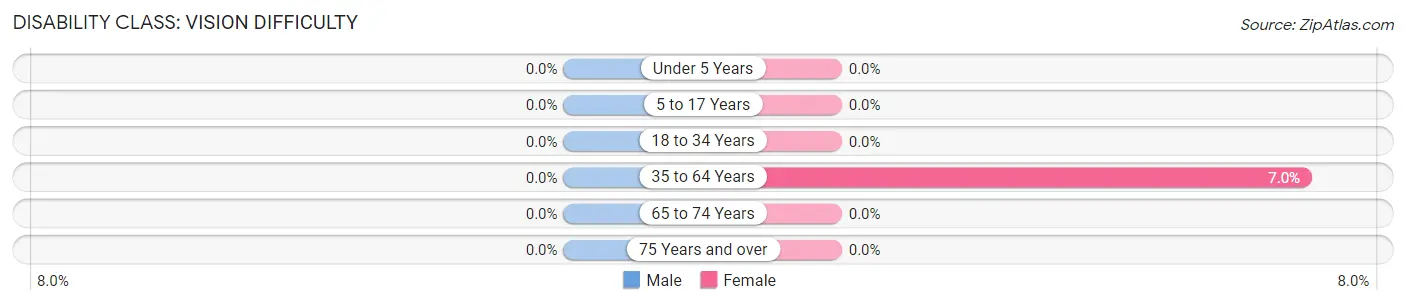
| Age Bracket | Male | Female |
| Under 5 Years | 0 (0.0%) | 0 (0.0%) |
| 5 to 17 Years | 0 (0.0%) | 0 (0.0%) |
| 18 to 34 Years | 0 (0.0%) | 0 (0.0%) |
| 35 to 64 Years | 0 (0.0%) | 9 (7.0%) |
| 65 to 74 Years | 0 (0.0%) | 0 (0.0%) |
| 75 Years and over | 0 (0.0%) | 0 (0.0%) |
Disability Class: Cognitive Difficulty
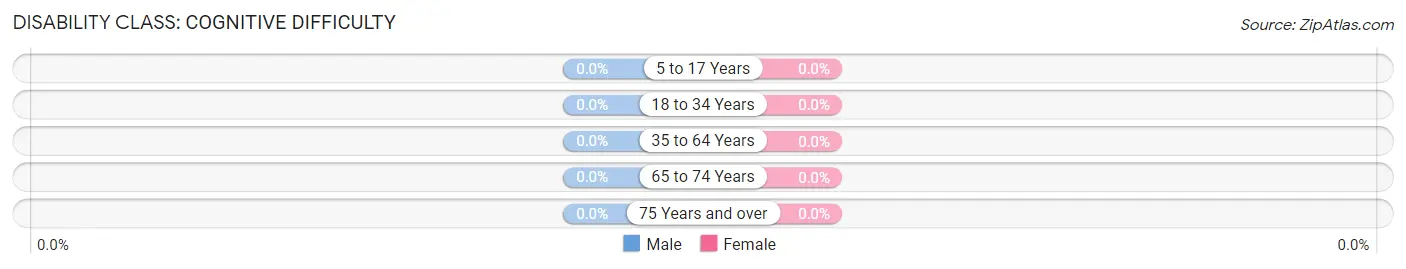
| Age Bracket | Male | Female |
| 5 to 17 Years | 0 (0.0%) | 0 (0.0%) |
| 18 to 34 Years | 0 (0.0%) | 0 (0.0%) |
| 35 to 64 Years | 0 (0.0%) | 0 (0.0%) |
| 65 to 74 Years | 0 (0.0%) | 0 (0.0%) |
| 75 Years and over | 0 (0.0%) | 0 (0.0%) |
Disability Class: Ambulatory Difficulty
| Age Bracket | Male | Female |
| 5 to 17 Years | 0 (0.0%) | 0 (0.0%) |
| 18 to 34 Years | 0 (0.0%) | 0 (0.0%) |
| 35 to 64 Years | 0 (0.0%) | 0 (0.0%) |
| 65 to 74 Years | 0 (0.0%) | 0 (0.0%) |
| 75 Years and over | 0 (0.0%) | 0 (0.0%) |
Disability Class: Self-Care Difficulty
| Age Bracket | Male | Female |
| 5 to 17 Years | 0 (0.0%) | 0 (0.0%) |
| 18 to 34 Years | 0 (0.0%) | 0 (0.0%) |
| 35 to 64 Years | 0 (0.0%) | 0 (0.0%) |
| 65 to 74 Years | 0 (0.0%) | 0 (0.0%) |
| 75 Years and over | 0 (0.0%) | 0 (0.0%) |
Technology Access in Saluda
Computing Device Access in Saluda
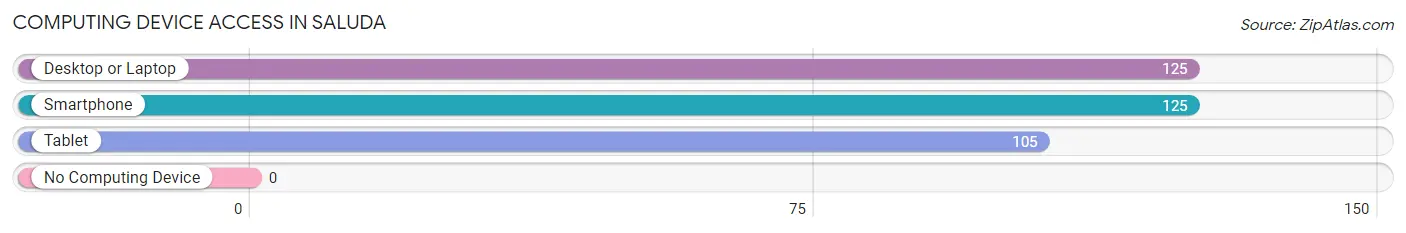
| Device Type | # Households | % Households |
| Desktop or Laptop | 125 | 100.0% |
| Smartphone | 125 | 100.0% |
| Tablet | 105 | 84.0% |
| No Computing Device | 0 | 0.0% |
| Total | 125 | 100.0% |
Internet Access in Saluda
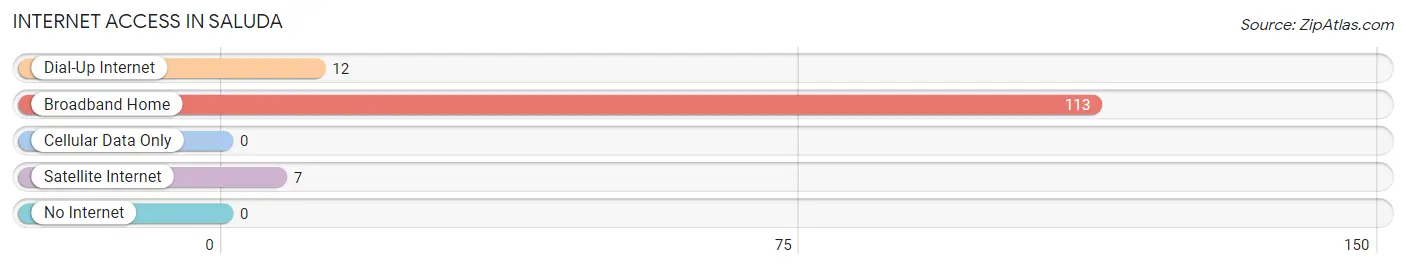
| Internet Type | # Households | % Households |
| Dial-Up Internet | 12 | 9.6% |
| Broadband Home | 113 | 90.4% |
| Cellular Data Only | 0 | 0.0% |
| Satellite Internet | 7 | 5.6% |
| No Internet | 0 | 0.0% |
| Total | 125 | 100.0% |
Saluda Summary
Saluda, Virginia is a small town located in the heart of the Shenandoah Valley in the United States. It is situated in the northern part of Rockingham County, Virginia, and is part of the Harrisonburg Metropolitan Statistical Area. The town has a population of approximately 1,500 people and is known for its rural charm and small-town atmosphere.
History
Saluda was first settled in the late 1700s by German immigrants who were attracted to the area by its fertile soil and abundant natural resources. The town was originally known as “Saluda’s Crossroads” due to its location at the intersection of two major roads. The town was officially incorporated in 1891 and was named after the nearby Saluda River.
In the early 1900s, Saluda was a thriving agricultural community, with many of its residents working in the local tobacco and grain industries. The town also had a thriving lumber industry, with several sawmills located in the area.
In the mid-1900s, Saluda began to experience a decline in its agricultural and industrial sectors. This was due in part to the introduction of new technologies and the increasing mechanization of farming. As a result, many of the town’s residents began to look for employment elsewhere.
Geography
Saluda is located in the northern part of Rockingham County, Virginia. It is situated in the Shenandoah Valley, which is a large valley that stretches from the Blue Ridge Mountains in the east to the Allegheny Mountains in the west. The town is located at the intersection of two major roads, US Route 11 and US Route 33.
The town is surrounded by rolling hills and lush forests, and is home to several small streams and creeks. The nearby Shenandoah River is a popular destination for fishing, canoeing, and other outdoor activities.
Economy
Saluda’s economy is largely based on agriculture and tourism. The town is home to several small farms, which produce a variety of crops, including corn, soybeans, wheat, and hay. The town also has several small businesses, including restaurants, antique stores, and gift shops.
Tourism is an important part of the local economy, with many visitors coming to the area to enjoy the town’s rural charm and natural beauty. The nearby Shenandoah National Park is a popular destination for hikers, campers, and other outdoor enthusiasts.
Demographics
As of the 2010 census, Saluda had a population of 1,500 people. The town is predominantly white, with approximately 95% of the population identifying as Caucasian. The remaining 5% of the population is made up of African Americans, Hispanics, and other ethnicities.
The median household income in Saluda is $41,000, which is slightly lower than the national average. The town has a poverty rate of 15%, which is slightly higher than the national average.
Conclusion
Saluda, Virginia is a small town located in the heart of the Shenandoah Valley. It has a population of approximately 1,500 people and is known for its rural charm and small-town atmosphere. The town’s economy is largely based on agriculture and tourism, and the nearby Shenandoah National Park is a popular destination for outdoor enthusiasts. The town is predominantly white, with a median household income of $41,000 and a poverty rate of 15%.
Common Questions
What is Per Capita Income in Saluda?
Per Capita income in Saluda is $34,863.
What is the Median Family Income in Saluda?
Median Family Income in Saluda is $115,221.
What is the Median Household income in Saluda?
Median Household Income in Saluda is $115,221.
What is Income or Wage Gap in Saluda?
Income or Wage Gap in Saluda is 30.5%.
Women in Saluda earn 69.5 cents for every dollar earned by a man.
What is Inequality or Gini Index in Saluda?
Inequality or Gini Index in Saluda is 0.31.
What is the Total Population of Saluda?
Total Population of Saluda is 650.
What is the Total Male Population of Saluda?
Total Male Population of Saluda is 383.
What is the Total Female Population of Saluda?
Total Female Population of Saluda is 267.
What is the Ratio of Males per 100 Females in Saluda?
There are 143.45 Males per 100 Females in Saluda.
What is the Ratio of Females per 100 Males in Saluda?
There are 69.71 Females per 100 Males in Saluda.
What is the Median Population Age in Saluda?
Median Population Age in Saluda is 39.4 Years.
What is the Average Family Size in Saluda
Average Family Size in Saluda is 2.6 People.
What is the Average Household Size in Saluda
Average Household Size in Saluda is 3.2 People.
How Large is the Labor Force in Saluda?
There are 349 People in the Labor Forcein in Saluda.
What is the Percentage of People in the Labor Force in Saluda?
55.6% of People are in the Labor Force in Saluda.