Sugarland Run, VA Map & Demographics
Sugarland Run Map
Sugarland Run Overview
$47,623
PER CAPITA INCOME
$143,548
AVG FAMILY INCOME
$141,680
AVG HOUSEHOLD INCOME
48.9%
WAGE / INCOME GAP [ % ]
51.1¢/ $1
WAGE / INCOME GAP [ $ ]
$7,353
FAMILY INCOME DEFICIT
0.36
INEQUALITY / GINI INDEX
12,818
TOTAL POPULATION
6,365
MALE POPULATION
6,453
FEMALE POPULATION
98.64
MALES / 100 FEMALES
101.38
FEMALES / 100 MALES
35.8
MEDIAN AGE
3.8
AVG FAMILY SIZE
3.5
AVG HOUSEHOLD SIZE
7,522
LABOR FORCE [ PEOPLE ]
72.3%
PERCENT IN LABOR FORCE
4.5%
UNEMPLOYMENT RATE
Income in Sugarland Run
Income Overview in Sugarland Run
Per Capita Income in Sugarland Run is $47,623, while median incomes of families and households are $143,548 and $141,680 respectively.
| Characteristic | Number | Measure |
| Per Capita Income | 12,818 | $47,623 |
| Median Family Income | 2,978 | $143,548 |
| Mean Family Income | 2,978 | $164,485 |
| Median Household Income | 3,635 | $141,680 |
| Mean Household Income | 3,635 | $163,647 |
| Income Deficit | 2,978 | $7,353 |
| Wage / Income Gap (%) | 12,818 | 48.93% |
| Wage / Income Gap ($) | 12,818 | 51.07¢ per $1 |
| Gini / Inequality Index | 12,818 | 0.36 |
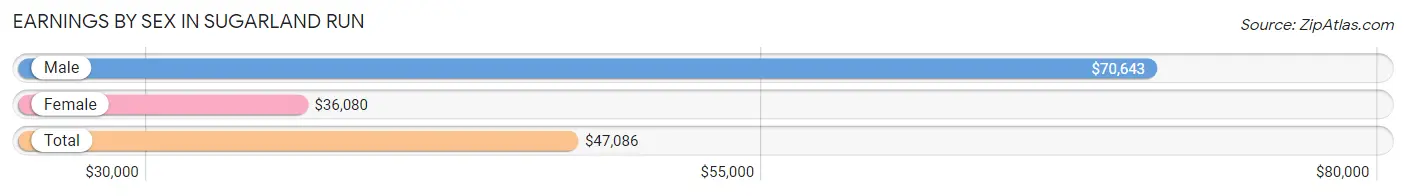
Earnings by Sex in Sugarland Run
Average Earnings in Sugarland Run are $47,086, $70,643 for men and $36,080 for women, a difference of 48.9%.
| Sex | Number | Average Earnings |
| Male | 4,199 (53.6%) | $70,643 |
| Female | 3,640 (46.4%) | $36,080 |
| Total | 7,839 (100.0%) | $47,086 |
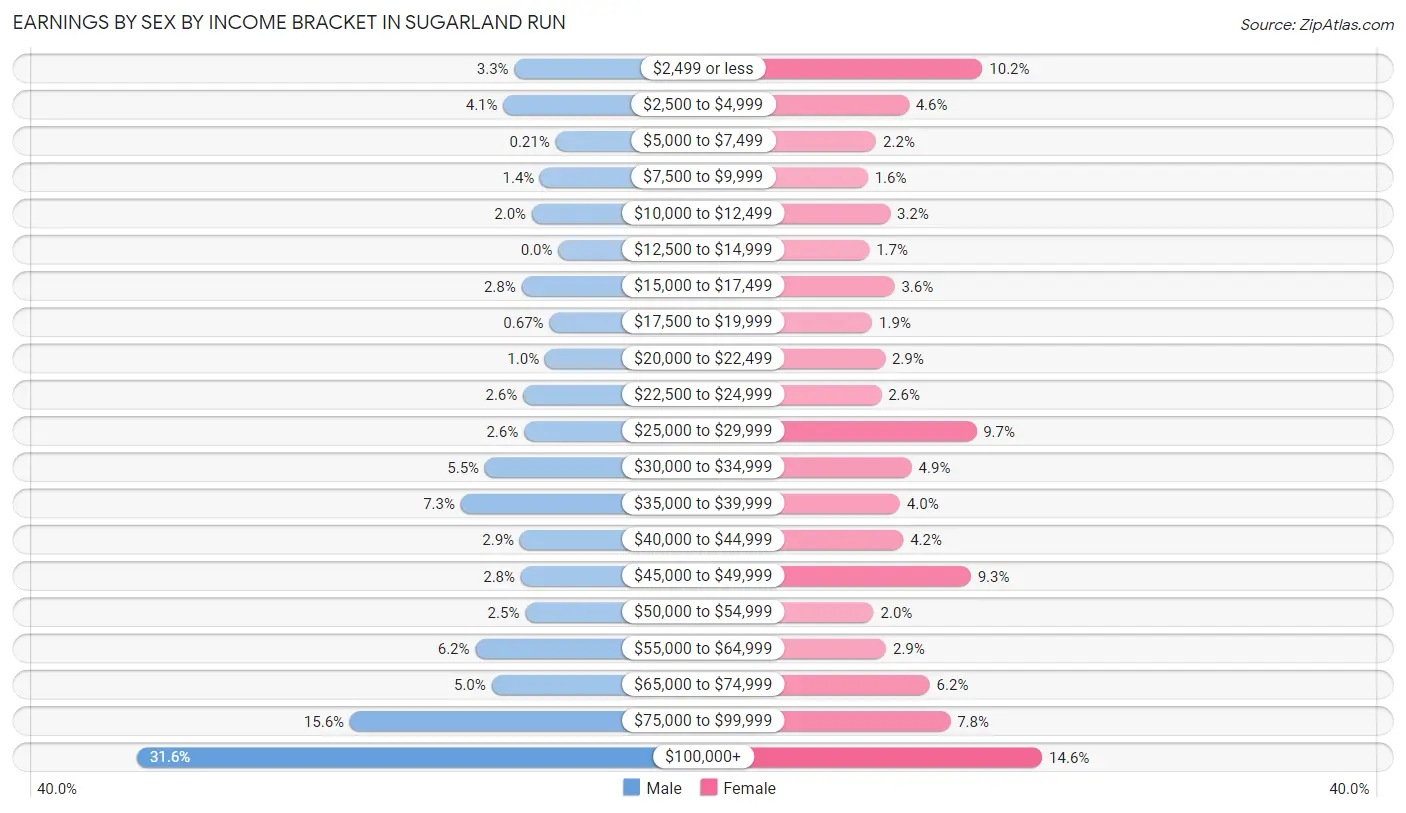
Earnings by Sex by Income Bracket in Sugarland Run
The most common earnings brackets in Sugarland Run are $100,000+ for men (1,326 | 31.6%) and $100,000+ for women (533 | 14.6%).
| Income | Male | Female |
| $2,499 or less | 138 (3.3%) | 370 (10.2%) |
| $2,500 to $4,999 | 173 (4.1%) | 169 (4.6%) |
| $5,000 to $7,499 | 9 (0.2%) | 80 (2.2%) |
| $7,500 to $9,999 | 57 (1.4%) | 57 (1.6%) |
| $10,000 to $12,499 | 83 (2.0%) | 118 (3.2%) |
| $12,500 to $14,999 | 0 (0.0%) | 61 (1.7%) |
| $15,000 to $17,499 | 116 (2.8%) | 130 (3.6%) |
| $17,500 to $19,999 | 28 (0.7%) | 69 (1.9%) |
| $20,000 to $22,499 | 42 (1.0%) | 104 (2.9%) |
| $22,500 to $24,999 | 111 (2.6%) | 94 (2.6%) |
| $25,000 to $29,999 | 108 (2.6%) | 353 (9.7%) |
| $30,000 to $34,999 | 231 (5.5%) | 177 (4.9%) |
| $35,000 to $39,999 | 307 (7.3%) | 145 (4.0%) |
| $40,000 to $44,999 | 121 (2.9%) | 154 (4.2%) |
| $45,000 to $49,999 | 118 (2.8%) | 338 (9.3%) |
| $50,000 to $54,999 | 104 (2.5%) | 73 (2.0%) |
| $55,000 to $64,999 | 261 (6.2%) | 107 (2.9%) |
| $65,000 to $74,999 | 210 (5.0%) | 226 (6.2%) |
| $75,000 to $99,999 | 656 (15.6%) | 282 (7.7%) |
| $100,000+ | 1,326 (31.6%) | 533 (14.6%) |
| Total | 4,199 (100.0%) | 3,640 (100.0%) |
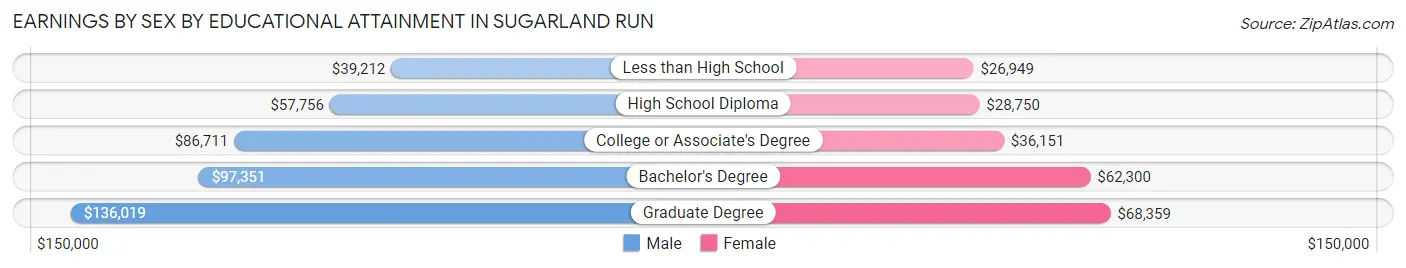
Earnings by Sex by Educational Attainment in Sugarland Run
Average earnings in Sugarland Run are $83,385 for men and $44,313 for women, a difference of 46.9%. Men with an educational attainment of graduate degree enjoy the highest average annual earnings of $136,019, while those with less than high school education earn the least with $39,212. Women with an educational attainment of graduate degree earn the most with the average annual earnings of $68,359, while those with less than high school education have the smallest earnings of $26,949.
| Educational Attainment | Male Income | Female Income |
| Less than High School | $39,212 | $26,949 |
| High School Diploma | $57,756 | $28,750 |
| College or Associate's Degree | $86,711 | $36,151 |
| Bachelor's Degree | $97,351 | $62,300 |
| Graduate Degree | $136,019 | $68,359 |
| Total | $83,385 | $44,313 |
Family Income in Sugarland Run
Family Income Brackets in Sugarland Run
According to the Sugarland Run family income data, there are 980 families falling into the $200,000+ income range, which is the most common income bracket and makes up 32.9% of all families.
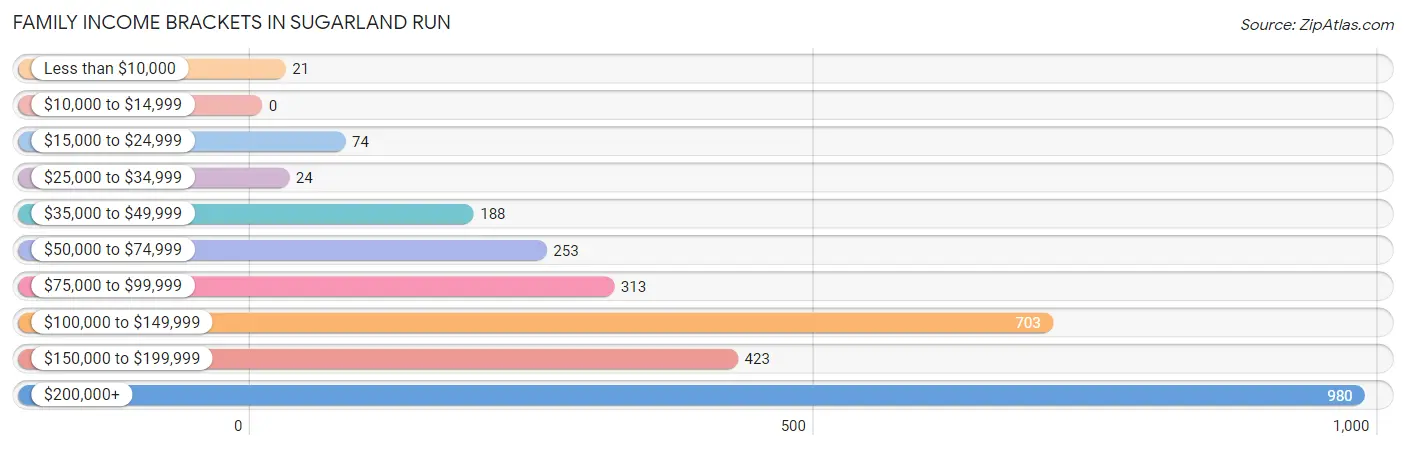
| Income Bracket | # Families | % Families |
| Less than $10,000 | 21 | 0.7% |
| $10,000 to $14,999 | 0 | 0.0% |
| $15,000 to $24,999 | 74 | 2.5% |
| $25,000 to $34,999 | 24 | 0.8% |
| $35,000 to $49,999 | 188 | 6.3% |
| $50,000 to $74,999 | 253 | 8.5% |
| $75,000 to $99,999 | 313 | 10.5% |
| $100,000 to $149,999 | 703 | 23.6% |
| $150,000 to $199,999 | 423 | 14.2% |
| $200,000+ | 980 | 32.9% |
Family Income by Famaliy Size in Sugarland Run
6-person families (118 | 4.0%) account for the highest median family income in Sugarland Run with $231,000 per family, while 2-person families (843 | 28.3%) have the highest median income of $79,292 per family member.
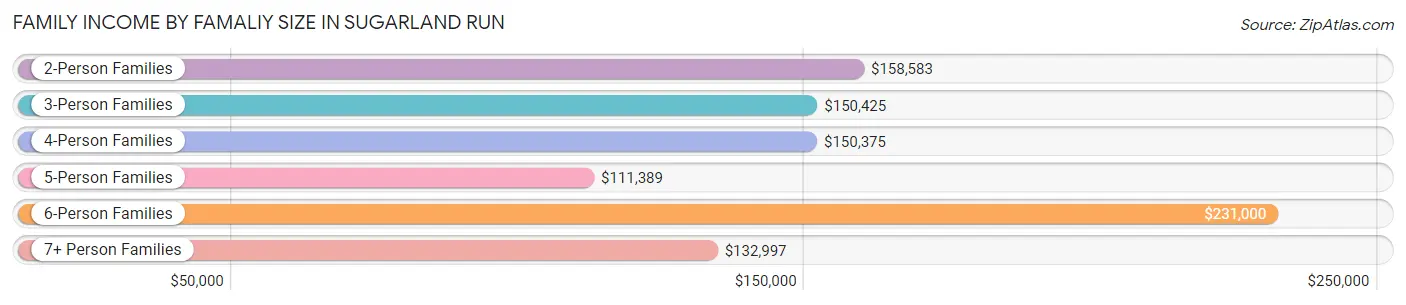
| Income Bracket | # Families | Median Income |
| 2-Person Families | 843 (28.3%) | $158,583 |
| 3-Person Families | 697 (23.4%) | $150,425 |
| 4-Person Families | 685 (23.0%) | $150,375 |
| 5-Person Families | 384 (12.9%) | $111,389 |
| 6-Person Families | 118 (4.0%) | $231,000 |
| 7+ Person Families | 251 (8.4%) | $132,997 |
| Total | 2,978 (100.0%) | $143,548 |
Family Income by Number of Earners in Sugarland Run
The median family income in Sugarland Run is $143,548, with families comprising 2 earners (1,370) having the highest median family income of $164,625, while families with no earners (93) have the lowest median family income of $48,814, accounting for 46.0% and 3.1% of families, respectively.
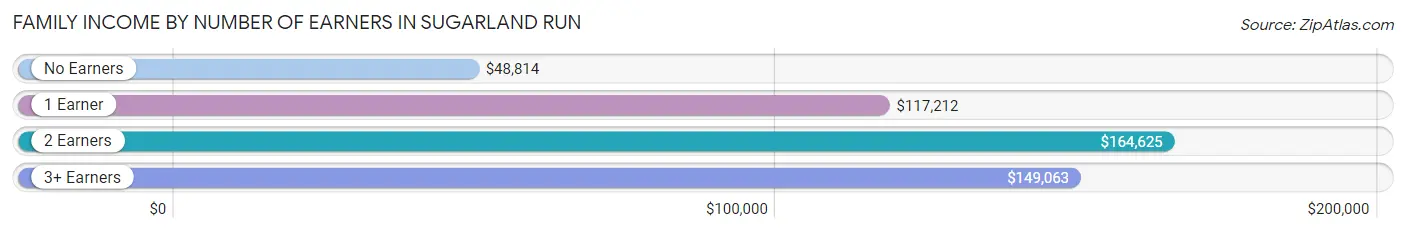
| Number of Earners | # Families | Median Income |
| No Earners | 93 (3.1%) | $48,814 |
| 1 Earner | 675 (22.7%) | $117,212 |
| 2 Earners | 1,370 (46.0%) | $164,625 |
| 3+ Earners | 840 (28.2%) | $149,063 |
| Total | 2,978 (100.0%) | $143,548 |
Household Income in Sugarland Run
Household Income Brackets in Sugarland Run
With 1,200 households falling in the category, the $200,000+ income range is the most frequent in Sugarland Run, accounting for 33.0% of all households. In contrast, only 36 households (1.0%) fall into the $25,000 to $34,999 income bracket, making it the least populous group.
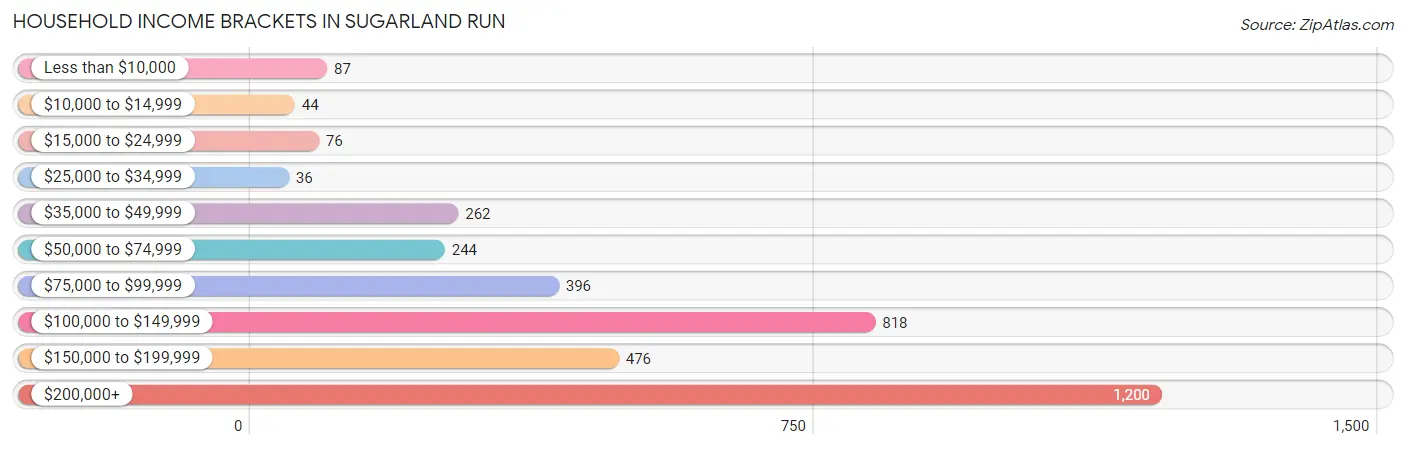
| Income Bracket | # Households | % Households |
| Less than $10,000 | 87 | 2.4% |
| $10,000 to $14,999 | 44 | 1.2% |
| $15,000 to $24,999 | 76 | 2.1% |
| $25,000 to $34,999 | 36 | 1.0% |
| $35,000 to $49,999 | 262 | 7.2% |
| $50,000 to $74,999 | 244 | 6.7% |
| $75,000 to $99,999 | 396 | 10.9% |
| $100,000 to $149,999 | 818 | 22.5% |
| $150,000 to $199,999 | 476 | 13.1% |
| $200,000+ | 1,200 | 33.0% |
Household Income by Householder Age in Sugarland Run
The median household income in Sugarland Run is $141,680, with the highest median household income of $151,766 found in the 45 to 64 years age bracket for the primary householder. A total of 1,535 households (42.2%) fall into this category. Meanwhile, the 15 to 24 years age bracket for the primary householder has the lowest median household income of $0, with 73 households (2.0%) in this group.
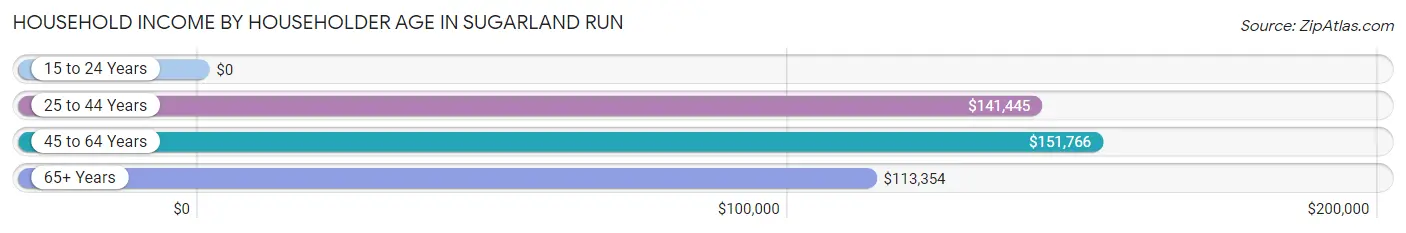
| Income Bracket | # Households | Median Income |
| 15 to 24 Years | 73 (2.0%) | $0 |
| 25 to 44 Years | 1,399 (38.5%) | $141,445 |
| 45 to 64 Years | 1,535 (42.2%) | $151,766 |
| 65+ Years | 628 (17.3%) | $113,354 |
| Total | 3,635 (100.0%) | $141,680 |
Poverty in Sugarland Run
Income Below Poverty by Sex and Age in Sugarland Run
With 5.3% poverty level for males and 4.3% for females among the residents of Sugarland Run, 18 to 24 year old males and under 5 year old females are the most vulnerable to poverty, with 96 males (11.1%) and 43 females (10.5%) in their respective age groups living below the poverty level.
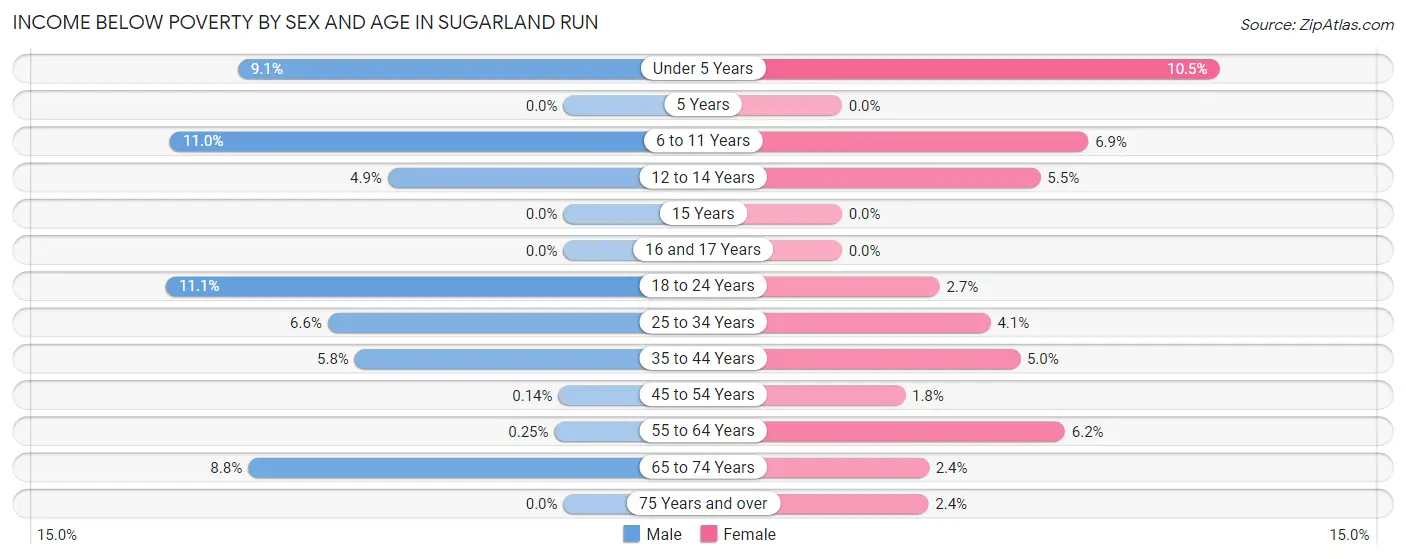
| Age Bracket | Male | Female |
| Under 5 Years | 28 (9.1%) | 43 (10.5%) |
| 5 Years | 0 (0.0%) | 0 (0.0%) |
| 6 to 11 Years | 46 (11.0%) | 33 (6.9%) |
| 12 to 14 Years | 15 (4.9%) | 14 (5.5%) |
| 15 Years | 0 (0.0%) | 0 (0.0%) |
| 16 and 17 Years | 0 (0.0%) | 0 (0.0%) |
| 18 to 24 Years | 96 (11.1%) | 17 (2.7%) |
| 25 to 34 Years | 60 (6.6%) | 39 (4.1%) |
| 35 to 44 Years | 63 (5.8%) | 49 (5.0%) |
| 45 to 54 Years | 1 (0.1%) | 16 (1.8%) |
| 55 to 64 Years | 2 (0.3%) | 45 (6.2%) |
| 65 to 74 Years | 28 (8.8%) | 10 (2.4%) |
| 75 Years and over | 0 (0.0%) | 9 (2.4%) |
| Total | 339 (5.3%) | 275 (4.3%) |
Income Above Poverty by Sex and Age in Sugarland Run
According to the poverty statistics in Sugarland Run, males aged 5 years and females aged 5 years are the age groups that are most secure financially, with 100.0% of males and 100.0% of females in these age groups living above the poverty line.
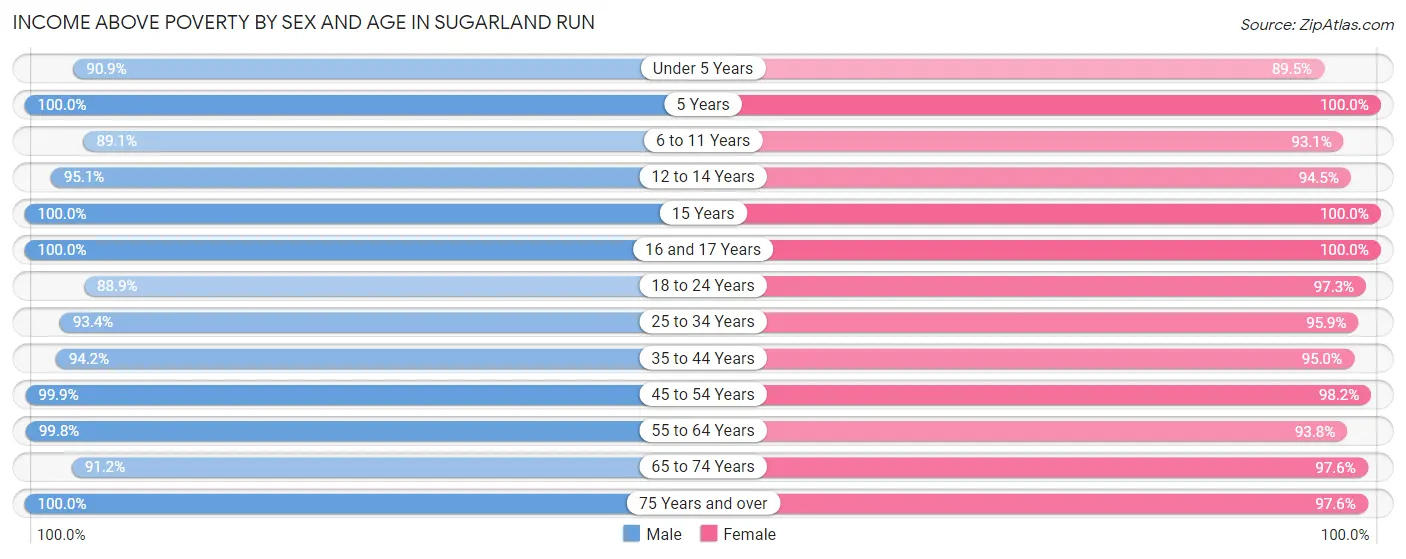
| Age Bracket | Male | Female |
| Under 5 Years | 281 (90.9%) | 366 (89.5%) |
| 5 Years | 143 (100.0%) | 32 (100.0%) |
| 6 to 11 Years | 374 (89.0%) | 448 (93.1%) |
| 12 to 14 Years | 292 (95.1%) | 239 (94.5%) |
| 15 Years | 17 (100.0%) | 32 (100.0%) |
| 16 and 17 Years | 255 (100.0%) | 262 (100.0%) |
| 18 to 24 Years | 772 (88.9%) | 608 (97.3%) |
| 25 to 34 Years | 855 (93.4%) | 902 (95.9%) |
| 35 to 44 Years | 1,022 (94.2%) | 938 (95.0%) |
| 45 to 54 Years | 729 (99.9%) | 893 (98.2%) |
| 55 to 64 Years | 801 (99.8%) | 680 (93.8%) |
| 65 to 74 Years | 291 (91.2%) | 403 (97.6%) |
| 75 Years and over | 194 (100.0%) | 364 (97.6%) |
| Total | 6,026 (94.7%) | 6,167 (95.7%) |
Income Below Poverty Among Married-Couple Families in Sugarland Run
The poverty statistics for married-couple families in Sugarland Run show that 4.2% or 106 of the total 2,498 families live below the poverty line. Families with 5 or more children have the highest poverty rate of 51.2%, comprising of 21 families. On the other hand, families with 3 or 4 children have the lowest poverty rate of 0.0%, which includes 0 families.
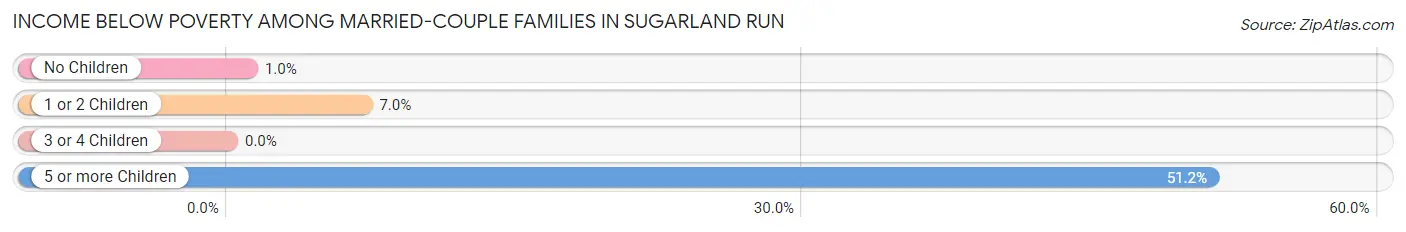
| Children | Above Poverty | Below Poverty |
| No Children | 1,140 (99.0%) | 12 (1.0%) |
| 1 or 2 Children | 967 (93.0%) | 73 (7.0%) |
| 3 or 4 Children | 265 (100.0%) | 0 (0.0%) |
| 5 or more Children | 20 (48.8%) | 21 (51.2%) |
| Total | 2,392 (95.8%) | 106 (4.2%) |
Income Below Poverty Among Single-Parent Households in Sugarland Run

| Children | Single Father | Single Mother |
| No Children | 0 (0.0%) | 0 (0.0%) |
| 1 or 2 Children | 0 (0.0%) | 0 (0.0%) |
| 3 or 4 Children | 0 (0.0%) | 0 (0.0%) |
| 5 or more Children | 0 (0.0%) | 0 (0.0%) |
| Total | 0 (0.0%) | 0 (0.0%) |
Income Below Poverty Among Married-Couple vs Single-Parent Households in Sugarland Run
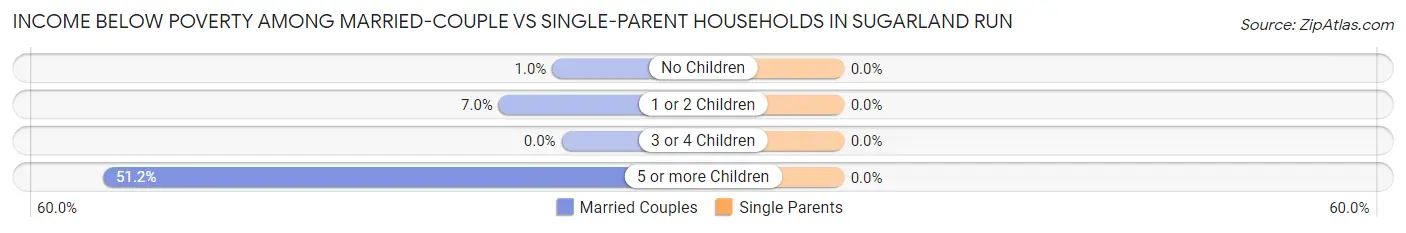
| Children | Married-Couple Families | Single-Parent Households |
| No Children | 12 (1.0%) | 0 (0.0%) |
| 1 or 2 Children | 73 (7.0%) | 0 (0.0%) |
| 3 or 4 Children | 0 (0.0%) | 0 (0.0%) |
| 5 or more Children | 21 (51.2%) | 0 (0.0%) |
| Total | 106 (4.2%) | 0 (0.0%) |
Race in Sugarland Run
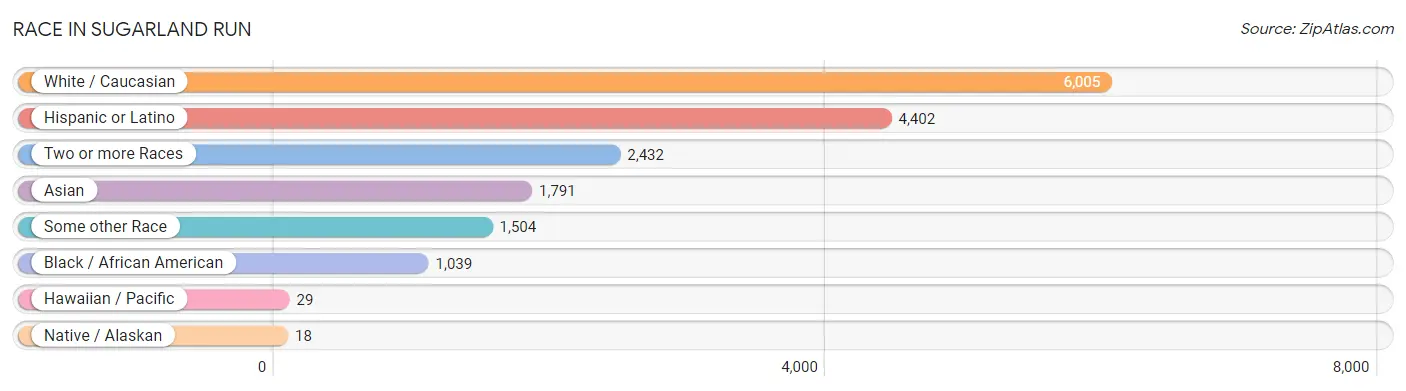
The most populous races in Sugarland Run are White / Caucasian (6,005 | 46.9%), Hispanic or Latino (4,402 | 34.3%), and Two or more Races (2,432 | 19.0%).
| Race | # Population | % Population |
| Asian | 1,791 | 14.0% |
| Black / African American | 1,039 | 8.1% |
| Hawaiian / Pacific | 29 | 0.2% |
| Hispanic or Latino | 4,402 | 34.3% |
| Native / Alaskan | 18 | 0.1% |
| White / Caucasian | 6,005 | 46.9% |
| Two or more Races | 2,432 | 19.0% |
| Some other Race | 1,504 | 11.7% |
| Total | 12,818 | 100.0% |
Ancestry in Sugarland Run
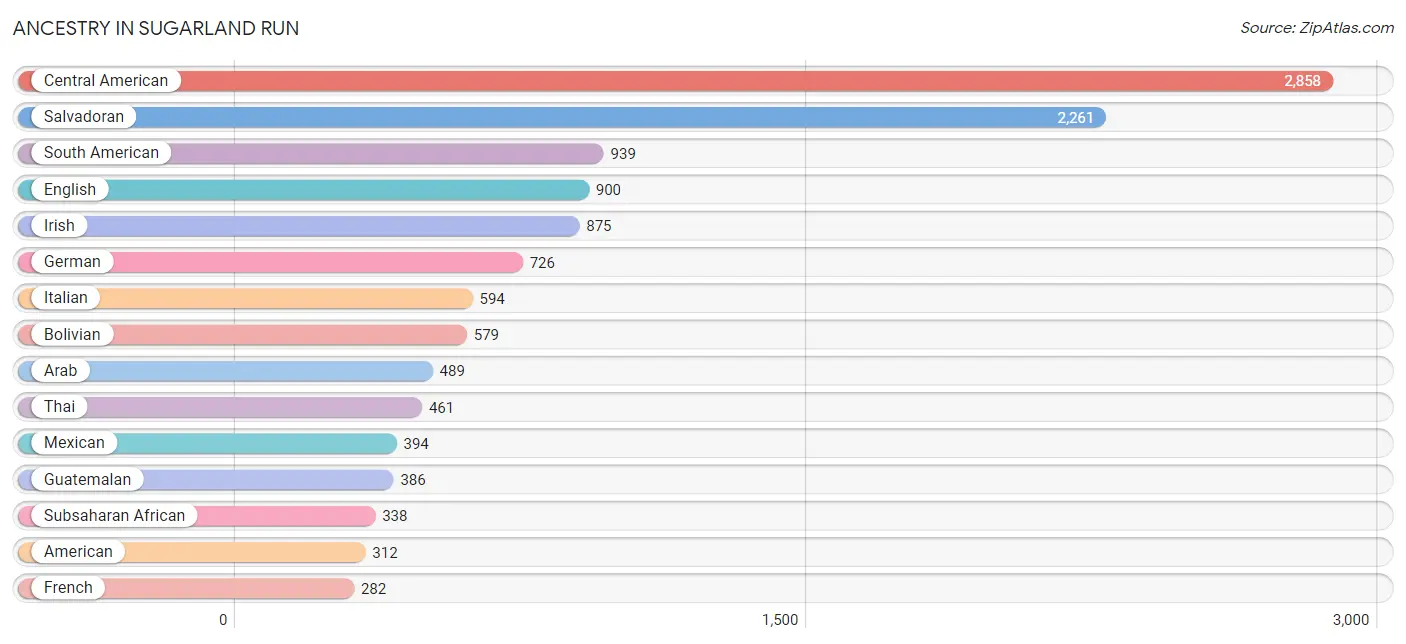
The most populous ancestries reported in Sugarland Run are Central American (2,858 | 22.3%), Salvadoran (2,261 | 17.6%), South American (939 | 7.3%), English (900 | 7.0%), and Irish (875 | 6.8%), together accounting for 61.1% of all Sugarland Run residents.
| Ancestry | # Population | % Population |
| Afghan | 125 | 1.0% |
| African | 53 | 0.4% |
| American | 312 | 2.4% |
| Arab | 489 | 3.8% |
| Argentinean | 17 | 0.1% |
| Belgian | 7 | 0.1% |
| Bhutanese | 39 | 0.3% |
| Bolivian | 579 | 4.5% |
| British | 42 | 0.3% |
| Burmese | 119 | 0.9% |
| Canadian | 9 | 0.1% |
| Central American | 2,858 | 22.3% |
| Central American Indian | 41 | 0.3% |
| Colombian | 81 | 0.6% |
| Costa Rican | 11 | 0.1% |
| Czech | 90 | 0.7% |
| Czechoslovakian | 12 | 0.1% |
| Danish | 21 | 0.2% |
| Dutch | 18 | 0.1% |
| Eastern European | 14 | 0.1% |
| Ecuadorian | 24 | 0.2% |
| English | 900 | 7.0% |
| Estonian | 12 | 0.1% |
| European | 272 | 2.1% |
| French | 282 | 2.2% |
| German | 726 | 5.7% |
| Ghanaian | 40 | 0.3% |
| Greek | 25 | 0.2% |
| Guatemalan | 386 | 3.0% |
| Honduran | 145 | 1.1% |
| Hungarian | 82 | 0.6% |
| Indian (Asian) | 106 | 0.8% |
| Iranian | 75 | 0.6% |
| Irish | 875 | 6.8% |
| Italian | 594 | 4.6% |
| Japanese | 29 | 0.2% |
| Korean | 164 | 1.3% |
| Lithuanian | 57 | 0.4% |
| Macedonian | 14 | 0.1% |
| Malaysian | 106 | 0.8% |
| Mexican | 394 | 3.1% |
| Mexican American Indian | 67 | 0.5% |
| Mongolian | 21 | 0.2% |
| Nicaraguan | 55 | 0.4% |
| Northern European | 11 | 0.1% |
| Norwegian | 33 | 0.3% |
| Pakistani | 111 | 0.9% |
| Peruvian | 227 | 1.8% |
| Polish | 187 | 1.5% |
| Portuguese | 34 | 0.3% |
| Puerto Rican | 86 | 0.7% |
| Puget Sound Salish | 7 | 0.1% |
| Romanian | 15 | 0.1% |
| Russian | 31 | 0.2% |
| Salvadoran | 2,261 | 17.6% |
| Scotch-Irish | 100 | 0.8% |
| Scottish | 205 | 1.6% |
| Slavic | 30 | 0.2% |
| Somali | 213 | 1.7% |
| South American | 939 | 7.3% |
| South American Indian | 47 | 0.4% |
| Spanish | 57 | 0.4% |
| Sri Lankan | 238 | 1.9% |
| Subsaharan African | 338 | 2.6% |
| Swedish | 43 | 0.3% |
| Swiss | 6 | 0.1% |
| Syrian | 282 | 2.2% |
| Thai | 461 | 3.6% |
| Trinidadian and Tobagonian | 35 | 0.3% |
| Ukrainian | 73 | 0.6% |
| Vietnamese | 124 | 1.0% |
| Welsh | 44 | 0.3% |
| Yugoslavian | 15 | 0.1% | View All 73 Rows |
Immigrants in Sugarland Run
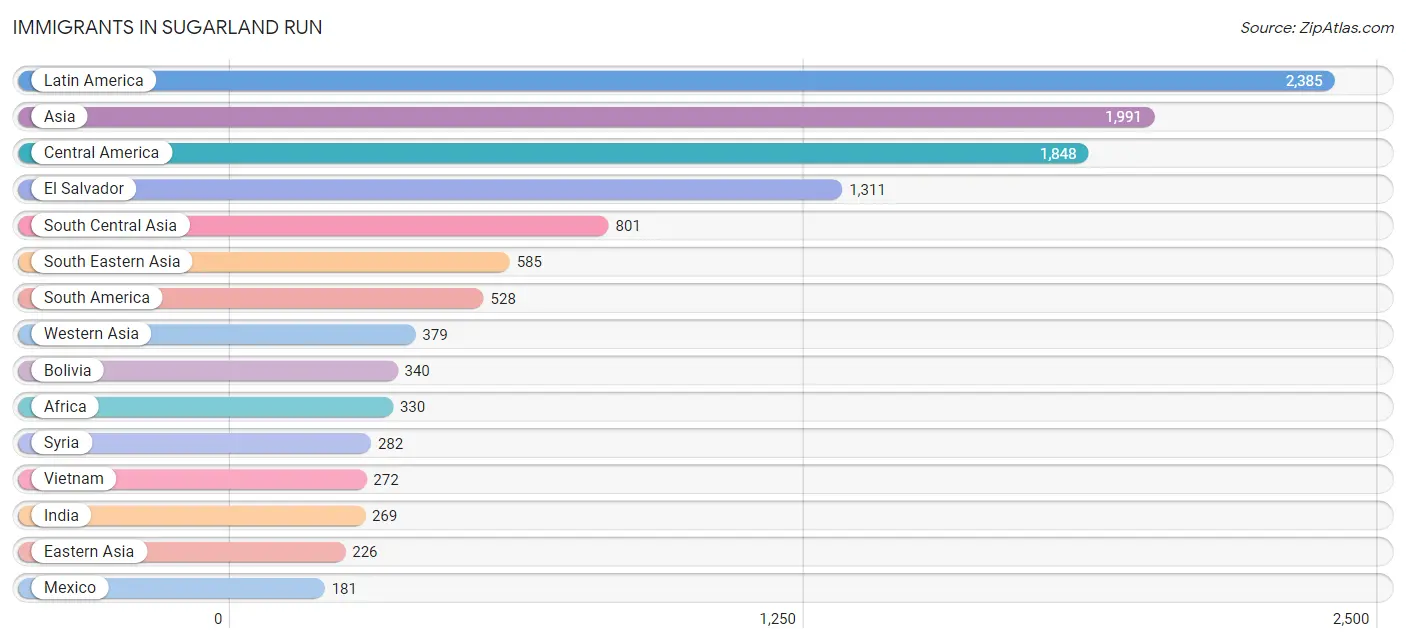
The most numerous immigrant groups reported in Sugarland Run came from Latin America (2,385 | 18.6%), Asia (1,991 | 15.5%), Central America (1,848 | 14.4%), El Salvador (1,311 | 10.2%), and South Central Asia (801 | 6.2%), together accounting for 65.0% of all Sugarland Run residents.
| Immigration Origin | # Population | % Population |
| Afghanistan | 166 | 1.3% |
| Africa | 330 | 2.6% |
| Argentina | 24 | 0.2% |
| Asia | 1,991 | 15.5% |
| Bangladesh | 93 | 0.7% |
| Bolivia | 340 | 2.6% |
| Bosnia and Herzegovina | 15 | 0.1% |
| Cambodia | 21 | 0.2% |
| Caribbean | 9 | 0.1% |
| Central America | 1,848 | 14.4% |
| Chile | 13 | 0.1% |
| China | 120 | 0.9% |
| Colombia | 11 | 0.1% |
| Costa Rica | 11 | 0.1% |
| Eastern Africa | 126 | 1.0% |
| Eastern Asia | 226 | 1.8% |
| Eastern Europe | 102 | 0.8% |
| Ecuador | 24 | 0.2% |
| El Salvador | 1,311 | 10.2% |
| England | 8 | 0.1% |
| Europe | 179 | 1.4% |
| France | 30 | 0.2% |
| Germany | 39 | 0.3% |
| Ghana | 40 | 0.3% |
| Guatemala | 150 | 1.2% |
| Guyana | 8 | 0.1% |
| Honduras | 140 | 1.1% |
| Hong Kong | 55 | 0.4% |
| Hungary | 39 | 0.3% |
| India | 269 | 2.1% |
| Iran | 110 | 0.9% |
| Japan | 27 | 0.2% |
| Korea | 79 | 0.6% |
| Laos | 59 | 0.5% |
| Latin America | 2,385 | 18.6% |
| Malaysia | 8 | 0.1% |
| Mexico | 181 | 1.4% |
| Middle Africa | 6 | 0.1% |
| Nicaragua | 55 | 0.4% |
| Nigeria | 18 | 0.1% |
| Northern Africa | 51 | 0.4% |
| Northern Europe | 8 | 0.1% |
| Pakistan | 163 | 1.3% |
| Peru | 108 | 0.8% |
| Philippines | 114 | 0.9% |
| Poland | 19 | 0.2% |
| Russia | 17 | 0.1% |
| Sierra Leone | 67 | 0.5% |
| Somalia | 114 | 0.9% |
| South America | 528 | 4.1% |
| South Central Asia | 801 | 6.2% |
| South Eastern Asia | 585 | 4.6% |
| Sudan | 16 | 0.1% |
| Syria | 282 | 2.2% |
| Thailand | 111 | 0.9% |
| Trinidad and Tobago | 9 | 0.1% |
| Vietnam | 272 | 2.1% |
| Western Africa | 147 | 1.1% |
| Western Asia | 379 | 3.0% |
| Western Europe | 69 | 0.5% |
| Yemen | 97 | 0.8% |
| Zimbabwe | 12 | 0.1% | View All 62 Rows |
Sex and Age in Sugarland Run
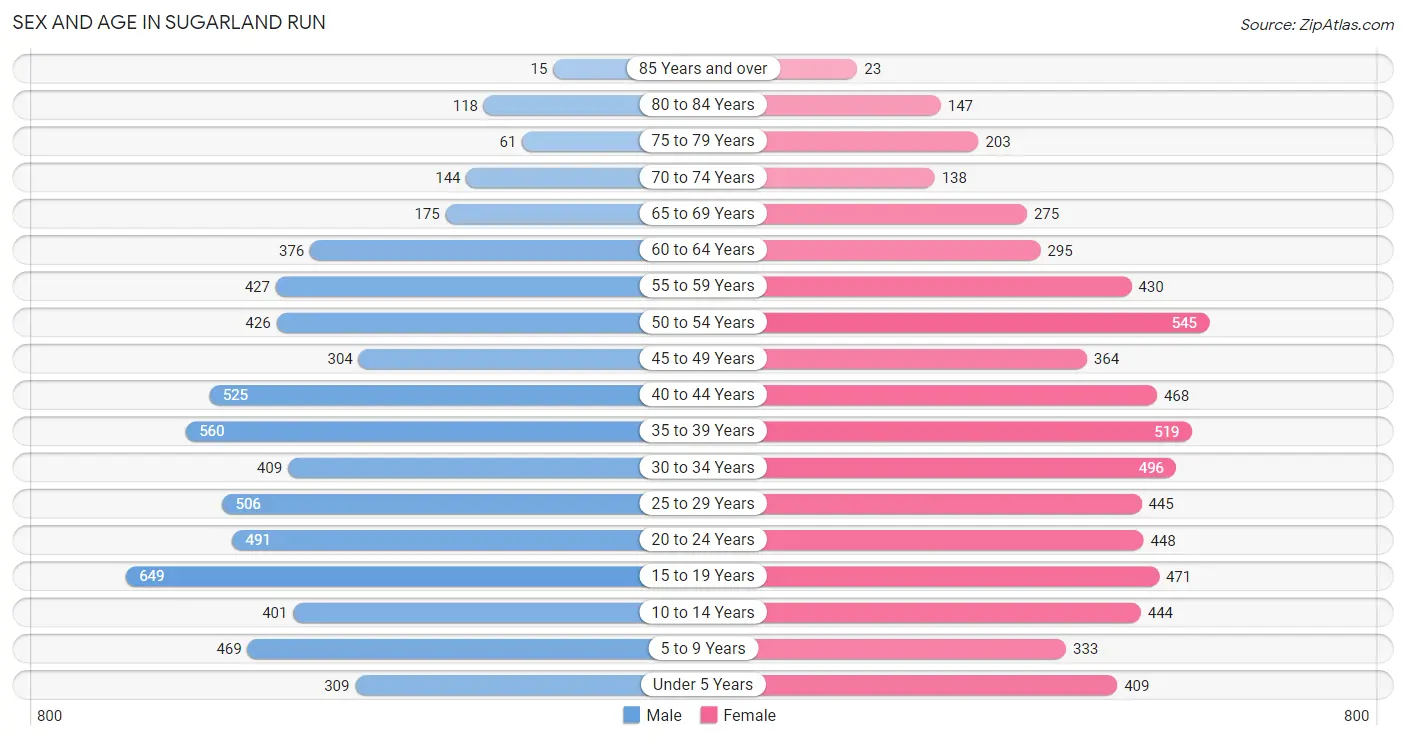
Sex and Age in Sugarland Run
The most populous age groups in Sugarland Run are 15 to 19 Years (649 | 10.2%) for men and 50 to 54 Years (545 | 8.5%) for women.
| Age Bracket | Male | Female |
| Under 5 Years | 309 (4.9%) | 409 (6.3%) |
| 5 to 9 Years | 469 (7.4%) | 333 (5.2%) |
| 10 to 14 Years | 401 (6.3%) | 444 (6.9%) |
| 15 to 19 Years | 649 (10.2%) | 471 (7.3%) |
| 20 to 24 Years | 491 (7.7%) | 448 (6.9%) |
| 25 to 29 Years | 506 (8.0%) | 445 (6.9%) |
| 30 to 34 Years | 409 (6.4%) | 496 (7.7%) |
| 35 to 39 Years | 560 (8.8%) | 519 (8.0%) |
| 40 to 44 Years | 525 (8.3%) | 468 (7.2%) |
| 45 to 49 Years | 304 (4.8%) | 364 (5.6%) |
| 50 to 54 Years | 426 (6.7%) | 545 (8.5%) |
| 55 to 59 Years | 427 (6.7%) | 430 (6.7%) |
| 60 to 64 Years | 376 (5.9%) | 295 (4.6%) |
| 65 to 69 Years | 175 (2.8%) | 275 (4.3%) |
| 70 to 74 Years | 144 (2.3%) | 138 (2.1%) |
| 75 to 79 Years | 61 (1.0%) | 203 (3.2%) |
| 80 to 84 Years | 118 (1.8%) | 147 (2.3%) |
| 85 Years and over | 15 (0.2%) | 23 (0.4%) |
| Total | 6,365 (100.0%) | 6,453 (100.0%) |
Families and Households in Sugarland Run
Median Family Size in Sugarland Run
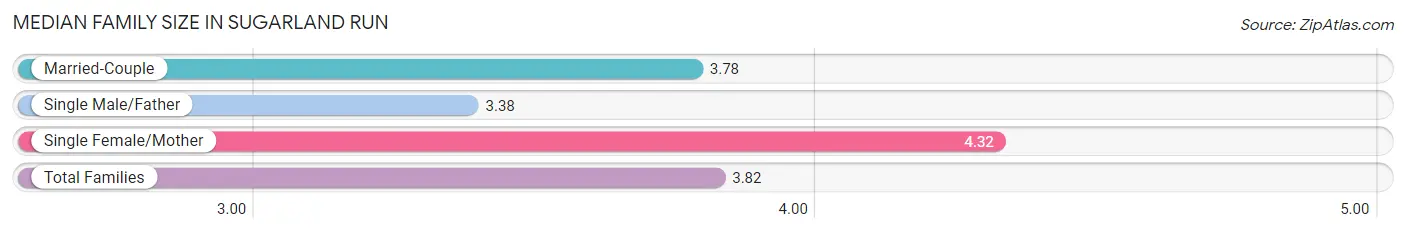
The median family size in Sugarland Run is 3.82 persons per family, with single female/mother families (346 | 11.6%) accounting for the largest median family size of 4.32 persons per family. On the other hand, single male/father families (134 | 4.5%) represent the smallest median family size with 3.38 persons per family.
| Family Type | # Families | Family Size |
| Married-Couple | 2,498 (83.9%) | 3.78 |
| Single Male/Father | 134 (4.5%) | 3.38 |
| Single Female/Mother | 346 (11.6%) | 4.32 |
| Total Families | 2,978 (100.0%) | 3.82 |
Median Household Size in Sugarland Run
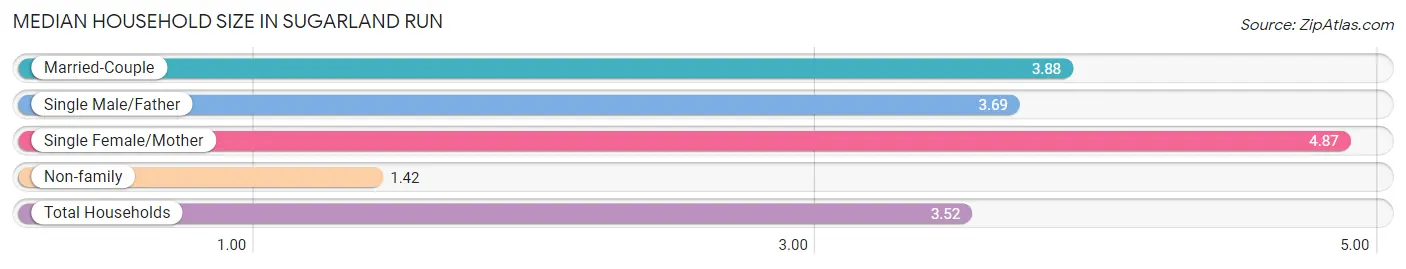
The median household size in Sugarland Run is 3.52 persons per household, with single female/mother households (346 | 9.5%) accounting for the largest median household size of 4.87 persons per household. non-family households (657 | 18.1%) represent the smallest median household size with 1.42 persons per household.
| Household Type | # Households | Household Size |
| Married-Couple | 2,498 (68.7%) | 3.88 |
| Single Male/Father | 134 (3.7%) | 3.69 |
| Single Female/Mother | 346 (9.5%) | 4.87 |
| Non-family | 657 (18.1%) | 1.42 |
| Total Households | 3,635 (100.0%) | 3.52 |
Household Size by Marriage Status in Sugarland Run
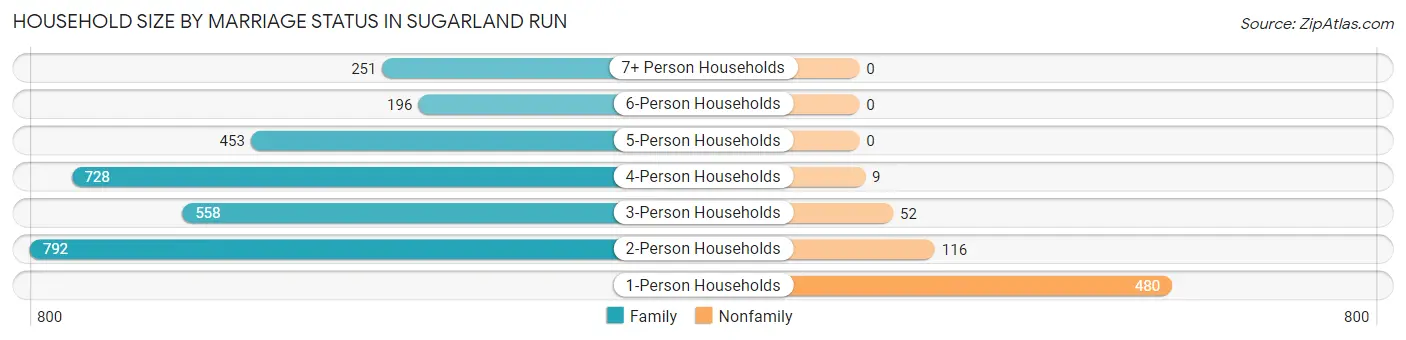
Out of a total of 3,635 households in Sugarland Run, 2,978 (81.9%) are family households, while 657 (18.1%) are nonfamily households. The most numerous type of family households are 2-person households, comprising 792, and the most common type of nonfamily households are 1-person households, comprising 480.
| Household Size | Family Households | Nonfamily Households |
| 1-Person Households | - | 480 (13.2%) |
| 2-Person Households | 792 (21.8%) | 116 (3.2%) |
| 3-Person Households | 558 (15.3%) | 52 (1.4%) |
| 4-Person Households | 728 (20.0%) | 9 (0.3%) |
| 5-Person Households | 453 (12.5%) | 0 (0.0%) |
| 6-Person Households | 196 (5.4%) | 0 (0.0%) |
| 7+ Person Households | 251 (6.9%) | 0 (0.0%) |
| Total | 2,978 (81.9%) | 657 (18.1%) |
Female Fertility in Sugarland Run
Fertility by Age in Sugarland Run
Average fertility rate in Sugarland Run is 81.0 births per 1,000 women. Women in the age bracket of 20 to 34 years have the highest fertility rate with 113.0 births per 1,000 women. Women in the age bracket of 20 to 34 years acount for 59.5% of all women with births.
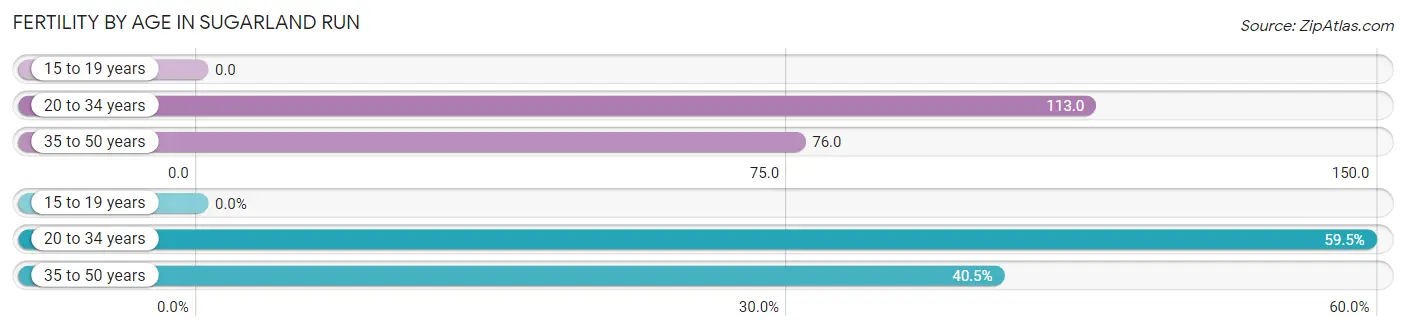
| Age Bracket | Women with Births | Births / 1,000 Women |
| 15 to 19 years | 0 (0.0%) | 0.0 |
| 20 to 34 years | 157 (59.5%) | 113.0 |
| 35 to 50 years | 107 (40.5%) | 76.0 |
| Total | 264 (100.0%) | 81.0 |
Fertility by Age by Marriage Status in Sugarland Run
70.5% of women with births (264) in Sugarland Run are married. The highest percentage of unmarried women with births falls into 35 to 50 years age bracket with 60.8% of them unmarried at the time of birth, while the lowest percentage of unmarried women with births belong to 20 to 34 years age bracket with 8.3% of them unmarried.
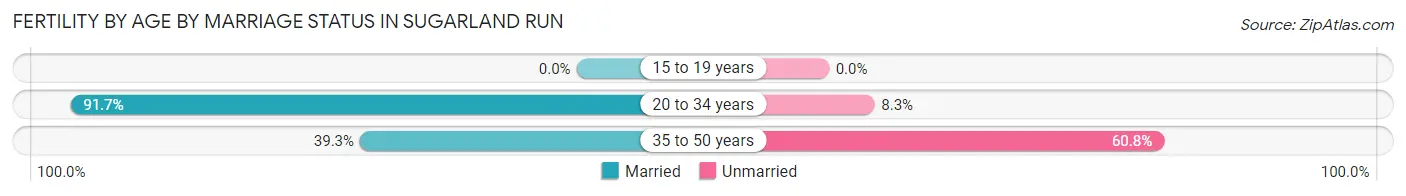
| Age Bracket | Married | Unmarried |
| 15 to 19 years | 0 (0.0%) | 0 (0.0%) |
| 20 to 34 years | 144 (91.7%) | 13 (8.3%) |
| 35 to 50 years | 42 (39.3%) | 65 (60.8%) |
| Total | 186 (70.5%) | 78 (29.5%) |
Fertility by Education in Sugarland Run
Average fertility rate in Sugarland Run is 81.0 births per 1,000 women. Women with the education attainment of graduate degree have the highest fertility rate of 175.0 births per 1,000 women, while women with the education attainment of college or associate's degree have the lowest fertility at 18.0 births per 1,000 women. Women with the education attainment of bachelor's degree represent 34.5% of all women with births.
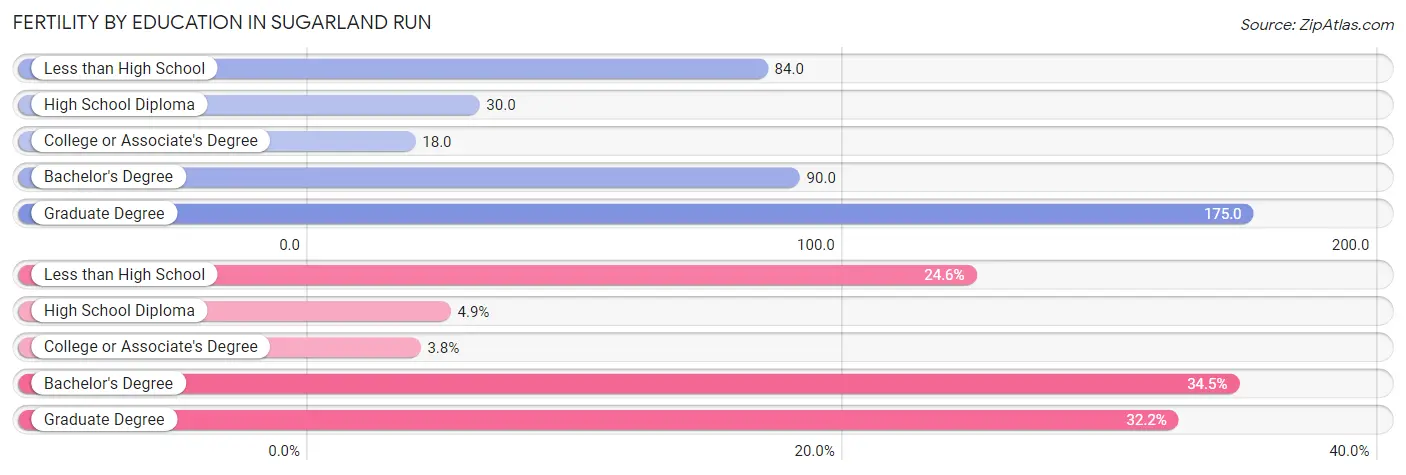
| Educational Attainment | Women with Births | Births / 1,000 Women |
| Less than High School | 65 (24.6%) | 84.0 |
| High School Diploma | 13 (4.9%) | 30.0 |
| College or Associate's Degree | 10 (3.8%) | 18.0 |
| Bachelor's Degree | 91 (34.5%) | 90.0 |
| Graduate Degree | 85 (32.2%) | 175.0 |
| Total | 264 (100.0%) | 81.0 |
Fertility by Education by Marriage Status in Sugarland Run
29.5% of women with births in Sugarland Run are unmarried. Women with the educational attainment of college or associate's degree are most likely to be married with 100.0% of them married at childbirth, while women with the educational attainment of less than high school are least likely to be married with 100.0% of them unmarried at childbirth.
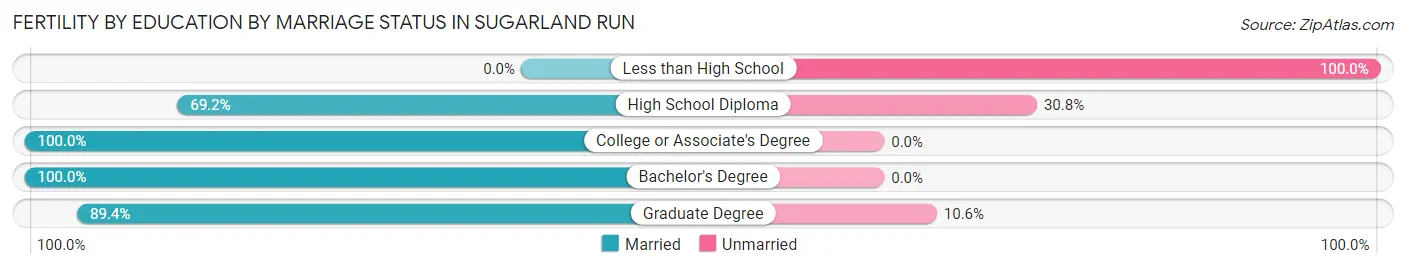
| Educational Attainment | Married | Unmarried |
| Less than High School | 0 (0.0%) | 65 (100.0%) |
| High School Diploma | 9 (69.2%) | 4 (30.8%) |
| College or Associate's Degree | 10 (100.0%) | 0 (0.0%) |
| Bachelor's Degree | 91 (100.0%) | 0 (0.0%) |
| Graduate Degree | 76 (89.4%) | 9 (10.6%) |
| Total | 186 (70.5%) | 78 (29.5%) |
Employment Characteristics in Sugarland Run
Employment by Class of Employer in Sugarland Run
Among the 7,095 employed individuals in Sugarland Run, private company employees (4,917 | 69.3%), federal government employees (704 | 9.9%), and local government employees (568 | 8.0%) make up the most common classes of employment.
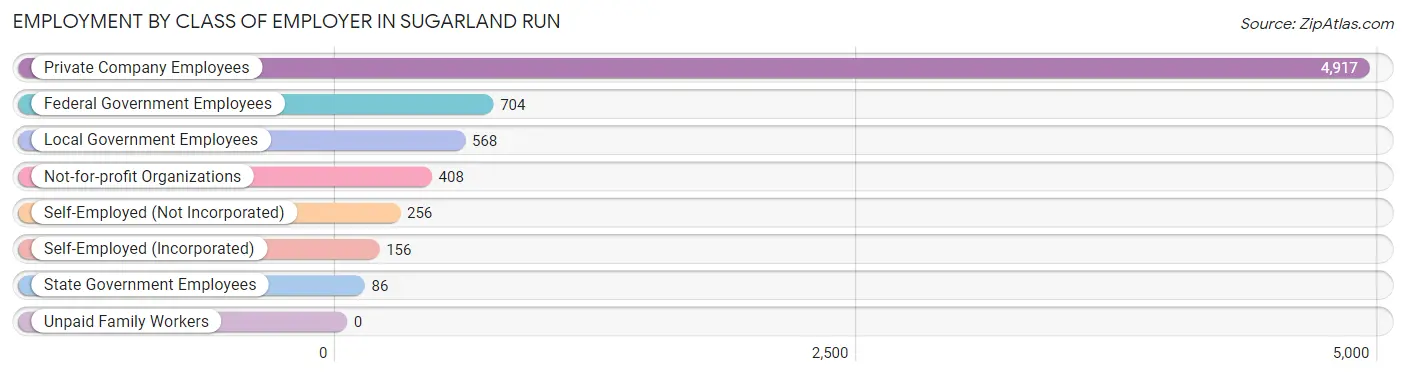
| Employer Class | # Employees | % Employees |
| Private Company Employees | 4,917 | 69.3% |
| Self-Employed (Incorporated) | 156 | 2.2% |
| Self-Employed (Not Incorporated) | 256 | 3.6% |
| Not-for-profit Organizations | 408 | 5.8% |
| Local Government Employees | 568 | 8.0% |
| State Government Employees | 86 | 1.2% |
| Federal Government Employees | 704 | 9.9% |
| Unpaid Family Workers | 0 | 0.0% |
| Total | 7,095 | 100.0% |
Employment Status by Age in Sugarland Run
According to the labor force statistics for Sugarland Run, out of the total population over 16 years of age (10,404), 72.3% or 7,522 individuals are in the labor force, with 4.5% or 338 of them unemployed. The age group with the highest labor force participation rate is 45 to 54 years, with 91.5% or 1,500 individuals in the labor force. Within the labor force, the 16 to 19 years age range has the highest percentage of unemployed individuals, with 18.8% or 58 of them being unemployed.
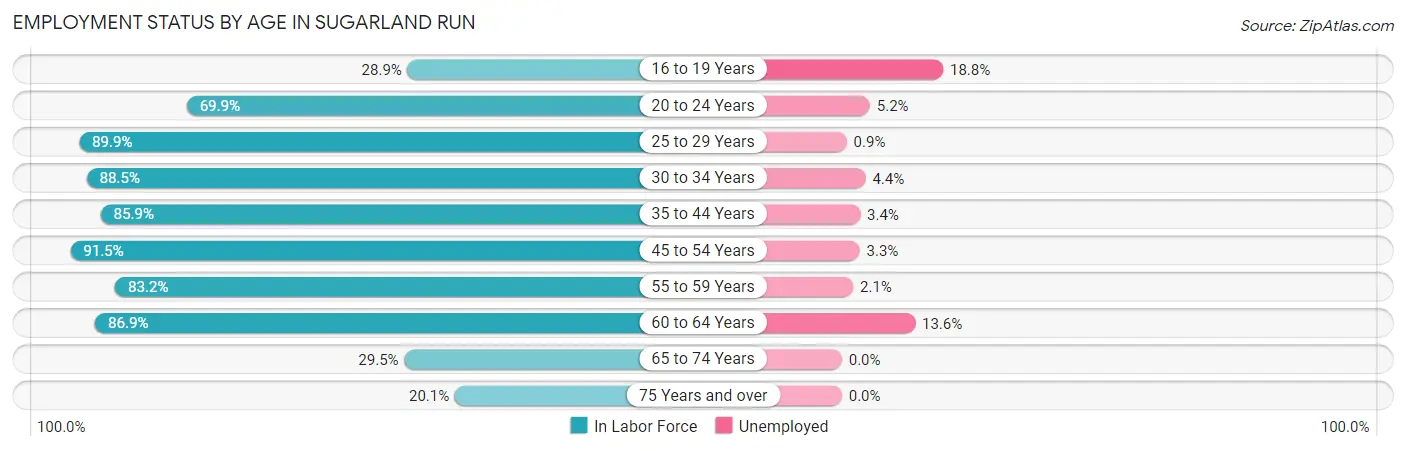
| Age Bracket | In Labor Force | Unemployed |
| 16 to 19 Years | 310 (28.9%) | 58 (18.8%) |
| 20 to 24 Years | 656 (69.9%) | 34 (5.2%) |
| 25 to 29 Years | 855 (89.9%) | 8 (0.9%) |
| 30 to 34 Years | 801 (88.5%) | 35 (4.4%) |
| 35 to 44 Years | 1,780 (85.9%) | 61 (3.4%) |
| 45 to 54 Years | 1,500 (91.5%) | 50 (3.3%) |
| 55 to 59 Years | 713 (83.2%) | 15 (2.1%) |
| 60 to 64 Years | 583 (86.9%) | 79 (13.6%) |
| 65 to 74 Years | 216 (29.5%) | 0 (0.0%) |
| 75 Years and over | 114 (20.1%) | 0 (0.0%) |
| Total | 7,522 (72.3%) | 338 (4.5%) |
Employment Status by Educational Attainment in Sugarland Run
According to labor force statistics for Sugarland Run, 87.8% of individuals (6,229) out of the total population between 25 and 64 years of age (7,095) are in the labor force, with 4.0% or 249 of them being unemployed. The group with the highest labor force participation rate are those with the educational attainment of college / associate degree, with 94.4% or 1,616 individuals in the labor force. Within the labor force, individuals with college / associate degree education have the highest percentage of unemployment, with 5.9% or 95 of them being unemployed.
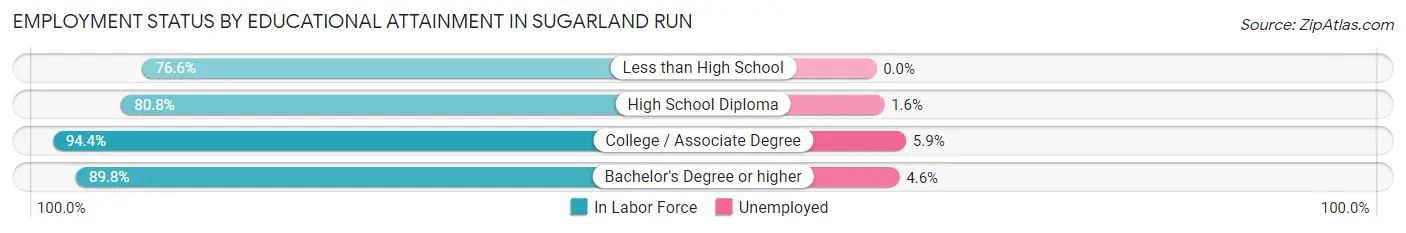
| Educational Attainment | In Labor Force | Unemployed |
| Less than High School | 816 (76.6%) | 0 (0.0%) |
| High School Diploma | 708 (80.8%) | 14 (1.6%) |
| College / Associate Degree | 1,616 (94.4%) | 101 (5.9%) |
| Bachelor's Degree or higher | 3,091 (89.8%) | 158 (4.6%) |
| Total | 6,229 (87.8%) | 284 (4.0%) |
Employment Occupations by Sex in Sugarland Run
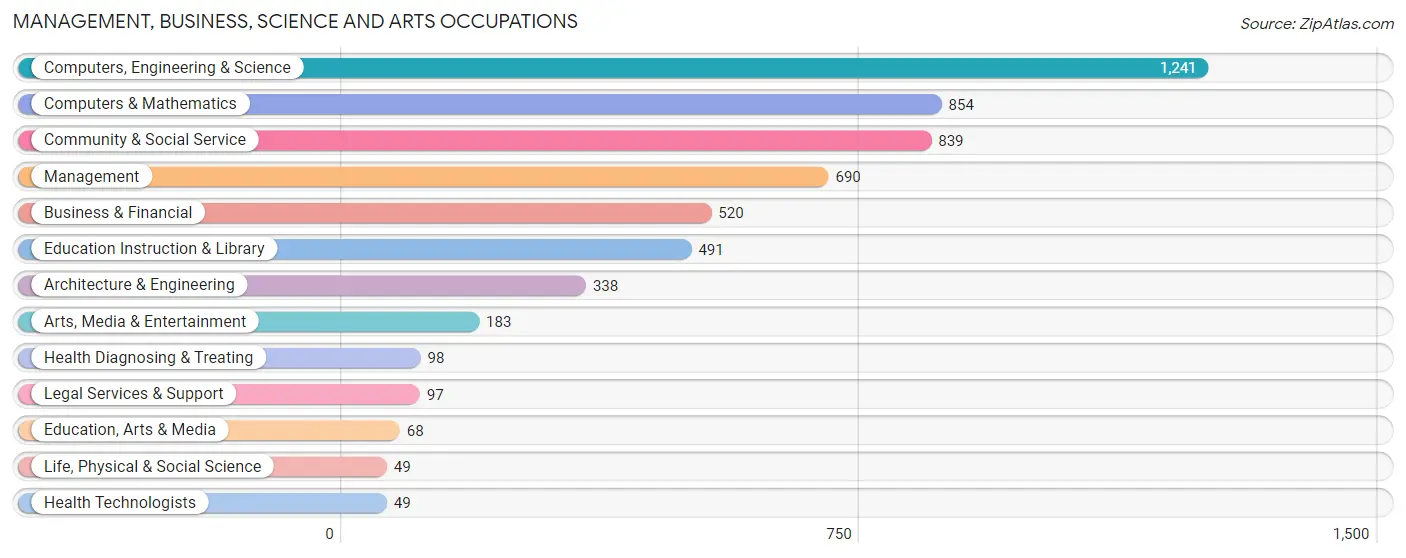
Management, Business, Science and Arts Occupations
The most common Management, Business, Science and Arts occupations in Sugarland Run are Computers, Engineering & Science (1,241 | 17.3%), Computers & Mathematics (854 | 11.9%), Community & Social Service (839 | 11.7%), Management (690 | 9.6%), and Business & Financial (520 | 7.2%).
Management, Business, Science and Arts Occupations by Sex
Within the Management, Business, Science and Arts occupations in Sugarland Run, the most male-oriented occupations are Arts, Media & Entertainment (93.4%), Architecture & Engineering (84.9%), and Legal Services & Support (75.3%), while the most female-oriented occupations are Life, Physical & Social Science (77.5%), Education Instruction & Library (77.4%), and Education, Arts & Media (67.6%).
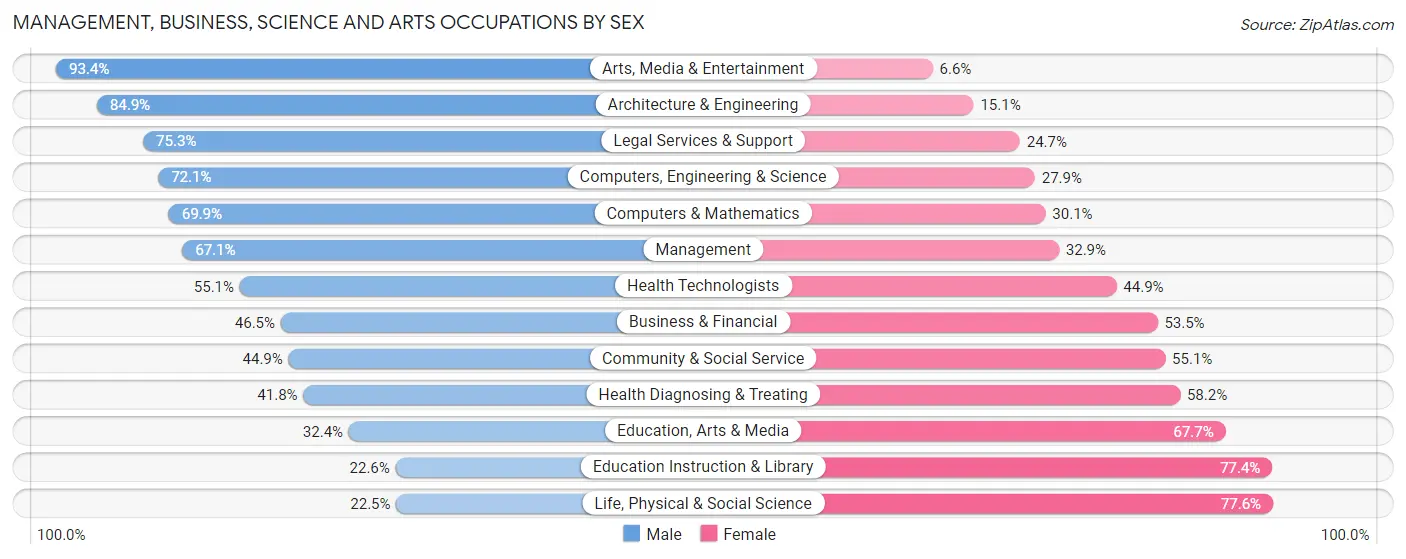
| Occupation | Male | Female |
| Management | 463 (67.1%) | 227 (32.9%) |
| Business & Financial | 242 (46.5%) | 278 (53.5%) |
| Computers, Engineering & Science | 895 (72.1%) | 346 (27.9%) |
| Computers & Mathematics | 597 (69.9%) | 257 (30.1%) |
| Architecture & Engineering | 287 (84.9%) | 51 (15.1%) |
| Life, Physical & Social Science | 11 (22.5%) | 38 (77.5%) |
| Community & Social Service | 377 (44.9%) | 462 (55.1%) |
| Education, Arts & Media | 22 (32.4%) | 46 (67.6%) |
| Legal Services & Support | 73 (75.3%) | 24 (24.7%) |
| Education Instruction & Library | 111 (22.6%) | 380 (77.4%) |
| Arts, Media & Entertainment | 171 (93.4%) | 12 (6.6%) |
| Health Diagnosing & Treating | 41 (41.8%) | 57 (58.2%) |
| Health Technologists | 27 (55.1%) | 22 (44.9%) |
| Total (Category) | 2,018 (59.6%) | 1,370 (40.4%) |
| Total (Overall) | 3,943 (55.0%) | 3,227 (45.0%) |
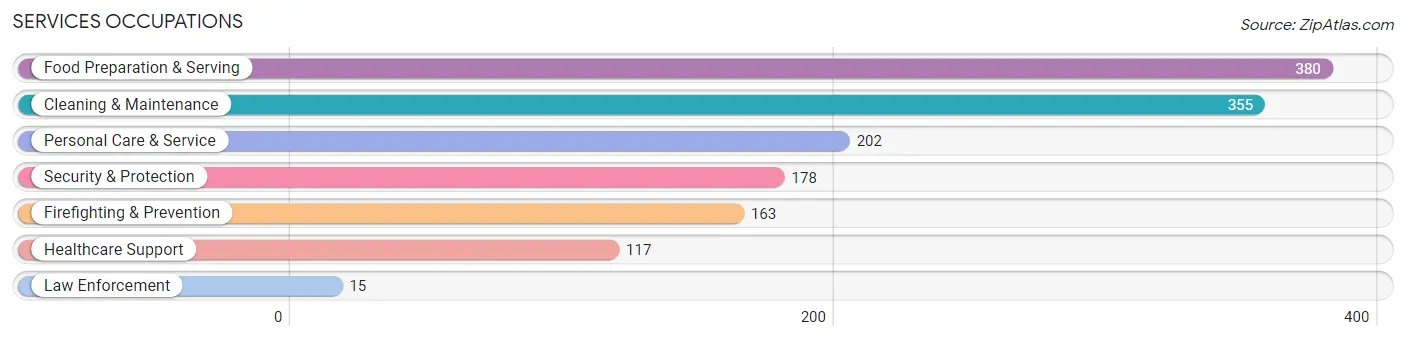
Services Occupations
The most common Services occupations in Sugarland Run are Food Preparation & Serving (380 | 5.3%), Cleaning & Maintenance (355 | 5.0%), Personal Care & Service (202 | 2.8%), Security & Protection (178 | 2.5%), and Firefighting & Prevention (163 | 2.3%).
Services Occupations by Sex
Within the Services occupations in Sugarland Run, the most male-oriented occupations are Food Preparation & Serving (48.7%), Firefighting & Prevention (46.0%), and Cleaning & Maintenance (42.5%), while the most female-oriented occupations are Healthcare Support (100.0%), Law Enforcement (100.0%), and Personal Care & Service (82.7%).
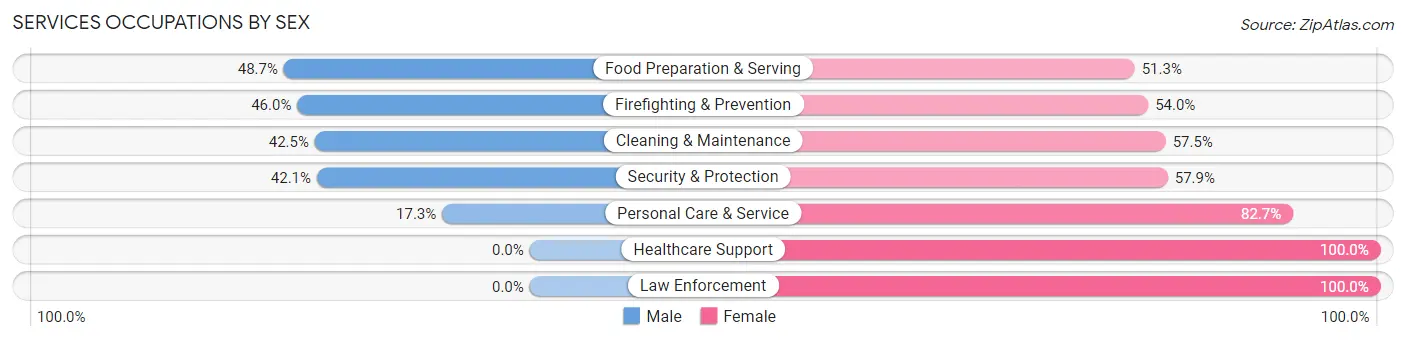
| Occupation | Male | Female |
| Healthcare Support | 0 (0.0%) | 117 (100.0%) |
| Security & Protection | 75 (42.1%) | 103 (57.9%) |
| Firefighting & Prevention | 75 (46.0%) | 88 (54.0%) |
| Law Enforcement | 0 (0.0%) | 15 (100.0%) |
| Food Preparation & Serving | 185 (48.7%) | 195 (51.3%) |
| Cleaning & Maintenance | 151 (42.5%) | 204 (57.5%) |
| Personal Care & Service | 35 (17.3%) | 167 (82.7%) |
| Total (Category) | 446 (36.2%) | 786 (63.8%) |
| Total (Overall) | 3,943 (55.0%) | 3,227 (45.0%) |
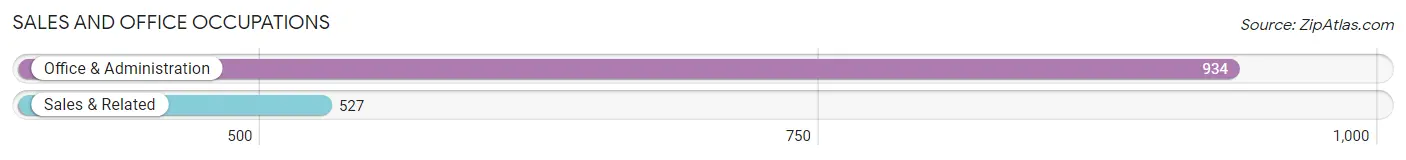
Sales and Office Occupations
The most common Sales and Office occupations in Sugarland Run are Office & Administration (934 | 13.0%), and Sales & Related (527 | 7.3%).
Sales and Office Occupations by Sex
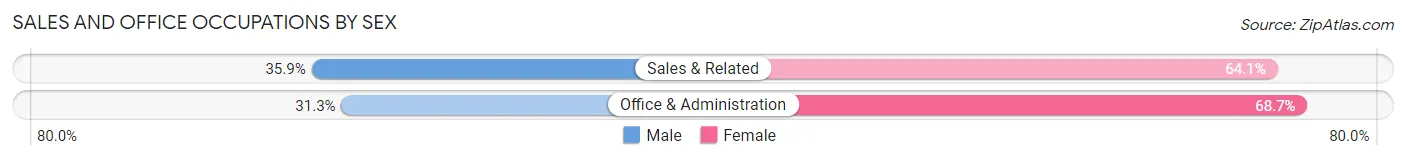
| Occupation | Male | Female |
| Sales & Related | 189 (35.9%) | 338 (64.1%) |
| Office & Administration | 292 (31.3%) | 642 (68.7%) |
| Total (Category) | 481 (32.9%) | 980 (67.1%) |
| Total (Overall) | 3,943 (55.0%) | 3,227 (45.0%) |
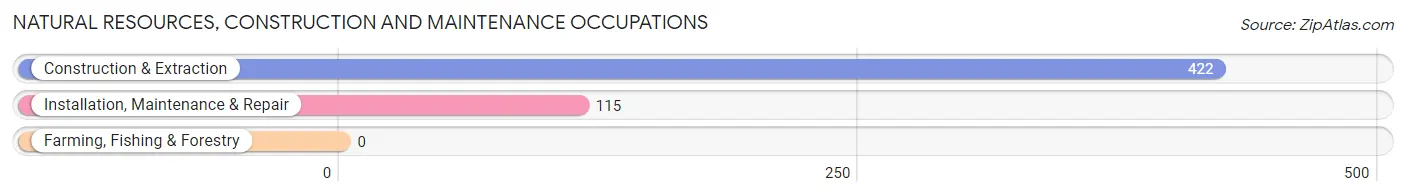
Natural Resources, Construction and Maintenance Occupations
The most common Natural Resources, Construction and Maintenance occupations in Sugarland Run are Construction & Extraction (422 | 5.9%), and Installation, Maintenance & Repair (115 | 1.6%).
Natural Resources, Construction and Maintenance Occupations by Sex
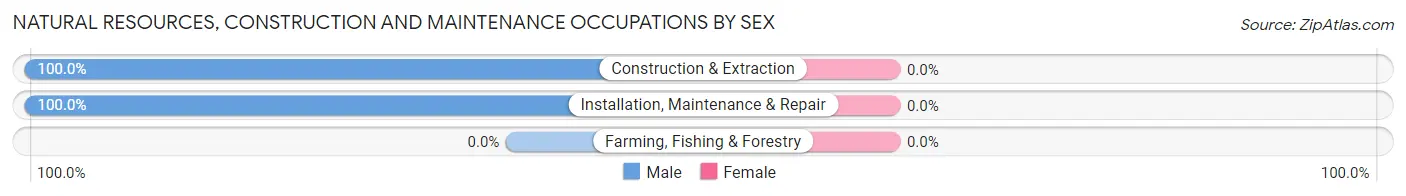
| Occupation | Male | Female |
| Farming, Fishing & Forestry | 0 (0.0%) | 0 (0.0%) |
| Construction & Extraction | 422 (100.0%) | 0 (0.0%) |
| Installation, Maintenance & Repair | 115 (100.0%) | 0 (0.0%) |
| Total (Category) | 537 (100.0%) | 0 (0.0%) |
| Total (Overall) | 3,943 (55.0%) | 3,227 (45.0%) |
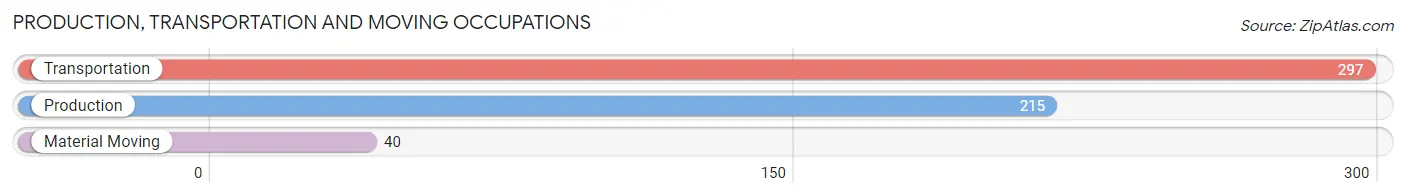
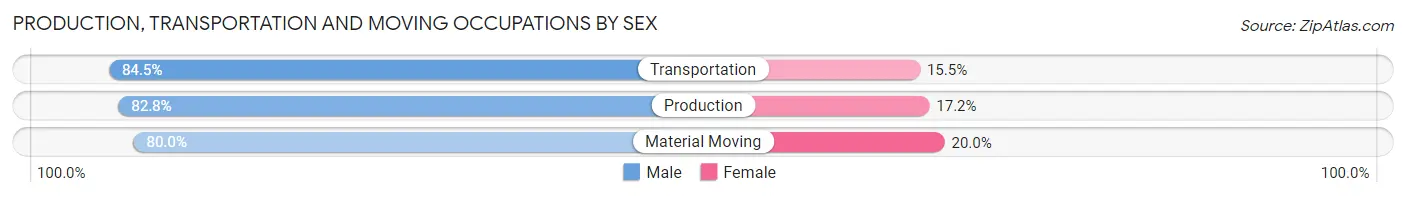
Production, Transportation and Moving Occupations
The most common Production, Transportation and Moving occupations in Sugarland Run are Transportation (297 | 4.1%), Production (215 | 3.0%), and Material Moving (40 | 0.6%).
Production, Transportation and Moving Occupations by Sex
| Occupation | Male | Female |
| Production | 178 (82.8%) | 37 (17.2%) |
| Transportation | 251 (84.5%) | 46 (15.5%) |
| Material Moving | 32 (80.0%) | 8 (20.0%) |
| Total (Category) | 461 (83.5%) | 91 (16.5%) |
| Total (Overall) | 3,943 (55.0%) | 3,227 (45.0%) |
Employment Industries by Sex in Sugarland Run
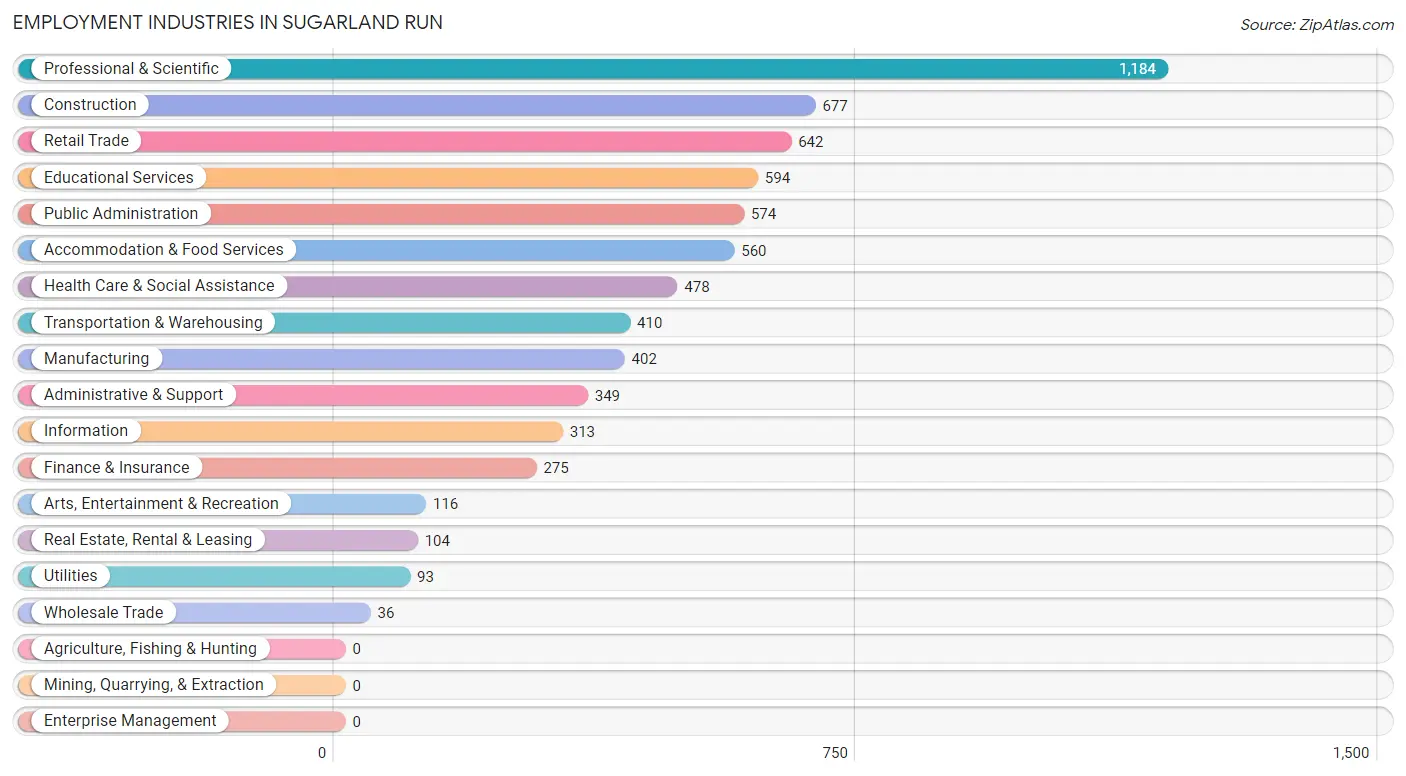
Employment Industries in Sugarland Run
The major employment industries in Sugarland Run include Professional & Scientific (1,184 | 16.5%), Construction (677 | 9.4%), Retail Trade (642 | 8.9%), Educational Services (594 | 8.3%), and Public Administration (574 | 8.0%).
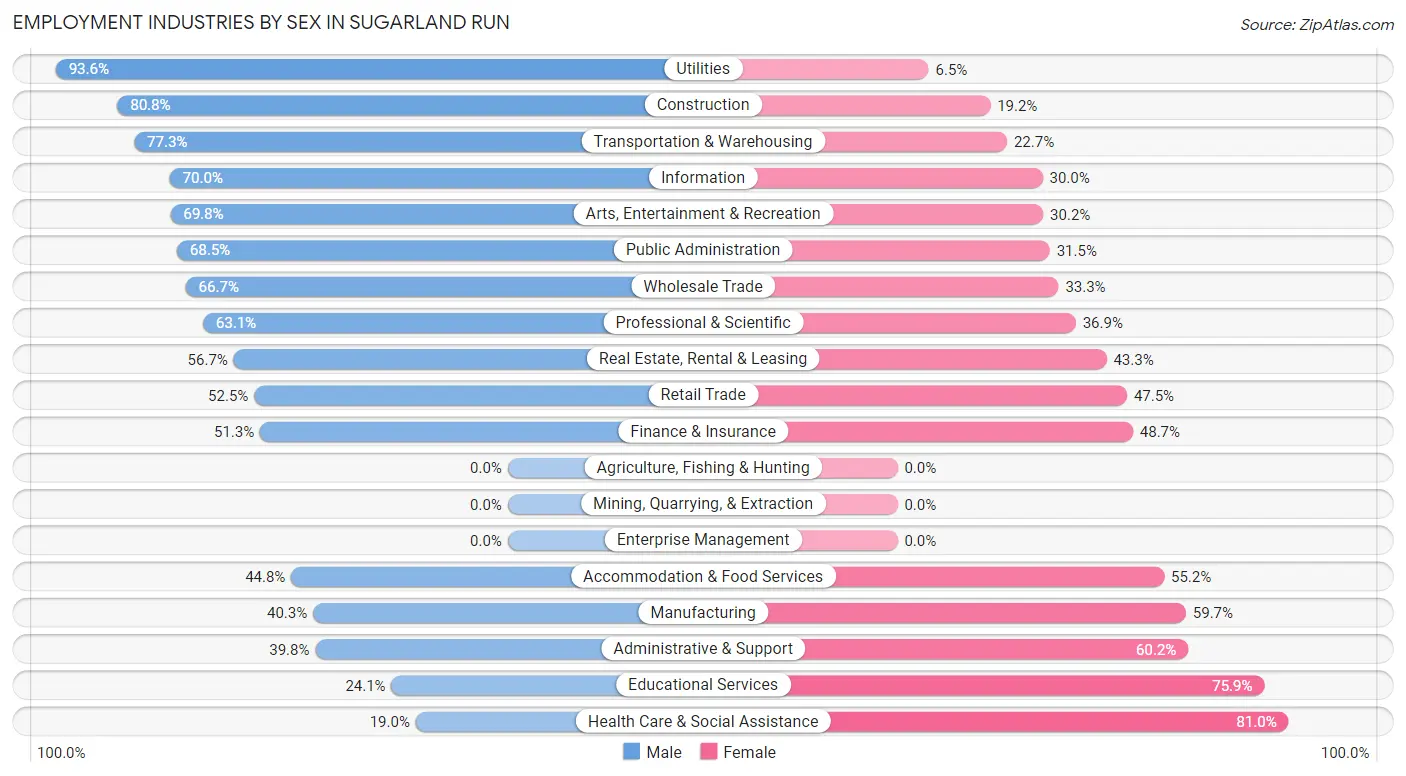
Employment Industries by Sex in Sugarland Run
The Sugarland Run industries that see more men than women are Utilities (93.5%), Construction (80.8%), and Transportation & Warehousing (77.3%), whereas the industries that tend to have a higher number of women are Health Care & Social Assistance (81.0%), Educational Services (75.9%), and Administrative & Support (60.2%).
| Industry | Male | Female |
| Agriculture, Fishing & Hunting | 0 (0.0%) | 0 (0.0%) |
| Mining, Quarrying, & Extraction | 0 (0.0%) | 0 (0.0%) |
| Construction | 547 (80.8%) | 130 (19.2%) |
| Manufacturing | 162 (40.3%) | 240 (59.7%) |
| Wholesale Trade | 24 (66.7%) | 12 (33.3%) |
| Retail Trade | 337 (52.5%) | 305 (47.5%) |
| Transportation & Warehousing | 317 (77.3%) | 93 (22.7%) |
| Utilities | 87 (93.5%) | 6 (6.5%) |
| Information | 219 (70.0%) | 94 (30.0%) |
| Finance & Insurance | 141 (51.3%) | 134 (48.7%) |
| Real Estate, Rental & Leasing | 59 (56.7%) | 45 (43.3%) |
| Professional & Scientific | 747 (63.1%) | 437 (36.9%) |
| Enterprise Management | 0 (0.0%) | 0 (0.0%) |
| Administrative & Support | 139 (39.8%) | 210 (60.2%) |
| Educational Services | 143 (24.1%) | 451 (75.9%) |
| Health Care & Social Assistance | 91 (19.0%) | 387 (81.0%) |
| Arts, Entertainment & Recreation | 81 (69.8%) | 35 (30.2%) |
| Accommodation & Food Services | 251 (44.8%) | 309 (55.2%) |
| Public Administration | 393 (68.5%) | 181 (31.5%) |
| Total | 3,943 (55.0%) | 3,227 (45.0%) |
Education in Sugarland Run
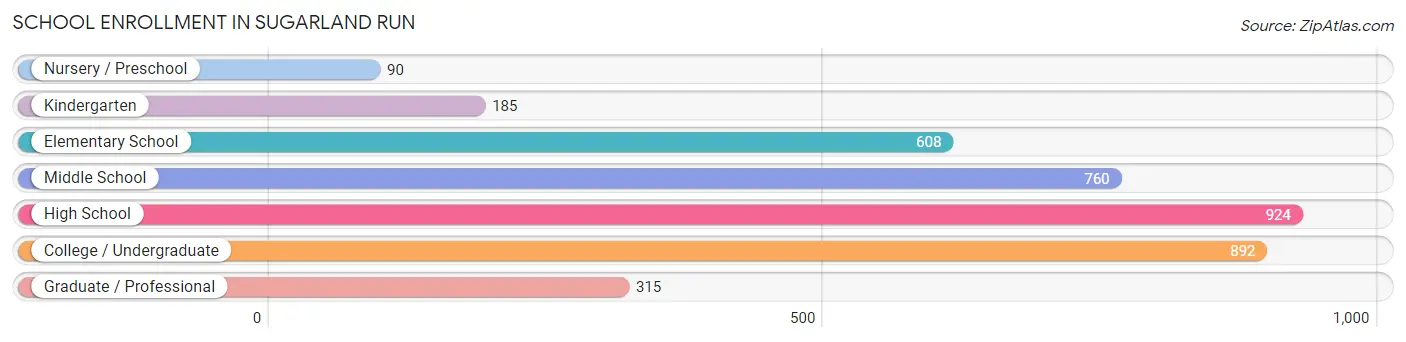
School Enrollment in Sugarland Run
The most common levels of schooling among the 3,774 students in Sugarland Run are high school (924 | 24.5%), college / undergraduate (892 | 23.6%), and middle school (760 | 20.1%).
| School Level | # Students | % Students |
| Nursery / Preschool | 90 | 2.4% |
| Kindergarten | 185 | 4.9% |
| Elementary School | 608 | 16.1% |
| Middle School | 760 | 20.1% |
| High School | 924 | 24.5% |
| College / Undergraduate | 892 | 23.6% |
| Graduate / Professional | 315 | 8.4% |
| Total | 3,774 | 100.0% |
School Enrollment by Age by Funding Source in Sugarland Run
Out of a total of 3,774 students who are enrolled in schools in Sugarland Run, 464 (12.3%) attend a private institution, while the remaining 3,310 (87.7%) are enrolled in public schools. The age group of 3 to 4 year olds has the highest likelihood of being enrolled in private schools, with 35 (45.5% in the age bracket) enrolled. Conversely, the age group of 10 to 14 year olds has the lowest likelihood of being enrolled in a private school, with 799 (94.6% in the age bracket) attending a public institution.
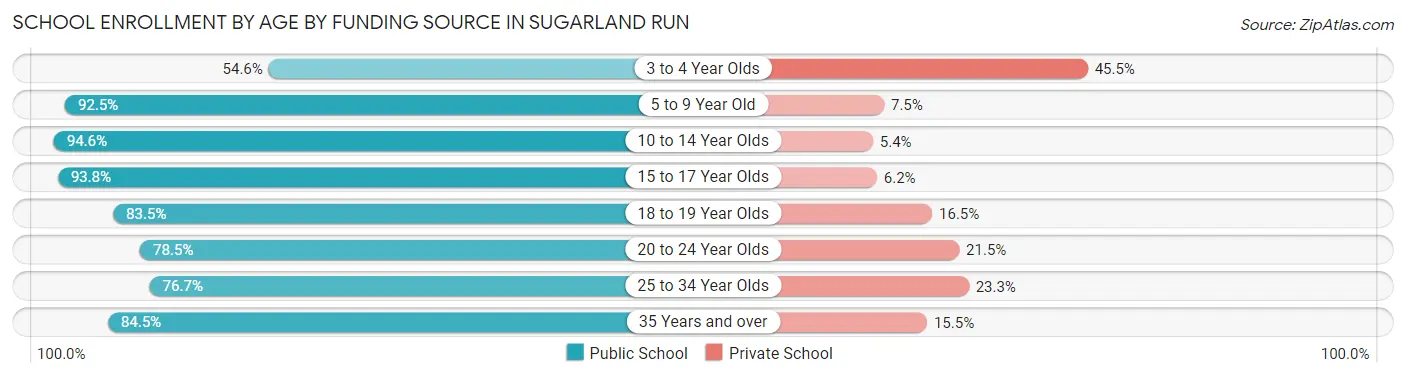
| Age Bracket | Public School | Private School |
| 3 to 4 Year Olds | 42 (54.5%) | 35 (45.5%) |
| 5 to 9 Year Old | 713 (92.5%) | 58 (7.5%) |
| 10 to 14 Year Olds | 799 (94.6%) | 46 (5.4%) |
| 15 to 17 Year Olds | 531 (93.8%) | 35 (6.2%) |
| 18 to 19 Year Olds | 421 (83.5%) | 83 (16.5%) |
| 20 to 24 Year Olds | 416 (78.5%) | 114 (21.5%) |
| 25 to 34 Year Olds | 191 (76.7%) | 58 (23.3%) |
| 35 Years and over | 196 (84.5%) | 36 (15.5%) |
| Total | 3,310 (87.7%) | 464 (12.3%) |
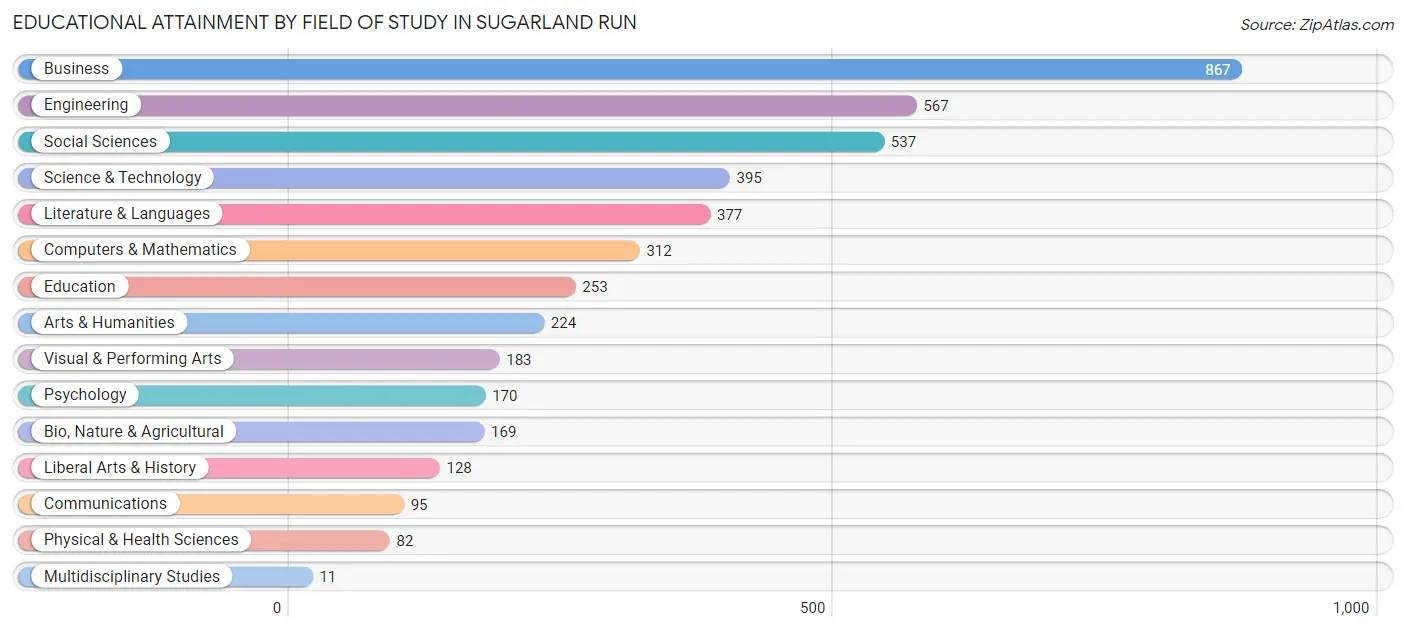
Educational Attainment by Field of Study in Sugarland Run
Business (867 | 19.8%), engineering (567 | 13.0%), social sciences (537 | 12.3%), science & technology (395 | 9.0%), and literature & languages (377 | 8.6%) are the most common fields of study among 4,370 individuals in Sugarland Run who have obtained a bachelor's degree or higher.
| Field of Study | # Graduates | % Graduates |
| Computers & Mathematics | 312 | 7.1% |
| Bio, Nature & Agricultural | 169 | 3.9% |
| Physical & Health Sciences | 82 | 1.9% |
| Psychology | 170 | 3.9% |
| Social Sciences | 537 | 12.3% |
| Engineering | 567 | 13.0% |
| Multidisciplinary Studies | 11 | 0.3% |
| Science & Technology | 395 | 9.0% |
| Business | 867 | 19.8% |
| Education | 253 | 5.8% |
| Literature & Languages | 377 | 8.6% |
| Liberal Arts & History | 128 | 2.9% |
| Visual & Performing Arts | 183 | 4.2% |
| Communications | 95 | 2.2% |
| Arts & Humanities | 224 | 5.1% |
| Total | 4,370 | 100.0% |
Transportation & Commute in Sugarland Run
Vehicle Availability by Sex in Sugarland Run
The most prevalent vehicle ownership categories in Sugarland Run are males with 2 vehicles (1,465, accounting for 37.4%) and females with 2 vehicles (1,015, making up 46.2%).
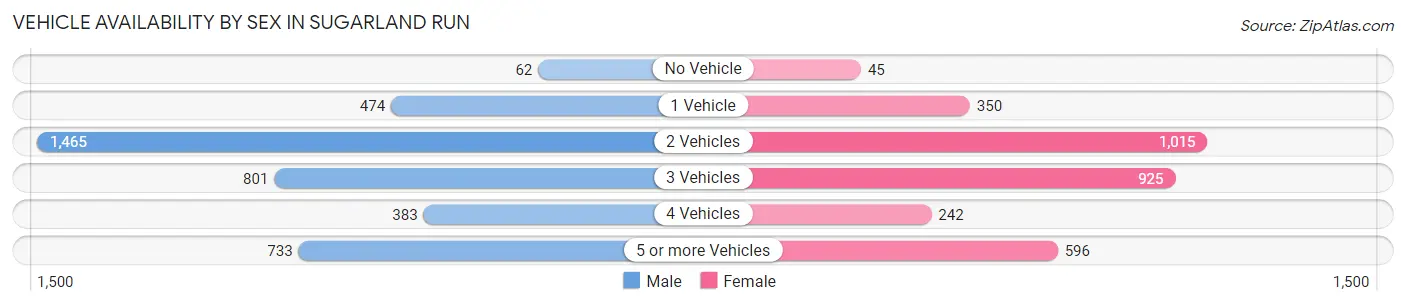
| Vehicles Available | Male | Female |
| No Vehicle | 62 (1.6%) | 45 (1.4%) |
| 1 Vehicle | 474 (12.1%) | 350 (11.0%) |
| 2 Vehicles | 1,465 (37.4%) | 1,015 (32.0%) |
| 3 Vehicles | 801 (20.4%) | 925 (29.1%) |
| 4 Vehicles | 383 (9.8%) | 242 (7.6%) |
| 5 or more Vehicles | 733 (18.7%) | 596 (18.8%) |
| Total | 3,918 (100.0%) | 3,173 (100.0%) |
Commute Time in Sugarland Run
The most frequently occuring commute durations in Sugarland Run are 15 to 19 minutes (1,037 commuters, 18.1%), 20 to 24 minutes (833 commuters, 14.6%), and 60 to 89 minutes (728 commuters, 12.8%).
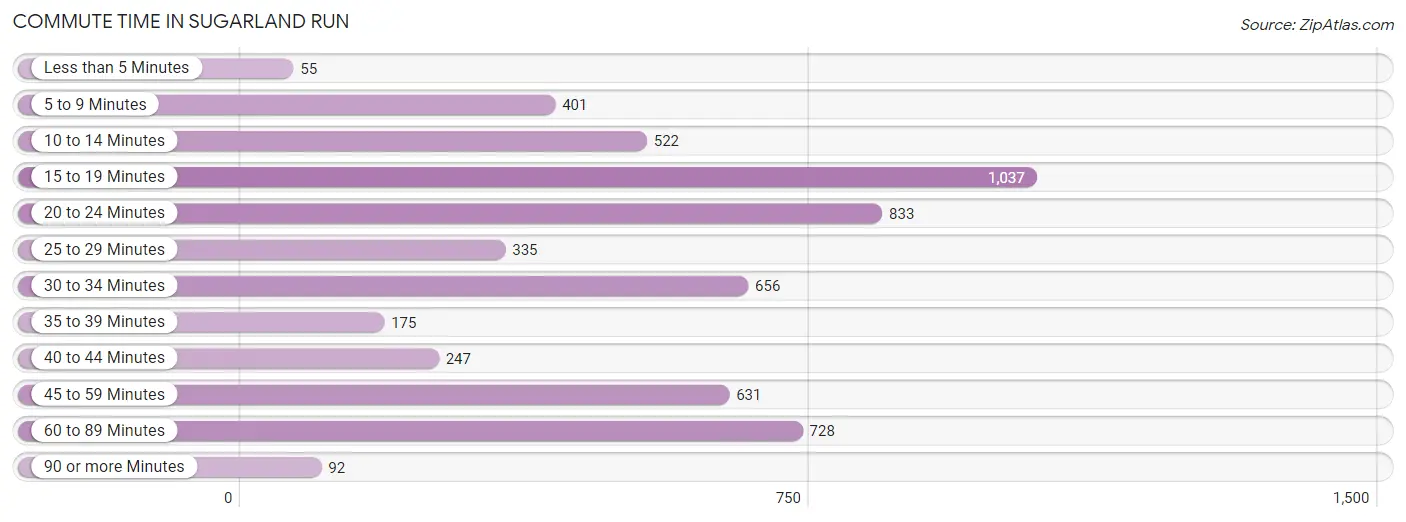
| Commute Time | # Commuters | % Commuters |
| Less than 5 Minutes | 55 | 1.0% |
| 5 to 9 Minutes | 401 | 7.0% |
| 10 to 14 Minutes | 522 | 9.1% |
| 15 to 19 Minutes | 1,037 | 18.1% |
| 20 to 24 Minutes | 833 | 14.6% |
| 25 to 29 Minutes | 335 | 5.9% |
| 30 to 34 Minutes | 656 | 11.5% |
| 35 to 39 Minutes | 175 | 3.1% |
| 40 to 44 Minutes | 247 | 4.3% |
| 45 to 59 Minutes | 631 | 11.1% |
| 60 to 89 Minutes | 728 | 12.8% |
| 90 or more Minutes | 92 | 1.6% |
Commute Time by Sex in Sugarland Run
The most common commute times in Sugarland Run are 60 to 89 minutes (658 commuters, 20.1%) for males and 15 to 19 minutes (528 commuters, 21.6%) for females.
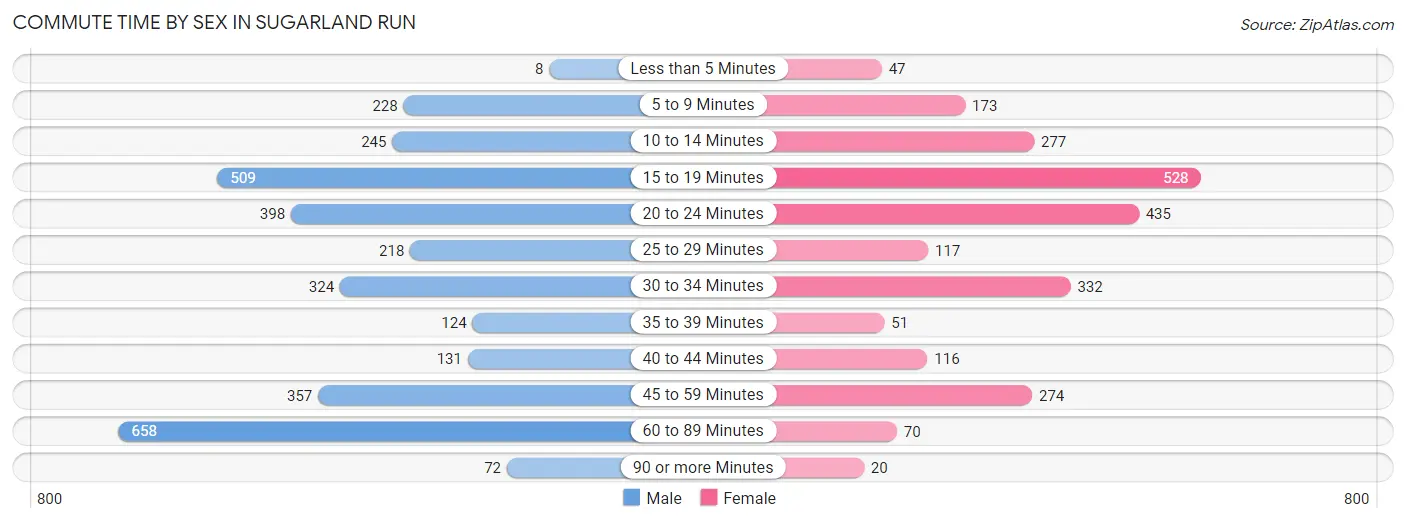
| Commute Time | Male | Female |
| Less than 5 Minutes | 8 (0.2%) | 47 (1.9%) |
| 5 to 9 Minutes | 228 (7.0%) | 173 (7.1%) |
| 10 to 14 Minutes | 245 (7.5%) | 277 (11.4%) |
| 15 to 19 Minutes | 509 (15.6%) | 528 (21.6%) |
| 20 to 24 Minutes | 398 (12.2%) | 435 (17.8%) |
| 25 to 29 Minutes | 218 (6.7%) | 117 (4.8%) |
| 30 to 34 Minutes | 324 (9.9%) | 332 (13.6%) |
| 35 to 39 Minutes | 124 (3.8%) | 51 (2.1%) |
| 40 to 44 Minutes | 131 (4.0%) | 116 (4.8%) |
| 45 to 59 Minutes | 357 (10.9%) | 274 (11.2%) |
| 60 to 89 Minutes | 658 (20.1%) | 70 (2.9%) |
| 90 or more Minutes | 72 (2.2%) | 20 (0.8%) |
Time of Departure to Work by Sex in Sugarland Run
The most frequent times of departure to work in Sugarland Run are 7:00 AM to 7:29 AM (670, 20.5%) for males and 7:30 AM to 7:59 AM (482, 19.8%) for females.
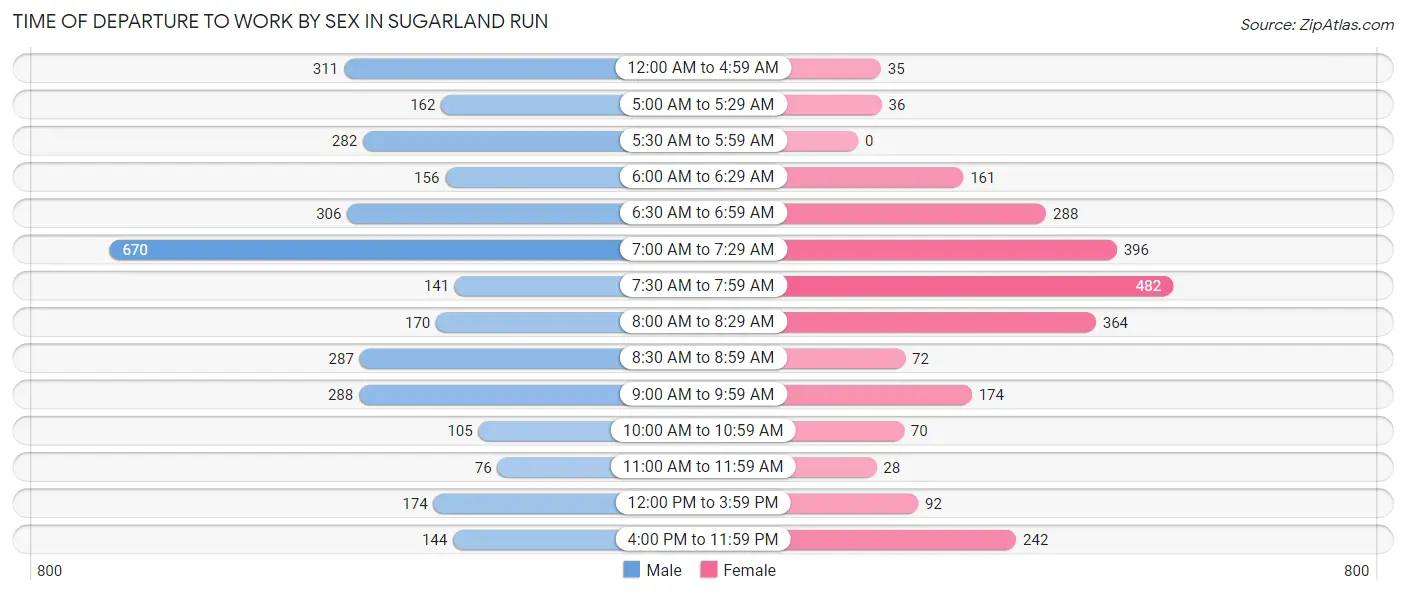
| Time of Departure | Male | Female |
| 12:00 AM to 4:59 AM | 311 (9.5%) | 35 (1.4%) |
| 5:00 AM to 5:29 AM | 162 (5.0%) | 36 (1.5%) |
| 5:30 AM to 5:59 AM | 282 (8.6%) | 0 (0.0%) |
| 6:00 AM to 6:29 AM | 156 (4.8%) | 161 (6.6%) |
| 6:30 AM to 6:59 AM | 306 (9.3%) | 288 (11.8%) |
| 7:00 AM to 7:29 AM | 670 (20.5%) | 396 (16.2%) |
| 7:30 AM to 7:59 AM | 141 (4.3%) | 482 (19.8%) |
| 8:00 AM to 8:29 AM | 170 (5.2%) | 364 (14.9%) |
| 8:30 AM to 8:59 AM | 287 (8.8%) | 72 (2.9%) |
| 9:00 AM to 9:59 AM | 288 (8.8%) | 174 (7.1%) |
| 10:00 AM to 10:59 AM | 105 (3.2%) | 70 (2.9%) |
| 11:00 AM to 11:59 AM | 76 (2.3%) | 28 (1.1%) |
| 12:00 PM to 3:59 PM | 174 (5.3%) | 92 (3.8%) |
| 4:00 PM to 11:59 PM | 144 (4.4%) | 242 (9.9%) |
| Total | 3,272 (100.0%) | 2,440 (100.0%) |
Housing Occupancy in Sugarland Run
Occupancy by Ownership in Sugarland Run
Of the total 3,635 dwellings in Sugarland Run, owner-occupied units account for 2,936 (80.8%), while renter-occupied units make up 699 (19.2%).
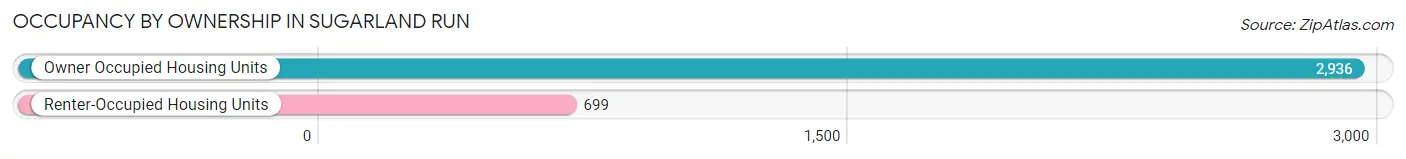
| Occupancy | # Housing Units | % Housing Units |
| Owner Occupied Housing Units | 2,936 | 80.8% |
| Renter-Occupied Housing Units | 699 | 19.2% |
| Total Occupied Housing Units | 3,635 | 100.0% |
Occupancy by Household Size in Sugarland Run
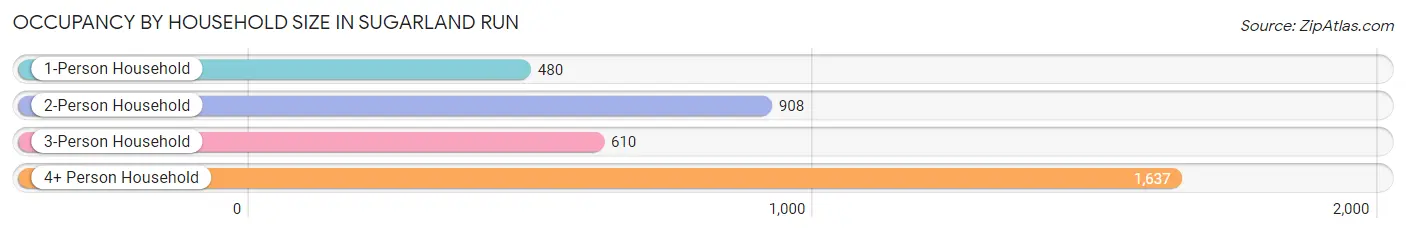
| Household Size | # Housing Units | % Housing Units |
| 1-Person Household | 480 | 13.2% |
| 2-Person Household | 908 | 25.0% |
| 3-Person Household | 610 | 16.8% |
| 4+ Person Household | 1,637 | 45.0% |
| Total Housing Units | 3,635 | 100.0% |
Occupancy by Ownership by Household Size in Sugarland Run
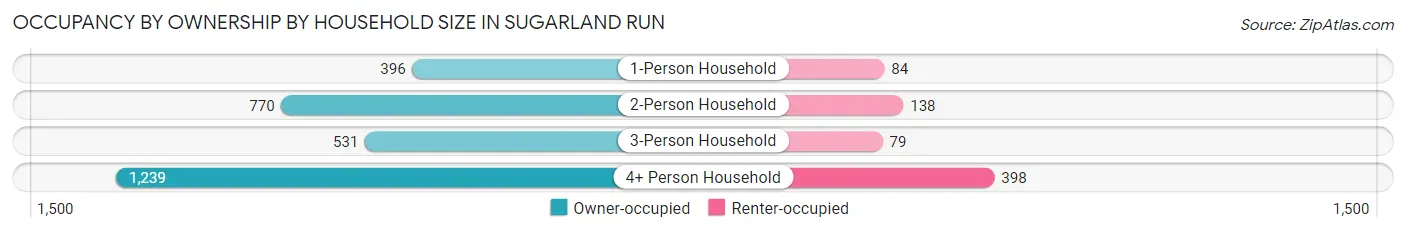
| Household Size | Owner-occupied | Renter-occupied |
| 1-Person Household | 396 (82.5%) | 84 (17.5%) |
| 2-Person Household | 770 (84.8%) | 138 (15.2%) |
| 3-Person Household | 531 (87.1%) | 79 (13.0%) |
| 4+ Person Household | 1,239 (75.7%) | 398 (24.3%) |
| Total Housing Units | 2,936 (80.8%) | 699 (19.2%) |
Occupancy by Educational Attainment in Sugarland Run
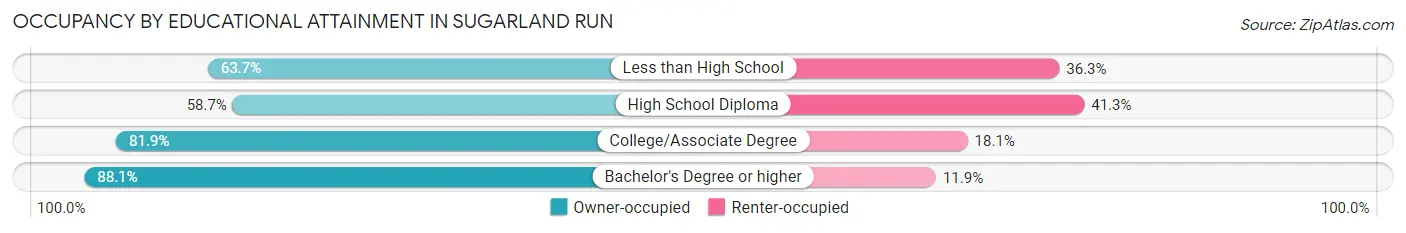
| Household Size | Owner-occupied | Renter-occupied |
| Less than High School | 256 (63.7%) | 146 (36.3%) |
| High School Diploma | 215 (58.7%) | 151 (41.3%) |
| College/Associate Degree | 808 (81.9%) | 179 (18.1%) |
| Bachelor's Degree or higher | 1,657 (88.1%) | 223 (11.9%) |
Occupancy by Age of Householder in Sugarland Run
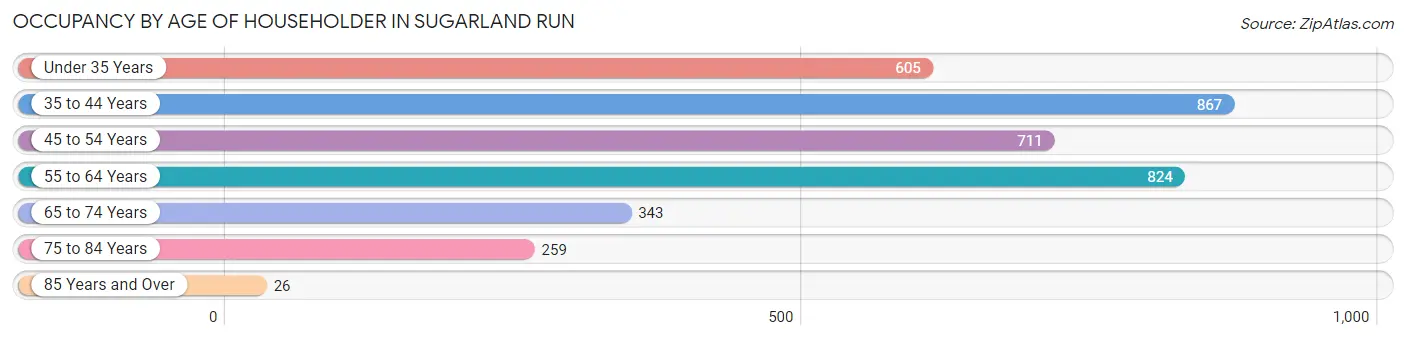
| Age Bracket | # Households | % Households |
| Under 35 Years | 605 | 16.6% |
| 35 to 44 Years | 867 | 23.8% |
| 45 to 54 Years | 711 | 19.6% |
| 55 to 64 Years | 824 | 22.7% |
| 65 to 74 Years | 343 | 9.4% |
| 75 to 84 Years | 259 | 7.1% |
| 85 Years and Over | 26 | 0.7% |
| Total | 3,635 | 100.0% |
Housing Finances in Sugarland Run
Median Income by Occupancy in Sugarland Run
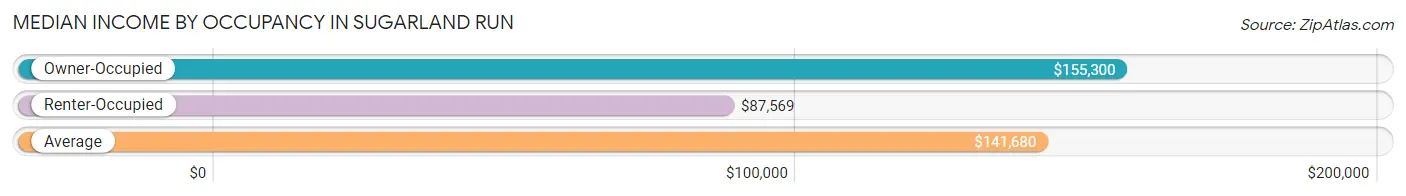
| Occupancy Type | # Households | Median Income |
| Owner-Occupied | 2,936 (80.8%) | $155,300 |
| Renter-Occupied | 699 (19.2%) | $87,569 |
| Average | 3,635 (100.0%) | $141,680 |
Occupancy by Householder Income Bracket in Sugarland Run
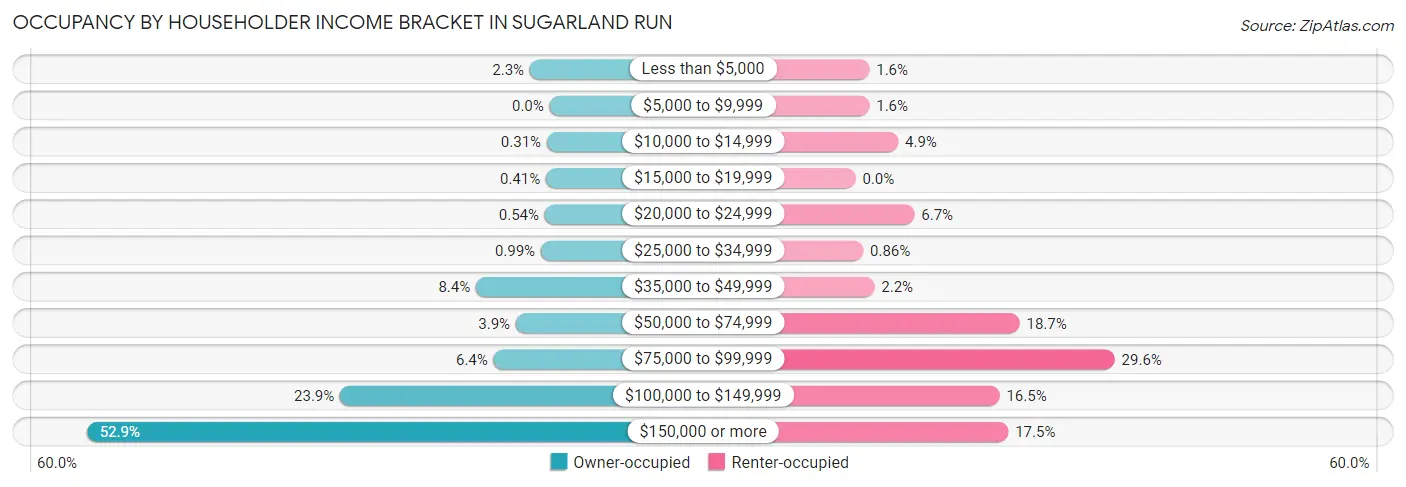
| Income Bracket | Owner-occupied | Renter-occupied |
| Less than $5,000 | 66 (2.2%) | 11 (1.6%) |
| $5,000 to $9,999 | 0 (0.0%) | 11 (1.6%) |
| $10,000 to $14,999 | 9 (0.3%) | 34 (4.9%) |
| $15,000 to $19,999 | 12 (0.4%) | 0 (0.0%) |
| $20,000 to $24,999 | 16 (0.5%) | 47 (6.7%) |
| $25,000 to $34,999 | 29 (1.0%) | 6 (0.9%) |
| $35,000 to $49,999 | 247 (8.4%) | 15 (2.1%) |
| $50,000 to $74,999 | 113 (3.8%) | 131 (18.7%) |
| $75,000 to $99,999 | 188 (6.4%) | 207 (29.6%) |
| $100,000 to $149,999 | 703 (23.9%) | 115 (16.5%) |
| $150,000 or more | 1,553 (52.9%) | 122 (17.4%) |
| Total | 2,936 (100.0%) | 699 (100.0%) |
Monthly Housing Cost Tiers in Sugarland Run
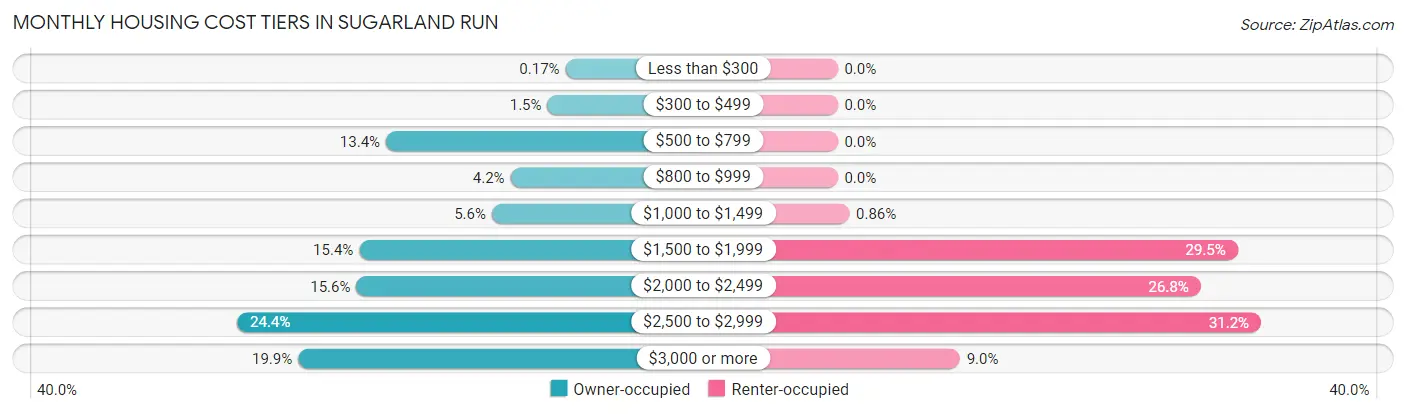
| Monthly Cost | Owner-occupied | Renter-occupied |
| Less than $300 | 5 (0.2%) | 0 (0.0%) |
| $300 to $499 | 44 (1.5%) | 0 (0.0%) |
| $500 to $799 | 393 (13.4%) | 0 (0.0%) |
| $800 to $999 | 124 (4.2%) | 0 (0.0%) |
| $1,000 to $1,499 | 164 (5.6%) | 6 (0.9%) |
| $1,500 to $1,999 | 451 (15.4%) | 206 (29.5%) |
| $2,000 to $2,499 | 457 (15.6%) | 187 (26.8%) |
| $2,500 to $2,999 | 715 (24.3%) | 218 (31.2%) |
| $3,000 or more | 583 (19.9%) | 63 (9.0%) |
| Total | 2,936 (100.0%) | 699 (100.0%) |
Physical Housing Characteristics in Sugarland Run
Housing Structures in Sugarland Run
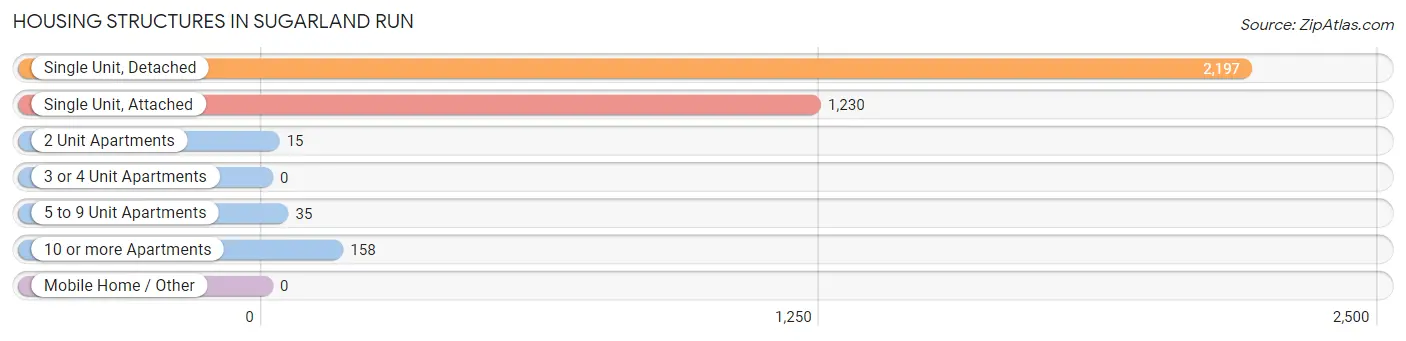
| Structure Type | # Housing Units | % Housing Units |
| Single Unit, Detached | 2,197 | 60.4% |
| Single Unit, Attached | 1,230 | 33.8% |
| 2 Unit Apartments | 15 | 0.4% |
| 3 or 4 Unit Apartments | 0 | 0.0% |
| 5 to 9 Unit Apartments | 35 | 1.0% |
| 10 or more Apartments | 158 | 4.3% |
| Mobile Home / Other | 0 | 0.0% |
| Total | 3,635 | 100.0% |
Housing Structures by Occupancy in Sugarland Run
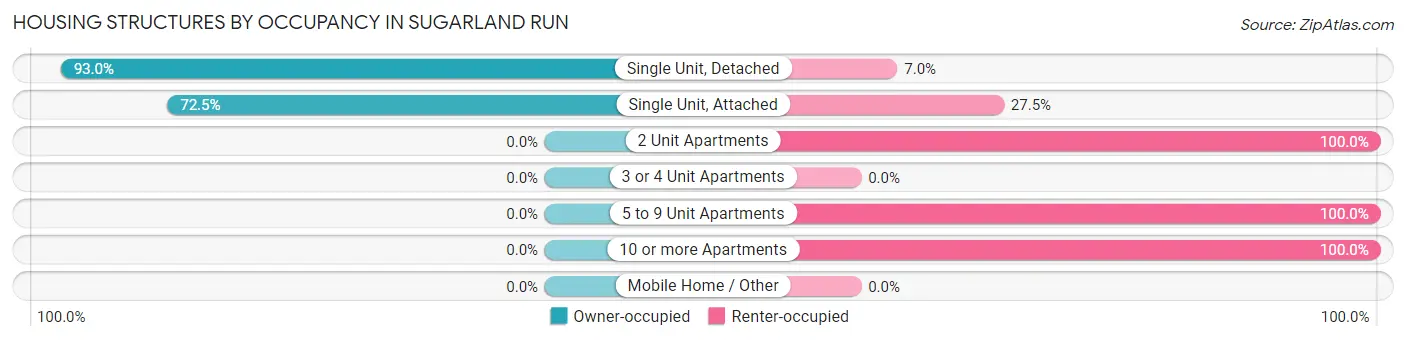
| Structure Type | Owner-occupied | Renter-occupied |
| Single Unit, Detached | 2,044 (93.0%) | 153 (7.0%) |
| Single Unit, Attached | 892 (72.5%) | 338 (27.5%) |
| 2 Unit Apartments | 0 (0.0%) | 15 (100.0%) |
| 3 or 4 Unit Apartments | 0 (0.0%) | 0 (0.0%) |
| 5 to 9 Unit Apartments | 0 (0.0%) | 35 (100.0%) |
| 10 or more Apartments | 0 (0.0%) | 158 (100.0%) |
| Mobile Home / Other | 0 (0.0%) | 0 (0.0%) |
| Total | 2,936 (80.8%) | 699 (19.2%) |
Housing Structures by Number of Rooms in Sugarland Run
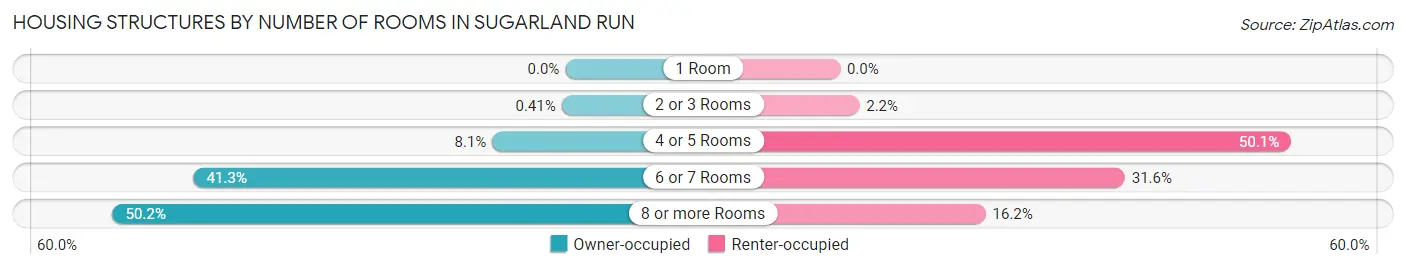
| Number of Rooms | Owner-occupied | Renter-occupied |
| 1 Room | 0 (0.0%) | 0 (0.0%) |
| 2 or 3 Rooms | 12 (0.4%) | 15 (2.1%) |
| 4 or 5 Rooms | 238 (8.1%) | 350 (50.1%) |
| 6 or 7 Rooms | 1,211 (41.2%) | 221 (31.6%) |
| 8 or more Rooms | 1,475 (50.2%) | 113 (16.2%) |
| Total | 2,936 (100.0%) | 699 (100.0%) |
Housing Structure by Heating Type in Sugarland Run
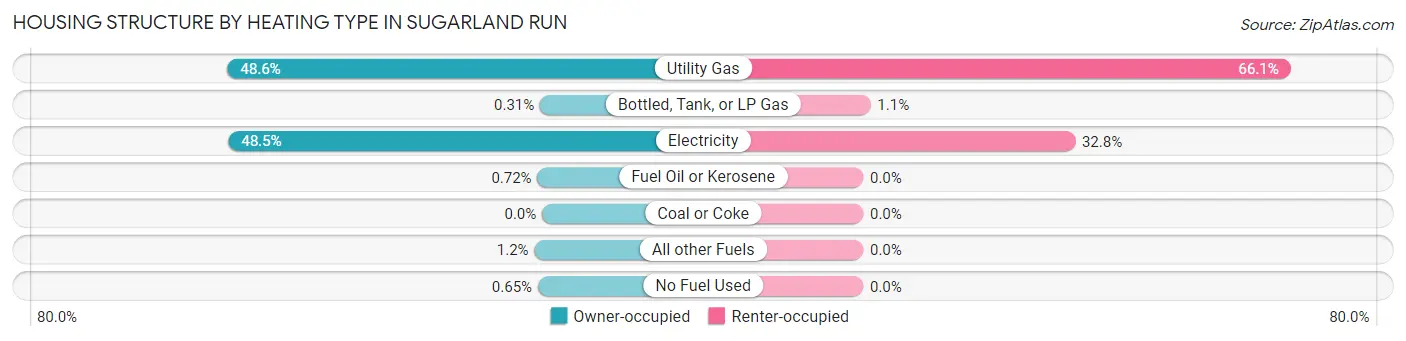
| Heating Type | Owner-occupied | Renter-occupied |
| Utility Gas | 1,428 (48.6%) | 462 (66.1%) |
| Bottled, Tank, or LP Gas | 9 (0.3%) | 8 (1.1%) |
| Electricity | 1,424 (48.5%) | 229 (32.8%) |
| Fuel Oil or Kerosene | 21 (0.7%) | 0 (0.0%) |
| Coal or Coke | 0 (0.0%) | 0 (0.0%) |
| All other Fuels | 35 (1.2%) | 0 (0.0%) |
| No Fuel Used | 19 (0.6%) | 0 (0.0%) |
| Total | 2,936 (100.0%) | 699 (100.0%) |
Household Vehicle Usage in Sugarland Run
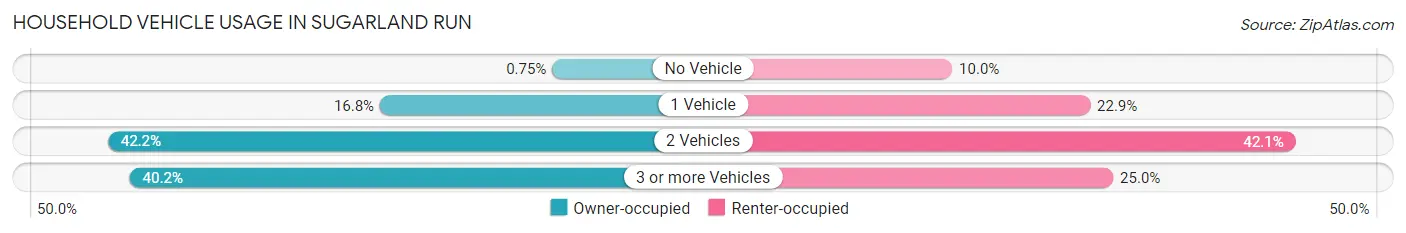
| Vehicles per Household | Owner-occupied | Renter-occupied |
| No Vehicle | 22 (0.7%) | 70 (10.0%) |
| 1 Vehicle | 494 (16.8%) | 160 (22.9%) |
| 2 Vehicles | 1,240 (42.2%) | 294 (42.1%) |
| 3 or more Vehicles | 1,180 (40.2%) | 175 (25.0%) |
| Total | 2,936 (100.0%) | 699 (100.0%) |
Real Estate & Mortgages in Sugarland Run
Real Estate and Mortgage Overview in Sugarland Run
| Characteristic | Without Mortgage | With Mortgage |
| Housing Units | 589 | 2,347 |
| Median Property Value | $458,000 | $539,000 |
| Median Household Income | $108,953 | $1,413 |
| Monthly Housing Costs | $719 | $583 |
| Real Estate Taxes | $4,279 | $57 |
Property Value by Mortgage Status in Sugarland Run
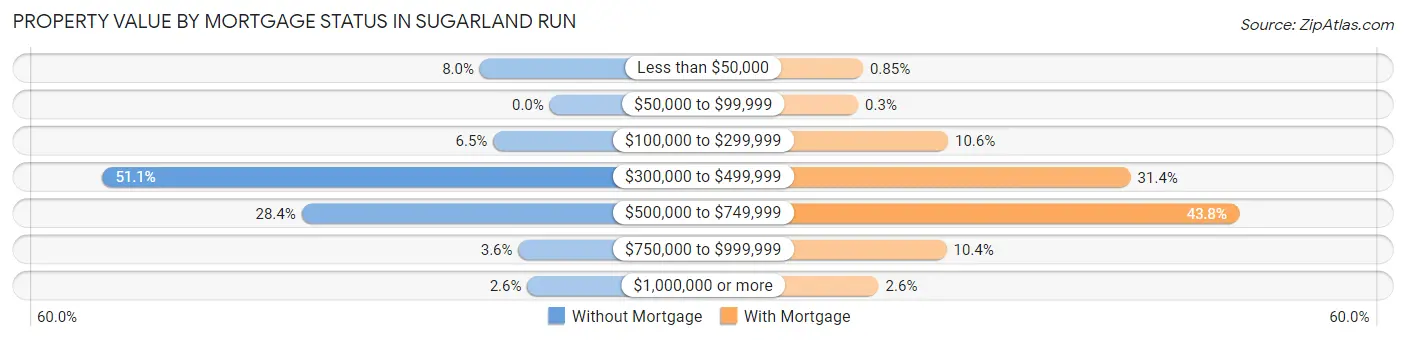
| Property Value | Without Mortgage | With Mortgage |
| Less than $50,000 | 47 (8.0%) | 20 (0.9%) |
| $50,000 to $99,999 | 0 (0.0%) | 7 (0.3%) |
| $100,000 to $299,999 | 38 (6.5%) | 248 (10.6%) |
| $300,000 to $499,999 | 301 (51.1%) | 738 (31.4%) |
| $500,000 to $749,999 | 167 (28.3%) | 1,028 (43.8%) |
| $750,000 to $999,999 | 21 (3.6%) | 244 (10.4%) |
| $1,000,000 or more | 15 (2.5%) | 62 (2.6%) |
| Total | 589 (100.0%) | 2,347 (100.0%) |
Household Income by Mortgage Status in Sugarland Run
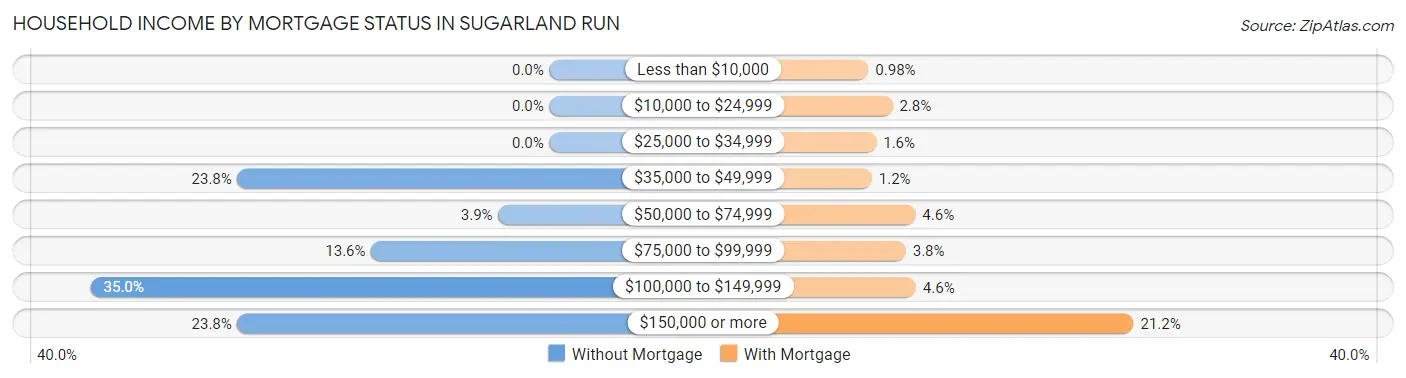
| Household Income | Without Mortgage | With Mortgage |
| Less than $10,000 | 0 (0.0%) | 23 (1.0%) |
| $10,000 to $24,999 | 0 (0.0%) | 66 (2.8%) |
| $25,000 to $34,999 | 0 (0.0%) | 37 (1.6%) |
| $35,000 to $49,999 | 140 (23.8%) | 29 (1.2%) |
| $50,000 to $74,999 | 23 (3.9%) | 107 (4.6%) |
| $75,000 to $99,999 | 80 (13.6%) | 90 (3.8%) |
| $100,000 to $149,999 | 206 (35.0%) | 108 (4.6%) |
| $150,000 or more | 140 (23.8%) | 497 (21.2%) |
| Total | 589 (100.0%) | 2,347 (100.0%) |
Property Value to Household Income Ratio in Sugarland Run
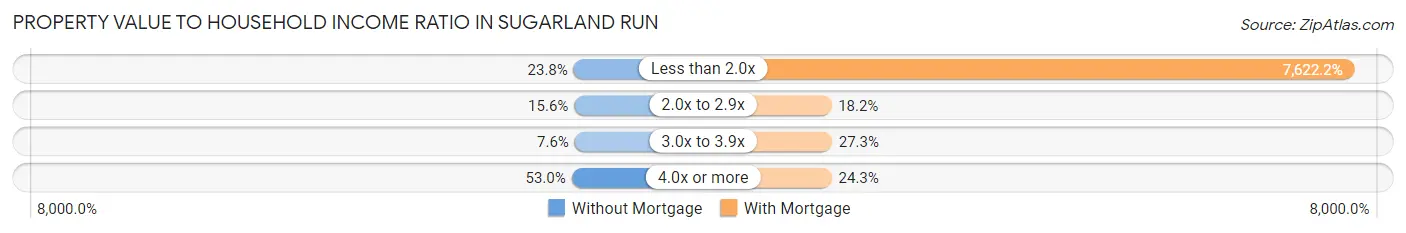
| Value-to-Income Ratio | Without Mortgage | With Mortgage |
| Less than 2.0x | 140 (23.8%) | 178,892 (7,622.2%) |
| 2.0x to 2.9x | 92 (15.6%) | 428 (18.2%) |
| 3.0x to 3.9x | 45 (7.6%) | 641 (27.3%) |
| 4.0x or more | 312 (53.0%) | 570 (24.3%) |
| Total | 589 (100.0%) | 2,347 (100.0%) |
Real Estate Taxes by Mortgage Status in Sugarland Run
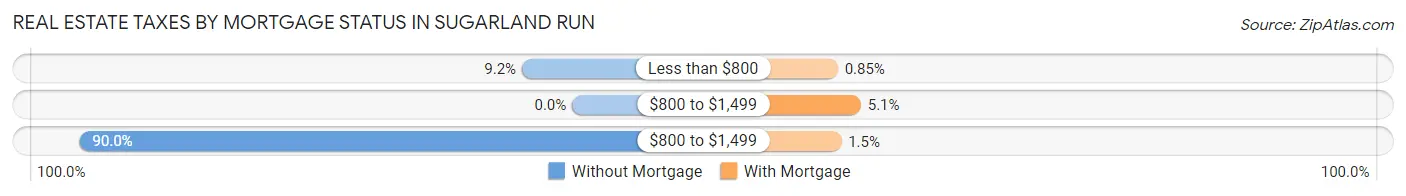
| Property Taxes | Without Mortgage | With Mortgage |
| Less than $800 | 54 (9.2%) | 20 (0.9%) |
| $800 to $1,499 | 0 (0.0%) | 119 (5.1%) |
| $800 to $1,499 | 530 (90.0%) | 35 (1.5%) |
| Total | 589 (100.0%) | 2,347 (100.0%) |
Health & Disability in Sugarland Run
Health Insurance Coverage by Age in Sugarland Run
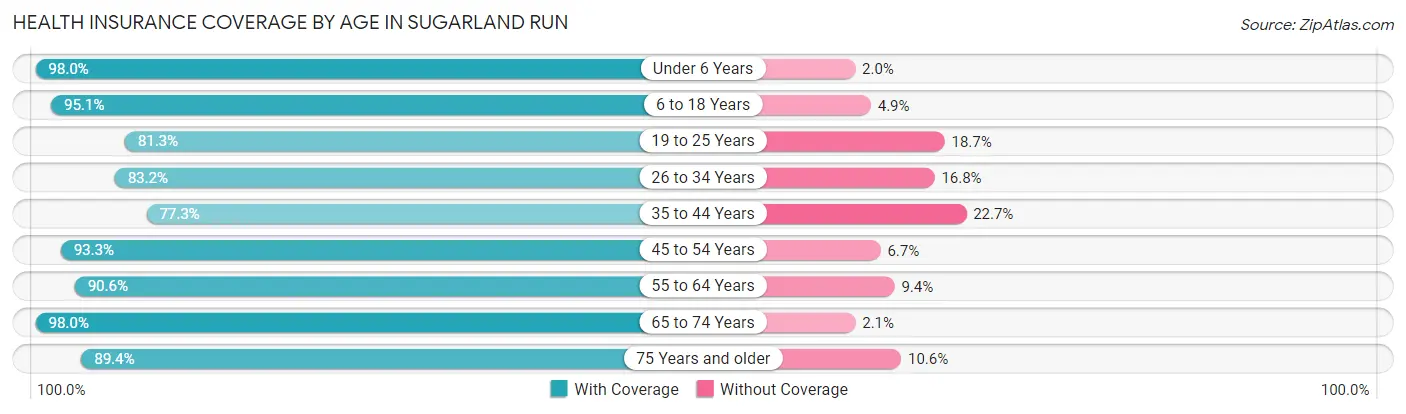
| Age Bracket | With Coverage | Without Coverage |
| Under 6 Years | 875 (98.0%) | 18 (2.0%) |
| 6 to 18 Years | 2,250 (95.1%) | 117 (4.9%) |
| 19 to 25 Years | 1,087 (81.3%) | 250 (18.7%) |
| 26 to 34 Years | 1,391 (83.2%) | 281 (16.8%) |
| 35 to 44 Years | 1,601 (77.3%) | 471 (22.7%) |
| 45 to 54 Years | 1,522 (93.3%) | 110 (6.7%) |
| 55 to 64 Years | 1,385 (90.6%) | 143 (9.4%) |
| 65 to 74 Years | 717 (98.0%) | 15 (2.1%) |
| 75 Years and older | 507 (89.4%) | 60 (10.6%) |
| Total | 11,335 (88.5%) | 1,465 (11.5%) |
Health Insurance Coverage by Citizenship Status in Sugarland Run
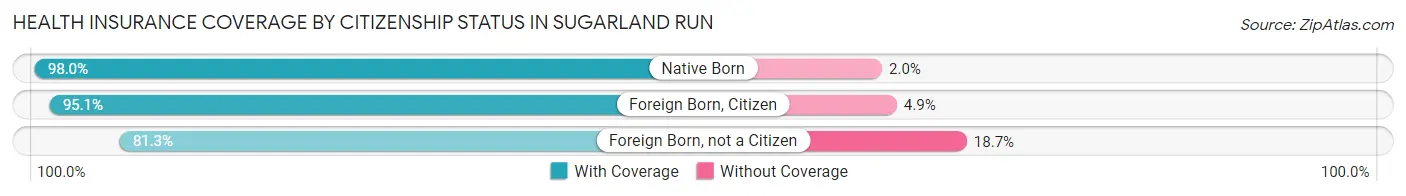
| Citizenship Status | With Coverage | Without Coverage |
| Native Born | 875 (98.0%) | 18 (2.0%) |
| Foreign Born, Citizen | 2,250 (95.1%) | 117 (4.9%) |
| Foreign Born, not a Citizen | 1,087 (81.3%) | 250 (18.7%) |
Health Insurance Coverage by Household Income in Sugarland Run
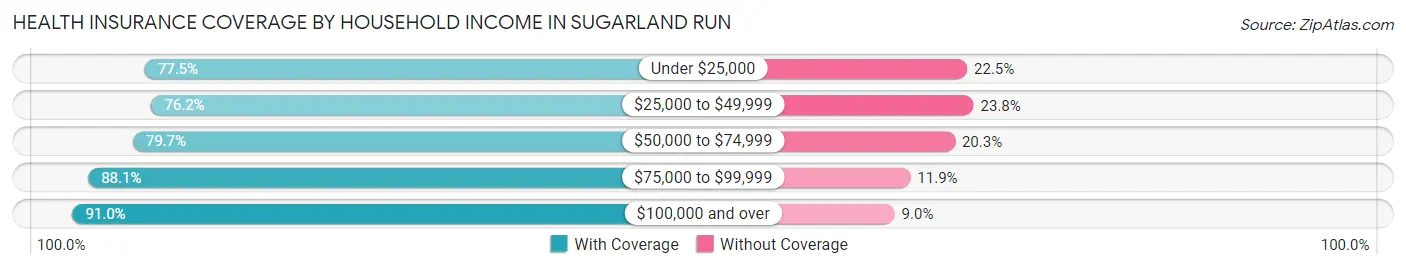
| Household Income | With Coverage | Without Coverage |
| Under $25,000 | 323 (77.5%) | 94 (22.5%) |
| $25,000 to $49,999 | 661 (76.2%) | 206 (23.8%) |
| $50,000 to $74,999 | 649 (79.7%) | 165 (20.3%) |
| $75,000 to $99,999 | 1,204 (88.1%) | 163 (11.9%) |
| $100,000 and over | 8,477 (91.0%) | 835 (9.0%) |
Public vs Private Health Insurance Coverage by Age in Sugarland Run
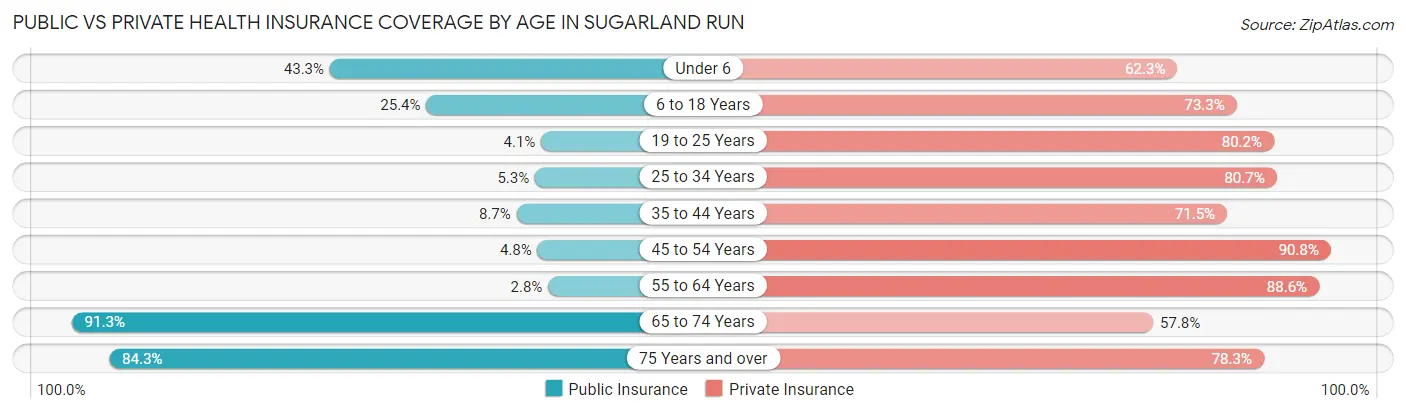
| Age Bracket | Public Insurance | Private Insurance |
| Under 6 | 387 (43.3%) | 556 (62.3%) |
| 6 to 18 Years | 602 (25.4%) | 1,734 (73.3%) |
| 19 to 25 Years | 55 (4.1%) | 1,072 (80.2%) |
| 25 to 34 Years | 88 (5.3%) | 1,349 (80.7%) |
| 35 to 44 Years | 180 (8.7%) | 1,481 (71.5%) |
| 45 to 54 Years | 78 (4.8%) | 1,481 (90.7%) |
| 55 to 64 Years | 43 (2.8%) | 1,353 (88.5%) |
| 65 to 74 Years | 668 (91.3%) | 423 (57.8%) |
| 75 Years and over | 478 (84.3%) | 444 (78.3%) |
| Total | 2,579 (20.2%) | 9,893 (77.3%) |
Disability Status by Sex by Age in Sugarland Run
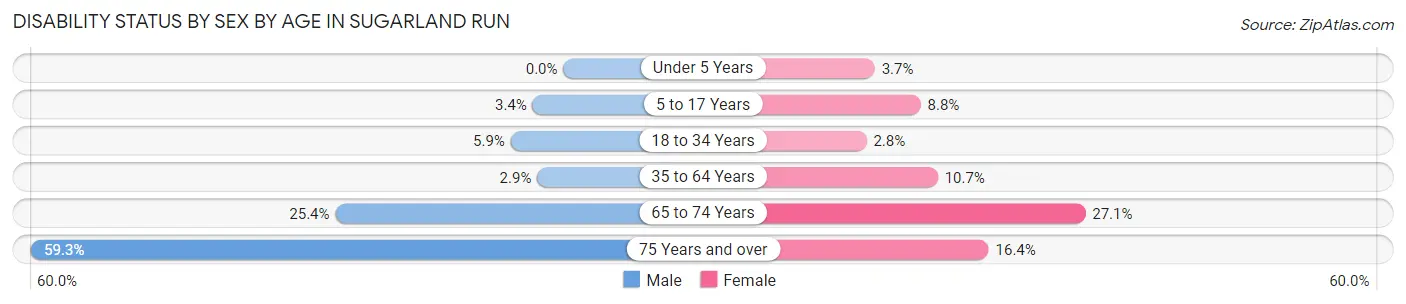
| Age Bracket | Male | Female |
| Under 5 Years | 0 (0.0%) | 15 (3.7%) |
| 5 to 17 Years | 39 (3.4%) | 94 (8.8%) |
| 18 to 34 Years | 104 (5.9%) | 43 (2.8%) |
| 35 to 64 Years | 76 (2.9%) | 280 (10.7%) |
| 65 to 74 Years | 81 (25.4%) | 112 (27.1%) |
| 75 Years and over | 115 (59.3%) | 61 (16.4%) |
Disability Class by Sex by Age in Sugarland Run
Disability Class: Hearing Difficulty
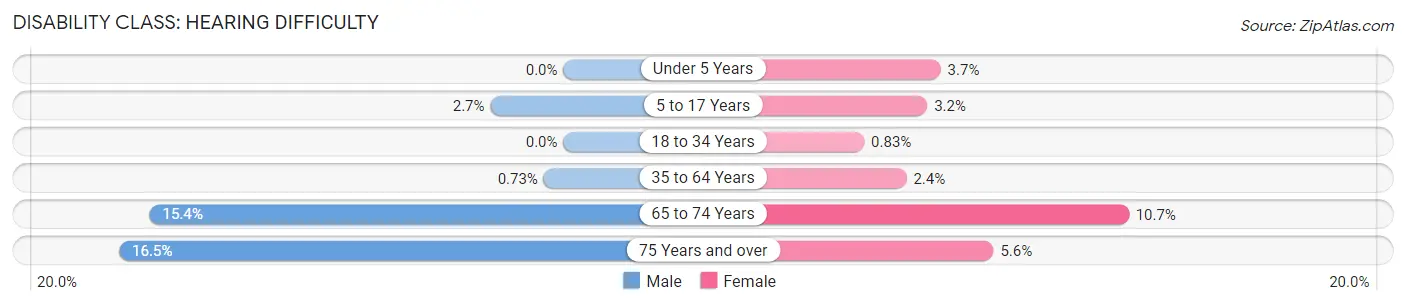
| Age Bracket | Male | Female |
| Under 5 Years | 0 (0.0%) | 15 (3.7%) |
| 5 to 17 Years | 31 (2.7%) | 34 (3.2%) |
| 18 to 34 Years | 0 (0.0%) | 13 (0.8%) |
| 35 to 64 Years | 19 (0.7%) | 63 (2.4%) |
| 65 to 74 Years | 49 (15.4%) | 44 (10.6%) |
| 75 Years and over | 32 (16.5%) | 21 (5.6%) |
Disability Class: Vision Difficulty
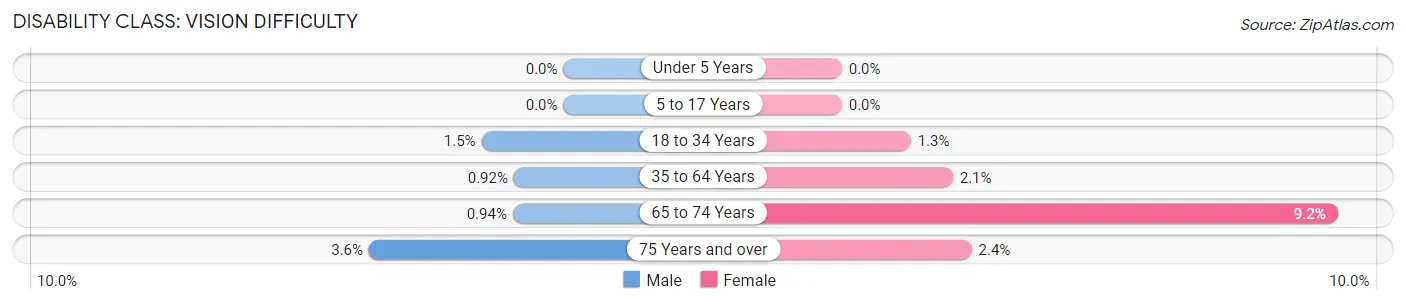
| Age Bracket | Male | Female |
| Under 5 Years | 0 (0.0%) | 0 (0.0%) |
| 5 to 17 Years | 0 (0.0%) | 0 (0.0%) |
| 18 to 34 Years | 27 (1.5%) | 20 (1.3%) |
| 35 to 64 Years | 24 (0.9%) | 54 (2.1%) |
| 65 to 74 Years | 3 (0.9%) | 38 (9.2%) |
| 75 Years and over | 7 (3.6%) | 9 (2.4%) |
Disability Class: Cognitive Difficulty
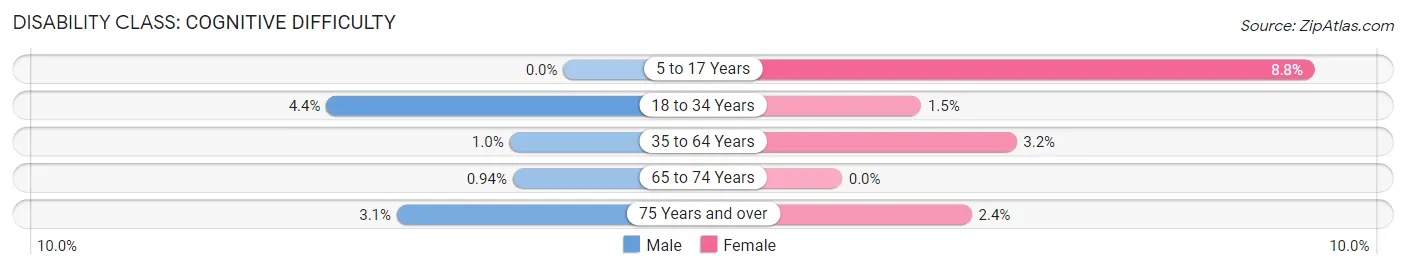
| Age Bracket | Male | Female |
| 5 to 17 Years | 0 (0.0%) | 94 (8.8%) |
| 18 to 34 Years | 78 (4.4%) | 23 (1.5%) |
| 35 to 64 Years | 26 (1.0%) | 85 (3.2%) |
| 65 to 74 Years | 3 (0.9%) | 0 (0.0%) |
| 75 Years and over | 6 (3.1%) | 9 (2.4%) |
Disability Class: Ambulatory Difficulty
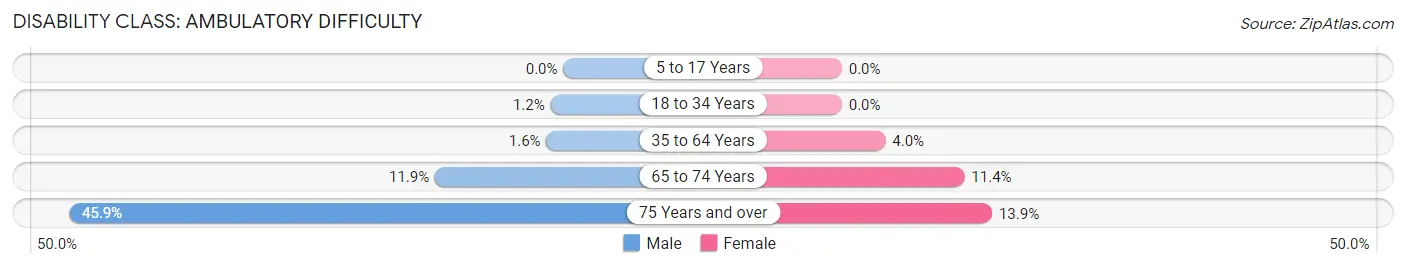
| Age Bracket | Male | Female |
| 5 to 17 Years | 0 (0.0%) | 0 (0.0%) |
| 18 to 34 Years | 21 (1.2%) | 0 (0.0%) |
| 35 to 64 Years | 41 (1.6%) | 106 (4.0%) |
| 65 to 74 Years | 38 (11.9%) | 47 (11.4%) |
| 75 Years and over | 89 (45.9%) | 52 (13.9%) |
Disability Class: Self-Care Difficulty
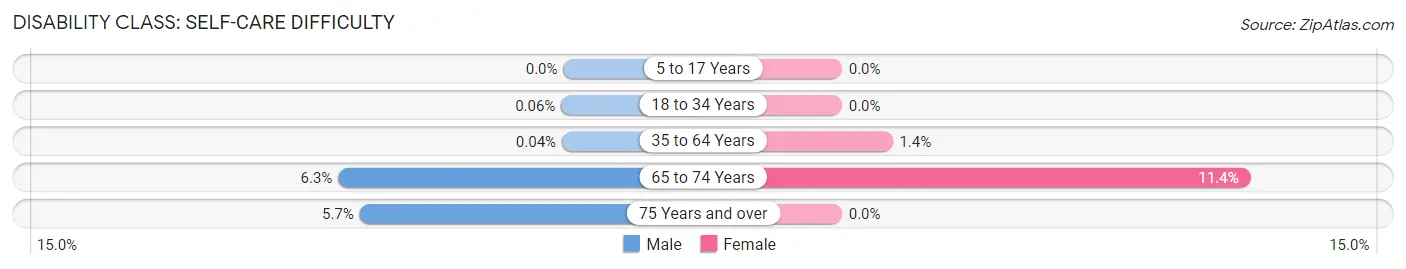
| Age Bracket | Male | Female |
| 5 to 17 Years | 0 (0.0%) | 0 (0.0%) |
| 18 to 34 Years | 1 (0.1%) | 0 (0.0%) |
| 35 to 64 Years | 1 (0.0%) | 37 (1.4%) |
| 65 to 74 Years | 20 (6.3%) | 47 (11.4%) |
| 75 Years and over | 11 (5.7%) | 0 (0.0%) |
Technology Access in Sugarland Run
Computing Device Access in Sugarland Run
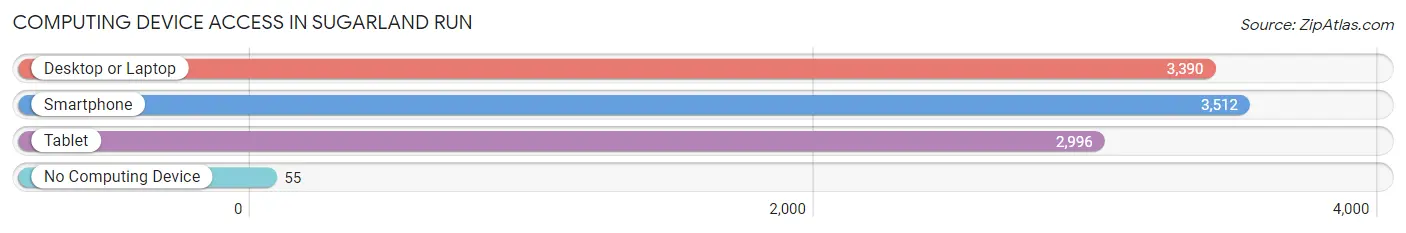
| Device Type | # Households | % Households |
| Desktop or Laptop | 3,390 | 93.3% |
| Smartphone | 3,512 | 96.6% |
| Tablet | 2,996 | 82.4% |
| No Computing Device | 55 | 1.5% |
| Total | 3,635 | 100.0% |
Internet Access in Sugarland Run
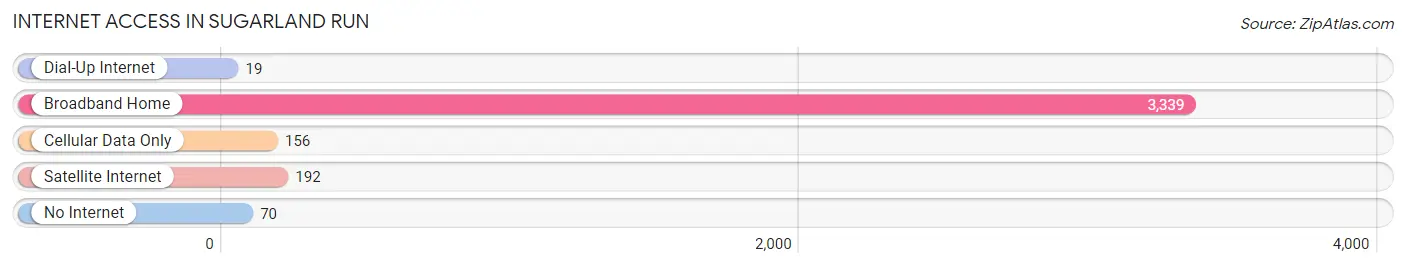
| Internet Type | # Households | % Households |
| Dial-Up Internet | 19 | 0.5% |
| Broadband Home | 3,339 | 91.9% |
| Cellular Data Only | 156 | 4.3% |
| Satellite Internet | 192 | 5.3% |
| No Internet | 70 | 1.9% |
| Total | 3,635 | 100.0% |
Sugarland Run Summary
Sugarland Run is a census-designated place (CDP) located in Loudoun County, Virginia. It is situated in the Washington metropolitan area and is part of the Dulles Technology Corridor. The population of Sugarland Run was 8,945 at the 2010 census.
Geography
Sugarland Run is located at 39°2'17" North, 77°30'17" West (39.038, -77.504). It is situated in the Washington metropolitan area and is part of the Dulles Technology Corridor. The CDP has a total area of 4.2 square miles, all of which is land.
History
Sugarland Run was first settled in the late 1700s by German and English immigrants. The area was originally known as “Sugarland” due to the abundance of sugar maple trees in the area. The name was later changed to “Sugarland Run” when a stream was discovered running through the area.
In the early 1800s, the area was home to a number of small farms and mills. The area was also home to a number of churches, including the Sugarland Run Methodist Church, which was established in 1820.
In the late 1800s, the area began to experience rapid growth due to the construction of the Washington and Old Dominion Railroad. The railroad provided easy access to Washington, D.C. and other nearby cities.
In the early 1900s, the area experienced a population boom as more people moved to the area to take advantage of the easy access to the nation’s capital. The population of Sugarland Run peaked in the 1950s, when it had a population of over 10,000.
Economy
Sugarland Run is home to a number of businesses, including a number of technology companies. The area is also home to a number of retail stores, restaurants, and other businesses.
The area is also home to a number of government agencies, including the National Geospatial-Intelligence Agency, the National Reconnaissance Office, and the National Security Agency.
Demographics
As of the 2010 census, the population of Sugarland Run was 8,945. The racial makeup of the CDP was 79.2% White, 8.2% African American, 0.3% Native American, 6.2% Asian, 0.1% Pacific Islander, 2.7% from other races, and 3.3% from two or more races. Hispanic or Latino of any race were 8.2% of the population.
The median income for a household in the CDP was $107,917, and the median income for a family was $118,917. The per capita income for the CDP was $45,917. About 3.2% of families and 4.2% of the population were below the poverty line, including 5.2% of those under age 18 and 4.2% of those age 65 or over.
Common Questions
What is Per Capita Income in Sugarland Run?
Per Capita income in Sugarland Run is $47,623.
What is the Median Family Income in Sugarland Run?
Median Family Income in Sugarland Run is $143,548.
What is the Median Household income in Sugarland Run?
Median Household Income in Sugarland Run is $141,680.
What is Income or Wage Gap in Sugarland Run?
Income or Wage Gap in Sugarland Run is 48.9%.
Women in Sugarland Run earn 51.1 cents for every dollar earned by a man.
What is Family Income Deficit in Sugarland Run?
Family Income Deficit in Sugarland Run is $7,353.
Families that are below poverty line in Sugarland Run earn $7,353 less on average than the poverty threshold level.
What is Inequality or Gini Index in Sugarland Run?
Inequality or Gini Index in Sugarland Run is 0.36.
What is the Total Population of Sugarland Run?
Total Population of Sugarland Run is 12,818.
What is the Total Male Population of Sugarland Run?
Total Male Population of Sugarland Run is 6,365.
What is the Total Female Population of Sugarland Run?
Total Female Population of Sugarland Run is 6,453.
What is the Ratio of Males per 100 Females in Sugarland Run?
There are 98.64 Males per 100 Females in Sugarland Run.
What is the Ratio of Females per 100 Males in Sugarland Run?
There are 101.38 Females per 100 Males in Sugarland Run.
What is the Median Population Age in Sugarland Run?
Median Population Age in Sugarland Run is 35.8 Years.
What is the Average Family Size in Sugarland Run
Average Family Size in Sugarland Run is 3.8 People.
What is the Average Household Size in Sugarland Run
Average Household Size in Sugarland Run is 3.5 People.
How Large is the Labor Force in Sugarland Run?
There are 7,522 People in the Labor Forcein in Sugarland Run.
What is the Percentage of People in the Labor Force in Sugarland Run?
72.3% of People are in the Labor Force in Sugarland Run.
What is the Unemployment Rate in Sugarland Run?
Unemployment Rate in Sugarland Run is 4.5%.