Long Branch, VA Map & Demographics
Long Branch Map
Long Branch Overview
$68,829
PER CAPITA INCOME
$206,364
AVG FAMILY INCOME
$178,938
AVG HOUSEHOLD INCOME
53.9%
WAGE / INCOME GAP [ % ]
46.1¢/ $1
WAGE / INCOME GAP [ $ ]
0.37
INEQUALITY / GINI INDEX
7,635
TOTAL POPULATION
3,705
MALE POPULATION
3,930
FEMALE POPULATION
94.27
MALES / 100 FEMALES
106.07
FEMALES / 100 MALES
44.3
MEDIAN AGE
3.2
AVG FAMILY SIZE
2.9
AVG HOUSEHOLD SIZE
3,958
LABOR FORCE [ PEOPLE ]
64.7%
PERCENT IN LABOR FORCE
3.1%
UNEMPLOYMENT RATE
Income in Long Branch
Income Overview in Long Branch
Per Capita Income in Long Branch is $68,829, while median incomes of families and households are $206,364 and $178,938 respectively.
| Characteristic | Number | Measure |
| Per Capita Income | 7,635 | $68,829 |
| Median Family Income | 2,176 | $206,364 |
| Mean Family Income | 2,176 | $221,348 |
| Median Household Income | 2,627 | $178,938 |
| Mean Household Income | 2,627 | $199,188 |
| Income Deficit | 2,176 | $0 |
| Wage / Income Gap (%) | 7,635 | 53.93% |
| Wage / Income Gap ($) | 7,635 | 46.07¢ per $1 |
| Gini / Inequality Index | 7,635 | 0.37 |
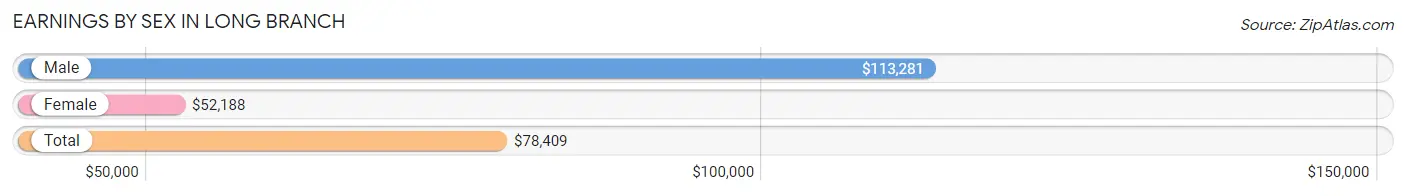
Earnings by Sex in Long Branch
Average Earnings in Long Branch are $78,409, $113,281 for men and $52,188 for women, a difference of 53.9%.
| Sex | Number | Average Earnings |
| Male | 2,094 (51.2%) | $113,281 |
| Female | 1,996 (48.8%) | $52,188 |
| Total | 4,090 (100.0%) | $78,409 |
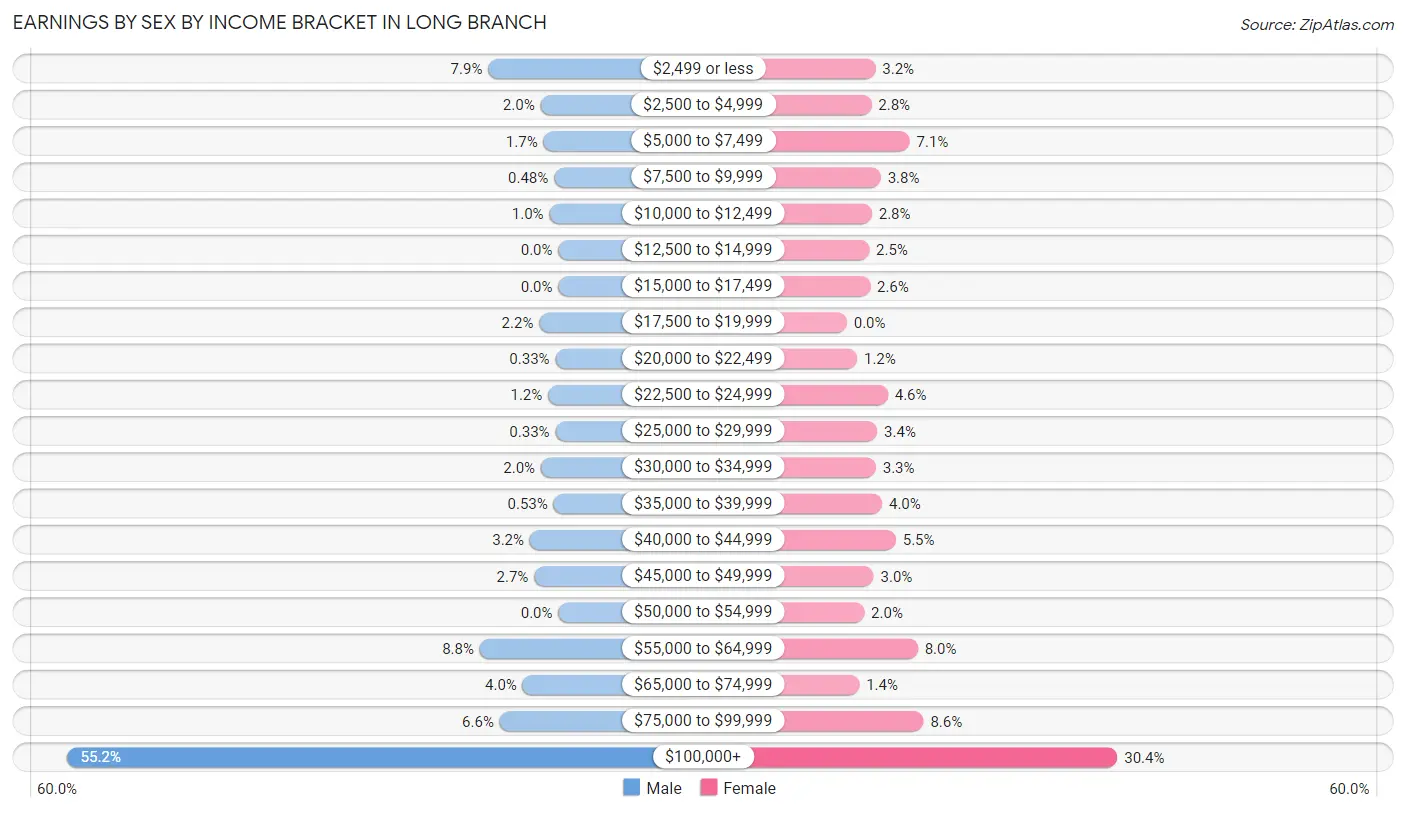
Earnings by Sex by Income Bracket in Long Branch
The most common earnings brackets in Long Branch are $100,000+ for men (1,155 | 55.2%) and $100,000+ for women (607 | 30.4%).
| Income | Male | Female |
| $2,499 or less | 165 (7.9%) | 64 (3.2%) |
| $2,500 to $4,999 | 42 (2.0%) | 55 (2.8%) |
| $5,000 to $7,499 | 35 (1.7%) | 141 (7.1%) |
| $7,500 to $9,999 | 10 (0.5%) | 76 (3.8%) |
| $10,000 to $12,499 | 21 (1.0%) | 56 (2.8%) |
| $12,500 to $14,999 | 0 (0.0%) | 50 (2.5%) |
| $15,000 to $17,499 | 0 (0.0%) | 52 (2.6%) |
| $17,500 to $19,999 | 45 (2.1%) | 0 (0.0%) |
| $20,000 to $22,499 | 7 (0.3%) | 23 (1.1%) |
| $22,500 to $24,999 | 24 (1.1%) | 92 (4.6%) |
| $25,000 to $29,999 | 7 (0.3%) | 68 (3.4%) |
| $30,000 to $34,999 | 41 (2.0%) | 65 (3.3%) |
| $35,000 to $39,999 | 11 (0.5%) | 79 (4.0%) |
| $40,000 to $44,999 | 67 (3.2%) | 110 (5.5%) |
| $45,000 to $49,999 | 57 (2.7%) | 60 (3.0%) |
| $50,000 to $54,999 | 0 (0.0%) | 39 (1.9%) |
| $55,000 to $64,999 | 185 (8.8%) | 159 (8.0%) |
| $65,000 to $74,999 | 84 (4.0%) | 28 (1.4%) |
| $75,000 to $99,999 | 138 (6.6%) | 172 (8.6%) |
| $100,000+ | 1,155 (55.2%) | 607 (30.4%) |
| Total | 2,094 (100.0%) | 1,996 (100.0%) |
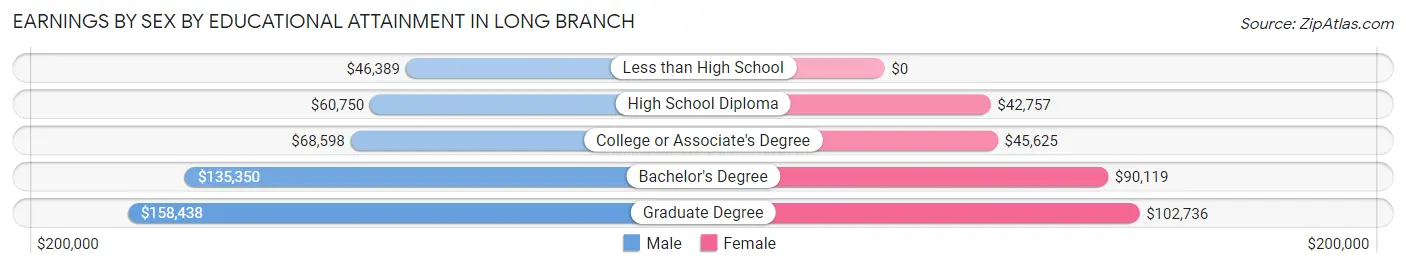
Earnings by Sex by Educational Attainment in Long Branch
Average earnings in Long Branch are $124,464 for men and $57,388 for women, a difference of 53.9%. Men with an educational attainment of graduate degree enjoy the highest average annual earnings of $158,438, while those with less than high school education earn the least with $46,389. Women with an educational attainment of graduate degree earn the most with the average annual earnings of $102,736, while those with high school diploma education have the smallest earnings of $42,757.
| Educational Attainment | Male Income | Female Income |
| Less than High School | $46,389 | $0 |
| High School Diploma | $60,750 | $42,757 |
| College or Associate's Degree | $68,598 | $45,625 |
| Bachelor's Degree | $135,350 | $90,119 |
| Graduate Degree | $158,438 | $102,736 |
| Total | $124,464 | $57,388 |
Family Income in Long Branch
Family Income Brackets in Long Branch
According to the Long Branch family income data, there are 1,110 families falling into the $200,000+ income range, which is the most common income bracket and makes up 51.0% of all families.
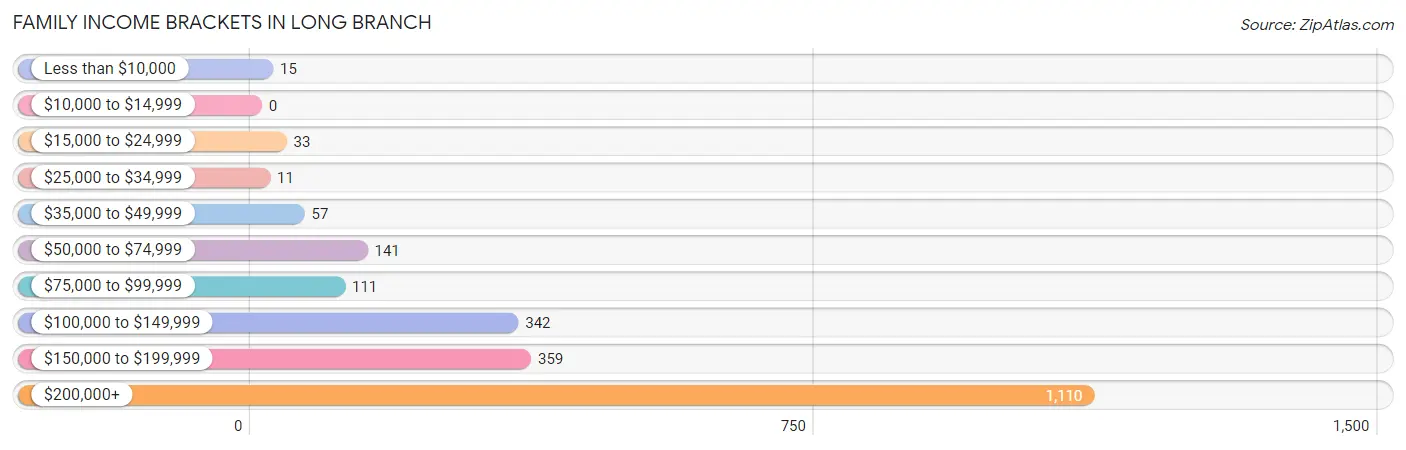
| Income Bracket | # Families | % Families |
| Less than $10,000 | 15 | 0.7% |
| $10,000 to $14,999 | 0 | 0.0% |
| $15,000 to $24,999 | 33 | 1.5% |
| $25,000 to $34,999 | 11 | 0.5% |
| $35,000 to $49,999 | 57 | 2.6% |
| $50,000 to $74,999 | 141 | 6.5% |
| $75,000 to $99,999 | 111 | 5.1% |
| $100,000 to $149,999 | 342 | 15.7% |
| $150,000 to $199,999 | 359 | 16.5% |
| $200,000+ | 1,110 | 51.0% |
Family Income by Famaliy Size in Long Branch
6-person families (141 | 6.5%) account for the highest median family income in Long Branch with $250,001 per family, while 3-person families (510 | 23.4%) have the highest median income of $71,645 per family member.
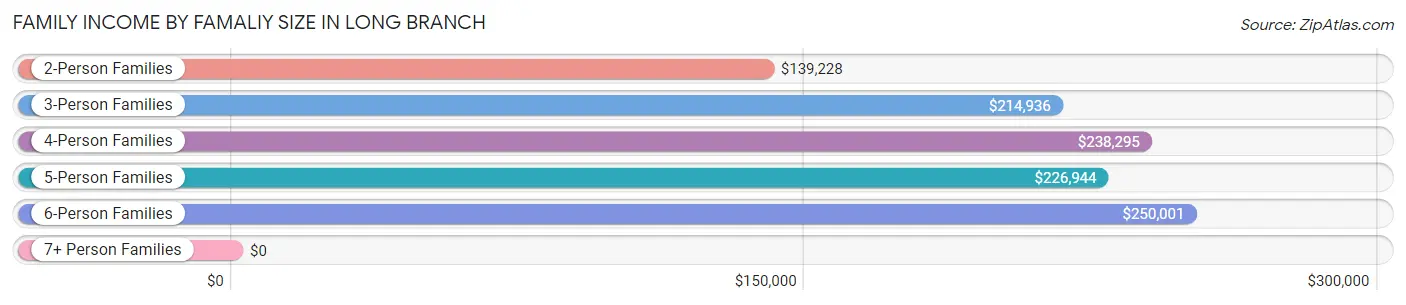
| Income Bracket | # Families | Median Income |
| 2-Person Families | 909 (41.8%) | $139,228 |
| 3-Person Families | 510 (23.4%) | $214,936 |
| 4-Person Families | 430 (19.8%) | $238,295 |
| 5-Person Families | 186 (8.6%) | $226,944 |
| 6-Person Families | 141 (6.5%) | $250,001 |
| 7+ Person Families | 0 (0.0%) | $0 |
| Total | 2,176 (100.0%) | $206,364 |
Family Income by Number of Earners in Long Branch
The median family income in Long Branch is $206,364, with families comprising 3+ earners (294) having the highest median family income of $250,001, while families with no earners (283) have the lowest median family income of $123,661, accounting for 13.5% and 13.0% of families, respectively.
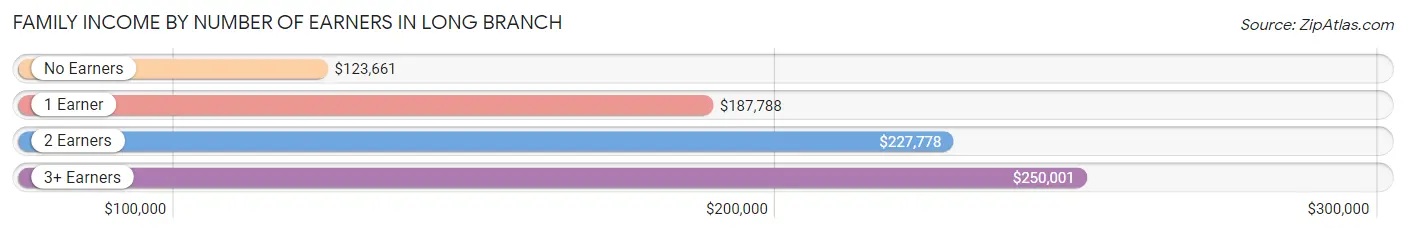
| Number of Earners | # Families | Median Income |
| No Earners | 283 (13.0%) | $123,661 |
| 1 Earner | 489 (22.5%) | $187,788 |
| 2 Earners | 1,110 (51.0%) | $227,778 |
| 3+ Earners | 294 (13.5%) | $250,001 |
| Total | 2,176 (100.0%) | $206,364 |
Household Income in Long Branch
Household Income Brackets in Long Branch
With 1,156 households falling in the category, the $200,000+ income range is the most frequent in Long Branch, accounting for 44.0% of all households. In contrast, only 18 households (0.7%) fall into the $10,000 to $14,999 income bracket, making it the least populous group.
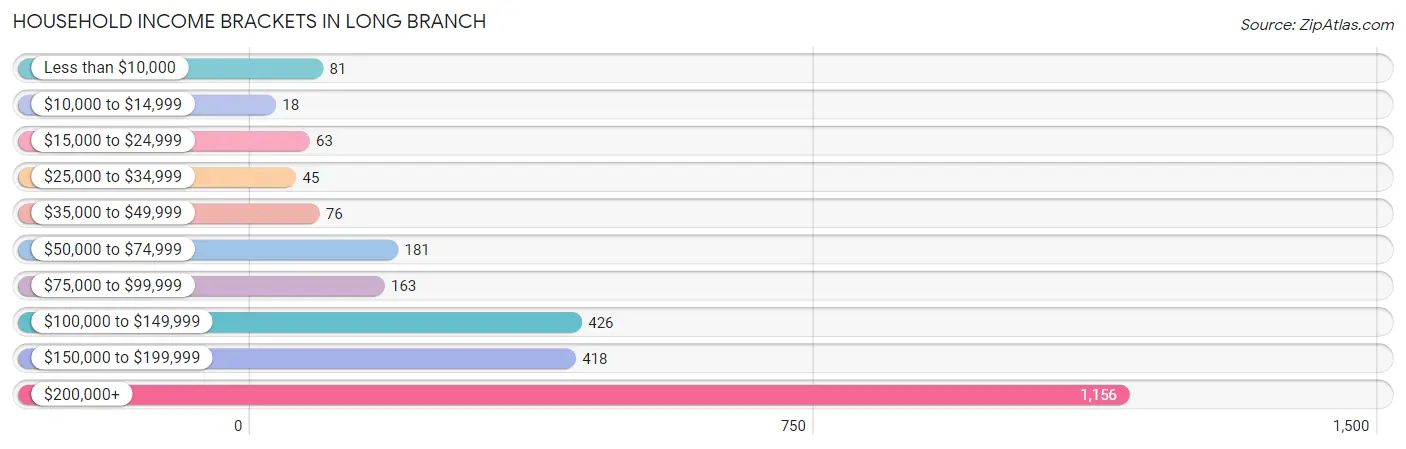
| Income Bracket | # Households | % Households |
| Less than $10,000 | 81 | 3.1% |
| $10,000 to $14,999 | 18 | 0.7% |
| $15,000 to $24,999 | 63 | 2.4% |
| $25,000 to $34,999 | 45 | 1.7% |
| $35,000 to $49,999 | 76 | 2.9% |
| $50,000 to $74,999 | 181 | 6.9% |
| $75,000 to $99,999 | 163 | 6.2% |
| $100,000 to $149,999 | 426 | 16.2% |
| $150,000 to $199,999 | 418 | 15.9% |
| $200,000+ | 1,156 | 44.0% |
Household Income by Householder Age in Long Branch
The median household income in Long Branch is $178,938, with the highest median household income of $249,018 found in the 25 to 44 years age bracket for the primary householder. A total of 531 households (20.2%) fall into this category.
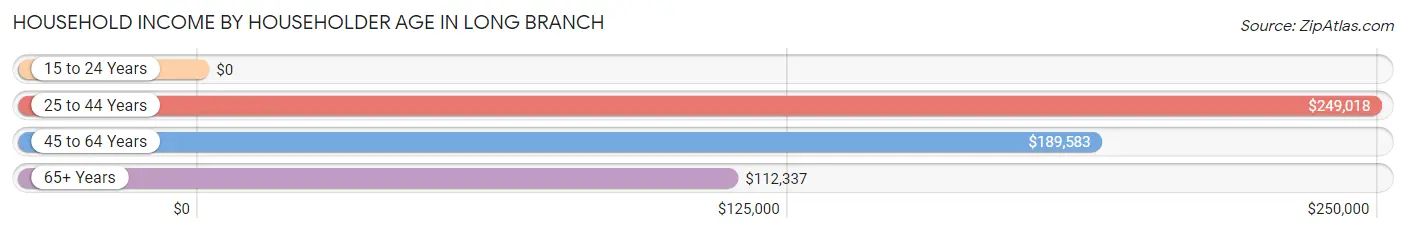
| Income Bracket | # Households | Median Income |
| 15 to 24 Years | 0 (0.0%) | $0 |
| 25 to 44 Years | 531 (20.2%) | $249,018 |
| 45 to 64 Years | 1,179 (44.9%) | $189,583 |
| 65+ Years | 917 (34.9%) | $112,337 |
| Total | 2,627 (100.0%) | $178,938 |
Poverty in Long Branch
Income Below Poverty by Sex and Age in Long Branch
With 4.1% poverty level for males and 3.0% for females among the residents of Long Branch, 75 year old and over males and 45 to 54 year old females are the most vulnerable to poverty, with 48 males (17.7%) and 44 females (7.7%) in their respective age groups living below the poverty level.
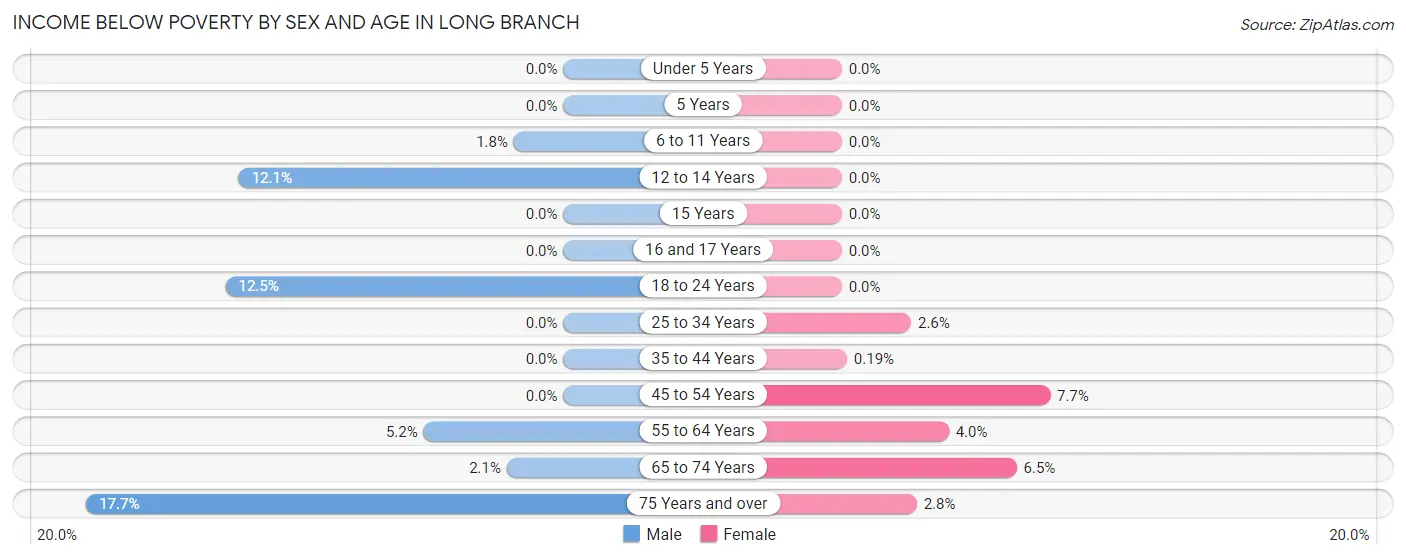
| Age Bracket | Male | Female |
| Under 5 Years | 0 (0.0%) | 0 (0.0%) |
| 5 Years | 0 (0.0%) | 0 (0.0%) |
| 6 to 11 Years | 8 (1.8%) | 0 (0.0%) |
| 12 to 14 Years | 20 (12.0%) | 0 (0.0%) |
| 15 Years | 0 (0.0%) | 0 (0.0%) |
| 16 and 17 Years | 0 (0.0%) | 0 (0.0%) |
| 18 to 24 Years | 39 (12.5%) | 0 (0.0%) |
| 25 to 34 Years | 0 (0.0%) | 7 (2.6%) |
| 35 to 44 Years | 0 (0.0%) | 1 (0.2%) |
| 45 to 54 Years | 0 (0.0%) | 44 (7.7%) |
| 55 to 64 Years | 27 (5.2%) | 21 (4.0%) |
| 65 to 74 Years | 9 (2.1%) | 32 (6.5%) |
| 75 Years and over | 48 (17.7%) | 12 (2.8%) |
| Total | 151 (4.1%) | 117 (3.0%) |
Income Above Poverty by Sex and Age in Long Branch
According to the poverty statistics in Long Branch, males aged under 5 years and females aged under 5 years are the age groups that are most secure financially, with 100.0% of males and 100.0% of females in these age groups living above the poverty line.
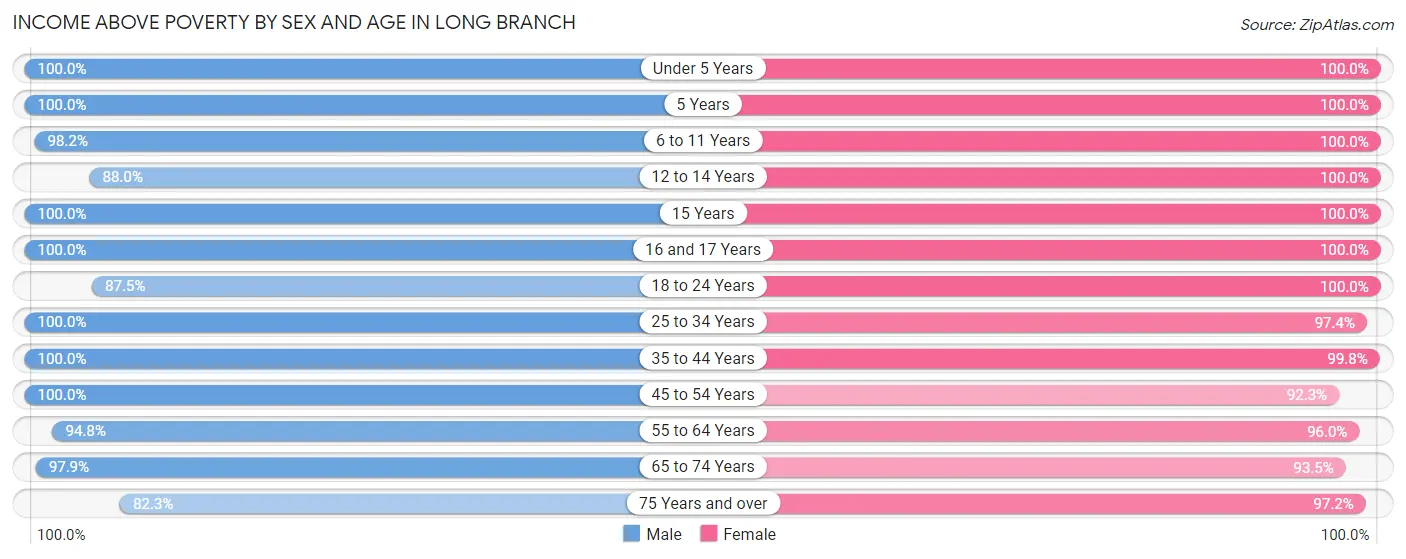
| Age Bracket | Male | Female |
| Under 5 Years | 73 (100.0%) | 55 (100.0%) |
| 5 Years | 55 (100.0%) | 73 (100.0%) |
| 6 to 11 Years | 427 (98.2%) | 260 (100.0%) |
| 12 to 14 Years | 146 (87.9%) | 296 (100.0%) |
| 15 Years | 30 (100.0%) | 74 (100.0%) |
| 16 and 17 Years | 196 (100.0%) | 99 (100.0%) |
| 18 to 24 Years | 272 (87.5%) | 247 (100.0%) |
| 25 to 34 Years | 258 (100.0%) | 265 (97.4%) |
| 35 to 44 Years | 446 (100.0%) | 531 (99.8%) |
| 45 to 54 Years | 515 (100.0%) | 525 (92.3%) |
| 55 to 64 Years | 493 (94.8%) | 508 (96.0%) |
| 65 to 74 Years | 420 (97.9%) | 461 (93.5%) |
| 75 Years and over | 223 (82.3%) | 419 (97.2%) |
| Total | 3,554 (95.9%) | 3,813 (97.0%) |
Income Below Poverty Among Married-Couple Families in Long Branch
The poverty statistics for married-couple families in Long Branch show that 1.8% or 34 of the total 1,872 families live below the poverty line. Families with 1 or 2 children have the highest poverty rate of 3.2%, comprising of 18 families. On the other hand, families with 3 or 4 children have the lowest poverty rate of 0.0%, which includes 0 families.
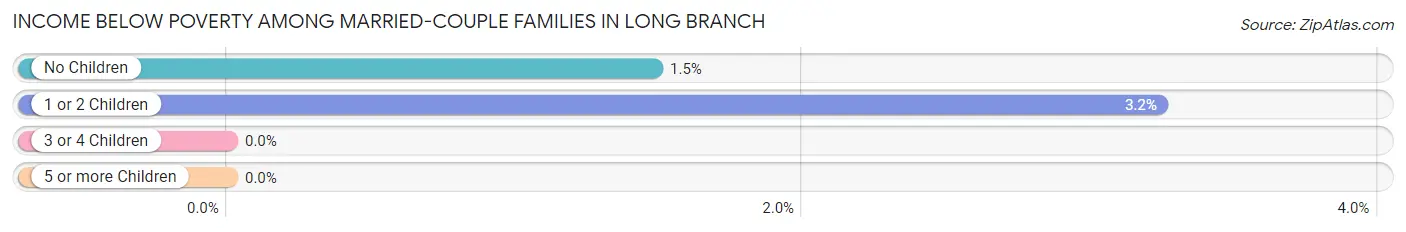
| Children | Above Poverty | Below Poverty |
| No Children | 1,067 (98.5%) | 16 (1.5%) |
| 1 or 2 Children | 537 (96.8%) | 18 (3.2%) |
| 3 or 4 Children | 234 (100.0%) | 0 (0.0%) |
| 5 or more Children | 0 (0.0%) | 0 (0.0%) |
| Total | 1,838 (98.2%) | 34 (1.8%) |
Income Below Poverty Among Single-Parent Households in Long Branch
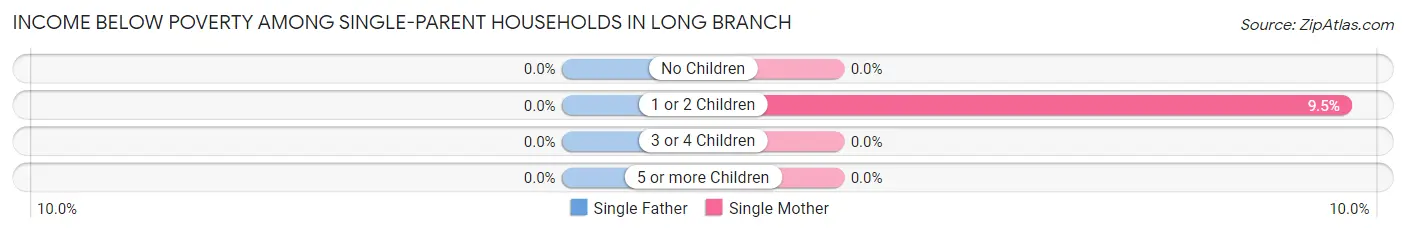
| Children | Single Father | Single Mother |
| No Children | 0 (0.0%) | 0 (0.0%) |
| 1 or 2 Children | 0 (0.0%) | 7 (9.5%) |
| 3 or 4 Children | 0 (0.0%) | 0 (0.0%) |
| 5 or more Children | 0 (0.0%) | 0 (0.0%) |
| Total | 0 (0.0%) | 7 (3.4%) |
Income Below Poverty Among Married-Couple vs Single-Parent Households in Long Branch
The poverty data for Long Branch shows that 34 of the married-couple family households (1.8%) and 7 of the single-parent households (2.3%) are living below the poverty level. Within the married-couple family households, those with 1 or 2 children have the highest poverty rate, with 18 households (3.2%) falling below the poverty line. Among the single-parent households, those with 1 or 2 children have the highest poverty rate, with 7 household (4.1%) living below poverty.
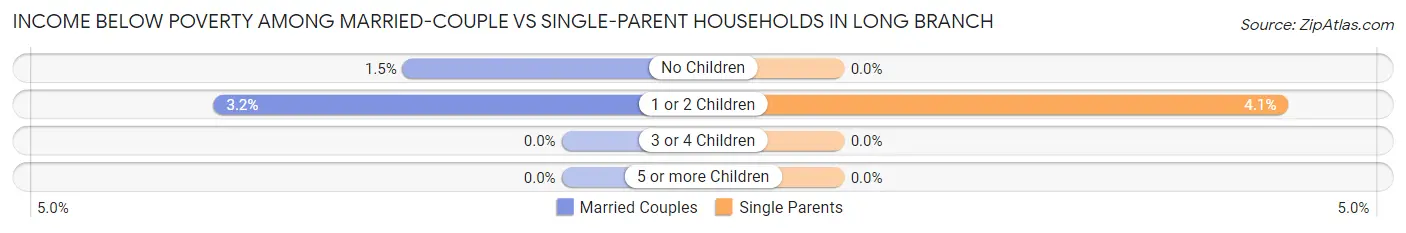
| Children | Married-Couple Families | Single-Parent Households |
| No Children | 16 (1.5%) | 0 (0.0%) |
| 1 or 2 Children | 18 (3.2%) | 7 (4.1%) |
| 3 or 4 Children | 0 (0.0%) | 0 (0.0%) |
| 5 or more Children | 0 (0.0%) | 0 (0.0%) |
| Total | 34 (1.8%) | 7 (2.3%) |
Race in Long Branch
The most populous races in Long Branch are White / Caucasian (5,251 | 68.8%), Asian (1,341 | 17.6%), and Hispanic or Latino (1,087 | 14.2%).
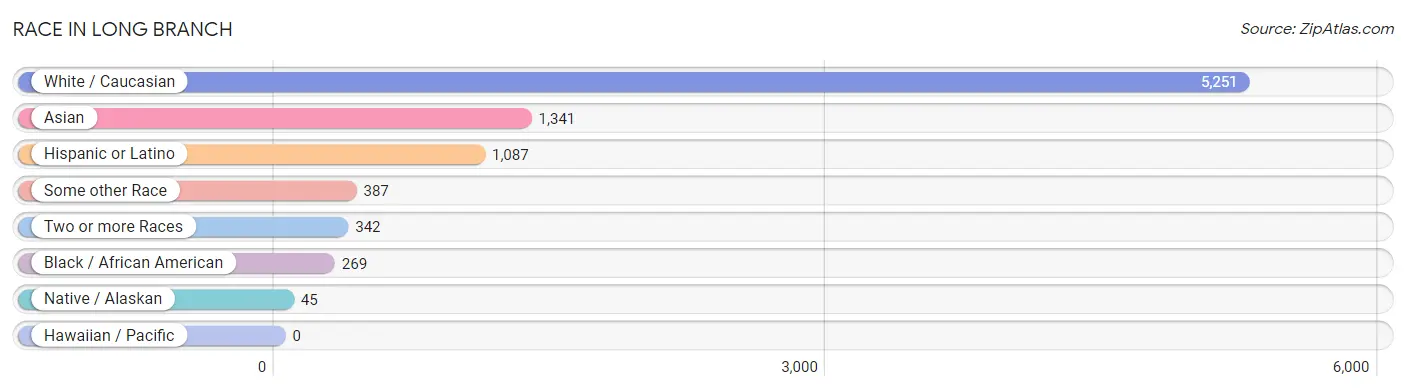
| Race | # Population | % Population |
| Asian | 1,341 | 17.6% |
| Black / African American | 269 | 3.5% |
| Hawaiian / Pacific | 0 | 0.0% |
| Hispanic or Latino | 1,087 | 14.2% |
| Native / Alaskan | 45 | 0.6% |
| White / Caucasian | 5,251 | 68.8% |
| Two or more Races | 342 | 4.5% |
| Some other Race | 387 | 5.1% |
| Total | 7,635 | 100.0% |
Ancestry in Long Branch
The most populous ancestries reported in Long Branch are English (1,174 | 15.4%), German (1,059 | 13.9%), Irish (883 | 11.6%), Burmese (561 | 7.3%), and Italian (546 | 7.1%), together accounting for 55.3% of all Long Branch residents.
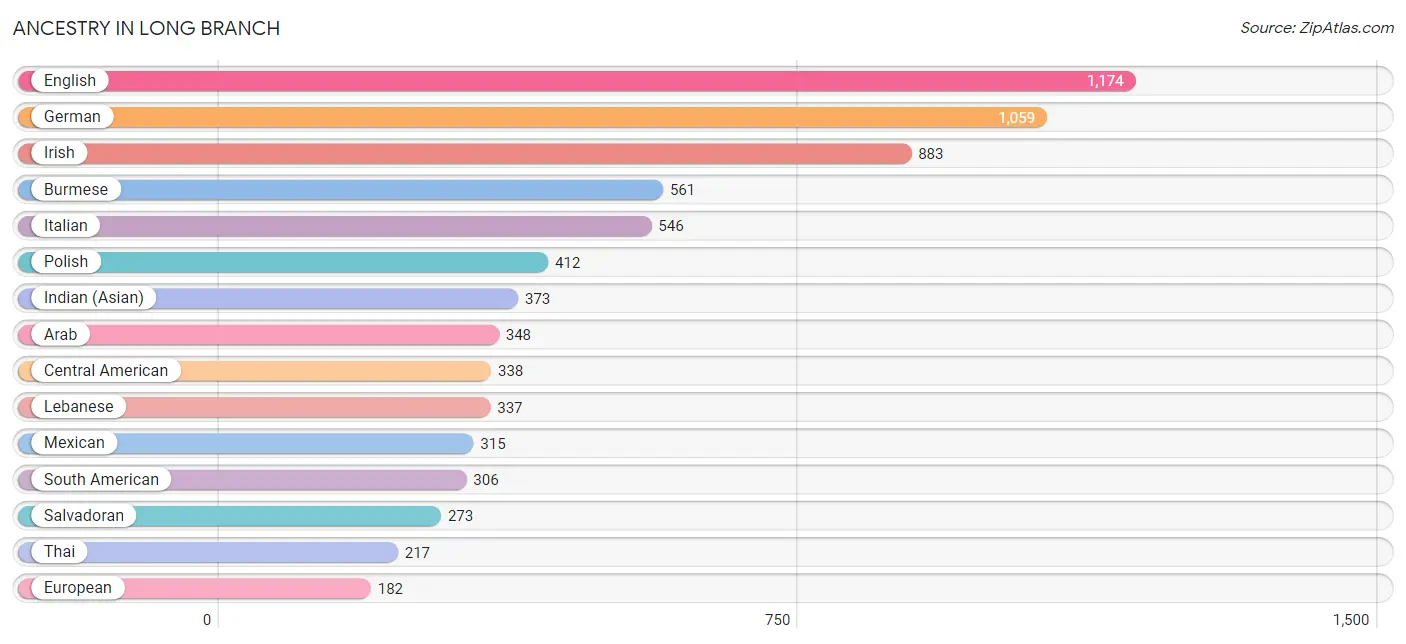
| Ancestry | # Population | % Population |
| American | 102 | 1.3% |
| Arab | 348 | 4.6% |
| Armenian | 79 | 1.0% |
| Austrian | 30 | 0.4% |
| Barbadian | 6 | 0.1% |
| Basque | 7 | 0.1% |
| Bhutanese | 32 | 0.4% |
| Bolivian | 153 | 2.0% |
| British | 15 | 0.2% |
| Burmese | 561 | 7.3% |
| Canadian | 29 | 0.4% |
| Central American | 338 | 4.4% |
| Central American Indian | 11 | 0.1% |
| Chilean | 50 | 0.6% |
| Colombian | 14 | 0.2% |
| Croatian | 14 | 0.2% |
| Czech | 32 | 0.4% |
| Czechoslovakian | 5 | 0.1% |
| Danish | 36 | 0.5% |
| Dutch | 64 | 0.8% |
| Eastern European | 107 | 1.4% |
| Ecuadorian | 55 | 0.7% |
| English | 1,174 | 15.4% |
| European | 182 | 2.4% |
| Filipino | 29 | 0.4% |
| Finnish | 6 | 0.1% |
| French | 141 | 1.8% |
| French Canadian | 56 | 0.7% |
| German | 1,059 | 13.9% |
| Ghanaian | 5 | 0.1% |
| Greek | 56 | 0.7% |
| Guatemalan | 47 | 0.6% |
| Honduran | 18 | 0.2% |
| Hungarian | 20 | 0.3% |
| Icelander | 7 | 0.1% |
| Indian (Asian) | 373 | 4.9% |
| Iranian | 28 | 0.4% |
| Irish | 883 | 11.6% |
| Italian | 546 | 7.1% |
| Jamaican | 7 | 0.1% |
| Korean | 143 | 1.9% |
| Lebanese | 337 | 4.4% |
| Mexican | 315 | 4.1% |
| Moroccan | 11 | 0.1% |
| Nigerian | 6 | 0.1% |
| Northern European | 51 | 0.7% |
| Norwegian | 46 | 0.6% |
| Paraguayan | 17 | 0.2% |
| Peruvian | 17 | 0.2% |
| Polish | 412 | 5.4% |
| Portuguese | 7 | 0.1% |
| Puerto Rican | 46 | 0.6% |
| Russian | 72 | 0.9% |
| Salvadoran | 273 | 3.6% |
| Scandinavian | 21 | 0.3% |
| Scotch-Irish | 55 | 0.7% |
| Scottish | 167 | 2.2% |
| Slovak | 48 | 0.6% |
| South American | 306 | 4.0% |
| Spaniard | 7 | 0.1% |
| Sri Lankan | 127 | 1.7% |
| Subsaharan African | 49 | 0.6% |
| Sudanese | 38 | 0.5% |
| Swedish | 22 | 0.3% |
| Swiss | 38 | 0.5% |
| Thai | 217 | 2.8% |
| Turkish | 11 | 0.1% |
| Ukrainian | 45 | 0.6% |
| Welsh | 34 | 0.4% |
| West Indian | 6 | 0.1% |
| Yugoslavian | 20 | 0.3% | View All 71 Rows |
Immigrants in Long Branch
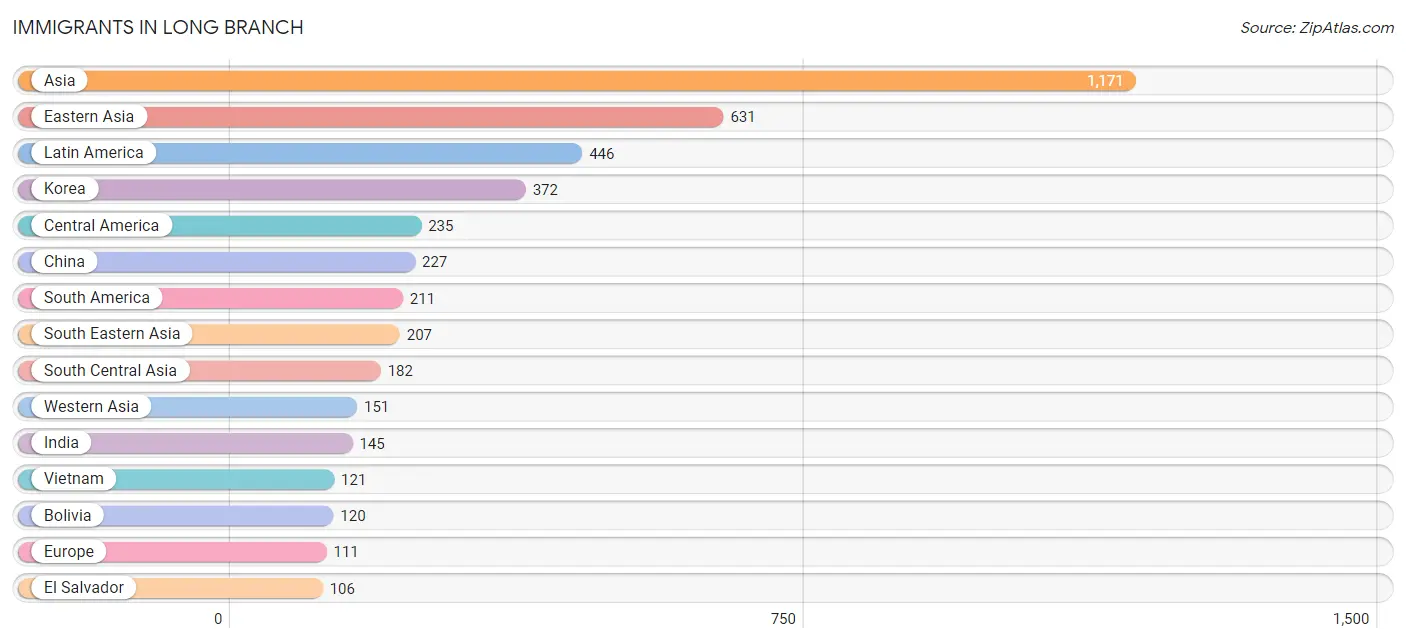
The most numerous immigrant groups reported in Long Branch came from Asia (1,171 | 15.3%), Eastern Asia (631 | 8.3%), Latin America (446 | 5.8%), Korea (372 | 4.9%), and Central America (235 | 3.1%), together accounting for 37.4% of all Long Branch residents.
| Immigration Origin | # Population | % Population |
| Afghanistan | 15 | 0.2% |
| Africa | 43 | 0.6% |
| Asia | 1,171 | 15.3% |
| Bolivia | 120 | 1.6% |
| Bosnia and Herzegovina | 20 | 0.3% |
| Canada | 24 | 0.3% |
| Central America | 235 | 3.1% |
| Chile | 50 | 0.6% |
| China | 227 | 3.0% |
| Eastern Africa | 38 | 0.5% |
| Eastern Asia | 631 | 8.3% |
| Eastern Europe | 82 | 1.1% |
| El Salvador | 106 | 1.4% |
| Eritrea | 18 | 0.2% |
| Europe | 111 | 1.5% |
| France | 6 | 0.1% |
| Germany | 17 | 0.2% |
| Guatemala | 47 | 0.6% |
| Hong Kong | 21 | 0.3% |
| India | 145 | 1.9% |
| Iran | 13 | 0.2% |
| Israel | 11 | 0.1% |
| Japan | 32 | 0.4% |
| Jordan | 36 | 0.5% |
| Kenya | 20 | 0.3% |
| Korea | 372 | 4.9% |
| Latin America | 446 | 5.8% |
| Lebanon | 98 | 1.3% |
| Mexico | 82 | 1.1% |
| Netherlands | 6 | 0.1% |
| Northern Africa | 5 | 0.1% |
| Pakistan | 9 | 0.1% |
| Peru | 24 | 0.3% |
| Philippines | 86 | 1.1% |
| Poland | 16 | 0.2% |
| Russia | 46 | 0.6% |
| South America | 211 | 2.8% |
| South Central Asia | 182 | 2.4% |
| South Eastern Asia | 207 | 2.7% |
| Sudan | 5 | 0.1% |
| Taiwan | 61 | 0.8% |
| Turkey | 6 | 0.1% |
| Vietnam | 121 | 1.6% |
| Western Asia | 151 | 2.0% |
| Western Europe | 29 | 0.4% | View All 45 Rows |
Sex and Age in Long Branch
Sex and Age in Long Branch
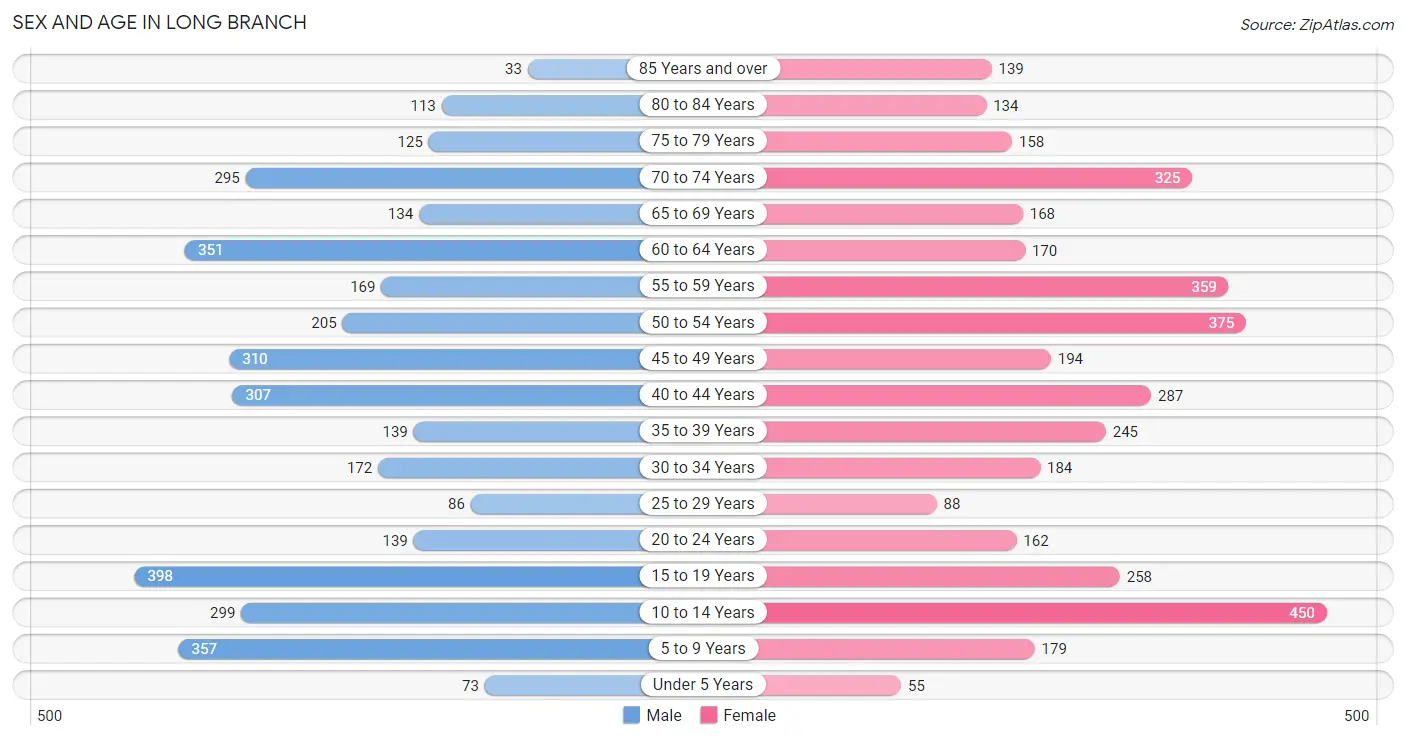
The most populous age groups in Long Branch are 15 to 19 Years (398 | 10.7%) for men and 10 to 14 Years (450 | 11.5%) for women.
| Age Bracket | Male | Female |
| Under 5 Years | 73 (2.0%) | 55 (1.4%) |
| 5 to 9 Years | 357 (9.6%) | 179 (4.5%) |
| 10 to 14 Years | 299 (8.1%) | 450 (11.5%) |
| 15 to 19 Years | 398 (10.7%) | 258 (6.6%) |
| 20 to 24 Years | 139 (3.7%) | 162 (4.1%) |
| 25 to 29 Years | 86 (2.3%) | 88 (2.2%) |
| 30 to 34 Years | 172 (4.6%) | 184 (4.7%) |
| 35 to 39 Years | 139 (3.7%) | 245 (6.2%) |
| 40 to 44 Years | 307 (8.3%) | 287 (7.3%) |
| 45 to 49 Years | 310 (8.4%) | 194 (4.9%) |
| 50 to 54 Years | 205 (5.5%) | 375 (9.5%) |
| 55 to 59 Years | 169 (4.6%) | 359 (9.1%) |
| 60 to 64 Years | 351 (9.5%) | 170 (4.3%) |
| 65 to 69 Years | 134 (3.6%) | 168 (4.3%) |
| 70 to 74 Years | 295 (8.0%) | 325 (8.3%) |
| 75 to 79 Years | 125 (3.4%) | 158 (4.0%) |
| 80 to 84 Years | 113 (3.0%) | 134 (3.4%) |
| 85 Years and over | 33 (0.9%) | 139 (3.5%) |
| Total | 3,705 (100.0%) | 3,930 (100.0%) |
Families and Households in Long Branch
Median Family Size in Long Branch
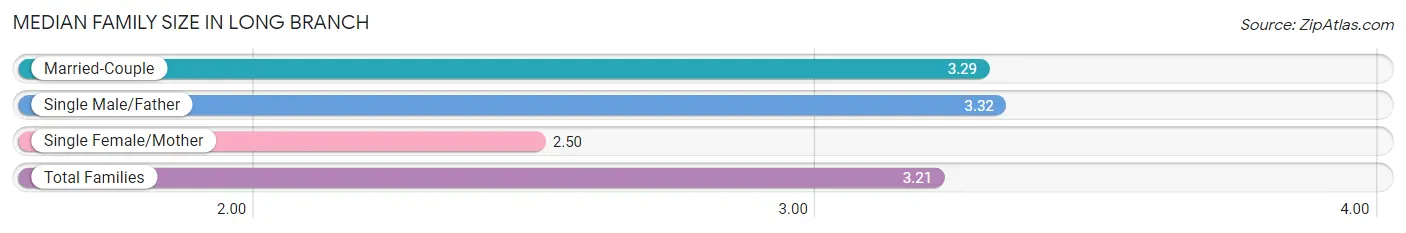
The median family size in Long Branch is 3.21 persons per family, with single male/father families (95 | 4.4%) accounting for the largest median family size of 3.32 persons per family. On the other hand, single female/mother families (209 | 9.6%) represent the smallest median family size with 2.50 persons per family.
| Family Type | # Families | Family Size |
| Married-Couple | 1,872 (86.0%) | 3.29 |
| Single Male/Father | 95 (4.4%) | 3.32 |
| Single Female/Mother | 209 (9.6%) | 2.50 |
| Total Families | 2,176 (100.0%) | 3.21 |
Median Household Size in Long Branch
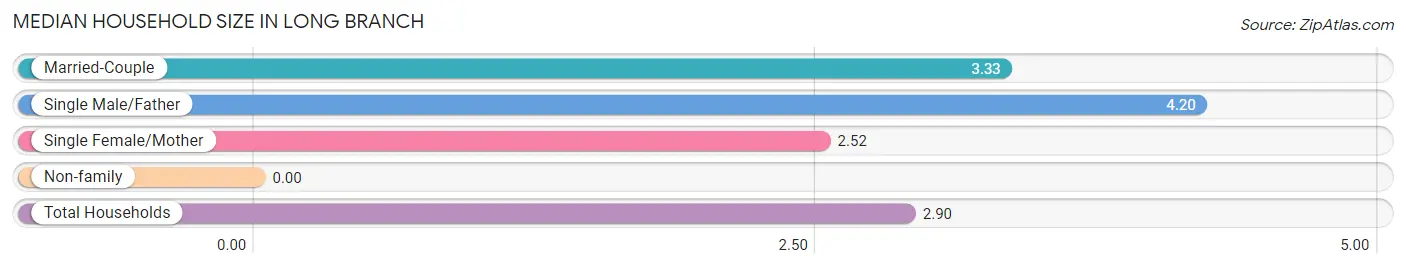
| Household Type | # Households | Household Size |
| Married-Couple | 1,872 (71.3%) | 3.33 |
| Single Male/Father | 95 (3.6%) | 4.20 |
| Single Female/Mother | 209 (8.0%) | 2.52 |
| Non-family | 451 (17.2%) | - |
| Total Households | 2,627 (100.0%) | 2.90 |
Household Size by Marriage Status in Long Branch
Out of a total of 2,627 households in Long Branch, 2,176 (82.8%) are family households, while 451 (17.2%) are nonfamily households. The most numerous type of family households are 2-person households, comprising 905, and the most common type of nonfamily households are 1-person households, comprising 451.
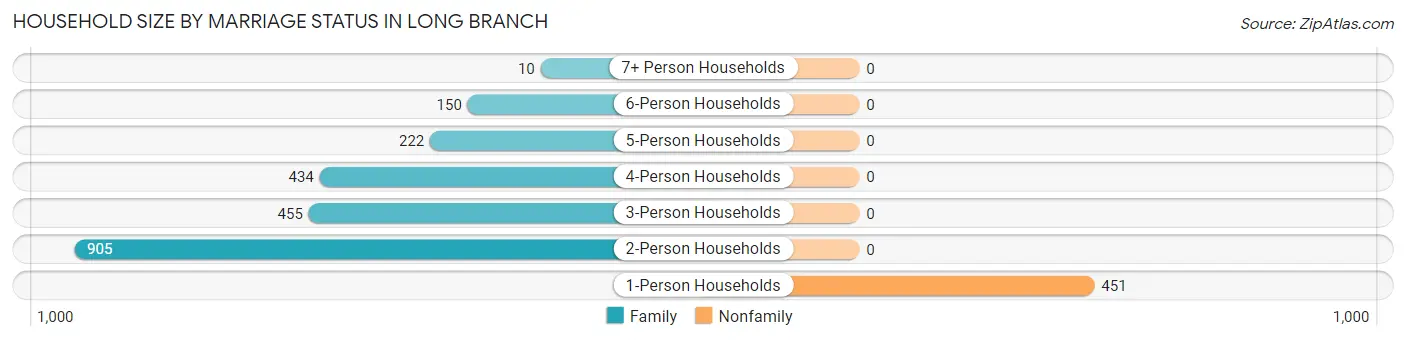
| Household Size | Family Households | Nonfamily Households |
| 1-Person Households | - | 451 (17.2%) |
| 2-Person Households | 905 (34.4%) | 0 (0.0%) |
| 3-Person Households | 455 (17.3%) | 0 (0.0%) |
| 4-Person Households | 434 (16.5%) | 0 (0.0%) |
| 5-Person Households | 222 (8.5%) | 0 (0.0%) |
| 6-Person Households | 150 (5.7%) | 0 (0.0%) |
| 7+ Person Households | 10 (0.4%) | 0 (0.0%) |
| Total | 2,176 (82.8%) | 451 (17.2%) |
Female Fertility in Long Branch
Fertility by Age in Long Branch
Average fertility rate in Long Branch is 21.0 births per 1,000 women. Women in the age bracket of 20 to 34 years have the highest fertility rate with 55.0 births per 1,000 women. Women in the age bracket of 20 to 34 years acount for 75.0% of all women with births.
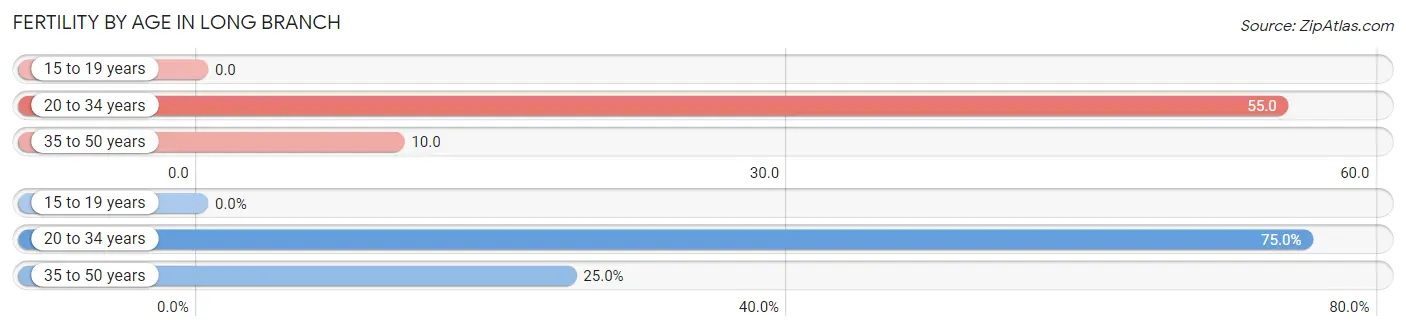
| Age Bracket | Women with Births | Births / 1,000 Women |
| 15 to 19 years | 0 (0.0%) | 0.0 |
| 20 to 34 years | 24 (75.0%) | 55.0 |
| 35 to 50 years | 8 (25.0%) | 10.0 |
| Total | 32 (100.0%) | 21.0 |
Fertility by Age by Marriage Status in Long Branch
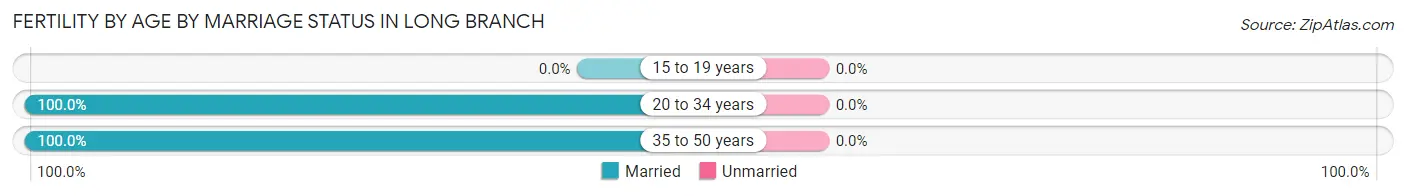
| Age Bracket | Married | Unmarried |
| 15 to 19 years | 0 (0.0%) | 0 (0.0%) |
| 20 to 34 years | 24 (100.0%) | 0 (0.0%) |
| 35 to 50 years | 8 (100.0%) | 0 (0.0%) |
| Total | 32 (100.0%) | 0 (0.0%) |
Fertility by Education in Long Branch
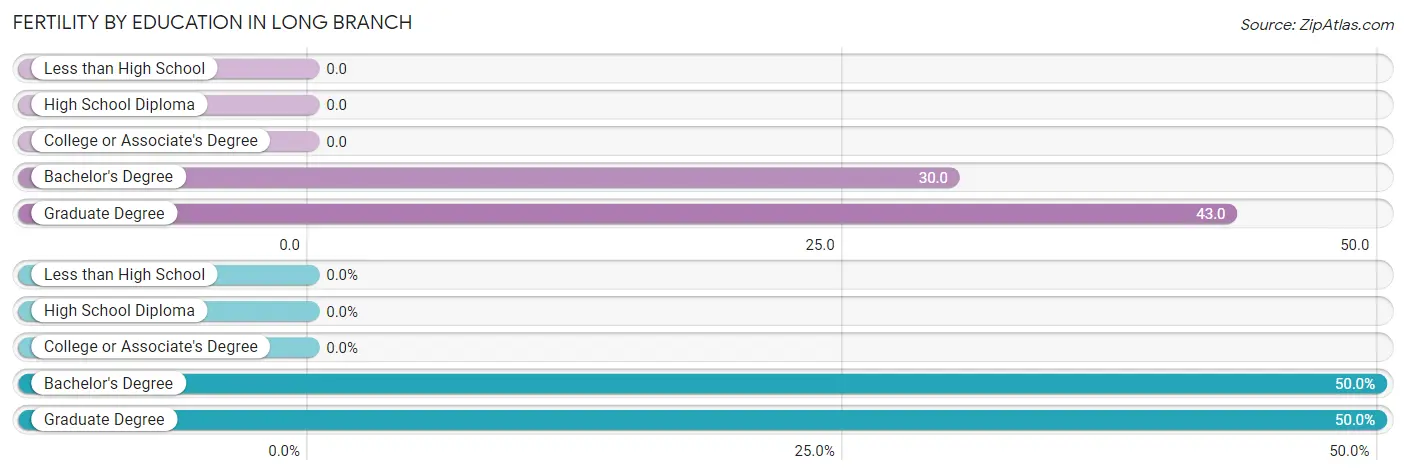
| Educational Attainment | Women with Births | Births / 1,000 Women |
| Less than High School | 0 (0.0%) | 0.0 |
| High School Diploma | 0 (0.0%) | 0.0 |
| College or Associate's Degree | 0 (0.0%) | 0.0 |
| Bachelor's Degree | 16 (50.0%) | 30.0 |
| Graduate Degree | 16 (50.0%) | 43.0 |
| Total | 32 (100.0%) | 21.0 |
Fertility by Education by Marriage Status in Long Branch
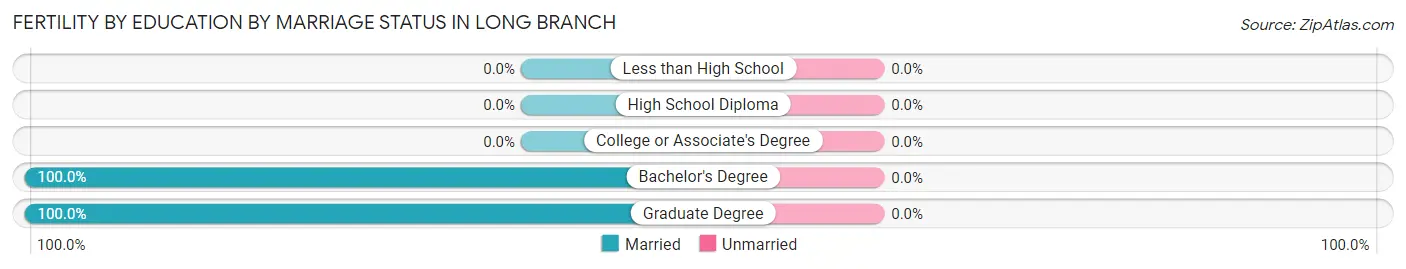
| Educational Attainment | Married | Unmarried |
| Less than High School | 0 (0.0%) | 0 (0.0%) |
| High School Diploma | 0 (0.0%) | 0 (0.0%) |
| College or Associate's Degree | 0 (0.0%) | 0 (0.0%) |
| Bachelor's Degree | 16 (100.0%) | 0 (0.0%) |
| Graduate Degree | 16 (100.0%) | 0 (0.0%) |
| Total | 32 (100.0%) | 0 (0.0%) |
Employment Characteristics in Long Branch
Employment by Class of Employer in Long Branch
Among the 3,799 employed individuals in Long Branch, private company employees (2,054 | 54.1%), federal government employees (598 | 15.7%), and not-for-profit organizations (362 | 9.5%) make up the most common classes of employment.
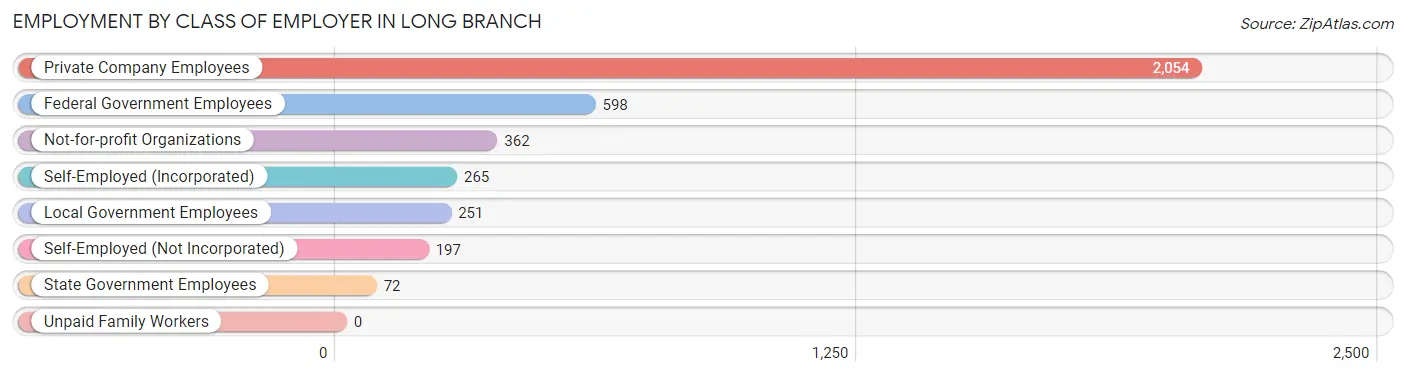
| Employer Class | # Employees | % Employees |
| Private Company Employees | 2,054 | 54.1% |
| Self-Employed (Incorporated) | 265 | 7.0% |
| Self-Employed (Not Incorporated) | 197 | 5.2% |
| Not-for-profit Organizations | 362 | 9.5% |
| Local Government Employees | 251 | 6.6% |
| State Government Employees | 72 | 1.9% |
| Federal Government Employees | 598 | 15.7% |
| Unpaid Family Workers | 0 | 0.0% |
| Total | 3,799 | 100.0% |
Employment Status by Age in Long Branch
According to the labor force statistics for Long Branch, out of the total population over 16 years of age (6,118), 64.7% or 3,958 individuals are in the labor force, with 3.1% or 123 of them unemployed. The age group with the highest labor force participation rate is 45 to 54 years, with 94.6% or 1,025 individuals in the labor force. Within the labor force, the 55 to 59 years age range has the highest percentage of unemployed individuals, with 17.3% or 80 of them being unemployed.
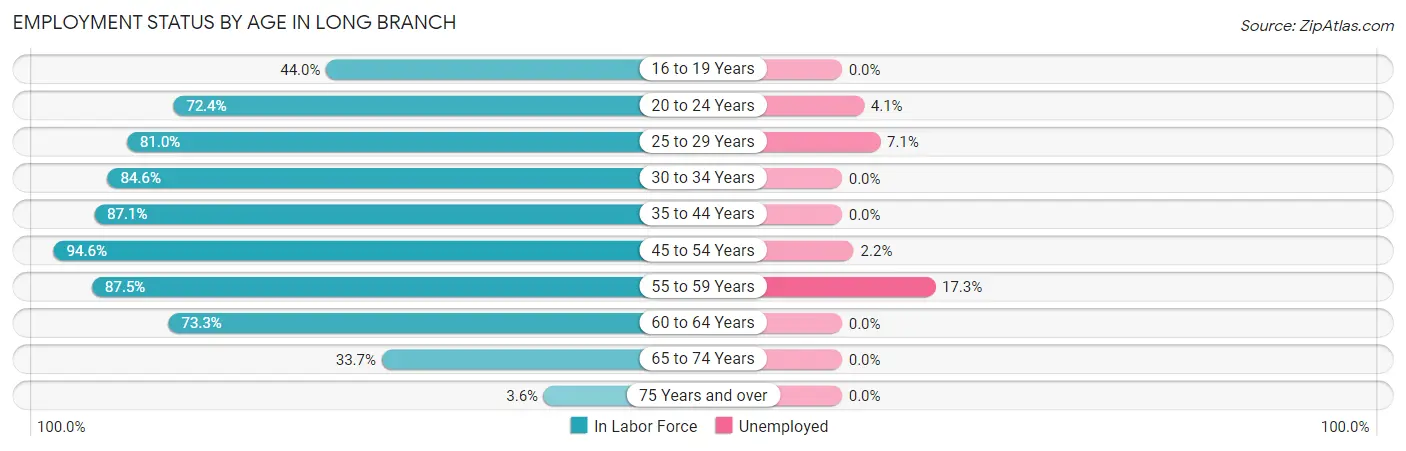
| Age Bracket | In Labor Force | Unemployed |
| 16 to 19 Years | 243 (44.0%) | 0 (0.0%) |
| 20 to 24 Years | 218 (72.4%) | 9 (4.1%) |
| 25 to 29 Years | 141 (81.0%) | 10 (7.1%) |
| 30 to 34 Years | 301 (84.6%) | 0 (0.0%) |
| 35 to 44 Years | 852 (87.1%) | 0 (0.0%) |
| 45 to 54 Years | 1,025 (94.6%) | 23 (2.2%) |
| 55 to 59 Years | 462 (87.5%) | 80 (17.3%) |
| 60 to 64 Years | 382 (73.3%) | 0 (0.0%) |
| 65 to 74 Years | 311 (33.7%) | 0 (0.0%) |
| 75 Years and over | 25 (3.6%) | 0 (0.0%) |
| Total | 3,958 (64.7%) | 123 (3.1%) |
Employment Status by Educational Attainment in Long Branch
According to labor force statistics for Long Branch, 86.9% of individuals (3,164) out of the total population between 25 and 64 years of age (3,641) are in the labor force, with 3.6% or 114 of them being unemployed. The group with the highest labor force participation rate are those with the educational attainment of college / associate degree, with 95.2% or 439 individuals in the labor force. Within the labor force, individuals with bachelor's degree or higher education have the highest percentage of unemployment, with 4.7% or 110 of them being unemployed.
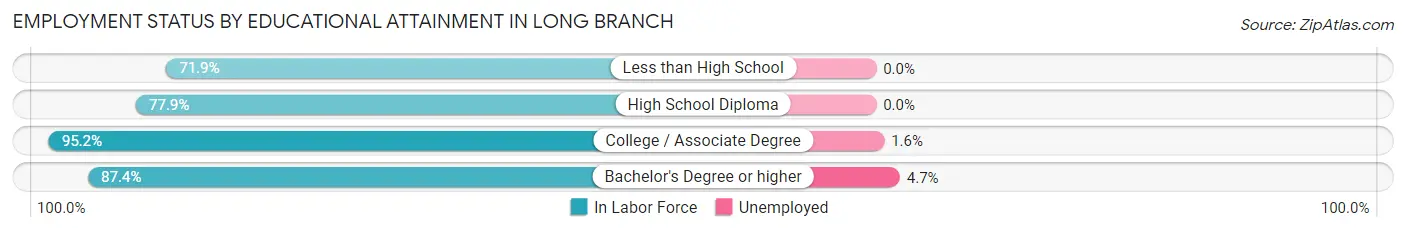
| Educational Attainment | In Labor Force | Unemployed |
| Less than High School | 82 (71.9%) | 0 (0.0%) |
| High School Diploma | 311 (77.9%) | 0 (0.0%) |
| College / Associate Degree | 439 (95.2%) | 7 (1.6%) |
| Bachelor's Degree or higher | 2,331 (87.4%) | 125 (4.7%) |
| Total | 3,164 (86.9%) | 131 (3.6%) |
Employment Occupations by Sex in Long Branch
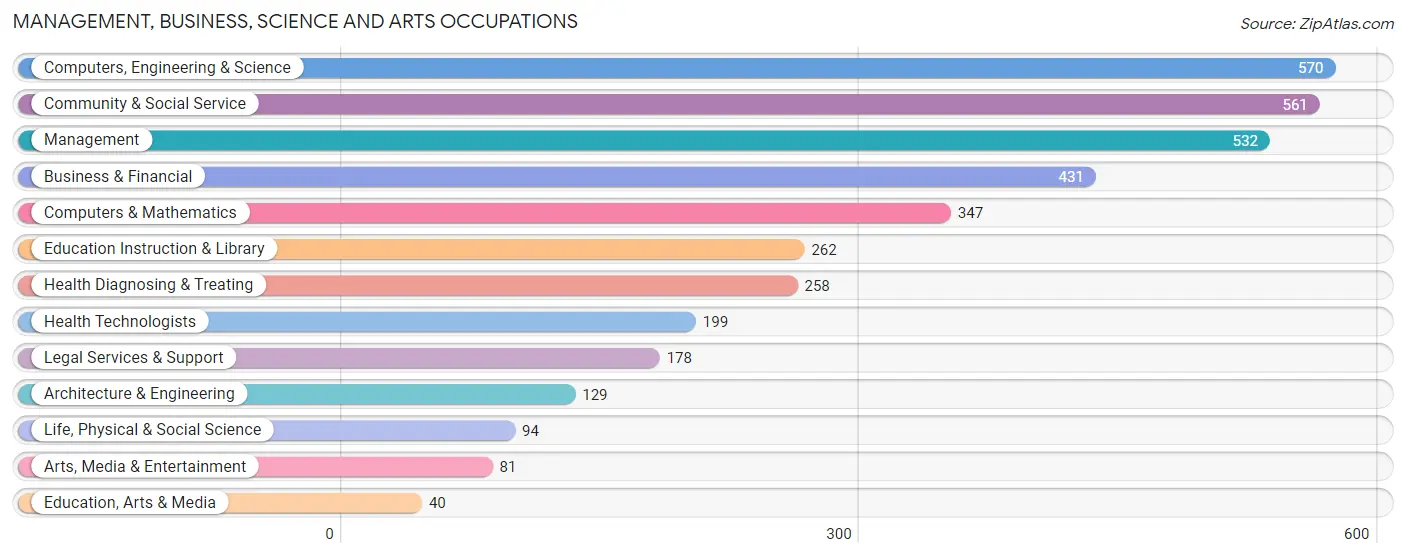
Management, Business, Science and Arts Occupations
The most common Management, Business, Science and Arts occupations in Long Branch are Computers, Engineering & Science (570 | 15.2%), Community & Social Service (561 | 14.9%), Management (532 | 14.1%), Business & Financial (431 | 11.5%), and Computers & Mathematics (347 | 9.2%).
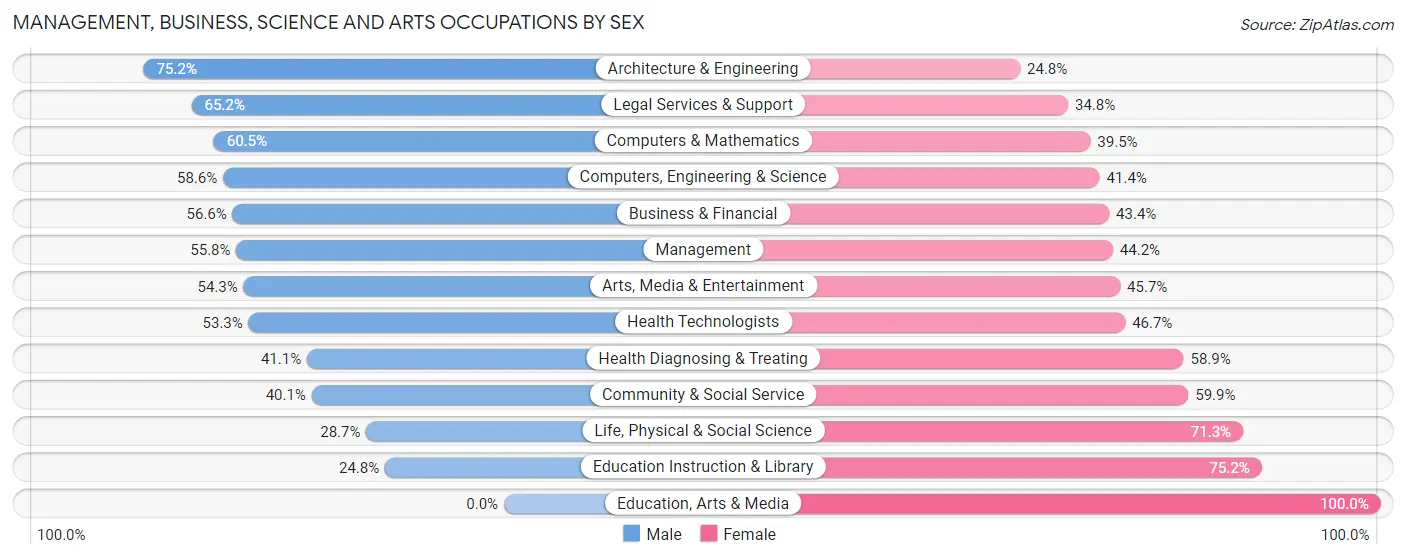
Management, Business, Science and Arts Occupations by Sex
Within the Management, Business, Science and Arts occupations in Long Branch, the most male-oriented occupations are Architecture & Engineering (75.2%), Legal Services & Support (65.2%), and Computers & Mathematics (60.5%), while the most female-oriented occupations are Education, Arts & Media (100.0%), Education Instruction & Library (75.2%), and Life, Physical & Social Science (71.3%).
| Occupation | Male | Female |
| Management | 297 (55.8%) | 235 (44.2%) |
| Business & Financial | 244 (56.6%) | 187 (43.4%) |
| Computers, Engineering & Science | 334 (58.6%) | 236 (41.4%) |
| Computers & Mathematics | 210 (60.5%) | 137 (39.5%) |
| Architecture & Engineering | 97 (75.2%) | 32 (24.8%) |
| Life, Physical & Social Science | 27 (28.7%) | 67 (71.3%) |
| Community & Social Service | 225 (40.1%) | 336 (59.9%) |
| Education, Arts & Media | 0 (0.0%) | 40 (100.0%) |
| Legal Services & Support | 116 (65.2%) | 62 (34.8%) |
| Education Instruction & Library | 65 (24.8%) | 197 (75.2%) |
| Arts, Media & Entertainment | 44 (54.3%) | 37 (45.7%) |
| Health Diagnosing & Treating | 106 (41.1%) | 152 (58.9%) |
| Health Technologists | 106 (53.3%) | 93 (46.7%) |
| Total (Category) | 1,206 (51.3%) | 1,146 (48.7%) |
| Total (Overall) | 1,941 (51.6%) | 1,818 (48.4%) |
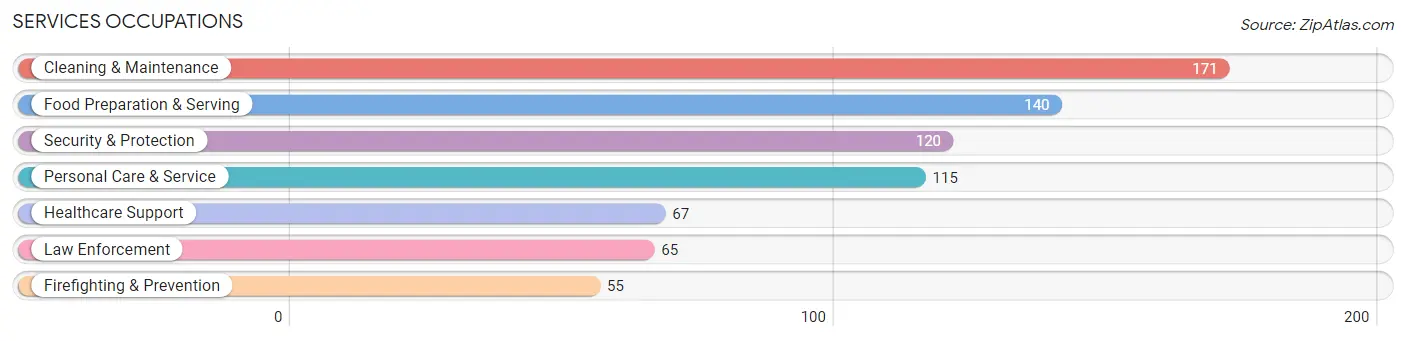
Services Occupations
The most common Services occupations in Long Branch are Cleaning & Maintenance (171 | 4.5%), Food Preparation & Serving (140 | 3.7%), Security & Protection (120 | 3.2%), Personal Care & Service (115 | 3.1%), and Healthcare Support (67 | 1.8%).
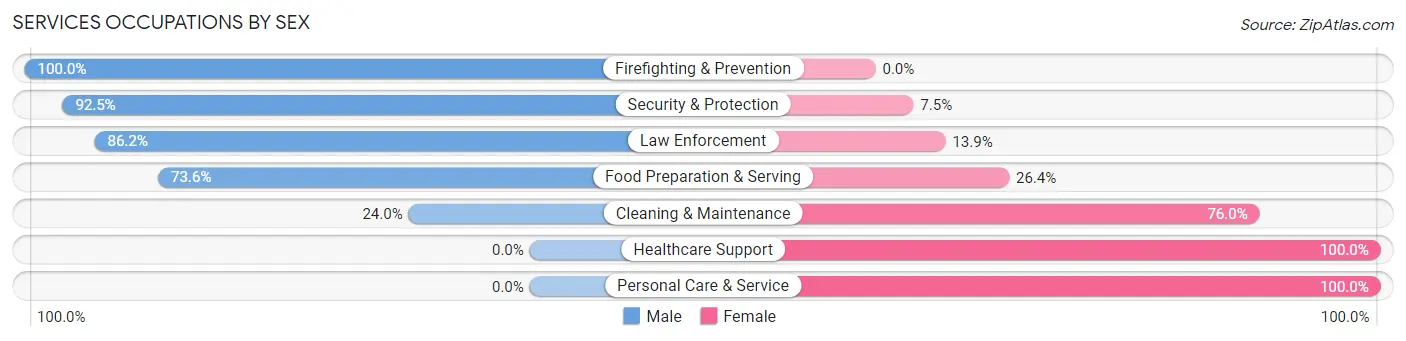
Services Occupations by Sex
Within the Services occupations in Long Branch, the most male-oriented occupations are Firefighting & Prevention (100.0%), Security & Protection (92.5%), and Law Enforcement (86.2%), while the most female-oriented occupations are Healthcare Support (100.0%), Personal Care & Service (100.0%), and Cleaning & Maintenance (76.0%).
| Occupation | Male | Female |
| Healthcare Support | 0 (0.0%) | 67 (100.0%) |
| Security & Protection | 111 (92.5%) | 9 (7.5%) |
| Firefighting & Prevention | 55 (100.0%) | 0 (0.0%) |
| Law Enforcement | 56 (86.2%) | 9 (13.9%) |
| Food Preparation & Serving | 103 (73.6%) | 37 (26.4%) |
| Cleaning & Maintenance | 41 (24.0%) | 130 (76.0%) |
| Personal Care & Service | 0 (0.0%) | 115 (100.0%) |
| Total (Category) | 255 (41.6%) | 358 (58.4%) |
| Total (Overall) | 1,941 (51.6%) | 1,818 (48.4%) |
Sales and Office Occupations
The most common Sales and Office occupations in Long Branch are Sales & Related (327 | 8.7%), and Office & Administration (275 | 7.3%).

Sales and Office Occupations by Sex
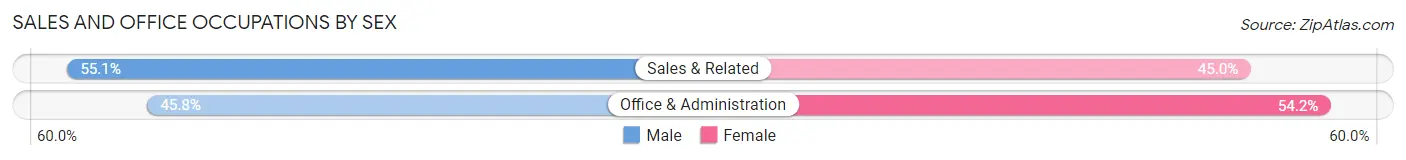
| Occupation | Male | Female |
| Sales & Related | 180 (55.0%) | 147 (45.0%) |
| Office & Administration | 126 (45.8%) | 149 (54.2%) |
| Total (Category) | 306 (50.8%) | 296 (49.2%) |
| Total (Overall) | 1,941 (51.6%) | 1,818 (48.4%) |
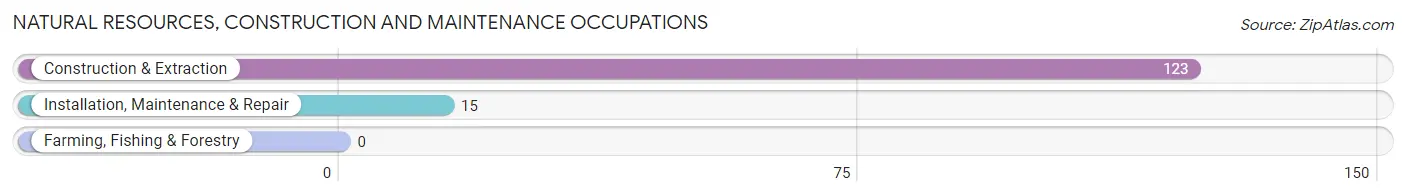
Natural Resources, Construction and Maintenance Occupations
The most common Natural Resources, Construction and Maintenance occupations in Long Branch are Construction & Extraction (123 | 3.3%), and Installation, Maintenance & Repair (15 | 0.4%).
Natural Resources, Construction and Maintenance Occupations by Sex
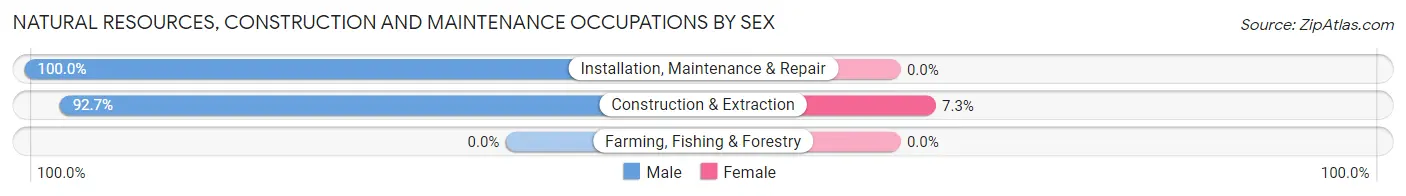
| Occupation | Male | Female |
| Farming, Fishing & Forestry | 0 (0.0%) | 0 (0.0%) |
| Construction & Extraction | 114 (92.7%) | 9 (7.3%) |
| Installation, Maintenance & Repair | 15 (100.0%) | 0 (0.0%) |
| Total (Category) | 129 (93.5%) | 9 (6.5%) |
| Total (Overall) | 1,941 (51.6%) | 1,818 (48.4%) |
Production, Transportation and Moving Occupations
The most common Production, Transportation and Moving occupations in Long Branch are Material Moving (24 | 0.6%), Transportation (21 | 0.6%), and Production (9 | 0.2%).
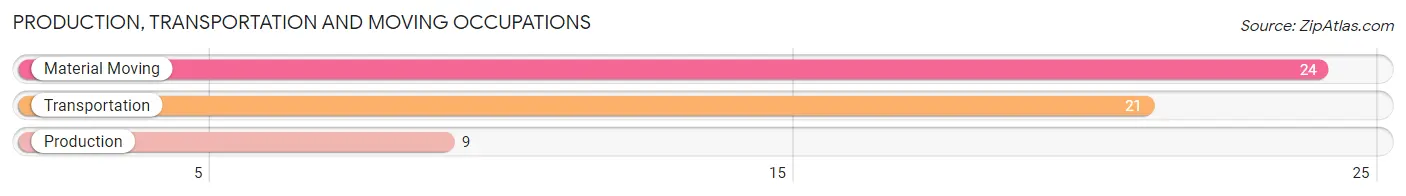
Production, Transportation and Moving Occupations by Sex
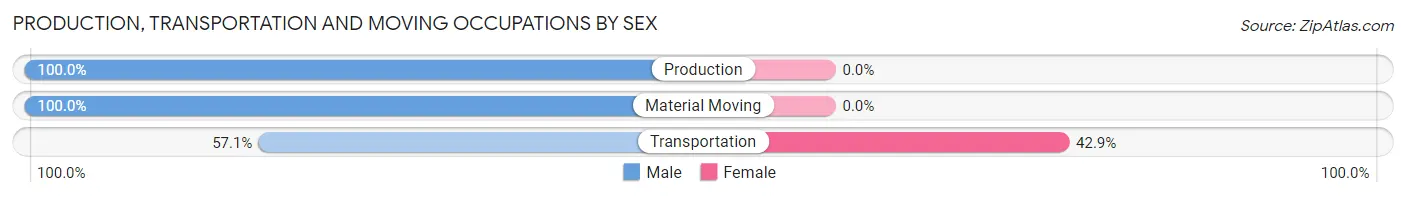
| Occupation | Male | Female |
| Production | 9 (100.0%) | 0 (0.0%) |
| Transportation | 12 (57.1%) | 9 (42.9%) |
| Material Moving | 24 (100.0%) | 0 (0.0%) |
| Total (Category) | 45 (83.3%) | 9 (16.7%) |
| Total (Overall) | 1,941 (51.6%) | 1,818 (48.4%) |
Employment Industries by Sex in Long Branch
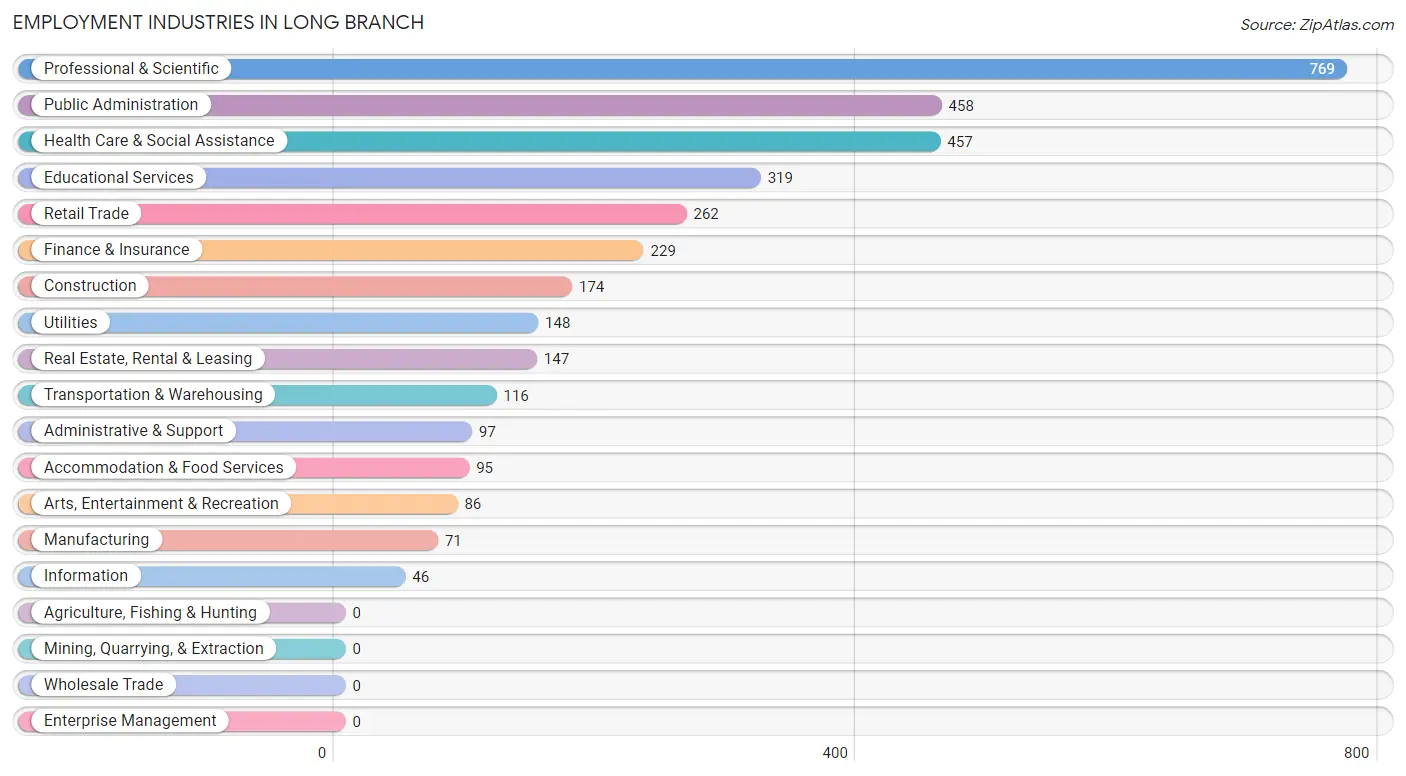
Employment Industries in Long Branch
The major employment industries in Long Branch include Professional & Scientific (769 | 20.5%), Public Administration (458 | 12.2%), Health Care & Social Assistance (457 | 12.2%), Educational Services (319 | 8.5%), and Retail Trade (262 | 7.0%).
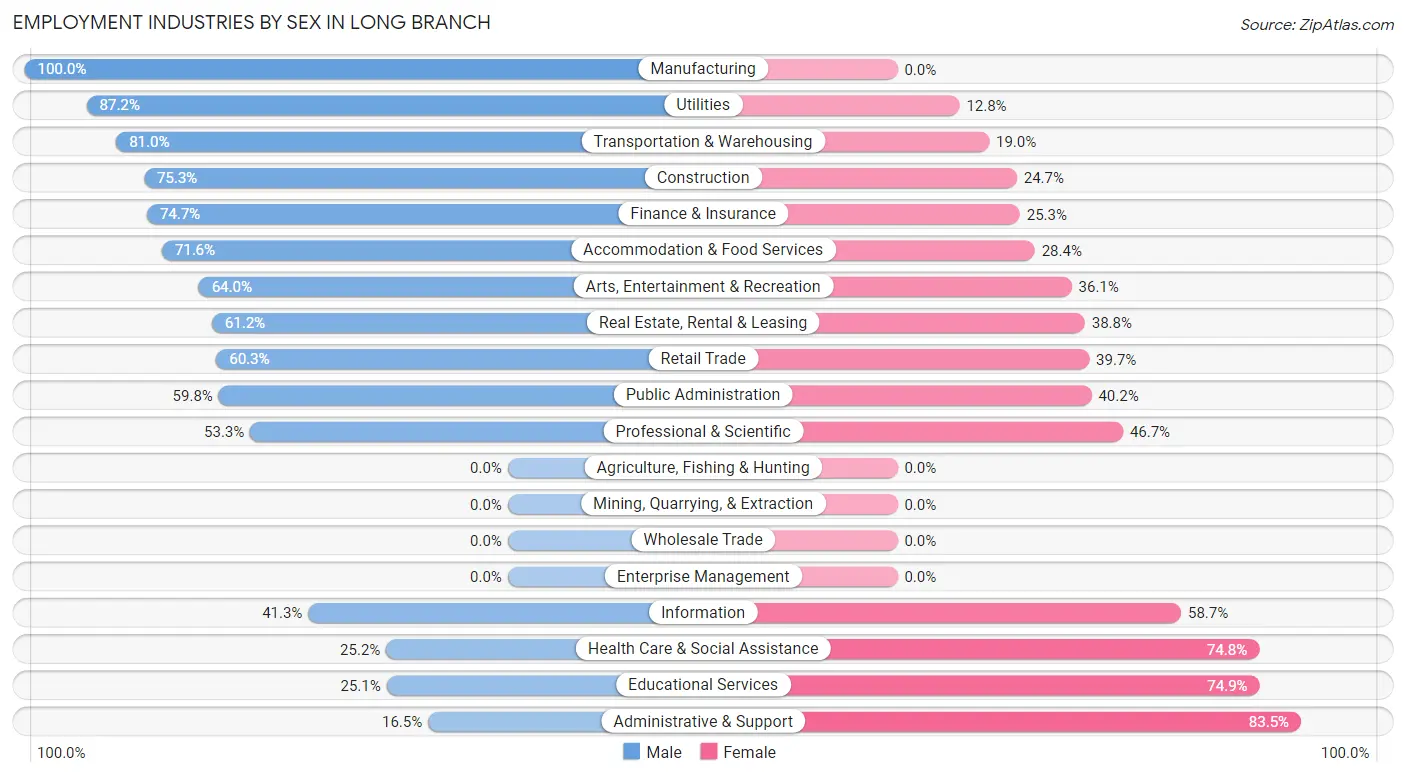
Employment Industries by Sex in Long Branch
The Long Branch industries that see more men than women are Manufacturing (100.0%), Utilities (87.2%), and Transportation & Warehousing (81.0%), whereas the industries that tend to have a higher number of women are Administrative & Support (83.5%), Educational Services (74.9%), and Health Care & Social Assistance (74.8%).
| Industry | Male | Female |
| Agriculture, Fishing & Hunting | 0 (0.0%) | 0 (0.0%) |
| Mining, Quarrying, & Extraction | 0 (0.0%) | 0 (0.0%) |
| Construction | 131 (75.3%) | 43 (24.7%) |
| Manufacturing | 71 (100.0%) | 0 (0.0%) |
| Wholesale Trade | 0 (0.0%) | 0 (0.0%) |
| Retail Trade | 158 (60.3%) | 104 (39.7%) |
| Transportation & Warehousing | 94 (81.0%) | 22 (19.0%) |
| Utilities | 129 (87.2%) | 19 (12.8%) |
| Information | 19 (41.3%) | 27 (58.7%) |
| Finance & Insurance | 171 (74.7%) | 58 (25.3%) |
| Real Estate, Rental & Leasing | 90 (61.2%) | 57 (38.8%) |
| Professional & Scientific | 410 (53.3%) | 359 (46.7%) |
| Enterprise Management | 0 (0.0%) | 0 (0.0%) |
| Administrative & Support | 16 (16.5%) | 81 (83.5%) |
| Educational Services | 80 (25.1%) | 239 (74.9%) |
| Health Care & Social Assistance | 115 (25.2%) | 342 (74.8%) |
| Arts, Entertainment & Recreation | 55 (63.9%) | 31 (36.0%) |
| Accommodation & Food Services | 68 (71.6%) | 27 (28.4%) |
| Public Administration | 274 (59.8%) | 184 (40.2%) |
| Total | 1,941 (51.6%) | 1,818 (48.4%) |
Education in Long Branch
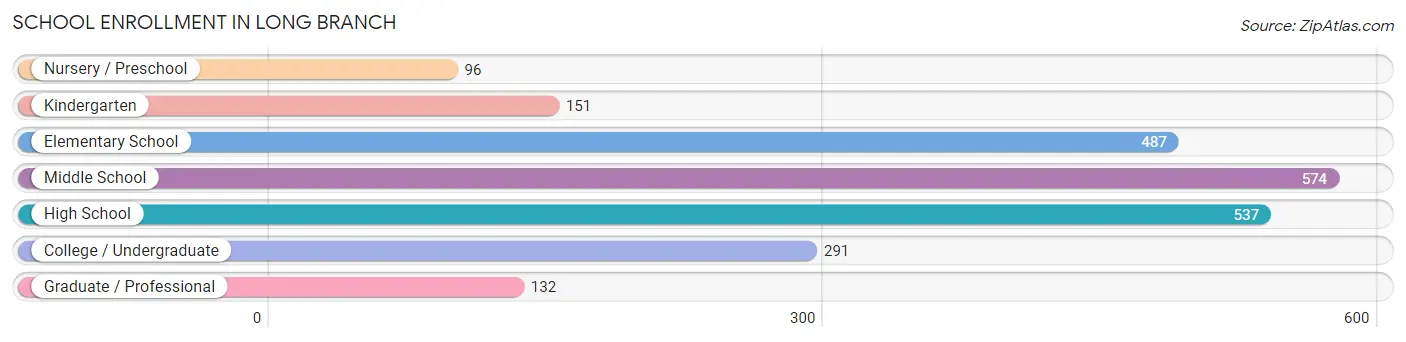
School Enrollment in Long Branch
The most common levels of schooling among the 2,268 students in Long Branch are middle school (574 | 25.3%), high school (537 | 23.7%), and elementary school (487 | 21.5%).
| School Level | # Students | % Students |
| Nursery / Preschool | 96 | 4.2% |
| Kindergarten | 151 | 6.7% |
| Elementary School | 487 | 21.5% |
| Middle School | 574 | 25.3% |
| High School | 537 | 23.7% |
| College / Undergraduate | 291 | 12.8% |
| Graduate / Professional | 132 | 5.8% |
| Total | 2,268 | 100.0% |
School Enrollment by Age by Funding Source in Long Branch
Out of a total of 2,268 students who are enrolled in schools in Long Branch, 358 (15.8%) attend a private institution, while the remaining 1,910 (84.2%) are enrolled in public schools. The age group of 3 to 4 year olds has the highest likelihood of being enrolled in private schools, with 62 (91.2% in the age bracket) enrolled. Conversely, the age group of 15 to 17 year olds has the lowest likelihood of being enrolled in a private school, with 392 (100.0% in the age bracket) attending a public institution.
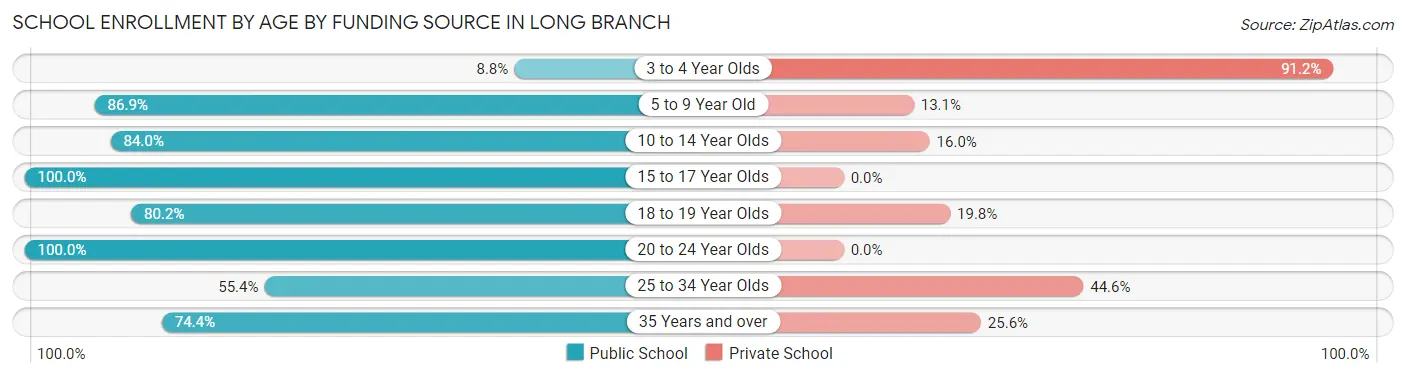
| Age Bracket | Public School | Private School |
| 3 to 4 Year Olds | 6 (8.8%) | 62 (91.2%) |
| 5 to 9 Year Old | 466 (86.9%) | 70 (13.1%) |
| 10 to 14 Year Olds | 629 (84.0%) | 120 (16.0%) |
| 15 to 17 Year Olds | 392 (100.0%) | 0 (0.0%) |
| 18 to 19 Year Olds | 194 (80.2%) | 48 (19.8%) |
| 20 to 24 Year Olds | 92 (100.0%) | 0 (0.0%) |
| 25 to 34 Year Olds | 31 (55.4%) | 25 (44.6%) |
| 35 Years and over | 99 (74.4%) | 34 (25.6%) |
| Total | 1,910 (84.2%) | 358 (15.8%) |
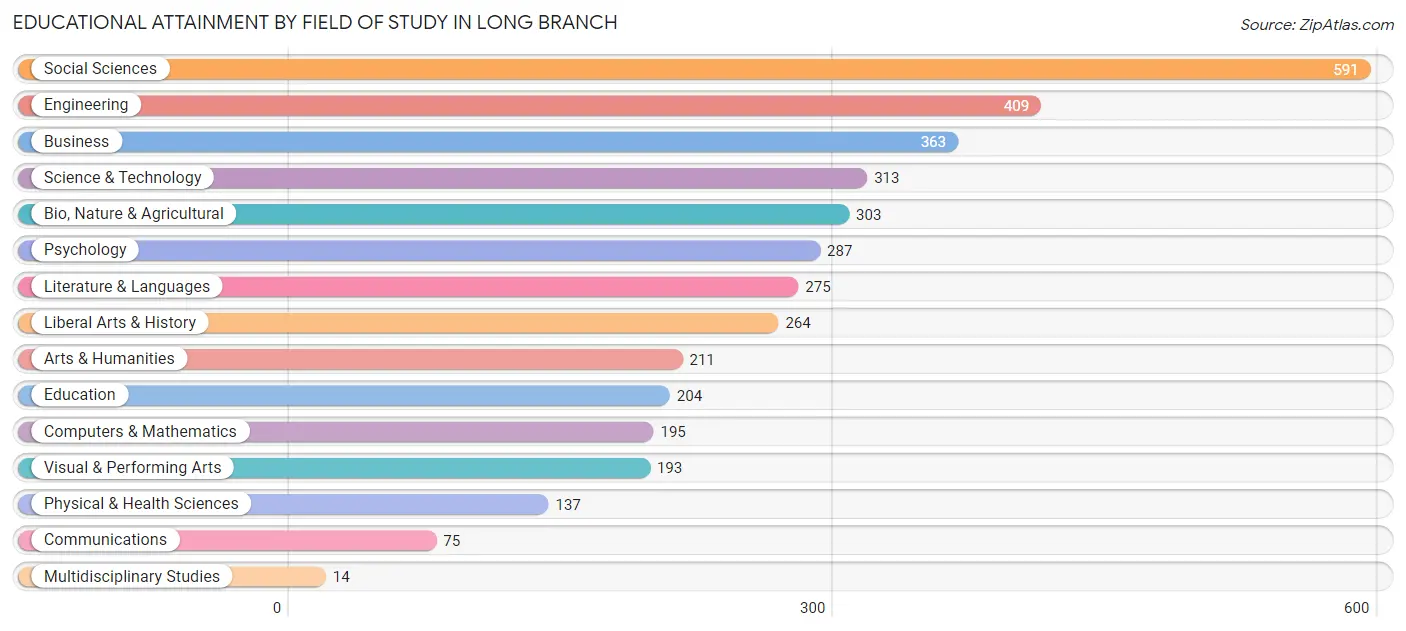
Educational Attainment by Field of Study in Long Branch
Social sciences (591 | 15.4%), engineering (409 | 10.7%), business (363 | 9.5%), science & technology (313 | 8.2%), and bio, nature & agricultural (303 | 7.9%) are the most common fields of study among 3,834 individuals in Long Branch who have obtained a bachelor's degree or higher.
| Field of Study | # Graduates | % Graduates |
| Computers & Mathematics | 195 | 5.1% |
| Bio, Nature & Agricultural | 303 | 7.9% |
| Physical & Health Sciences | 137 | 3.6% |
| Psychology | 287 | 7.5% |
| Social Sciences | 591 | 15.4% |
| Engineering | 409 | 10.7% |
| Multidisciplinary Studies | 14 | 0.4% |
| Science & Technology | 313 | 8.2% |
| Business | 363 | 9.5% |
| Education | 204 | 5.3% |
| Literature & Languages | 275 | 7.2% |
| Liberal Arts & History | 264 | 6.9% |
| Visual & Performing Arts | 193 | 5.0% |
| Communications | 75 | 2.0% |
| Arts & Humanities | 211 | 5.5% |
| Total | 3,834 | 100.0% |
Transportation & Commute in Long Branch
Vehicle Availability by Sex in Long Branch
The most prevalent vehicle ownership categories in Long Branch are males with 2 vehicles (941, accounting for 46.8%) and females with 2 vehicles (887, making up 52.7%).
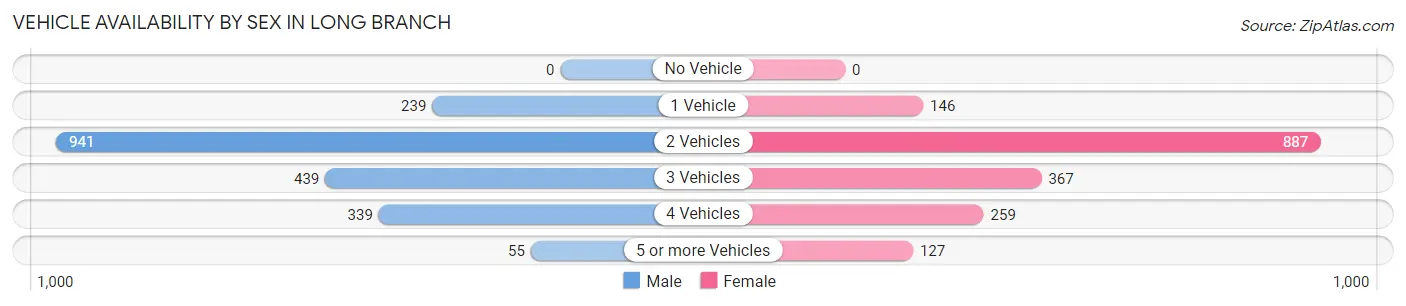
| Vehicles Available | Male | Female |
| No Vehicle | 0 (0.0%) | 0 (0.0%) |
| 1 Vehicle | 239 (11.9%) | 146 (8.2%) |
| 2 Vehicles | 941 (46.8%) | 887 (49.7%) |
| 3 Vehicles | 439 (21.8%) | 367 (20.5%) |
| 4 Vehicles | 339 (16.8%) | 259 (14.5%) |
| 5 or more Vehicles | 55 (2.7%) | 127 (7.1%) |
| Total | 2,013 (100.0%) | 1,786 (100.0%) |
Commute Time in Long Branch
The most frequently occuring commute durations in Long Branch are 15 to 19 minutes (473 commuters, 15.5%), 30 to 34 minutes (466 commuters, 15.3%), and 45 to 59 minutes (408 commuters, 13.4%).
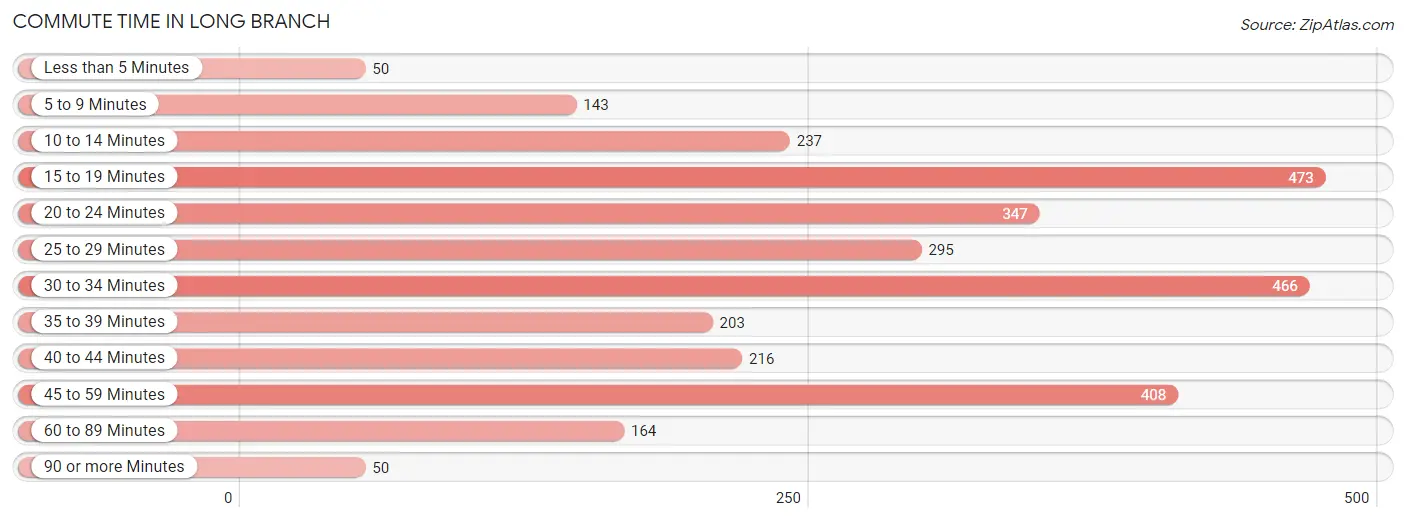
| Commute Time | # Commuters | % Commuters |
| Less than 5 Minutes | 50 | 1.6% |
| 5 to 9 Minutes | 143 | 4.7% |
| 10 to 14 Minutes | 237 | 7.8% |
| 15 to 19 Minutes | 473 | 15.5% |
| 20 to 24 Minutes | 347 | 11.4% |
| 25 to 29 Minutes | 295 | 9.7% |
| 30 to 34 Minutes | 466 | 15.3% |
| 35 to 39 Minutes | 203 | 6.7% |
| 40 to 44 Minutes | 216 | 7.1% |
| 45 to 59 Minutes | 408 | 13.4% |
| 60 to 89 Minutes | 164 | 5.4% |
| 90 or more Minutes | 50 | 1.6% |
Commute Time by Sex in Long Branch
The most common commute times in Long Branch are 30 to 34 minutes (292 commuters, 17.7%) for males and 15 to 19 minutes (229 commuters, 16.3%) for females.
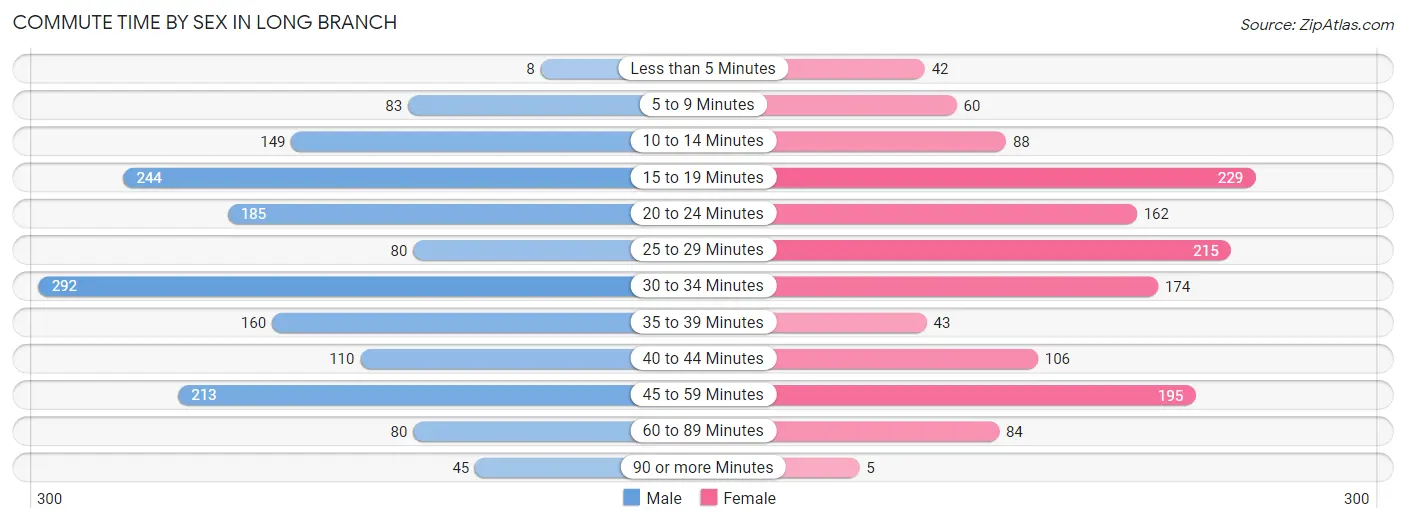
| Commute Time | Male | Female |
| Less than 5 Minutes | 8 (0.5%) | 42 (3.0%) |
| 5 to 9 Minutes | 83 (5.0%) | 60 (4.3%) |
| 10 to 14 Minutes | 149 (9.0%) | 88 (6.3%) |
| 15 to 19 Minutes | 244 (14.8%) | 229 (16.3%) |
| 20 to 24 Minutes | 185 (11.2%) | 162 (11.6%) |
| 25 to 29 Minutes | 80 (4.9%) | 215 (15.3%) |
| 30 to 34 Minutes | 292 (17.7%) | 174 (12.4%) |
| 35 to 39 Minutes | 160 (9.7%) | 43 (3.1%) |
| 40 to 44 Minutes | 110 (6.7%) | 106 (7.6%) |
| 45 to 59 Minutes | 213 (12.9%) | 195 (13.9%) |
| 60 to 89 Minutes | 80 (4.9%) | 84 (6.0%) |
| 90 or more Minutes | 45 (2.7%) | 5 (0.4%) |
Time of Departure to Work by Sex in Long Branch
The most frequent times of departure to work in Long Branch are 7:00 AM to 7:29 AM (301, 18.2%) for males and 9:00 AM to 9:59 AM (239, 17.0%) for females.
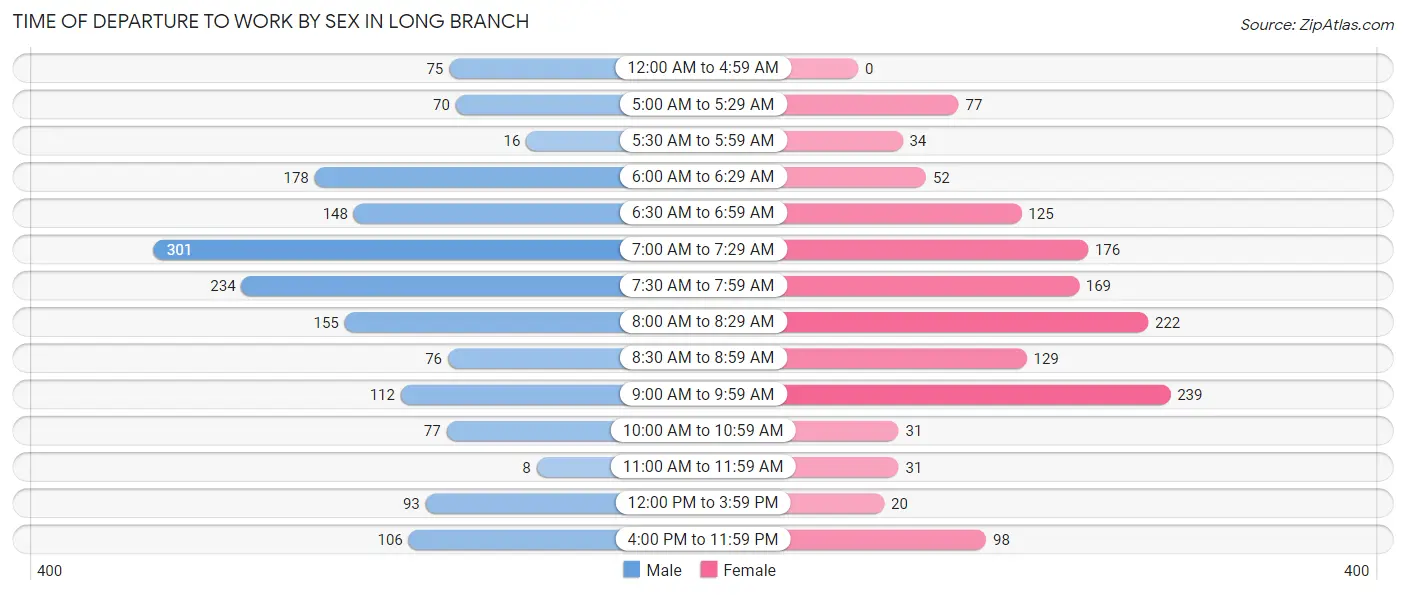
| Time of Departure | Male | Female |
| 12:00 AM to 4:59 AM | 75 (4.5%) | 0 (0.0%) |
| 5:00 AM to 5:29 AM | 70 (4.2%) | 77 (5.5%) |
| 5:30 AM to 5:59 AM | 16 (1.0%) | 34 (2.4%) |
| 6:00 AM to 6:29 AM | 178 (10.8%) | 52 (3.7%) |
| 6:30 AM to 6:59 AM | 148 (9.0%) | 125 (8.9%) |
| 7:00 AM to 7:29 AM | 301 (18.2%) | 176 (12.5%) |
| 7:30 AM to 7:59 AM | 234 (14.2%) | 169 (12.0%) |
| 8:00 AM to 8:29 AM | 155 (9.4%) | 222 (15.8%) |
| 8:30 AM to 8:59 AM | 76 (4.6%) | 129 (9.2%) |
| 9:00 AM to 9:59 AM | 112 (6.8%) | 239 (17.0%) |
| 10:00 AM to 10:59 AM | 77 (4.7%) | 31 (2.2%) |
| 11:00 AM to 11:59 AM | 8 (0.5%) | 31 (2.2%) |
| 12:00 PM to 3:59 PM | 93 (5.6%) | 20 (1.4%) |
| 4:00 PM to 11:59 PM | 106 (6.4%) | 98 (7.0%) |
| Total | 1,649 (100.0%) | 1,403 (100.0%) |
Housing Occupancy in Long Branch
Occupancy by Ownership in Long Branch
Of the total 2,627 dwellings in Long Branch, owner-occupied units account for 2,172 (82.7%), while renter-occupied units make up 455 (17.3%).
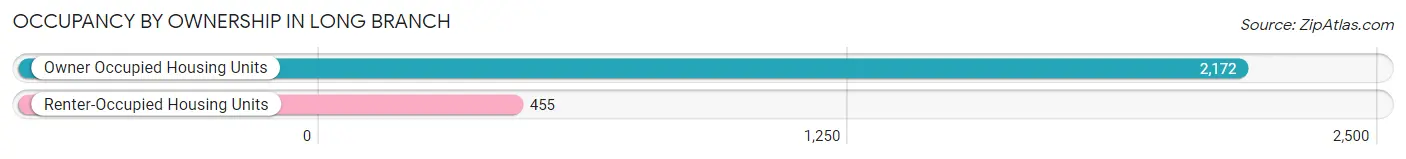
| Occupancy | # Housing Units | % Housing Units |
| Owner Occupied Housing Units | 2,172 | 82.7% |
| Renter-Occupied Housing Units | 455 | 17.3% |
| Total Occupied Housing Units | 2,627 | 100.0% |
Occupancy by Household Size in Long Branch
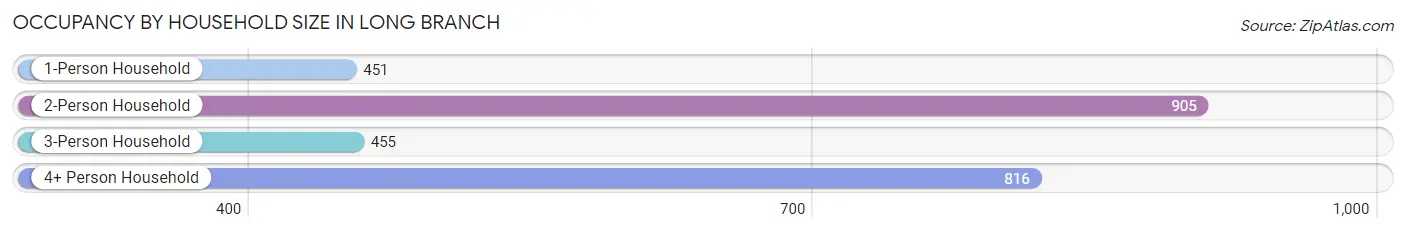
| Household Size | # Housing Units | % Housing Units |
| 1-Person Household | 451 | 17.2% |
| 2-Person Household | 905 | 34.4% |
| 3-Person Household | 455 | 17.3% |
| 4+ Person Household | 816 | 31.1% |
| Total Housing Units | 2,627 | 100.0% |
Occupancy by Ownership by Household Size in Long Branch
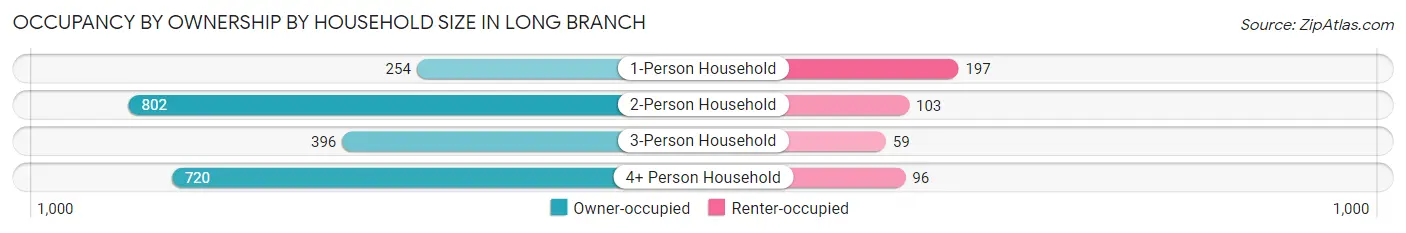
| Household Size | Owner-occupied | Renter-occupied |
| 1-Person Household | 254 (56.3%) | 197 (43.7%) |
| 2-Person Household | 802 (88.6%) | 103 (11.4%) |
| 3-Person Household | 396 (87.0%) | 59 (13.0%) |
| 4+ Person Household | 720 (88.2%) | 96 (11.8%) |
| Total Housing Units | 2,172 (82.7%) | 455 (17.3%) |
Occupancy by Educational Attainment in Long Branch
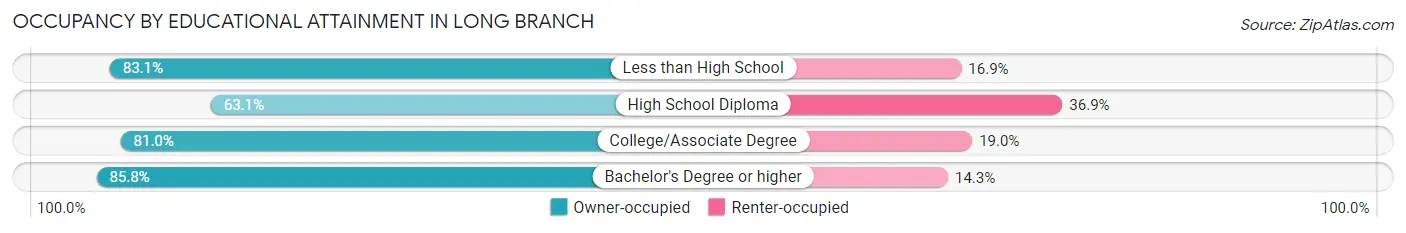
| Household Size | Owner-occupied | Renter-occupied |
| Less than High School | 59 (83.1%) | 12 (16.9%) |
| High School Diploma | 164 (63.1%) | 96 (36.9%) |
| College/Associate Degree | 336 (81.0%) | 79 (19.0%) |
| Bachelor's Degree or higher | 1,613 (85.8%) | 268 (14.2%) |
Occupancy by Age of Householder in Long Branch
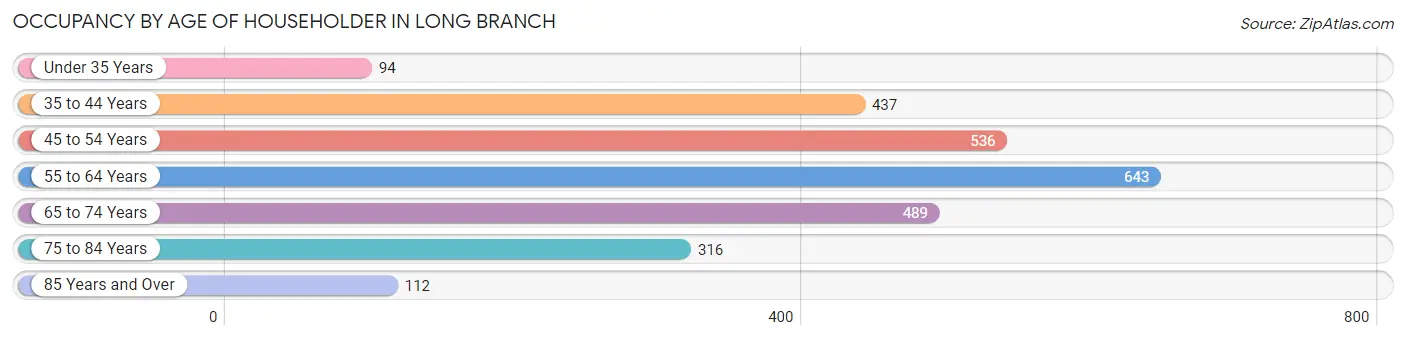
| Age Bracket | # Households | % Households |
| Under 35 Years | 94 | 3.6% |
| 35 to 44 Years | 437 | 16.6% |
| 45 to 54 Years | 536 | 20.4% |
| 55 to 64 Years | 643 | 24.5% |
| 65 to 74 Years | 489 | 18.6% |
| 75 to 84 Years | 316 | 12.0% |
| 85 Years and Over | 112 | 4.3% |
| Total | 2,627 | 100.0% |
Housing Finances in Long Branch
Median Income by Occupancy in Long Branch
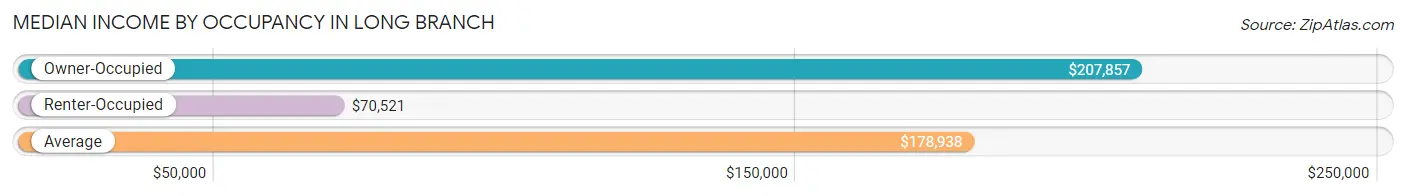
| Occupancy Type | # Households | Median Income |
| Owner-Occupied | 2,172 (82.7%) | $207,857 |
| Renter-Occupied | 455 (17.3%) | $70,521 |
| Average | 2,627 (100.0%) | $178,938 |
Occupancy by Householder Income Bracket in Long Branch
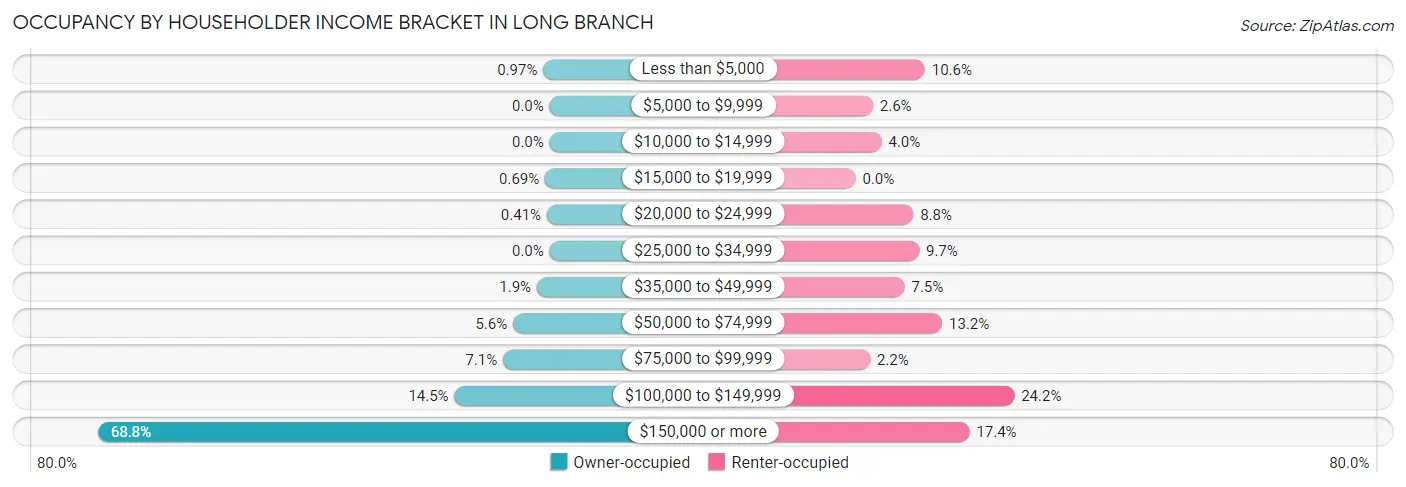
| Income Bracket | Owner-occupied | Renter-occupied |
| Less than $5,000 | 21 (1.0%) | 48 (10.5%) |
| $5,000 to $9,999 | 0 (0.0%) | 12 (2.6%) |
| $10,000 to $14,999 | 0 (0.0%) | 18 (4.0%) |
| $15,000 to $19,999 | 15 (0.7%) | 0 (0.0%) |
| $20,000 to $24,999 | 9 (0.4%) | 40 (8.8%) |
| $25,000 to $34,999 | 0 (0.0%) | 44 (9.7%) |
| $35,000 to $49,999 | 42 (1.9%) | 34 (7.5%) |
| $50,000 to $74,999 | 121 (5.6%) | 60 (13.2%) |
| $75,000 to $99,999 | 154 (7.1%) | 10 (2.2%) |
| $100,000 to $149,999 | 315 (14.5%) | 110 (24.2%) |
| $150,000 or more | 1,495 (68.8%) | 79 (17.4%) |
| Total | 2,172 (100.0%) | 455 (100.0%) |
Monthly Housing Cost Tiers in Long Branch
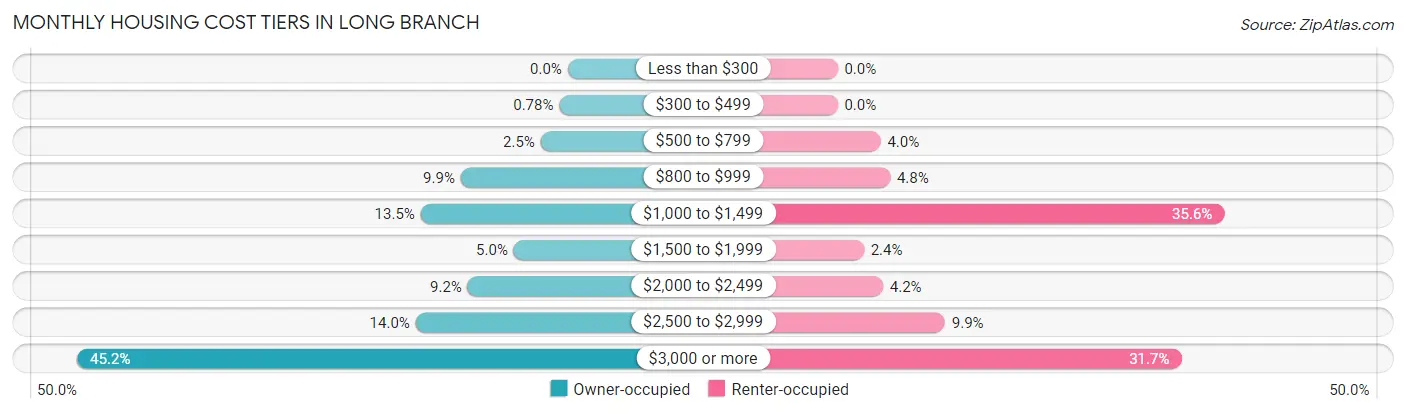
| Monthly Cost | Owner-occupied | Renter-occupied |
| Less than $300 | 0 (0.0%) | 0 (0.0%) |
| $300 to $499 | 17 (0.8%) | 0 (0.0%) |
| $500 to $799 | 54 (2.5%) | 18 (4.0%) |
| $800 to $999 | 214 (9.9%) | 22 (4.8%) |
| $1,000 to $1,499 | 294 (13.5%) | 162 (35.6%) |
| $1,500 to $1,999 | 108 (5.0%) | 11 (2.4%) |
| $2,000 to $2,499 | 200 (9.2%) | 19 (4.2%) |
| $2,500 to $2,999 | 304 (14.0%) | 45 (9.9%) |
| $3,000 or more | 981 (45.2%) | 144 (31.7%) |
| Total | 2,172 (100.0%) | 455 (100.0%) |
Physical Housing Characteristics in Long Branch
Housing Structures in Long Branch
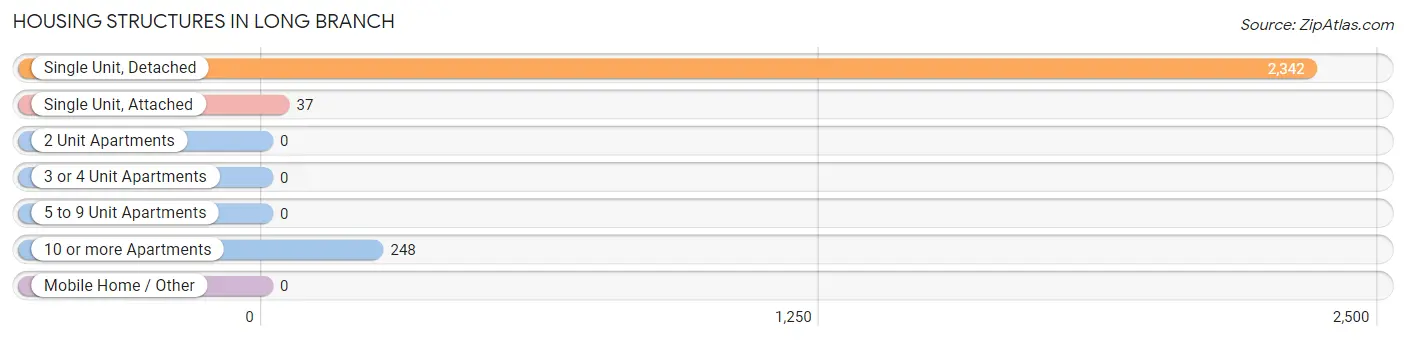
| Structure Type | # Housing Units | % Housing Units |
| Single Unit, Detached | 2,342 | 89.1% |
| Single Unit, Attached | 37 | 1.4% |
| 2 Unit Apartments | 0 | 0.0% |
| 3 or 4 Unit Apartments | 0 | 0.0% |
| 5 to 9 Unit Apartments | 0 | 0.0% |
| 10 or more Apartments | 248 | 9.4% |
| Mobile Home / Other | 0 | 0.0% |
| Total | 2,627 | 100.0% |
Housing Structures by Occupancy in Long Branch
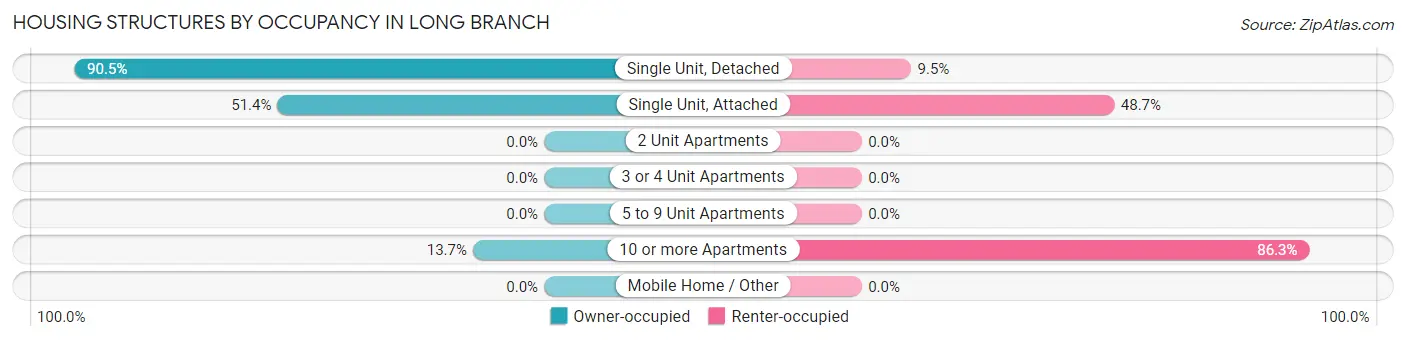
| Structure Type | Owner-occupied | Renter-occupied |
| Single Unit, Detached | 2,119 (90.5%) | 223 (9.5%) |
| Single Unit, Attached | 19 (51.3%) | 18 (48.6%) |
| 2 Unit Apartments | 0 (0.0%) | 0 (0.0%) |
| 3 or 4 Unit Apartments | 0 (0.0%) | 0 (0.0%) |
| 5 to 9 Unit Apartments | 0 (0.0%) | 0 (0.0%) |
| 10 or more Apartments | 34 (13.7%) | 214 (86.3%) |
| Mobile Home / Other | 0 (0.0%) | 0 (0.0%) |
| Total | 2,172 (82.7%) | 455 (17.3%) |
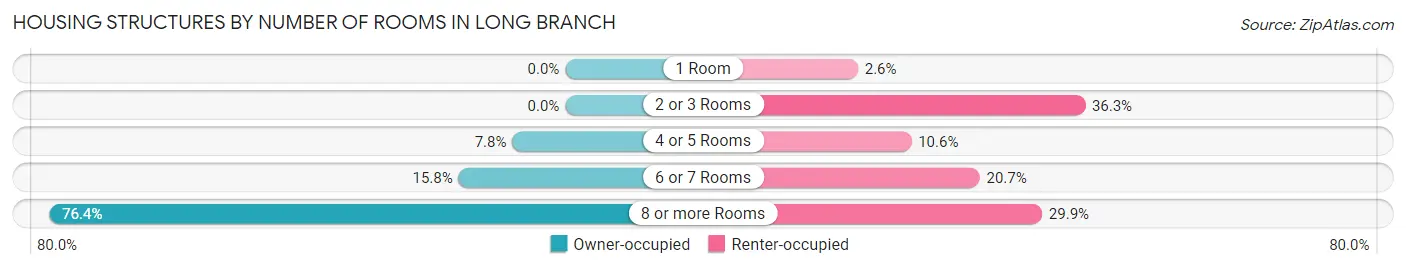
Housing Structures by Number of Rooms in Long Branch
| Number of Rooms | Owner-occupied | Renter-occupied |
| 1 Room | 0 (0.0%) | 12 (2.6%) |
| 2 or 3 Rooms | 0 (0.0%) | 165 (36.3%) |
| 4 or 5 Rooms | 170 (7.8%) | 48 (10.5%) |
| 6 or 7 Rooms | 343 (15.8%) | 94 (20.7%) |
| 8 or more Rooms | 1,659 (76.4%) | 136 (29.9%) |
| Total | 2,172 (100.0%) | 455 (100.0%) |
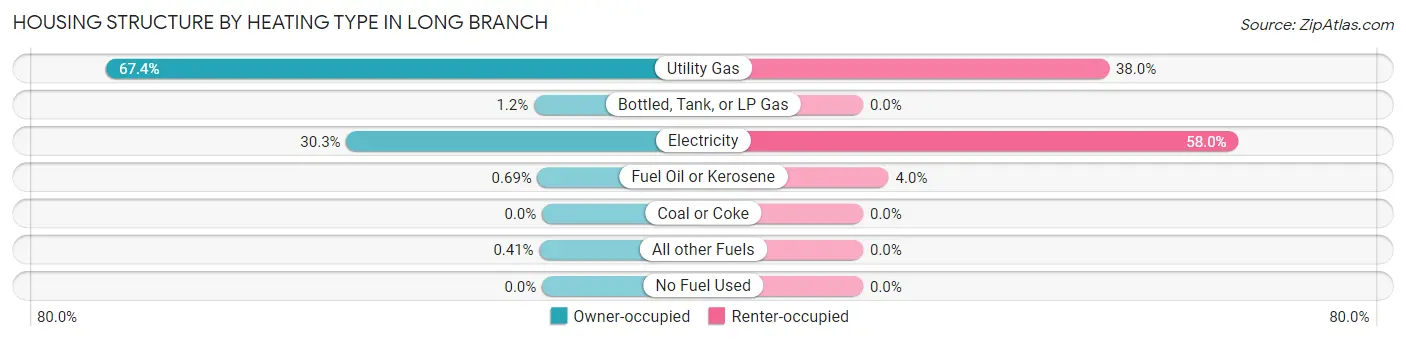
Housing Structure by Heating Type in Long Branch
| Heating Type | Owner-occupied | Renter-occupied |
| Utility Gas | 1,464 (67.4%) | 173 (38.0%) |
| Bottled, Tank, or LP Gas | 27 (1.2%) | 0 (0.0%) |
| Electricity | 657 (30.2%) | 264 (58.0%) |
| Fuel Oil or Kerosene | 15 (0.7%) | 18 (4.0%) |
| Coal or Coke | 0 (0.0%) | 0 (0.0%) |
| All other Fuels | 9 (0.4%) | 0 (0.0%) |
| No Fuel Used | 0 (0.0%) | 0 (0.0%) |
| Total | 2,172 (100.0%) | 455 (100.0%) |
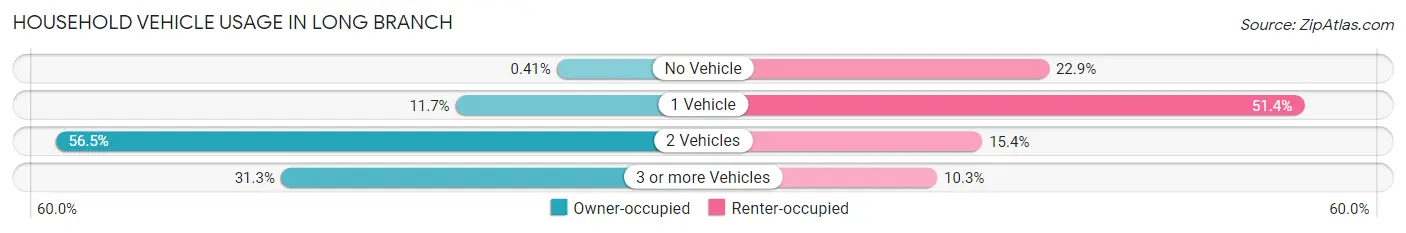
Household Vehicle Usage in Long Branch
| Vehicles per Household | Owner-occupied | Renter-occupied |
| No Vehicle | 9 (0.4%) | 104 (22.9%) |
| 1 Vehicle | 255 (11.7%) | 234 (51.4%) |
| 2 Vehicles | 1,228 (56.5%) | 70 (15.4%) |
| 3 or more Vehicles | 680 (31.3%) | 47 (10.3%) |
| Total | 2,172 (100.0%) | 455 (100.0%) |
Real Estate & Mortgages in Long Branch
Real Estate and Mortgage Overview in Long Branch
| Characteristic | Without Mortgage | With Mortgage |
| Housing Units | 522 | 1,650 |
| Median Property Value | $734,300 | $679,300 |
| Median Household Income | $177,283 | $1,150 |
| Monthly Housing Costs | $997 | $981 |
| Real Estate Taxes | $7,857 | $44 |
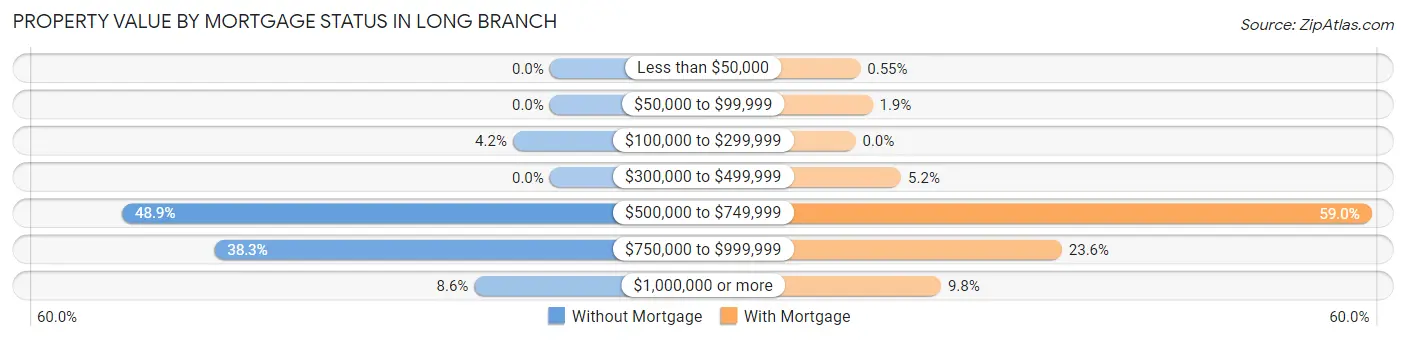
Property Value by Mortgage Status in Long Branch
| Property Value | Without Mortgage | With Mortgage |
| Less than $50,000 | 0 (0.0%) | 9 (0.5%) |
| $50,000 to $99,999 | 0 (0.0%) | 32 (1.9%) |
| $100,000 to $299,999 | 22 (4.2%) | 0 (0.0%) |
| $300,000 to $499,999 | 0 (0.0%) | 86 (5.2%) |
| $500,000 to $749,999 | 255 (48.8%) | 973 (59.0%) |
| $750,000 to $999,999 | 200 (38.3%) | 389 (23.6%) |
| $1,000,000 or more | 45 (8.6%) | 161 (9.8%) |
| Total | 522 (100.0%) | 1,650 (100.0%) |
Household Income by Mortgage Status in Long Branch
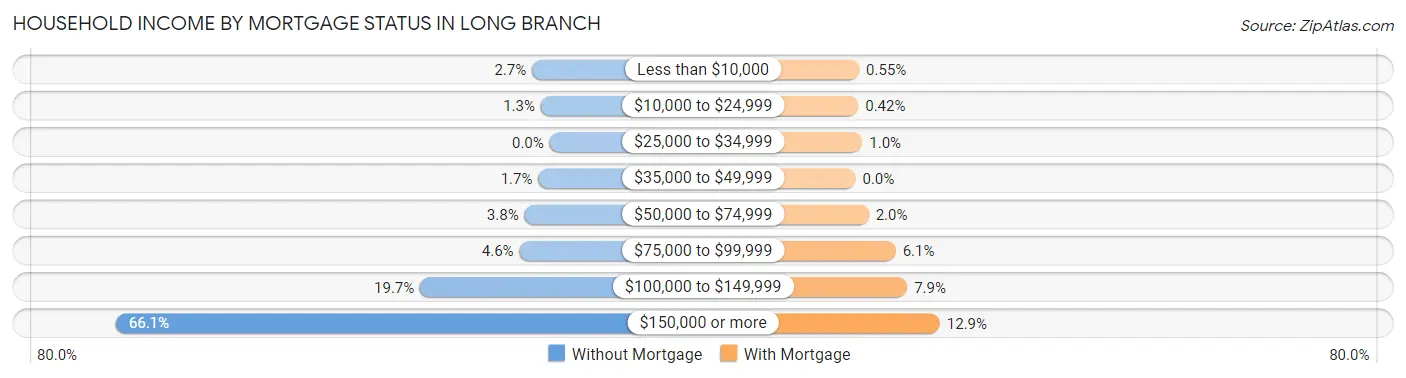
| Household Income | Without Mortgage | With Mortgage |
| Less than $10,000 | 14 (2.7%) | 9 (0.5%) |
| $10,000 to $24,999 | 7 (1.3%) | 7 (0.4%) |
| $25,000 to $34,999 | 0 (0.0%) | 17 (1.0%) |
| $35,000 to $49,999 | 9 (1.7%) | 0 (0.0%) |
| $50,000 to $74,999 | 20 (3.8%) | 33 (2.0%) |
| $75,000 to $99,999 | 24 (4.6%) | 101 (6.1%) |
| $100,000 to $149,999 | 103 (19.7%) | 130 (7.9%) |
| $150,000 or more | 345 (66.1%) | 212 (12.9%) |
| Total | 522 (100.0%) | 1,650 (100.0%) |
Property Value to Household Income Ratio in Long Branch
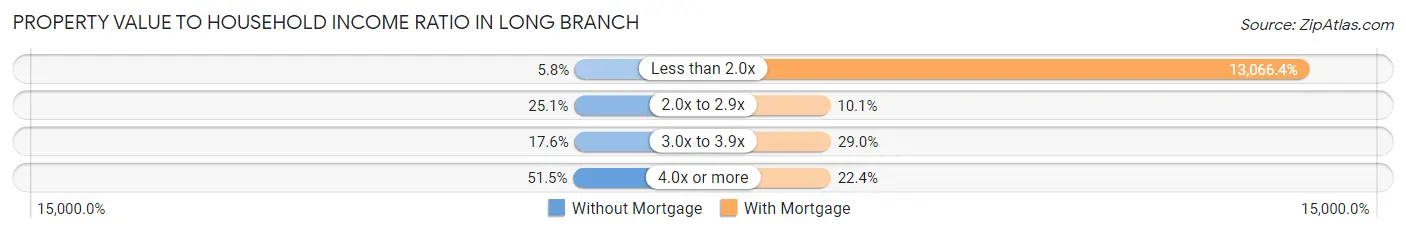
| Value-to-Income Ratio | Without Mortgage | With Mortgage |
| Less than 2.0x | 30 (5.8%) | 215,595 (13,066.4%) |
| 2.0x to 2.9x | 131 (25.1%) | 167 (10.1%) |
| 3.0x to 3.9x | 92 (17.6%) | 478 (29.0%) |
| 4.0x or more | 269 (51.5%) | 369 (22.4%) |
| Total | 522 (100.0%) | 1,650 (100.0%) |
Real Estate Taxes by Mortgage Status in Long Branch
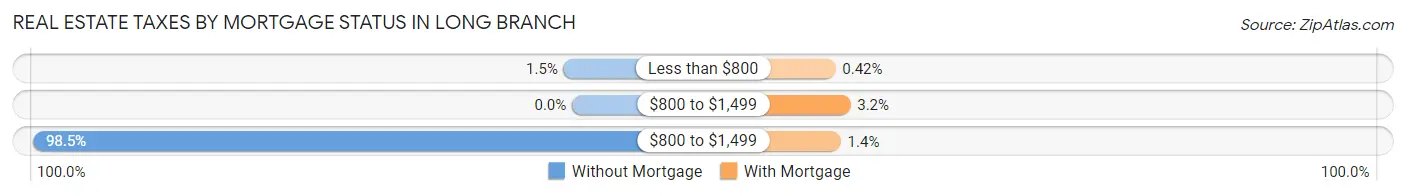
| Property Taxes | Without Mortgage | With Mortgage |
| Less than $800 | 8 (1.5%) | 7 (0.4%) |
| $800 to $1,499 | 0 (0.0%) | 52 (3.2%) |
| $800 to $1,499 | 514 (98.5%) | 23 (1.4%) |
| Total | 522 (100.0%) | 1,650 (100.0%) |
Health & Disability in Long Branch
Health Insurance Coverage by Age in Long Branch
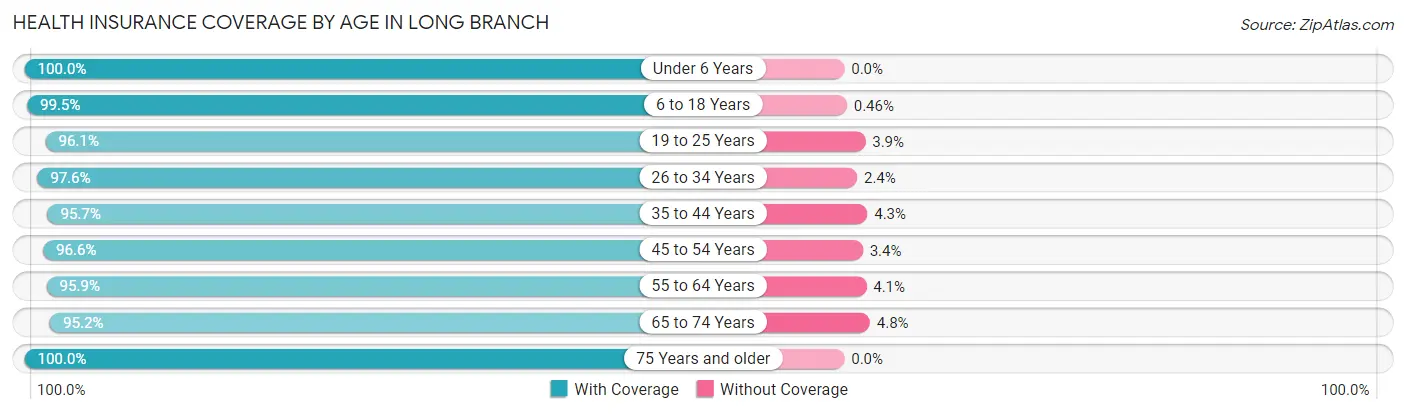
| Age Bracket | With Coverage | Without Coverage |
| Under 6 Years | 256 (100.0%) | 0 (0.0%) |
| 6 to 18 Years | 1,713 (99.5%) | 8 (0.5%) |
| 19 to 25 Years | 442 (96.1%) | 18 (3.9%) |
| 26 to 34 Years | 452 (97.6%) | 11 (2.4%) |
| 35 to 44 Years | 893 (95.7%) | 40 (4.3%) |
| 45 to 54 Years | 1,012 (96.6%) | 36 (3.4%) |
| 55 to 64 Years | 1,006 (95.9%) | 43 (4.1%) |
| 65 to 74 Years | 878 (95.2%) | 44 (4.8%) |
| 75 Years and older | 702 (100.0%) | 0 (0.0%) |
| Total | 7,354 (97.4%) | 200 (2.6%) |
Health Insurance Coverage by Citizenship Status in Long Branch
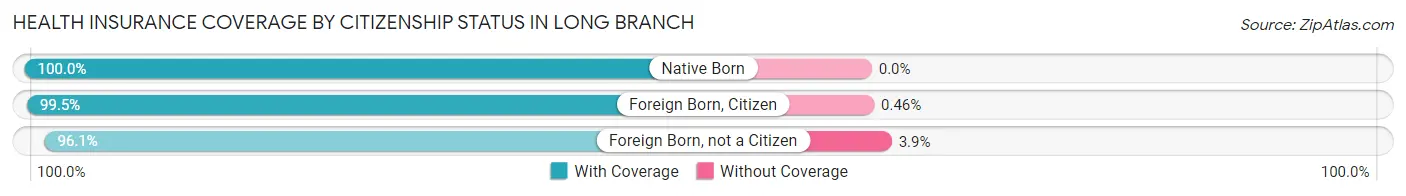
| Citizenship Status | With Coverage | Without Coverage |
| Native Born | 256 (100.0%) | 0 (0.0%) |
| Foreign Born, Citizen | 1,713 (99.5%) | 8 (0.5%) |
| Foreign Born, not a Citizen | 442 (96.1%) | 18 (3.9%) |
Health Insurance Coverage by Household Income in Long Branch
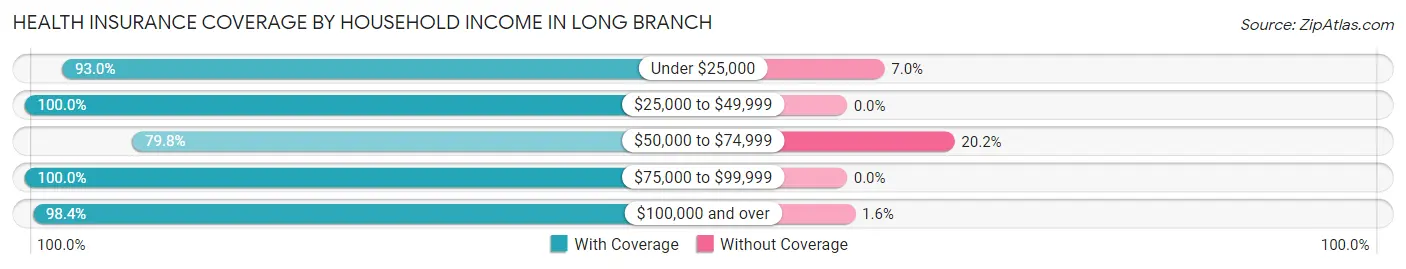
| Household Income | With Coverage | Without Coverage |
| Under $25,000 | 238 (93.0%) | 18 (7.0%) |
| $25,000 to $49,999 | 192 (100.0%) | 0 (0.0%) |
| $50,000 to $74,999 | 301 (79.8%) | 76 (20.2%) |
| $75,000 to $99,999 | 312 (100.0%) | 0 (0.0%) |
| $100,000 and over | 6,301 (98.4%) | 100 (1.6%) |
Public vs Private Health Insurance Coverage by Age in Long Branch
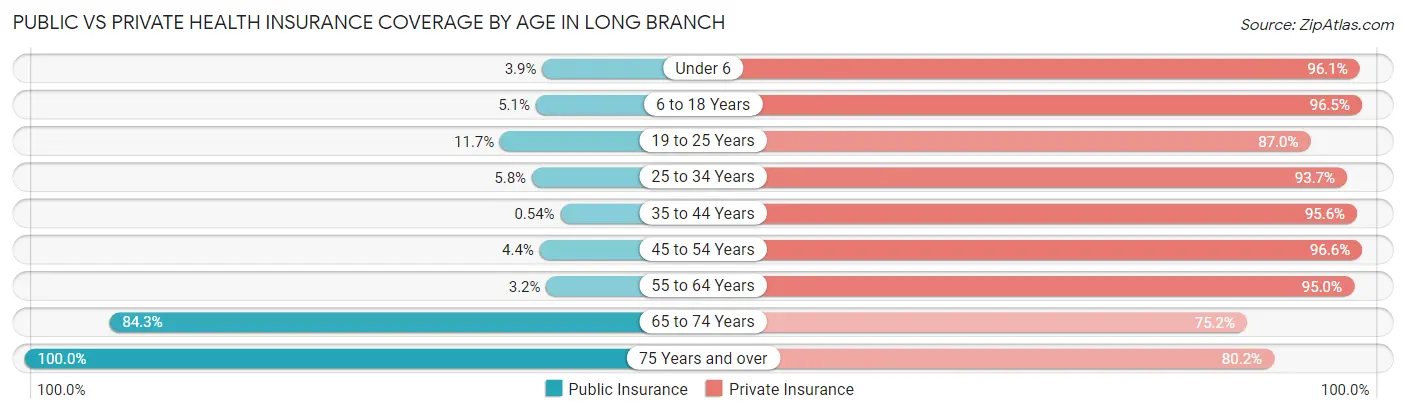
| Age Bracket | Public Insurance | Private Insurance |
| Under 6 | 10 (3.9%) | 246 (96.1%) |
| 6 to 18 Years | 88 (5.1%) | 1,661 (96.5%) |
| 19 to 25 Years | 54 (11.7%) | 400 (87.0%) |
| 25 to 34 Years | 27 (5.8%) | 434 (93.7%) |
| 35 to 44 Years | 5 (0.5%) | 892 (95.6%) |
| 45 to 54 Years | 46 (4.4%) | 1,012 (96.6%) |
| 55 to 64 Years | 33 (3.2%) | 997 (95.0%) |
| 65 to 74 Years | 777 (84.3%) | 693 (75.2%) |
| 75 Years and over | 702 (100.0%) | 563 (80.2%) |
| Total | 1,742 (23.1%) | 6,898 (91.3%) |
Disability Status by Sex by Age in Long Branch
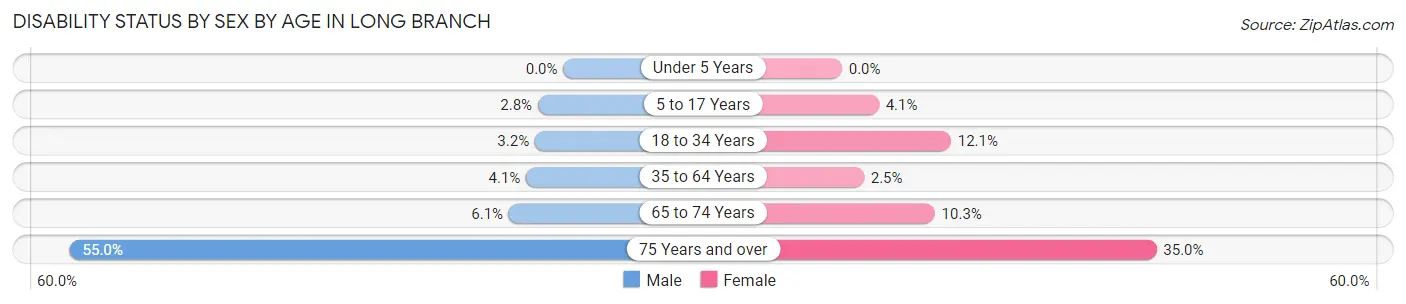
| Age Bracket | Male | Female |
| Under 5 Years | 0 (0.0%) | 0 (0.0%) |
| 5 to 17 Years | 25 (2.8%) | 33 (4.1%) |
| 18 to 34 Years | 18 (3.2%) | 63 (12.1%) |
| 35 to 64 Years | 58 (4.1%) | 40 (2.5%) |
| 65 to 74 Years | 26 (6.1%) | 51 (10.3%) |
| 75 Years and over | 149 (55.0%) | 151 (35.0%) |
Disability Class by Sex by Age in Long Branch
Disability Class: Hearing Difficulty
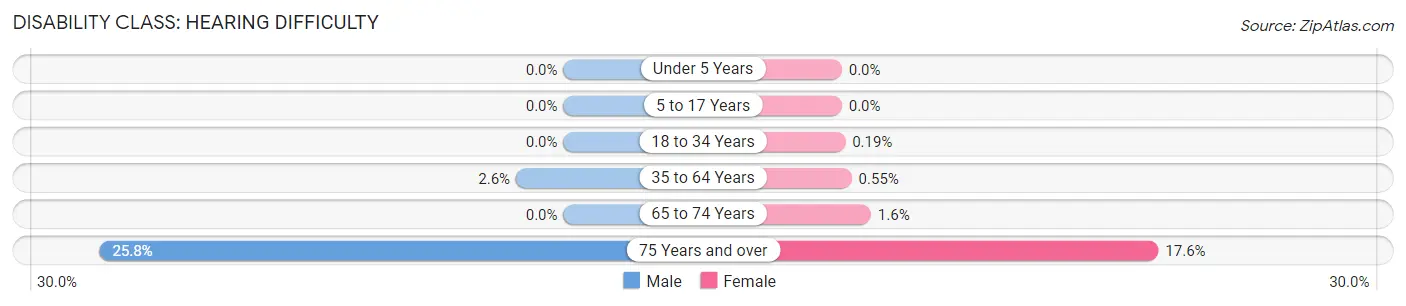
| Age Bracket | Male | Female |
| Under 5 Years | 0 (0.0%) | 0 (0.0%) |
| 5 to 17 Years | 0 (0.0%) | 0 (0.0%) |
| 18 to 34 Years | 0 (0.0%) | 1 (0.2%) |
| 35 to 64 Years | 37 (2.6%) | 9 (0.5%) |
| 65 to 74 Years | 0 (0.0%) | 8 (1.6%) |
| 75 Years and over | 70 (25.8%) | 76 (17.6%) |
Disability Class: Vision Difficulty
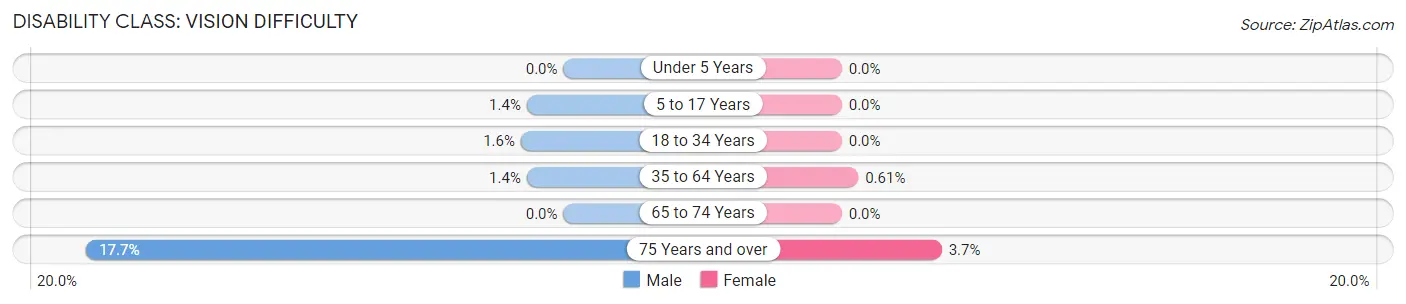
| Age Bracket | Male | Female |
| Under 5 Years | 0 (0.0%) | 0 (0.0%) |
| 5 to 17 Years | 12 (1.4%) | 0 (0.0%) |
| 18 to 34 Years | 9 (1.6%) | 0 (0.0%) |
| 35 to 64 Years | 19 (1.4%) | 10 (0.6%) |
| 65 to 74 Years | 0 (0.0%) | 0 (0.0%) |
| 75 Years and over | 48 (17.7%) | 16 (3.7%) |
Disability Class: Cognitive Difficulty
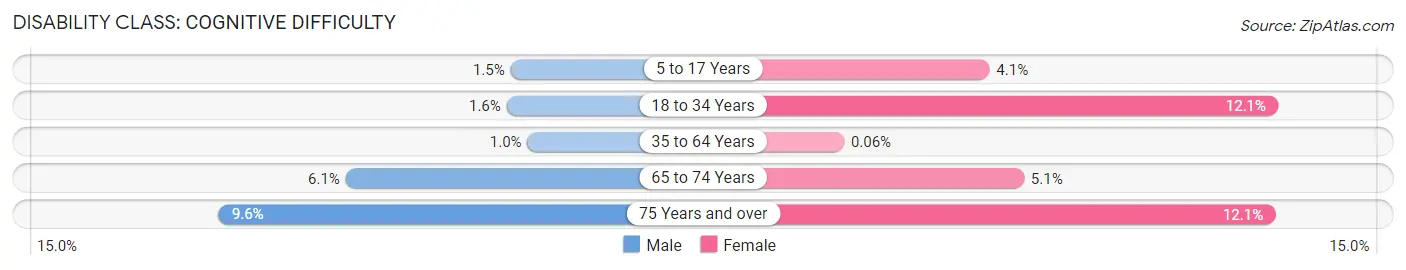
| Age Bracket | Male | Female |
| 5 to 17 Years | 13 (1.5%) | 33 (4.1%) |
| 18 to 34 Years | 9 (1.6%) | 63 (12.1%) |
| 35 to 64 Years | 14 (1.0%) | 1 (0.1%) |
| 65 to 74 Years | 26 (6.1%) | 25 (5.1%) |
| 75 Years and over | 26 (9.6%) | 52 (12.1%) |
Disability Class: Ambulatory Difficulty
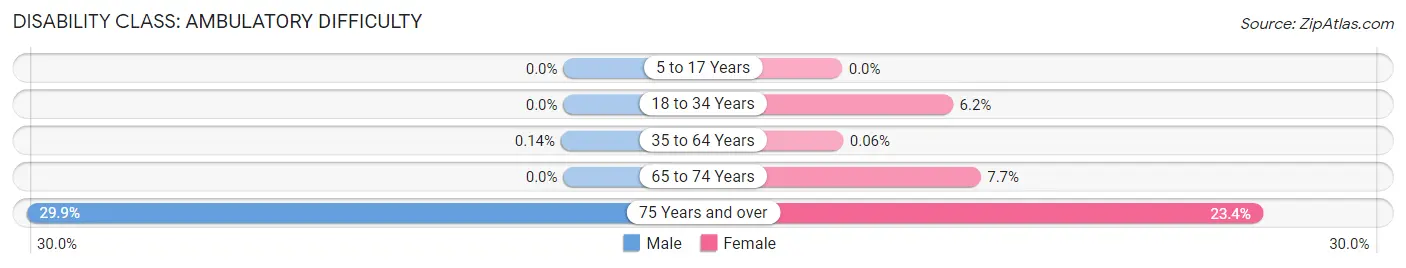
| Age Bracket | Male | Female |
| 5 to 17 Years | 0 (0.0%) | 0 (0.0%) |
| 18 to 34 Years | 0 (0.0%) | 32 (6.2%) |
| 35 to 64 Years | 2 (0.1%) | 1 (0.1%) |
| 65 to 74 Years | 0 (0.0%) | 38 (7.7%) |
| 75 Years and over | 81 (29.9%) | 101 (23.4%) |
Disability Class: Self-Care Difficulty
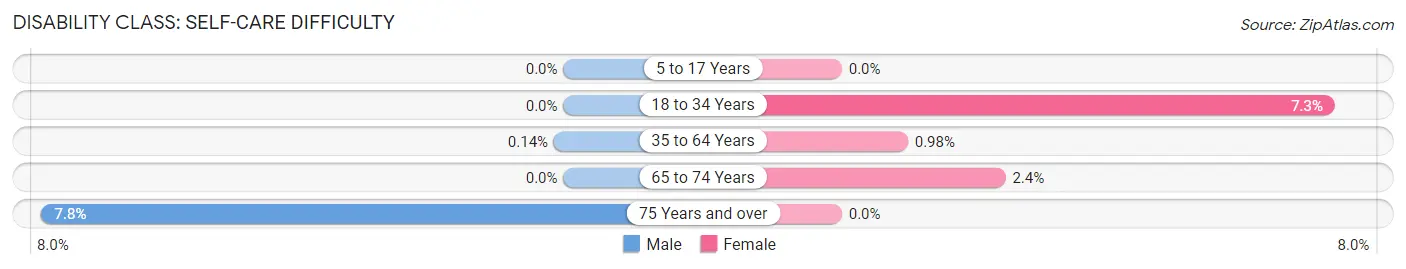
| Age Bracket | Male | Female |
| 5 to 17 Years | 0 (0.0%) | 0 (0.0%) |
| 18 to 34 Years | 0 (0.0%) | 38 (7.3%) |
| 35 to 64 Years | 2 (0.1%) | 16 (1.0%) |
| 65 to 74 Years | 0 (0.0%) | 12 (2.4%) |
| 75 Years and over | 21 (7.7%) | 0 (0.0%) |
Technology Access in Long Branch
Computing Device Access in Long Branch
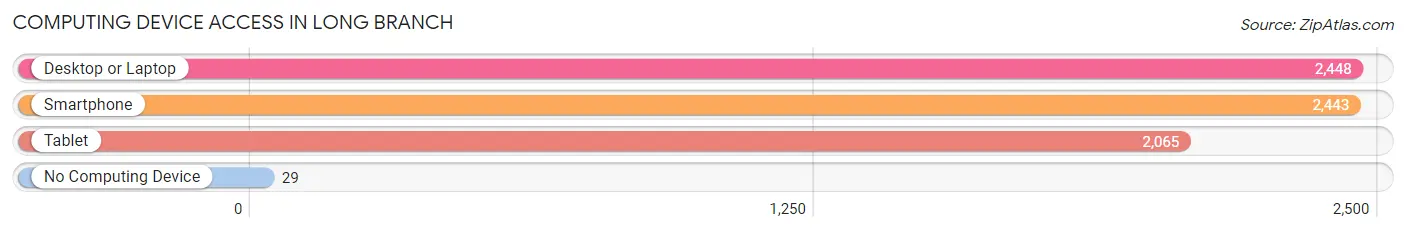
| Device Type | # Households | % Households |
| Desktop or Laptop | 2,448 | 93.2% |
| Smartphone | 2,443 | 93.0% |
| Tablet | 2,065 | 78.6% |
| No Computing Device | 29 | 1.1% |
| Total | 2,627 | 100.0% |
Internet Access in Long Branch
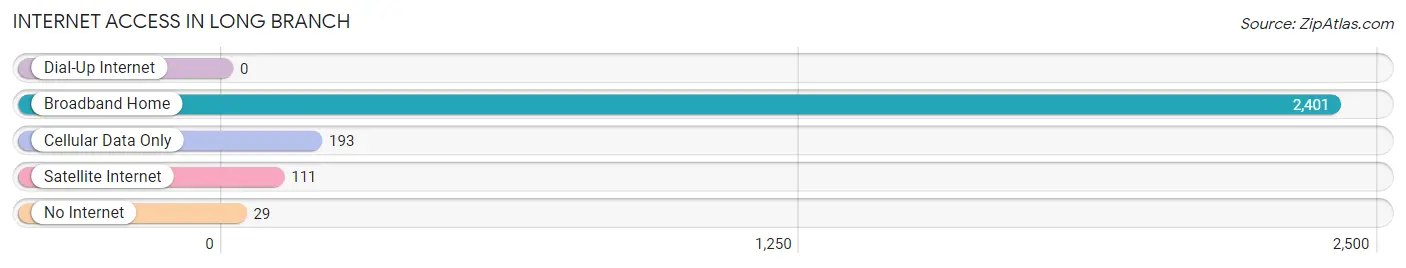
| Internet Type | # Households | % Households |
| Dial-Up Internet | 0 | 0.0% |
| Broadband Home | 2,401 | 91.4% |
| Cellular Data Only | 193 | 7.3% |
| Satellite Internet | 111 | 4.2% |
| No Internet | 29 | 1.1% |
| Total | 2,627 | 100.0% |
Long Branch Summary
Long Branch is a small unincorporated community located in the northern part of Prince William County, Virginia. It is situated along the banks of the Occoquan River, approximately 25 miles southwest of Washington, D.C. The community is home to a diverse population of approximately 1,000 people, and is known for its rural charm and close-knit community.
History
Long Branch was first settled in the late 1700s by a group of Quakers from Pennsylvania. The community was originally known as “Long Branch Meeting House” and was home to a Quaker meeting house, which was built in 1790. The meeting house was used for religious services and community gatherings until it was destroyed by fire in 1864.
In the early 1800s, Long Branch was a thriving agricultural community. The area was known for its tobacco, corn, and wheat crops, as well as its apple orchards. The community also had a number of mills, including a grist mill, a saw mill, and a woolen mill.
In the late 1800s, Long Branch began to experience a period of growth and development. The community was home to a number of businesses, including a general store, a blacksmith shop, and a post office. The community also had a school, which was built in 1891.
Geography
Long Branch is located in the northern part of Prince William County, Virginia. The community is situated along the banks of the Occoquan River, approximately 25 miles southwest of Washington, D.C. The area is characterized by rolling hills and wooded areas, and is home to a variety of wildlife, including deer, foxes, and wild turkeys.
Economy
Long Branch is a primarily residential community, and the majority of its residents are employed in the nearby cities of Manassas and Woodbridge. The community is home to a number of small businesses, including a general store, a gas station, and a post office.
Demographics
As of the 2010 census, Long Branch had a population of 1,000 people. The racial makeup of the community was 79.2% White, 14.2% African American, 0.7% Native American, 0.7% Asian, and 4.9% from other races. The median household income was $60,000, and the median age was 40.
Long Branch is a close-knit community with a strong sense of community pride. The community is home to a variety of churches, including a Quaker meeting house, a Baptist church, and a Methodist church. The community also has a number of civic organizations, including a volunteer fire department and a community center.
Common Questions
What is Per Capita Income in Long Branch?
Per Capita income in Long Branch is $68,829.
What is the Median Family Income in Long Branch?
Median Family Income in Long Branch is $206,364.
What is the Median Household income in Long Branch?
Median Household Income in Long Branch is $178,938.
What is Income or Wage Gap in Long Branch?
Income or Wage Gap in Long Branch is 53.9%.
Women in Long Branch earn 46.1 cents for every dollar earned by a man.
What is Inequality or Gini Index in Long Branch?
Inequality or Gini Index in Long Branch is 0.37.
What is the Total Population of Long Branch?
Total Population of Long Branch is 7,635.
What is the Total Male Population of Long Branch?
Total Male Population of Long Branch is 3,705.
What is the Total Female Population of Long Branch?
Total Female Population of Long Branch is 3,930.
What is the Ratio of Males per 100 Females in Long Branch?
There are 94.27 Males per 100 Females in Long Branch.
What is the Ratio of Females per 100 Males in Long Branch?
There are 106.07 Females per 100 Males in Long Branch.
What is the Median Population Age in Long Branch?
Median Population Age in Long Branch is 44.3 Years.
What is the Average Family Size in Long Branch
Average Family Size in Long Branch is 3.2 People.
What is the Average Household Size in Long Branch
Average Household Size in Long Branch is 2.9 People.
How Large is the Labor Force in Long Branch?
There are 3,958 People in the Labor Forcein in Long Branch.
What is the Percentage of People in the Labor Force in Long Branch?
64.7% of People are in the Labor Force in Long Branch.
What is the Unemployment Rate in Long Branch?
Unemployment Rate in Long Branch is 3.1%.