Quantico Base, VA Map & Demographics
Quantico Base Map
Quantico Base Overview
$27,085
PER CAPITA INCOME
$68,607
AVG FAMILY INCOME
$66,361
AVG HOUSEHOLD INCOME
4.5%
WAGE / INCOME GAP [ % ]
95.5¢/ $1
WAGE / INCOME GAP [ $ ]
0.38
INEQUALITY / GINI INDEX
5,372
TOTAL POPULATION
3,348
MALE POPULATION
2,024
FEMALE POPULATION
165.42
MALES / 100 FEMALES
60.45
FEMALES / 100 MALES
22.2
MEDIAN AGE
3.4
AVG FAMILY SIZE
3.2
AVG HOUSEHOLD SIZE
3,381
LABOR FORCE [ PEOPLE ]
85.5%
PERCENT IN LABOR FORCE
8.4%
UNEMPLOYMENT RATE
Income in Quantico Base
Income Overview in Quantico Base
Per Capita Income in Quantico Base is $27,085, while median incomes of families and households are $68,607 and $66,361 respectively.
| Characteristic | Number | Measure |
| Per Capita Income | 5,372 | $27,085 |
| Median Family Income | 967 | $68,607 |
| Mean Family Income | 967 | $85,896 |
| Median Household Income | 1,097 | $66,361 |
| Mean Household Income | 1,097 | $80,683 |
| Income Deficit | 967 | $0 |
| Wage / Income Gap (%) | 5,372 | 4.51% |
| Wage / Income Gap ($) | 5,372 | 95.49¢ per $1 |
| Gini / Inequality Index | 5,372 | 0.38 |
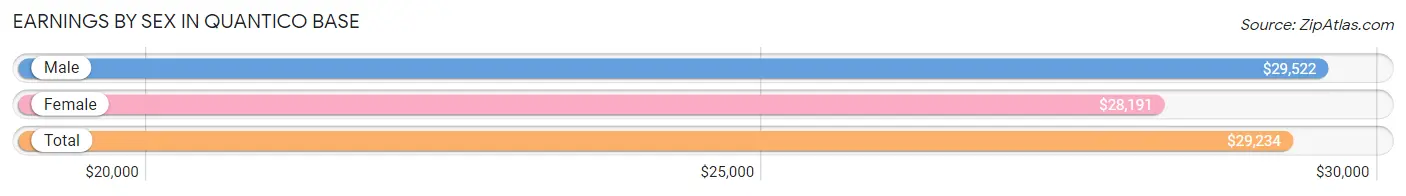
Earnings by Sex in Quantico Base
Average Earnings in Quantico Base are $29,234, $29,522 for men and $28,191 for women, a difference of 4.5%.
| Sex | Number | Average Earnings |
| Male | 2,527 (74.1%) | $29,522 |
| Female | 882 (25.9%) | $28,191 |
| Total | 3,409 (100.0%) | $29,234 |
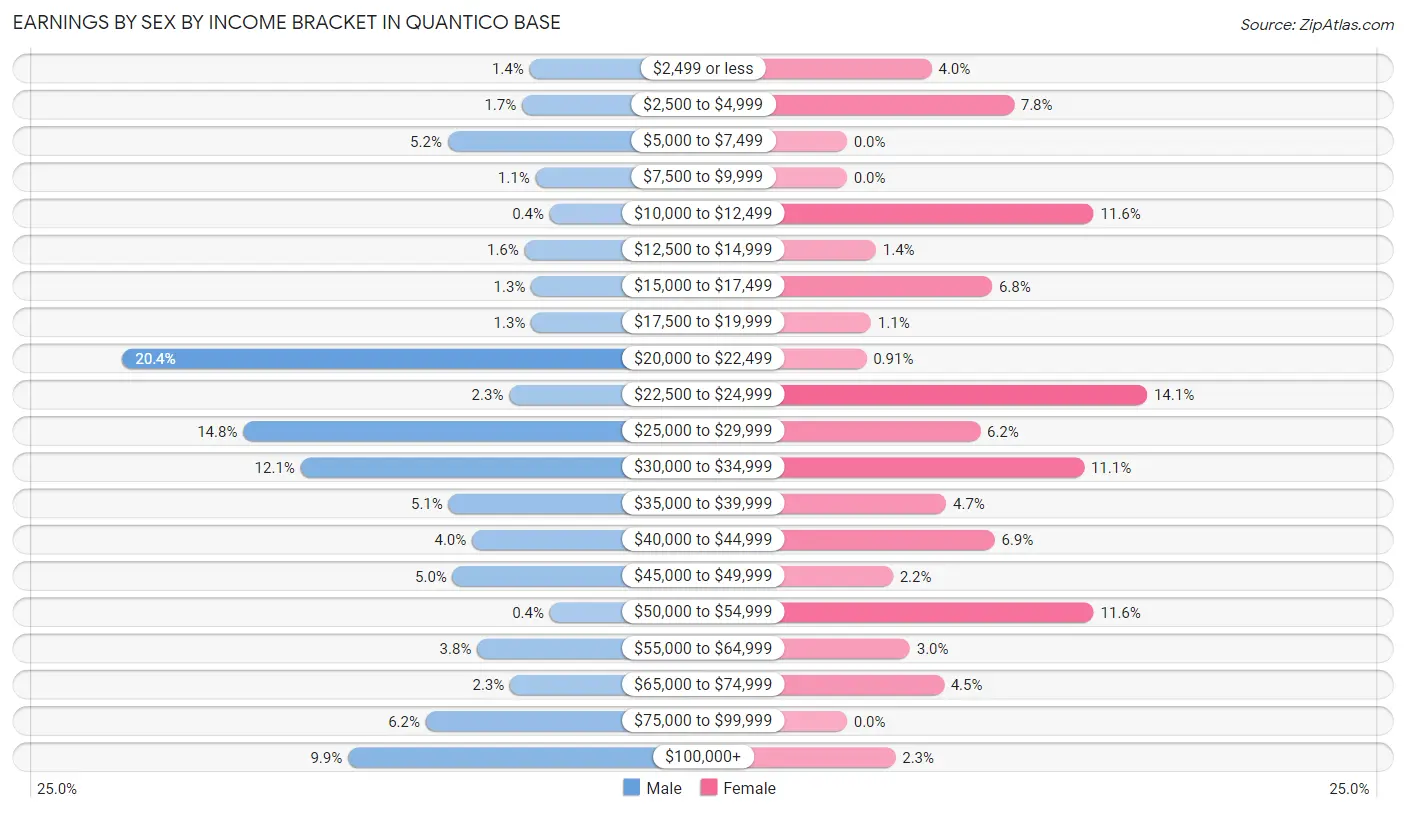
Earnings by Sex by Income Bracket in Quantico Base
The most common earnings brackets in Quantico Base are $20,000 to $22,499 for men (516 | 20.4%) and $22,500 to $24,999 for women (124 | 14.1%).
| Income | Male | Female |
| $2,499 or less | 34 (1.3%) | 35 (4.0%) |
| $2,500 to $4,999 | 43 (1.7%) | 69 (7.8%) |
| $5,000 to $7,499 | 131 (5.2%) | 0 (0.0%) |
| $7,500 to $9,999 | 27 (1.1%) | 0 (0.0%) |
| $10,000 to $12,499 | 10 (0.4%) | 102 (11.6%) |
| $12,500 to $14,999 | 40 (1.6%) | 12 (1.4%) |
| $15,000 to $17,499 | 32 (1.3%) | 60 (6.8%) |
| $17,500 to $19,999 | 32 (1.3%) | 10 (1.1%) |
| $20,000 to $22,499 | 516 (20.4%) | 8 (0.9%) |
| $22,500 to $24,999 | 58 (2.3%) | 124 (14.1%) |
| $25,000 to $29,999 | 373 (14.8%) | 55 (6.2%) |
| $30,000 to $34,999 | 305 (12.1%) | 98 (11.1%) |
| $35,000 to $39,999 | 130 (5.1%) | 41 (4.6%) |
| $40,000 to $44,999 | 102 (4.0%) | 61 (6.9%) |
| $45,000 to $49,999 | 125 (5.0%) | 19 (2.1%) |
| $50,000 to $54,999 | 10 (0.4%) | 102 (11.6%) |
| $55,000 to $64,999 | 96 (3.8%) | 26 (2.9%) |
| $65,000 to $74,999 | 57 (2.3%) | 40 (4.5%) |
| $75,000 to $99,999 | 157 (6.2%) | 0 (0.0%) |
| $100,000+ | 249 (9.9%) | 20 (2.3%) |
| Total | 2,527 (100.0%) | 882 (100.0%) |
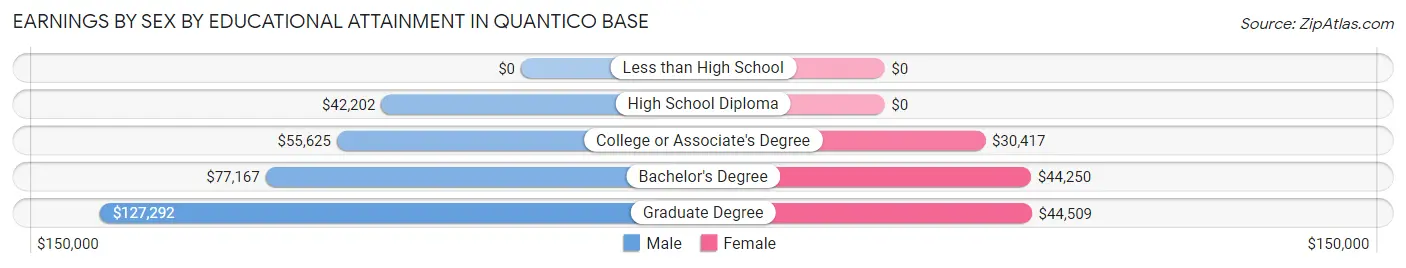
Earnings by Sex by Educational Attainment in Quantico Base
Average earnings in Quantico Base are $69,125 for men and $34,821 for women, a difference of 49.6%. Men with an educational attainment of graduate degree enjoy the highest average annual earnings of $127,292, while those with high school diploma education earn the least with $42,202. Women with an educational attainment of graduate degree earn the most with the average annual earnings of $44,509, while those with college or associate's degree education have the smallest earnings of $30,417.
| Educational Attainment | Male Income | Female Income |
| Less than High School | - | - |
| High School Diploma | $42,202 | $0 |
| College or Associate's Degree | $55,625 | $30,417 |
| Bachelor's Degree | $77,167 | $44,250 |
| Graduate Degree | $127,292 | $44,509 |
| Total | $69,125 | $34,821 |
Family Income in Quantico Base
Family Income Brackets in Quantico Base
According to the Quantico Base family income data, there are 224 families falling into the $35,000 to $49,999 income range, which is the most common income bracket and makes up 23.2% of all families.
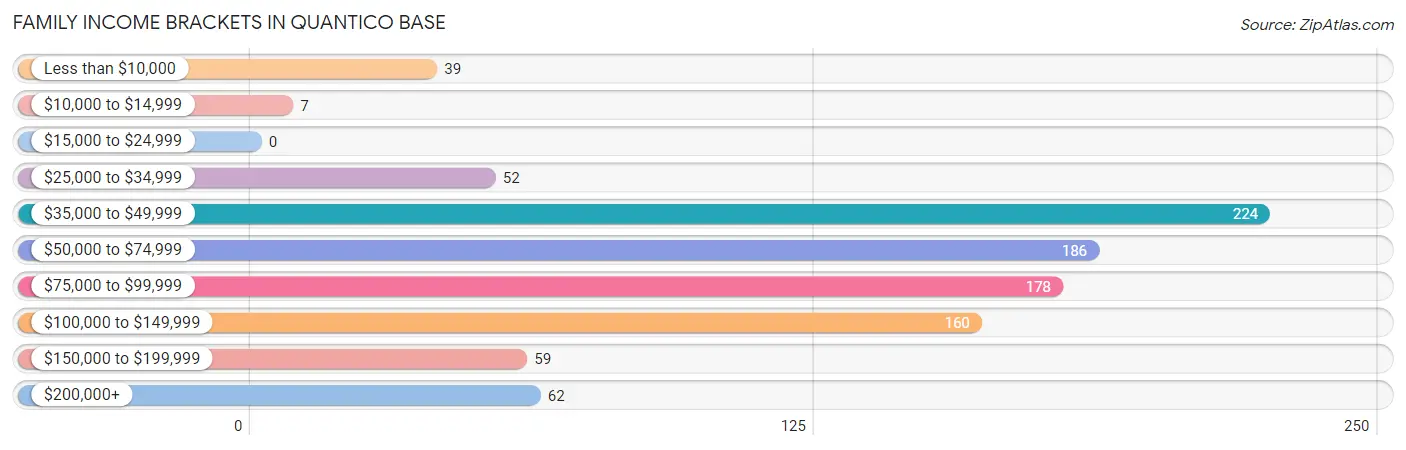
| Income Bracket | # Families | % Families |
| Less than $10,000 | 39 | 4.0% |
| $10,000 to $14,999 | 7 | 0.7% |
| $15,000 to $24,999 | 0 | 0.0% |
| $25,000 to $34,999 | 52 | 5.4% |
| $35,000 to $49,999 | 224 | 23.2% |
| $50,000 to $74,999 | 186 | 19.2% |
| $75,000 to $99,999 | 178 | 18.4% |
| $100,000 to $149,999 | 160 | 16.5% |
| $150,000 to $199,999 | 59 | 6.1% |
| $200,000+ | 62 | 6.4% |
Family Income by Famaliy Size in Quantico Base
4-person families (307 | 31.8%) account for the highest median family income in Quantico Base with $85,417 per family, while 2-person families (356 | 36.8%) have the highest median income of $28,029 per family member.
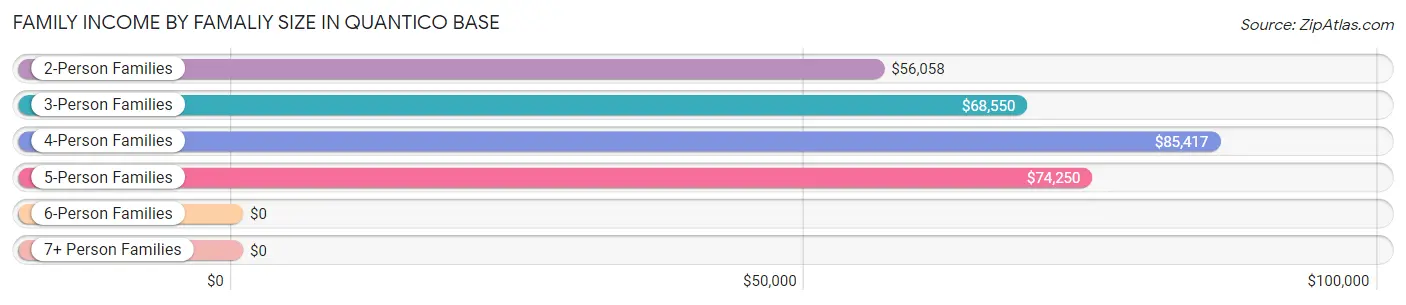
| Income Bracket | # Families | Median Income |
| 2-Person Families | 356 (36.8%) | $56,058 |
| 3-Person Families | 153 (15.8%) | $68,550 |
| 4-Person Families | 307 (31.8%) | $85,417 |
| 5-Person Families | 121 (12.5%) | $74,250 |
| 6-Person Families | 14 (1.5%) | $0 |
| 7+ Person Families | 16 (1.7%) | $0 |
| Total | 967 (100.0%) | $68,607 |
Family Income by Number of Earners in Quantico Base
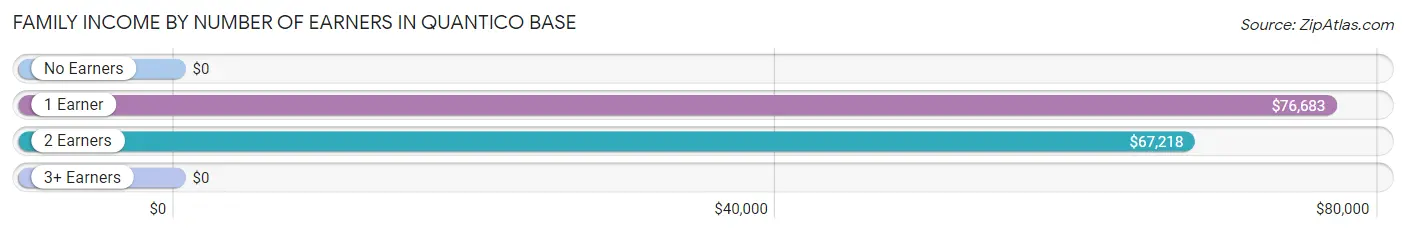
| Number of Earners | # Families | Median Income |
| No Earners | 39 (4.0%) | $0 |
| 1 Earner | 467 (48.3%) | $76,683 |
| 2 Earners | 439 (45.4%) | $67,218 |
| 3+ Earners | 22 (2.3%) | $0 |
| Total | 967 (100.0%) | $68,607 |
Household Income in Quantico Base
Household Income Brackets in Quantico Base
With 239 households falling in the category, the $35,000 to $49,999 income range is the most frequent in Quantico Base, accounting for 21.8% of all households.
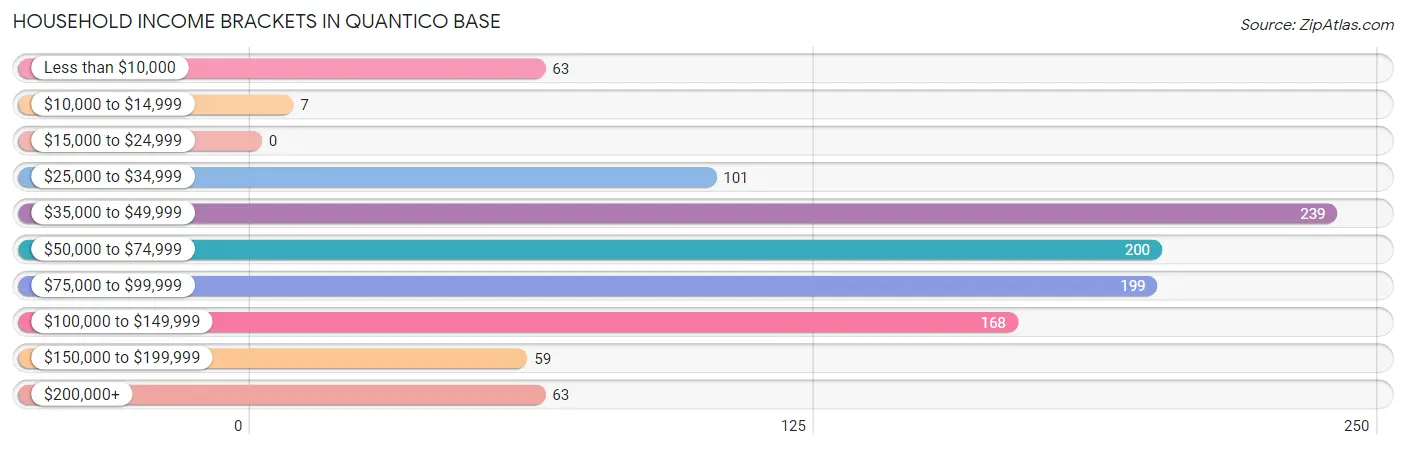
| Income Bracket | # Households | % Households |
| Less than $10,000 | 63 | 5.7% |
| $10,000 to $14,999 | 7 | 0.6% |
| $15,000 to $24,999 | 0 | 0.0% |
| $25,000 to $34,999 | 101 | 9.2% |
| $35,000 to $49,999 | 239 | 21.8% |
| $50,000 to $74,999 | 200 | 18.2% |
| $75,000 to $99,999 | 199 | 18.1% |
| $100,000 to $149,999 | 168 | 15.3% |
| $150,000 to $199,999 | 59 | 5.4% |
| $200,000+ | 63 | 5.7% |
Household Income by Householder Age in Quantico Base
The median household income in Quantico Base is $66,361, with the highest median household income of $196,806 found in the 45 to 64 years age bracket for the primary householder. A total of 105 households (9.6%) fall into this category.
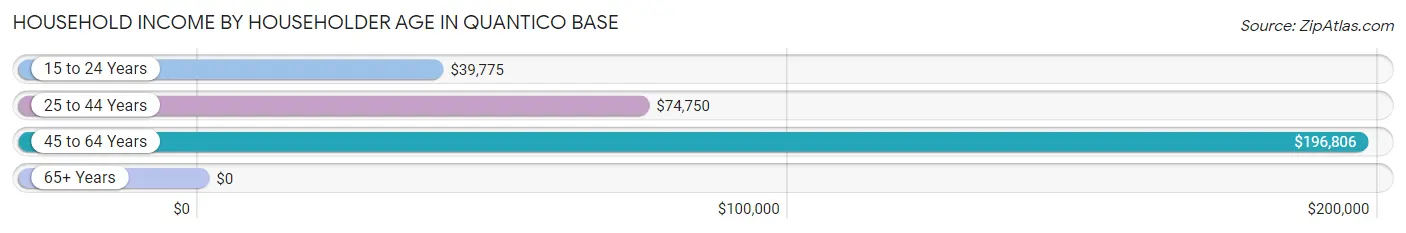
| Income Bracket | # Households | Median Income |
| 15 to 24 Years | 303 (27.6%) | $39,775 |
| 25 to 44 Years | 689 (62.8%) | $74,750 |
| 45 to 64 Years | 105 (9.6%) | $196,806 |
| 65+ Years | 0 (0.0%) | $0 |
| Total | 1,097 (100.0%) | $66,361 |
Poverty in Quantico Base
Income Below Poverty by Sex and Age in Quantico Base
With 5.9% poverty level for males and 4.5% for females among the residents of Quantico Base, under 5 year old males and 5 year old females are the most vulnerable to poverty, with 35 males (10.1%) and 25 females (36.8%) in their respective age groups living below the poverty level.
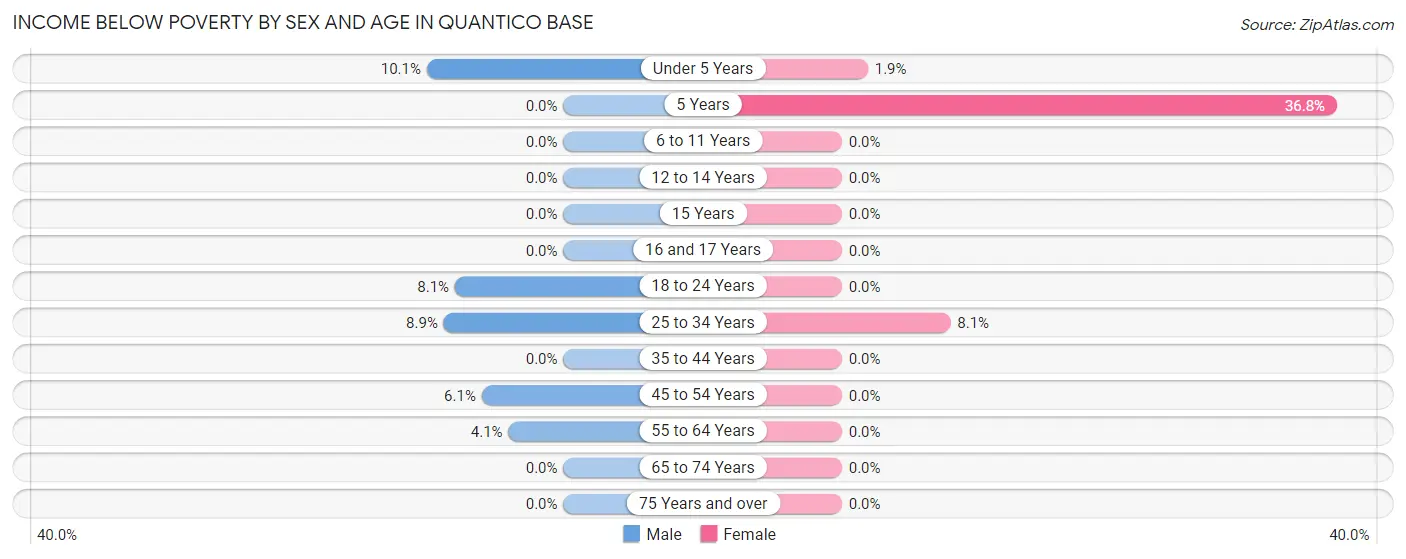
| Age Bracket | Male | Female |
| Under 5 Years | 35 (10.1%) | 7 (1.9%) |
| 5 Years | 0 (0.0%) | 25 (36.8%) |
| 6 to 11 Years | 0 (0.0%) | 0 (0.0%) |
| 12 to 14 Years | 0 (0.0%) | 0 (0.0%) |
| 15 Years | 0 (0.0%) | 0 (0.0%) |
| 16 and 17 Years | 0 (0.0%) | 0 (0.0%) |
| 18 to 24 Years | 26 (8.1%) | 0 (0.0%) |
| 25 to 34 Years | 39 (8.9%) | 45 (8.1%) |
| 35 to 44 Years | 0 (0.0%) | 0 (0.0%) |
| 45 to 54 Years | 2 (6.1%) | 0 (0.0%) |
| 55 to 64 Years | 2 (4.1%) | 0 (0.0%) |
| 65 to 74 Years | 0 (0.0%) | 0 (0.0%) |
| 75 Years and over | 0 (0.0%) | 0 (0.0%) |
| Total | 104 (5.9%) | 77 (4.5%) |
Income Above Poverty by Sex and Age in Quantico Base
According to the poverty statistics in Quantico Base, males aged 5 years and females aged 6 to 11 years are the age groups that are most secure financially, with 100.0% of males and 100.0% of females in these age groups living above the poverty line.
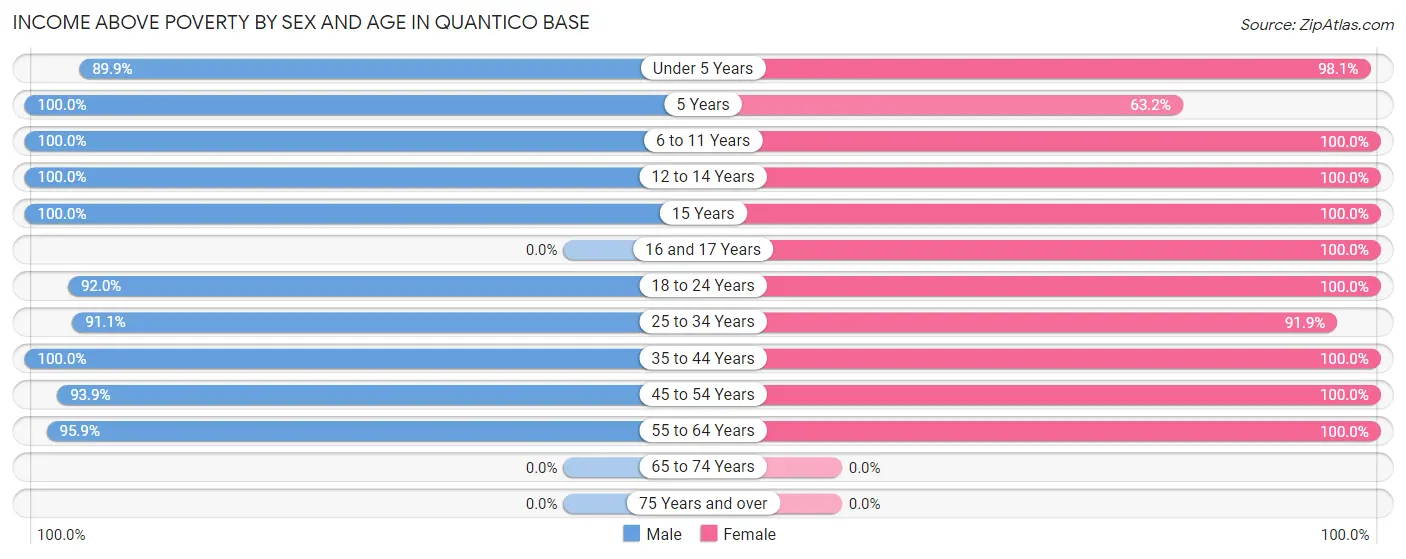
| Age Bracket | Male | Female |
| Under 5 Years | 310 (89.9%) | 356 (98.1%) |
| 5 Years | 59 (100.0%) | 43 (63.2%) |
| 6 to 11 Years | 272 (100.0%) | 223 (100.0%) |
| 12 to 14 Years | 16 (100.0%) | 17 (100.0%) |
| 15 Years | 29 (100.0%) | 4 (100.0%) |
| 16 and 17 Years | 0 (0.0%) | 8 (100.0%) |
| 18 to 24 Years | 297 (91.9%) | 193 (100.0%) |
| 25 to 34 Years | 400 (91.1%) | 513 (91.9%) |
| 35 to 44 Years | 194 (100.0%) | 174 (100.0%) |
| 45 to 54 Years | 31 (93.9%) | 56 (100.0%) |
| 55 to 64 Years | 47 (95.9%) | 57 (100.0%) |
| 65 to 74 Years | 0 (0.0%) | 0 (0.0%) |
| 75 Years and over | 0 (0.0%) | 0 (0.0%) |
| Total | 1,655 (94.1%) | 1,644 (95.5%) |
Income Below Poverty Among Married-Couple Families in Quantico Base
The poverty statistics for married-couple families in Quantico Base show that 4.3% or 39 of the total 900 families live below the poverty line. Families with 1 or 2 children have the highest poverty rate of 9.1%, comprising of 39 families. On the other hand, families with no children have the lowest poverty rate of 0.0%, which includes 0 families.
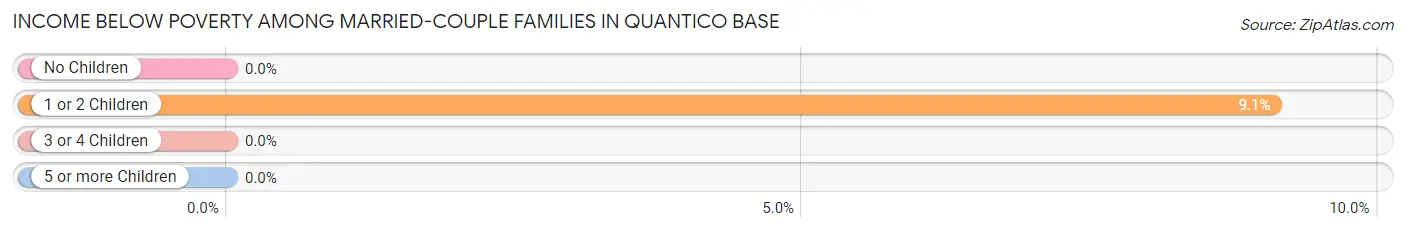
| Children | Above Poverty | Below Poverty |
| No Children | 320 (100.0%) | 0 (0.0%) |
| 1 or 2 Children | 390 (90.9%) | 39 (9.1%) |
| 3 or 4 Children | 135 (100.0%) | 0 (0.0%) |
| 5 or more Children | 16 (100.0%) | 0 (0.0%) |
| Total | 861 (95.7%) | 39 (4.3%) |
Income Below Poverty Among Single-Parent Households in Quantico Base
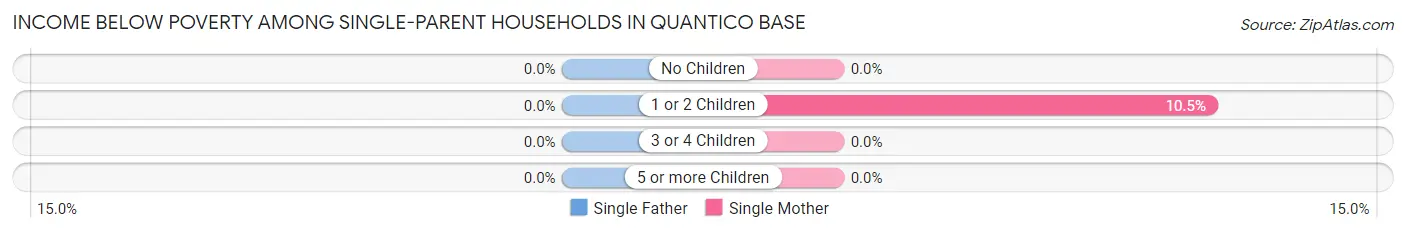
| Children | Single Father | Single Mother |
| No Children | 0 (0.0%) | 0 (0.0%) |
| 1 or 2 Children | 0 (0.0%) | 7 (10.4%) |
| 3 or 4 Children | 0 (0.0%) | 0 (0.0%) |
| 5 or more Children | 0 (0.0%) | 0 (0.0%) |
| Total | 0 (0.0%) | 7 (10.4%) |
Income Below Poverty Among Married-Couple vs Single-Parent Households in Quantico Base
The poverty data for Quantico Base shows that 39 of the married-couple family households (4.3%) and 7 of the single-parent households (10.4%) are living below the poverty level. Within the married-couple family households, those with 1 or 2 children have the highest poverty rate, with 39 households (9.1%) falling below the poverty line. Among the single-parent households, those with 1 or 2 children have the highest poverty rate, with 7 household (10.4%) living below poverty.
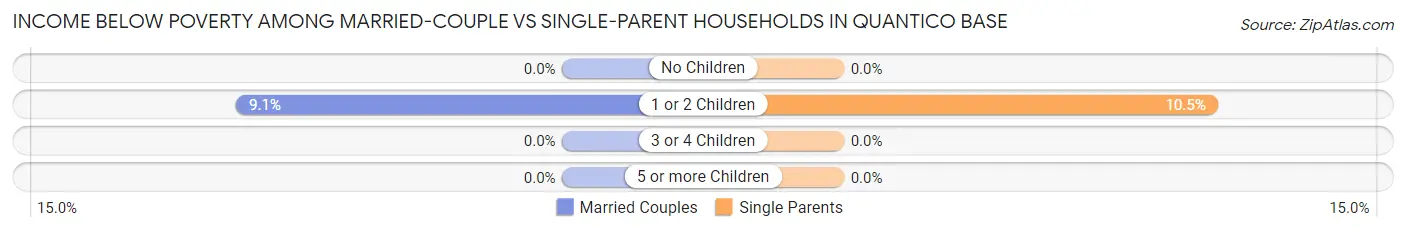
| Children | Married-Couple Families | Single-Parent Households |
| No Children | 0 (0.0%) | 0 (0.0%) |
| 1 or 2 Children | 39 (9.1%) | 7 (10.4%) |
| 3 or 4 Children | 0 (0.0%) | 0 (0.0%) |
| 5 or more Children | 0 (0.0%) | 0 (0.0%) |
| Total | 39 (4.3%) | 7 (10.4%) |
Race in Quantico Base
The most populous races in Quantico Base are White / Caucasian (3,889 | 72.4%), Hispanic or Latino (887 | 16.5%), and Two or more Races (602 | 11.2%).
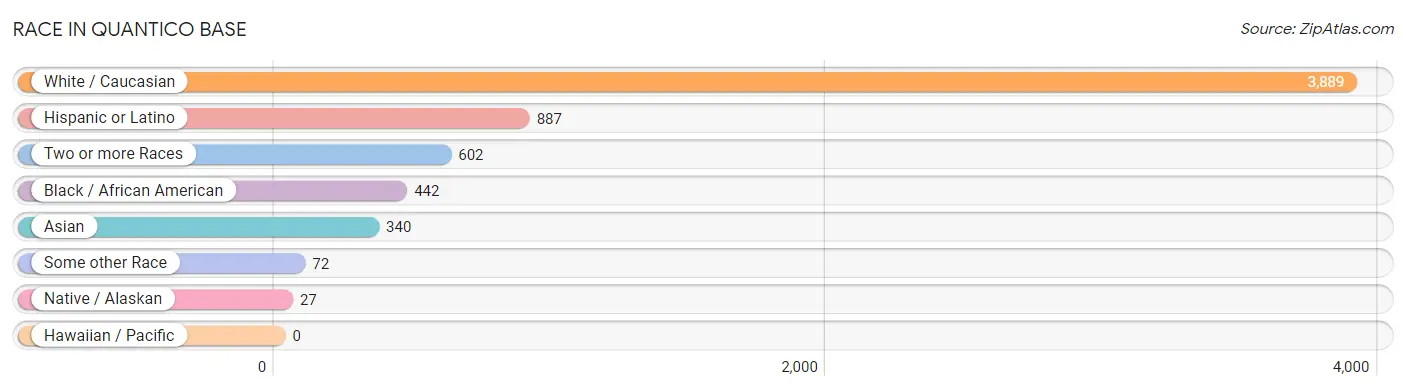
| Race | # Population | % Population |
| Asian | 340 | 6.3% |
| Black / African American | 442 | 8.2% |
| Hawaiian / Pacific | 0 | 0.0% |
| Hispanic or Latino | 887 | 16.5% |
| Native / Alaskan | 27 | 0.5% |
| White / Caucasian | 3,889 | 72.4% |
| Two or more Races | 602 | 11.2% |
| Some other Race | 72 | 1.3% |
| Total | 5,372 | 100.0% |
Ancestry in Quantico Base
The most populous ancestries reported in Quantico Base are German (989 | 18.4%), Mexican (486 | 9.0%), Irish (416 | 7.7%), American (395 | 7.3%), and Italian (304 | 5.7%), together accounting for 48.2% of all Quantico Base residents.
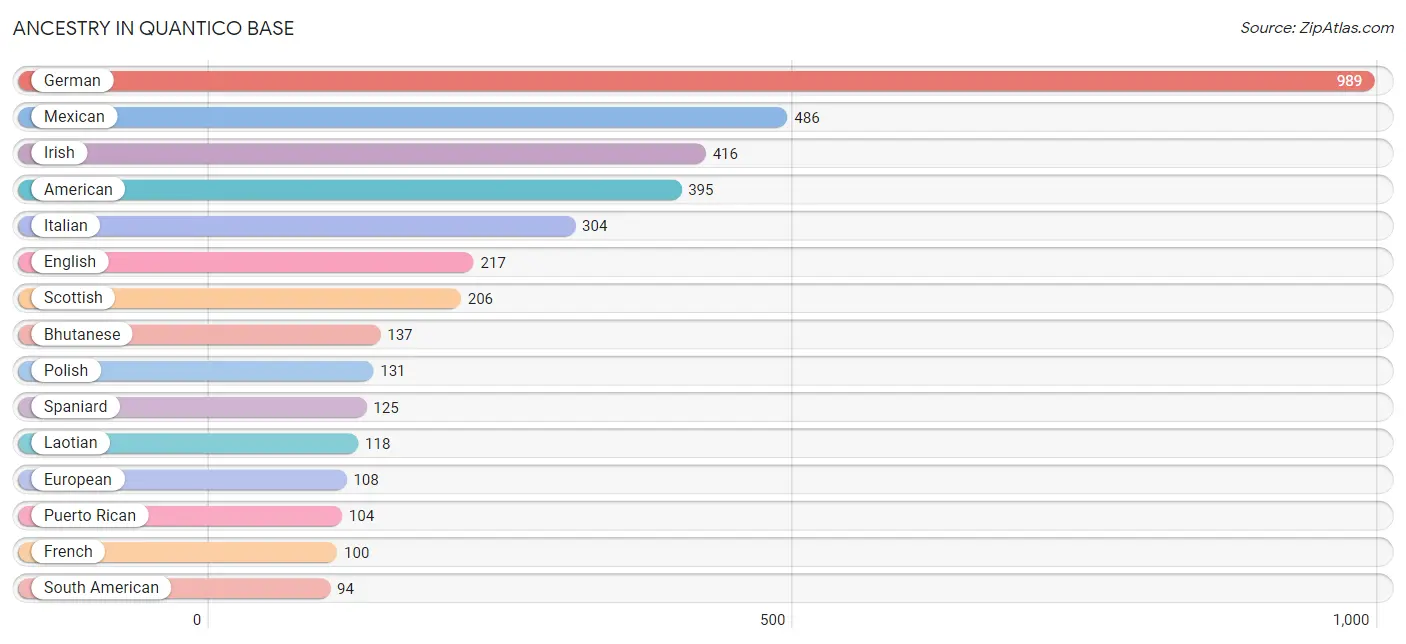
| Ancestry | # Population | % Population |
| African | 9 | 0.2% |
| American | 395 | 7.3% |
| Arab | 34 | 0.6% |
| Australian | 22 | 0.4% |
| Austrian | 19 | 0.4% |
| Belgian | 10 | 0.2% |
| Bhutanese | 137 | 2.5% |
| Brazilian | 4 | 0.1% |
| British | 36 | 0.7% |
| Burmese | 72 | 1.3% |
| Central American | 41 | 0.8% |
| Central American Indian | 29 | 0.5% |
| Cherokee | 32 | 0.6% |
| Colombian | 49 | 0.9% |
| Cuban | 26 | 0.5% |
| Czech | 10 | 0.2% |
| Dominican | 11 | 0.2% |
| Eastern European | 10 | 0.2% |
| Egyptian | 34 | 0.6% |
| English | 217 | 4.0% |
| European | 108 | 2.0% |
| French | 100 | 1.9% |
| German | 989 | 18.4% |
| German Russian | 56 | 1.0% |
| Greek | 9 | 0.2% |
| Guatemalan | 21 | 0.4% |
| Honduran | 14 | 0.3% |
| Hungarian | 8 | 0.2% |
| Indian (Asian) | 33 | 0.6% |
| Irish | 416 | 7.7% |
| Italian | 304 | 5.7% |
| Korean | 11 | 0.2% |
| Laotian | 118 | 2.2% |
| Mexican | 486 | 9.0% |
| Mexican American Indian | 38 | 0.7% |
| Norwegian | 56 | 1.0% |
| Pakistani | 10 | 0.2% |
| Pennsylvania German | 7 | 0.1% |
| Peruvian | 36 | 0.7% |
| Polish | 131 | 2.4% |
| Portuguese | 10 | 0.2% |
| Puerto Rican | 104 | 1.9% |
| Russian | 8 | 0.2% |
| Salvadoran | 6 | 0.1% |
| Scandinavian | 67 | 1.3% |
| Scotch-Irish | 17 | 0.3% |
| Scottish | 206 | 3.8% |
| Sioux | 23 | 0.4% |
| South American | 94 | 1.8% |
| Spaniard | 125 | 2.3% |
| Sri Lankan | 40 | 0.7% |
| Subsaharan African | 9 | 0.2% |
| Swedish | 27 | 0.5% |
| Thai | 80 | 1.5% |
| Ukrainian | 39 | 0.7% |
| Venezuelan | 9 | 0.2% |
| Welsh | 54 | 1.0% |
| West Indian | 20 | 0.4% | View All 58 Rows |
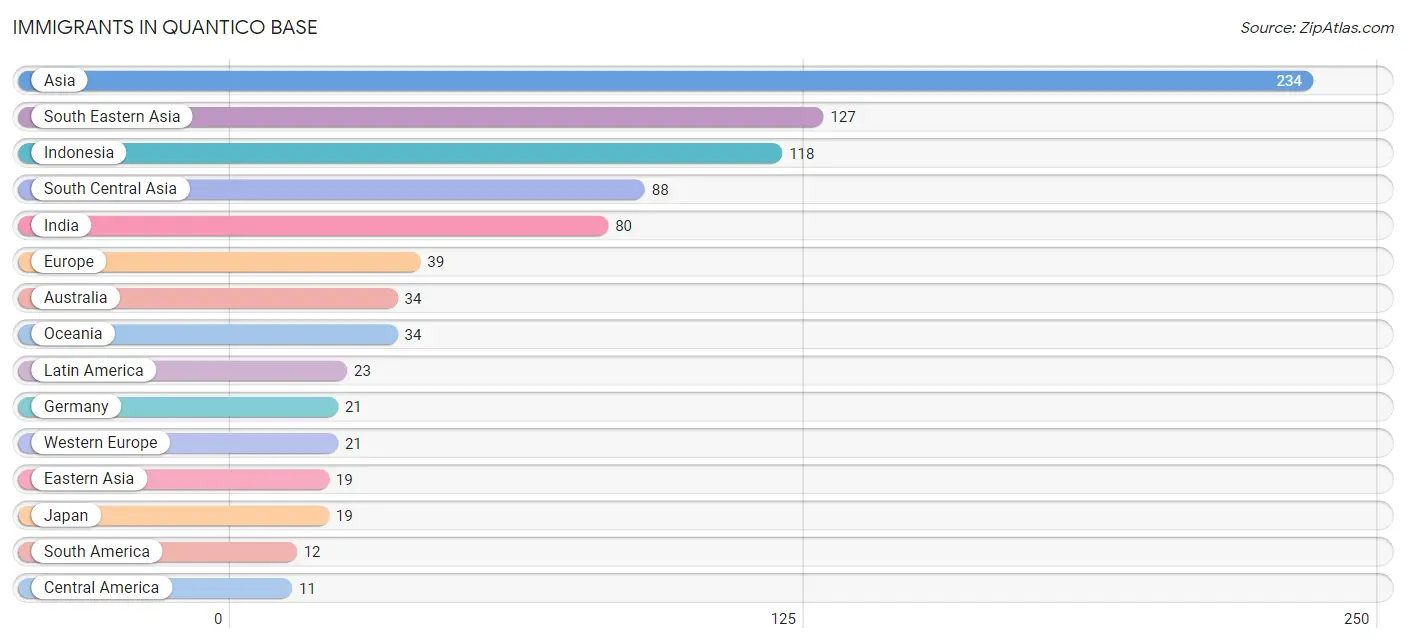
Immigrants in Quantico Base
The most numerous immigrant groups reported in Quantico Base came from Asia (234 | 4.4%), South Eastern Asia (127 | 2.4%), Indonesia (118 | 2.2%), South Central Asia (88 | 1.6%), and India (80 | 1.5%), together accounting for 12.0% of all Quantico Base residents.
| Immigration Origin | # Population | % Population |
| Africa | 9 | 0.2% |
| Asia | 234 | 4.4% |
| Australia | 34 | 0.6% |
| Brazil | 4 | 0.1% |
| Central America | 11 | 0.2% |
| Eastern Asia | 19 | 0.4% |
| Eastern Europe | 8 | 0.2% |
| Egypt | 9 | 0.2% |
| El Salvador | 6 | 0.1% |
| Europe | 39 | 0.7% |
| Germany | 21 | 0.4% |
| India | 80 | 1.5% |
| Indonesia | 118 | 2.2% |
| Iran | 8 | 0.2% |
| Japan | 19 | 0.4% |
| Latin America | 23 | 0.4% |
| Mexico | 5 | 0.1% |
| Northern Africa | 9 | 0.2% |
| Oceania | 34 | 0.6% |
| Peru | 8 | 0.2% |
| Portugal | 10 | 0.2% |
| Russia | 8 | 0.2% |
| South America | 12 | 0.2% |
| South Central Asia | 88 | 1.6% |
| South Eastern Asia | 127 | 2.4% |
| Southern Europe | 10 | 0.2% |
| Vietnam | 9 | 0.2% |
| Western Europe | 21 | 0.4% | View All 28 Rows |
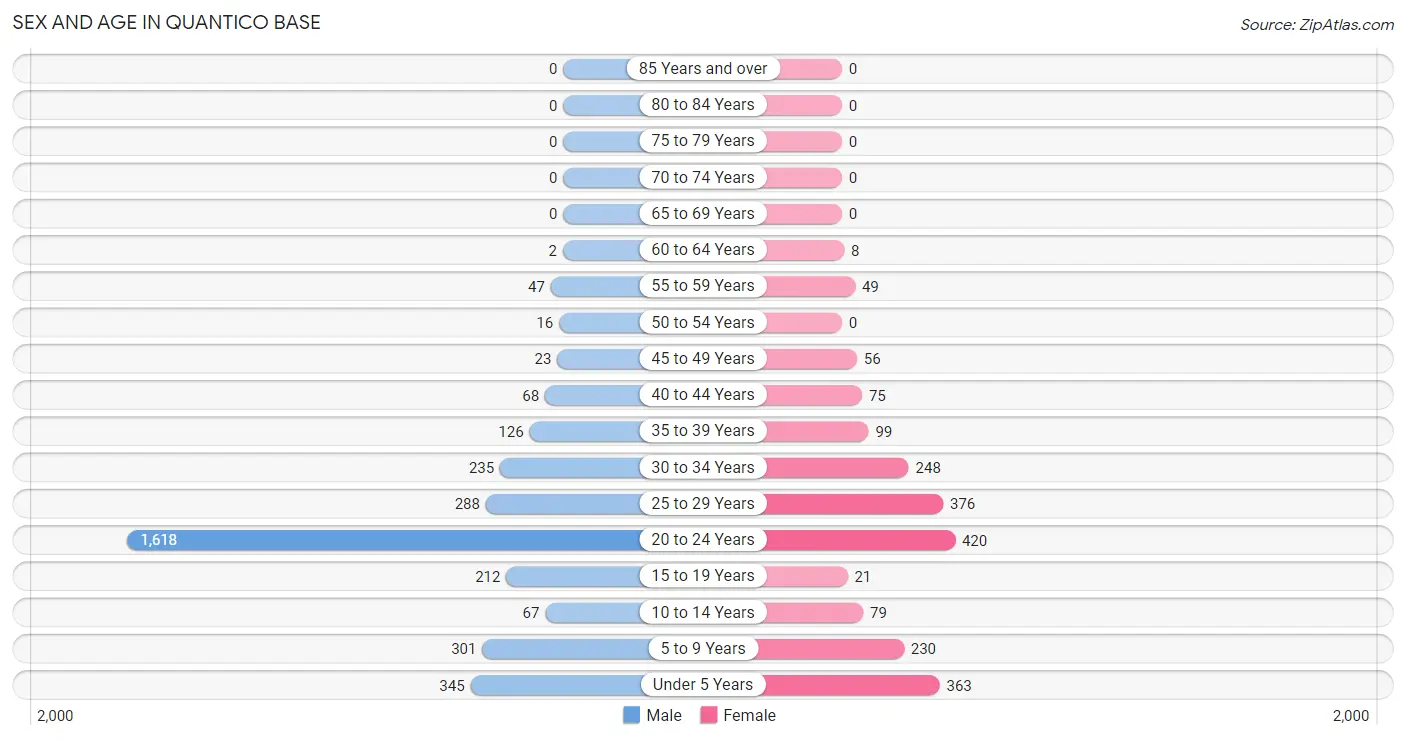
Sex and Age in Quantico Base
Sex and Age in Quantico Base
The most populous age groups in Quantico Base are 20 to 24 Years (1,618 | 48.3%) for men and 20 to 24 Years (420 | 20.7%) for women.
| Age Bracket | Male | Female |
| Under 5 Years | 345 (10.3%) | 363 (17.9%) |
| 5 to 9 Years | 301 (9.0%) | 230 (11.4%) |
| 10 to 14 Years | 67 (2.0%) | 79 (3.9%) |
| 15 to 19 Years | 212 (6.3%) | 21 (1.0%) |
| 20 to 24 Years | 1,618 (48.3%) | 420 (20.7%) |
| 25 to 29 Years | 288 (8.6%) | 376 (18.6%) |
| 30 to 34 Years | 235 (7.0%) | 248 (12.2%) |
| 35 to 39 Years | 126 (3.8%) | 99 (4.9%) |
| 40 to 44 Years | 68 (2.0%) | 75 (3.7%) |
| 45 to 49 Years | 23 (0.7%) | 56 (2.8%) |
| 50 to 54 Years | 16 (0.5%) | 0 (0.0%) |
| 55 to 59 Years | 47 (1.4%) | 49 (2.4%) |
| 60 to 64 Years | 2 (0.1%) | 8 (0.4%) |
| 65 to 69 Years | 0 (0.0%) | 0 (0.0%) |
| 70 to 74 Years | 0 (0.0%) | 0 (0.0%) |
| 75 to 79 Years | 0 (0.0%) | 0 (0.0%) |
| 80 to 84 Years | 0 (0.0%) | 0 (0.0%) |
| 85 Years and over | 0 (0.0%) | 0 (0.0%) |
| Total | 3,348 (100.0%) | 2,024 (100.0%) |
Families and Households in Quantico Base
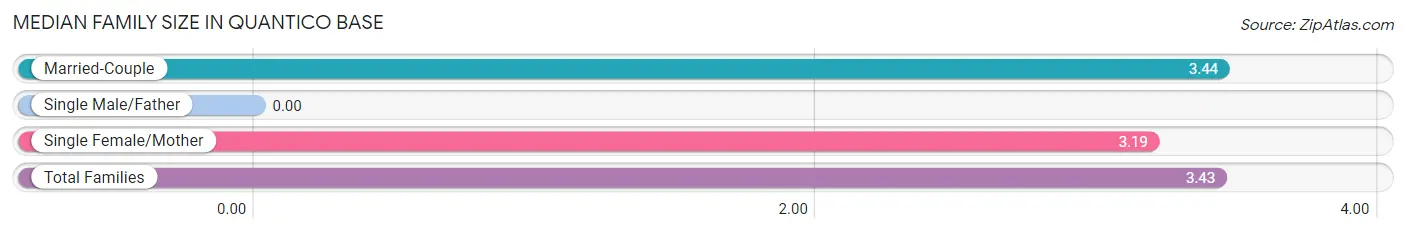
Median Family Size in Quantico Base
| Family Type | # Families | Family Size |
| Married-Couple | 900 (93.1%) | 3.44 |
| Single Male/Father | 0 (0.0%) | - |
| Single Female/Mother | 67 (6.9%) | 3.19 |
| Total Families | 967 (100.0%) | 3.43 |
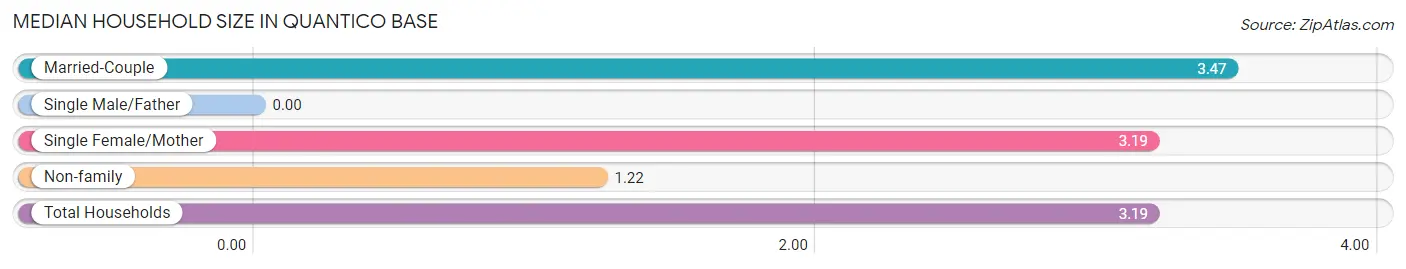
Median Household Size in Quantico Base
| Household Type | # Households | Household Size |
| Married-Couple | 900 (82.0%) | 3.47 |
| Single Male/Father | 0 (0.0%) | - |
| Single Female/Mother | 67 (6.1%) | 3.19 |
| Non-family | 130 (11.8%) | 1.22 |
| Total Households | 1,097 (100.0%) | 3.19 |
Household Size by Marriage Status in Quantico Base
Out of a total of 1,097 households in Quantico Base, 967 (88.1%) are family households, while 130 (11.8%) are nonfamily households. The most numerous type of family households are 2-person households, comprising 356, and the most common type of nonfamily households are 1-person households, comprising 101.
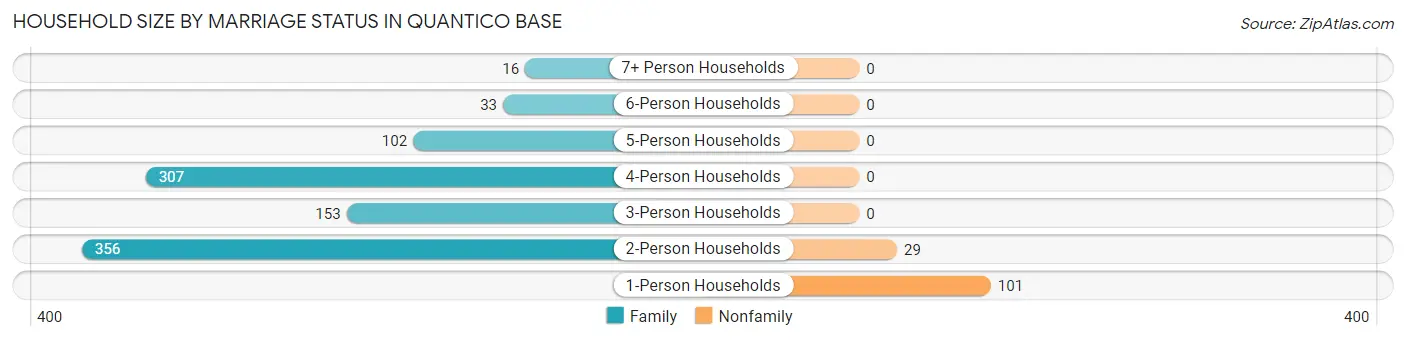
| Household Size | Family Households | Nonfamily Households |
| 1-Person Households | - | 101 (9.2%) |
| 2-Person Households | 356 (32.5%) | 29 (2.6%) |
| 3-Person Households | 153 (14.0%) | 0 (0.0%) |
| 4-Person Households | 307 (28.0%) | 0 (0.0%) |
| 5-Person Households | 102 (9.3%) | 0 (0.0%) |
| 6-Person Households | 33 (3.0%) | 0 (0.0%) |
| 7+ Person Households | 16 (1.5%) | 0 (0.0%) |
| Total | 967 (88.1%) | 130 (11.8%) |
Female Fertility in Quantico Base
Fertility by Age in Quantico Base
Average fertility rate in Quantico Base is 94.0 births per 1,000 women. Women in the age bracket of 20 to 34 years have the highest fertility rate with 117.0 births per 1,000 women. Women in the age bracket of 20 to 34 years acount for 100.0% of all women with births.
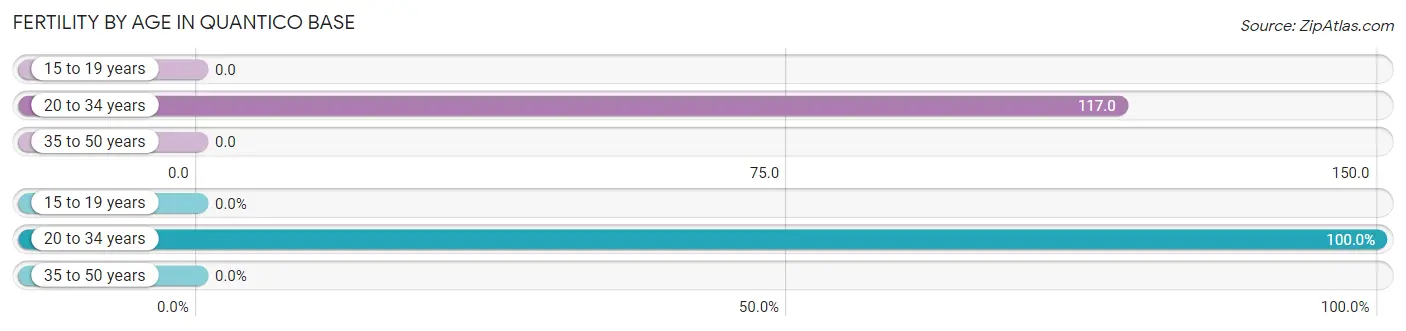
| Age Bracket | Women with Births | Births / 1,000 Women |
| 15 to 19 years | 0 (0.0%) | 0.0 |
| 20 to 34 years | 122 (100.0%) | 117.0 |
| 35 to 50 years | 0 (0.0%) | 0.0 |
| Total | 122 (100.0%) | 94.0 |
Fertility by Age by Marriage Status in Quantico Base
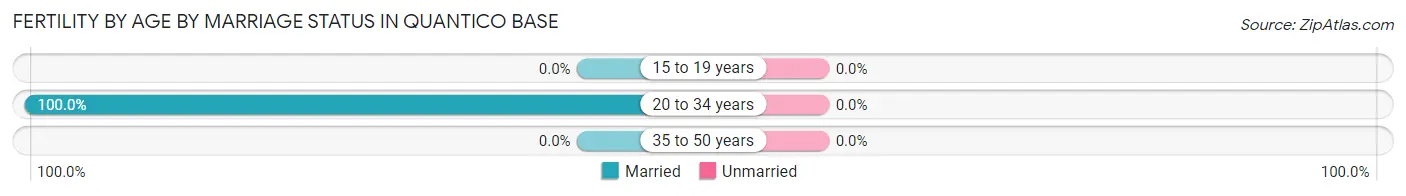
| Age Bracket | Married | Unmarried |
| 15 to 19 years | 0 (0.0%) | 0 (0.0%) |
| 20 to 34 years | 122 (100.0%) | 0 (0.0%) |
| 35 to 50 years | 0 (0.0%) | 0 (0.0%) |
| Total | 122 (100.0%) | 0 (0.0%) |
Fertility by Education in Quantico Base
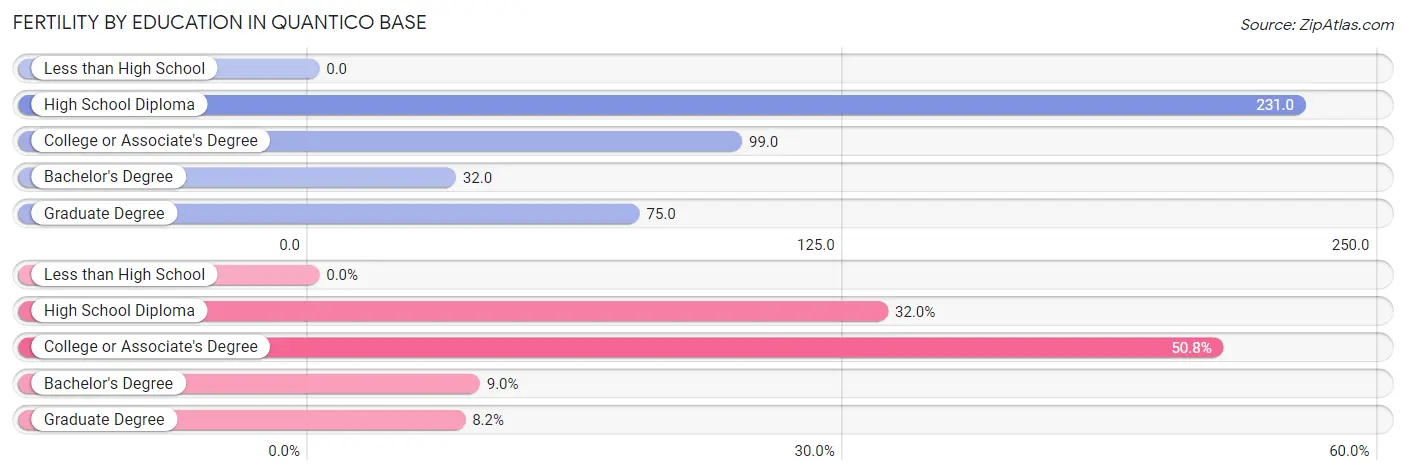
| Educational Attainment | Women with Births | Births / 1,000 Women |
| Less than High School | 0 (0.0%) | 0.0 |
| High School Diploma | 39 (32.0%) | 231.0 |
| College or Associate's Degree | 62 (50.8%) | 99.0 |
| Bachelor's Degree | 11 (9.0%) | 32.0 |
| Graduate Degree | 10 (8.2%) | 75.0 |
| Total | 122 (100.0%) | 94.0 |
Fertility by Education by Marriage Status in Quantico Base
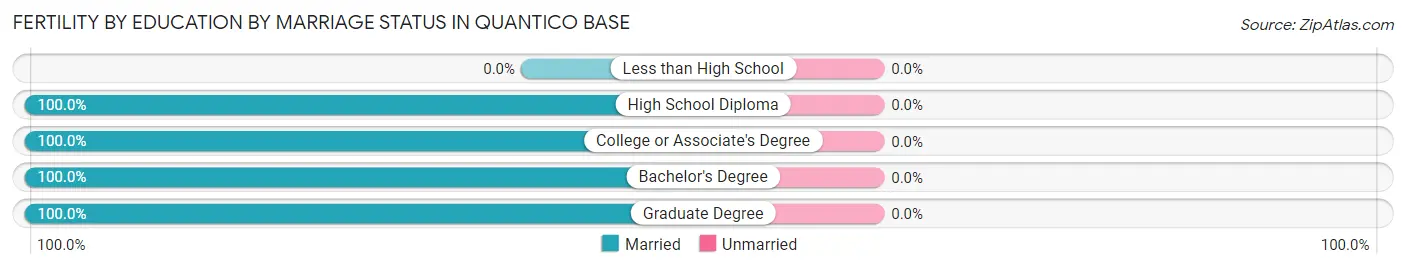
| Educational Attainment | Married | Unmarried |
| Less than High School | 0 (0.0%) | 0 (0.0%) |
| High School Diploma | 39 (100.0%) | 0 (0.0%) |
| College or Associate's Degree | 62 (100.0%) | 0 (0.0%) |
| Bachelor's Degree | 11 (100.0%) | 0 (0.0%) |
| Graduate Degree | 10 (100.0%) | 0 (0.0%) |
| Total | 122 (100.0%) | 0 (0.0%) |
Employment Characteristics in Quantico Base
Employment by Class of Employer in Quantico Base
Among the 3,300 employed individuals in Quantico Base, federal government employees (2,762 | 83.7%), private company employees (430 | 13.0%), and not-for-profit organizations (64 | 1.9%) make up the most common classes of employment.
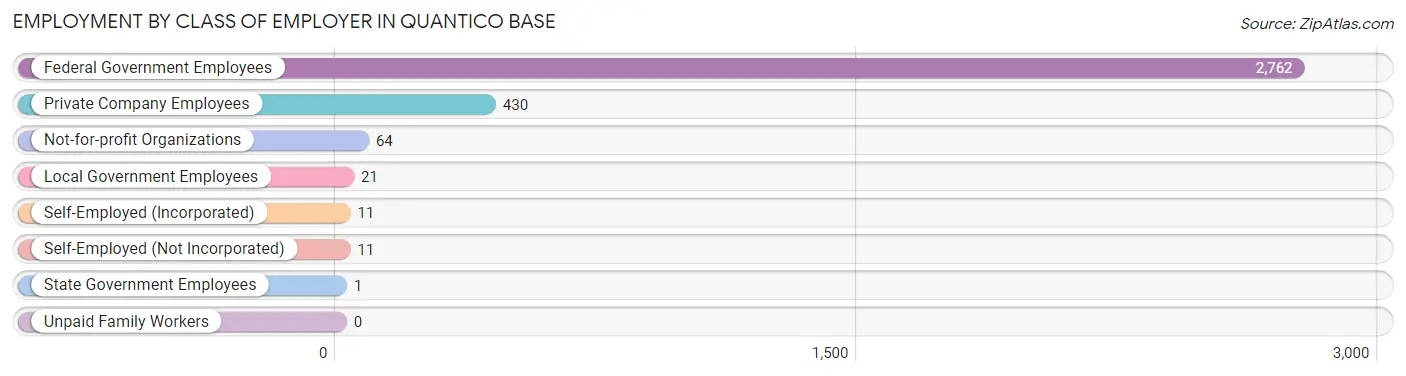
| Employer Class | # Employees | % Employees |
| Private Company Employees | 430 | 13.0% |
| Self-Employed (Incorporated) | 11 | 0.3% |
| Self-Employed (Not Incorporated) | 11 | 0.3% |
| Not-for-profit Organizations | 64 | 1.9% |
| Local Government Employees | 21 | 0.6% |
| State Government Employees | 1 | 0.0% |
| Federal Government Employees | 2,762 | 83.7% |
| Unpaid Family Workers | 0 | 0.0% |
| Total | 3,300 | 100.0% |
Employment Status by Age in Quantico Base
According to the labor force statistics for Quantico Base, out of the total population over 16 years of age (3,954), 85.5% or 3,381 individuals are in the labor force, with 8.4% or 284 of them unemployed. The age group with the highest labor force participation rate is 16 to 19 years, with 100.0% or 200 individuals in the labor force. Within the labor force, the 30 to 34 years age range has the highest percentage of unemployed individuals, with 18.6% or 63 of them being unemployed.
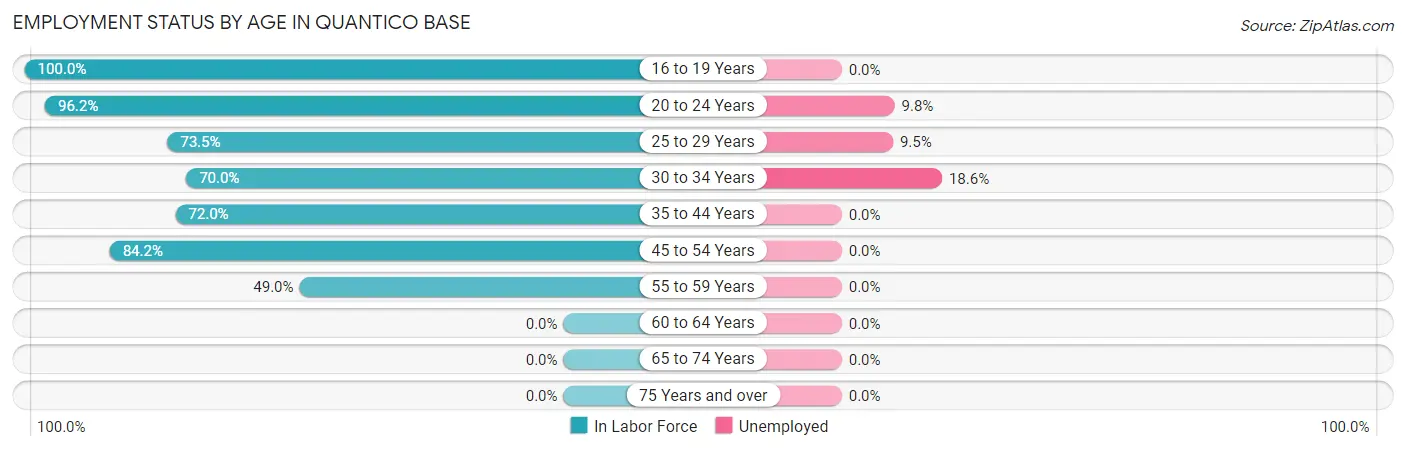
| Age Bracket | In Labor Force | Unemployed |
| 16 to 19 Years | 200 (100.0%) | 0 (0.0%) |
| 20 to 24 Years | 1,961 (96.2%) | 192 (9.8%) |
| 25 to 29 Years | 488 (73.5%) | 46 (9.5%) |
| 30 to 34 Years | 338 (70.0%) | 63 (18.6%) |
| 35 to 44 Years | 265 (72.0%) | 0 (0.0%) |
| 45 to 54 Years | 80 (84.2%) | 0 (0.0%) |
| 55 to 59 Years | 47 (49.0%) | 0 (0.0%) |
| 60 to 64 Years | 0 (0.0%) | 0 (0.0%) |
| 65 to 74 Years | 0 (0.0%) | 0 (0.0%) |
| 75 Years and over | 0 (0.0%) | 0 (0.0%) |
| Total | 3,381 (85.5%) | 284 (8.4%) |
Employment Status by Educational Attainment in Quantico Base
According to labor force statistics for Quantico Base, 71.0% of individuals (1,218) out of the total population between 25 and 64 years of age (1,716) are in the labor force, with 7.8% or 95 of them being unemployed. The group with the highest labor force participation rate are those with the educational attainment of less than high school, with 100.0% or 9 individuals in the labor force. Within the labor force, individuals with bachelor's degree or higher education have the highest percentage of unemployment, with 10.4% or 63 of them being unemployed.
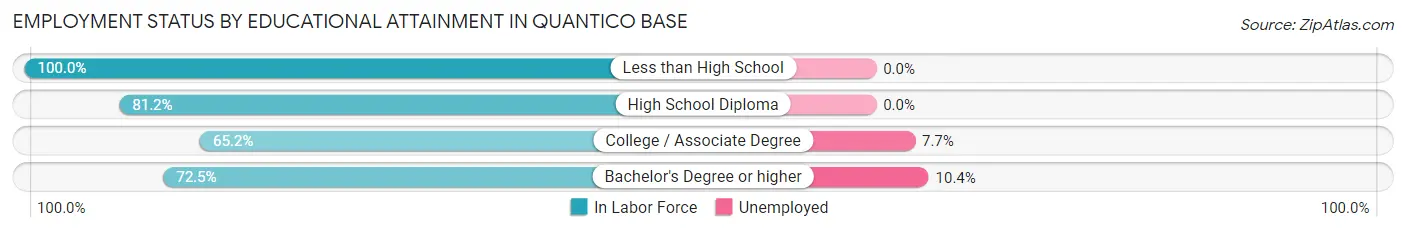
| Educational Attainment | In Labor Force | Unemployed |
| Less than High School | 9 (100.0%) | 0 (0.0%) |
| High School Diploma | 177 (81.2%) | 0 (0.0%) |
| College / Associate Degree | 427 (65.2%) | 50 (7.7%) |
| Bachelor's Degree or higher | 605 (72.5%) | 87 (10.4%) |
| Total | 1,218 (71.0%) | 134 (7.8%) |
Employment Occupations by Sex in Quantico Base
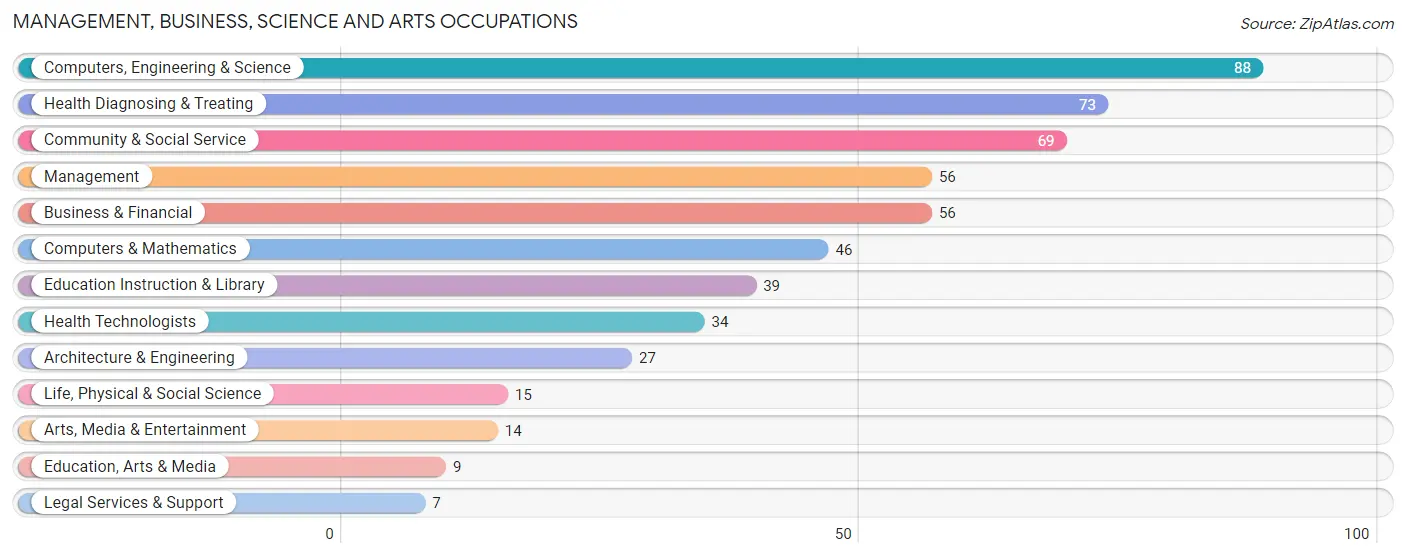
Management, Business, Science and Arts Occupations
The most common Management, Business, Science and Arts occupations in Quantico Base are Computers, Engineering & Science (88 | 11.7%), Health Diagnosing & Treating (73 | 9.7%), Community & Social Service (69 | 9.2%), Management (56 | 7.5%), and Business & Financial (56 | 7.5%).
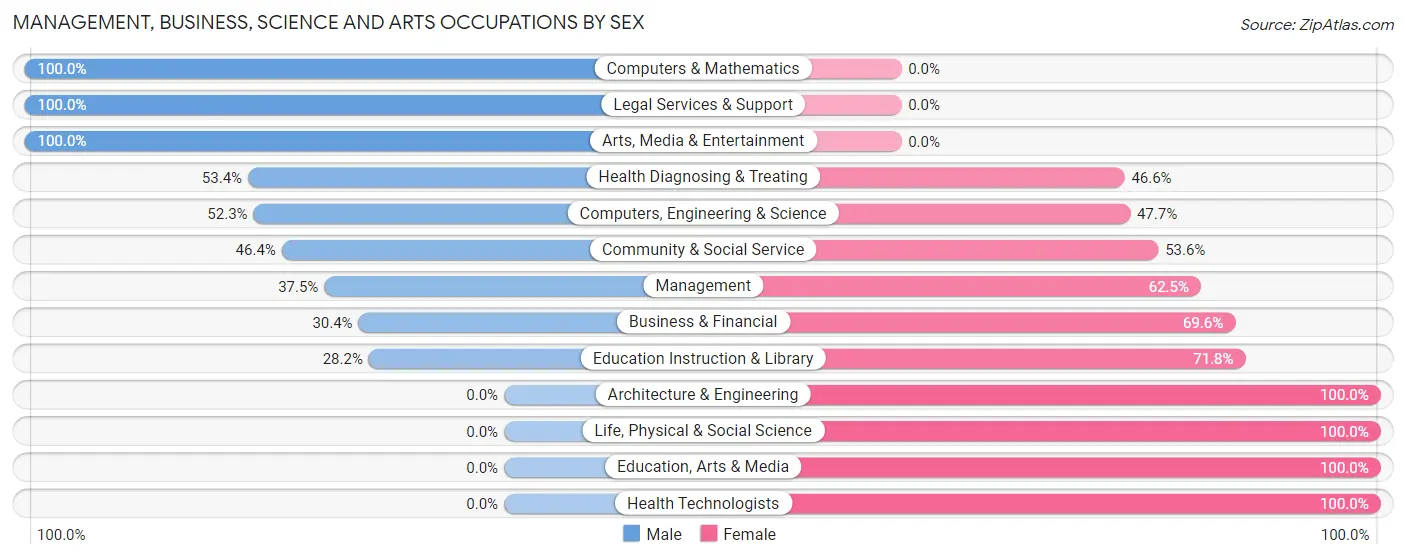
Management, Business, Science and Arts Occupations by Sex
Within the Management, Business, Science and Arts occupations in Quantico Base, the most male-oriented occupations are Computers & Mathematics (100.0%), Legal Services & Support (100.0%), and Arts, Media & Entertainment (100.0%), while the most female-oriented occupations are Architecture & Engineering (100.0%), Life, Physical & Social Science (100.0%), and Education, Arts & Media (100.0%).
| Occupation | Male | Female |
| Management | 21 (37.5%) | 35 (62.5%) |
| Business & Financial | 17 (30.4%) | 39 (69.6%) |
| Computers, Engineering & Science | 46 (52.3%) | 42 (47.7%) |
| Computers & Mathematics | 46 (100.0%) | 0 (0.0%) |
| Architecture & Engineering | 0 (0.0%) | 27 (100.0%) |
| Life, Physical & Social Science | 0 (0.0%) | 15 (100.0%) |
| Community & Social Service | 32 (46.4%) | 37 (53.6%) |
| Education, Arts & Media | 0 (0.0%) | 9 (100.0%) |
| Legal Services & Support | 7 (100.0%) | 0 (0.0%) |
| Education Instruction & Library | 11 (28.2%) | 28 (71.8%) |
| Arts, Media & Entertainment | 14 (100.0%) | 0 (0.0%) |
| Health Diagnosing & Treating | 39 (53.4%) | 34 (46.6%) |
| Health Technologists | 0 (0.0%) | 34 (100.0%) |
| Total (Category) | 155 (45.3%) | 187 (54.7%) |
| Total (Overall) | 347 (46.2%) | 404 (53.8%) |
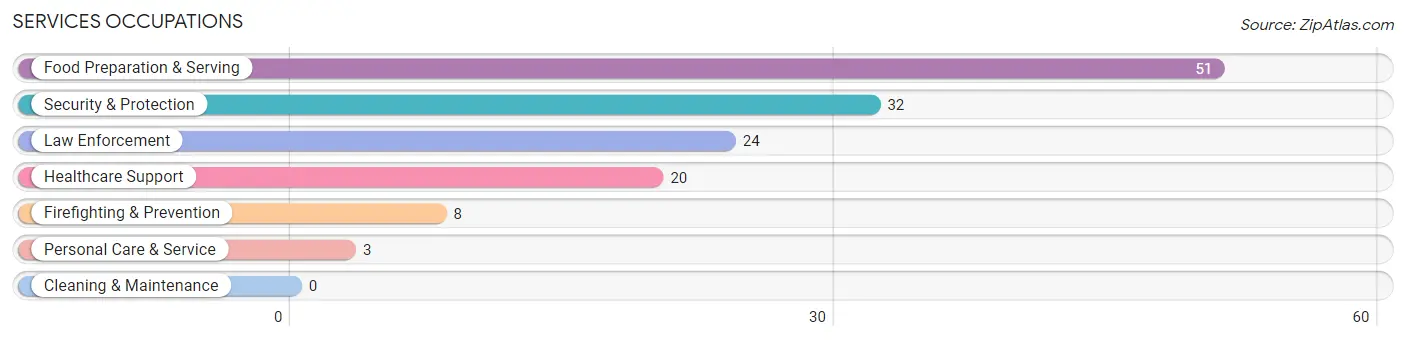
Services Occupations
The most common Services occupations in Quantico Base are Food Preparation & Serving (51 | 6.8%), Security & Protection (32 | 4.3%), Law Enforcement (24 | 3.2%), Healthcare Support (20 | 2.7%), and Firefighting & Prevention (8 | 1.1%).
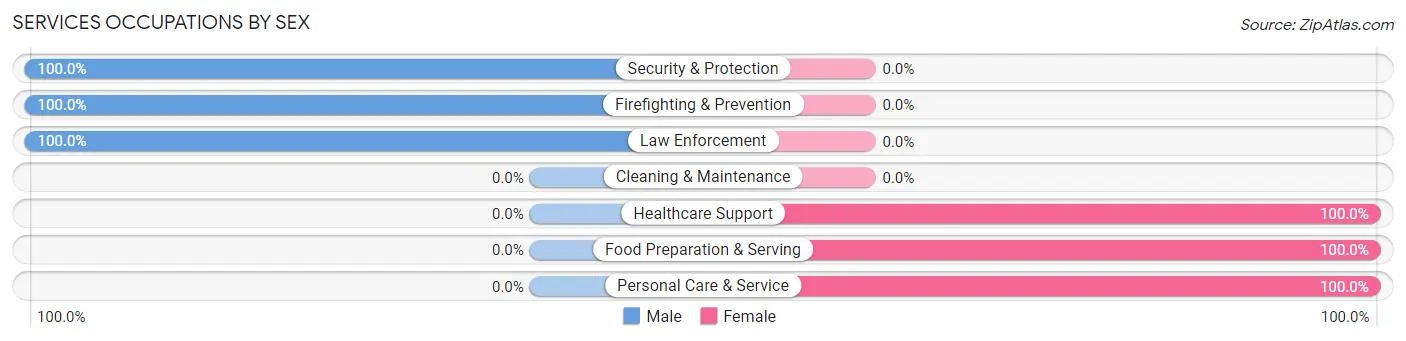
Services Occupations by Sex
Within the Services occupations in Quantico Base, the most male-oriented occupations are Security & Protection (100.0%), Firefighting & Prevention (100.0%), and Law Enforcement (100.0%), while the most female-oriented occupations are Healthcare Support (100.0%), Food Preparation & Serving (100.0%), and Personal Care & Service (100.0%).
| Occupation | Male | Female |
| Healthcare Support | 0 (0.0%) | 20 (100.0%) |
| Security & Protection | 32 (100.0%) | 0 (0.0%) |
| Firefighting & Prevention | 8 (100.0%) | 0 (0.0%) |
| Law Enforcement | 24 (100.0%) | 0 (0.0%) |
| Food Preparation & Serving | 0 (0.0%) | 51 (100.0%) |
| Cleaning & Maintenance | 0 (0.0%) | 0 (0.0%) |
| Personal Care & Service | 0 (0.0%) | 3 (100.0%) |
| Total (Category) | 32 (30.2%) | 74 (69.8%) |
| Total (Overall) | 347 (46.2%) | 404 (53.8%) |
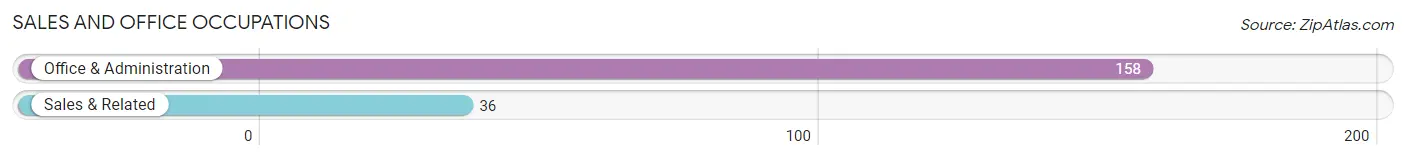
Sales and Office Occupations
The most common Sales and Office occupations in Quantico Base are Office & Administration (158 | 21.0%), and Sales & Related (36 | 4.8%).
Sales and Office Occupations by Sex
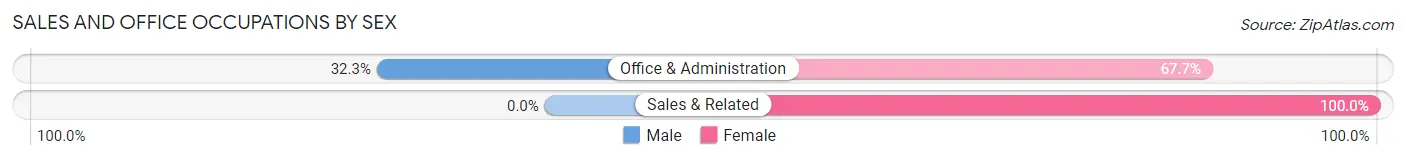
| Occupation | Male | Female |
| Sales & Related | 0 (0.0%) | 36 (100.0%) |
| Office & Administration | 51 (32.3%) | 107 (67.7%) |
| Total (Category) | 51 (26.3%) | 143 (73.7%) |
| Total (Overall) | 347 (46.2%) | 404 (53.8%) |
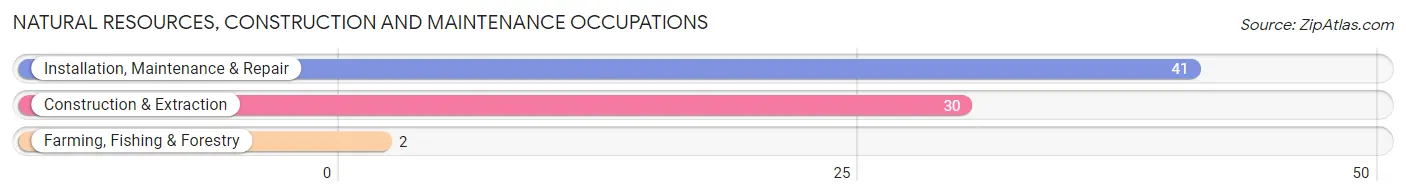
Natural Resources, Construction and Maintenance Occupations
The most common Natural Resources, Construction and Maintenance occupations in Quantico Base are Installation, Maintenance & Repair (41 | 5.5%), Construction & Extraction (30 | 4.0%), and Farming, Fishing & Forestry (2 | 0.3%).
Natural Resources, Construction and Maintenance Occupations by Sex
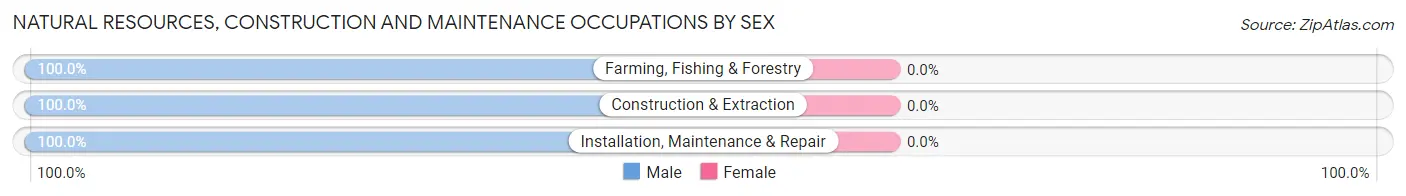
| Occupation | Male | Female |
| Farming, Fishing & Forestry | 2 (100.0%) | 0 (0.0%) |
| Construction & Extraction | 30 (100.0%) | 0 (0.0%) |
| Installation, Maintenance & Repair | 41 (100.0%) | 0 (0.0%) |
| Total (Category) | 73 (100.0%) | 0 (0.0%) |
| Total (Overall) | 347 (46.2%) | 404 (53.8%) |
Production, Transportation and Moving Occupations
The most common Production, Transportation and Moving occupations in Quantico Base are Production (25 | 3.3%), and Material Moving (11 | 1.5%).
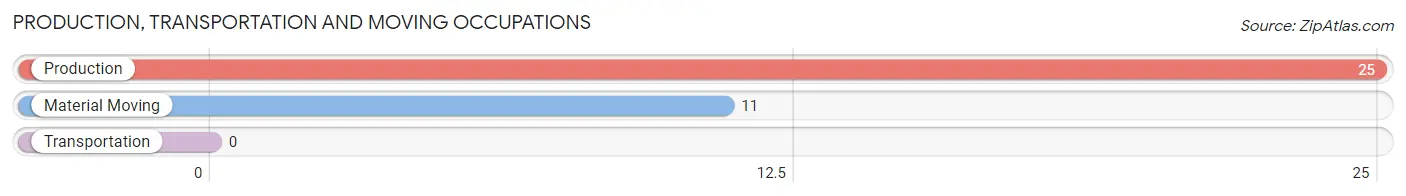
Production, Transportation and Moving Occupations by Sex
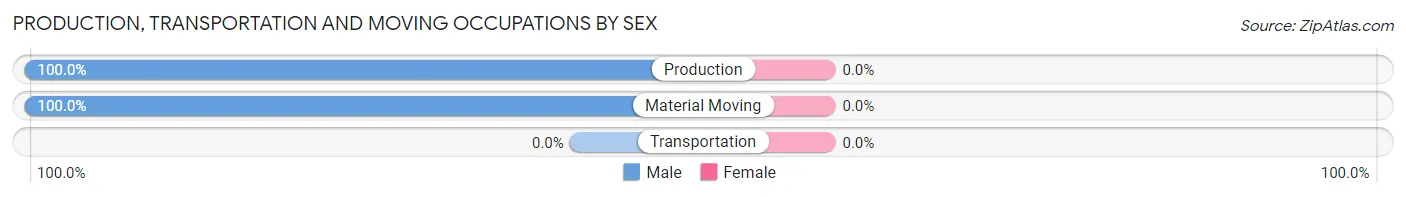
| Occupation | Male | Female |
| Production | 25 (100.0%) | 0 (0.0%) |
| Transportation | 0 (0.0%) | 0 (0.0%) |
| Material Moving | 11 (100.0%) | 0 (0.0%) |
| Total (Category) | 36 (100.0%) | 0 (0.0%) |
| Total (Overall) | 347 (46.2%) | 404 (53.8%) |
Employment Industries by Sex in Quantico Base
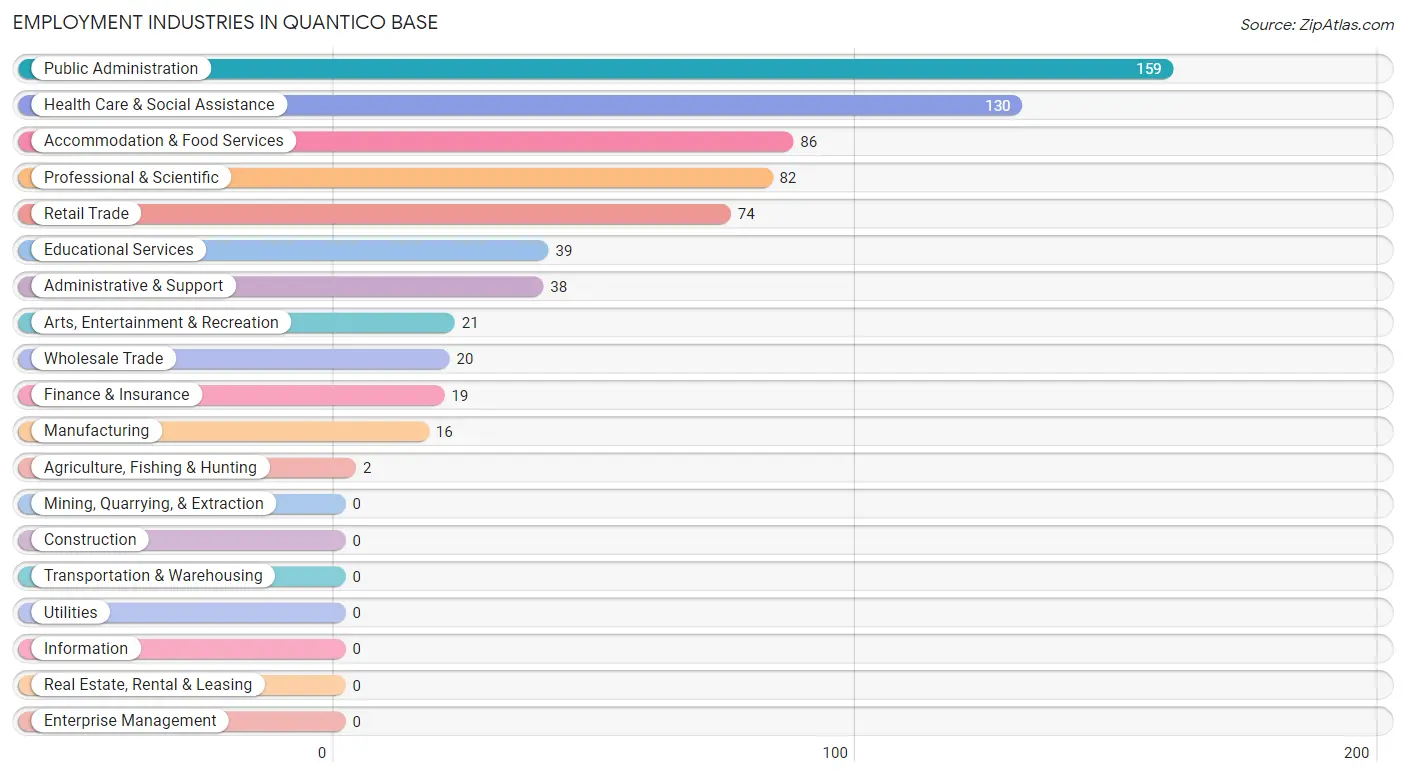
Employment Industries in Quantico Base
The major employment industries in Quantico Base include Public Administration (159 | 21.2%), Health Care & Social Assistance (130 | 17.3%), Accommodation & Food Services (86 | 11.5%), Professional & Scientific (82 | 10.9%), and Retail Trade (74 | 9.9%).
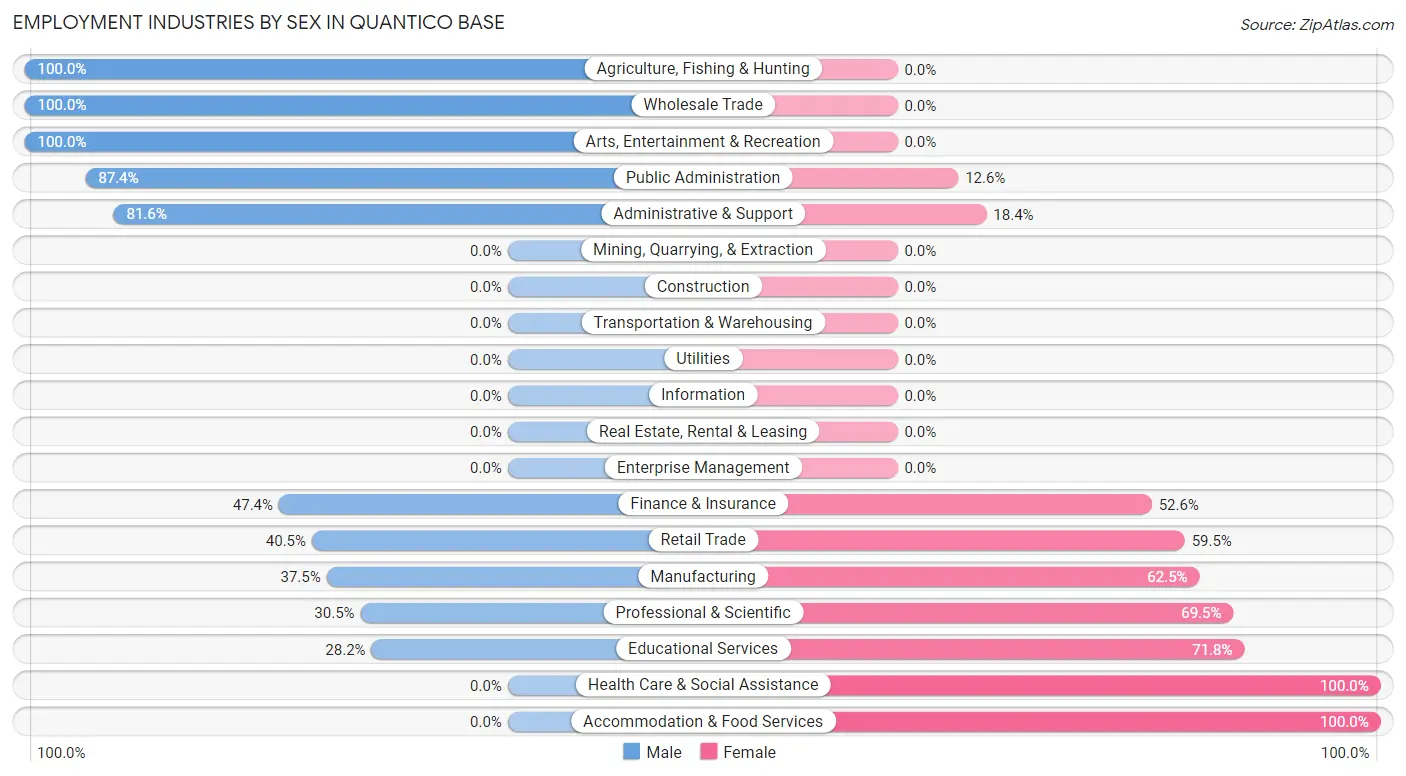
Employment Industries by Sex in Quantico Base
The Quantico Base industries that see more men than women are Agriculture, Fishing & Hunting (100.0%), Wholesale Trade (100.0%), and Arts, Entertainment & Recreation (100.0%), whereas the industries that tend to have a higher number of women are Health Care & Social Assistance (100.0%), Accommodation & Food Services (100.0%), and Educational Services (71.8%).
| Industry | Male | Female |
| Agriculture, Fishing & Hunting | 2 (100.0%) | 0 (0.0%) |
| Mining, Quarrying, & Extraction | 0 (0.0%) | 0 (0.0%) |
| Construction | 0 (0.0%) | 0 (0.0%) |
| Manufacturing | 6 (37.5%) | 10 (62.5%) |
| Wholesale Trade | 20 (100.0%) | 0 (0.0%) |
| Retail Trade | 30 (40.5%) | 44 (59.5%) |
| Transportation & Warehousing | 0 (0.0%) | 0 (0.0%) |
| Utilities | 0 (0.0%) | 0 (0.0%) |
| Information | 0 (0.0%) | 0 (0.0%) |
| Finance & Insurance | 9 (47.4%) | 10 (52.6%) |
| Real Estate, Rental & Leasing | 0 (0.0%) | 0 (0.0%) |
| Professional & Scientific | 25 (30.5%) | 57 (69.5%) |
| Enterprise Management | 0 (0.0%) | 0 (0.0%) |
| Administrative & Support | 31 (81.6%) | 7 (18.4%) |
| Educational Services | 11 (28.2%) | 28 (71.8%) |
| Health Care & Social Assistance | 0 (0.0%) | 130 (100.0%) |
| Arts, Entertainment & Recreation | 21 (100.0%) | 0 (0.0%) |
| Accommodation & Food Services | 0 (0.0%) | 86 (100.0%) |
| Public Administration | 139 (87.4%) | 20 (12.6%) |
| Total | 347 (46.2%) | 404 (53.8%) |
Education in Quantico Base
School Enrollment in Quantico Base
The most common levels of schooling among the 1,624 students in Quantico Base are college / undergraduate (594 | 36.6%), elementary school (409 | 25.2%), and nursery / preschool (220 | 13.6%).
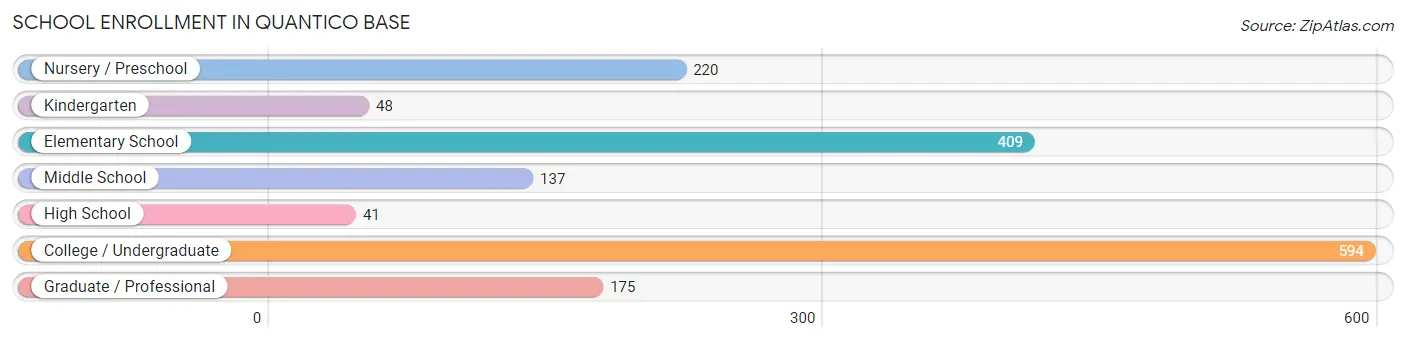
| School Level | # Students | % Students |
| Nursery / Preschool | 220 | 13.6% |
| Kindergarten | 48 | 3.0% |
| Elementary School | 409 | 25.2% |
| Middle School | 137 | 8.4% |
| High School | 41 | 2.5% |
| College / Undergraduate | 594 | 36.6% |
| Graduate / Professional | 175 | 10.8% |
| Total | 1,624 | 100.0% |
School Enrollment by Age by Funding Source in Quantico Base
Out of a total of 1,624 students who are enrolled in schools in Quantico Base, 387 (23.8%) attend a private institution, while the remaining 1,237 (76.2%) are enrolled in public schools. The age group of 35 years and over has the highest likelihood of being enrolled in private schools, with 50 (43.1% in the age bracket) enrolled. Conversely, the age group of 15 to 17 year olds has the lowest likelihood of being enrolled in a private school, with 41 (100.0% in the age bracket) attending a public institution.
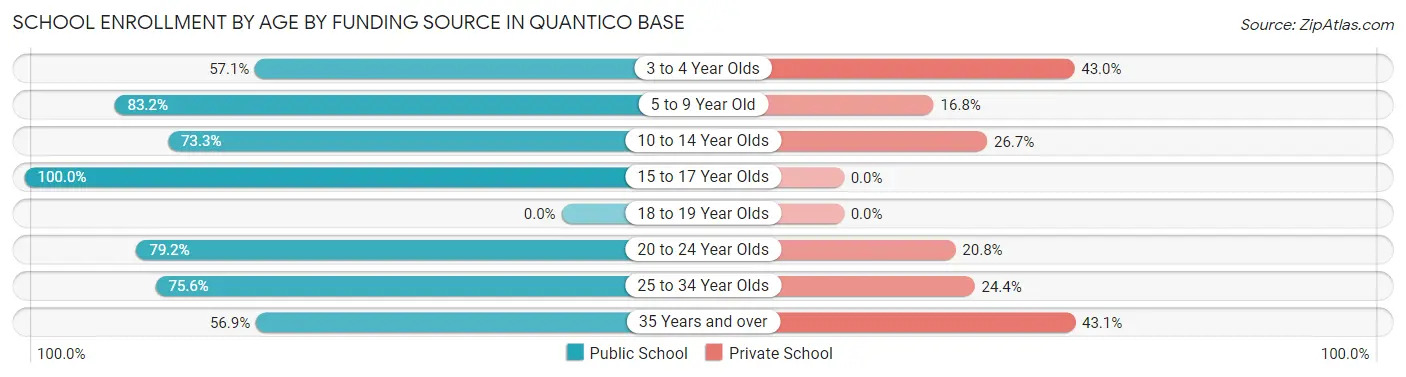
| Age Bracket | Public School | Private School |
| 3 to 4 Year Olds | 85 (57.1%) | 64 (42.9%) |
| 5 to 9 Year Old | 432 (83.2%) | 87 (16.8%) |
| 10 to 14 Year Olds | 107 (73.3%) | 39 (26.7%) |
| 15 to 17 Year Olds | 41 (100.0%) | 0 (0.0%) |
| 18 to 19 Year Olds | 0 (0.0%) | 0 (0.0%) |
| 20 to 24 Year Olds | 293 (79.2%) | 77 (20.8%) |
| 25 to 34 Year Olds | 214 (75.6%) | 69 (24.4%) |
| 35 Years and over | 66 (56.9%) | 50 (43.1%) |
| Total | 1,237 (76.2%) | 387 (23.8%) |
Educational Attainment by Field of Study in Quantico Base
Arts & humanities (184 | 19.7%), social sciences (158 | 16.9%), business (137 | 14.6%), computers & mathematics (94 | 10.0%), and communications (64 | 6.8%) are the most common fields of study among 936 individuals in Quantico Base who have obtained a bachelor's degree or higher.
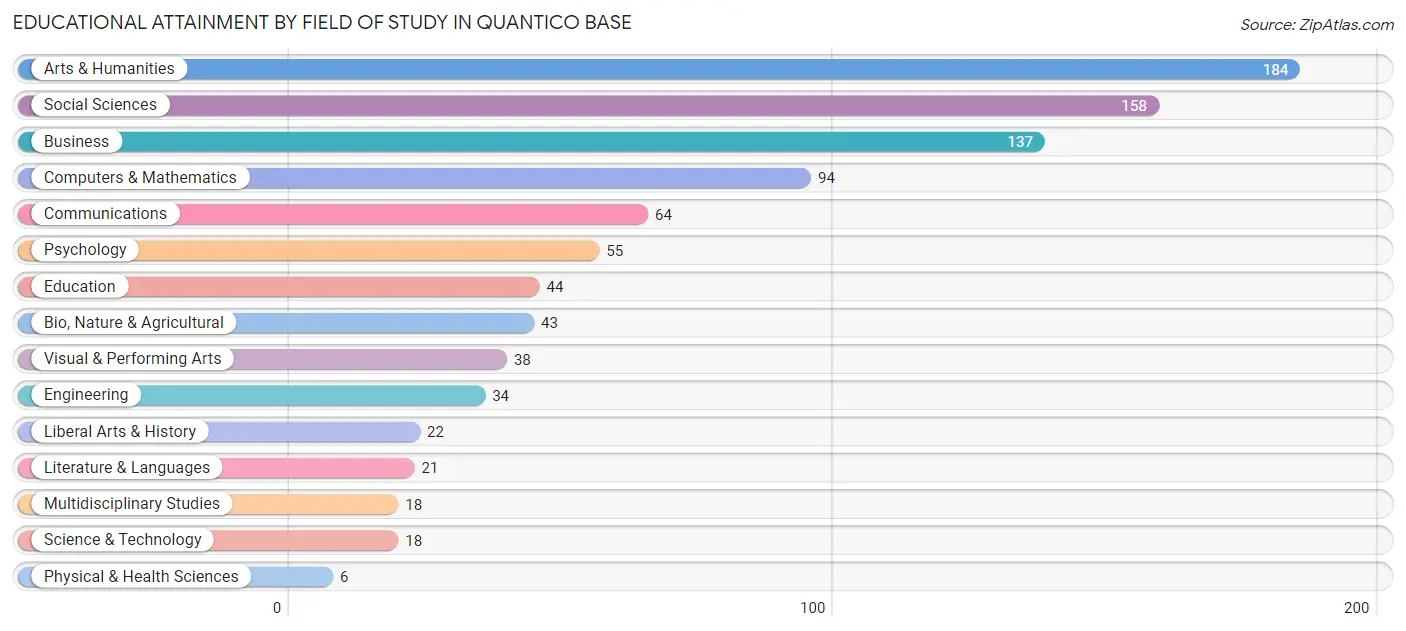
| Field of Study | # Graduates | % Graduates |
| Computers & Mathematics | 94 | 10.0% |
| Bio, Nature & Agricultural | 43 | 4.6% |
| Physical & Health Sciences | 6 | 0.6% |
| Psychology | 55 | 5.9% |
| Social Sciences | 158 | 16.9% |
| Engineering | 34 | 3.6% |
| Multidisciplinary Studies | 18 | 1.9% |
| Science & Technology | 18 | 1.9% |
| Business | 137 | 14.6% |
| Education | 44 | 4.7% |
| Literature & Languages | 21 | 2.2% |
| Liberal Arts & History | 22 | 2.4% |
| Visual & Performing Arts | 38 | 4.1% |
| Communications | 64 | 6.8% |
| Arts & Humanities | 184 | 19.7% |
| Total | 936 | 100.0% |
Transportation & Commute in Quantico Base
Vehicle Availability by Sex in Quantico Base
The most prevalent vehicle ownership categories in Quantico Base are males with 2 vehicles (680, accounting for 70.8%) and females with 2 vehicles (323, making up 139.3%).
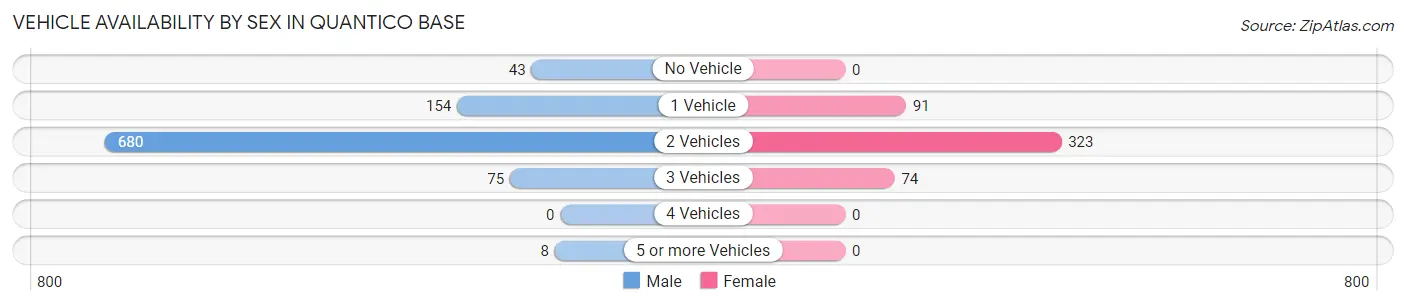
| Vehicles Available | Male | Female |
| No Vehicle | 43 (4.5%) | 0 (0.0%) |
| 1 Vehicle | 154 (16.0%) | 91 (18.6%) |
| 2 Vehicles | 680 (70.8%) | 323 (66.2%) |
| 3 Vehicles | 75 (7.8%) | 74 (15.2%) |
| 4 Vehicles | 0 (0.0%) | 0 (0.0%) |
| 5 or more Vehicles | 8 (0.8%) | 0 (0.0%) |
| Total | 960 (100.0%) | 488 (100.0%) |
Commute Time in Quantico Base
The most frequently occuring commute durations in Quantico Base are 5 to 9 minutes (1,160 commuters, 38.1%), 15 to 19 minutes (446 commuters, 14.6%), and less than 5 minutes (420 commuters, 13.8%).
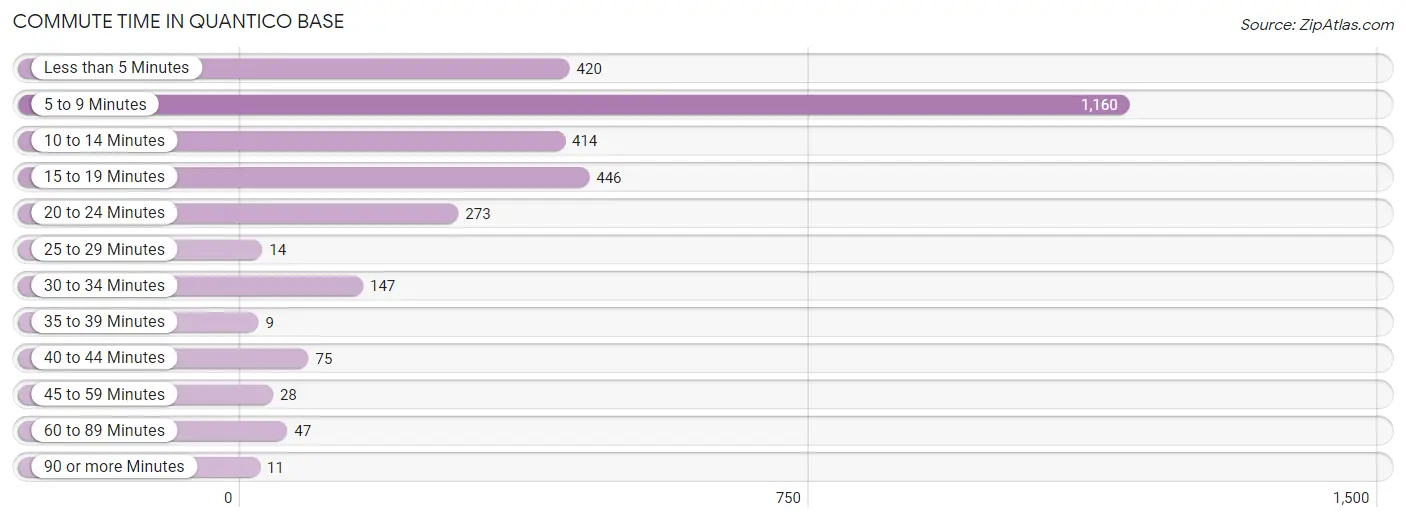
| Commute Time | # Commuters | % Commuters |
| Less than 5 Minutes | 420 | 13.8% |
| 5 to 9 Minutes | 1,160 | 38.1% |
| 10 to 14 Minutes | 414 | 13.6% |
| 15 to 19 Minutes | 446 | 14.6% |
| 20 to 24 Minutes | 273 | 9.0% |
| 25 to 29 Minutes | 14 | 0.5% |
| 30 to 34 Minutes | 147 | 4.8% |
| 35 to 39 Minutes | 9 | 0.3% |
| 40 to 44 Minutes | 75 | 2.5% |
| 45 to 59 Minutes | 28 | 0.9% |
| 60 to 89 Minutes | 47 | 1.5% |
| 90 or more Minutes | 11 | 0.4% |
Commute Time by Sex in Quantico Base
The most common commute times in Quantico Base are 5 to 9 minutes (964 commuters, 41.1%) for males and 5 to 9 minutes (196 commuters, 28.0%) for females.
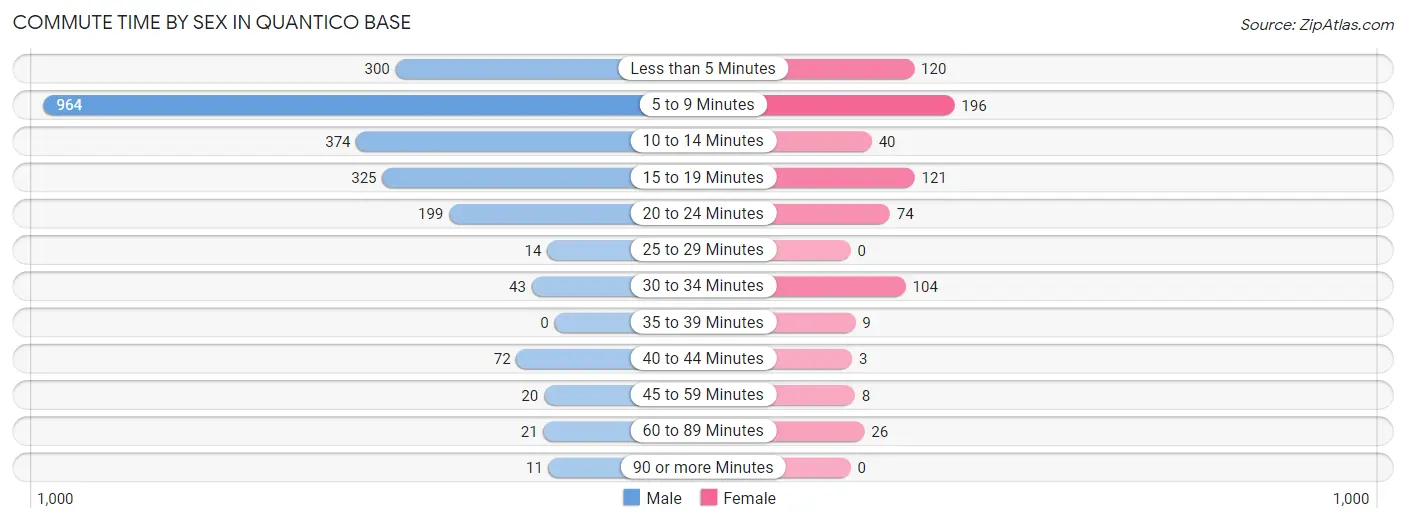
| Commute Time | Male | Female |
| Less than 5 Minutes | 300 (12.8%) | 120 (17.1%) |
| 5 to 9 Minutes | 964 (41.1%) | 196 (28.0%) |
| 10 to 14 Minutes | 374 (16.0%) | 40 (5.7%) |
| 15 to 19 Minutes | 325 (13.9%) | 121 (17.3%) |
| 20 to 24 Minutes | 199 (8.5%) | 74 (10.6%) |
| 25 to 29 Minutes | 14 (0.6%) | 0 (0.0%) |
| 30 to 34 Minutes | 43 (1.8%) | 104 (14.8%) |
| 35 to 39 Minutes | 0 (0.0%) | 9 (1.3%) |
| 40 to 44 Minutes | 72 (3.1%) | 3 (0.4%) |
| 45 to 59 Minutes | 20 (0.9%) | 8 (1.1%) |
| 60 to 89 Minutes | 21 (0.9%) | 26 (3.7%) |
| 90 or more Minutes | 11 (0.5%) | 0 (0.0%) |
Time of Departure to Work by Sex in Quantico Base
The most frequent times of departure to work in Quantico Base are 7:30 AM to 7:59 AM (707, 30.2%) for males and 7:00 AM to 7:29 AM (180, 25.7%) for females.
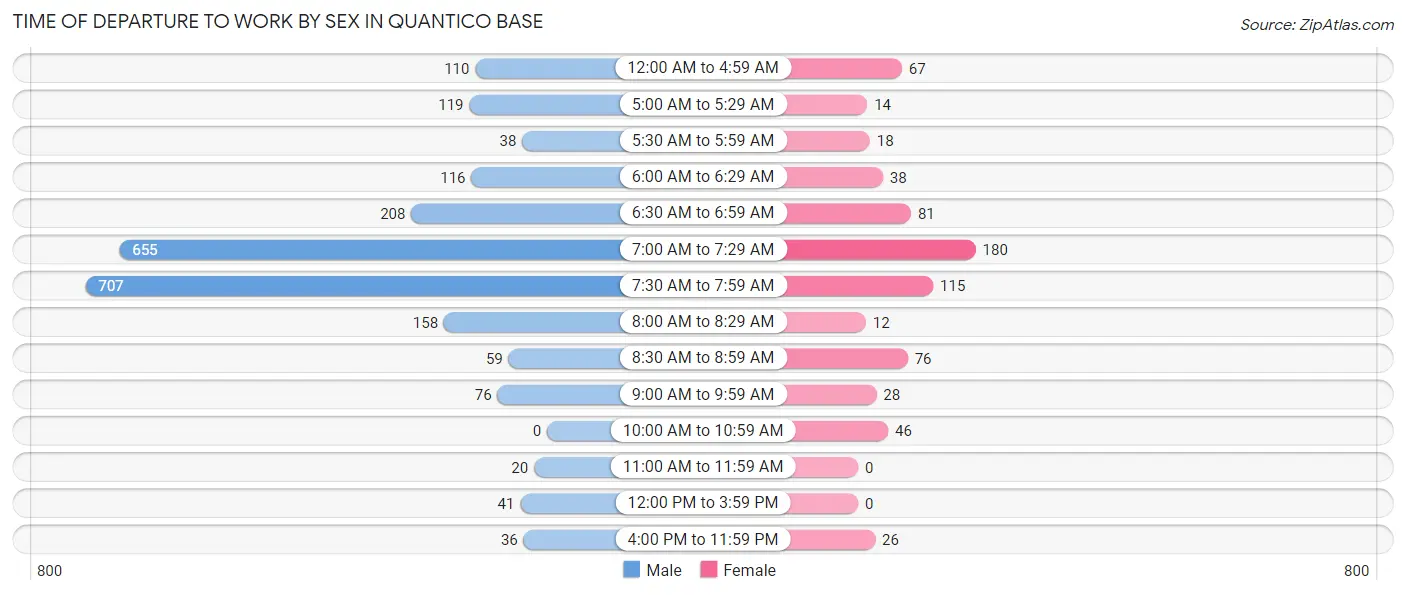
| Time of Departure | Male | Female |
| 12:00 AM to 4:59 AM | 110 (4.7%) | 67 (9.6%) |
| 5:00 AM to 5:29 AM | 119 (5.1%) | 14 (2.0%) |
| 5:30 AM to 5:59 AM | 38 (1.6%) | 18 (2.6%) |
| 6:00 AM to 6:29 AM | 116 (5.0%) | 38 (5.4%) |
| 6:30 AM to 6:59 AM | 208 (8.9%) | 81 (11.6%) |
| 7:00 AM to 7:29 AM | 655 (28.0%) | 180 (25.7%) |
| 7:30 AM to 7:59 AM | 707 (30.2%) | 115 (16.4%) |
| 8:00 AM to 8:29 AM | 158 (6.7%) | 12 (1.7%) |
| 8:30 AM to 8:59 AM | 59 (2.5%) | 76 (10.8%) |
| 9:00 AM to 9:59 AM | 76 (3.2%) | 28 (4.0%) |
| 10:00 AM to 10:59 AM | 0 (0.0%) | 46 (6.6%) |
| 11:00 AM to 11:59 AM | 20 (0.9%) | 0 (0.0%) |
| 12:00 PM to 3:59 PM | 41 (1.8%) | 0 (0.0%) |
| 4:00 PM to 11:59 PM | 36 (1.5%) | 26 (3.7%) |
| Total | 2,343 (100.0%) | 701 (100.0%) |
Housing Occupancy in Quantico Base
Occupancy by Ownership in Quantico Base
Of the total 1,097 dwellings in Quantico Base, owner-occupied units account for 10 (0.9%), while renter-occupied units make up 1,087 (99.1%).
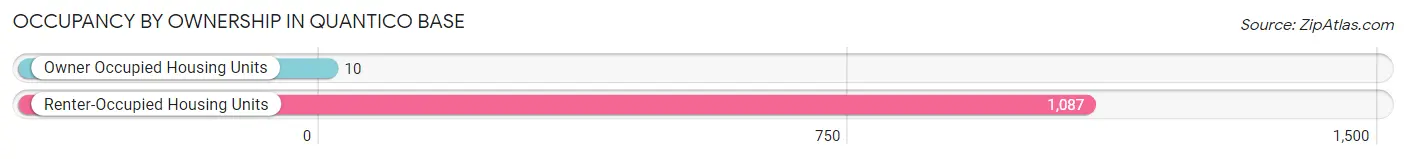
| Occupancy | # Housing Units | % Housing Units |
| Owner Occupied Housing Units | 10 | 0.9% |
| Renter-Occupied Housing Units | 1,087 | 99.1% |
| Total Occupied Housing Units | 1,097 | 100.0% |
Occupancy by Household Size in Quantico Base
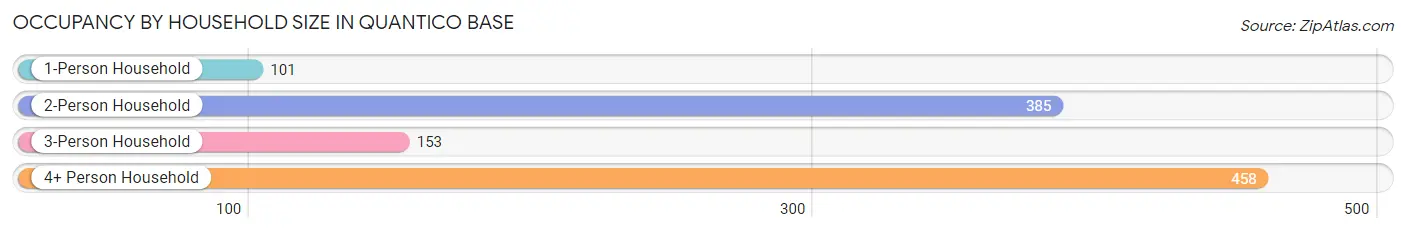
| Household Size | # Housing Units | % Housing Units |
| 1-Person Household | 101 | 9.2% |
| 2-Person Household | 385 | 35.1% |
| 3-Person Household | 153 | 14.0% |
| 4+ Person Household | 458 | 41.7% |
| Total Housing Units | 1,097 | 100.0% |
Occupancy by Ownership by Household Size in Quantico Base
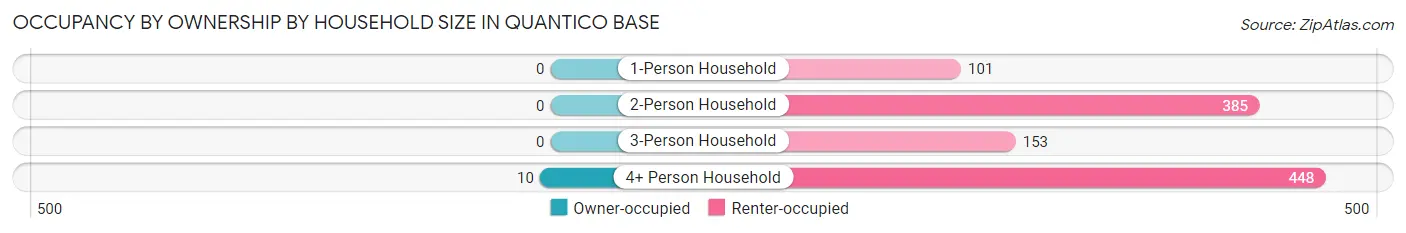
| Household Size | Owner-occupied | Renter-occupied |
| 1-Person Household | 0 (0.0%) | 101 (100.0%) |
| 2-Person Household | 0 (0.0%) | 385 (100.0%) |
| 3-Person Household | 0 (0.0%) | 153 (100.0%) |
| 4+ Person Household | 10 (2.2%) | 448 (97.8%) |
| Total Housing Units | 10 (0.9%) | 1,087 (99.1%) |
Occupancy by Educational Attainment in Quantico Base
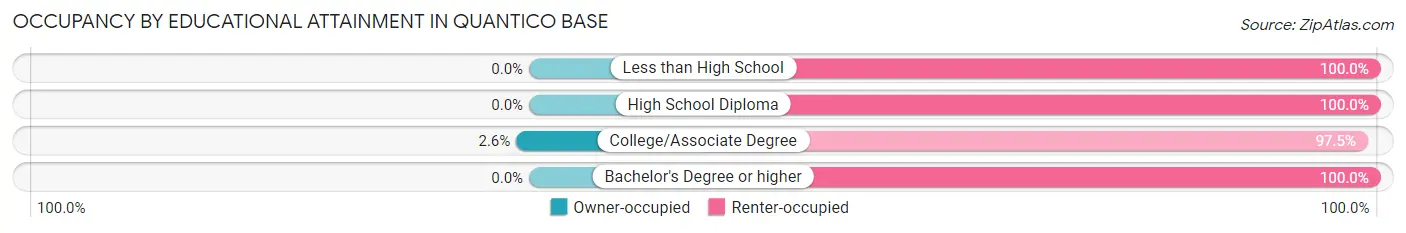
| Household Size | Owner-occupied | Renter-occupied |
| Less than High School | 0 (0.0%) | 5 (100.0%) |
| High School Diploma | 0 (0.0%) | 277 (100.0%) |
| College/Associate Degree | 10 (2.5%) | 382 (97.5%) |
| Bachelor's Degree or higher | 0 (0.0%) | 423 (100.0%) |
Occupancy by Age of Householder in Quantico Base
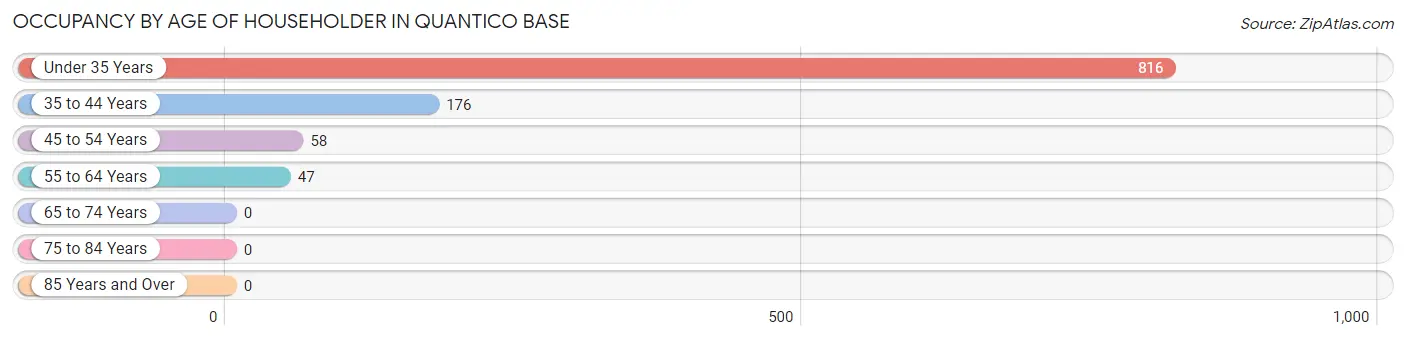
| Age Bracket | # Households | % Households |
| Under 35 Years | 816 | 74.4% |
| 35 to 44 Years | 176 | 16.0% |
| 45 to 54 Years | 58 | 5.3% |
| 55 to 64 Years | 47 | 4.3% |
| 65 to 74 Years | 0 | 0.0% |
| 75 to 84 Years | 0 | 0.0% |
| 85 Years and Over | 0 | 0.0% |
| Total | 1,097 | 100.0% |
Housing Finances in Quantico Base
Median Income by Occupancy in Quantico Base
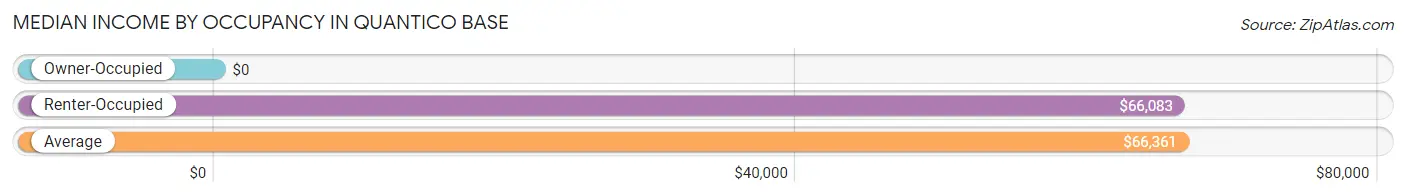
| Occupancy Type | # Households | Median Income |
| Owner-Occupied | 10 (0.9%) | $0 |
| Renter-Occupied | 1,087 (99.1%) | $66,083 |
| Average | 1,097 (100.0%) | $66,361 |
Occupancy by Householder Income Bracket in Quantico Base
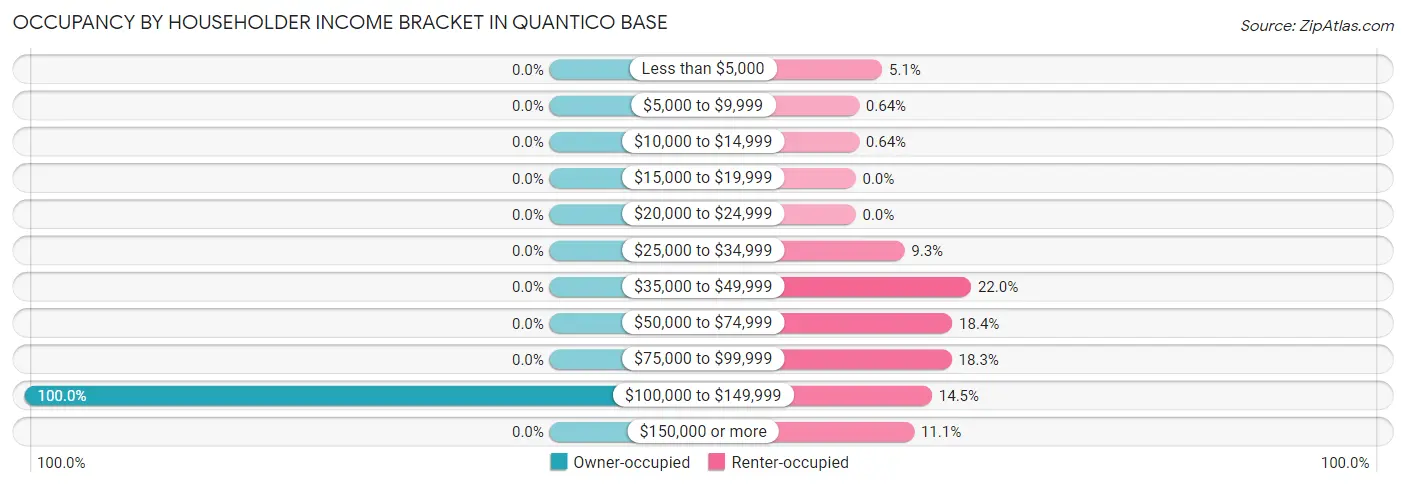
| Income Bracket | Owner-occupied | Renter-occupied |
| Less than $5,000 | 0 (0.0%) | 55 (5.1%) |
| $5,000 to $9,999 | 0 (0.0%) | 7 (0.6%) |
| $10,000 to $14,999 | 0 (0.0%) | 7 (0.6%) |
| $15,000 to $19,999 | 0 (0.0%) | 0 (0.0%) |
| $20,000 to $24,999 | 0 (0.0%) | 0 (0.0%) |
| $25,000 to $34,999 | 0 (0.0%) | 101 (9.3%) |
| $35,000 to $49,999 | 0 (0.0%) | 239 (22.0%) |
| $50,000 to $74,999 | 0 (0.0%) | 200 (18.4%) |
| $75,000 to $99,999 | 0 (0.0%) | 199 (18.3%) |
| $100,000 to $149,999 | 10 (100.0%) | 158 (14.5%) |
| $150,000 or more | 0 (0.0%) | 121 (11.1%) |
| Total | 10 (100.0%) | 1,087 (100.0%) |
Monthly Housing Cost Tiers in Quantico Base
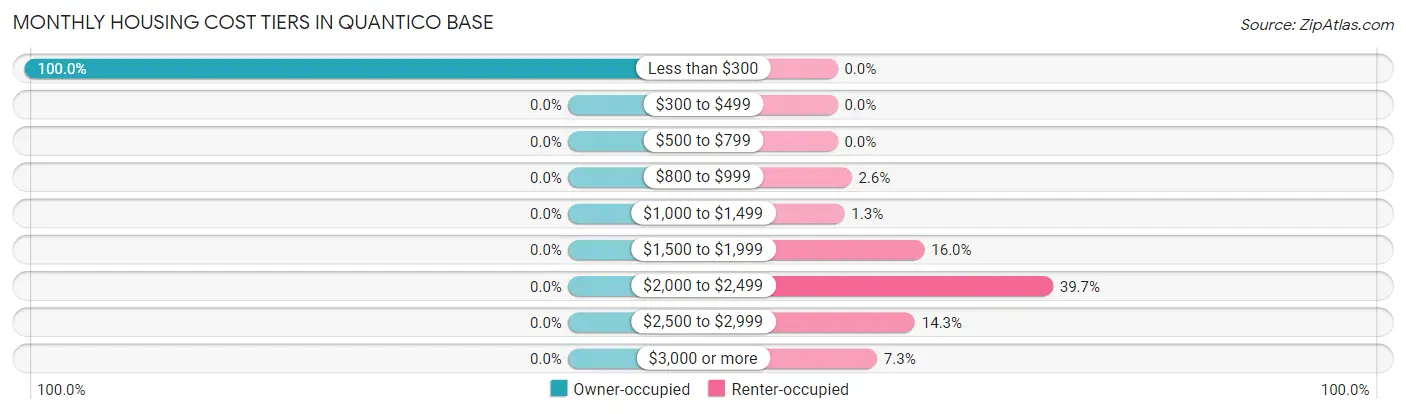
| Monthly Cost | Owner-occupied | Renter-occupied |
| Less than $300 | 10 (100.0%) | 0 (0.0%) |
| $300 to $499 | 0 (0.0%) | 0 (0.0%) |
| $500 to $799 | 0 (0.0%) | 0 (0.0%) |
| $800 to $999 | 0 (0.0%) | 28 (2.6%) |
| $1,000 to $1,499 | 0 (0.0%) | 14 (1.3%) |
| $1,500 to $1,999 | 0 (0.0%) | 174 (16.0%) |
| $2,000 to $2,499 | 0 (0.0%) | 431 (39.7%) |
| $2,500 to $2,999 | 0 (0.0%) | 155 (14.3%) |
| $3,000 or more | 0 (0.0%) | 79 (7.3%) |
| Total | 10 (100.0%) | 1,087 (100.0%) |
Physical Housing Characteristics in Quantico Base
Housing Structures in Quantico Base
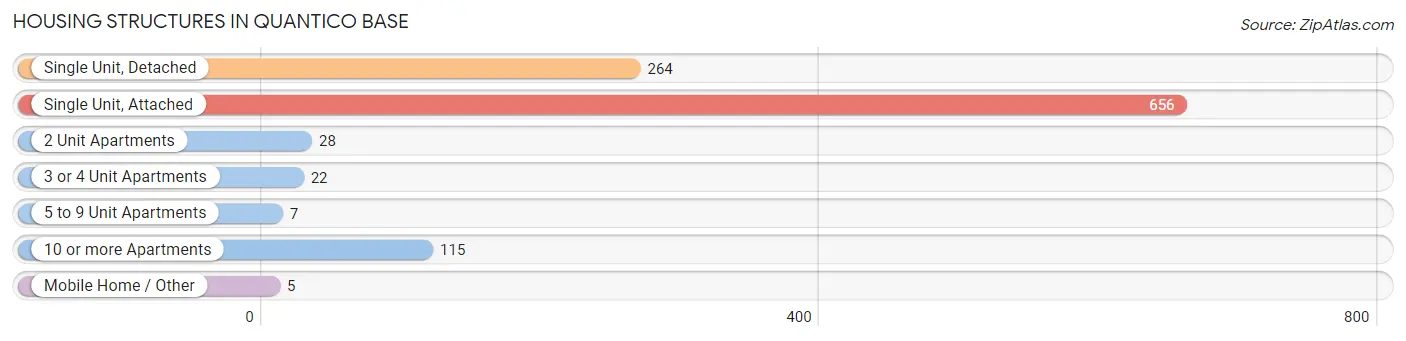
| Structure Type | # Housing Units | % Housing Units |
| Single Unit, Detached | 264 | 24.1% |
| Single Unit, Attached | 656 | 59.8% |
| 2 Unit Apartments | 28 | 2.5% |
| 3 or 4 Unit Apartments | 22 | 2.0% |
| 5 to 9 Unit Apartments | 7 | 0.6% |
| 10 or more Apartments | 115 | 10.5% |
| Mobile Home / Other | 5 | 0.5% |
| Total | 1,097 | 100.0% |
Housing Structures by Occupancy in Quantico Base
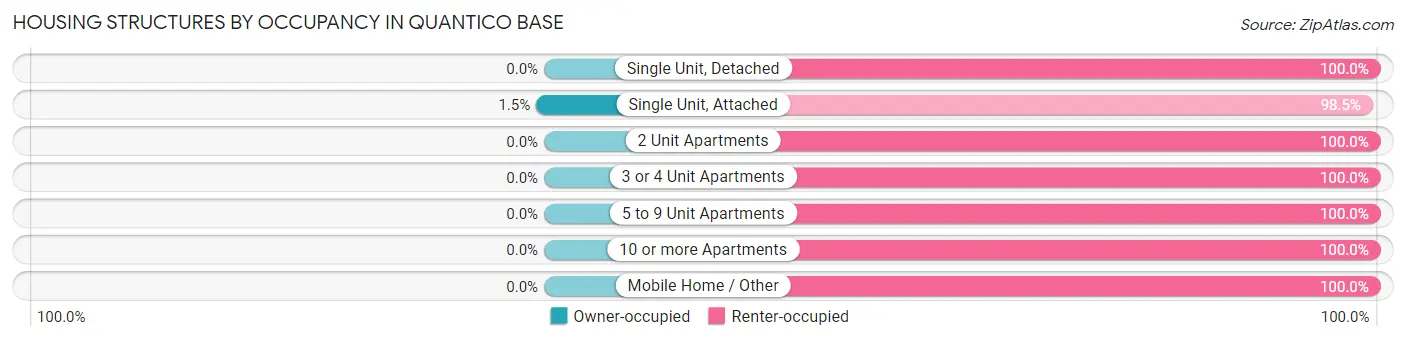
| Structure Type | Owner-occupied | Renter-occupied |
| Single Unit, Detached | 0 (0.0%) | 264 (100.0%) |
| Single Unit, Attached | 10 (1.5%) | 646 (98.5%) |
| 2 Unit Apartments | 0 (0.0%) | 28 (100.0%) |
| 3 or 4 Unit Apartments | 0 (0.0%) | 22 (100.0%) |
| 5 to 9 Unit Apartments | 0 (0.0%) | 7 (100.0%) |
| 10 or more Apartments | 0 (0.0%) | 115 (100.0%) |
| Mobile Home / Other | 0 (0.0%) | 5 (100.0%) |
| Total | 10 (0.9%) | 1,087 (99.1%) |
Housing Structures by Number of Rooms in Quantico Base
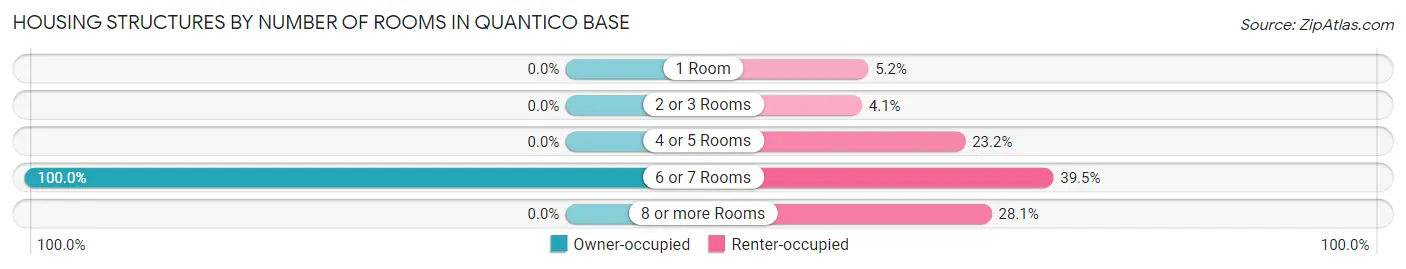
| Number of Rooms | Owner-occupied | Renter-occupied |
| 1 Room | 0 (0.0%) | 57 (5.2%) |
| 2 or 3 Rooms | 0 (0.0%) | 44 (4.1%) |
| 4 or 5 Rooms | 0 (0.0%) | 252 (23.2%) |
| 6 or 7 Rooms | 10 (100.0%) | 429 (39.5%) |
| 8 or more Rooms | 0 (0.0%) | 305 (28.1%) |
| Total | 10 (100.0%) | 1,087 (100.0%) |
Housing Structure by Heating Type in Quantico Base
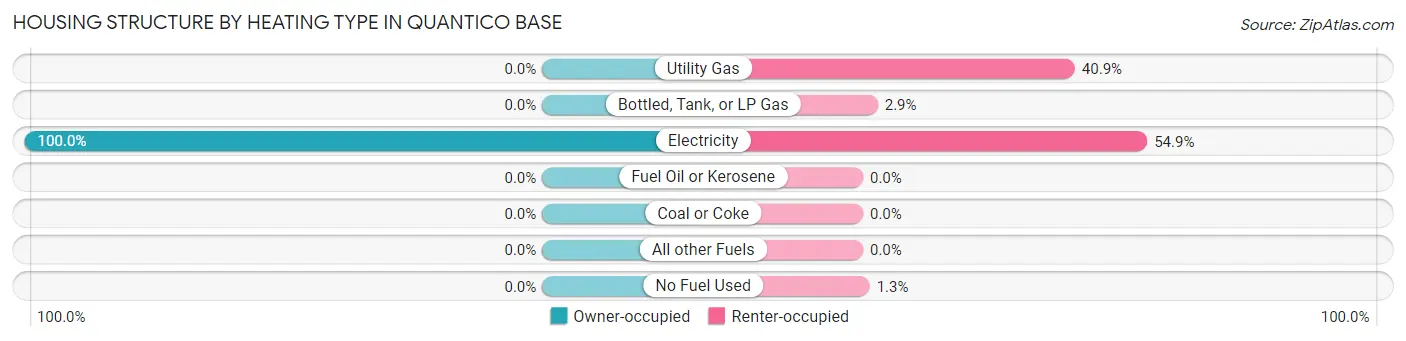
| Heating Type | Owner-occupied | Renter-occupied |
| Utility Gas | 0 (0.0%) | 445 (40.9%) |
| Bottled, Tank, or LP Gas | 0 (0.0%) | 31 (2.9%) |
| Electricity | 10 (100.0%) | 597 (54.9%) |
| Fuel Oil or Kerosene | 0 (0.0%) | 0 (0.0%) |
| Coal or Coke | 0 (0.0%) | 0 (0.0%) |
| All other Fuels | 0 (0.0%) | 0 (0.0%) |
| No Fuel Used | 0 (0.0%) | 14 (1.3%) |
| Total | 10 (100.0%) | 1,087 (100.0%) |
Household Vehicle Usage in Quantico Base
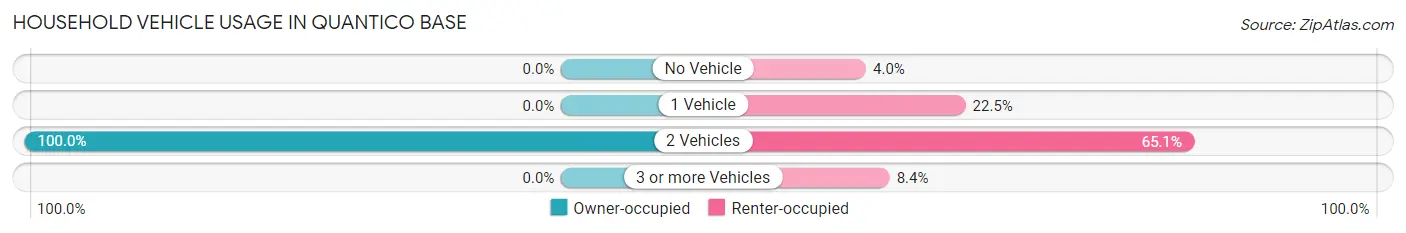
| Vehicles per Household | Owner-occupied | Renter-occupied |
| No Vehicle | 0 (0.0%) | 43 (4.0%) |
| 1 Vehicle | 0 (0.0%) | 245 (22.5%) |
| 2 Vehicles | 10 (100.0%) | 708 (65.1%) |
| 3 or more Vehicles | 0 (0.0%) | 91 (8.4%) |
| Total | 10 (100.0%) | 1,087 (100.0%) |
Real Estate & Mortgages in Quantico Base
Real Estate and Mortgage Overview in Quantico Base
| Characteristic | Without Mortgage | With Mortgage |
| Housing Units | 10 | 0 |
| Median Property Value | - | - |
| Median Household Income | - | - |
| Monthly Housing Costs | - | - |
| Real Estate Taxes | - | - |
Property Value by Mortgage Status in Quantico Base
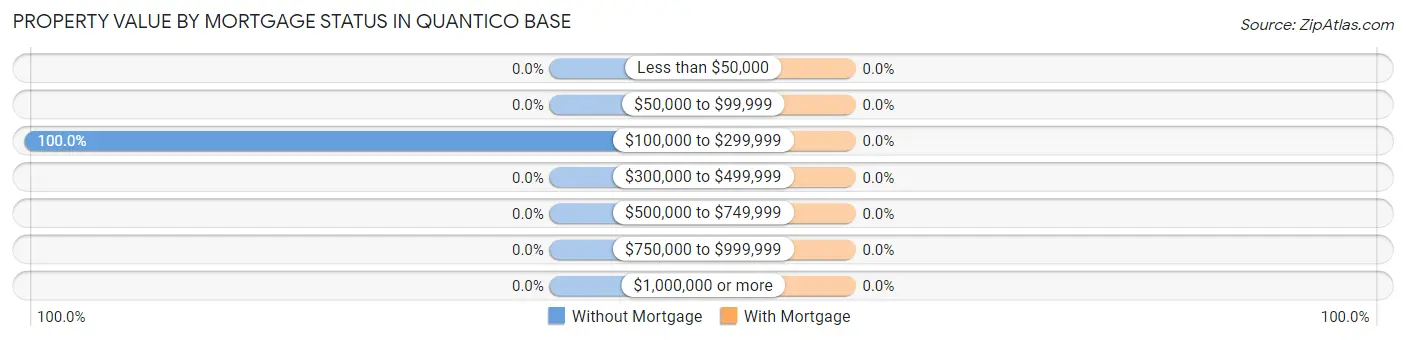
| Property Value | Without Mortgage | With Mortgage |
| Less than $50,000 | 0 (0.0%) | 0 (0.0%) |
| $50,000 to $99,999 | 0 (0.0%) | 0 (0.0%) |
| $100,000 to $299,999 | 10 (100.0%) | 0 (0.0%) |
| $300,000 to $499,999 | 0 (0.0%) | 0 (0.0%) |
| $500,000 to $749,999 | 0 (0.0%) | 0 (0.0%) |
| $750,000 to $999,999 | 0 (0.0%) | 0 (0.0%) |
| $1,000,000 or more | 0 (0.0%) | 0 (0.0%) |
| Total | 10 (100.0%) | 0 (0.0%) |
Household Income by Mortgage Status in Quantico Base
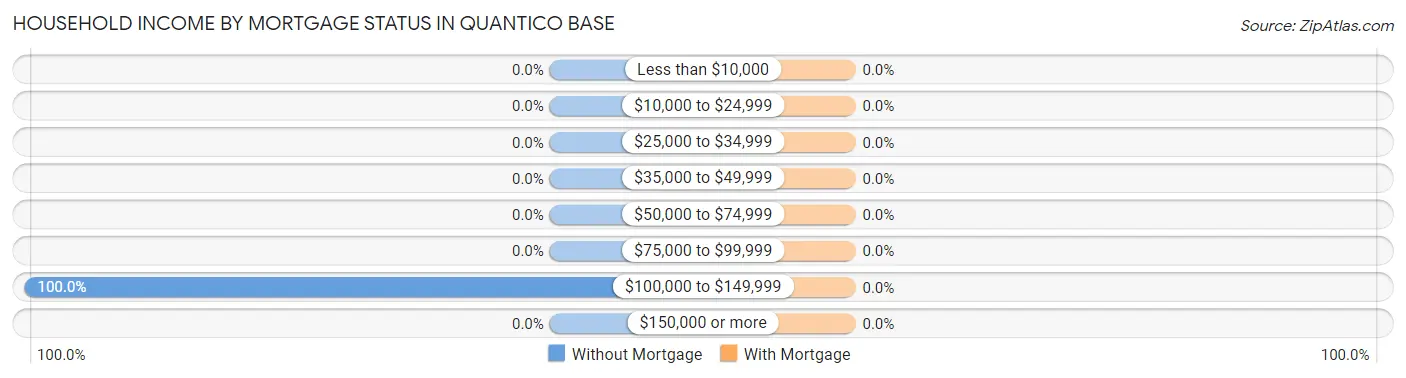
| Household Income | Without Mortgage | With Mortgage |
| Less than $10,000 | 0 (0.0%) | 0 (0.0%) |
| $10,000 to $24,999 | 0 (0.0%) | 0 (0.0%) |
| $25,000 to $34,999 | 0 (0.0%) | 0 (0.0%) |
| $35,000 to $49,999 | 0 (0.0%) | 0 (0.0%) |
| $50,000 to $74,999 | 0 (0.0%) | 0 (0.0%) |
| $75,000 to $99,999 | 0 (0.0%) | 0 (0.0%) |
| $100,000 to $149,999 | 10 (100.0%) | 0 (0.0%) |
| $150,000 or more | 0 (0.0%) | 0 (0.0%) |
| Total | 10 (100.0%) | 0 (0.0%) |
Property Value to Household Income Ratio in Quantico Base
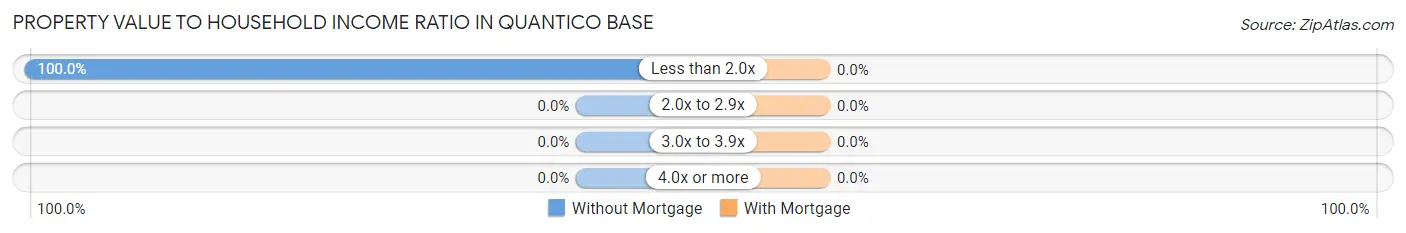
| Value-to-Income Ratio | Without Mortgage | With Mortgage |
| Less than 2.0x | 10 (100.0%) | 0 (0.0%) |
| 2.0x to 2.9x | 0 (0.0%) | 0 (0.0%) |
| 3.0x to 3.9x | 0 (0.0%) | 0 (0.0%) |
| 4.0x or more | 0 (0.0%) | 0 (0.0%) |
| Total | 10 (100.0%) | 0 (0.0%) |
Real Estate Taxes by Mortgage Status in Quantico Base
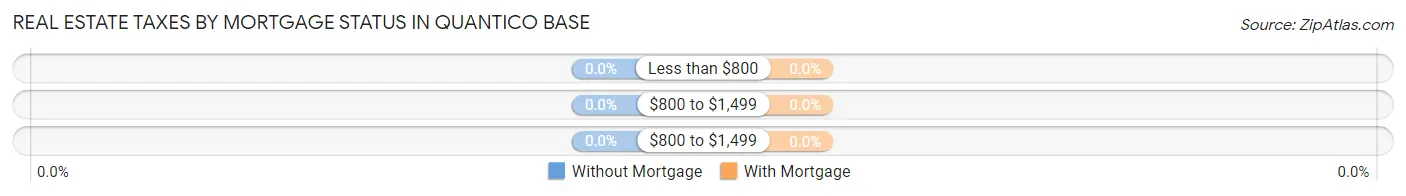
| Property Taxes | Without Mortgage | With Mortgage |
| Less than $800 | 0 (0.0%) | 0 (0.0%) |
| $800 to $1,499 | 0 (0.0%) | 0 (0.0%) |
| $800 to $1,499 | 0 (0.0%) | 0 (0.0%) |
| Total | 10 (100.0%) | 0 (0.0%) |
Health & Disability in Quantico Base
Health Insurance Coverage by Age in Quantico Base
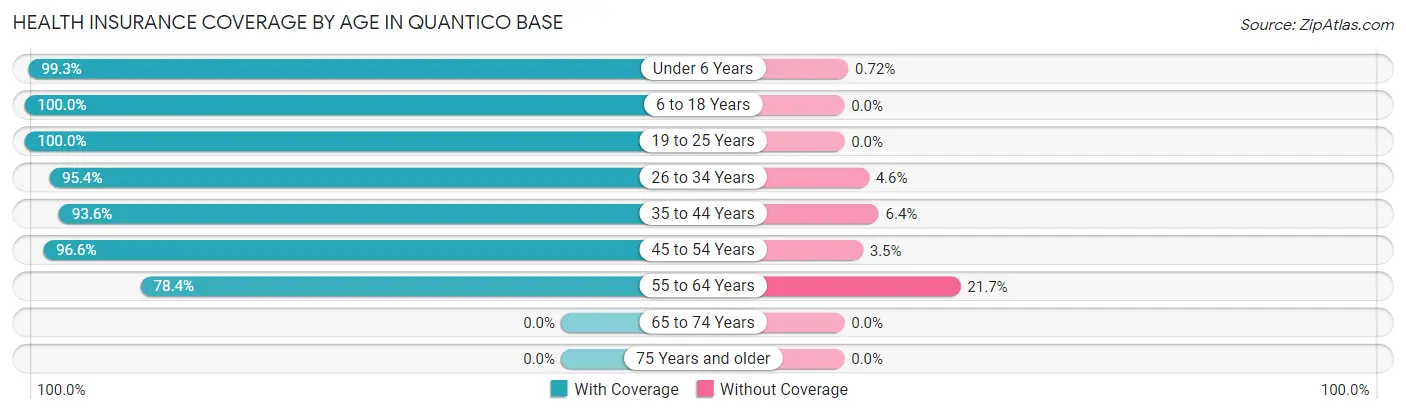
| Age Bracket | With Coverage | Without Coverage |
| Under 6 Years | 829 (99.3%) | 6 (0.7%) |
| 6 to 18 Years | 591 (100.0%) | 0 (0.0%) |
| 19 to 25 Years | 286 (100.0%) | 0 (0.0%) |
| 26 to 34 Years | 523 (95.4%) | 25 (4.6%) |
| 35 to 44 Years | 190 (93.6%) | 13 (6.4%) |
| 45 to 54 Years | 56 (96.6%) | 2 (3.5%) |
| 55 to 64 Years | 76 (78.3%) | 21 (21.6%) |
| 65 to 74 Years | 0 (0.0%) | 0 (0.0%) |
| 75 Years and older | 0 (0.0%) | 0 (0.0%) |
| Total | 2,551 (97.4%) | 67 (2.6%) |
Health Insurance Coverage by Citizenship Status in Quantico Base
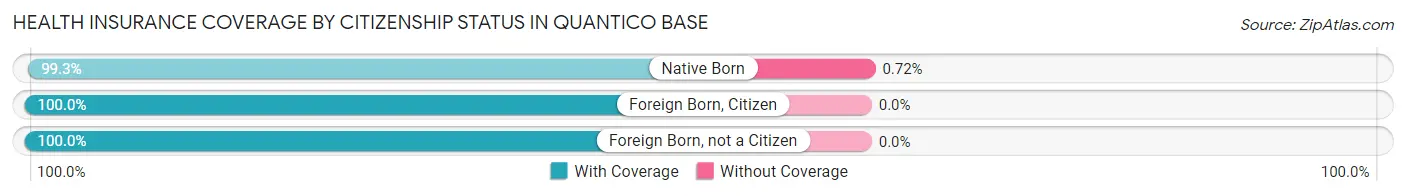
| Citizenship Status | With Coverage | Without Coverage |
| Native Born | 829 (99.3%) | 6 (0.7%) |
| Foreign Born, Citizen | 591 (100.0%) | 0 (0.0%) |
| Foreign Born, not a Citizen | 286 (100.0%) | 0 (0.0%) |
Health Insurance Coverage by Household Income in Quantico Base
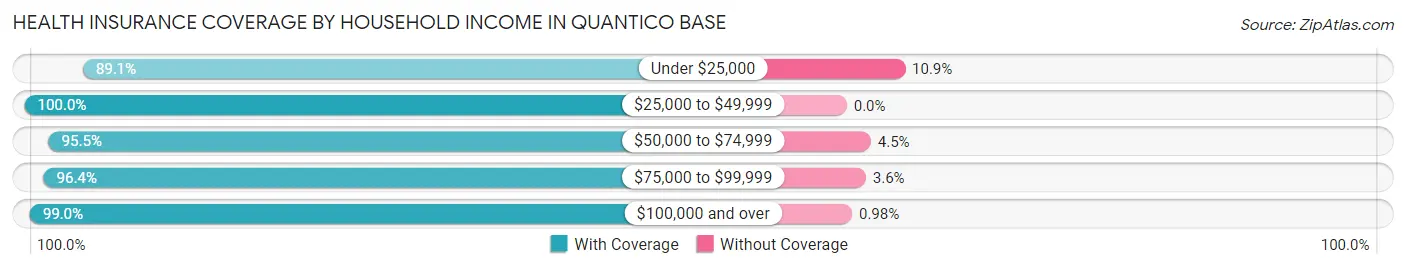
| Household Income | With Coverage | Without Coverage |
| Under $25,000 | 155 (89.1%) | 19 (10.9%) |
| $25,000 to $49,999 | 652 (100.0%) | 0 (0.0%) |
| $50,000 to $74,999 | 360 (95.5%) | 17 (4.5%) |
| $75,000 to $99,999 | 567 (96.4%) | 21 (3.6%) |
| $100,000 and over | 811 (99.0%) | 8 (1.0%) |
Public vs Private Health Insurance Coverage by Age in Quantico Base
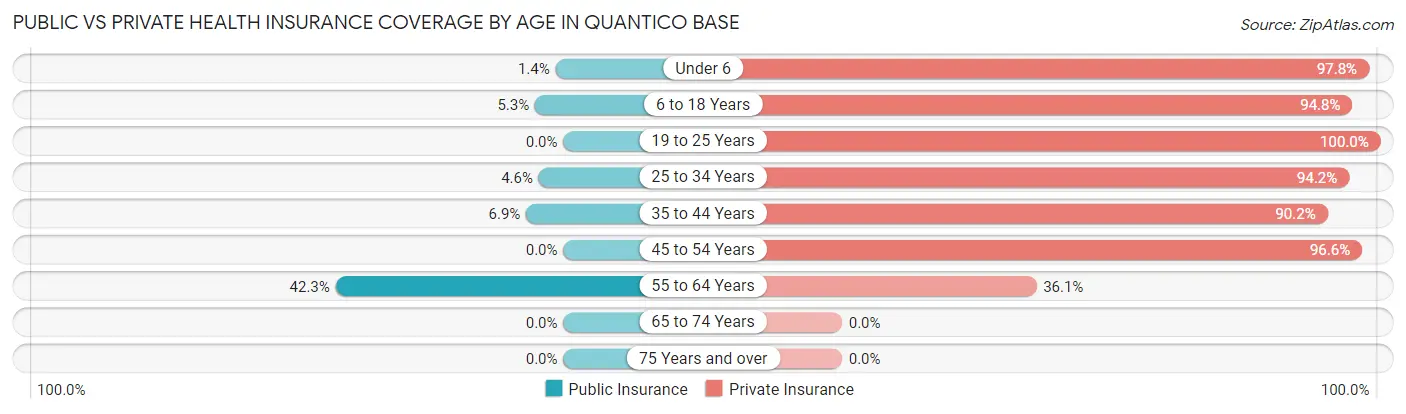
| Age Bracket | Public Insurance | Private Insurance |
| Under 6 | 12 (1.4%) | 817 (97.8%) |
| 6 to 18 Years | 31 (5.2%) | 560 (94.8%) |
| 19 to 25 Years | 0 (0.0%) | 286 (100.0%) |
| 25 to 34 Years | 25 (4.6%) | 516 (94.2%) |
| 35 to 44 Years | 14 (6.9%) | 183 (90.1%) |
| 45 to 54 Years | 0 (0.0%) | 56 (96.6%) |
| 55 to 64 Years | 41 (42.3%) | 35 (36.1%) |
| 65 to 74 Years | 0 (0.0%) | 0 (0.0%) |
| 75 Years and over | 0 (0.0%) | 0 (0.0%) |
| Total | 123 (4.7%) | 2,453 (93.7%) |
Disability Status by Sex by Age in Quantico Base
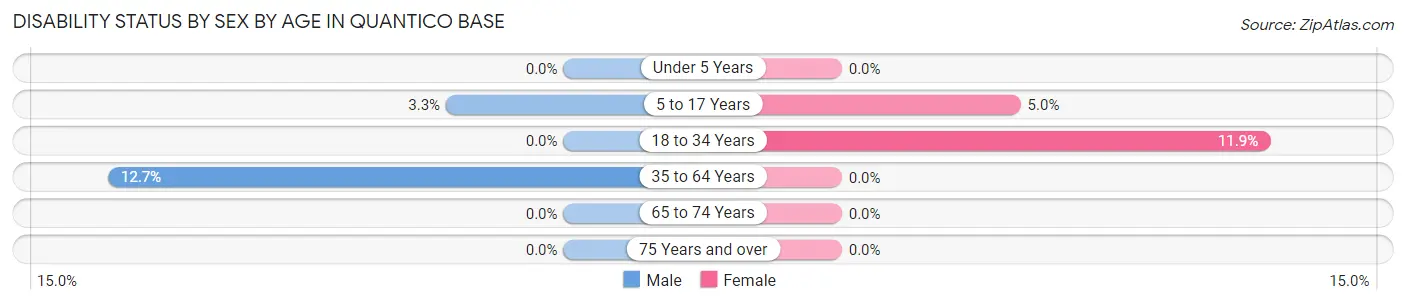
| Age Bracket | Male | Female |
| Under 5 Years | 0 (0.0%) | 0 (0.0%) |
| 5 to 17 Years | 13 (3.3%) | 16 (5.0%) |
| 18 to 34 Years | 0 (0.0%) | 77 (11.9%) |
| 35 to 64 Years | 9 (12.7%) | 0 (0.0%) |
| 65 to 74 Years | 0 (0.0%) | 0 (0.0%) |
| 75 Years and over | 0 (0.0%) | 0 (0.0%) |
Disability Class by Sex by Age in Quantico Base
Disability Class: Hearing Difficulty
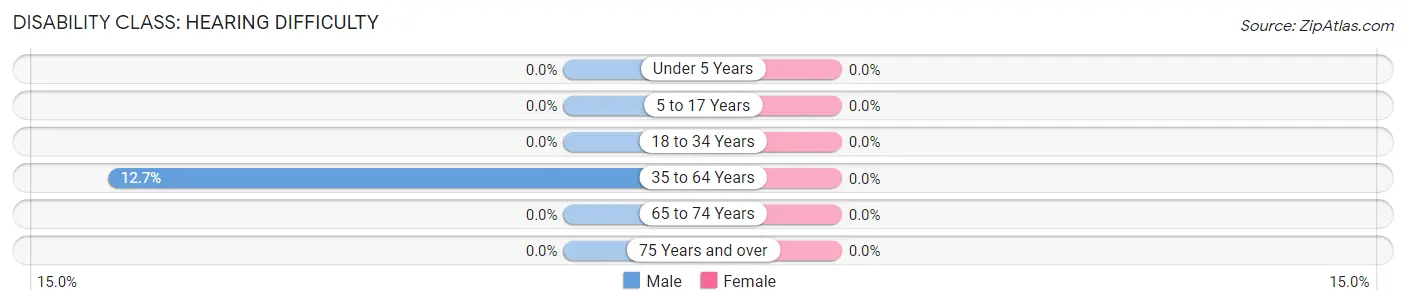
| Age Bracket | Male | Female |
| Under 5 Years | 0 (0.0%) | 0 (0.0%) |
| 5 to 17 Years | 0 (0.0%) | 0 (0.0%) |
| 18 to 34 Years | 0 (0.0%) | 0 (0.0%) |
| 35 to 64 Years | 9 (12.7%) | 0 (0.0%) |
| 65 to 74 Years | 0 (0.0%) | 0 (0.0%) |
| 75 Years and over | 0 (0.0%) | 0 (0.0%) |
Disability Class: Vision Difficulty
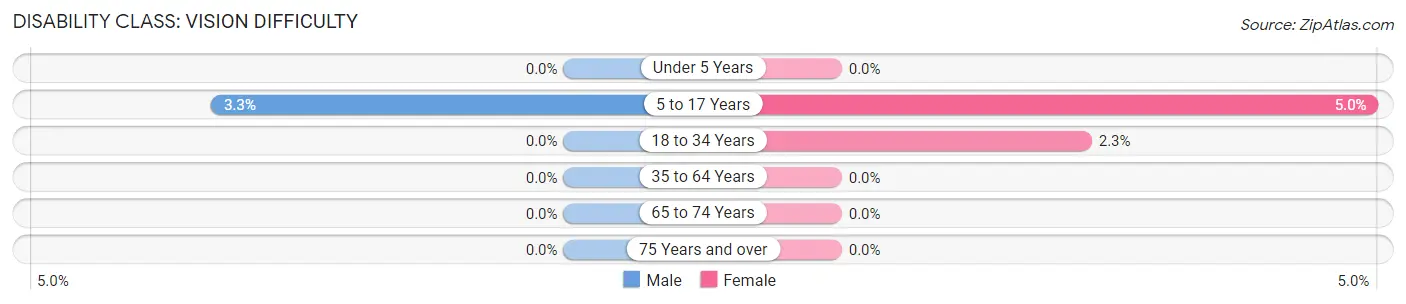
| Age Bracket | Male | Female |
| Under 5 Years | 0 (0.0%) | 0 (0.0%) |
| 5 to 17 Years | 13 (3.3%) | 16 (5.0%) |
| 18 to 34 Years | 0 (0.0%) | 15 (2.3%) |
| 35 to 64 Years | 0 (0.0%) | 0 (0.0%) |
| 65 to 74 Years | 0 (0.0%) | 0 (0.0%) |
| 75 Years and over | 0 (0.0%) | 0 (0.0%) |
Disability Class: Cognitive Difficulty
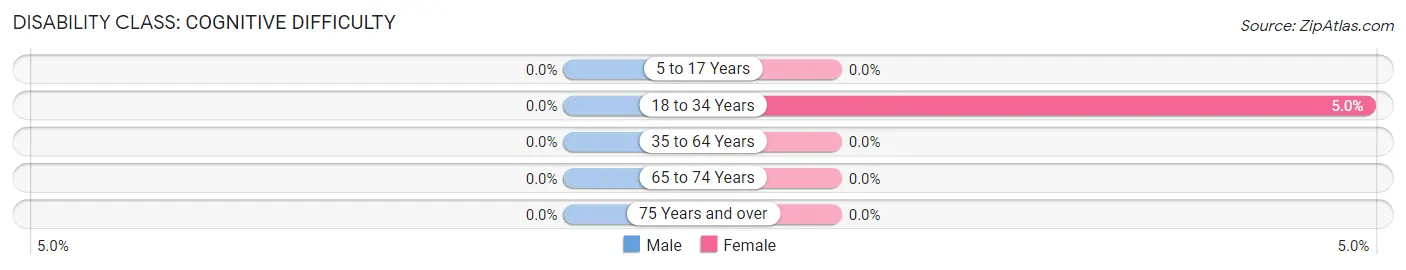
| Age Bracket | Male | Female |
| 5 to 17 Years | 0 (0.0%) | 0 (0.0%) |
| 18 to 34 Years | 0 (0.0%) | 32 (5.0%) |
| 35 to 64 Years | 0 (0.0%) | 0 (0.0%) |
| 65 to 74 Years | 0 (0.0%) | 0 (0.0%) |
| 75 Years and over | 0 (0.0%) | 0 (0.0%) |
Disability Class: Ambulatory Difficulty
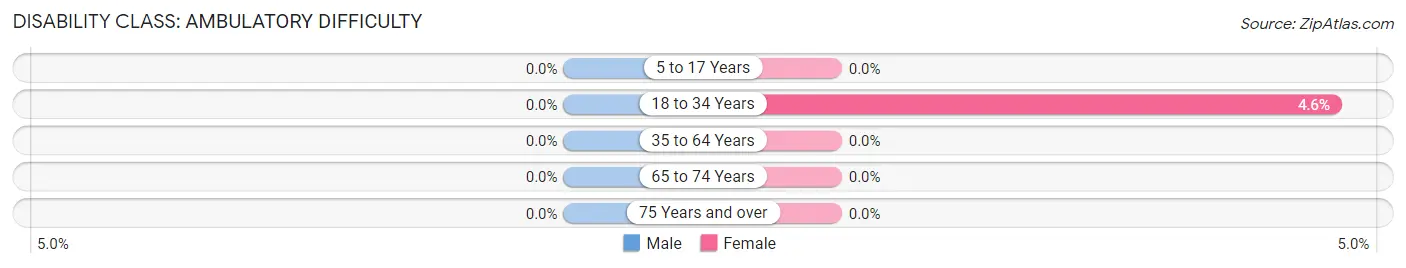
| Age Bracket | Male | Female |
| 5 to 17 Years | 0 (0.0%) | 0 (0.0%) |
| 18 to 34 Years | 0 (0.0%) | 30 (4.6%) |
| 35 to 64 Years | 0 (0.0%) | 0 (0.0%) |
| 65 to 74 Years | 0 (0.0%) | 0 (0.0%) |
| 75 Years and over | 0 (0.0%) | 0 (0.0%) |
Disability Class: Self-Care Difficulty
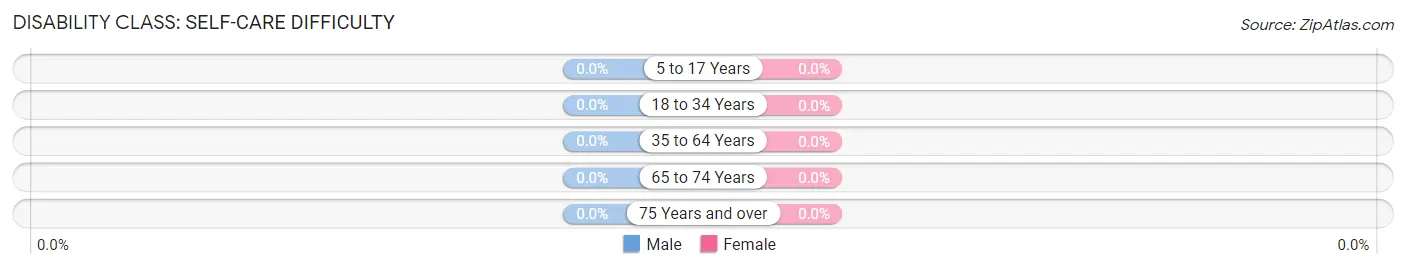
| Age Bracket | Male | Female |
| 5 to 17 Years | 0 (0.0%) | 0 (0.0%) |
| 18 to 34 Years | 0 (0.0%) | 0 (0.0%) |
| 35 to 64 Years | 0 (0.0%) | 0 (0.0%) |
| 65 to 74 Years | 0 (0.0%) | 0 (0.0%) |
| 75 Years and over | 0 (0.0%) | 0 (0.0%) |
Technology Access in Quantico Base
Computing Device Access in Quantico Base
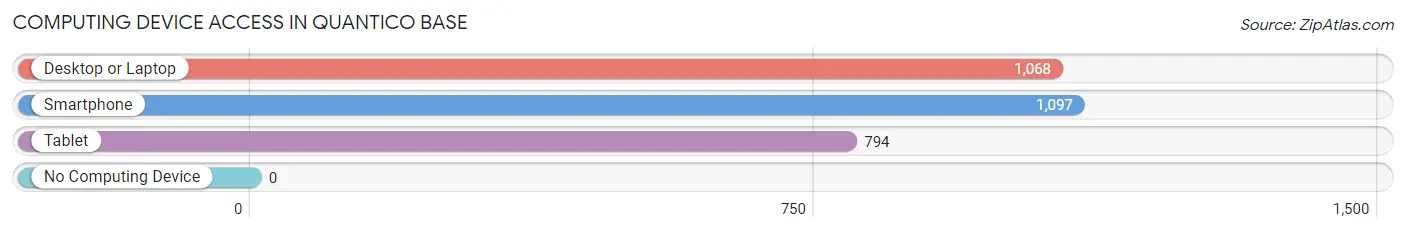
| Device Type | # Households | % Households |
| Desktop or Laptop | 1,068 | 97.4% |
| Smartphone | 1,097 | 100.0% |
| Tablet | 794 | 72.4% |
| No Computing Device | 0 | 0.0% |
| Total | 1,097 | 100.0% |
Internet Access in Quantico Base
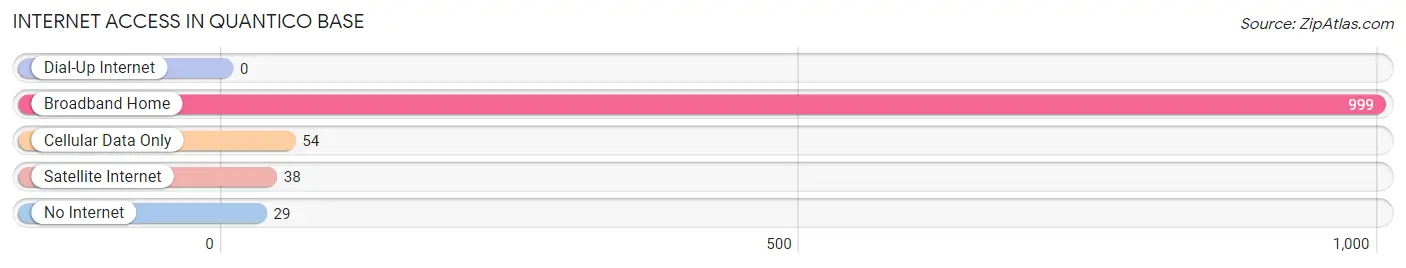
| Internet Type | # Households | % Households |
| Dial-Up Internet | 0 | 0.0% |
| Broadband Home | 999 | 91.1% |
| Cellular Data Only | 54 | 4.9% |
| Satellite Internet | 38 | 3.5% |
| No Internet | 29 | 2.6% |
| Total | 1,097 | 100.0% |
Quantico Base Summary
History
Quantico Base is a United States Marine Corps base located in Prince William County, Virginia. It is the largest Marine Corps base in the world and is home to the Marine Corps Combat Development Command, the Marine Corps Systems Command, the Marine Corps Warfighting Laboratory, and the Marine Corps University. The base was established in 1917 and has been in continuous operation since then.
Quantico Base has a long and storied history. During World War I, the base was used as a training center for the Marine Corps. During World War II, the base was used as a staging area for the Marine Corps’ Pacific campaigns. During the Cold War, the base was used as a training center for the Marine Corps’ special operations forces.
In the post-Cold War era, Quantico Base has become a major hub for the Marine Corps’ training and education programs. The base is home to the Marine Corps Combat Development Command, which is responsible for developing and testing new tactics, techniques, and procedures for the Marine Corps. The base is also home to the Marine Corps Systems Command, which is responsible for developing and testing new weapons and equipment for the Marine Corps. The base is also home to the Marine Corps Warfighting Laboratory, which is responsible for researching and developing new technologies for the Marine Corps.
Geography
Quantico Base is located in Prince William County, Virginia, approximately 40 miles south of Washington, D.C. The base is situated on the Potomac River, and is bordered by the Quantico National Wildlife Refuge to the north and the Quantico Creek to the south. The base covers an area of approximately 8,000 acres and is home to a variety of military installations, including the Marine Corps Combat Development Command, the Marine Corps Systems Command, the Marine Corps Warfighting Laboratory, and the Marine Corps University.
Economy
Quantico Base is a major economic driver for the region. The base is home to a variety of military installations, which employ thousands of people. In addition, the base is home to a variety of businesses, including restaurants, hotels, and retail stores. The base also serves as a major tourist destination, attracting visitors from all over the world.
Demographics
As of the 2010 census, the population of Quantico Base was 8,845. The population is predominantly white (77.3%), followed by African American (14.2%), Asian (3.7%), and Hispanic or Latino (2.7%). The median household income is $50,945, and the median age is 33. The base is home to a variety of military personnel, civilian employees, and their families.
Common Questions
What is Per Capita Income in Quantico Base?
Per Capita income in Quantico Base is $27,085.
What is the Median Family Income in Quantico Base?
Median Family Income in Quantico Base is $68,607.
What is the Median Household income in Quantico Base?
Median Household Income in Quantico Base is $66,361.
What is Income or Wage Gap in Quantico Base?
Income or Wage Gap in Quantico Base is 4.5%.
Women in Quantico Base earn 95.5 cents for every dollar earned by a man.
What is Inequality or Gini Index in Quantico Base?
Inequality or Gini Index in Quantico Base is 0.38.
What is the Total Population of Quantico Base?
Total Population of Quantico Base is 5,372.
What is the Total Male Population of Quantico Base?
Total Male Population of Quantico Base is 3,348.
What is the Total Female Population of Quantico Base?
Total Female Population of Quantico Base is 2,024.
What is the Ratio of Males per 100 Females in Quantico Base?
There are 165.42 Males per 100 Females in Quantico Base.
What is the Ratio of Females per 100 Males in Quantico Base?
There are 60.45 Females per 100 Males in Quantico Base.
What is the Median Population Age in Quantico Base?
Median Population Age in Quantico Base is 22.2 Years.
What is the Average Family Size in Quantico Base
Average Family Size in Quantico Base is 3.4 People.
What is the Average Household Size in Quantico Base
Average Household Size in Quantico Base is 3.2 People.
How Large is the Labor Force in Quantico Base?
There are 3,381 People in the Labor Forcein in Quantico Base.
What is the Percentage of People in the Labor Force in Quantico Base?
85.5% of People are in the Labor Force in Quantico Base.
What is the Unemployment Rate in Quantico Base?
Unemployment Rate in Quantico Base is 8.4%.