Independence, VA Map & Demographics
Independence Map
Independence Overview
$29,591
PER CAPITA INCOME
$40,682
AVG FAMILY INCOME
$34,286
AVG HOUSEHOLD INCOME
6.7%
WAGE / INCOME GAP [ % ]
93.3¢/ $1
WAGE / INCOME GAP [ $ ]
0.60
INEQUALITY / GINI INDEX
1,176
TOTAL POPULATION
561
MALE POPULATION
615
FEMALE POPULATION
91.22
MALES / 100 FEMALES
109.63
FEMALES / 100 MALES
55.2
MEDIAN AGE
2.8
AVG FAMILY SIZE
2.3
AVG HOUSEHOLD SIZE
400
LABOR FORCE [ PEOPLE ]
41.5%
PERCENT IN LABOR FORCE
7.8%
UNEMPLOYMENT RATE
Independence Zip Codes
Independence Area Codes
Income in Independence
Income Overview in Independence
Per Capita Income in Independence is $29,591, while median incomes of families and households are $40,682 and $34,286 respectively.
| Characteristic | Number | Measure |
| Per Capita Income | 1,176 | $29,591 |
| Median Family Income | 278 | $40,682 |
| Mean Family Income | 278 | $81,864 |
| Median Household Income | 454 | $34,286 |
| Mean Household Income | 454 | $70,389 |
| Income Deficit | 278 | $0 |
| Wage / Income Gap (%) | 1,176 | 6.69% |
| Wage / Income Gap ($) | 1,176 | 93.31¢ per $1 |
| Gini / Inequality Index | 1,176 | 0.60 |
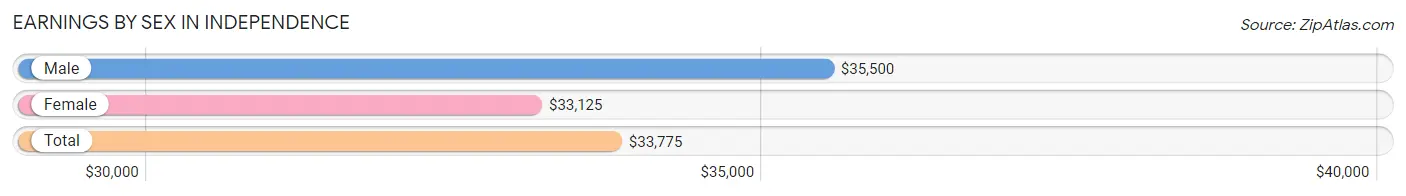
Earnings by Sex in Independence
Average Earnings in Independence are $33,775, $35,500 for men and $33,125 for women, a difference of 6.7%.
| Sex | Number | Average Earnings |
| Male | 238 (58.2%) | $35,500 |
| Female | 171 (41.8%) | $33,125 |
| Total | 409 (100.0%) | $33,775 |
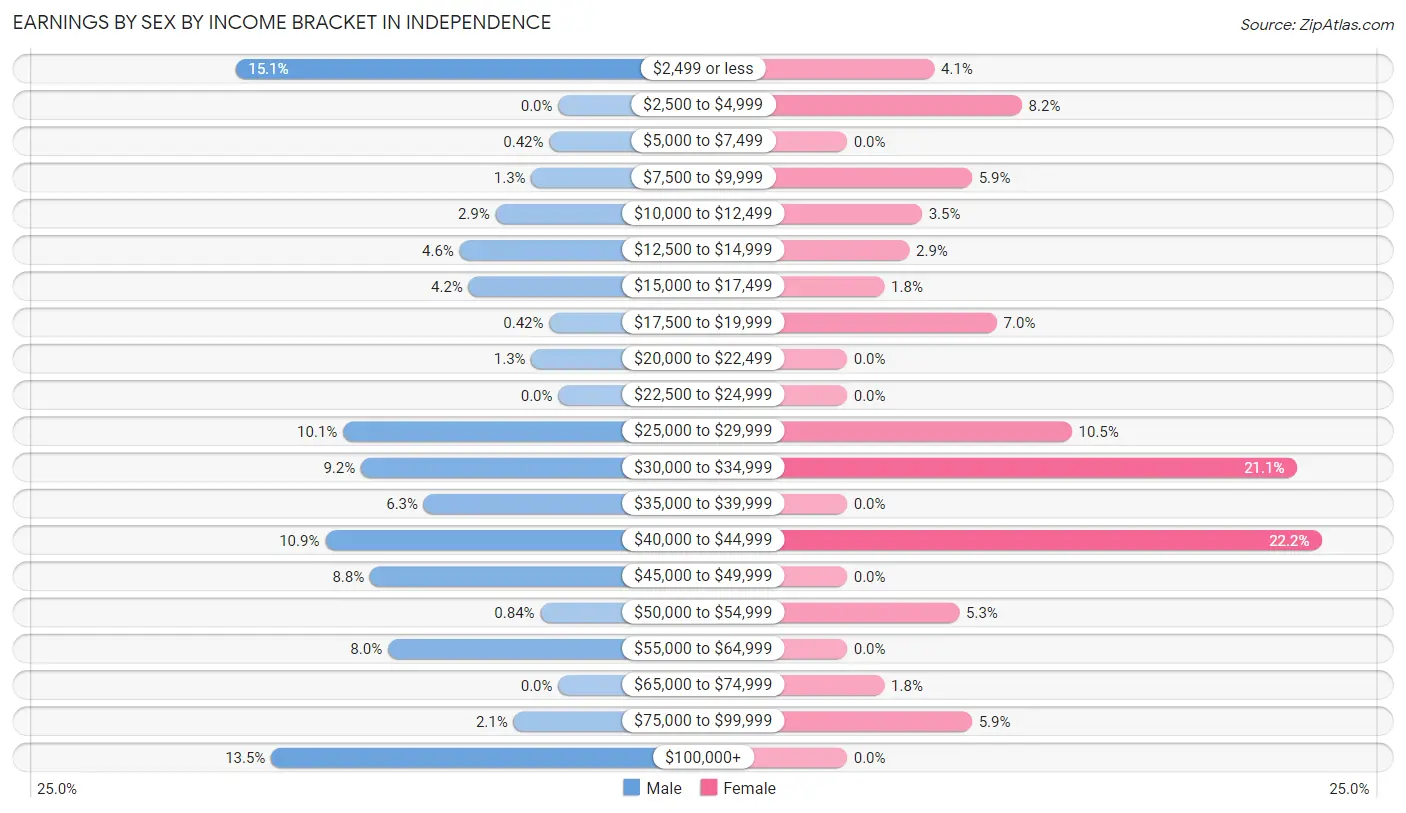
Earnings by Sex by Income Bracket in Independence
The most common earnings brackets in Independence are $2,499 or less for men (36 | 15.1%) and $40,000 to $44,999 for women (38 | 22.2%).
| Income | Male | Female |
| $2,499 or less | 36 (15.1%) | 7 (4.1%) |
| $2,500 to $4,999 | 0 (0.0%) | 14 (8.2%) |
| $5,000 to $7,499 | 1 (0.4%) | 0 (0.0%) |
| $7,500 to $9,999 | 3 (1.3%) | 10 (5.9%) |
| $10,000 to $12,499 | 7 (2.9%) | 6 (3.5%) |
| $12,500 to $14,999 | 11 (4.6%) | 5 (2.9%) |
| $15,000 to $17,499 | 10 (4.2%) | 3 (1.8%) |
| $17,500 to $19,999 | 1 (0.4%) | 12 (7.0%) |
| $20,000 to $22,499 | 3 (1.3%) | 0 (0.0%) |
| $22,500 to $24,999 | 0 (0.0%) | 0 (0.0%) |
| $25,000 to $29,999 | 24 (10.1%) | 18 (10.5%) |
| $30,000 to $34,999 | 22 (9.2%) | 36 (21.0%) |
| $35,000 to $39,999 | 15 (6.3%) | 0 (0.0%) |
| $40,000 to $44,999 | 26 (10.9%) | 38 (22.2%) |
| $45,000 to $49,999 | 21 (8.8%) | 0 (0.0%) |
| $50,000 to $54,999 | 2 (0.8%) | 9 (5.3%) |
| $55,000 to $64,999 | 19 (8.0%) | 0 (0.0%) |
| $65,000 to $74,999 | 0 (0.0%) | 3 (1.8%) |
| $75,000 to $99,999 | 5 (2.1%) | 10 (5.9%) |
| $100,000+ | 32 (13.5%) | 0 (0.0%) |
| Total | 238 (100.0%) | 171 (100.0%) |
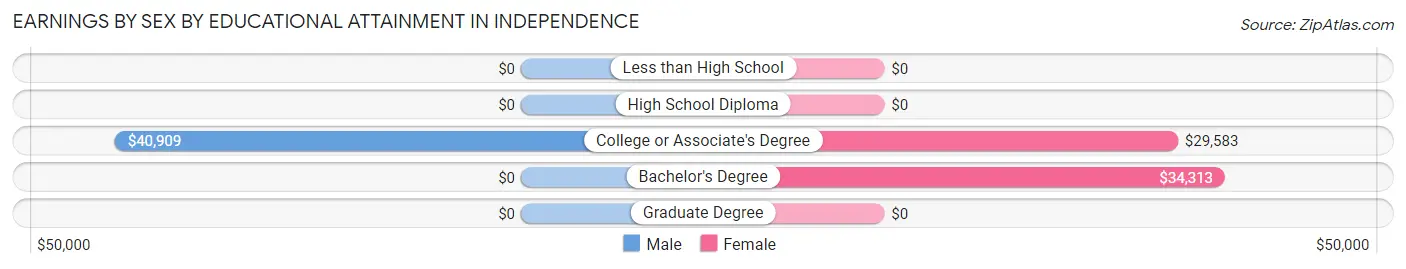
Earnings by Sex by Educational Attainment in Independence
Average earnings in Independence are $36,500 for men and $33,519 for women, a difference of 8.2%. Men with an educational attainment of college or associate's degree enjoy the highest average annual earnings of $40,909, while those with college or associate's degree education earn the least with $40,909. Women with an educational attainment of bachelor's degree earn the most with the average annual earnings of $34,313, while those with college or associate's degree education have the smallest earnings of $29,583.
| Educational Attainment | Male Income | Female Income |
| Less than High School | - | - |
| High School Diploma | - | - |
| College or Associate's Degree | $40,909 | $29,583 |
| Bachelor's Degree | - | - |
| Graduate Degree | - | - |
| Total | $36,500 | $33,519 |
Family Income in Independence
Family Income Brackets in Independence
According to the Independence family income data, there are 74 families falling into the $25,000 to $34,999 income range, which is the most common income bracket and makes up 26.6% of all families. Conversely, the $150,000 to $199,999 income bracket is the least frequent group with only 4 families (1.4%) belonging to this category.
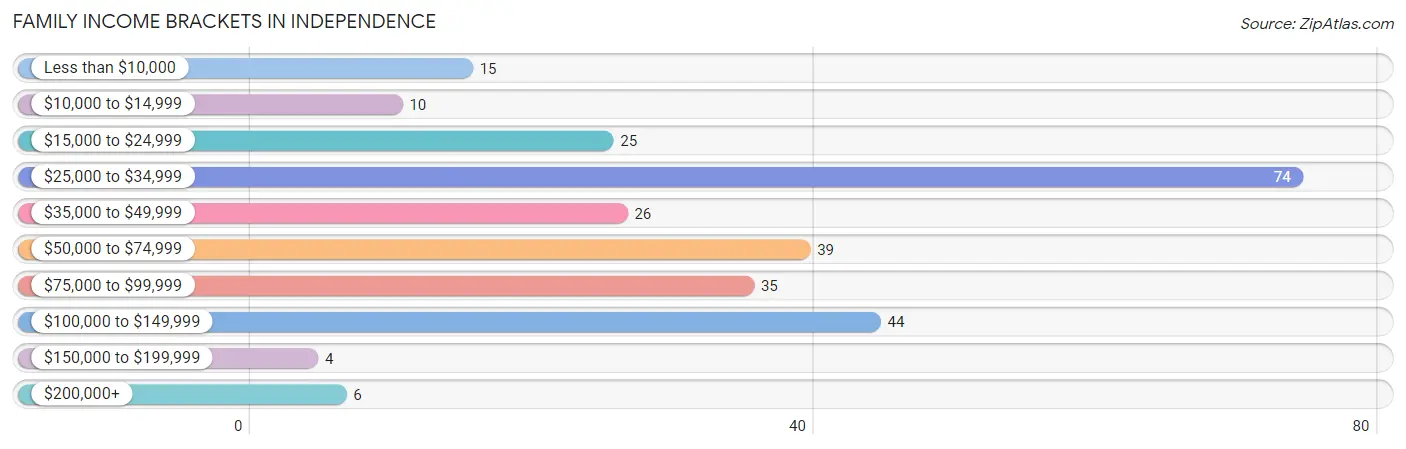
| Income Bracket | # Families | % Families |
| Less than $10,000 | 15 | 5.4% |
| $10,000 to $14,999 | 10 | 3.6% |
| $15,000 to $24,999 | 25 | 9.0% |
| $25,000 to $34,999 | 74 | 26.6% |
| $35,000 to $49,999 | 26 | 9.4% |
| $50,000 to $74,999 | 39 | 14.0% |
| $75,000 to $99,999 | 35 | 12.6% |
| $100,000 to $149,999 | 44 | 15.8% |
| $150,000 to $199,999 | 4 | 1.4% |
| $200,000+ | 6 | 2.2% |
Family Income by Famaliy Size in Independence
5-person families (28 | 10.1%) account for the highest median family income in Independence with $40,227 per family, while 5-person families (28 | 10.1%) have the highest median income of $8,045 per family member.
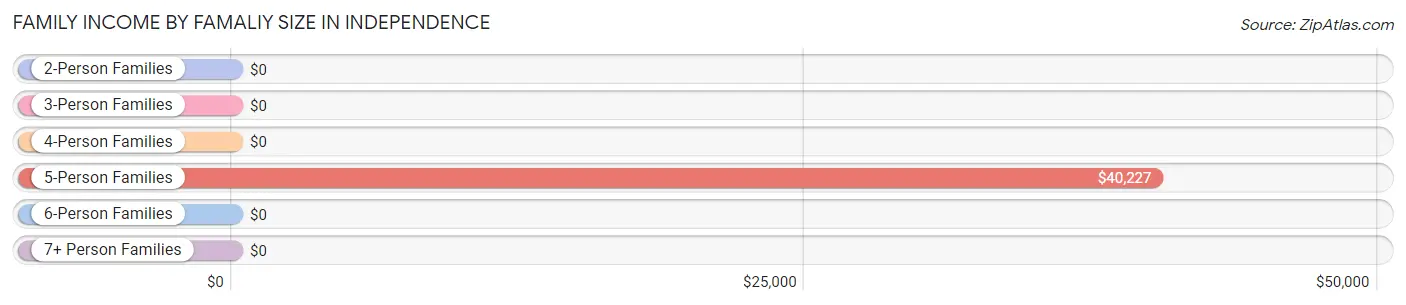
| Income Bracket | # Families | Median Income |
| 2-Person Families | 156 (56.1%) | $0 |
| 3-Person Families | 51 (18.3%) | $0 |
| 4-Person Families | 36 (13.0%) | $0 |
| 5-Person Families | 28 (10.1%) | $40,227 |
| 6-Person Families | 4 (1.4%) | $0 |
| 7+ Person Families | 3 (1.1%) | $0 |
| Total | 278 (100.0%) | $40,682 |
Family Income by Number of Earners in Independence
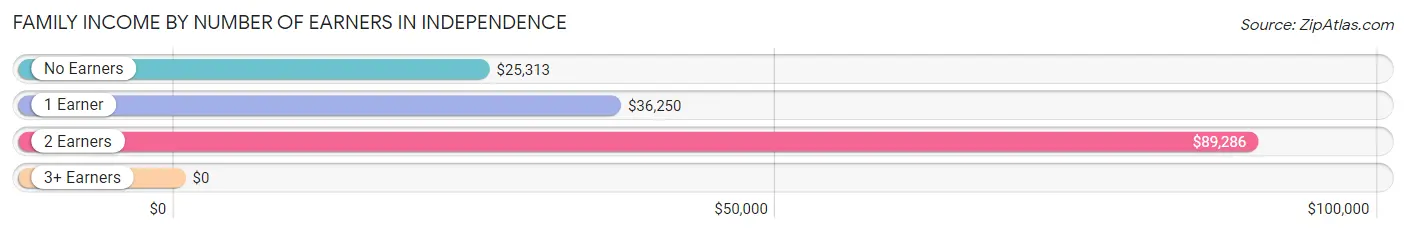
| Number of Earners | # Families | Median Income |
| No Earners | 94 (33.8%) | $25,313 |
| 1 Earner | 81 (29.1%) | $36,250 |
| 2 Earners | 100 (36.0%) | $89,286 |
| 3+ Earners | 3 (1.1%) | $0 |
| Total | 278 (100.0%) | $40,682 |
Household Income in Independence
Household Income Brackets in Independence
With 88 households falling in the category, the $25,000 to $34,999 income range is the most frequent in Independence, accounting for 19.4% of all households. In contrast, only 4 households (0.9%) fall into the $150,000 to $199,999 income bracket, making it the least populous group.
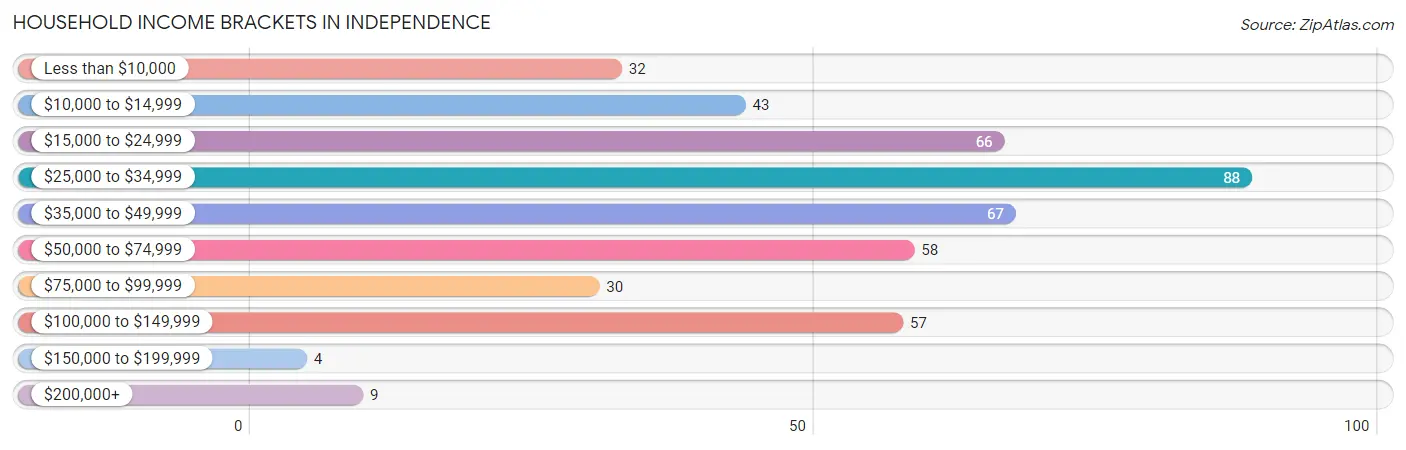
| Income Bracket | # Households | % Households |
| Less than $10,000 | 32 | 7.0% |
| $10,000 to $14,999 | 43 | 9.5% |
| $15,000 to $24,999 | 66 | 14.5% |
| $25,000 to $34,999 | 88 | 19.4% |
| $35,000 to $49,999 | 67 | 14.8% |
| $50,000 to $74,999 | 58 | 12.8% |
| $75,000 to $99,999 | 30 | 6.6% |
| $100,000 to $149,999 | 57 | 12.6% |
| $150,000 to $199,999 | 4 | 0.9% |
| $200,000+ | 9 | 2.0% |
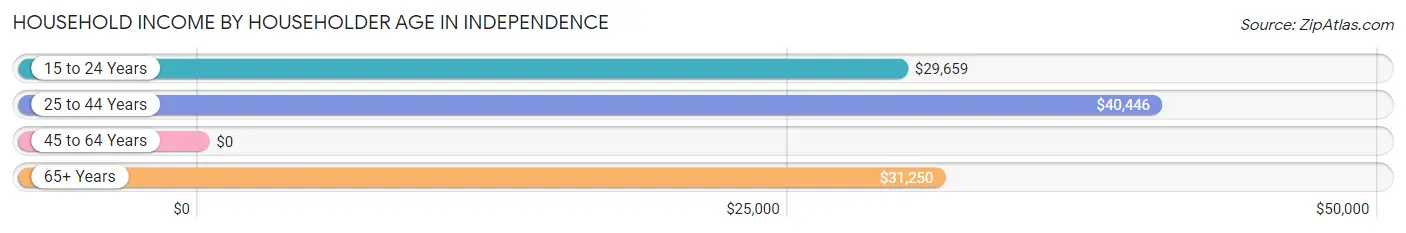
Household Income by Householder Age in Independence
The median household income in Independence is $34,286, with the highest median household income of $40,446 found in the 25 to 44 years age bracket for the primary householder. A total of 87 households (19.2%) fall into this category. Meanwhile, the 45 to 64 years age bracket for the primary householder has the lowest median household income of $0, with 143 households (31.5%) in this group.
| Income Bracket | # Households | Median Income |
| 15 to 24 Years | 38 (8.4%) | $29,659 |
| 25 to 44 Years | 87 (19.2%) | $40,446 |
| 45 to 64 Years | 143 (31.5%) | $0 |
| 65+ Years | 186 (41.0%) | $31,250 |
| Total | 454 (100.0%) | $34,286 |
Poverty in Independence
Income Below Poverty by Sex and Age in Independence
With 15.4% poverty level for males and 21.5% for females among the residents of Independence, 16 and 17 year old males and 16 and 17 year old females are the most vulnerable to poverty, with 6 males (75.0%) and 5 females (100.0%) in their respective age groups living below the poverty level.
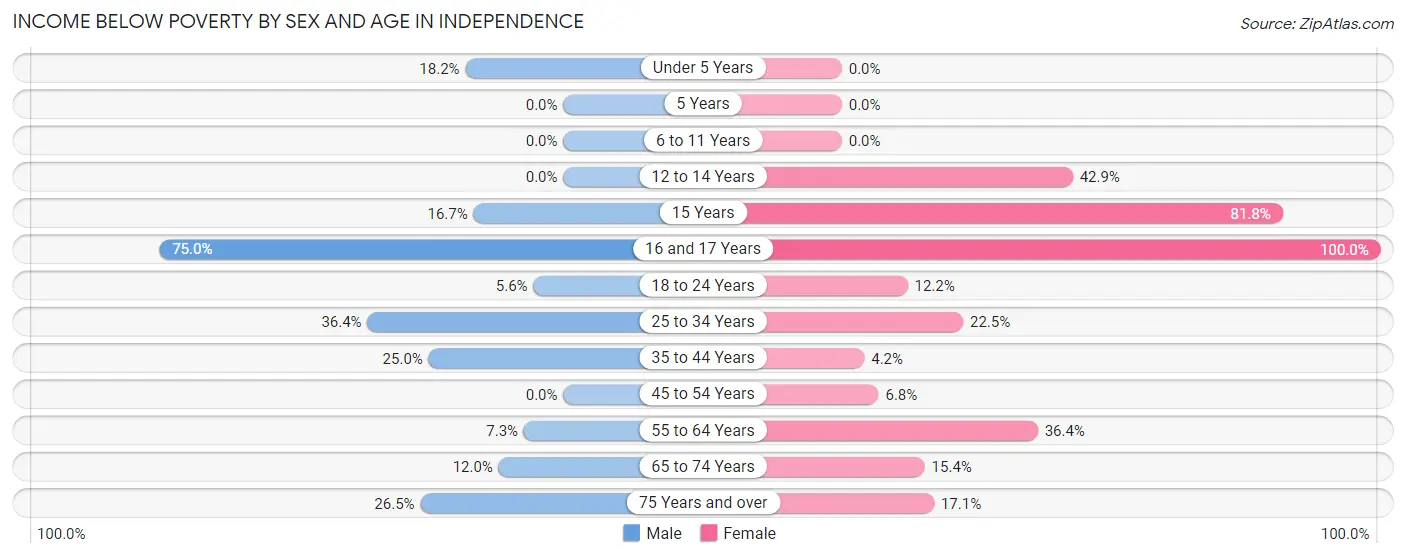
| Age Bracket | Male | Female |
| Under 5 Years | 6 (18.2%) | 0 (0.0%) |
| 5 Years | 0 (0.0%) | 0 (0.0%) |
| 6 to 11 Years | 0 (0.0%) | 0 (0.0%) |
| 12 to 14 Years | 0 (0.0%) | 18 (42.9%) |
| 15 Years | 2 (16.7%) | 9 (81.8%) |
| 16 and 17 Years | 6 (75.0%) | 5 (100.0%) |
| 18 to 24 Years | 2 (5.6%) | 5 (12.2%) |
| 25 to 34 Years | 24 (36.4%) | 9 (22.5%) |
| 35 to 44 Years | 10 (25.0%) | 1 (4.2%) |
| 45 to 54 Years | 0 (0.0%) | 3 (6.8%) |
| 55 to 64 Years | 6 (7.3%) | 40 (36.4%) |
| 65 to 74 Years | 9 (12.0%) | 10 (15.4%) |
| 75 Years and over | 13 (26.5%) | 13 (17.1%) |
| Total | 78 (15.4%) | 113 (21.5%) |
Income Above Poverty by Sex and Age in Independence
According to the poverty statistics in Independence, males aged 5 years and females aged under 5 years are the age groups that are most secure financially, with 100.0% of males and 100.0% of females in these age groups living above the poverty line.
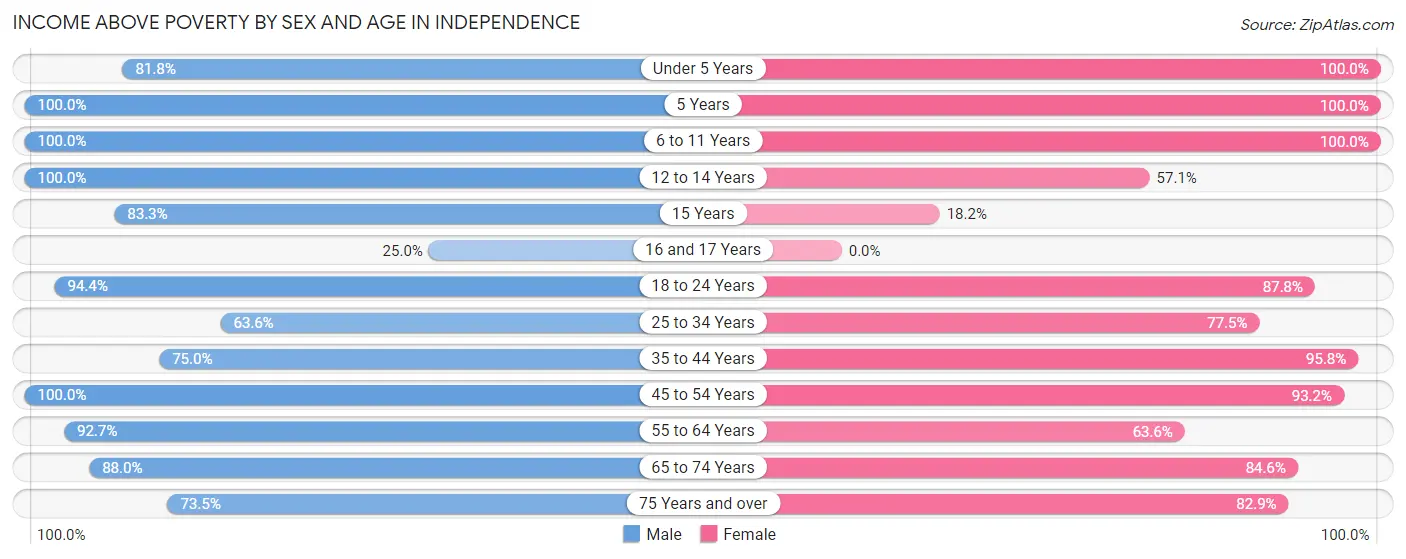
| Age Bracket | Male | Female |
| Under 5 Years | 27 (81.8%) | 27 (100.0%) |
| 5 Years | 15 (100.0%) | 8 (100.0%) |
| 6 to 11 Years | 17 (100.0%) | 32 (100.0%) |
| 12 to 14 Years | 8 (100.0%) | 24 (57.1%) |
| 15 Years | 10 (83.3%) | 2 (18.2%) |
| 16 and 17 Years | 2 (25.0%) | 0 (0.0%) |
| 18 to 24 Years | 34 (94.4%) | 36 (87.8%) |
| 25 to 34 Years | 42 (63.6%) | 31 (77.5%) |
| 35 to 44 Years | 30 (75.0%) | 23 (95.8%) |
| 45 to 54 Years | 66 (100.0%) | 41 (93.2%) |
| 55 to 64 Years | 76 (92.7%) | 70 (63.6%) |
| 65 to 74 Years | 66 (88.0%) | 55 (84.6%) |
| 75 Years and over | 36 (73.5%) | 63 (82.9%) |
| Total | 429 (84.6%) | 412 (78.5%) |
Income Below Poverty Among Married-Couple Families in Independence
The poverty statistics for married-couple families in Independence show that 6.2% or 13 of the total 209 families live below the poverty line. Families with 3 or 4 children have the highest poverty rate of 28.1%, comprising of 9 families. On the other hand, families with 1 or 2 children have the lowest poverty rate of 0.0%, which includes 0 families.
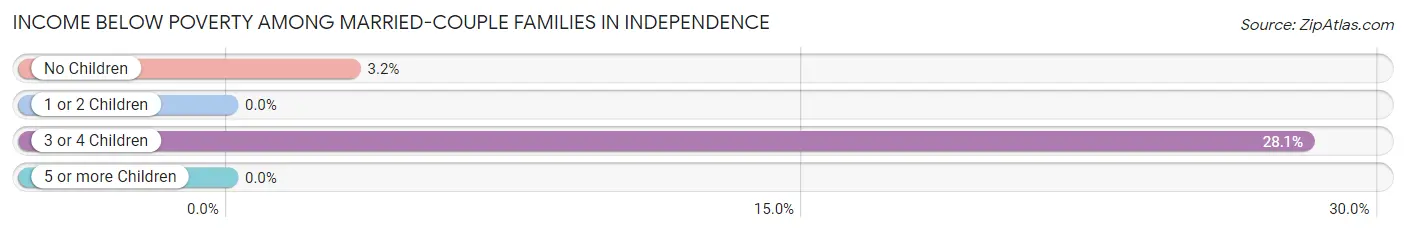
| Children | Above Poverty | Below Poverty |
| No Children | 121 (96.8%) | 4 (3.2%) |
| 1 or 2 Children | 49 (100.0%) | 0 (0.0%) |
| 3 or 4 Children | 23 (71.9%) | 9 (28.1%) |
| 5 or more Children | 3 (100.0%) | 0 (0.0%) |
| Total | 196 (93.8%) | 13 (6.2%) |
Income Below Poverty Among Single-Parent Households in Independence
According to the poverty data in Independence, 58.3% or 7 single-father households and 17.5% or 10 single-mother households are living below the poverty line. Among single-father households, those with 3 or 4 children have the highest poverty rate, with 7 households (100.0%) experiencing poverty. Likewise, among single-mother households, those with 1 or 2 children have the highest poverty rate, with 3 households (21.4%) falling below the poverty line.
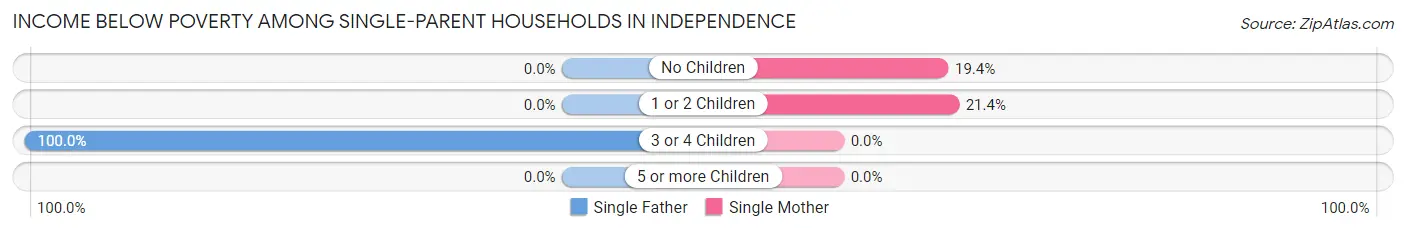
| Children | Single Father | Single Mother |
| No Children | 0 (0.0%) | 7 (19.4%) |
| 1 or 2 Children | 0 (0.0%) | 3 (21.4%) |
| 3 or 4 Children | 7 (100.0%) | 0 (0.0%) |
| 5 or more Children | 0 (0.0%) | 0 (0.0%) |
| Total | 7 (58.3%) | 10 (17.5%) |
Income Below Poverty Among Married-Couple vs Single-Parent Households in Independence
The poverty data for Independence shows that 13 of the married-couple family households (6.2%) and 17 of the single-parent households (24.6%) are living below the poverty level. Within the married-couple family households, those with 3 or 4 children have the highest poverty rate, with 9 households (28.1%) falling below the poverty line. Among the single-parent households, those with 3 or 4 children have the highest poverty rate, with 7 household (50.0%) living below poverty.
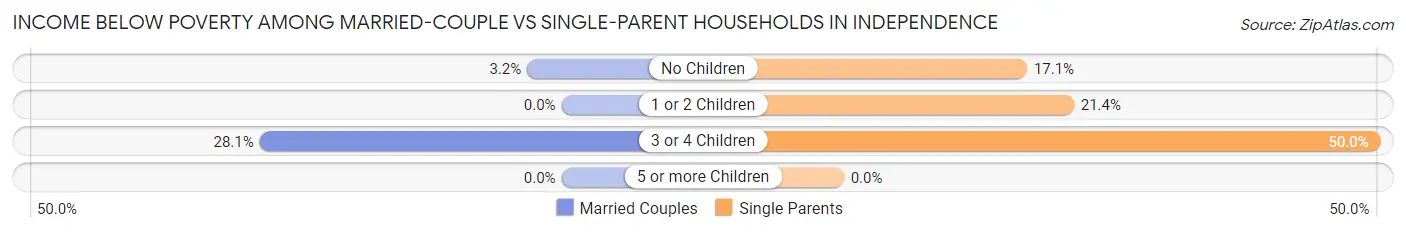
| Children | Married-Couple Families | Single-Parent Households |
| No Children | 4 (3.2%) | 7 (17.1%) |
| 1 or 2 Children | 0 (0.0%) | 3 (21.4%) |
| 3 or 4 Children | 9 (28.1%) | 7 (50.0%) |
| 5 or more Children | 0 (0.0%) | 0 (0.0%) |
| Total | 13 (6.2%) | 17 (24.6%) |
Race in Independence
The most populous races in Independence are White / Caucasian (1,026 | 87.2%), Black / African American (119 | 10.1%), and Hispanic or Latino (86 | 7.3%).
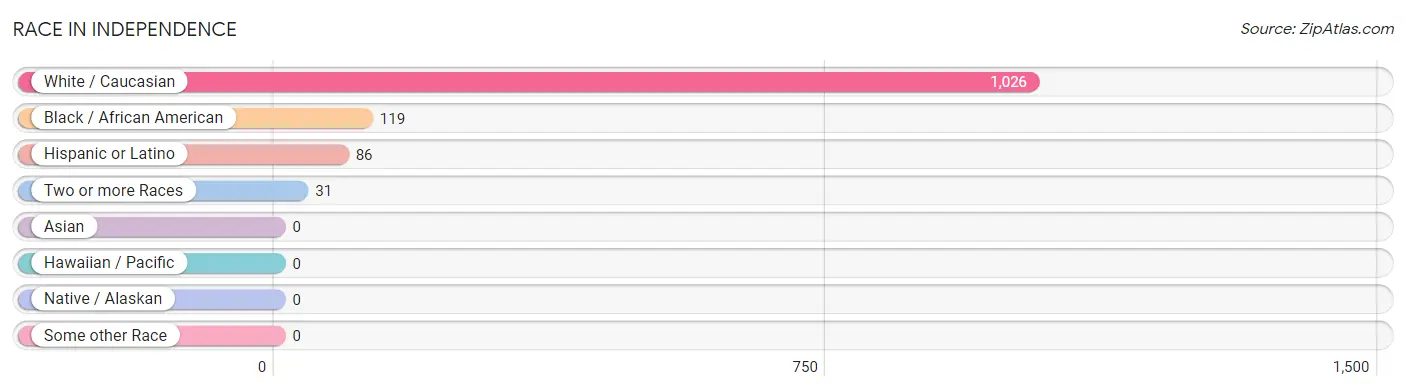
| Race | # Population | % Population |
| Asian | 0 | 0.0% |
| Black / African American | 119 | 10.1% |
| Hawaiian / Pacific | 0 | 0.0% |
| Hispanic or Latino | 86 | 7.3% |
| Native / Alaskan | 0 | 0.0% |
| White / Caucasian | 1,026 | 87.2% |
| Two or more Races | 31 | 2.6% |
| Some other Race | 0 | 0.0% |
| Total | 1,176 | 100.0% |
Ancestry in Independence
The most populous ancestries reported in Independence are American (537 | 45.7%), English (109 | 9.3%), Mexican (74 | 6.3%), Irish (43 | 3.7%), and Scottish (26 | 2.2%), together accounting for 67.1% of all Independence residents.
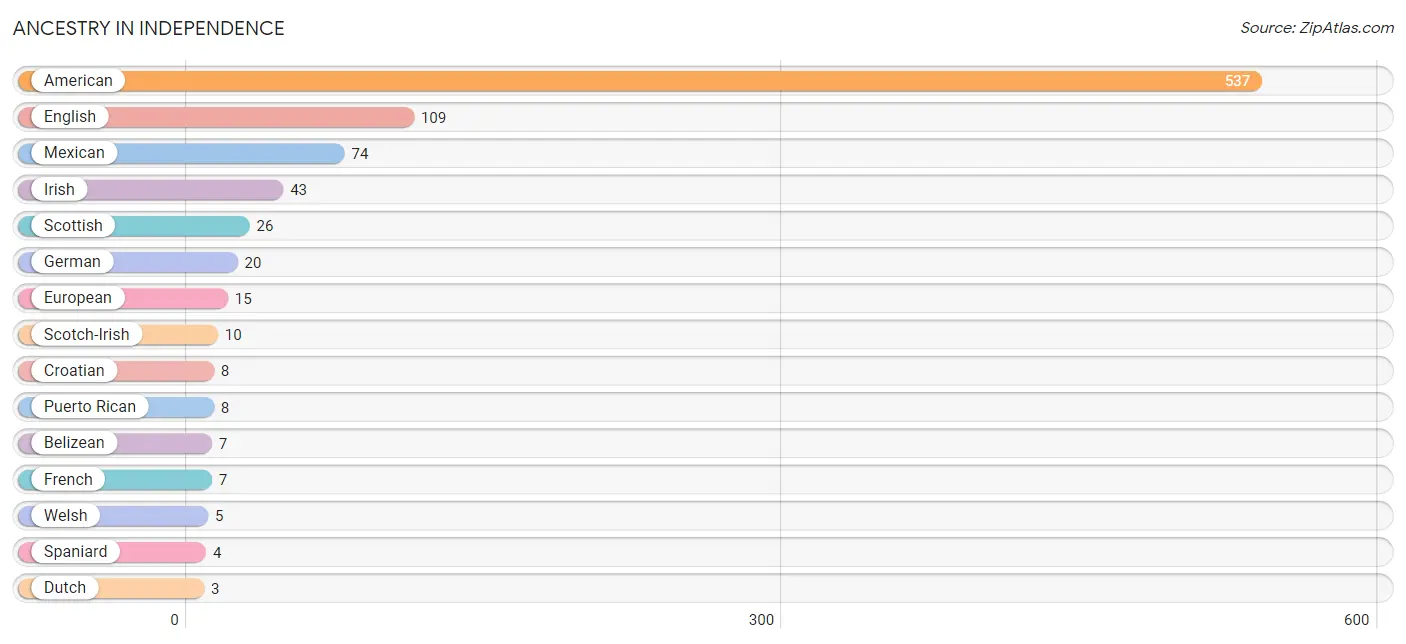
| Ancestry | # Population | % Population |
| American | 537 | 45.7% |
| Belizean | 7 | 0.6% |
| Cherokee | 2 | 0.2% |
| Croatian | 8 | 0.7% |
| Dutch | 3 | 0.3% |
| English | 109 | 9.3% |
| European | 15 | 1.3% |
| French | 7 | 0.6% |
| German | 20 | 1.7% |
| Irish | 43 | 3.7% |
| Italian | 1 | 0.1% |
| Mexican | 74 | 6.3% |
| Norwegian | 3 | 0.3% |
| Puerto Rican | 8 | 0.7% |
| Scotch-Irish | 10 | 0.9% |
| Scottish | 26 | 2.2% |
| Spaniard | 4 | 0.3% |
| Swedish | 3 | 0.3% |
| Welsh | 5 | 0.4% | View All 19 Rows |
Immigrants in Independence
The most numerous immigrant groups reported in Independence came from Central America (54 | 4.6%), Latin America (54 | 4.6%), Mexico (47 | 4.0%), and Belize (7 | 0.6%), together accounting for 13.8% of all Independence residents.
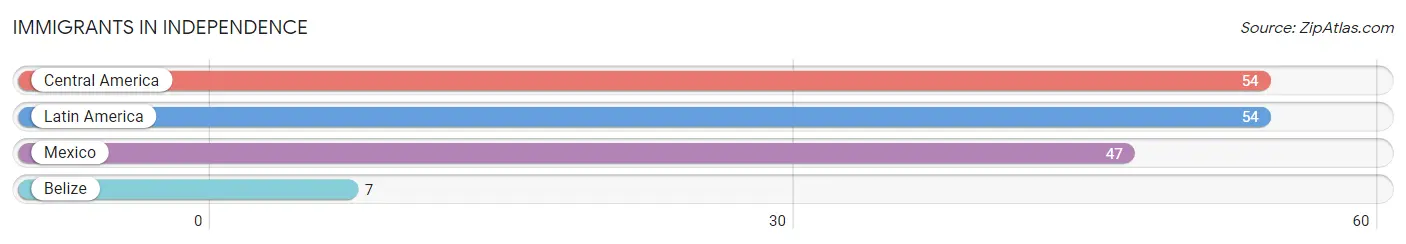
| Immigration Origin | # Population | % Population |
| Belize | 7 | 0.6% |
| Central America | 54 | 4.6% |
| Latin America | 54 | 4.6% |
| Mexico | 47 | 4.0% | View All 4 Rows |
Sex and Age in Independence
Sex and Age in Independence
The most populous age groups in Independence are 30 to 34 Years (53 | 9.5%) for men and 60 to 64 Years (85 | 13.8%) for women.
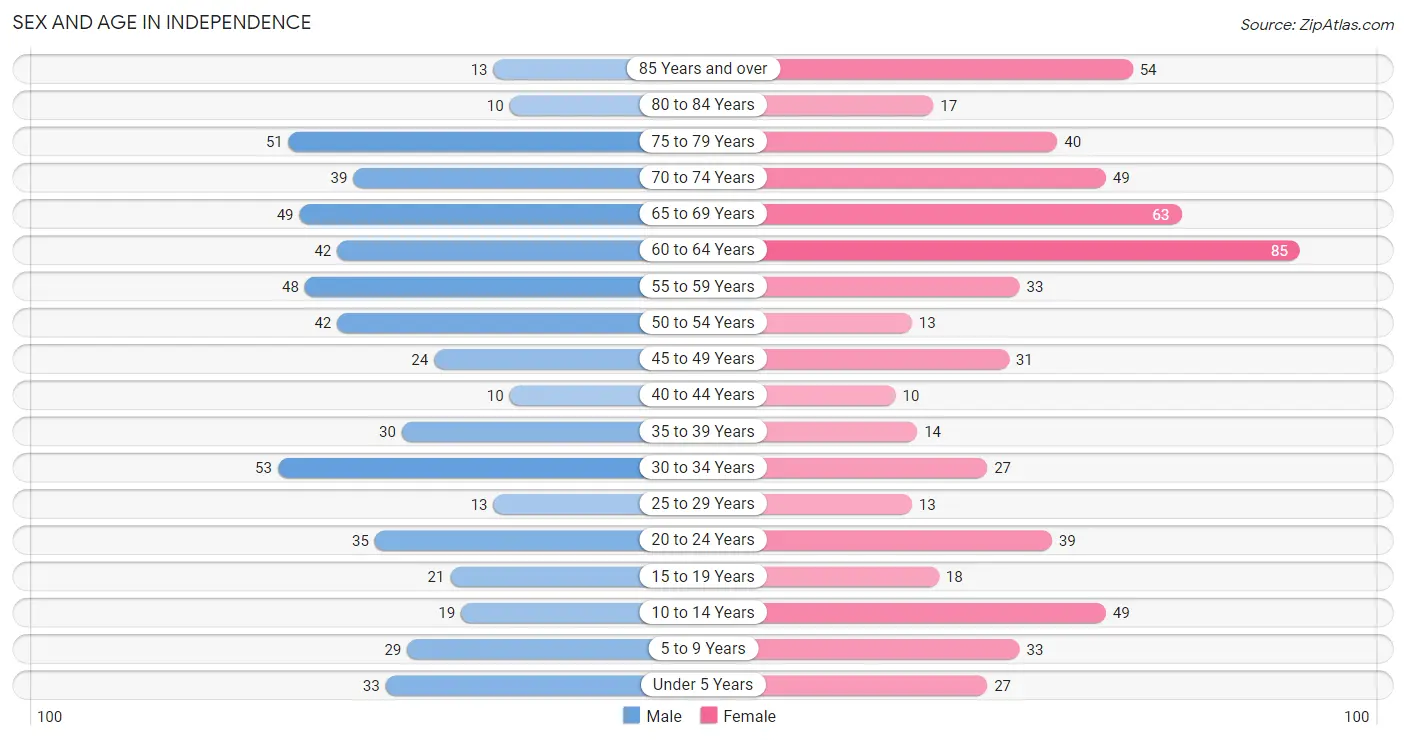
| Age Bracket | Male | Female |
| Under 5 Years | 33 (5.9%) | 27 (4.4%) |
| 5 to 9 Years | 29 (5.2%) | 33 (5.4%) |
| 10 to 14 Years | 19 (3.4%) | 49 (8.0%) |
| 15 to 19 Years | 21 (3.7%) | 18 (2.9%) |
| 20 to 24 Years | 35 (6.2%) | 39 (6.3%) |
| 25 to 29 Years | 13 (2.3%) | 13 (2.1%) |
| 30 to 34 Years | 53 (9.5%) | 27 (4.4%) |
| 35 to 39 Years | 30 (5.3%) | 14 (2.3%) |
| 40 to 44 Years | 10 (1.8%) | 10 (1.6%) |
| 45 to 49 Years | 24 (4.3%) | 31 (5.0%) |
| 50 to 54 Years | 42 (7.5%) | 13 (2.1%) |
| 55 to 59 Years | 48 (8.6%) | 33 (5.4%) |
| 60 to 64 Years | 42 (7.5%) | 85 (13.8%) |
| 65 to 69 Years | 49 (8.7%) | 63 (10.2%) |
| 70 to 74 Years | 39 (7.0%) | 49 (8.0%) |
| 75 to 79 Years | 51 (9.1%) | 40 (6.5%) |
| 80 to 84 Years | 10 (1.8%) | 17 (2.8%) |
| 85 Years and over | 13 (2.3%) | 54 (8.8%) |
| Total | 561 (100.0%) | 615 (100.0%) |
Families and Households in Independence
Median Family Size in Independence
The median family size in Independence is 2.82 persons per family, with single male/father families (12 | 4.3%) accounting for the largest median family size of 4.5 persons per family. On the other hand, single female/mother families (57 | 20.5%) represent the smallest median family size with 2.58 persons per family.
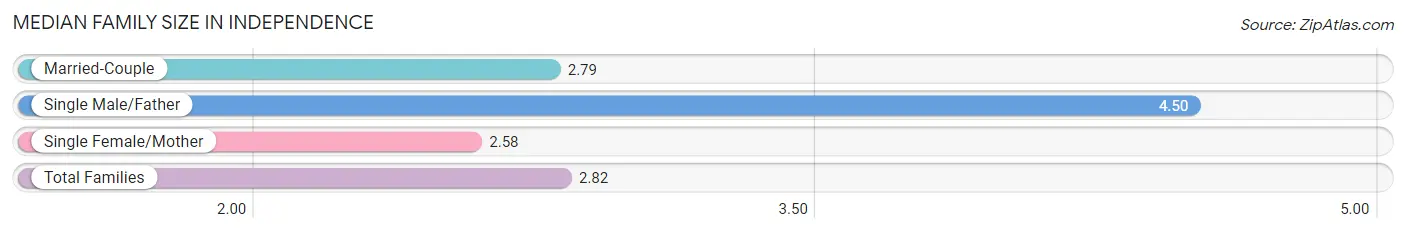
| Family Type | # Families | Family Size |
| Married-Couple | 209 (75.2%) | 2.79 |
| Single Male/Father | 12 (4.3%) | 4.50 |
| Single Female/Mother | 57 (20.5%) | 2.58 |
| Total Families | 278 (100.0%) | 2.82 |
Median Household Size in Independence
The median household size in Independence is 2.28 persons per household, with single male/father households (12 | 2.6%) accounting for the largest median household size of 4.5 persons per household. non-family households (176 | 38.8%) represent the smallest median household size with 1.16 persons per household.
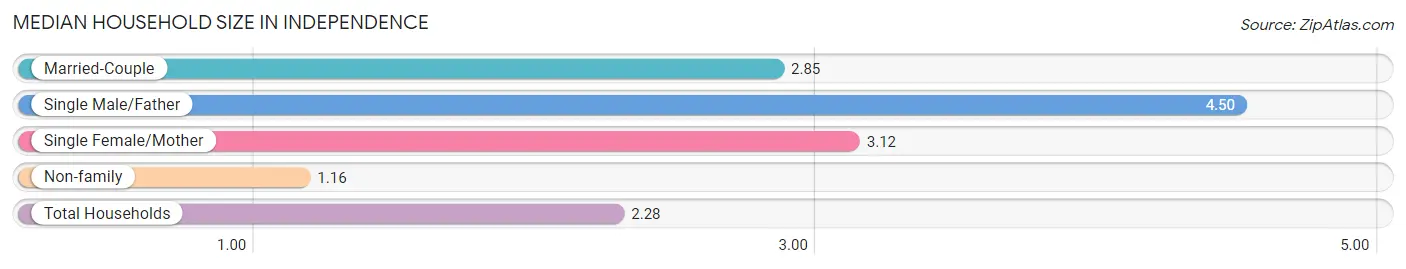
| Household Type | # Households | Household Size |
| Married-Couple | 209 (46.0%) | 2.85 |
| Single Male/Father | 12 (2.6%) | 4.50 |
| Single Female/Mother | 57 (12.6%) | 3.12 |
| Non-family | 176 (38.8%) | 1.16 |
| Total Households | 454 (100.0%) | 2.28 |
Household Size by Marriage Status in Independence
Out of a total of 454 households in Independence, 278 (61.2%) are family households, while 176 (38.8%) are nonfamily households. The most numerous type of family households are 2-person households, comprising 152, and the most common type of nonfamily households are 1-person households, comprising 160.
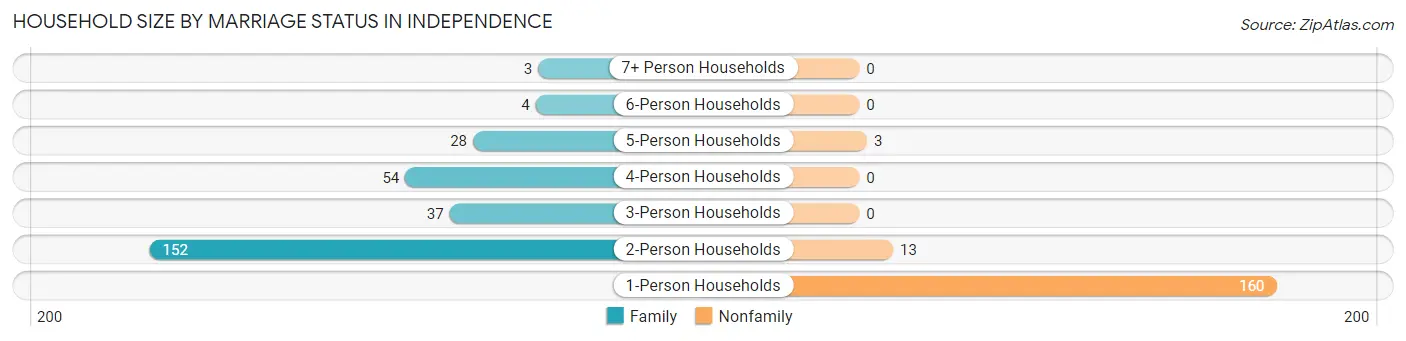
| Household Size | Family Households | Nonfamily Households |
| 1-Person Households | - | 160 (35.2%) |
| 2-Person Households | 152 (33.5%) | 13 (2.9%) |
| 3-Person Households | 37 (8.2%) | 0 (0.0%) |
| 4-Person Households | 54 (11.9%) | 0 (0.0%) |
| 5-Person Households | 28 (6.2%) | 3 (0.7%) |
| 6-Person Households | 4 (0.9%) | 0 (0.0%) |
| 7+ Person Households | 3 (0.7%) | 0 (0.0%) |
| Total | 278 (61.2%) | 176 (38.8%) |
Female Fertility in Independence
Fertility by Age in Independence
Average fertility rate in Independence is 97.0 births per 1,000 women. Women in the age bracket of 20 to 34 years have the highest fertility rate with 190.0 births per 1,000 women. Women in the age bracket of 20 to 34 years acount for 100.0% of all women with births.
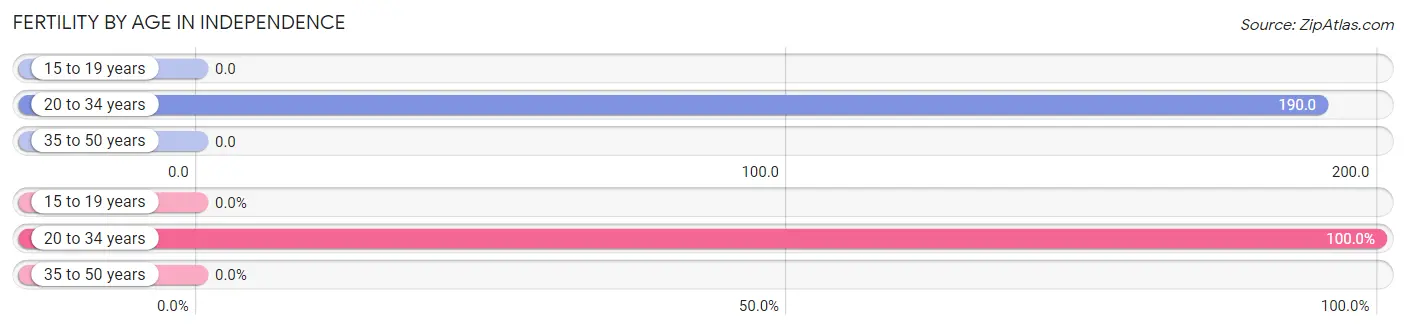
| Age Bracket | Women with Births | Births / 1,000 Women |
| 15 to 19 years | 0 (0.0%) | 0.0 |
| 20 to 34 years | 15 (100.0%) | 190.0 |
| 35 to 50 years | 0 (0.0%) | 0.0 |
| Total | 15 (100.0%) | 97.0 |
Fertility by Age by Marriage Status in Independence
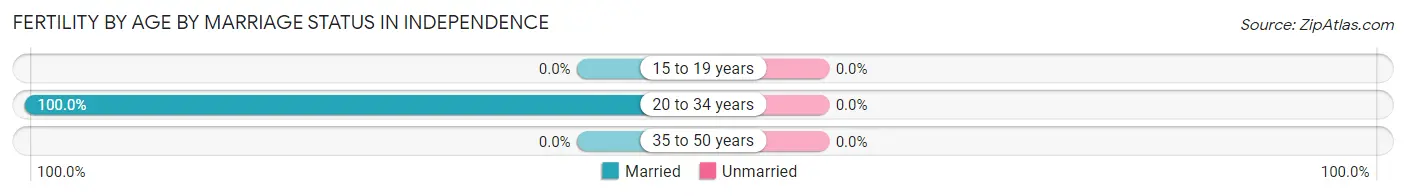
| Age Bracket | Married | Unmarried |
| 15 to 19 years | 0 (0.0%) | 0 (0.0%) |
| 20 to 34 years | 15 (100.0%) | 0 (0.0%) |
| 35 to 50 years | 0 (0.0%) | 0 (0.0%) |
| Total | 15 (100.0%) | 0 (0.0%) |
Fertility by Education in Independence
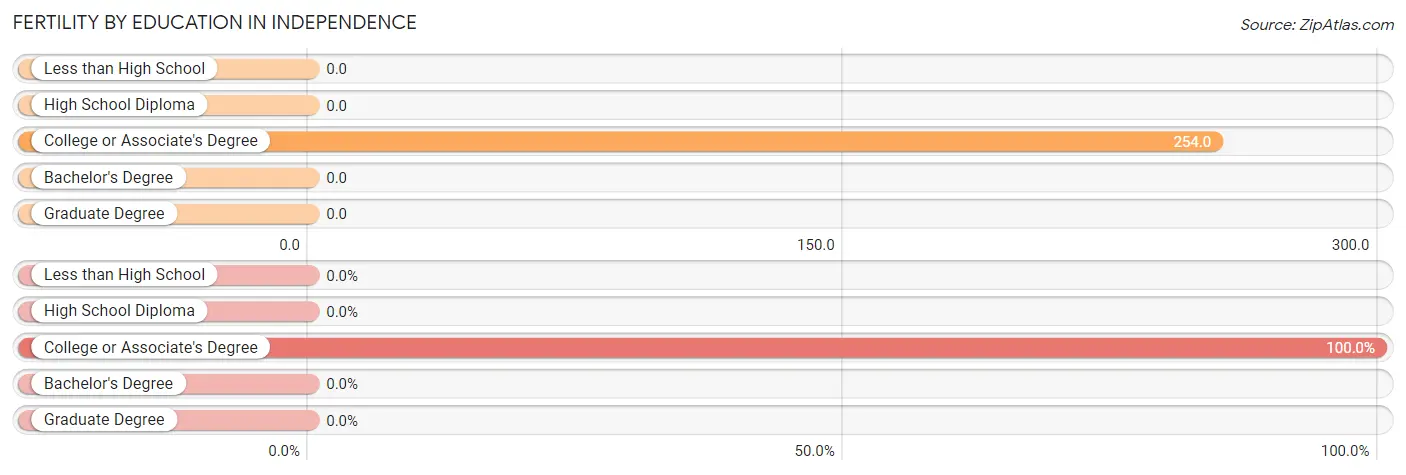
| Educational Attainment | Women with Births | Births / 1,000 Women |
| Less than High School | 0 (0.0%) | 0.0 |
| High School Diploma | 0 (0.0%) | 0.0 |
| College or Associate's Degree | 15 (100.0%) | 254.0 |
| Bachelor's Degree | 0 (0.0%) | 0.0 |
| Graduate Degree | 0 (0.0%) | 0.0 |
| Total | 15 (100.0%) | 97.0 |
Fertility by Education by Marriage Status in Independence
| Educational Attainment | Married | Unmarried |
| Less than High School | 0 (0.0%) | 0 (0.0%) |
| High School Diploma | 0 (0.0%) | 0 (0.0%) |
| College or Associate's Degree | 15 (100.0%) | 0 (0.0%) |
| Bachelor's Degree | 0 (0.0%) | 0 (0.0%) |
| Graduate Degree | 0 (0.0%) | 0 (0.0%) |
| Total | 15 (100.0%) | 0 (0.0%) |
Employment Characteristics in Independence
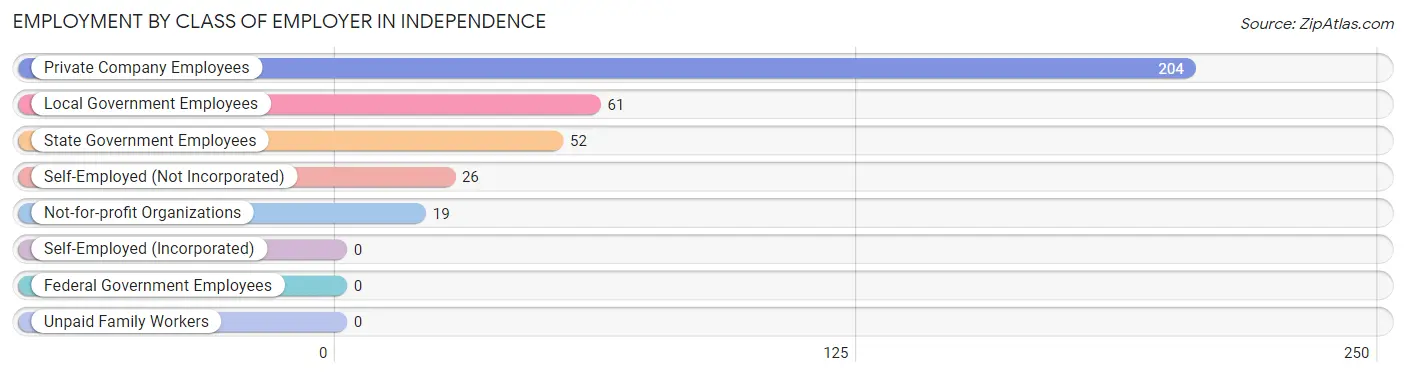
Employment by Class of Employer in Independence
Among the 362 employed individuals in Independence, private company employees (204 | 56.4%), local government employees (61 | 16.9%), and state government employees (52 | 14.4%) make up the most common classes of employment.
| Employer Class | # Employees | % Employees |
| Private Company Employees | 204 | 56.4% |
| Self-Employed (Incorporated) | 0 | 0.0% |
| Self-Employed (Not Incorporated) | 26 | 7.2% |
| Not-for-profit Organizations | 19 | 5.2% |
| Local Government Employees | 61 | 16.9% |
| State Government Employees | 52 | 14.4% |
| Federal Government Employees | 0 | 0.0% |
| Unpaid Family Workers | 0 | 0.0% |
| Total | 362 | 100.0% |
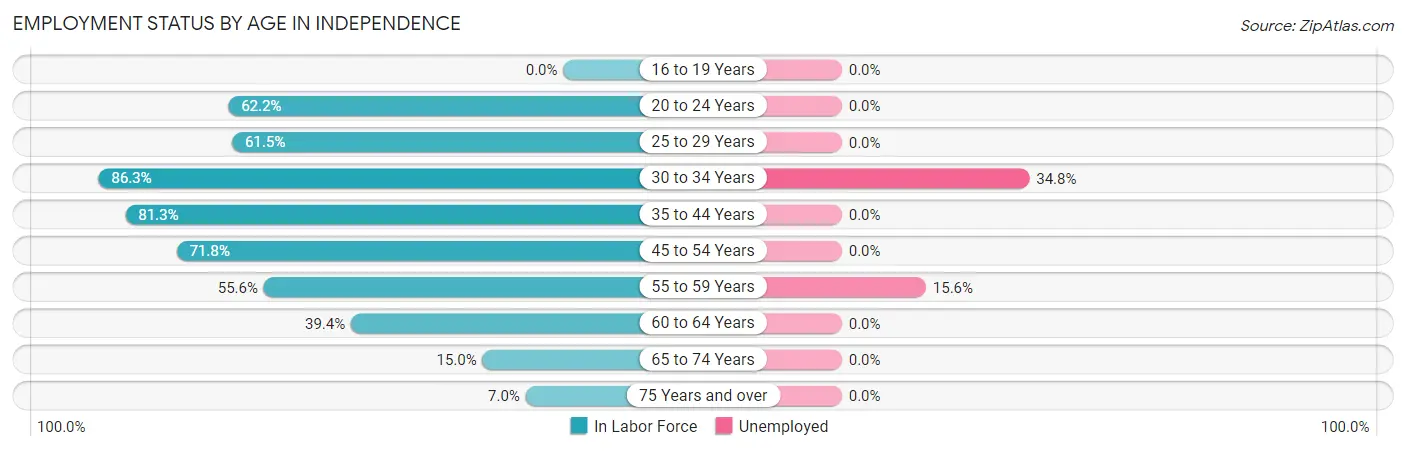
Employment Status by Age in Independence
According to the labor force statistics for Independence, out of the total population over 16 years of age (963), 41.5% or 400 individuals are in the labor force, with 7.8% or 31 of them unemployed. The age group with the highest labor force participation rate is 30 to 34 years, with 86.3% or 69 individuals in the labor force. Within the labor force, the 30 to 34 years age range has the highest percentage of unemployed individuals, with 34.8% or 24 of them being unemployed.
| Age Bracket | In Labor Force | Unemployed |
| 16 to 19 Years | 0 (0.0%) | 0 (0.0%) |
| 20 to 24 Years | 46 (62.2%) | 0 (0.0%) |
| 25 to 29 Years | 16 (61.5%) | 0 (0.0%) |
| 30 to 34 Years | 69 (86.3%) | 24 (34.8%) |
| 35 to 44 Years | 52 (81.3%) | 0 (0.0%) |
| 45 to 54 Years | 79 (71.8%) | 0 (0.0%) |
| 55 to 59 Years | 45 (55.6%) | 7 (15.6%) |
| 60 to 64 Years | 50 (39.4%) | 0 (0.0%) |
| 65 to 74 Years | 30 (15.0%) | 0 (0.0%) |
| 75 Years and over | 13 (7.0%) | 0 (0.0%) |
| Total | 400 (41.5%) | 31 (7.8%) |
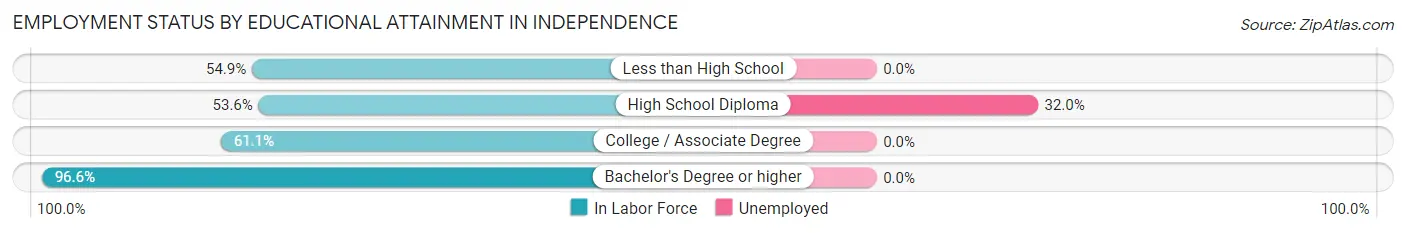
Employment Status by Educational Attainment in Independence
According to labor force statistics for Independence, 63.7% of individuals (311) out of the total population between 25 and 64 years of age (488) are in the labor force, with 10.0% or 31 of them being unemployed. The group with the highest labor force participation rate are those with the educational attainment of bachelor's degree or higher, with 96.6% or 84 individuals in the labor force. Within the labor force, individuals with high school diploma education have the highest percentage of unemployment, with 32.0% or 31 of them being unemployed.
| Educational Attainment | In Labor Force | Unemployed |
| Less than High School | 39 (54.9%) | 0 (0.0%) |
| High School Diploma | 97 (53.6%) | 58 (32.0%) |
| College / Associate Degree | 91 (61.1%) | 0 (0.0%) |
| Bachelor's Degree or higher | 84 (96.6%) | 0 (0.0%) |
| Total | 311 (63.7%) | 49 (10.0%) |
Employment Occupations by Sex in Independence
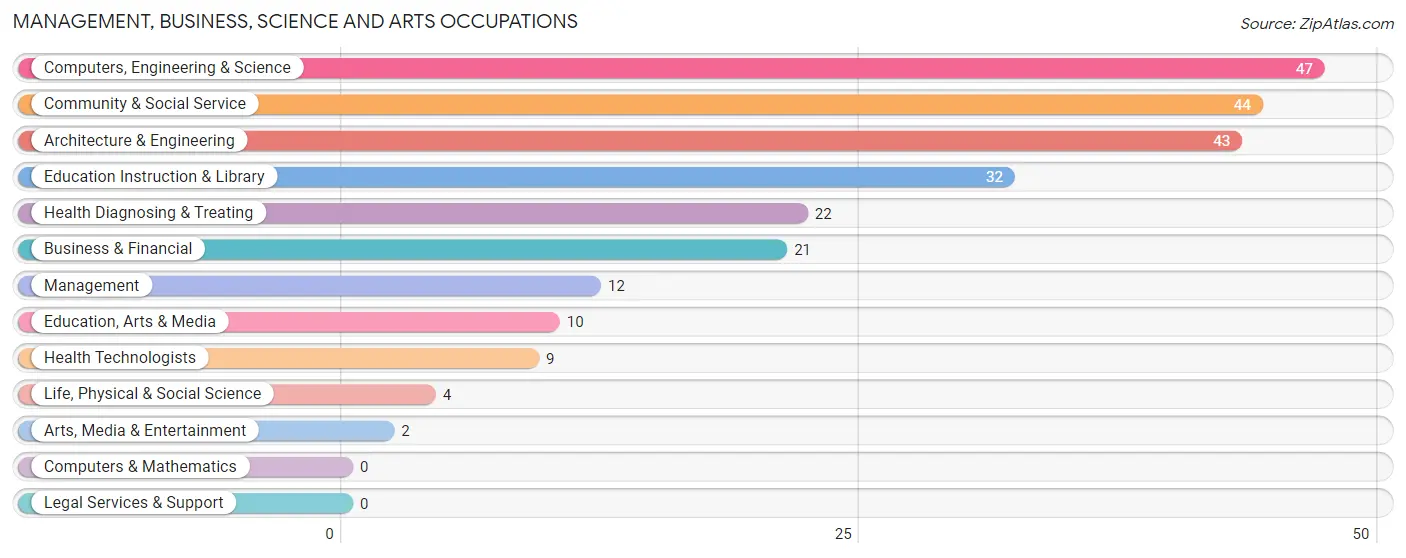
Management, Business, Science and Arts Occupations
The most common Management, Business, Science and Arts occupations in Independence are Computers, Engineering & Science (47 | 12.7%), Community & Social Service (44 | 11.9%), Architecture & Engineering (43 | 11.7%), Education Instruction & Library (32 | 8.7%), and Health Diagnosing & Treating (22 | 6.0%).
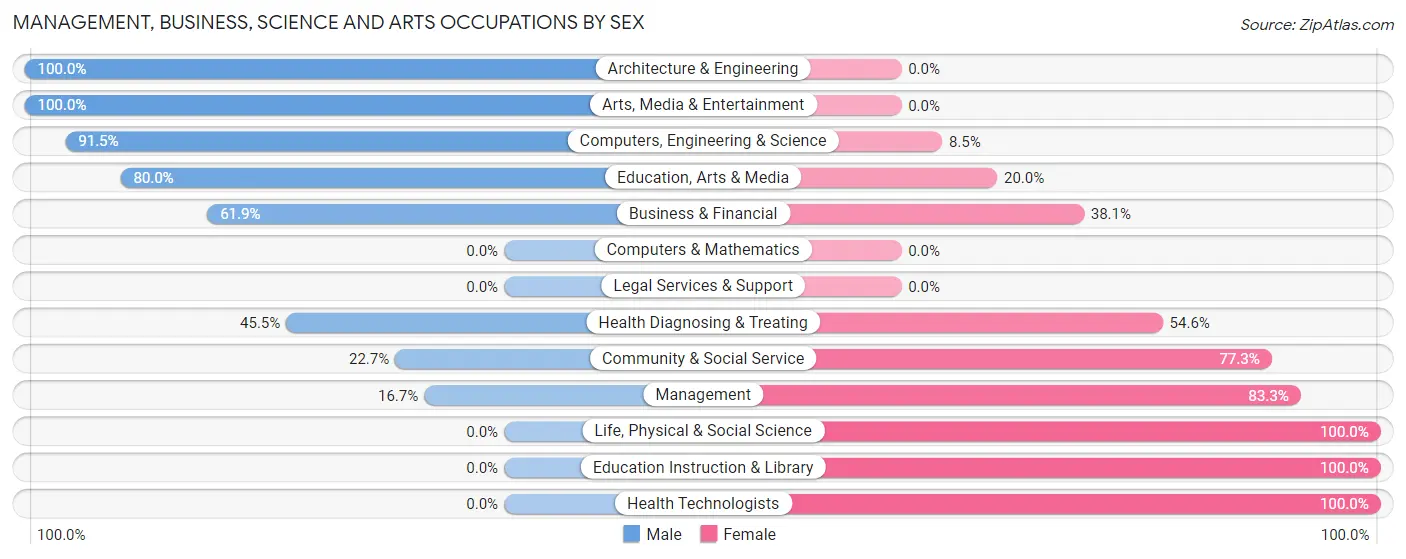
Management, Business, Science and Arts Occupations by Sex
Within the Management, Business, Science and Arts occupations in Independence, the most male-oriented occupations are Architecture & Engineering (100.0%), Arts, Media & Entertainment (100.0%), and Computers, Engineering & Science (91.5%), while the most female-oriented occupations are Life, Physical & Social Science (100.0%), Education Instruction & Library (100.0%), and Health Technologists (100.0%).
| Occupation | Male | Female |
| Management | 2 (16.7%) | 10 (83.3%) |
| Business & Financial | 13 (61.9%) | 8 (38.1%) |
| Computers, Engineering & Science | 43 (91.5%) | 4 (8.5%) |
| Computers & Mathematics | 0 (0.0%) | 0 (0.0%) |
| Architecture & Engineering | 43 (100.0%) | 0 (0.0%) |
| Life, Physical & Social Science | 0 (0.0%) | 4 (100.0%) |
| Community & Social Service | 10 (22.7%) | 34 (77.3%) |
| Education, Arts & Media | 8 (80.0%) | 2 (20.0%) |
| Legal Services & Support | 0 (0.0%) | 0 (0.0%) |
| Education Instruction & Library | 0 (0.0%) | 32 (100.0%) |
| Arts, Media & Entertainment | 2 (100.0%) | 0 (0.0%) |
| Health Diagnosing & Treating | 10 (45.5%) | 12 (54.5%) |
| Health Technologists | 0 (0.0%) | 9 (100.0%) |
| Total (Category) | 78 (53.4%) | 68 (46.6%) |
| Total (Overall) | 203 (55.0%) | 166 (45.0%) |
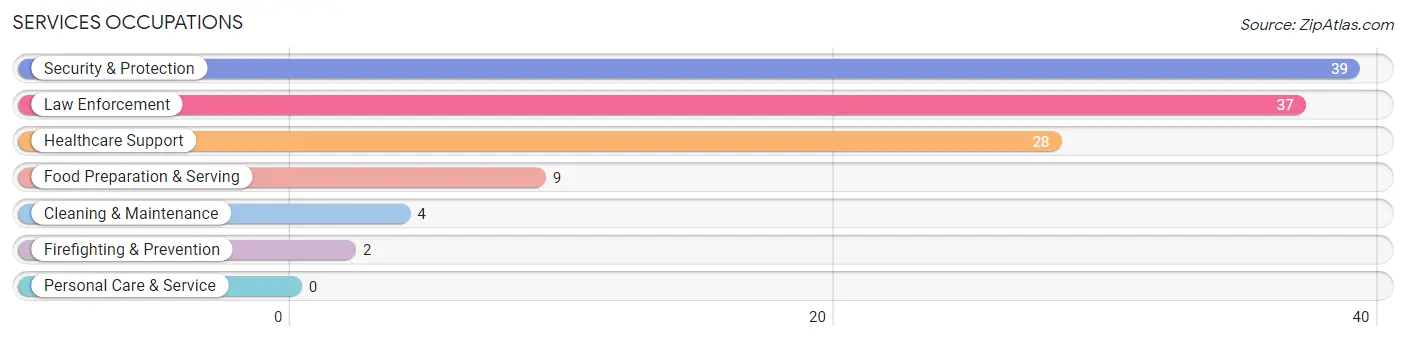
Services Occupations
The most common Services occupations in Independence are Security & Protection (39 | 10.6%), Law Enforcement (37 | 10.0%), Healthcare Support (28 | 7.6%), Food Preparation & Serving (9 | 2.4%), and Cleaning & Maintenance (4 | 1.1%).
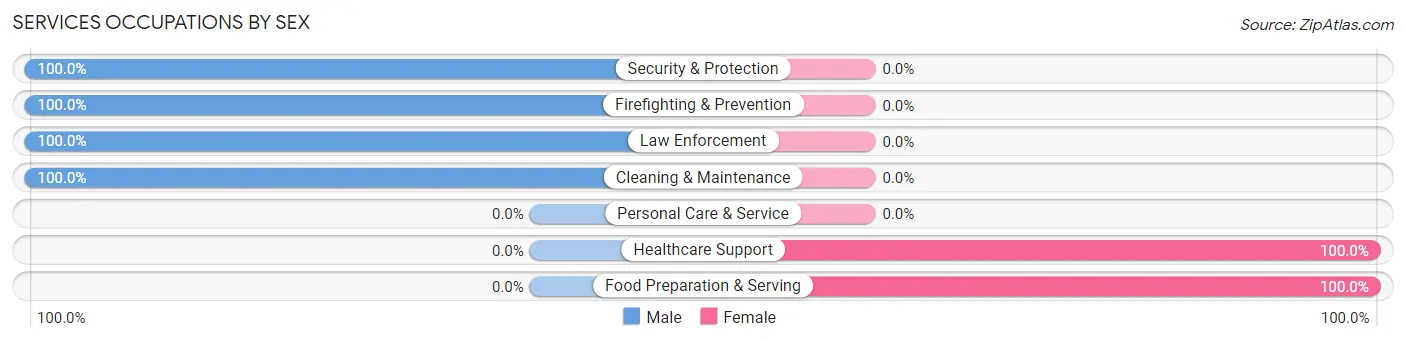
Services Occupations by Sex
Within the Services occupations in Independence, the most male-oriented occupations are Security & Protection (100.0%), Firefighting & Prevention (100.0%), and Law Enforcement (100.0%), while the most female-oriented occupations are Healthcare Support (100.0%), and Food Preparation & Serving (100.0%).
| Occupation | Male | Female |
| Healthcare Support | 0 (0.0%) | 28 (100.0%) |
| Security & Protection | 39 (100.0%) | 0 (0.0%) |
| Firefighting & Prevention | 2 (100.0%) | 0 (0.0%) |
| Law Enforcement | 37 (100.0%) | 0 (0.0%) |
| Food Preparation & Serving | 0 (0.0%) | 9 (100.0%) |
| Cleaning & Maintenance | 4 (100.0%) | 0 (0.0%) |
| Personal Care & Service | 0 (0.0%) | 0 (0.0%) |
| Total (Category) | 43 (53.7%) | 37 (46.3%) |
| Total (Overall) | 203 (55.0%) | 166 (45.0%) |
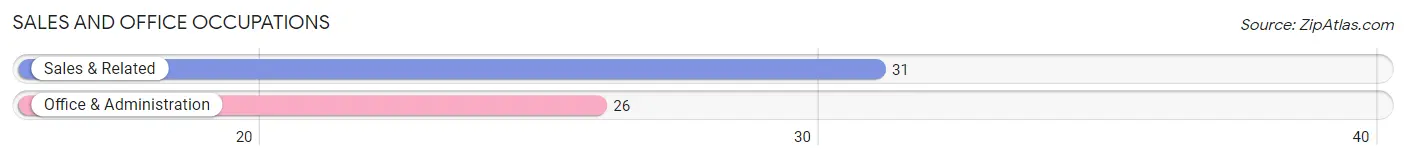
Sales and Office Occupations
The most common Sales and Office occupations in Independence are Sales & Related (31 | 8.4%), and Office & Administration (26 | 7.0%).
Sales and Office Occupations by Sex
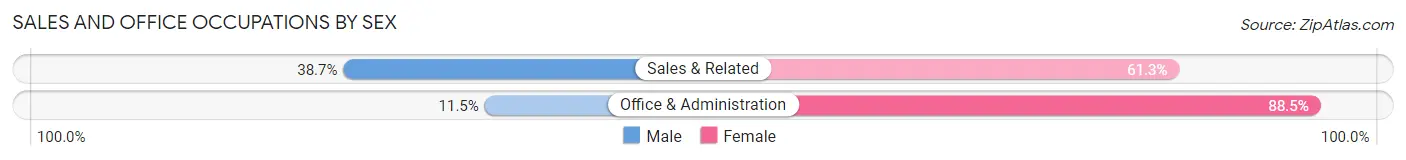
| Occupation | Male | Female |
| Sales & Related | 12 (38.7%) | 19 (61.3%) |
| Office & Administration | 3 (11.5%) | 23 (88.5%) |
| Total (Category) | 15 (26.3%) | 42 (73.7%) |
| Total (Overall) | 203 (55.0%) | 166 (45.0%) |
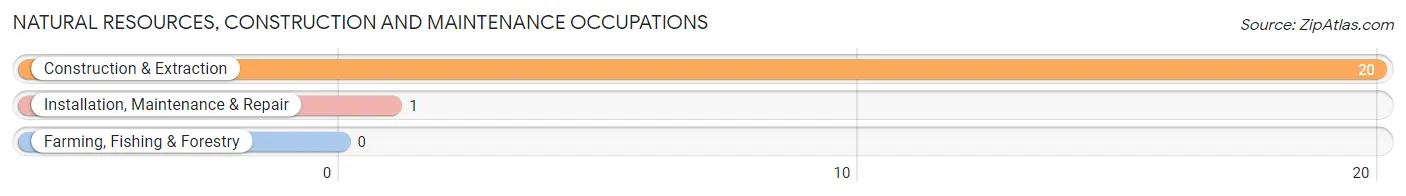
Natural Resources, Construction and Maintenance Occupations
The most common Natural Resources, Construction and Maintenance occupations in Independence are Construction & Extraction (20 | 5.4%), and Installation, Maintenance & Repair (1 | 0.3%).
Natural Resources, Construction and Maintenance Occupations by Sex
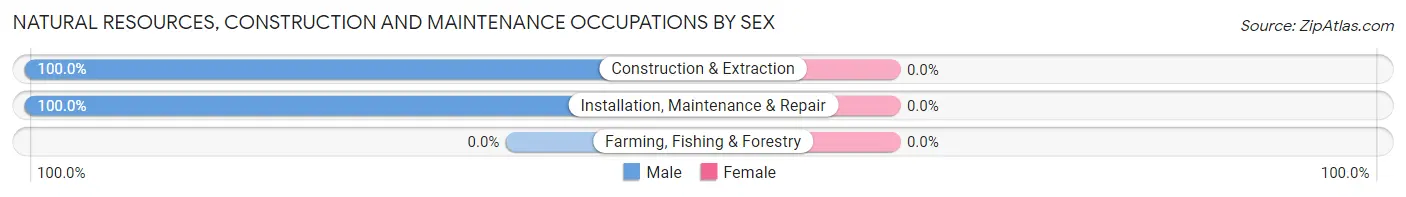
| Occupation | Male | Female |
| Farming, Fishing & Forestry | 0 (0.0%) | 0 (0.0%) |
| Construction & Extraction | 20 (100.0%) | 0 (0.0%) |
| Installation, Maintenance & Repair | 1 (100.0%) | 0 (0.0%) |
| Total (Category) | 21 (100.0%) | 0 (0.0%) |
| Total (Overall) | 203 (55.0%) | 166 (45.0%) |
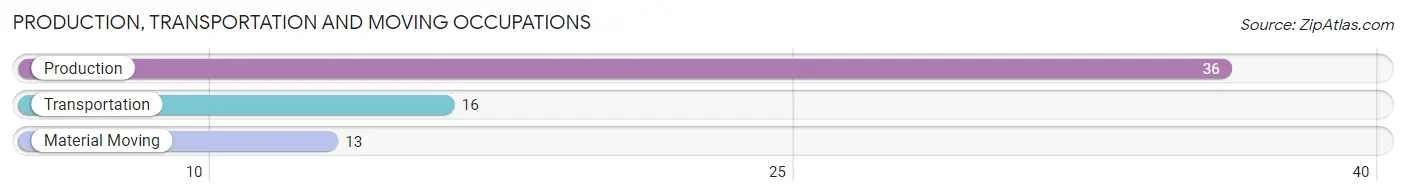
Production, Transportation and Moving Occupations
The most common Production, Transportation and Moving occupations in Independence are Production (36 | 9.8%), Transportation (16 | 4.3%), and Material Moving (13 | 3.5%).
Production, Transportation and Moving Occupations by Sex
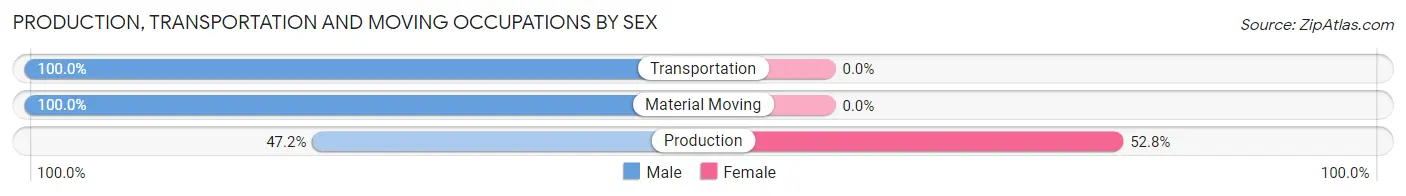
| Occupation | Male | Female |
| Production | 17 (47.2%) | 19 (52.8%) |
| Transportation | 16 (100.0%) | 0 (0.0%) |
| Material Moving | 13 (100.0%) | 0 (0.0%) |
| Total (Category) | 46 (70.8%) | 19 (29.2%) |
| Total (Overall) | 203 (55.0%) | 166 (45.0%) |
Employment Industries by Sex in Independence
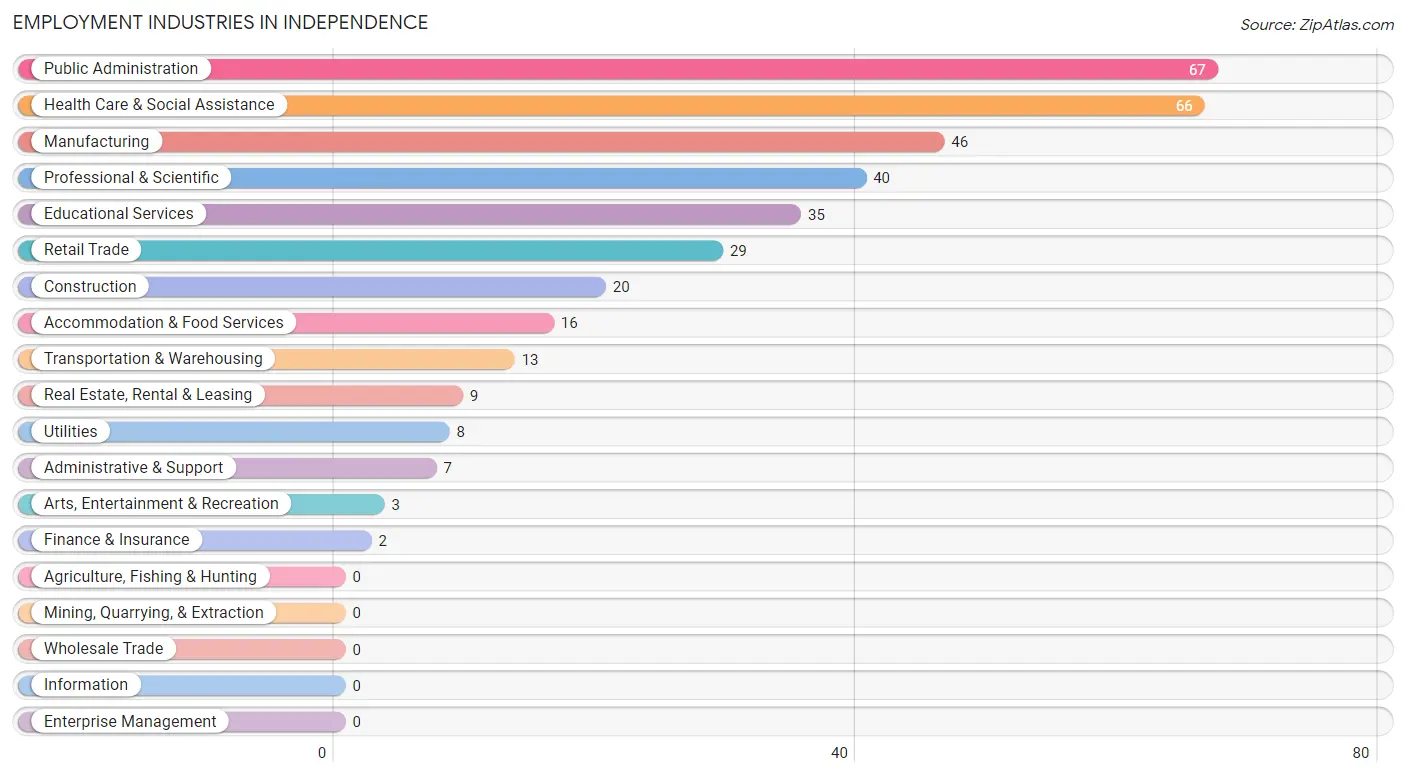
Employment Industries in Independence
The major employment industries in Independence include Public Administration (67 | 18.2%), Health Care & Social Assistance (66 | 17.9%), Manufacturing (46 | 12.5%), Professional & Scientific (40 | 10.8%), and Educational Services (35 | 9.5%).
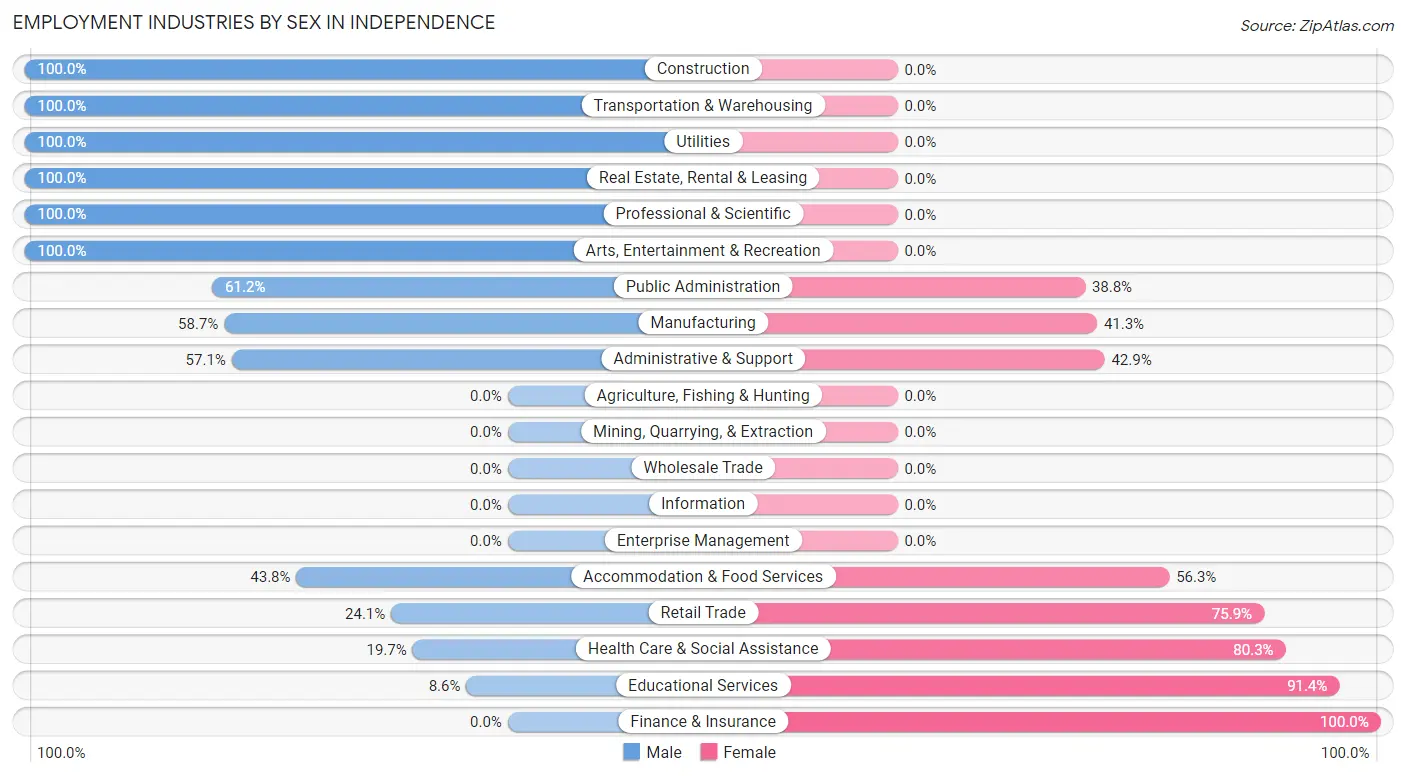
Employment Industries by Sex in Independence
The Independence industries that see more men than women are Construction (100.0%), Transportation & Warehousing (100.0%), and Utilities (100.0%), whereas the industries that tend to have a higher number of women are Finance & Insurance (100.0%), Educational Services (91.4%), and Health Care & Social Assistance (80.3%).
| Industry | Male | Female |
| Agriculture, Fishing & Hunting | 0 (0.0%) | 0 (0.0%) |
| Mining, Quarrying, & Extraction | 0 (0.0%) | 0 (0.0%) |
| Construction | 20 (100.0%) | 0 (0.0%) |
| Manufacturing | 27 (58.7%) | 19 (41.3%) |
| Wholesale Trade | 0 (0.0%) | 0 (0.0%) |
| Retail Trade | 7 (24.1%) | 22 (75.9%) |
| Transportation & Warehousing | 13 (100.0%) | 0 (0.0%) |
| Utilities | 8 (100.0%) | 0 (0.0%) |
| Information | 0 (0.0%) | 0 (0.0%) |
| Finance & Insurance | 0 (0.0%) | 2 (100.0%) |
| Real Estate, Rental & Leasing | 9 (100.0%) | 0 (0.0%) |
| Professional & Scientific | 40 (100.0%) | 0 (0.0%) |
| Enterprise Management | 0 (0.0%) | 0 (0.0%) |
| Administrative & Support | 4 (57.1%) | 3 (42.9%) |
| Educational Services | 3 (8.6%) | 32 (91.4%) |
| Health Care & Social Assistance | 13 (19.7%) | 53 (80.3%) |
| Arts, Entertainment & Recreation | 3 (100.0%) | 0 (0.0%) |
| Accommodation & Food Services | 7 (43.8%) | 9 (56.2%) |
| Public Administration | 41 (61.2%) | 26 (38.8%) |
| Total | 203 (55.0%) | 166 (45.0%) |
Education in Independence
School Enrollment in Independence
The most common levels of schooling among the 204 students in Independence are middle school (65 | 31.9%), high school (39 | 19.1%), and college / undergraduate (28 | 13.7%).
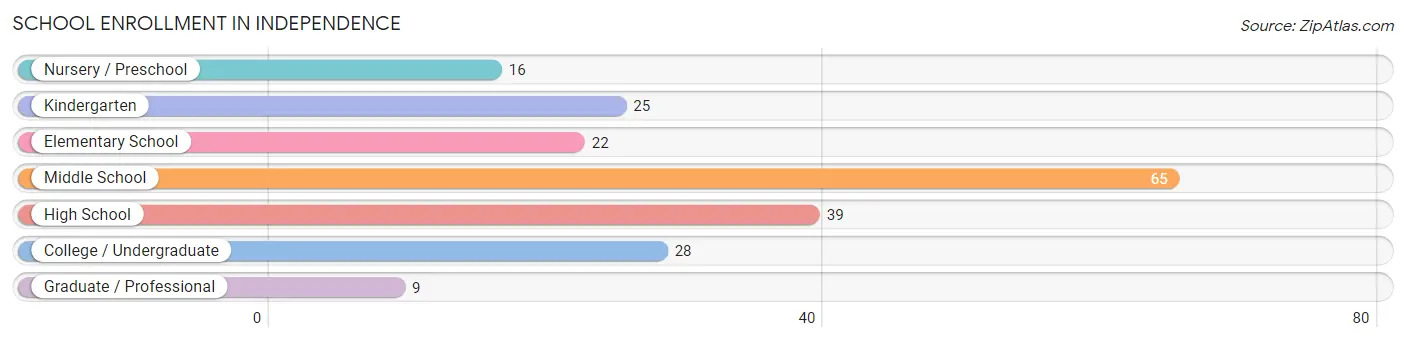
| School Level | # Students | % Students |
| Nursery / Preschool | 16 | 7.8% |
| Kindergarten | 25 | 12.2% |
| Elementary School | 22 | 10.8% |
| Middle School | 65 | 31.9% |
| High School | 39 | 19.1% |
| College / Undergraduate | 28 | 13.7% |
| Graduate / Professional | 9 | 4.4% |
| Total | 204 | 100.0% |
School Enrollment by Age by Funding Source in Independence
Out of a total of 204 students who are enrolled in schools in Independence, 12 (5.9%) attend a private institution, while the remaining 192 (94.1%) are enrolled in public schools. The age group of 35 years and over has the highest likelihood of being enrolled in private schools, with 10 (62.5% in the age bracket) enrolled. Conversely, the age group of 3 to 4 year olds has the lowest likelihood of being enrolled in a private school, with 4 (100.0% in the age bracket) attending a public institution.
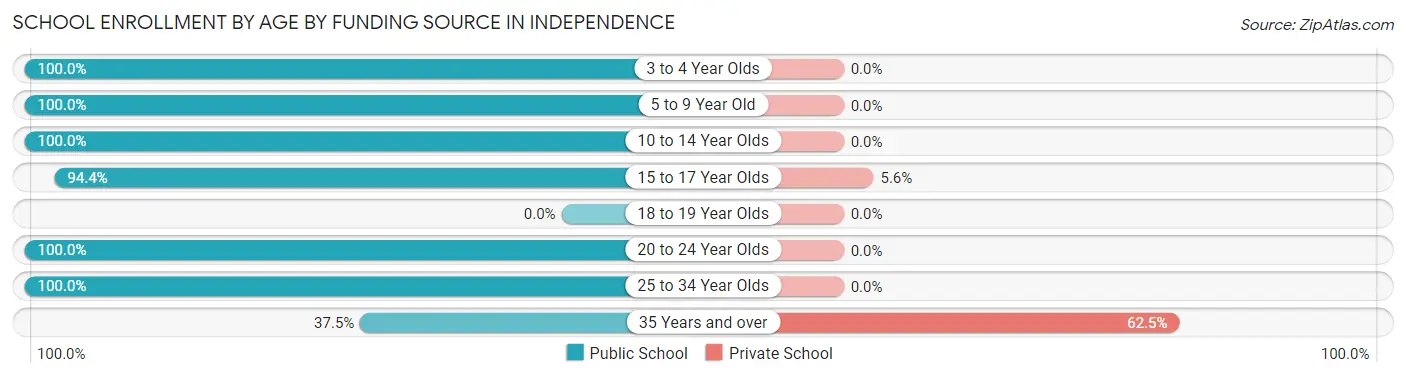
| Age Bracket | Public School | Private School |
| 3 to 4 Year Olds | 4 (100.0%) | 0 (0.0%) |
| 5 to 9 Year Old | 59 (100.0%) | 0 (0.0%) |
| 10 to 14 Year Olds | 68 (100.0%) | 0 (0.0%) |
| 15 to 17 Year Olds | 34 (94.4%) | 2 (5.6%) |
| 18 to 19 Year Olds | 0 (0.0%) | 0 (0.0%) |
| 20 to 24 Year Olds | 4 (100.0%) | 0 (0.0%) |
| 25 to 34 Year Olds | 17 (100.0%) | 0 (0.0%) |
| 35 Years and over | 6 (37.5%) | 10 (62.5%) |
| Total | 192 (94.1%) | 12 (5.9%) |
Educational Attainment by Field of Study in Independence
Education (63 | 37.3%), engineering (42 | 24.8%), literature & languages (19 | 11.2%), psychology (10 | 5.9%), and bio, nature & agricultural (9 | 5.3%) are the most common fields of study among 169 individuals in Independence who have obtained a bachelor's degree or higher.
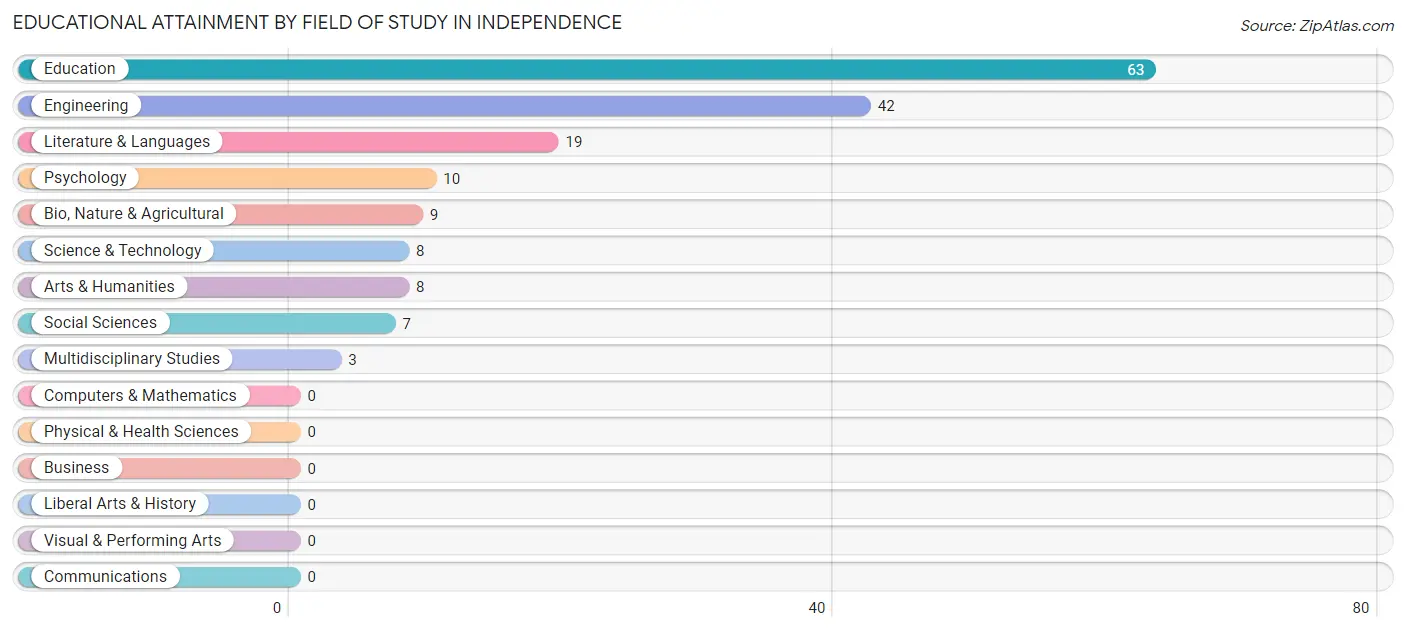
| Field of Study | # Graduates | % Graduates |
| Computers & Mathematics | 0 | 0.0% |
| Bio, Nature & Agricultural | 9 | 5.3% |
| Physical & Health Sciences | 0 | 0.0% |
| Psychology | 10 | 5.9% |
| Social Sciences | 7 | 4.1% |
| Engineering | 42 | 24.8% |
| Multidisciplinary Studies | 3 | 1.8% |
| Science & Technology | 8 | 4.7% |
| Business | 0 | 0.0% |
| Education | 63 | 37.3% |
| Literature & Languages | 19 | 11.2% |
| Liberal Arts & History | 0 | 0.0% |
| Visual & Performing Arts | 0 | 0.0% |
| Communications | 0 | 0.0% |
| Arts & Humanities | 8 | 4.7% |
| Total | 169 | 100.0% |
Transportation & Commute in Independence
Vehicle Availability by Sex in Independence
The most prevalent vehicle ownership categories in Independence are males with 2 vehicles (62, accounting for 31.0%) and females with 2 vehicles (45, making up 38.3%).
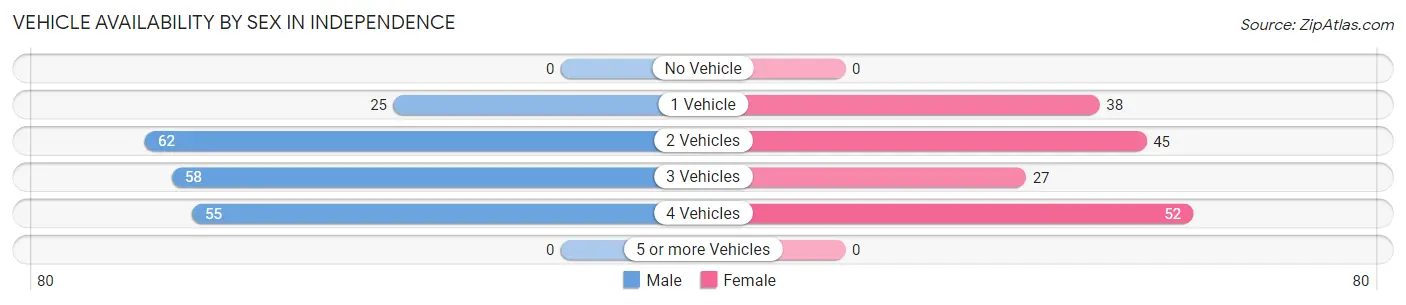
| Vehicles Available | Male | Female |
| No Vehicle | 0 (0.0%) | 0 (0.0%) |
| 1 Vehicle | 25 (12.5%) | 38 (23.5%) |
| 2 Vehicles | 62 (31.0%) | 45 (27.8%) |
| 3 Vehicles | 58 (29.0%) | 27 (16.7%) |
| 4 Vehicles | 55 (27.5%) | 52 (32.1%) |
| 5 or more Vehicles | 0 (0.0%) | 0 (0.0%) |
| Total | 200 (100.0%) | 162 (100.0%) |
Commute Time in Independence
The most frequently occuring commute durations in Independence are 30 to 34 minutes (70 commuters, 20.5%), 10 to 14 minutes (56 commuters, 16.4%), and less than 5 minutes (51 commuters, 14.9%).
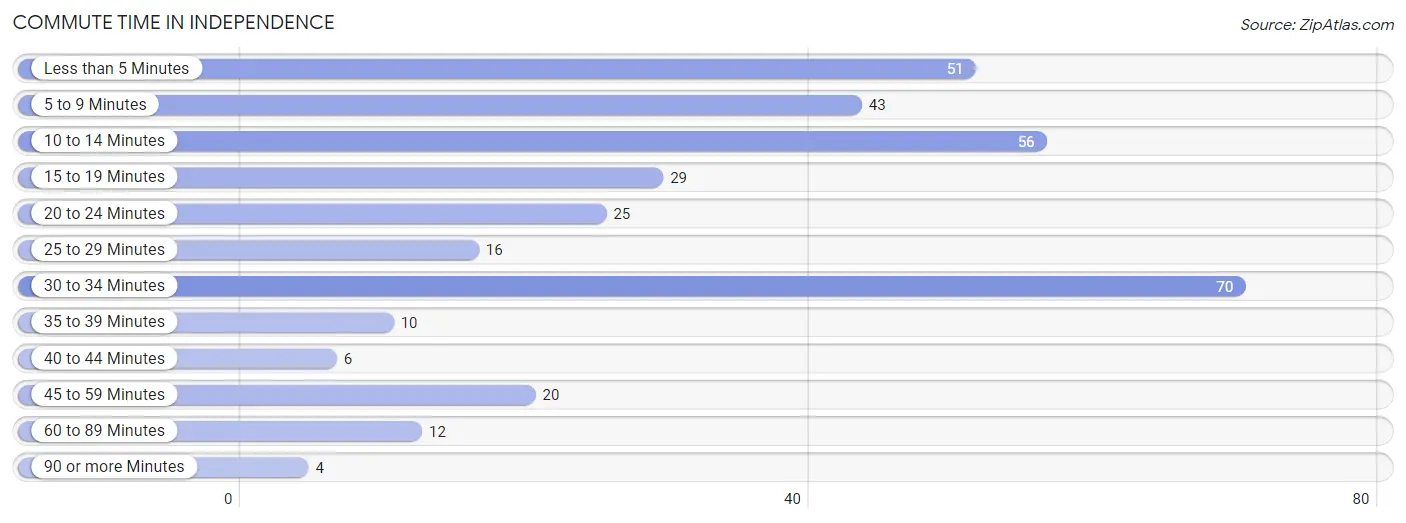
| Commute Time | # Commuters | % Commuters |
| Less than 5 Minutes | 51 | 14.9% |
| 5 to 9 Minutes | 43 | 12.6% |
| 10 to 14 Minutes | 56 | 16.4% |
| 15 to 19 Minutes | 29 | 8.5% |
| 20 to 24 Minutes | 25 | 7.3% |
| 25 to 29 Minutes | 16 | 4.7% |
| 30 to 34 Minutes | 70 | 20.5% |
| 35 to 39 Minutes | 10 | 2.9% |
| 40 to 44 Minutes | 6 | 1.8% |
| 45 to 59 Minutes | 20 | 5.9% |
| 60 to 89 Minutes | 12 | 3.5% |
| 90 or more Minutes | 4 | 1.2% |
Commute Time by Sex in Independence
The most common commute times in Independence are 30 to 34 minutes (61 commuters, 30.5%) for males and 15 to 19 minutes (28 commuters, 19.7%) for females.
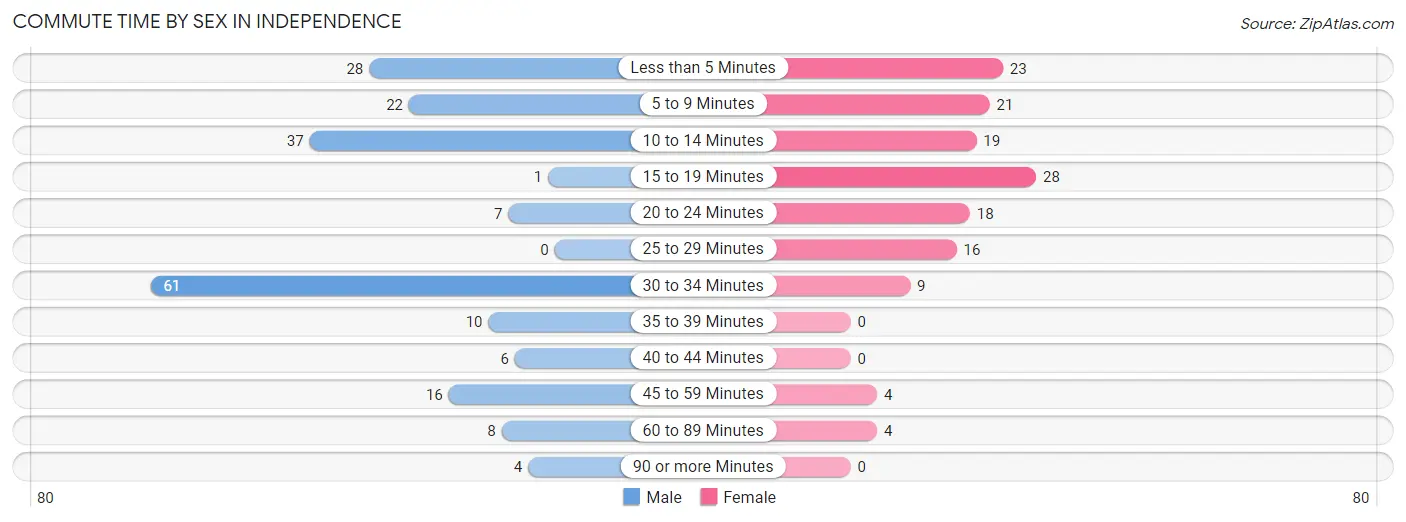
| Commute Time | Male | Female |
| Less than 5 Minutes | 28 (14.0%) | 23 (16.2%) |
| 5 to 9 Minutes | 22 (11.0%) | 21 (14.8%) |
| 10 to 14 Minutes | 37 (18.5%) | 19 (13.4%) |
| 15 to 19 Minutes | 1 (0.5%) | 28 (19.7%) |
| 20 to 24 Minutes | 7 (3.5%) | 18 (12.7%) |
| 25 to 29 Minutes | 0 (0.0%) | 16 (11.3%) |
| 30 to 34 Minutes | 61 (30.5%) | 9 (6.3%) |
| 35 to 39 Minutes | 10 (5.0%) | 0 (0.0%) |
| 40 to 44 Minutes | 6 (3.0%) | 0 (0.0%) |
| 45 to 59 Minutes | 16 (8.0%) | 4 (2.8%) |
| 60 to 89 Minutes | 8 (4.0%) | 4 (2.8%) |
| 90 or more Minutes | 4 (2.0%) | 0 (0.0%) |
Time of Departure to Work by Sex in Independence
The most frequent times of departure to work in Independence are 7:30 AM to 7:59 AM (49, 24.5%) for males and 7:30 AM to 7:59 AM (35, 24.6%) for females.
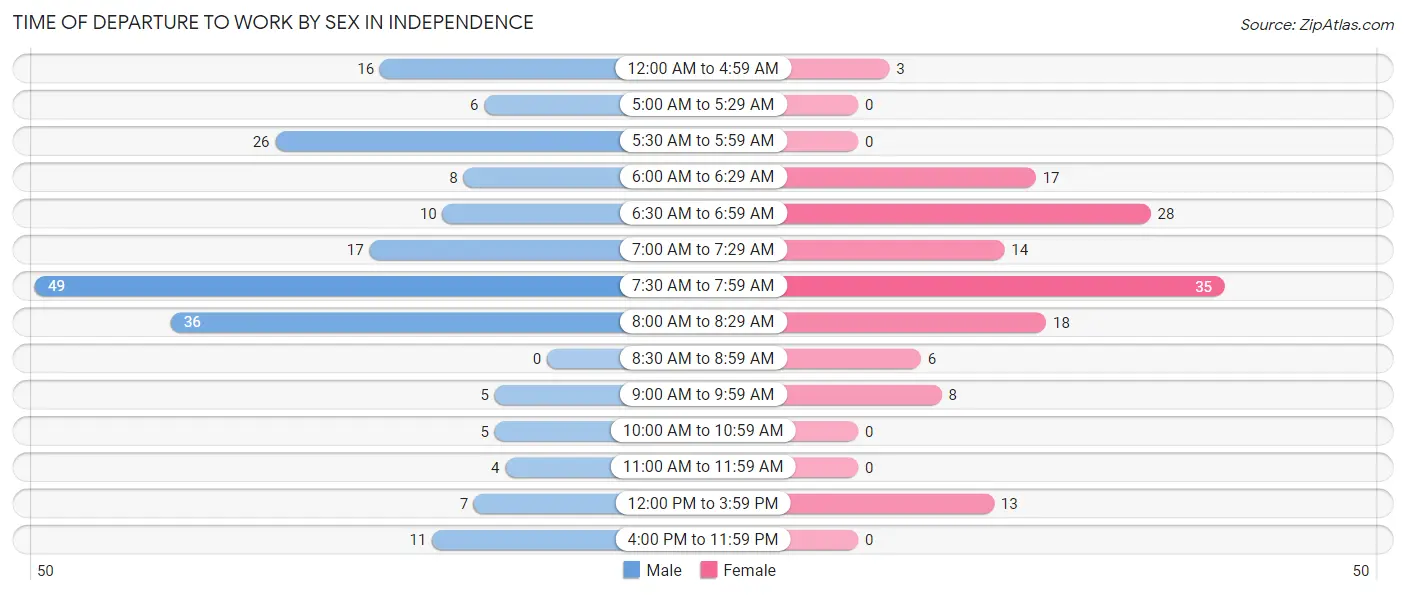
| Time of Departure | Male | Female |
| 12:00 AM to 4:59 AM | 16 (8.0%) | 3 (2.1%) |
| 5:00 AM to 5:29 AM | 6 (3.0%) | 0 (0.0%) |
| 5:30 AM to 5:59 AM | 26 (13.0%) | 0 (0.0%) |
| 6:00 AM to 6:29 AM | 8 (4.0%) | 17 (12.0%) |
| 6:30 AM to 6:59 AM | 10 (5.0%) | 28 (19.7%) |
| 7:00 AM to 7:29 AM | 17 (8.5%) | 14 (9.9%) |
| 7:30 AM to 7:59 AM | 49 (24.5%) | 35 (24.6%) |
| 8:00 AM to 8:29 AM | 36 (18.0%) | 18 (12.7%) |
| 8:30 AM to 8:59 AM | 0 (0.0%) | 6 (4.2%) |
| 9:00 AM to 9:59 AM | 5 (2.5%) | 8 (5.6%) |
| 10:00 AM to 10:59 AM | 5 (2.5%) | 0 (0.0%) |
| 11:00 AM to 11:59 AM | 4 (2.0%) | 0 (0.0%) |
| 12:00 PM to 3:59 PM | 7 (3.5%) | 13 (9.1%) |
| 4:00 PM to 11:59 PM | 11 (5.5%) | 0 (0.0%) |
| Total | 200 (100.0%) | 142 (100.0%) |
Housing Occupancy in Independence
Occupancy by Ownership in Independence
Of the total 454 dwellings in Independence, owner-occupied units account for 274 (60.4%), while renter-occupied units make up 180 (39.7%).
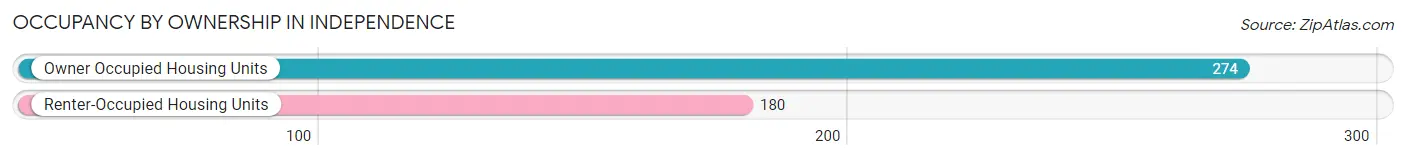
| Occupancy | # Housing Units | % Housing Units |
| Owner Occupied Housing Units | 274 | 60.4% |
| Renter-Occupied Housing Units | 180 | 39.7% |
| Total Occupied Housing Units | 454 | 100.0% |
Occupancy by Household Size in Independence
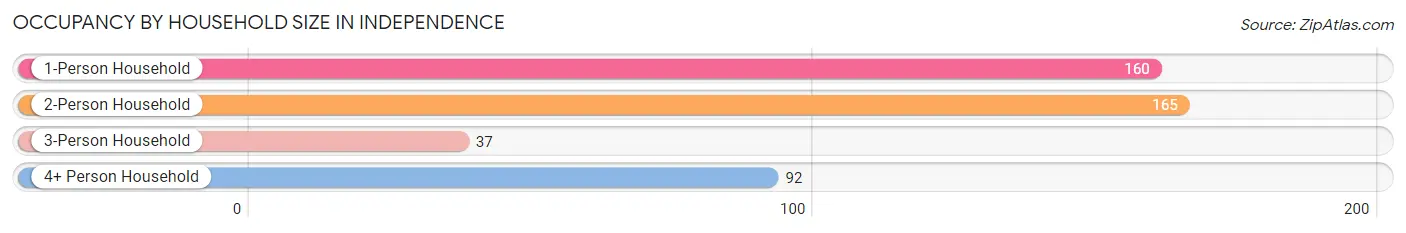
| Household Size | # Housing Units | % Housing Units |
| 1-Person Household | 160 | 35.2% |
| 2-Person Household | 165 | 36.3% |
| 3-Person Household | 37 | 8.2% |
| 4+ Person Household | 92 | 20.3% |
| Total Housing Units | 454 | 100.0% |
Occupancy by Ownership by Household Size in Independence
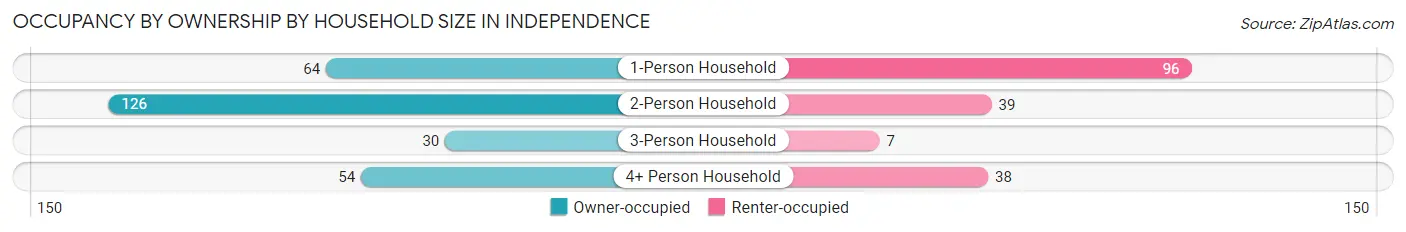
| Household Size | Owner-occupied | Renter-occupied |
| 1-Person Household | 64 (40.0%) | 96 (60.0%) |
| 2-Person Household | 126 (76.4%) | 39 (23.6%) |
| 3-Person Household | 30 (81.1%) | 7 (18.9%) |
| 4+ Person Household | 54 (58.7%) | 38 (41.3%) |
| Total Housing Units | 274 (60.4%) | 180 (39.7%) |
Occupancy by Educational Attainment in Independence
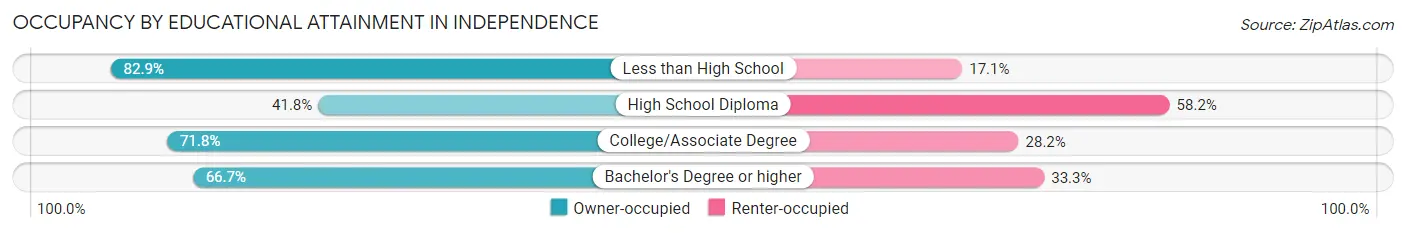
| Household Size | Owner-occupied | Renter-occupied |
| Less than High School | 34 (82.9%) | 7 (17.1%) |
| High School Diploma | 74 (41.8%) | 103 (58.2%) |
| College/Associate Degree | 122 (71.8%) | 48 (28.2%) |
| Bachelor's Degree or higher | 44 (66.7%) | 22 (33.3%) |
Occupancy by Age of Householder in Independence
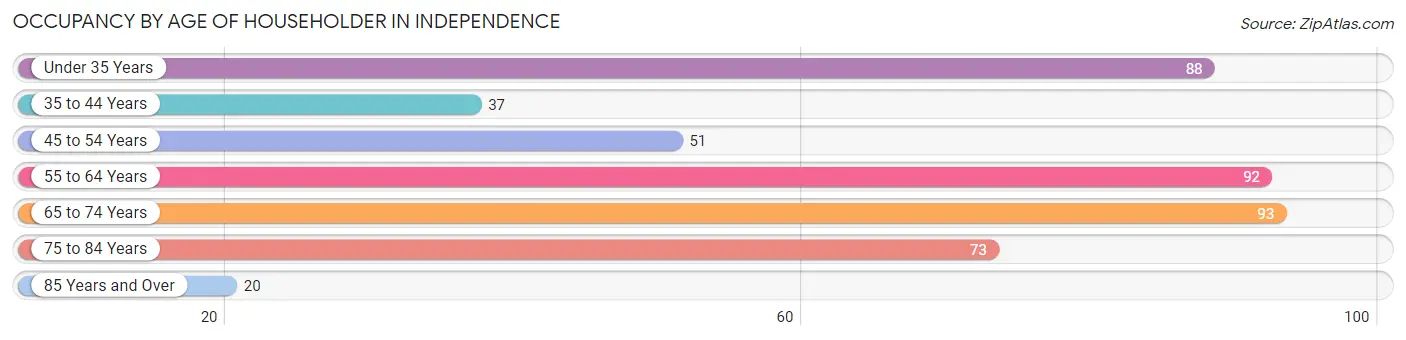
| Age Bracket | # Households | % Households |
| Under 35 Years | 88 | 19.4% |
| 35 to 44 Years | 37 | 8.2% |
| 45 to 54 Years | 51 | 11.2% |
| 55 to 64 Years | 92 | 20.3% |
| 65 to 74 Years | 93 | 20.5% |
| 75 to 84 Years | 73 | 16.1% |
| 85 Years and Over | 20 | 4.4% |
| Total | 454 | 100.0% |
Housing Finances in Independence
Median Income by Occupancy in Independence
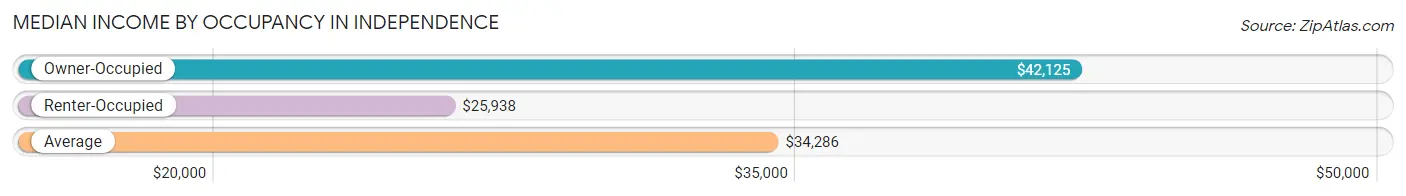
| Occupancy Type | # Households | Median Income |
| Owner-Occupied | 274 (60.4%) | $42,125 |
| Renter-Occupied | 180 (39.7%) | $25,938 |
| Average | 454 (100.0%) | $34,286 |
Occupancy by Householder Income Bracket in Independence
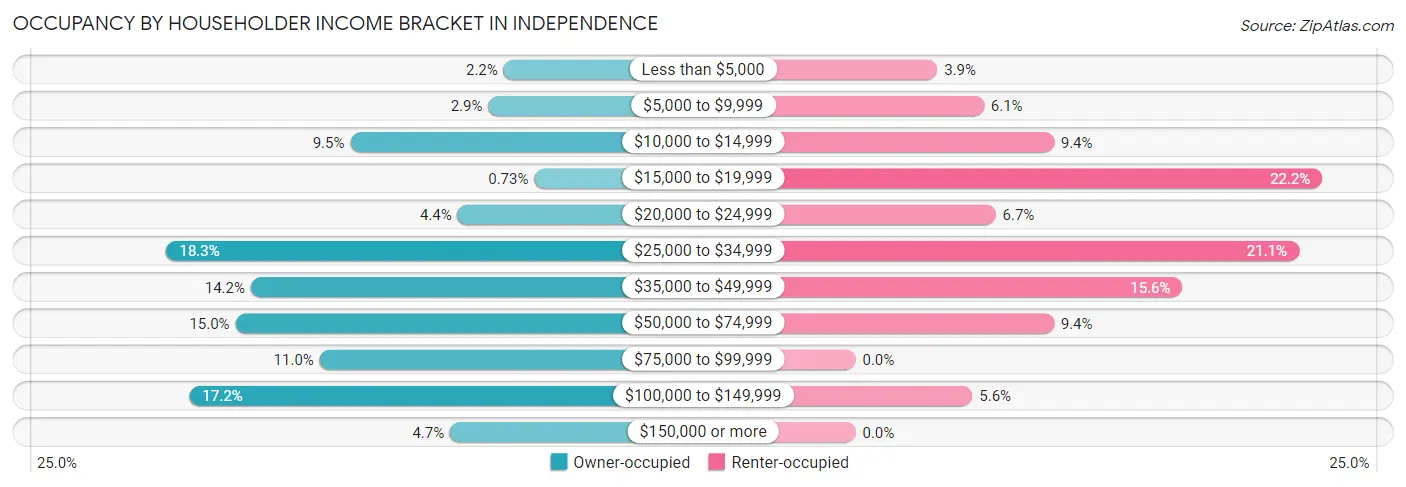
| Income Bracket | Owner-occupied | Renter-occupied |
| Less than $5,000 | 6 (2.2%) | 7 (3.9%) |
| $5,000 to $9,999 | 8 (2.9%) | 11 (6.1%) |
| $10,000 to $14,999 | 26 (9.5%) | 17 (9.4%) |
| $15,000 to $19,999 | 2 (0.7%) | 40 (22.2%) |
| $20,000 to $24,999 | 12 (4.4%) | 12 (6.7%) |
| $25,000 to $34,999 | 50 (18.2%) | 38 (21.1%) |
| $35,000 to $49,999 | 39 (14.2%) | 28 (15.6%) |
| $50,000 to $74,999 | 41 (15.0%) | 17 (9.4%) |
| $75,000 to $99,999 | 30 (11.0%) | 0 (0.0%) |
| $100,000 to $149,999 | 47 (17.2%) | 10 (5.6%) |
| $150,000 or more | 13 (4.7%) | 0 (0.0%) |
| Total | 274 (100.0%) | 180 (100.0%) |
Monthly Housing Cost Tiers in Independence
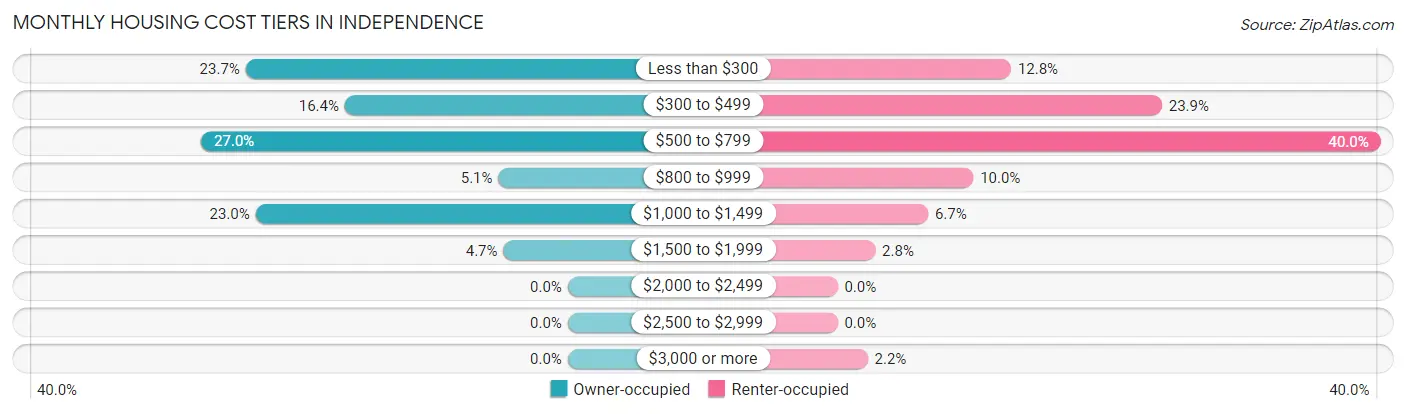
| Monthly Cost | Owner-occupied | Renter-occupied |
| Less than $300 | 65 (23.7%) | 23 (12.8%) |
| $300 to $499 | 45 (16.4%) | 43 (23.9%) |
| $500 to $799 | 74 (27.0%) | 72 (40.0%) |
| $800 to $999 | 14 (5.1%) | 18 (10.0%) |
| $1,000 to $1,499 | 63 (23.0%) | 12 (6.7%) |
| $1,500 to $1,999 | 13 (4.7%) | 5 (2.8%) |
| $2,000 to $2,499 | 0 (0.0%) | 0 (0.0%) |
| $2,500 to $2,999 | 0 (0.0%) | 0 (0.0%) |
| $3,000 or more | 0 (0.0%) | 4 (2.2%) |
| Total | 274 (100.0%) | 180 (100.0%) |
Physical Housing Characteristics in Independence
Housing Structures in Independence
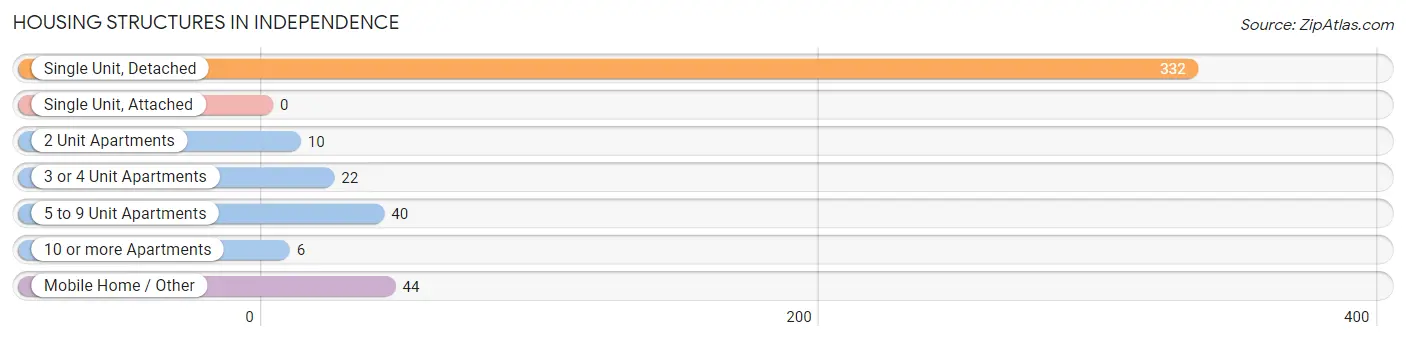
| Structure Type | # Housing Units | % Housing Units |
| Single Unit, Detached | 332 | 73.1% |
| Single Unit, Attached | 0 | 0.0% |
| 2 Unit Apartments | 10 | 2.2% |
| 3 or 4 Unit Apartments | 22 | 4.9% |
| 5 to 9 Unit Apartments | 40 | 8.8% |
| 10 or more Apartments | 6 | 1.3% |
| Mobile Home / Other | 44 | 9.7% |
| Total | 454 | 100.0% |
Housing Structures by Occupancy in Independence
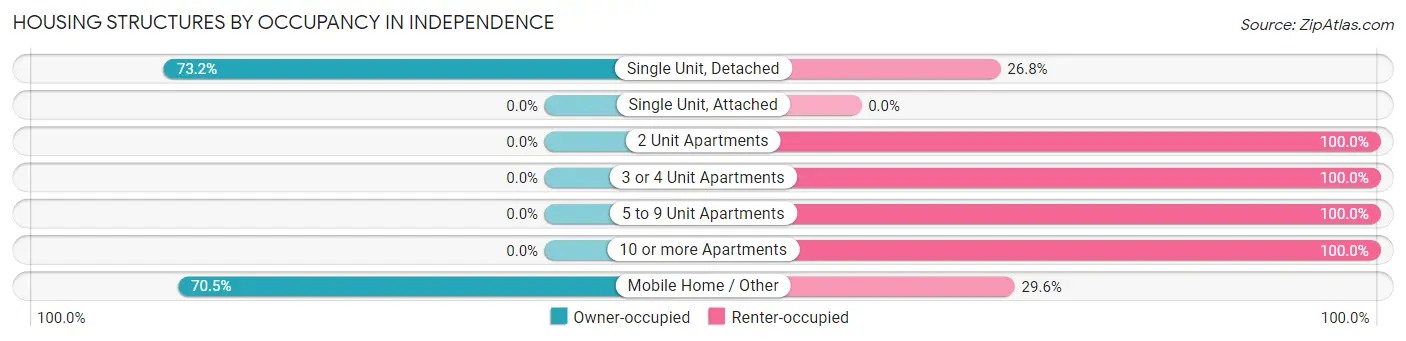
| Structure Type | Owner-occupied | Renter-occupied |
| Single Unit, Detached | 243 (73.2%) | 89 (26.8%) |
| Single Unit, Attached | 0 (0.0%) | 0 (0.0%) |
| 2 Unit Apartments | 0 (0.0%) | 10 (100.0%) |
| 3 or 4 Unit Apartments | 0 (0.0%) | 22 (100.0%) |
| 5 to 9 Unit Apartments | 0 (0.0%) | 40 (100.0%) |
| 10 or more Apartments | 0 (0.0%) | 6 (100.0%) |
| Mobile Home / Other | 31 (70.5%) | 13 (29.5%) |
| Total | 274 (60.4%) | 180 (39.7%) |
Housing Structures by Number of Rooms in Independence
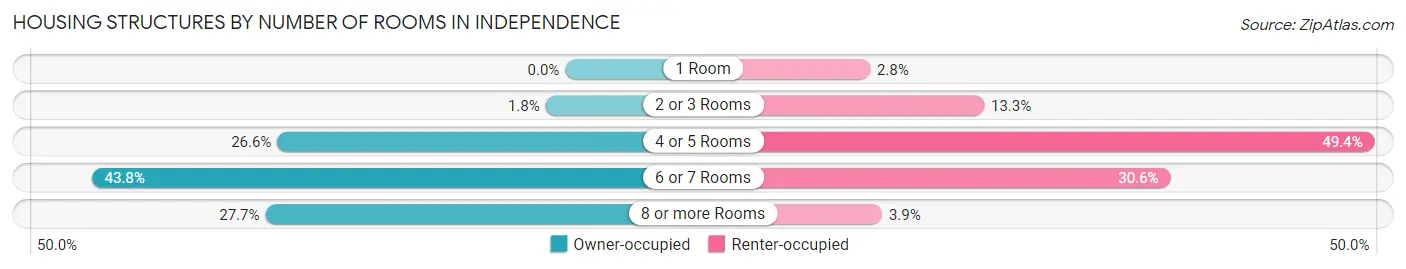
| Number of Rooms | Owner-occupied | Renter-occupied |
| 1 Room | 0 (0.0%) | 5 (2.8%) |
| 2 or 3 Rooms | 5 (1.8%) | 24 (13.3%) |
| 4 or 5 Rooms | 73 (26.6%) | 89 (49.4%) |
| 6 or 7 Rooms | 120 (43.8%) | 55 (30.6%) |
| 8 or more Rooms | 76 (27.7%) | 7 (3.9%) |
| Total | 274 (100.0%) | 180 (100.0%) |
Housing Structure by Heating Type in Independence
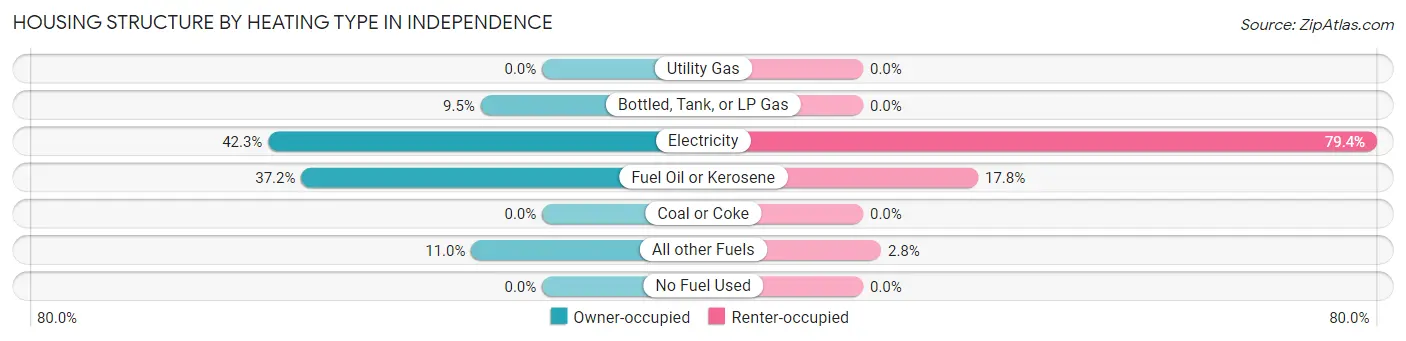
| Heating Type | Owner-occupied | Renter-occupied |
| Utility Gas | 0 (0.0%) | 0 (0.0%) |
| Bottled, Tank, or LP Gas | 26 (9.5%) | 0 (0.0%) |
| Electricity | 116 (42.3%) | 143 (79.4%) |
| Fuel Oil or Kerosene | 102 (37.2%) | 32 (17.8%) |
| Coal or Coke | 0 (0.0%) | 0 (0.0%) |
| All other Fuels | 30 (11.0%) | 5 (2.8%) |
| No Fuel Used | 0 (0.0%) | 0 (0.0%) |
| Total | 274 (100.0%) | 180 (100.0%) |
Household Vehicle Usage in Independence
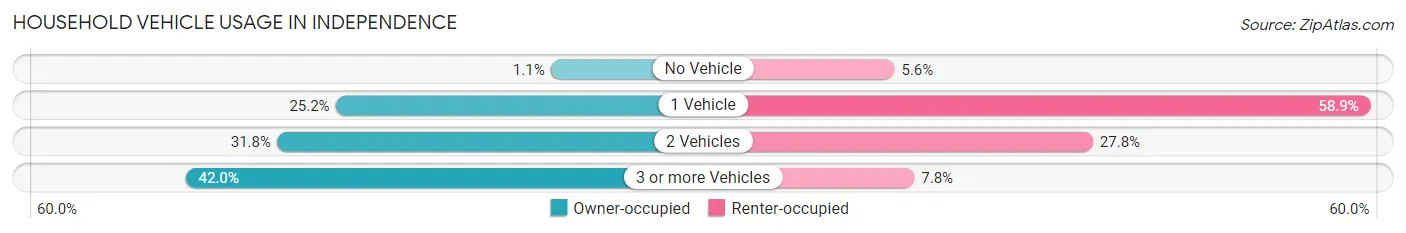
| Vehicles per Household | Owner-occupied | Renter-occupied |
| No Vehicle | 3 (1.1%) | 10 (5.6%) |
| 1 Vehicle | 69 (25.2%) | 106 (58.9%) |
| 2 Vehicles | 87 (31.8%) | 50 (27.8%) |
| 3 or more Vehicles | 115 (42.0%) | 14 (7.8%) |
| Total | 274 (100.0%) | 180 (100.0%) |
Real Estate & Mortgages in Independence
Real Estate and Mortgage Overview in Independence
| Characteristic | Without Mortgage | With Mortgage |
| Housing Units | 130 | 144 |
| Median Property Value | $114,700 | $126,100 |
| Median Household Income | $39,167 | $0 |
| Monthly Housing Costs | $307 | $0 |
| Real Estate Taxes | $676 | $0 |
Property Value by Mortgage Status in Independence
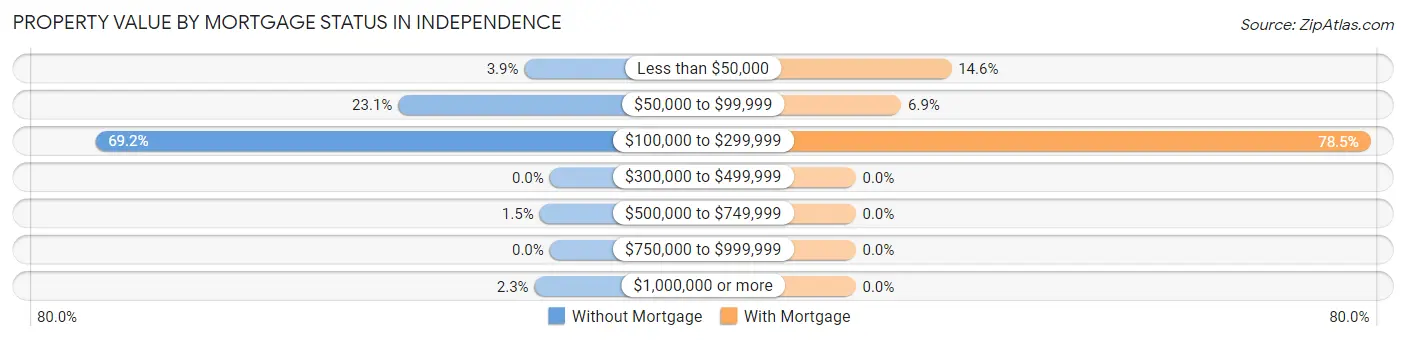
| Property Value | Without Mortgage | With Mortgage |
| Less than $50,000 | 5 (3.8%) | 21 (14.6%) |
| $50,000 to $99,999 | 30 (23.1%) | 10 (6.9%) |
| $100,000 to $299,999 | 90 (69.2%) | 113 (78.5%) |
| $300,000 to $499,999 | 0 (0.0%) | 0 (0.0%) |
| $500,000 to $749,999 | 2 (1.5%) | 0 (0.0%) |
| $750,000 to $999,999 | 0 (0.0%) | 0 (0.0%) |
| $1,000,000 or more | 3 (2.3%) | 0 (0.0%) |
| Total | 130 (100.0%) | 144 (100.0%) |
Household Income by Mortgage Status in Independence
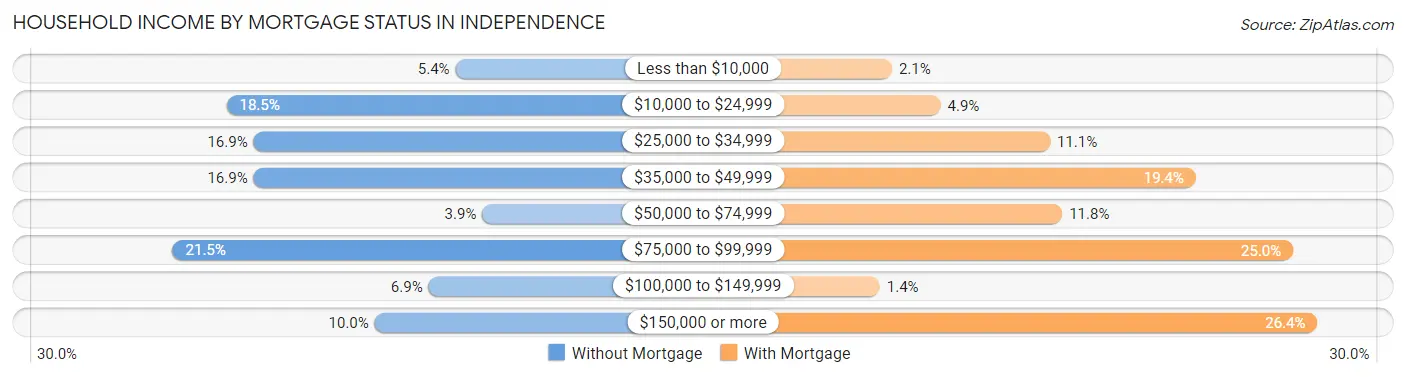
| Household Income | Without Mortgage | With Mortgage |
| Less than $10,000 | 7 (5.4%) | 3 (2.1%) |
| $10,000 to $24,999 | 24 (18.5%) | 7 (4.9%) |
| $25,000 to $34,999 | 22 (16.9%) | 16 (11.1%) |
| $35,000 to $49,999 | 22 (16.9%) | 28 (19.4%) |
| $50,000 to $74,999 | 5 (3.8%) | 17 (11.8%) |
| $75,000 to $99,999 | 28 (21.5%) | 36 (25.0%) |
| $100,000 to $149,999 | 9 (6.9%) | 2 (1.4%) |
| $150,000 or more | 13 (10.0%) | 38 (26.4%) |
| Total | 130 (100.0%) | 144 (100.0%) |
Property Value to Household Income Ratio in Independence
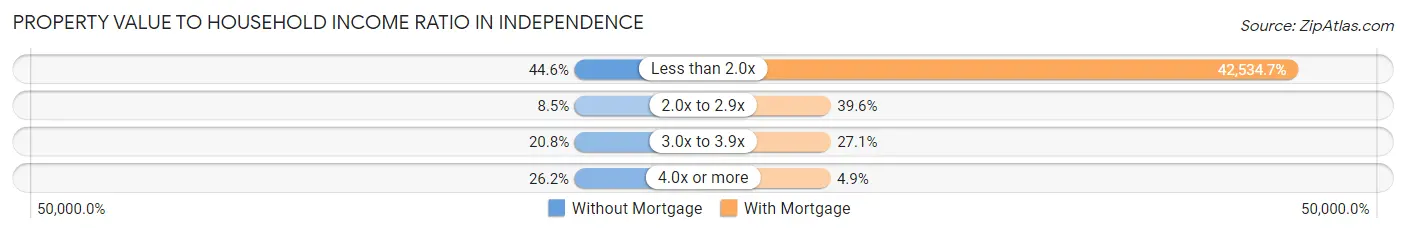
| Value-to-Income Ratio | Without Mortgage | With Mortgage |
| Less than 2.0x | 58 (44.6%) | 61,250 (42,534.7%) |
| 2.0x to 2.9x | 11 (8.5%) | 57 (39.6%) |
| 3.0x to 3.9x | 27 (20.8%) | 39 (27.1%) |
| 4.0x or more | 34 (26.2%) | 7 (4.9%) |
| Total | 130 (100.0%) | 144 (100.0%) |
Real Estate Taxes by Mortgage Status in Independence
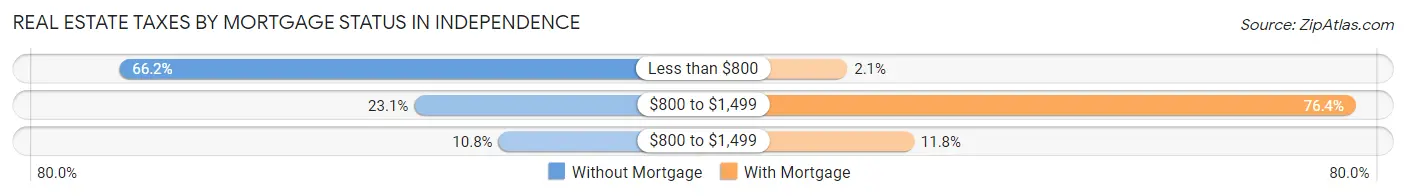
| Property Taxes | Without Mortgage | With Mortgage |
| Less than $800 | 86 (66.1%) | 3 (2.1%) |
| $800 to $1,499 | 30 (23.1%) | 110 (76.4%) |
| $800 to $1,499 | 14 (10.8%) | 17 (11.8%) |
| Total | 130 (100.0%) | 144 (100.0%) |
Health & Disability in Independence
Health Insurance Coverage by Age in Independence
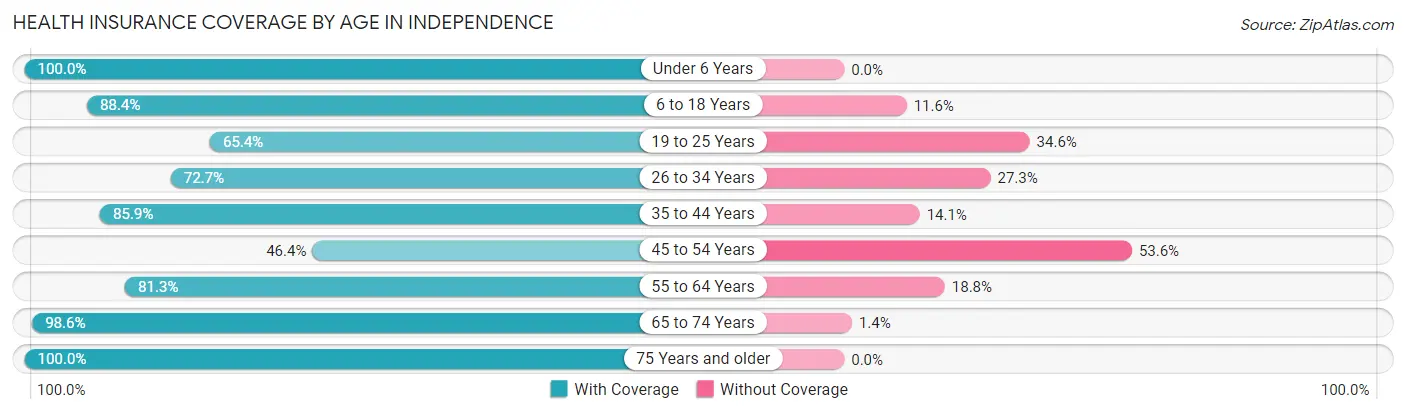
| Age Bracket | With Coverage | Without Coverage |
| Under 6 Years | 83 (100.0%) | 0 (0.0%) |
| 6 to 18 Years | 129 (88.4%) | 17 (11.6%) |
| 19 to 25 Years | 53 (65.4%) | 28 (34.6%) |
| 26 to 34 Years | 72 (72.7%) | 27 (27.3%) |
| 35 to 44 Years | 55 (85.9%) | 9 (14.1%) |
| 45 to 54 Years | 51 (46.4%) | 59 (53.6%) |
| 55 to 64 Years | 156 (81.2%) | 36 (18.8%) |
| 65 to 74 Years | 138 (98.6%) | 2 (1.4%) |
| 75 Years and older | 125 (100.0%) | 0 (0.0%) |
| Total | 862 (82.9%) | 178 (17.1%) |
Health Insurance Coverage by Citizenship Status in Independence
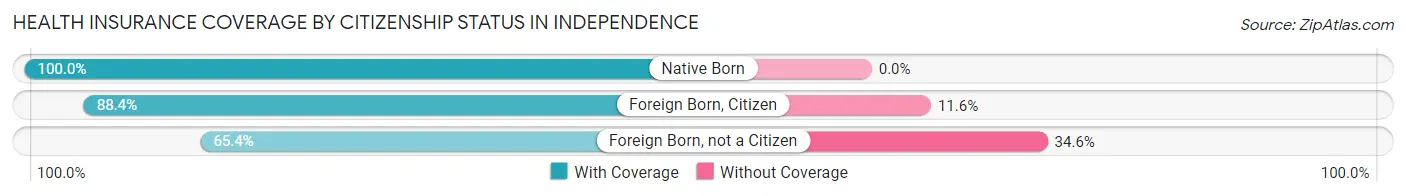
| Citizenship Status | With Coverage | Without Coverage |
| Native Born | 83 (100.0%) | 0 (0.0%) |
| Foreign Born, Citizen | 129 (88.4%) | 17 (11.6%) |
| Foreign Born, not a Citizen | 53 (65.4%) | 28 (34.6%) |
Health Insurance Coverage by Household Income in Independence
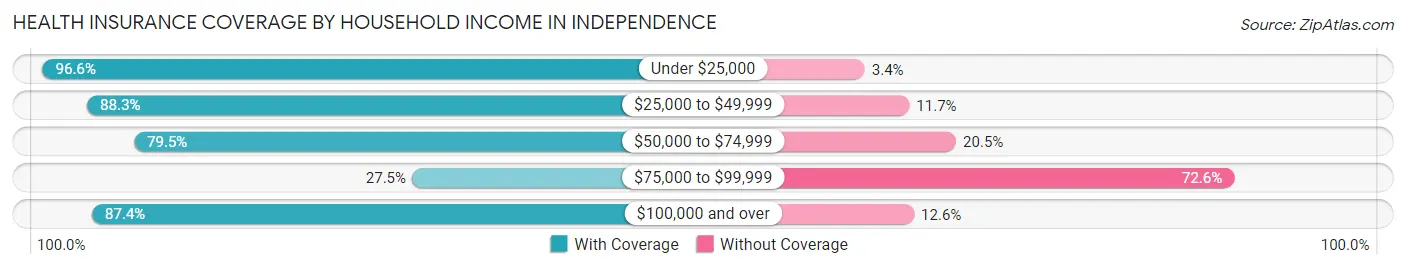
| Household Income | With Coverage | Without Coverage |
| Under $25,000 | 229 (96.6%) | 8 (3.4%) |
| $25,000 to $49,999 | 316 (88.3%) | 42 (11.7%) |
| $50,000 to $74,999 | 97 (79.5%) | 25 (20.5%) |
| $75,000 to $99,999 | 28 (27.5%) | 74 (72.6%) |
| $100,000 and over | 187 (87.4%) | 27 (12.6%) |
Public vs Private Health Insurance Coverage by Age in Independence
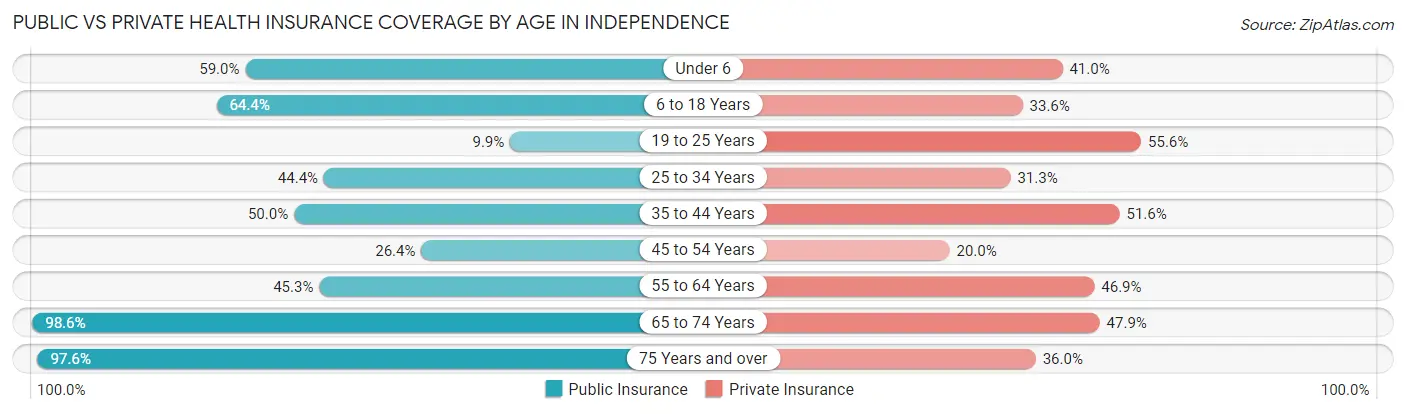
| Age Bracket | Public Insurance | Private Insurance |
| Under 6 | 49 (59.0%) | 34 (41.0%) |
| 6 to 18 Years | 94 (64.4%) | 49 (33.6%) |
| 19 to 25 Years | 8 (9.9%) | 45 (55.6%) |
| 25 to 34 Years | 44 (44.4%) | 31 (31.3%) |
| 35 to 44 Years | 32 (50.0%) | 33 (51.6%) |
| 45 to 54 Years | 29 (26.4%) | 22 (20.0%) |
| 55 to 64 Years | 87 (45.3%) | 90 (46.9%) |
| 65 to 74 Years | 138 (98.6%) | 67 (47.9%) |
| 75 Years and over | 122 (97.6%) | 45 (36.0%) |
| Total | 603 (58.0%) | 416 (40.0%) |
Disability Status by Sex by Age in Independence
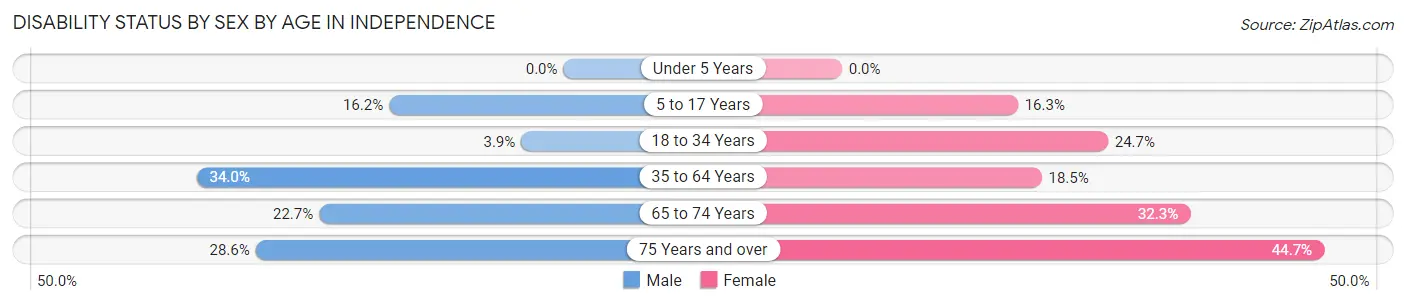
| Age Bracket | Male | Female |
| Under 5 Years | 0 (0.0%) | 0 (0.0%) |
| 5 to 17 Years | 11 (16.2%) | 16 (16.3%) |
| 18 to 34 Years | 4 (3.9%) | 20 (24.7%) |
| 35 to 64 Years | 64 (34.0%) | 33 (18.5%) |
| 65 to 74 Years | 17 (22.7%) | 21 (32.3%) |
| 75 Years and over | 14 (28.6%) | 34 (44.7%) |
Disability Class by Sex by Age in Independence
Disability Class: Hearing Difficulty
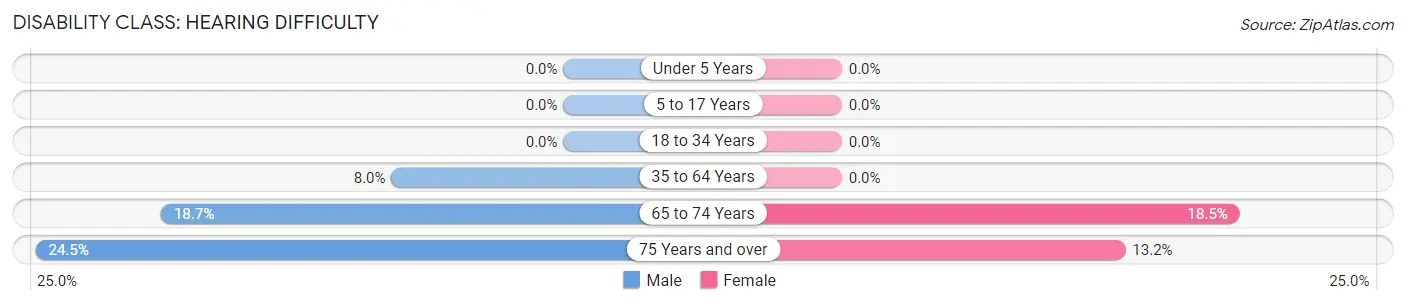
| Age Bracket | Male | Female |
| Under 5 Years | 0 (0.0%) | 0 (0.0%) |
| 5 to 17 Years | 0 (0.0%) | 0 (0.0%) |
| 18 to 34 Years | 0 (0.0%) | 0 (0.0%) |
| 35 to 64 Years | 15 (8.0%) | 0 (0.0%) |
| 65 to 74 Years | 14 (18.7%) | 12 (18.5%) |
| 75 Years and over | 12 (24.5%) | 10 (13.2%) |
Disability Class: Vision Difficulty
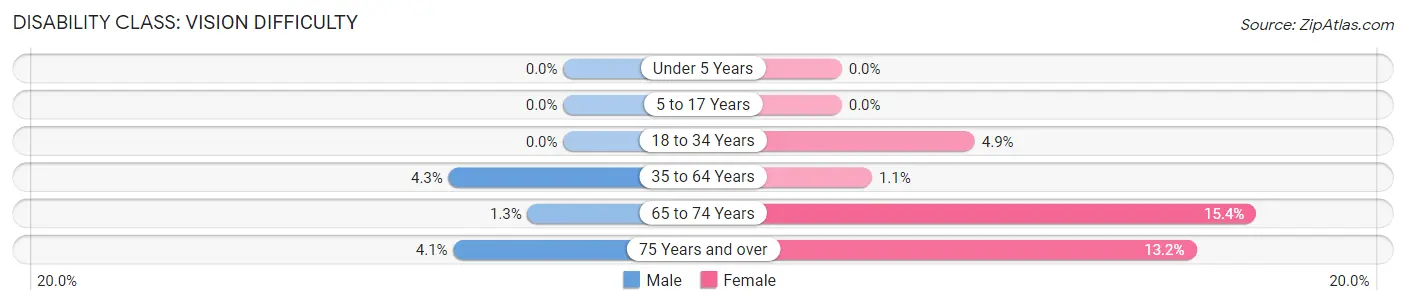
| Age Bracket | Male | Female |
| Under 5 Years | 0 (0.0%) | 0 (0.0%) |
| 5 to 17 Years | 0 (0.0%) | 0 (0.0%) |
| 18 to 34 Years | 0 (0.0%) | 4 (4.9%) |
| 35 to 64 Years | 8 (4.3%) | 2 (1.1%) |
| 65 to 74 Years | 1 (1.3%) | 10 (15.4%) |
| 75 Years and over | 2 (4.1%) | 10 (13.2%) |
Disability Class: Cognitive Difficulty
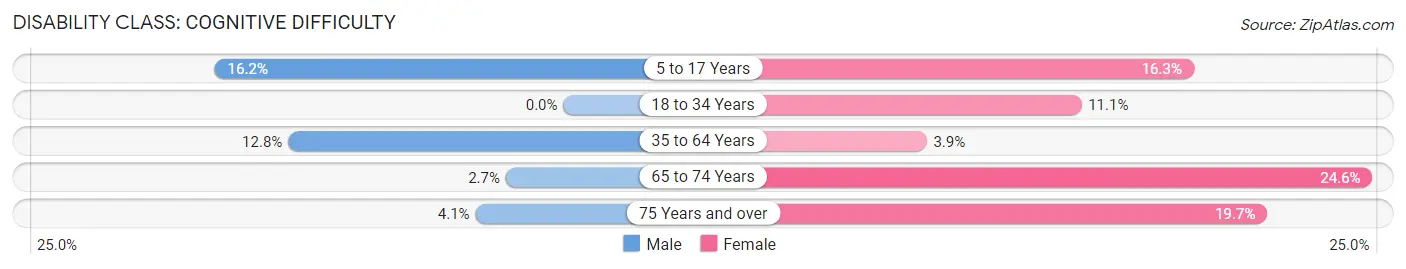
| Age Bracket | Male | Female |
| 5 to 17 Years | 11 (16.2%) | 16 (16.3%) |
| 18 to 34 Years | 0 (0.0%) | 9 (11.1%) |
| 35 to 64 Years | 24 (12.8%) | 7 (3.9%) |
| 65 to 74 Years | 2 (2.7%) | 16 (24.6%) |
| 75 Years and over | 2 (4.1%) | 15 (19.7%) |
Disability Class: Ambulatory Difficulty
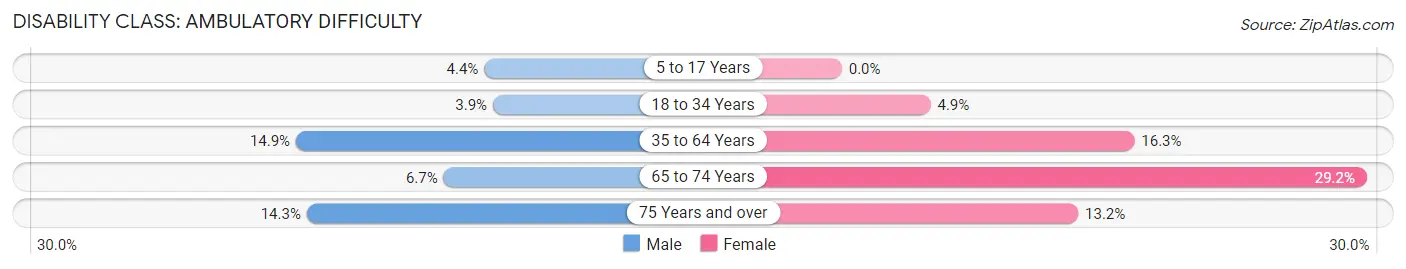
| Age Bracket | Male | Female |
| 5 to 17 Years | 3 (4.4%) | 0 (0.0%) |
| 18 to 34 Years | 4 (3.9%) | 4 (4.9%) |
| 35 to 64 Years | 28 (14.9%) | 29 (16.3%) |
| 65 to 74 Years | 5 (6.7%) | 19 (29.2%) |
| 75 Years and over | 7 (14.3%) | 10 (13.2%) |
Disability Class: Self-Care Difficulty
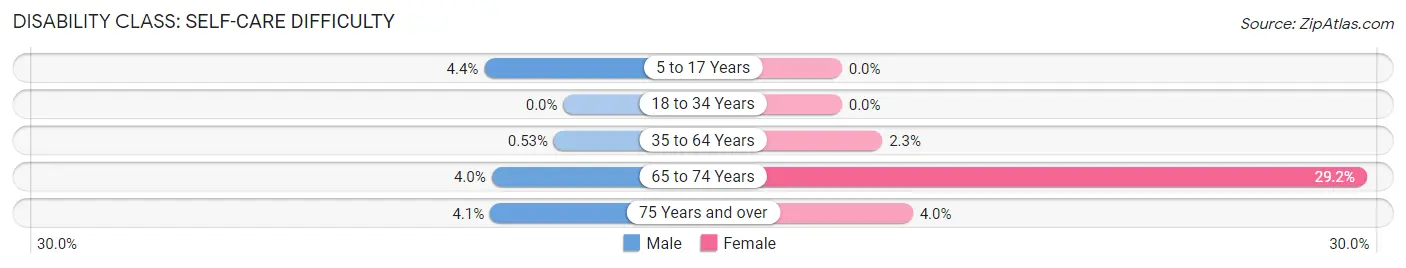
| Age Bracket | Male | Female |
| 5 to 17 Years | 3 (4.4%) | 0 (0.0%) |
| 18 to 34 Years | 0 (0.0%) | 0 (0.0%) |
| 35 to 64 Years | 1 (0.5%) | 4 (2.2%) |
| 65 to 74 Years | 3 (4.0%) | 19 (29.2%) |
| 75 Years and over | 2 (4.1%) | 3 (4.0%) |
Technology Access in Independence
Computing Device Access in Independence
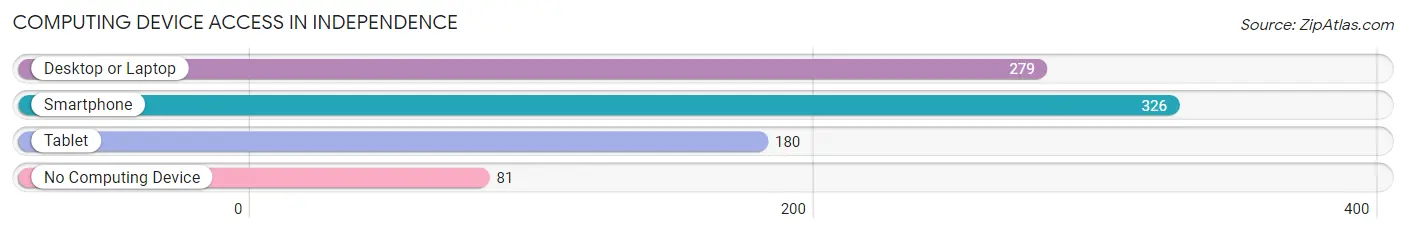
| Device Type | # Households | % Households |
| Desktop or Laptop | 279 | 61.5% |
| Smartphone | 326 | 71.8% |
| Tablet | 180 | 39.7% |
| No Computing Device | 81 | 17.8% |
| Total | 454 | 100.0% |
Internet Access in Independence
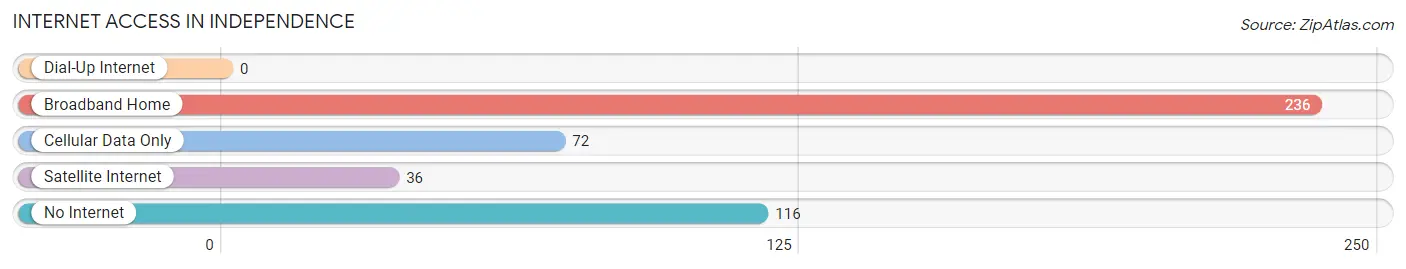
| Internet Type | # Households | % Households |
| Dial-Up Internet | 0 | 0.0% |
| Broadband Home | 236 | 52.0% |
| Cellular Data Only | 72 | 15.9% |
| Satellite Internet | 36 | 7.9% |
| No Internet | 116 | 25.6% |
| Total | 454 | 100.0% |
Independence Summary
Independence is a town located in Grayson County, Virginia, United States. The population was 1,845 at the 2010 census. It is the county seat of Grayson County.
History
Independence was founded in 1776 by a group of settlers from the nearby town of Fries. The town was named after the Declaration of Independence, which was signed in 1776. The town was incorporated in 1831.
In the 19th century, Independence was a major stop on the Great Road, a major route for settlers heading west. The town was also a major stop on the Virginia and Tennessee Railroad, which connected the town to the rest of the state.
In the 20th century, Independence became a major center for the production of furniture and textiles. The town was also home to several large tobacco warehouses.
Geography
Independence is located in the Blue Ridge Mountains of southwestern Virginia. The town is situated at the confluence of the New River and the Holston River. The town is located at an elevation of 1,845 feet (562 m).
The town is located in the Appalachian Mountains, and is surrounded by the Jefferson National Forest. The town is located near the border of North Carolina and Tennessee.
Economy
The economy of Independence is largely based on agriculture and manufacturing. The town is home to several large furniture and textile factories. The town is also home to several tobacco warehouses.
The town is also home to several small businesses, including restaurants, retail stores, and service providers.
Demographics
As of the 2010 census, the population of Independence was 1,845. The racial makeup of the town was 95.3% White, 1.2% African American, 0.3% Native American, 0.2% Asian, 0.1% Pacific Islander, 0.7% from other races, and 2.4% from two or more races. Hispanic or Latino of any race were 1.7% of the population.
The median income for a household in the town was $30,938, and the median income for a family was $37,813. The per capita income for the town was $17,845. About 15.2% of families and 18.2% of the population were below the poverty line, including 25.2% of those under age 18 and 11.2% of those age 65 or over.
Conclusion
Independence is a small town located in Grayson County, Virginia. The town was founded in 1776 and has a rich history. The town is home to several large furniture and textile factories, as well as several tobacco warehouses. The town has a population of 1,845, and the median income for a household is $30,938. Independence is a great place to live and work, and is a great place to visit.
Common Questions
What is Per Capita Income in Independence?
Per Capita income in Independence is $29,591.
What is the Median Family Income in Independence?
Median Family Income in Independence is $40,682.
What is the Median Household income in Independence?
Median Household Income in Independence is $34,286.
What is Income or Wage Gap in Independence?
Income or Wage Gap in Independence is 6.7%.
Women in Independence earn 93.3 cents for every dollar earned by a man.
What is Inequality or Gini Index in Independence?
Inequality or Gini Index in Independence is 0.60.
What is the Total Population of Independence?
Total Population of Independence is 1,176.
What is the Total Male Population of Independence?
Total Male Population of Independence is 561.
What is the Total Female Population of Independence?
Total Female Population of Independence is 615.
What is the Ratio of Males per 100 Females in Independence?
There are 91.22 Males per 100 Females in Independence.
What is the Ratio of Females per 100 Males in Independence?
There are 109.63 Females per 100 Males in Independence.
What is the Median Population Age in Independence?
Median Population Age in Independence is 55.2 Years.
What is the Average Family Size in Independence
Average Family Size in Independence is 2.8 People.
What is the Average Household Size in Independence
Average Household Size in Independence is 2.3 People.
How Large is the Labor Force in Independence?
There are 400 People in the Labor Forcein in Independence.
What is the Percentage of People in the Labor Force in Independence?
41.5% of People are in the Labor Force in Independence.
What is the Unemployment Rate in Independence?
Unemployment Rate in Independence is 7.8%.