Vienna, VA Map & Demographics
Vienna Map
Vienna Overview
$88,569
PER CAPITA INCOME
$249,219
AVG FAMILY INCOME
$215,556
AVG HOUSEHOLD INCOME
45.8%
WAGE / INCOME GAP [ % ]
54.2¢/ $1
WAGE / INCOME GAP [ $ ]
0.46
INEQUALITY / GINI INDEX
16,401
TOTAL POPULATION
7,976
MALE POPULATION
8,425
FEMALE POPULATION
94.67
MALES / 100 FEMALES
105.63
FEMALES / 100 MALES
41.2
MEDIAN AGE
3.4
AVG FAMILY SIZE
3.0
AVG HOUSEHOLD SIZE
8,613
LABOR FORCE [ PEOPLE ]
69.8%
PERCENT IN LABOR FORCE
3.6%
UNEMPLOYMENT RATE
Income in Vienna
Income Overview in Vienna
Per Capita Income in Vienna is $88,569, while median incomes of families and households are $249,219 and $215,556 respectively.
| Characteristic | Number | Measure |
| Per Capita Income | 16,401 | $88,569 |
| Median Family Income | 4,351 | $249,219 |
| Mean Family Income | 4,351 | $299,222 |
| Median Household Income | 5,418 | $215,556 |
| Mean Household Income | 5,418 | $265,744 |
| Income Deficit | 4,351 | $0 |
| Wage / Income Gap (%) | 16,401 | 45.77% |
| Wage / Income Gap ($) | 16,401 | 54.23¢ per $1 |
| Gini / Inequality Index | 16,401 | 0.46 |
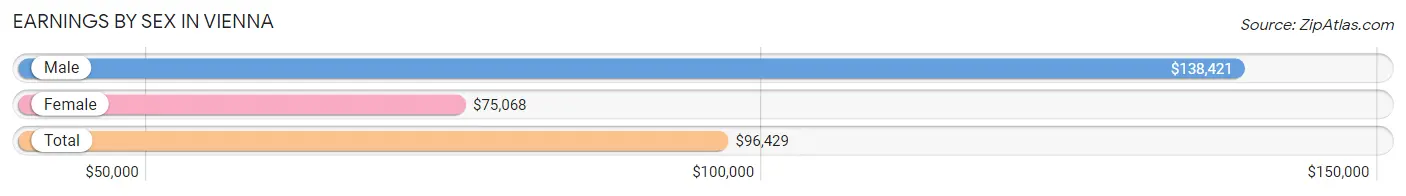
Earnings by Sex in Vienna
Average Earnings in Vienna are $96,429, $138,421 for men and $75,068 for women, a difference of 45.8%.
| Sex | Number | Average Earnings |
| Male | 4,906 (55.4%) | $138,421 |
| Female | 3,944 (44.6%) | $75,068 |
| Total | 8,850 (100.0%) | $96,429 |
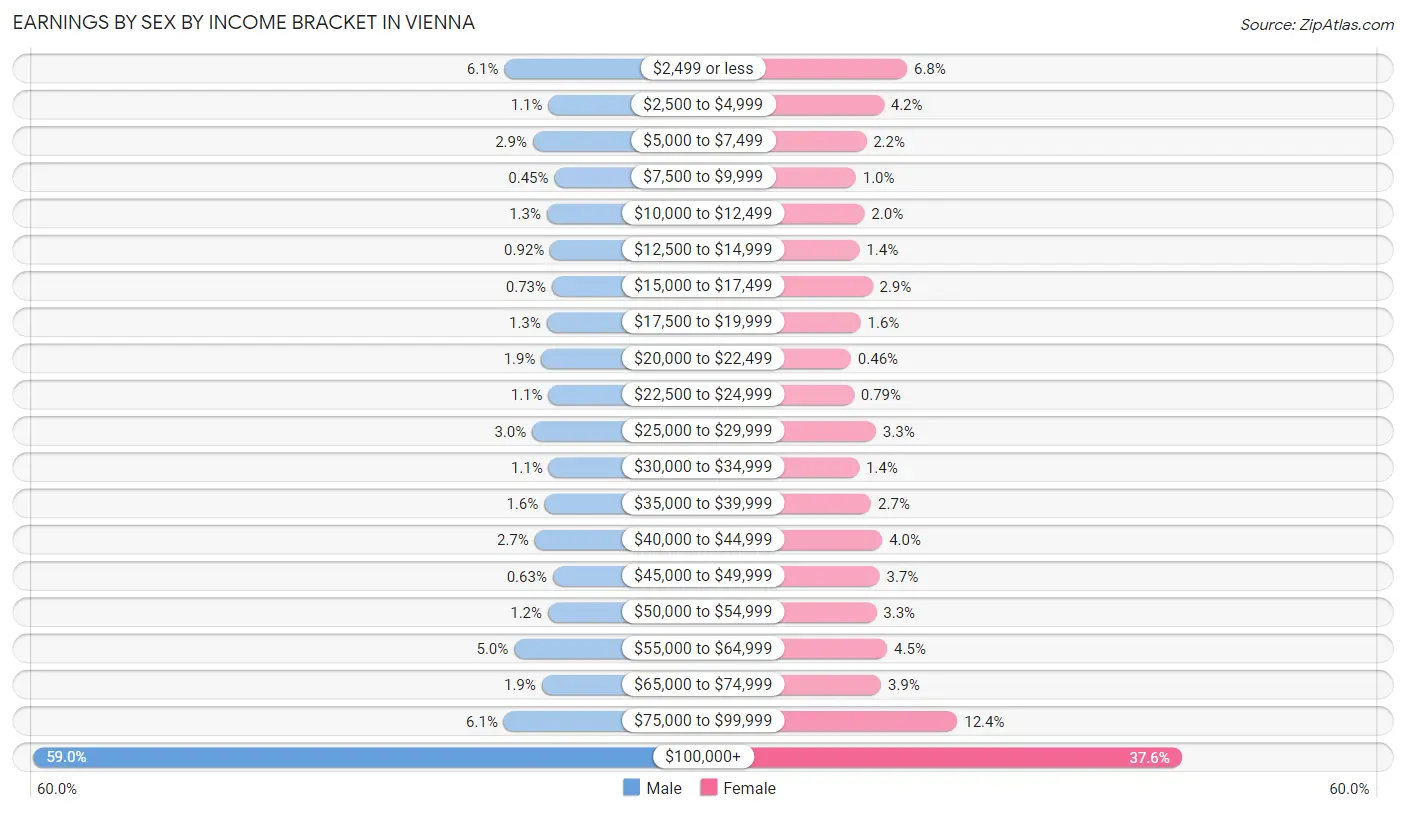
Earnings by Sex by Income Bracket in Vienna
The most common earnings brackets in Vienna are $100,000+ for men (2,896 | 59.0%) and $100,000+ for women (1,484 | 37.6%).
| Income | Male | Female |
| $2,499 or less | 298 (6.1%) | 267 (6.8%) |
| $2,500 to $4,999 | 55 (1.1%) | 164 (4.2%) |
| $5,000 to $7,499 | 141 (2.9%) | 86 (2.2%) |
| $7,500 to $9,999 | 22 (0.4%) | 40 (1.0%) |
| $10,000 to $12,499 | 64 (1.3%) | 78 (2.0%) |
| $12,500 to $14,999 | 45 (0.9%) | 56 (1.4%) |
| $15,000 to $17,499 | 36 (0.7%) | 114 (2.9%) |
| $17,500 to $19,999 | 65 (1.3%) | 61 (1.5%) |
| $20,000 to $22,499 | 94 (1.9%) | 18 (0.5%) |
| $22,500 to $24,999 | 55 (1.1%) | 31 (0.8%) |
| $25,000 to $29,999 | 145 (3.0%) | 129 (3.3%) |
| $30,000 to $34,999 | 54 (1.1%) | 54 (1.4%) |
| $35,000 to $39,999 | 79 (1.6%) | 108 (2.7%) |
| $40,000 to $44,999 | 131 (2.7%) | 157 (4.0%) |
| $45,000 to $49,999 | 31 (0.6%) | 145 (3.7%) |
| $50,000 to $54,999 | 58 (1.2%) | 131 (3.3%) |
| $55,000 to $64,999 | 244 (5.0%) | 179 (4.5%) |
| $65,000 to $74,999 | 92 (1.9%) | 152 (3.8%) |
| $75,000 to $99,999 | 301 (6.1%) | 490 (12.4%) |
| $100,000+ | 2,896 (59.0%) | 1,484 (37.6%) |
| Total | 4,906 (100.0%) | 3,944 (100.0%) |
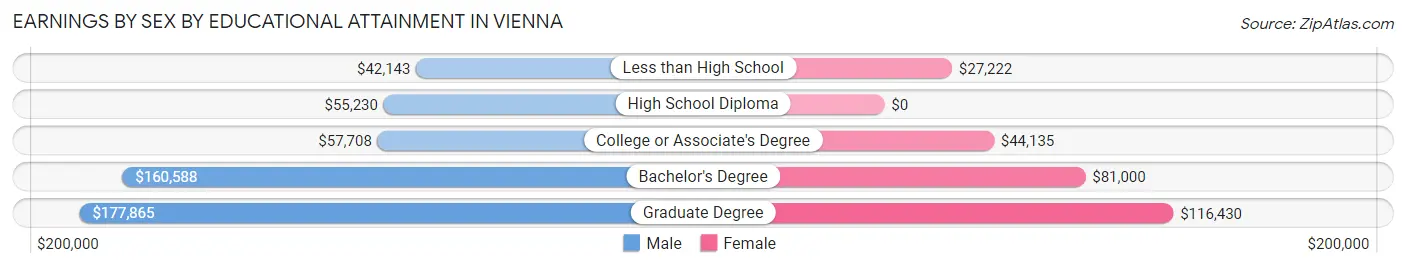
Earnings by Sex by Educational Attainment in Vienna
Average earnings in Vienna are $149,082 for men and $89,104 for women, a difference of 40.2%. Men with an educational attainment of graduate degree enjoy the highest average annual earnings of $177,865, while those with less than high school education earn the least with $42,143. Women with an educational attainment of graduate degree earn the most with the average annual earnings of $116,430, while those with less than high school education have the smallest earnings of $27,222.
| Educational Attainment | Male Income | Female Income |
| Less than High School | $42,143 | $27,222 |
| High School Diploma | $55,230 | $0 |
| College or Associate's Degree | $57,708 | $44,135 |
| Bachelor's Degree | $160,588 | $81,000 |
| Graduate Degree | $177,865 | $116,430 |
| Total | $149,082 | $89,104 |
Family Income in Vienna
Family Income Brackets in Vienna
According to the Vienna family income data, there are 2,654 families falling into the $200,000+ income range, which is the most common income bracket and makes up 61.0% of all families. Conversely, the $15,000 to $24,999 income bracket is the least frequent group with only 35 families (0.8%) belonging to this category.
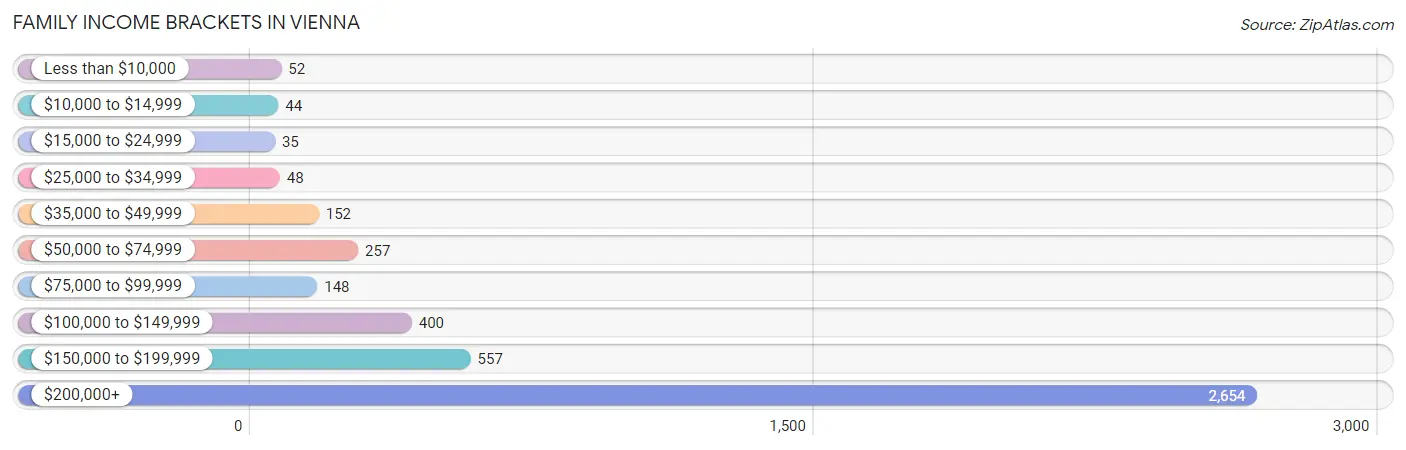
| Income Bracket | # Families | % Families |
| Less than $10,000 | 52 | 1.2% |
| $10,000 to $14,999 | 44 | 1.0% |
| $15,000 to $24,999 | 35 | 0.8% |
| $25,000 to $34,999 | 48 | 1.1% |
| $35,000 to $49,999 | 152 | 3.5% |
| $50,000 to $74,999 | 257 | 5.9% |
| $75,000 to $99,999 | 148 | 3.4% |
| $100,000 to $149,999 | 400 | 9.2% |
| $150,000 to $199,999 | 557 | 12.8% |
| $200,000+ | 2,654 | 61.0% |
Family Income by Famaliy Size in Vienna
4-person families (1,179 | 27.1%) account for the highest median family income in Vienna with $250,001 per family, while 2-person families (1,605 | 36.9%) have the highest median income of $92,312 per family member.
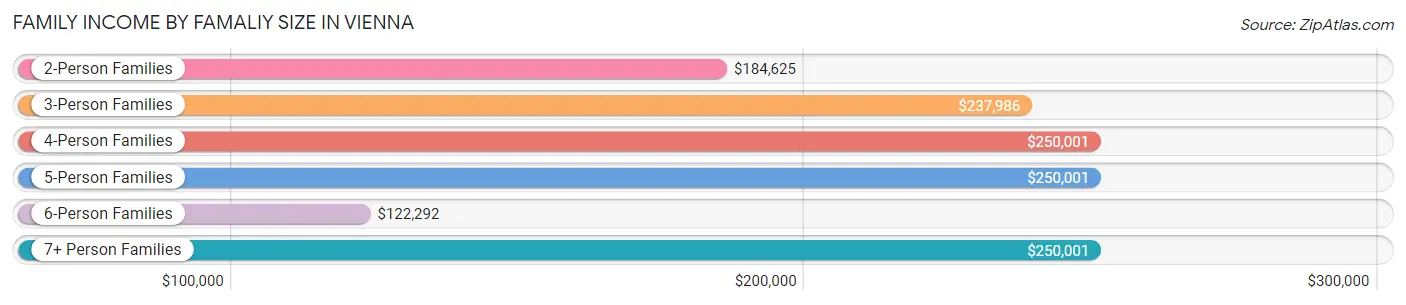
| Income Bracket | # Families | Median Income |
| 2-Person Families | 1,605 (36.9%) | $184,625 |
| 3-Person Families | 969 (22.3%) | $237,986 |
| 4-Person Families | 1,179 (27.1%) | $250,001 |
| 5-Person Families | 379 (8.7%) | $250,001 |
| 6-Person Families | 176 (4.1%) | $122,292 |
| 7+ Person Families | 43 (1.0%) | $250,001 |
| Total | 4,351 (100.0%) | $249,219 |
Family Income by Number of Earners in Vienna
The median family income in Vienna is $249,219, with families comprising 2 earners (2,240) having the highest median family income of $250,001, while families with no earners (476) have the lowest median family income of $86,167, accounting for 51.5% and 10.9% of families, respectively.
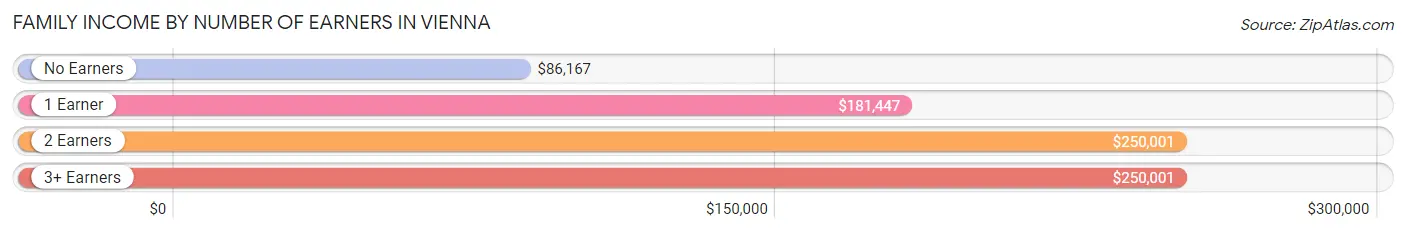
| Number of Earners | # Families | Median Income |
| No Earners | 476 (10.9%) | $86,167 |
| 1 Earner | 1,060 (24.4%) | $181,447 |
| 2 Earners | 2,240 (51.5%) | $250,001 |
| 3+ Earners | 575 (13.2%) | $250,001 |
| Total | 4,351 (100.0%) | $249,219 |
Household Income in Vienna
Household Income Brackets in Vienna
With 2,861 households falling in the category, the $200,000+ income range is the most frequent in Vienna, accounting for 52.8% of all households. In contrast, only 54 households (1.0%) fall into the $25,000 to $34,999 income bracket, making it the least populous group.
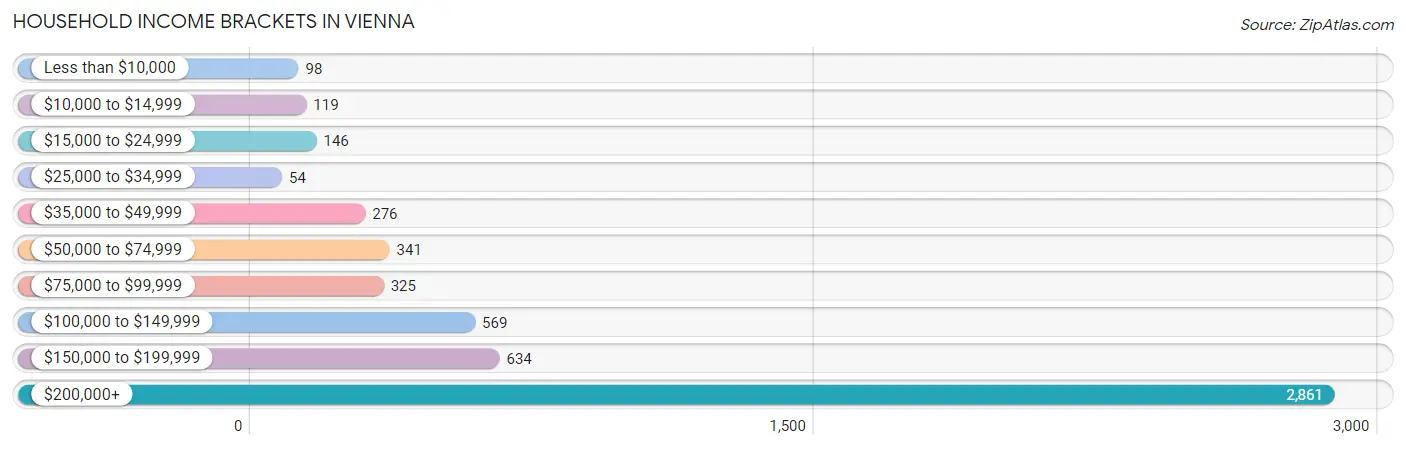
| Income Bracket | # Households | % Households |
| Less than $10,000 | 98 | 1.8% |
| $10,000 to $14,999 | 119 | 2.2% |
| $15,000 to $24,999 | 146 | 2.7% |
| $25,000 to $34,999 | 54 | 1.0% |
| $35,000 to $49,999 | 276 | 5.1% |
| $50,000 to $74,999 | 341 | 6.3% |
| $75,000 to $99,999 | 325 | 6.0% |
| $100,000 to $149,999 | 569 | 10.5% |
| $150,000 to $199,999 | 634 | 11.7% |
| $200,000+ | 2,861 | 52.8% |
Household Income by Householder Age in Vienna
The median household income in Vienna is $215,556, with the highest median household income of $250,001 found in the 25 to 44 years age bracket for the primary householder. A total of 1,417 households (26.2%) fall into this category. Meanwhile, the 15 to 24 years age bracket for the primary householder has the lowest median household income of $0, with 12 households (0.2%) in this group.
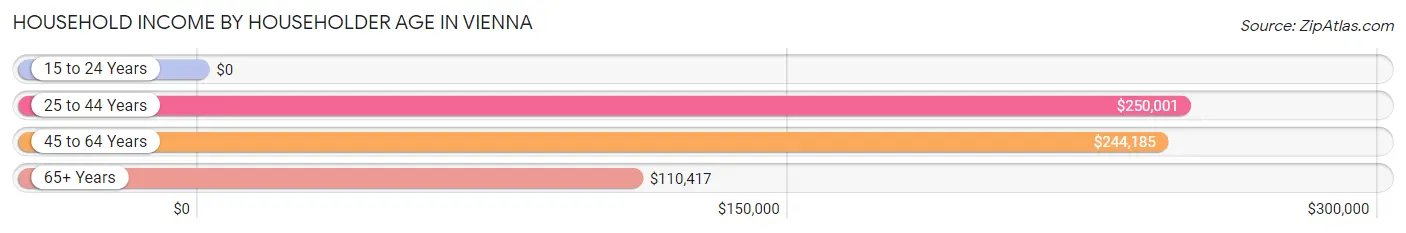
| Income Bracket | # Households | Median Income |
| 15 to 24 Years | 12 (0.2%) | $0 |
| 25 to 44 Years | 1,417 (26.2%) | $250,001 |
| 45 to 64 Years | 2,577 (47.6%) | $244,185 |
| 65+ Years | 1,412 (26.1%) | $110,417 |
| Total | 5,418 (100.0%) | $215,556 |
Poverty in Vienna
Income Below Poverty by Sex and Age in Vienna
With 5.1% poverty level for males and 4.7% for females among the residents of Vienna, 18 to 24 year old males and 5 year old females are the most vulnerable to poverty, with 96 males (18.6%) and 15 females (14.4%) in their respective age groups living below the poverty level.
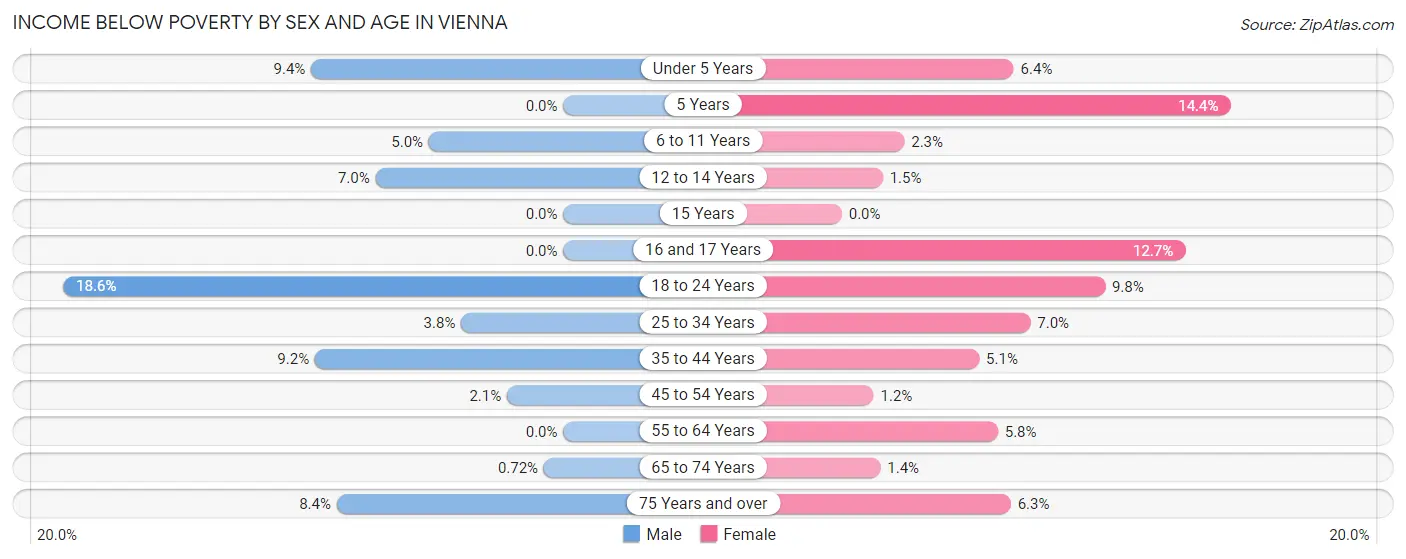
| Age Bracket | Male | Female |
| Under 5 Years | 47 (9.4%) | 35 (6.4%) |
| 5 Years | 0 (0.0%) | 15 (14.4%) |
| 6 to 11 Years | 39 (5.0%) | 20 (2.3%) |
| 12 to 14 Years | 26 (7.0%) | 8 (1.5%) |
| 15 Years | 0 (0.0%) | 0 (0.0%) |
| 16 and 17 Years | 0 (0.0%) | 33 (12.7%) |
| 18 to 24 Years | 96 (18.6%) | 42 (9.8%) |
| 25 to 34 Years | 18 (3.8%) | 41 (7.0%) |
| 35 to 44 Years | 117 (9.2%) | 64 (5.1%) |
| 45 to 54 Years | 25 (2.1%) | 14 (1.2%) |
| 55 to 64 Years | 0 (0.0%) | 71 (5.8%) |
| 65 to 74 Years | 5 (0.7%) | 9 (1.4%) |
| 75 Years and over | 35 (8.4%) | 41 (6.3%) |
| Total | 408 (5.1%) | 393 (4.7%) |
Income Above Poverty by Sex and Age in Vienna
According to the poverty statistics in Vienna, males aged 5 years and females aged 15 years are the age groups that are most secure financially, with 100.0% of males and 100.0% of females in these age groups living above the poverty line.
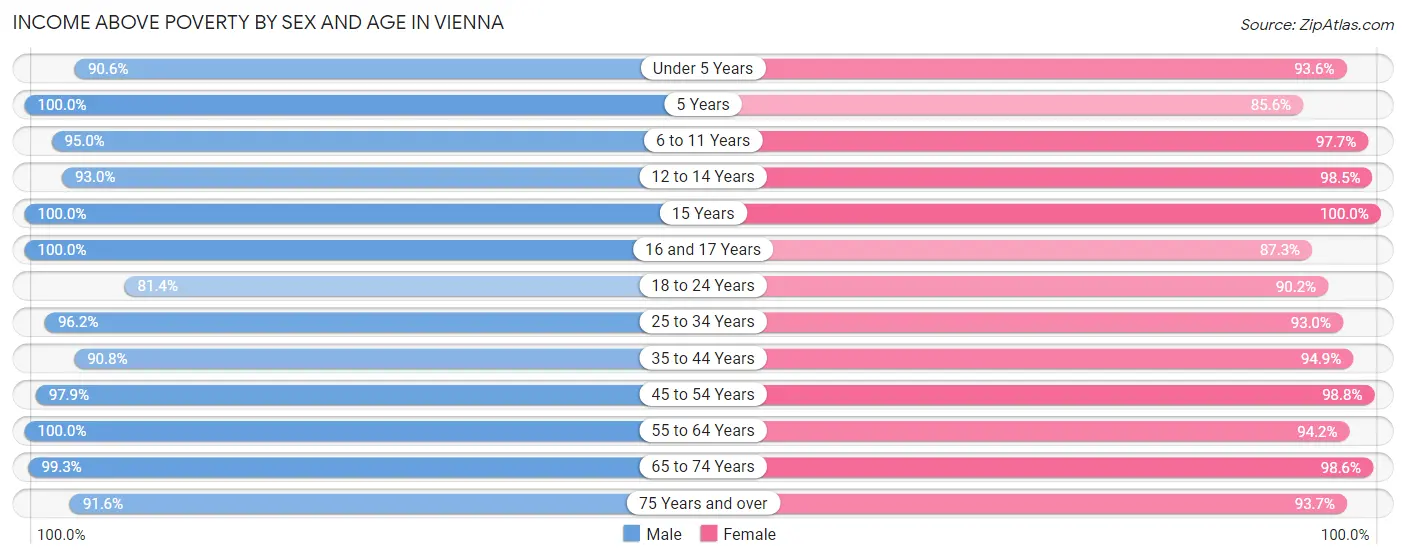
| Age Bracket | Male | Female |
| Under 5 Years | 455 (90.6%) | 514 (93.6%) |
| 5 Years | 47 (100.0%) | 89 (85.6%) |
| 6 to 11 Years | 742 (95.0%) | 842 (97.7%) |
| 12 to 14 Years | 347 (93.0%) | 518 (98.5%) |
| 15 Years | 113 (100.0%) | 164 (100.0%) |
| 16 and 17 Years | 288 (100.0%) | 226 (87.3%) |
| 18 to 24 Years | 421 (81.4%) | 388 (90.2%) |
| 25 to 34 Years | 457 (96.2%) | 545 (93.0%) |
| 35 to 44 Years | 1,152 (90.8%) | 1,190 (94.9%) |
| 45 to 54 Years | 1,174 (97.9%) | 1,168 (98.8%) |
| 55 to 64 Years | 1,262 (100.0%) | 1,155 (94.2%) |
| 65 to 74 Years | 688 (99.3%) | 620 (98.6%) |
| 75 Years and over | 381 (91.6%) | 613 (93.7%) |
| Total | 7,527 (94.9%) | 8,032 (95.3%) |
Income Below Poverty Among Married-Couple Families in Vienna
The poverty statistics for married-couple families in Vienna show that 2.2% or 84 of the total 3,762 families live below the poverty line. Families with 3 or 4 children have the highest poverty rate of 6.7%, comprising of 27 families. On the other hand, families with 5 or more children have the lowest poverty rate of 0.0%, which includes 0 families.
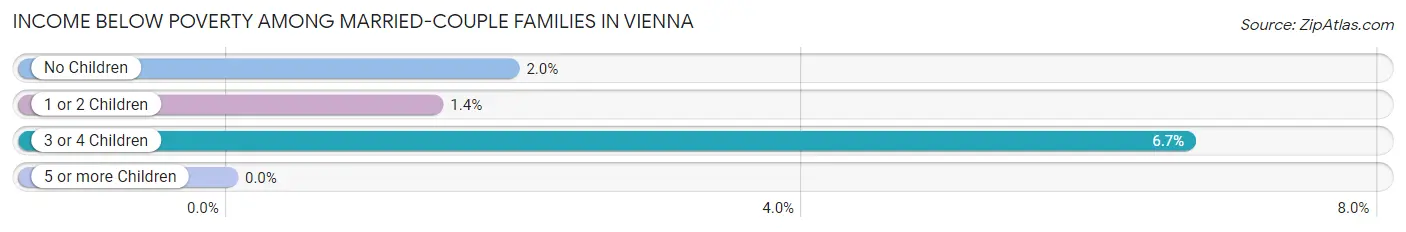
| Children | Above Poverty | Below Poverty |
| No Children | 1,754 (98.0%) | 35 (2.0%) |
| 1 or 2 Children | 1,518 (98.6%) | 22 (1.4%) |
| 3 or 4 Children | 378 (93.3%) | 27 (6.7%) |
| 5 or more Children | 28 (100.0%) | 0 (0.0%) |
| Total | 3,678 (97.8%) | 84 (2.2%) |
Income Below Poverty Among Single-Parent Households in Vienna
According to the poverty data in Vienna, 8.8% or 12 single-father households and 12.4% or 56 single-mother households are living below the poverty line. Among single-father households, those with 1 or 2 children have the highest poverty rate, with 12 households (12.0%) experiencing poverty. Likewise, among single-mother households, those with 3 or 4 children have the highest poverty rate, with 5 households (71.4%) falling below the poverty line.
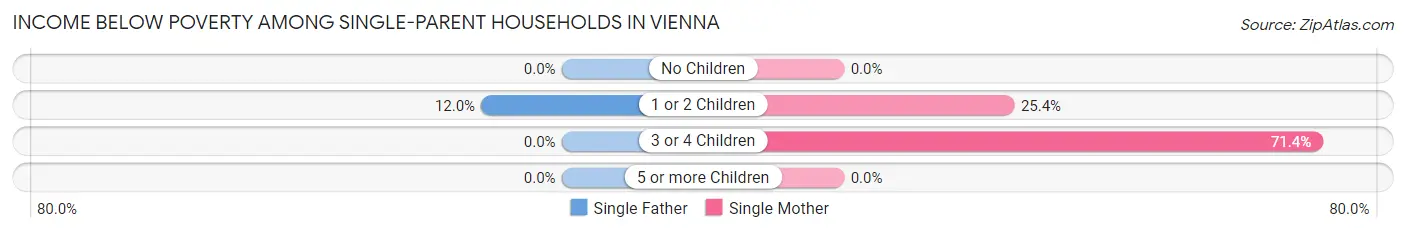
| Children | Single Father | Single Mother |
| No Children | 0 (0.0%) | 0 (0.0%) |
| 1 or 2 Children | 12 (12.0%) | 51 (25.4%) |
| 3 or 4 Children | 0 (0.0%) | 5 (71.4%) |
| 5 or more Children | 0 (0.0%) | 0 (0.0%) |
| Total | 12 (8.8%) | 56 (12.4%) |
Income Below Poverty Among Married-Couple vs Single-Parent Households in Vienna
The poverty data for Vienna shows that 84 of the married-couple family households (2.2%) and 68 of the single-parent households (11.5%) are living below the poverty level. Within the married-couple family households, those with 3 or 4 children have the highest poverty rate, with 27 households (6.7%) falling below the poverty line. Among the single-parent households, those with 3 or 4 children have the highest poverty rate, with 5 household (71.4%) living below poverty.
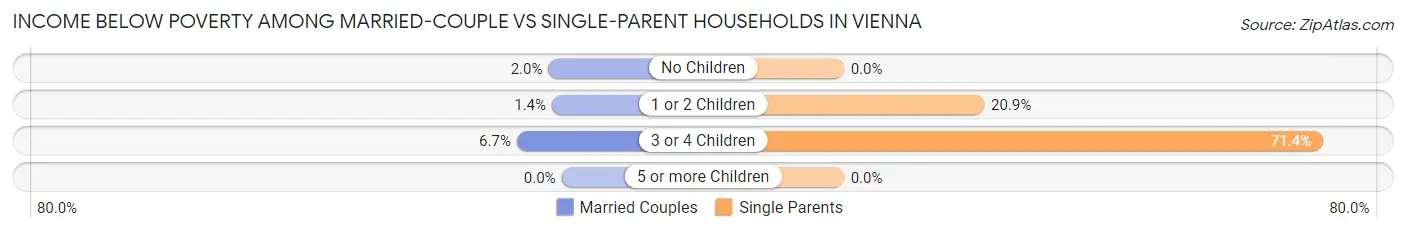
| Children | Married-Couple Families | Single-Parent Households |
| No Children | 35 (2.0%) | 0 (0.0%) |
| 1 or 2 Children | 22 (1.4%) | 63 (20.9%) |
| 3 or 4 Children | 27 (6.7%) | 5 (71.4%) |
| 5 or more Children | 0 (0.0%) | 0 (0.0%) |
| Total | 84 (2.2%) | 68 (11.5%) |
Race in Vienna
The most populous races in Vienna are White / Caucasian (11,532 | 70.3%), Asian (2,189 | 13.4%), and Two or more Races (1,460 | 8.9%).
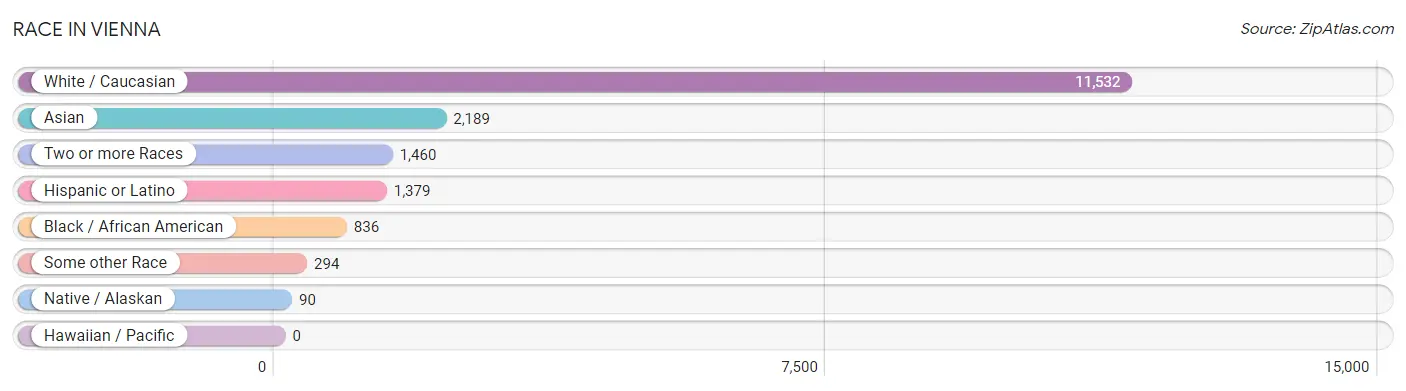
| Race | # Population | % Population |
| Asian | 2,189 | 13.4% |
| Black / African American | 836 | 5.1% |
| Hawaiian / Pacific | 0 | 0.0% |
| Hispanic or Latino | 1,379 | 8.4% |
| Native / Alaskan | 90 | 0.5% |
| White / Caucasian | 11,532 | 70.3% |
| Two or more Races | 1,460 | 8.9% |
| Some other Race | 294 | 1.8% |
| Total | 16,401 | 100.0% |
Ancestry in Vienna
The most populous ancestries reported in Vienna are German (2,205 | 13.4%), English (2,138 | 13.0%), Irish (2,122 | 12.9%), Italian (915 | 5.6%), and Indian (Asian) (770 | 4.7%), together accounting for 49.7% of all Vienna residents.
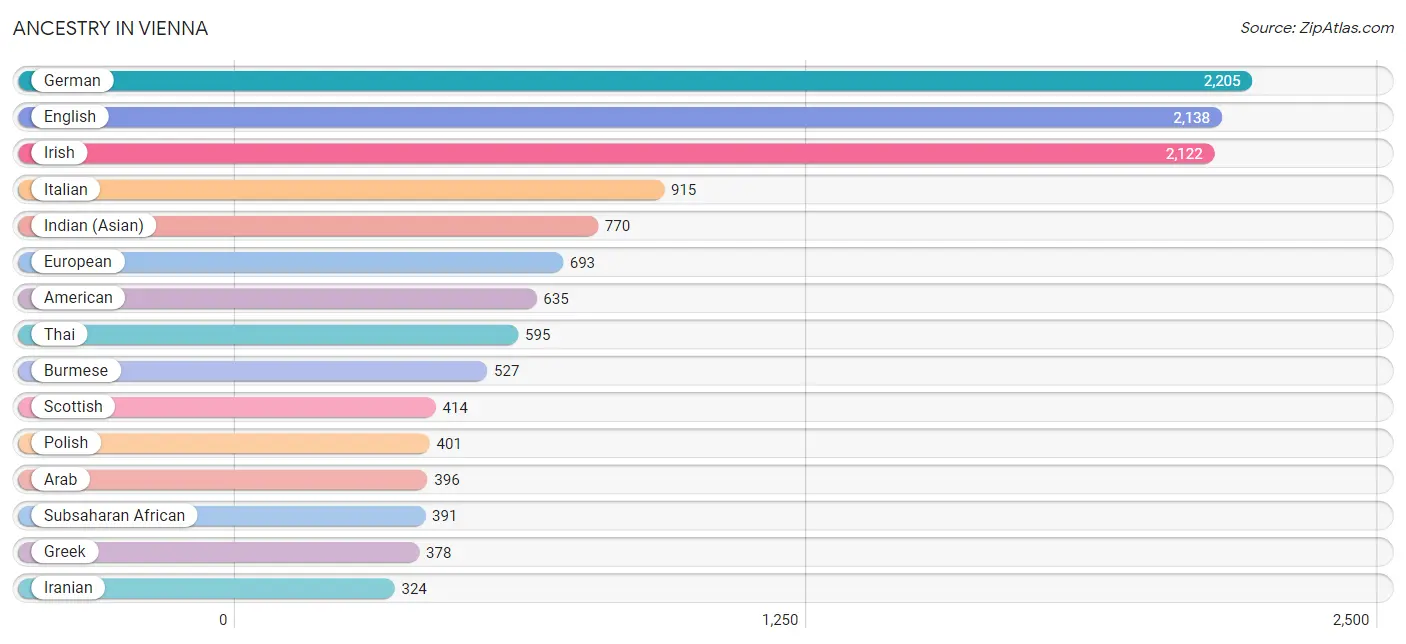
| Ancestry | # Population | % Population |
| Afghan | 75 | 0.5% |
| African | 94 | 0.6% |
| Albanian | 31 | 0.2% |
| American | 635 | 3.9% |
| Arab | 396 | 2.4% |
| Armenian | 72 | 0.4% |
| Australian | 11 | 0.1% |
| Austrian | 135 | 0.8% |
| Belgian | 8 | 0.1% |
| Bhutanese | 230 | 1.4% |
| Bolivian | 20 | 0.1% |
| British | 307 | 1.9% |
| Burmese | 527 | 3.2% |
| Canadian | 28 | 0.2% |
| Central American | 319 | 1.9% |
| Central American Indian | 22 | 0.1% |
| Cherokee | 13 | 0.1% |
| Chickasaw | 65 | 0.4% |
| Choctaw | 8 | 0.1% |
| Colombian | 45 | 0.3% |
| Croatian | 16 | 0.1% |
| Cuban | 93 | 0.6% |
| Cypriot | 42 | 0.3% |
| Czech | 80 | 0.5% |
| Czechoslovakian | 33 | 0.2% |
| Danish | 46 | 0.3% |
| Dutch | 246 | 1.5% |
| Eastern European | 79 | 0.5% |
| Egyptian | 40 | 0.2% |
| English | 2,138 | 13.0% |
| Ethiopian | 16 | 0.1% |
| European | 693 | 4.2% |
| Filipino | 41 | 0.3% |
| Finnish | 12 | 0.1% |
| French | 293 | 1.8% |
| French Canadian | 96 | 0.6% |
| German | 2,205 | 13.4% |
| Ghanaian | 62 | 0.4% |
| Greek | 378 | 2.3% |
| Guatemalan | 48 | 0.3% |
| Haitian | 17 | 0.1% |
| Hungarian | 71 | 0.4% |
| Indian (Asian) | 770 | 4.7% |
| Iranian | 324 | 2.0% |
| Iraqi | 91 | 0.5% |
| Irish | 2,122 | 12.9% |
| Israeli | 7 | 0.0% |
| Italian | 915 | 5.6% |
| Japanese | 5 | 0.0% |
| Jordanian | 50 | 0.3% |
| Korean | 177 | 1.1% |
| Lebanese | 109 | 0.7% |
| Lithuanian | 137 | 0.8% |
| Mexican | 260 | 1.6% |
| Mexican American Indian | 9 | 0.1% |
| Nicaraguan | 16 | 0.1% |
| Northern European | 14 | 0.1% |
| Norwegian | 125 | 0.8% |
| Pakistani | 6 | 0.0% |
| Panamanian | 6 | 0.0% |
| Paraguayan | 30 | 0.2% |
| Peruvian | 40 | 0.2% |
| Polish | 401 | 2.4% |
| Portuguese | 41 | 0.3% |
| Puerto Rican | 108 | 0.7% |
| Romanian | 34 | 0.2% |
| Russian | 236 | 1.4% |
| Salvadoran | 249 | 1.5% |
| Scandinavian | 48 | 0.3% |
| Scotch-Irish | 298 | 1.8% |
| Scottish | 414 | 2.5% |
| Seminole | 12 | 0.1% |
| Serbian | 54 | 0.3% |
| Slovak | 51 | 0.3% |
| Slovene | 36 | 0.2% |
| Somali | 64 | 0.4% |
| South African | 28 | 0.2% |
| South American | 143 | 0.9% |
| Spaniard | 171 | 1.0% |
| Spanish | 149 | 0.9% |
| Sri Lankan | 313 | 1.9% |
| Subsaharan African | 391 | 2.4% |
| Sudanese | 153 | 0.9% |
| Swedish | 70 | 0.4% |
| Swiss | 24 | 0.2% |
| Syrian | 25 | 0.2% |
| Thai | 595 | 3.6% |
| Ukrainian | 118 | 0.7% |
| Vietnamese | 97 | 0.6% |
| Welsh | 134 | 0.8% |
| West Indian | 12 | 0.1% | View All 91 Rows |
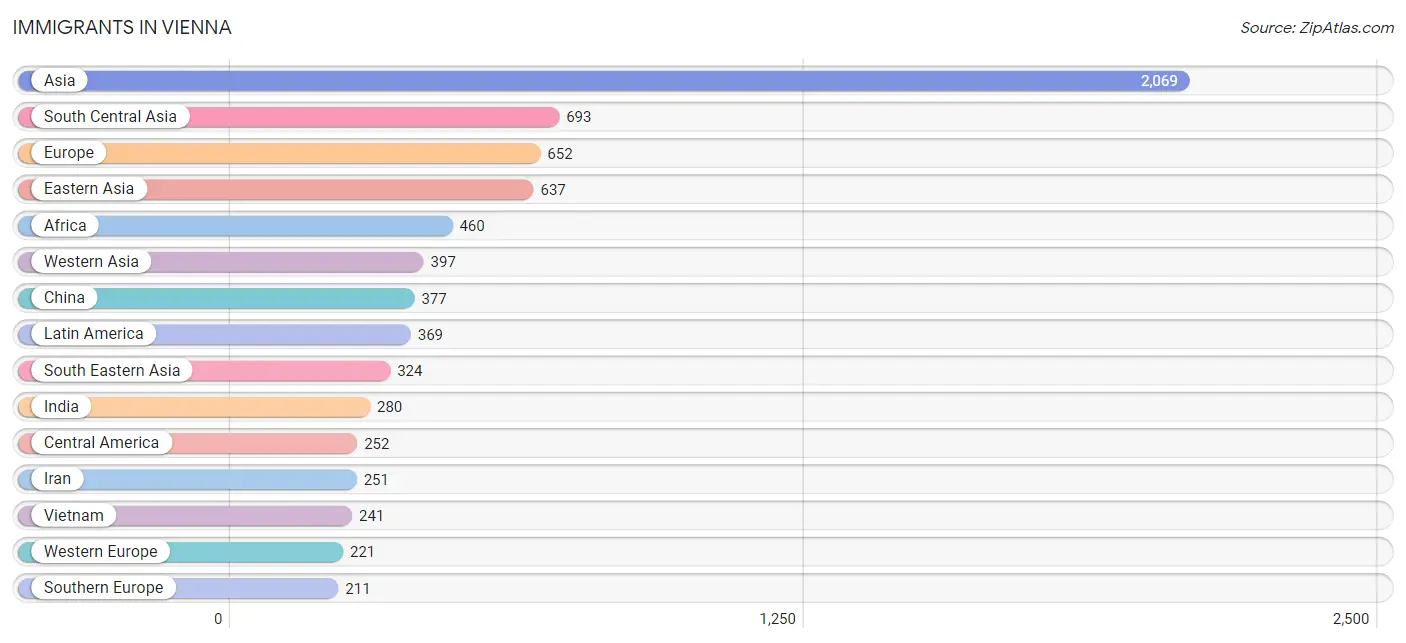
Immigrants in Vienna
The most numerous immigrant groups reported in Vienna came from Asia (2,069 | 12.6%), South Central Asia (693 | 4.2%), Europe (652 | 4.0%), Eastern Asia (637 | 3.9%), and Africa (460 | 2.8%), together accounting for 27.5% of all Vienna residents.
| Immigration Origin | # Population | % Population |
| Afghanistan | 71 | 0.4% |
| Africa | 460 | 2.8% |
| Albania | 24 | 0.2% |
| Armenia | 62 | 0.4% |
| Asia | 2,069 | 12.6% |
| Bangladesh | 30 | 0.2% |
| Belarus | 4 | 0.0% |
| Belgium | 44 | 0.3% |
| Bolivia | 4 | 0.0% |
| Brazil | 33 | 0.2% |
| Cambodia | 5 | 0.0% |
| Canada | 100 | 0.6% |
| Caribbean | 6 | 0.0% |
| Central America | 252 | 1.5% |
| China | 377 | 2.3% |
| Colombia | 28 | 0.2% |
| Czechoslovakia | 11 | 0.1% |
| Eastern Africa | 183 | 1.1% |
| Eastern Asia | 637 | 3.9% |
| Eastern Europe | 158 | 1.0% |
| Egypt | 18 | 0.1% |
| El Salvador | 204 | 1.2% |
| England | 13 | 0.1% |
| Ethiopia | 127 | 0.8% |
| Europe | 652 | 4.0% |
| France | 85 | 0.5% |
| Germany | 81 | 0.5% |
| Ghana | 62 | 0.4% |
| Greece | 44 | 0.3% |
| Guatemala | 11 | 0.1% |
| Haiti | 6 | 0.0% |
| Hong Kong | 9 | 0.1% |
| Hungary | 11 | 0.1% |
| India | 280 | 1.7% |
| Iran | 251 | 1.5% |
| Iraq | 125 | 0.8% |
| Italy | 4 | 0.0% |
| Japan | 77 | 0.5% |
| Jordan | 3 | 0.0% |
| Kenya | 51 | 0.3% |
| Korea | 183 | 1.1% |
| Latin America | 369 | 2.2% |
| Lebanon | 73 | 0.4% |
| Malaysia | 28 | 0.2% |
| Mexico | 25 | 0.2% |
| Middle Africa | 12 | 0.1% |
| Morocco | 20 | 0.1% |
| Nepal | 14 | 0.1% |
| Netherlands | 11 | 0.1% |
| Nicaragua | 12 | 0.1% |
| Northern Africa | 174 | 1.1% |
| Northern Europe | 62 | 0.4% |
| Pakistan | 43 | 0.3% |
| Peru | 39 | 0.2% |
| Philippines | 50 | 0.3% |
| Portugal | 3 | 0.0% |
| Romania | 12 | 0.1% |
| Russia | 15 | 0.1% |
| Saudi Arabia | 96 | 0.6% |
| South Africa | 24 | 0.2% |
| South America | 111 | 0.7% |
| South Central Asia | 693 | 4.2% |
| South Eastern Asia | 324 | 2.0% |
| Southern Europe | 211 | 1.3% |
| Spain | 160 | 1.0% |
| Sudan | 122 | 0.7% |
| Syria | 9 | 0.1% |
| Taiwan | 84 | 0.5% |
| Ukraine | 61 | 0.4% |
| Venezuela | 7 | 0.0% |
| Vietnam | 241 | 1.5% |
| Western Africa | 62 | 0.4% |
| Western Asia | 397 | 2.4% |
| Western Europe | 221 | 1.3% |
| Zaire | 12 | 0.1% |
| Zimbabwe | 5 | 0.0% | View All 76 Rows |
Sex and Age in Vienna
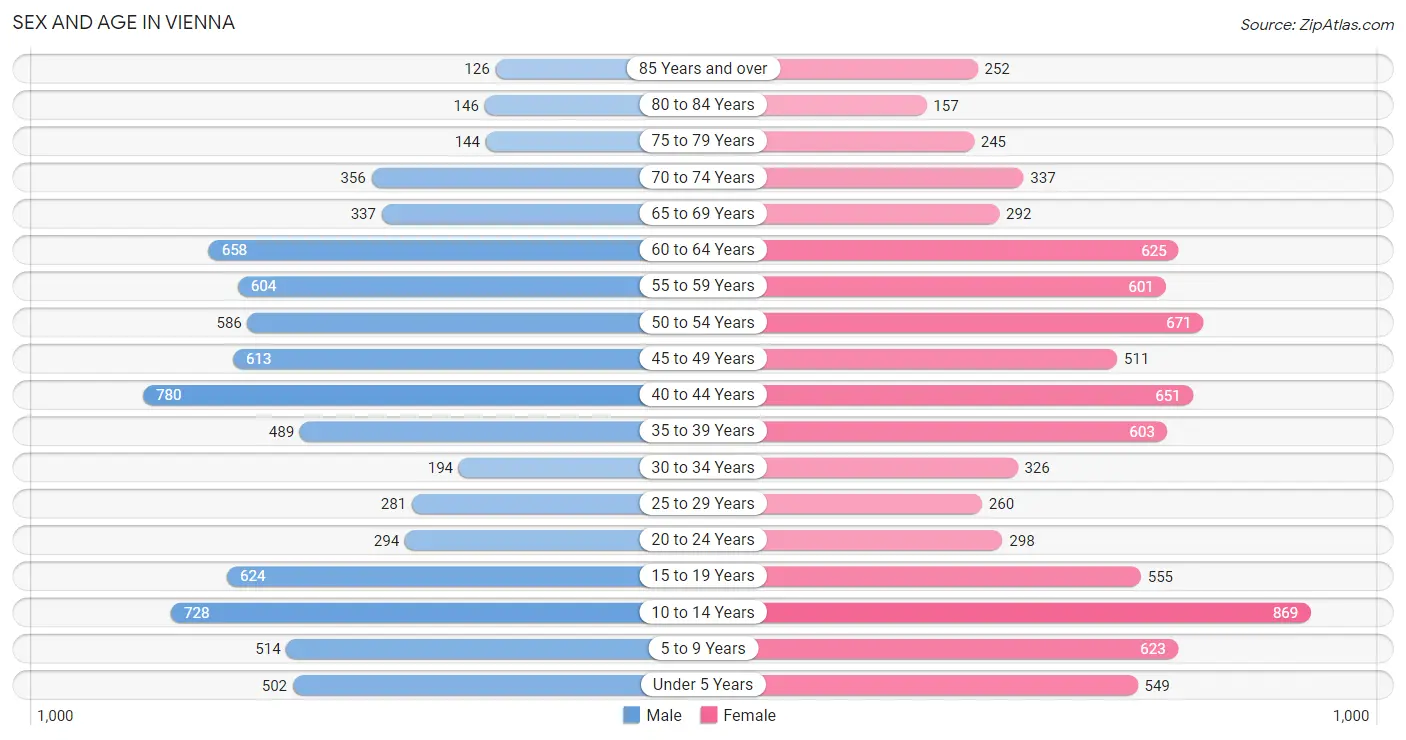
Sex and Age in Vienna
The most populous age groups in Vienna are 40 to 44 Years (780 | 9.8%) for men and 10 to 14 Years (869 | 10.3%) for women.
| Age Bracket | Male | Female |
| Under 5 Years | 502 (6.3%) | 549 (6.5%) |
| 5 to 9 Years | 514 (6.4%) | 623 (7.4%) |
| 10 to 14 Years | 728 (9.1%) | 869 (10.3%) |
| 15 to 19 Years | 624 (7.8%) | 555 (6.6%) |
| 20 to 24 Years | 294 (3.7%) | 298 (3.5%) |
| 25 to 29 Years | 281 (3.5%) | 260 (3.1%) |
| 30 to 34 Years | 194 (2.4%) | 326 (3.9%) |
| 35 to 39 Years | 489 (6.1%) | 603 (7.2%) |
| 40 to 44 Years | 780 (9.8%) | 651 (7.7%) |
| 45 to 49 Years | 613 (7.7%) | 511 (6.1%) |
| 50 to 54 Years | 586 (7.3%) | 671 (8.0%) |
| 55 to 59 Years | 604 (7.6%) | 601 (7.1%) |
| 60 to 64 Years | 658 (8.3%) | 625 (7.4%) |
| 65 to 69 Years | 337 (4.2%) | 292 (3.5%) |
| 70 to 74 Years | 356 (4.5%) | 337 (4.0%) |
| 75 to 79 Years | 144 (1.8%) | 245 (2.9%) |
| 80 to 84 Years | 146 (1.8%) | 157 (1.9%) |
| 85 Years and over | 126 (1.6%) | 252 (3.0%) |
| Total | 7,976 (100.0%) | 8,425 (100.0%) |
Families and Households in Vienna
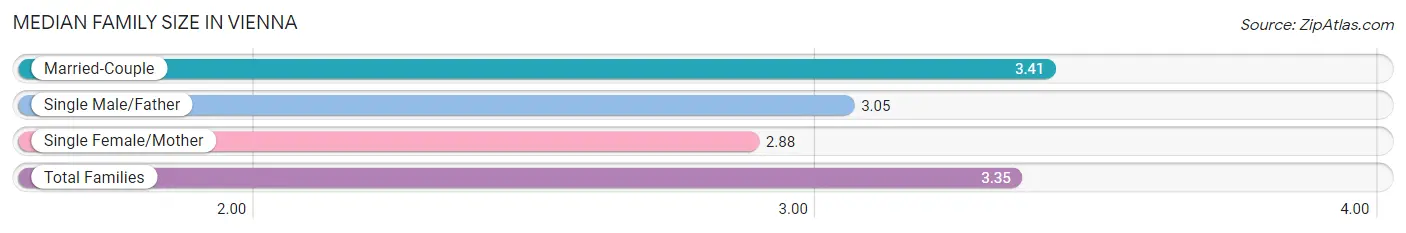
Median Family Size in Vienna
The median family size in Vienna is 3.35 persons per family, with married-couple families (3,762 | 86.5%) accounting for the largest median family size of 3.41 persons per family. On the other hand, single female/mother families (452 | 10.4%) represent the smallest median family size with 2.88 persons per family.
| Family Type | # Families | Family Size |
| Married-Couple | 3,762 (86.5%) | 3.41 |
| Single Male/Father | 137 (3.2%) | 3.05 |
| Single Female/Mother | 452 (10.4%) | 2.88 |
| Total Families | 4,351 (100.0%) | 3.35 |
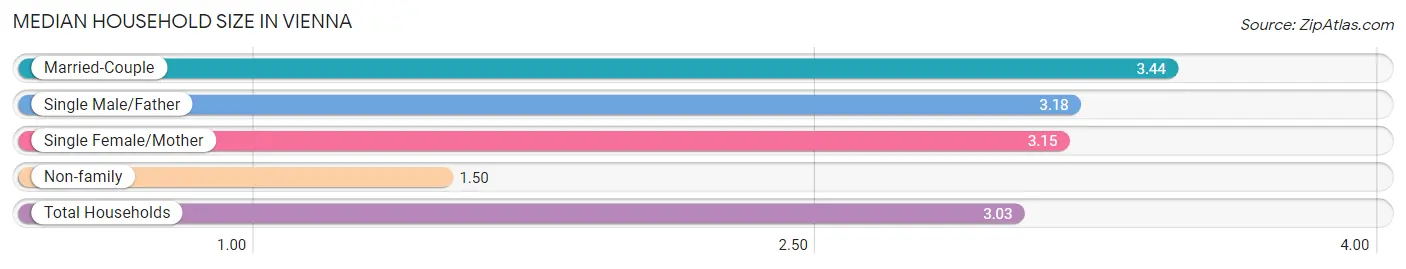
Median Household Size in Vienna
The median household size in Vienna is 3.03 persons per household, with married-couple households (3,762 | 69.4%) accounting for the largest median household size of 3.44 persons per household. non-family households (1,067 | 19.7%) represent the smallest median household size with 1.50 persons per household.
| Household Type | # Households | Household Size |
| Married-Couple | 3,762 (69.4%) | 3.44 |
| Single Male/Father | 137 (2.5%) | 3.18 |
| Single Female/Mother | 452 (8.3%) | 3.15 |
| Non-family | 1,067 (19.7%) | 1.50 |
| Total Households | 5,418 (100.0%) | 3.03 |
Household Size by Marriage Status in Vienna
Out of a total of 5,418 households in Vienna, 4,351 (80.3%) are family households, while 1,067 (19.7%) are nonfamily households. The most numerous type of family households are 2-person households, comprising 1,545, and the most common type of nonfamily households are 1-person households, comprising 889.
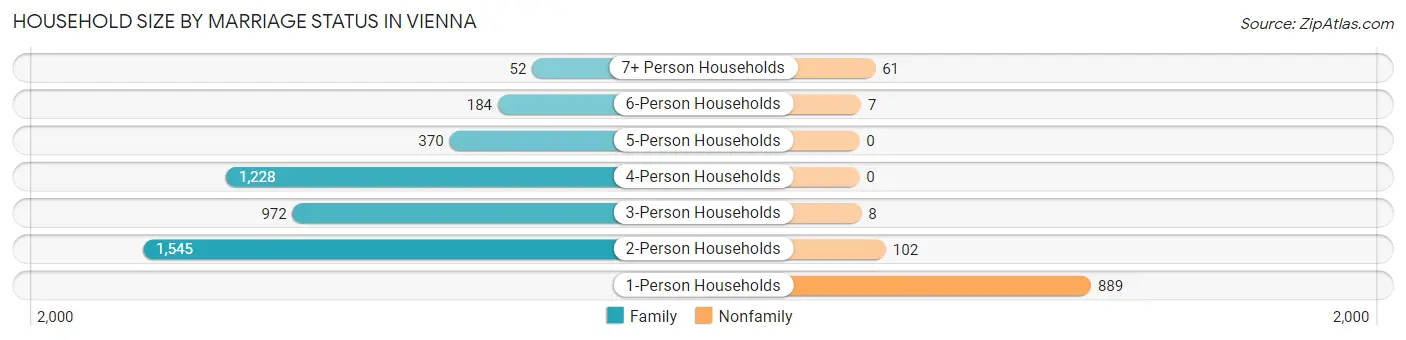
| Household Size | Family Households | Nonfamily Households |
| 1-Person Households | - | 889 (16.4%) |
| 2-Person Households | 1,545 (28.5%) | 102 (1.9%) |
| 3-Person Households | 972 (17.9%) | 8 (0.2%) |
| 4-Person Households | 1,228 (22.7%) | 0 (0.0%) |
| 5-Person Households | 370 (6.8%) | 0 (0.0%) |
| 6-Person Households | 184 (3.4%) | 7 (0.1%) |
| 7+ Person Households | 52 (1.0%) | 61 (1.1%) |
| Total | 4,351 (80.3%) | 1,067 (19.7%) |
Female Fertility in Vienna
Fertility by Age in Vienna
Average fertility rate in Vienna is 35.0 births per 1,000 women. Women in the age bracket of 20 to 34 years have the highest fertility rate with 43.0 births per 1,000 women. Women in the age bracket of 35 to 50 years acount for 67.5% of all women with births.
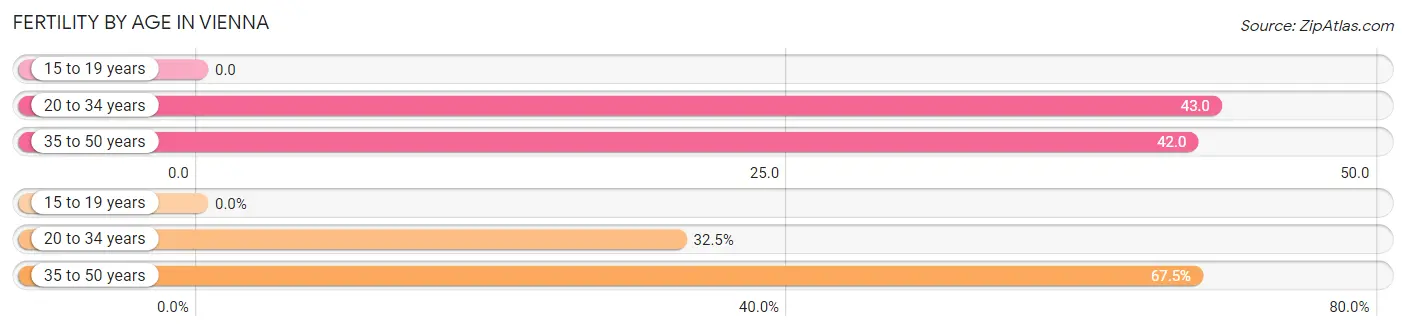
| Age Bracket | Women with Births | Births / 1,000 Women |
| 15 to 19 years | 0 (0.0%) | 0.0 |
| 20 to 34 years | 38 (32.5%) | 43.0 |
| 35 to 50 years | 79 (67.5%) | 42.0 |
| Total | 117 (100.0%) | 35.0 |
Fertility by Age by Marriage Status in Vienna
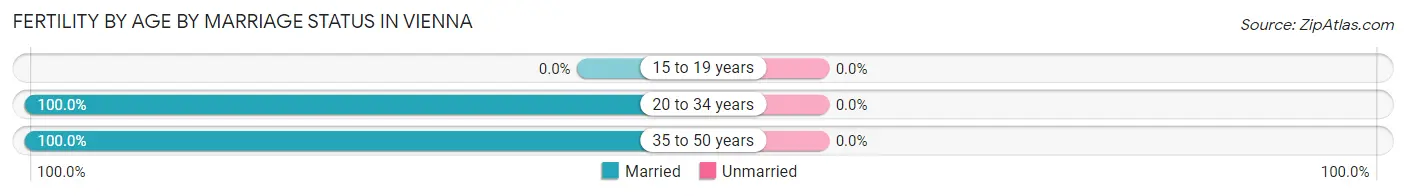
| Age Bracket | Married | Unmarried |
| 15 to 19 years | 0 (0.0%) | 0 (0.0%) |
| 20 to 34 years | 38 (100.0%) | 0 (0.0%) |
| 35 to 50 years | 79 (100.0%) | 0 (0.0%) |
| Total | 117 (100.0%) | 0 (0.0%) |
Fertility by Education in Vienna
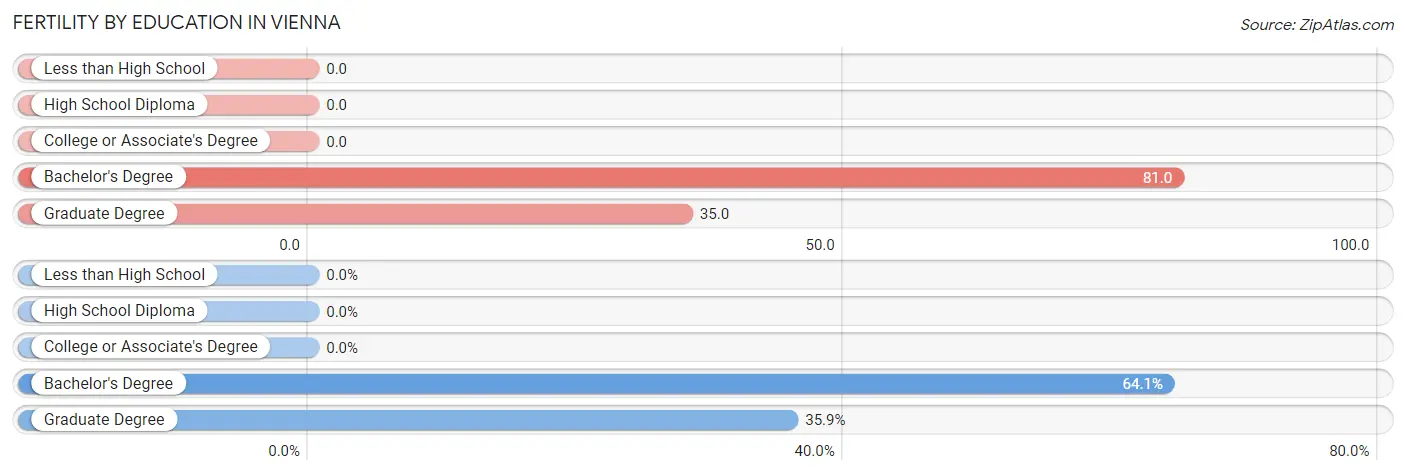
| Educational Attainment | Women with Births | Births / 1,000 Women |
| Less than High School | 0 (0.0%) | 0.0 |
| High School Diploma | 0 (0.0%) | 0.0 |
| College or Associate's Degree | 0 (0.0%) | 0.0 |
| Bachelor's Degree | 75 (64.1%) | 81.0 |
| Graduate Degree | 42 (35.9%) | 35.0 |
| Total | 117 (100.0%) | 35.0 |
Fertility by Education by Marriage Status in Vienna
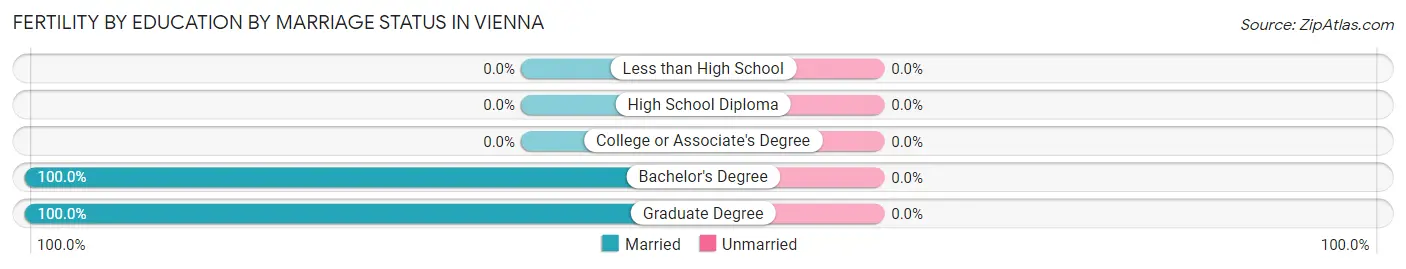
| Educational Attainment | Married | Unmarried |
| Less than High School | 0 (0.0%) | 0 (0.0%) |
| High School Diploma | 0 (0.0%) | 0 (0.0%) |
| College or Associate's Degree | 0 (0.0%) | 0 (0.0%) |
| Bachelor's Degree | 75 (100.0%) | 0 (0.0%) |
| Graduate Degree | 42 (100.0%) | 0 (0.0%) |
| Total | 117 (100.0%) | 0 (0.0%) |
Employment Characteristics in Vienna
Employment by Class of Employer in Vienna
Among the 8,232 employed individuals in Vienna, private company employees (4,711 | 57.2%), federal government employees (987 | 12.0%), and not-for-profit organizations (885 | 10.7%) make up the most common classes of employment.
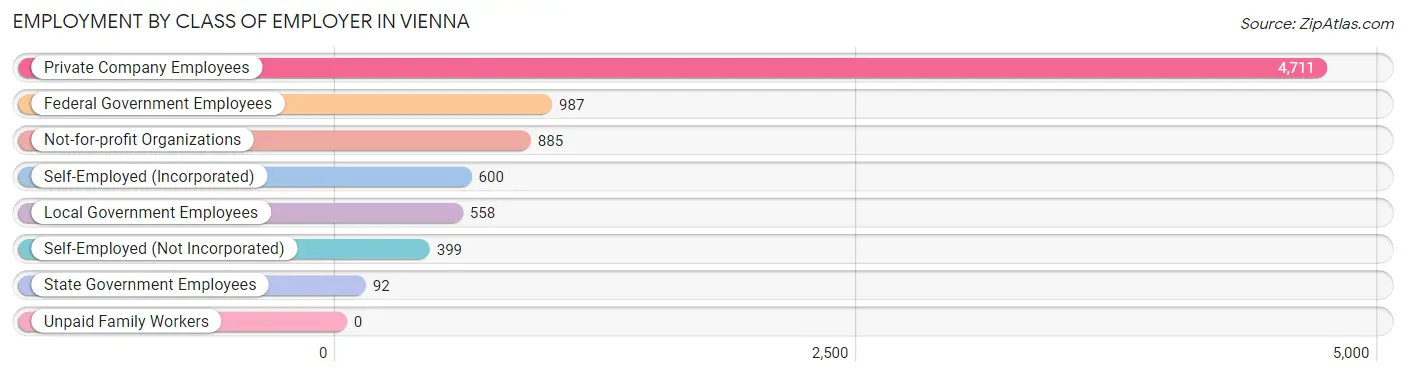
| Employer Class | # Employees | % Employees |
| Private Company Employees | 4,711 | 57.2% |
| Self-Employed (Incorporated) | 600 | 7.3% |
| Self-Employed (Not Incorporated) | 399 | 4.9% |
| Not-for-profit Organizations | 885 | 10.7% |
| Local Government Employees | 558 | 6.8% |
| State Government Employees | 92 | 1.1% |
| Federal Government Employees | 987 | 12.0% |
| Unpaid Family Workers | 0 | 0.0% |
| Total | 8,232 | 100.0% |
Employment Status by Age in Vienna
According to the labor force statistics for Vienna, out of the total population over 16 years of age (12,339), 69.8% or 8,613 individuals are in the labor force, with 3.6% or 310 of them unemployed. The age group with the highest labor force participation rate is 35 to 44 years, with 90.2% or 2,276 individuals in the labor force. Within the labor force, the 20 to 24 years age range has the highest percentage of unemployed individuals, with 9.9% or 46 of them being unemployed.
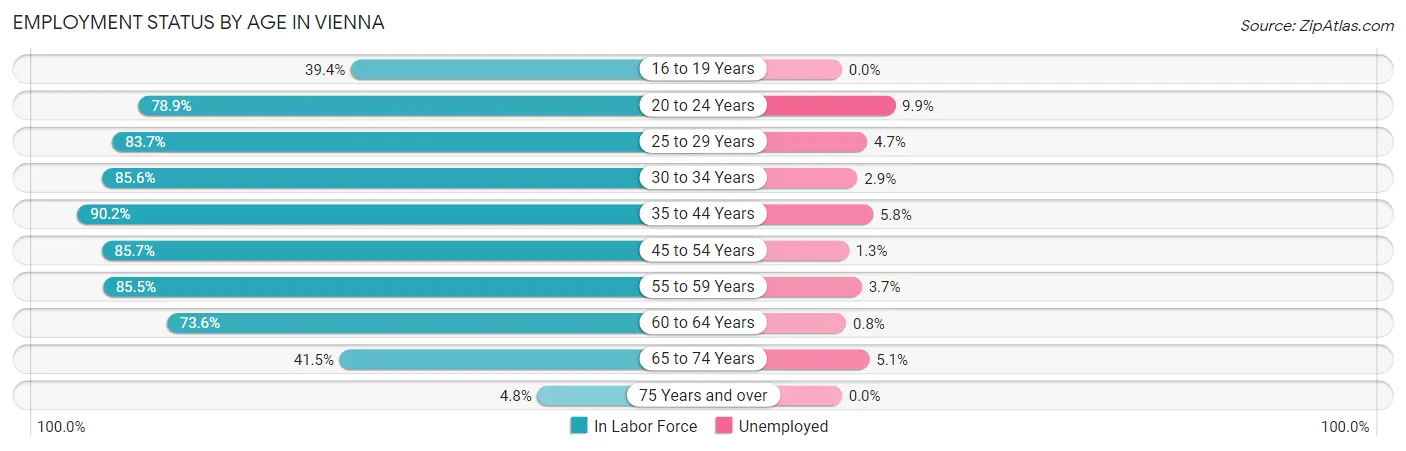
| Age Bracket | In Labor Force | Unemployed |
| 16 to 19 Years | 355 (39.4%) | 0 (0.0%) |
| 20 to 24 Years | 467 (78.9%) | 46 (9.9%) |
| 25 to 29 Years | 453 (83.7%) | 21 (4.7%) |
| 30 to 34 Years | 445 (85.6%) | 13 (2.9%) |
| 35 to 44 Years | 2,276 (90.2%) | 132 (5.8%) |
| 45 to 54 Years | 2,041 (85.7%) | 27 (1.3%) |
| 55 to 59 Years | 1,030 (85.5%) | 38 (3.7%) |
| 60 to 64 Years | 944 (73.6%) | 8 (0.8%) |
| 65 to 74 Years | 549 (41.5%) | 28 (5.1%) |
| 75 Years and over | 51 (4.8%) | 0 (0.0%) |
| Total | 8,613 (69.8%) | 310 (3.6%) |
Employment Status by Educational Attainment in Vienna
According to labor force statistics for Vienna, 85.0% of individuals (7,185) out of the total population between 25 and 64 years of age (8,453) are in the labor force, with 3.3% or 237 of them being unemployed. The group with the highest labor force participation rate are those with the educational attainment of bachelor's degree or higher, with 87.9% or 5,845 individuals in the labor force. Within the labor force, individuals with less than high school education have the highest percentage of unemployment, with 10.2% or 13 of them being unemployed.
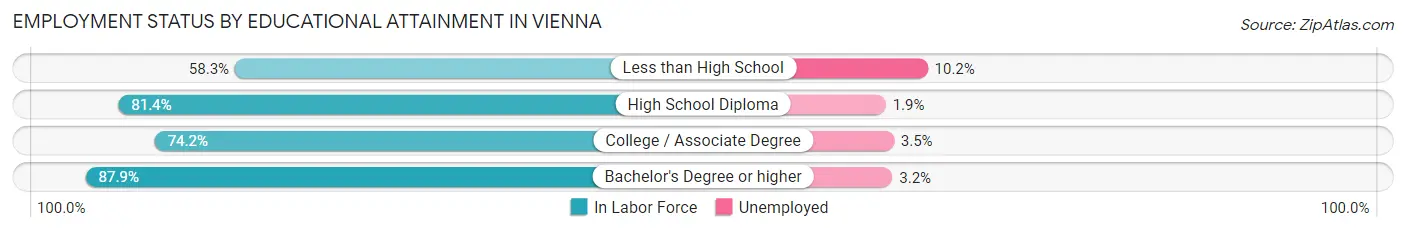
| Educational Attainment | In Labor Force | Unemployed |
| Less than High School | 127 (58.3%) | 22 (10.2%) |
| High School Diploma | 464 (81.4%) | 11 (1.9%) |
| College / Associate Degree | 753 (74.2%) | 36 (3.5%) |
| Bachelor's Degree or higher | 5,845 (87.9%) | 213 (3.2%) |
| Total | 7,185 (85.0%) | 279 (3.3%) |
Employment Occupations by Sex in Vienna
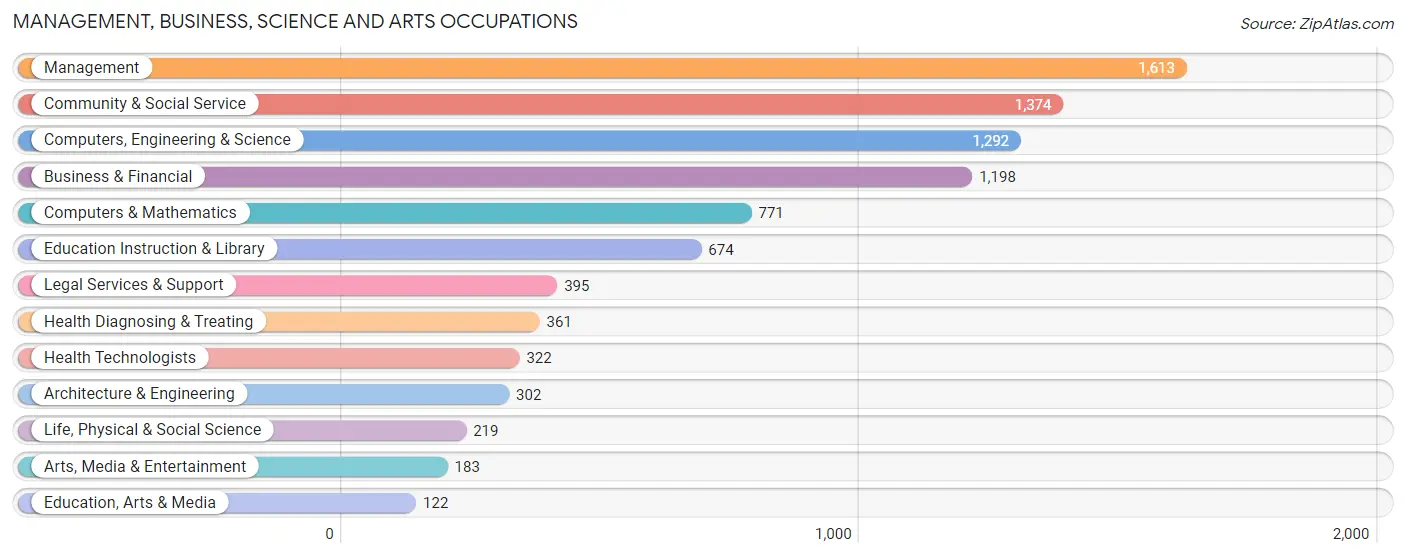
Management, Business, Science and Arts Occupations
The most common Management, Business, Science and Arts occupations in Vienna are Management (1,613 | 19.6%), Community & Social Service (1,374 | 16.7%), Computers, Engineering & Science (1,292 | 15.7%), Business & Financial (1,198 | 14.5%), and Computers & Mathematics (771 | 9.3%).
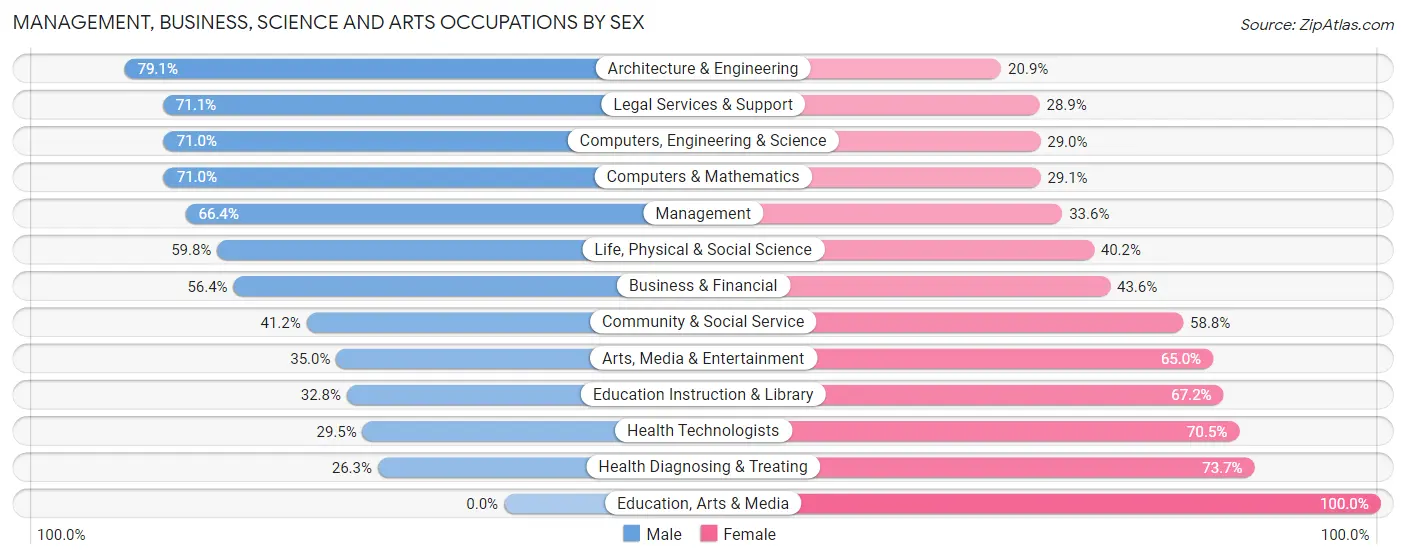
Management, Business, Science and Arts Occupations by Sex
Within the Management, Business, Science and Arts occupations in Vienna, the most male-oriented occupations are Architecture & Engineering (79.1%), Legal Services & Support (71.1%), and Computers, Engineering & Science (71.0%), while the most female-oriented occupations are Education, Arts & Media (100.0%), Health Diagnosing & Treating (73.7%), and Health Technologists (70.5%).
| Occupation | Male | Female |
| Management | 1,071 (66.4%) | 542 (33.6%) |
| Business & Financial | 676 (56.4%) | 522 (43.6%) |
| Computers, Engineering & Science | 917 (71.0%) | 375 (29.0%) |
| Computers & Mathematics | 547 (71.0%) | 224 (29.0%) |
| Architecture & Engineering | 239 (79.1%) | 63 (20.9%) |
| Life, Physical & Social Science | 131 (59.8%) | 88 (40.2%) |
| Community & Social Service | 566 (41.2%) | 808 (58.8%) |
| Education, Arts & Media | 0 (0.0%) | 122 (100.0%) |
| Legal Services & Support | 281 (71.1%) | 114 (28.9%) |
| Education Instruction & Library | 221 (32.8%) | 453 (67.2%) |
| Arts, Media & Entertainment | 64 (35.0%) | 119 (65.0%) |
| Health Diagnosing & Treating | 95 (26.3%) | 266 (73.7%) |
| Health Technologists | 95 (29.5%) | 227 (70.5%) |
| Total (Category) | 3,325 (57.0%) | 2,513 (43.0%) |
| Total (Overall) | 4,580 (55.5%) | 3,666 (44.5%) |
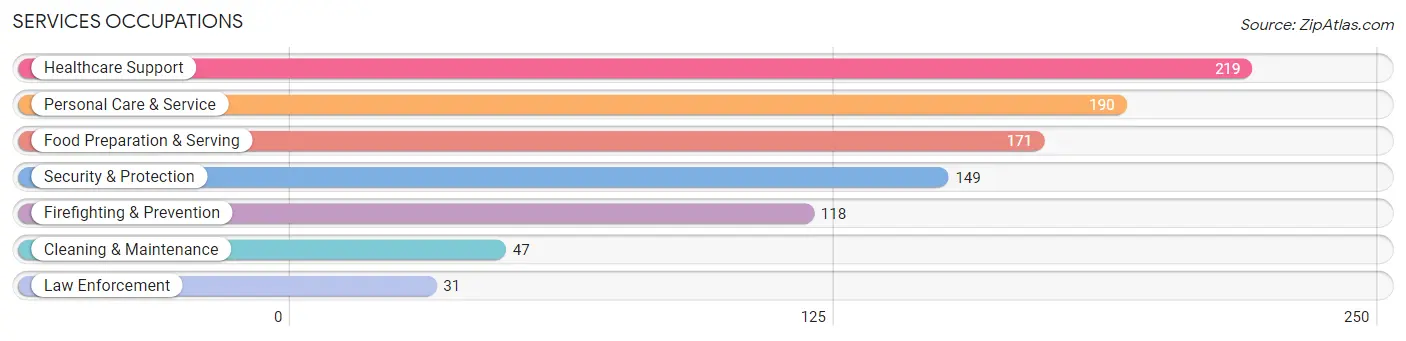
Services Occupations
The most common Services occupations in Vienna are Healthcare Support (219 | 2.7%), Personal Care & Service (190 | 2.3%), Food Preparation & Serving (171 | 2.1%), Security & Protection (149 | 1.8%), and Firefighting & Prevention (118 | 1.4%).
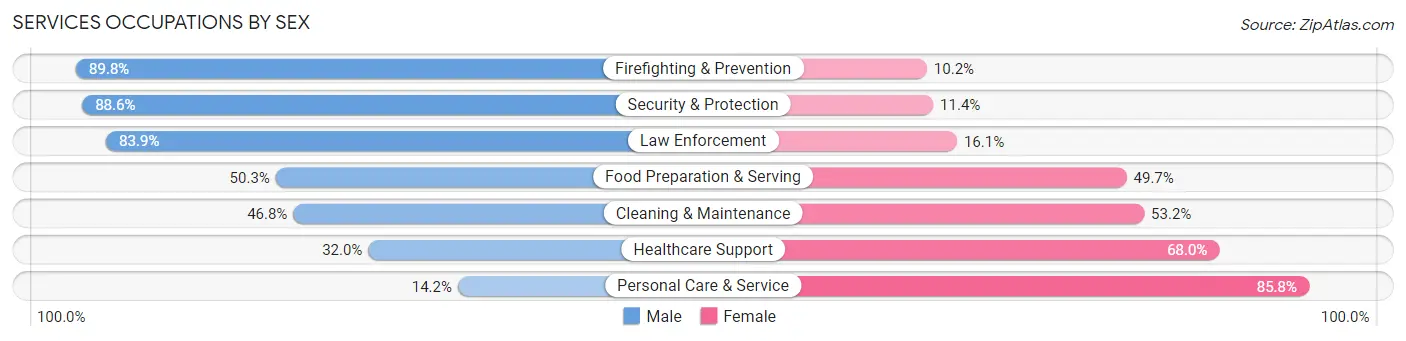
Services Occupations by Sex
Within the Services occupations in Vienna, the most male-oriented occupations are Firefighting & Prevention (89.8%), Security & Protection (88.6%), and Law Enforcement (83.9%), while the most female-oriented occupations are Personal Care & Service (85.8%), Healthcare Support (68.0%), and Cleaning & Maintenance (53.2%).
| Occupation | Male | Female |
| Healthcare Support | 70 (32.0%) | 149 (68.0%) |
| Security & Protection | 132 (88.6%) | 17 (11.4%) |
| Firefighting & Prevention | 106 (89.8%) | 12 (10.2%) |
| Law Enforcement | 26 (83.9%) | 5 (16.1%) |
| Food Preparation & Serving | 86 (50.3%) | 85 (49.7%) |
| Cleaning & Maintenance | 22 (46.8%) | 25 (53.2%) |
| Personal Care & Service | 27 (14.2%) | 163 (85.8%) |
| Total (Category) | 337 (43.4%) | 439 (56.6%) |
| Total (Overall) | 4,580 (55.5%) | 3,666 (44.5%) |
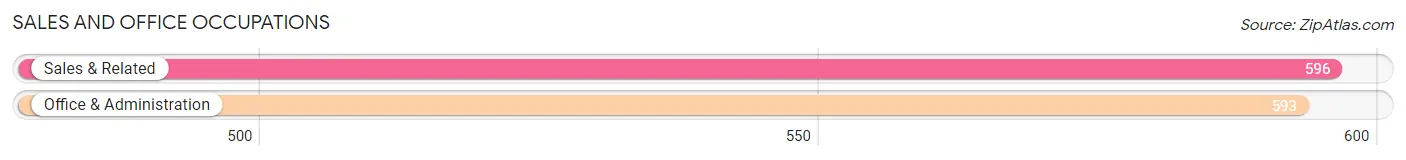
Sales and Office Occupations
The most common Sales and Office occupations in Vienna are Sales & Related (596 | 7.2%), and Office & Administration (593 | 7.2%).
Sales and Office Occupations by Sex
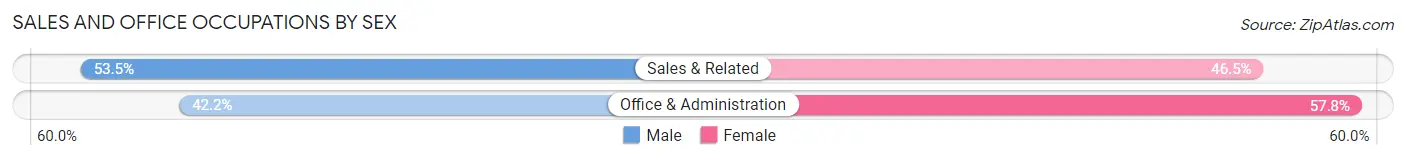
| Occupation | Male | Female |
| Sales & Related | 319 (53.5%) | 277 (46.5%) |
| Office & Administration | 250 (42.2%) | 343 (57.8%) |
| Total (Category) | 569 (47.9%) | 620 (52.1%) |
| Total (Overall) | 4,580 (55.5%) | 3,666 (44.5%) |
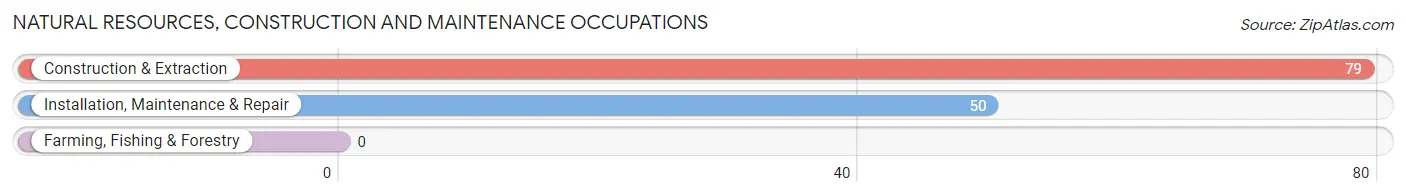
Natural Resources, Construction and Maintenance Occupations
The most common Natural Resources, Construction and Maintenance occupations in Vienna are Construction & Extraction (79 | 1.0%), and Installation, Maintenance & Repair (50 | 0.6%).
Natural Resources, Construction and Maintenance Occupations by Sex
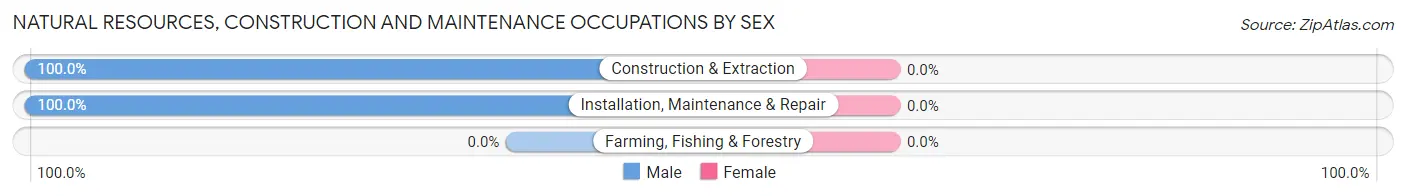
| Occupation | Male | Female |
| Farming, Fishing & Forestry | 0 (0.0%) | 0 (0.0%) |
| Construction & Extraction | 79 (100.0%) | 0 (0.0%) |
| Installation, Maintenance & Repair | 50 (100.0%) | 0 (0.0%) |
| Total (Category) | 129 (100.0%) | 0 (0.0%) |
| Total (Overall) | 4,580 (55.5%) | 3,666 (44.5%) |
Production, Transportation and Moving Occupations
The most common Production, Transportation and Moving occupations in Vienna are Material Moving (149 | 1.8%), Transportation (106 | 1.3%), and Production (59 | 0.7%).
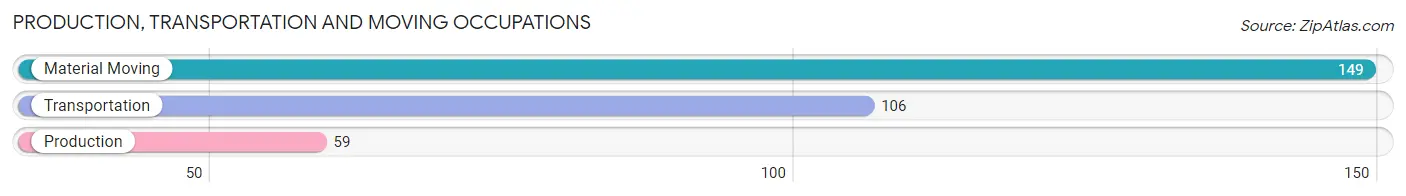
Production, Transportation and Moving Occupations by Sex
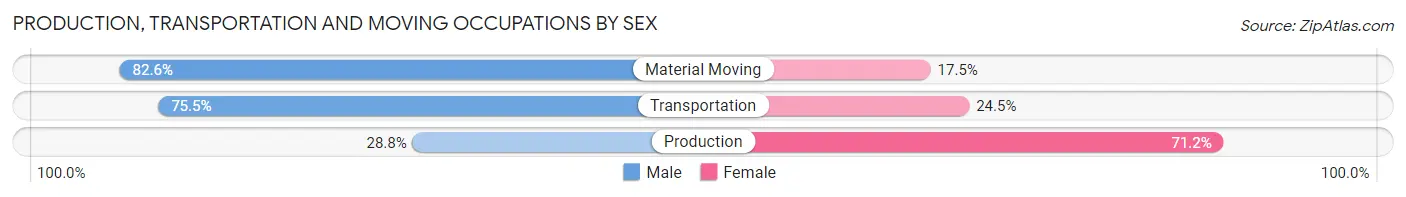
| Occupation | Male | Female |
| Production | 17 (28.8%) | 42 (71.2%) |
| Transportation | 80 (75.5%) | 26 (24.5%) |
| Material Moving | 123 (82.6%) | 26 (17.4%) |
| Total (Category) | 220 (70.1%) | 94 (29.9%) |
| Total (Overall) | 4,580 (55.5%) | 3,666 (44.5%) |
Employment Industries by Sex in Vienna
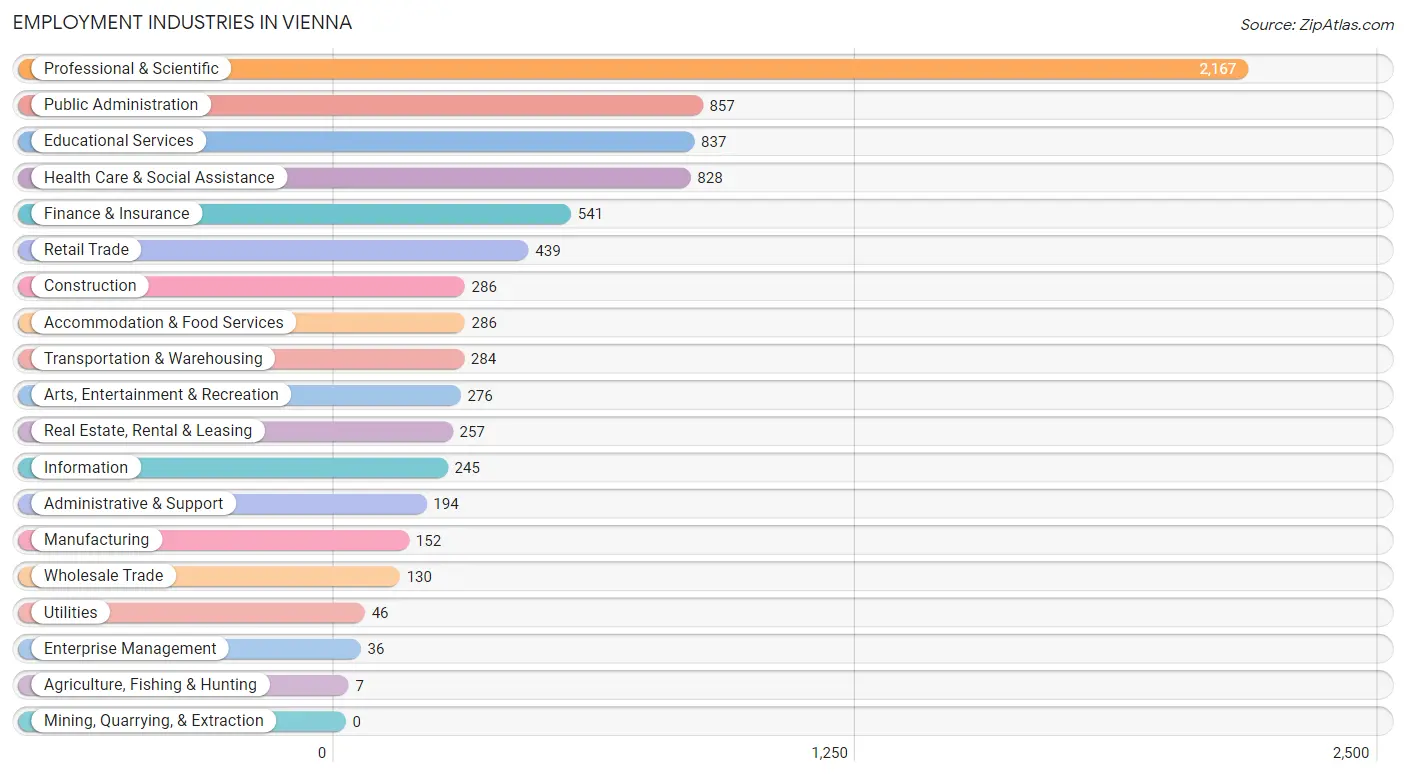
Employment Industries in Vienna
The major employment industries in Vienna include Professional & Scientific (2,167 | 26.3%), Public Administration (857 | 10.4%), Educational Services (837 | 10.2%), Health Care & Social Assistance (828 | 10.0%), and Finance & Insurance (541 | 6.6%).
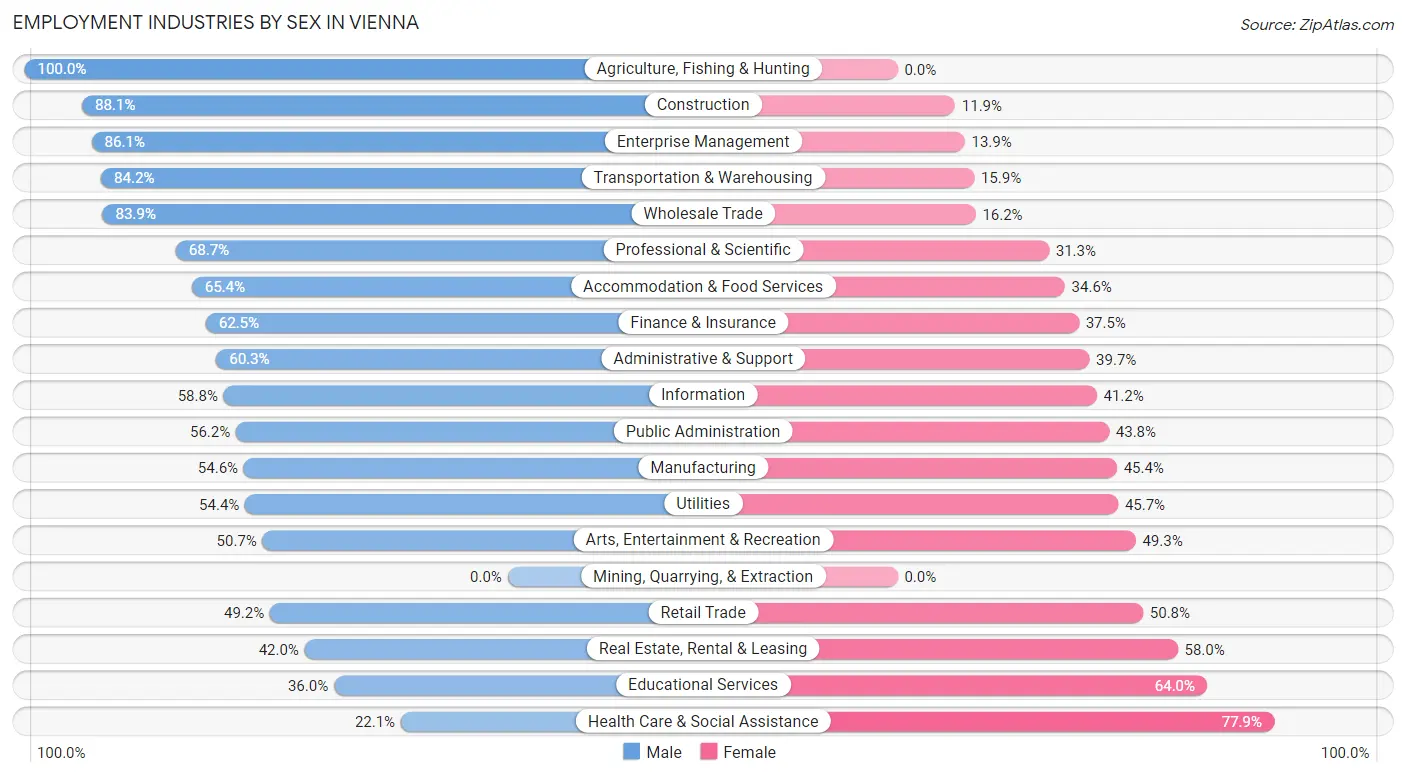
Employment Industries by Sex in Vienna
The Vienna industries that see more men than women are Agriculture, Fishing & Hunting (100.0%), Construction (88.1%), and Enterprise Management (86.1%), whereas the industries that tend to have a higher number of women are Health Care & Social Assistance (77.9%), Educational Services (64.0%), and Real Estate, Rental & Leasing (58.0%).
| Industry | Male | Female |
| Agriculture, Fishing & Hunting | 7 (100.0%) | 0 (0.0%) |
| Mining, Quarrying, & Extraction | 0 (0.0%) | 0 (0.0%) |
| Construction | 252 (88.1%) | 34 (11.9%) |
| Manufacturing | 83 (54.6%) | 69 (45.4%) |
| Wholesale Trade | 109 (83.9%) | 21 (16.2%) |
| Retail Trade | 216 (49.2%) | 223 (50.8%) |
| Transportation & Warehousing | 239 (84.2%) | 45 (15.9%) |
| Utilities | 25 (54.3%) | 21 (45.7%) |
| Information | 144 (58.8%) | 101 (41.2%) |
| Finance & Insurance | 338 (62.5%) | 203 (37.5%) |
| Real Estate, Rental & Leasing | 108 (42.0%) | 149 (58.0%) |
| Professional & Scientific | 1,488 (68.7%) | 679 (31.3%) |
| Enterprise Management | 31 (86.1%) | 5 (13.9%) |
| Administrative & Support | 117 (60.3%) | 77 (39.7%) |
| Educational Services | 301 (36.0%) | 536 (64.0%) |
| Health Care & Social Assistance | 183 (22.1%) | 645 (77.9%) |
| Arts, Entertainment & Recreation | 140 (50.7%) | 136 (49.3%) |
| Accommodation & Food Services | 187 (65.4%) | 99 (34.6%) |
| Public Administration | 482 (56.2%) | 375 (43.8%) |
| Total | 4,580 (55.5%) | 3,666 (44.5%) |
Education in Vienna
School Enrollment in Vienna
The most common levels of schooling among the 4,777 students in Vienna are middle school (1,316 | 27.6%), high school (1,073 | 22.5%), and elementary school (1,019 | 21.3%).
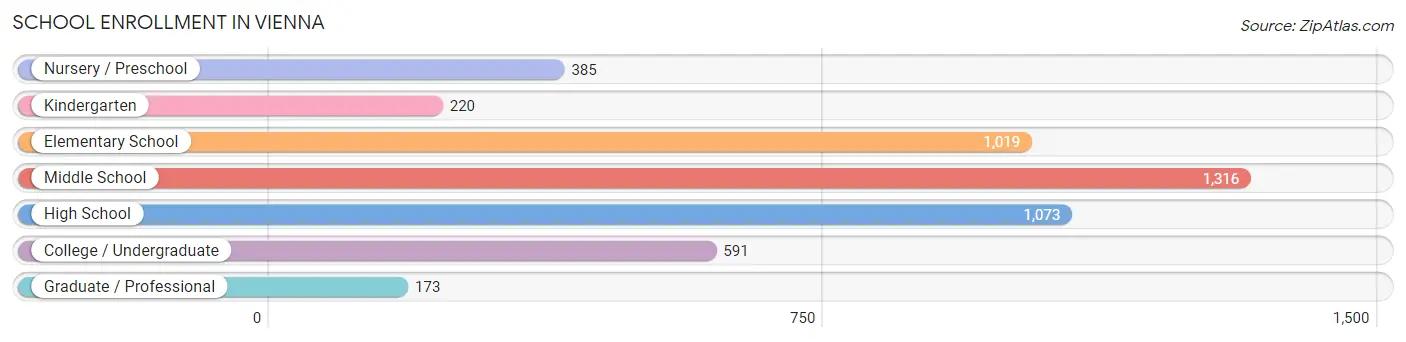
| School Level | # Students | % Students |
| Nursery / Preschool | 385 | 8.1% |
| Kindergarten | 220 | 4.6% |
| Elementary School | 1,019 | 21.3% |
| Middle School | 1,316 | 27.6% |
| High School | 1,073 | 22.5% |
| College / Undergraduate | 591 | 12.4% |
| Graduate / Professional | 173 | 3.6% |
| Total | 4,777 | 100.0% |
School Enrollment by Age by Funding Source in Vienna
Out of a total of 4,777 students who are enrolled in schools in Vienna, 1,013 (21.2%) attend a private institution, while the remaining 3,764 (78.8%) are enrolled in public schools. The age group of 3 to 4 year olds has the highest likelihood of being enrolled in private schools, with 285 (80.7% in the age bracket) enrolled. Conversely, the age group of 25 to 34 year olds has the lowest likelihood of being enrolled in a private school, with 137 (100.0% in the age bracket) attending a public institution.
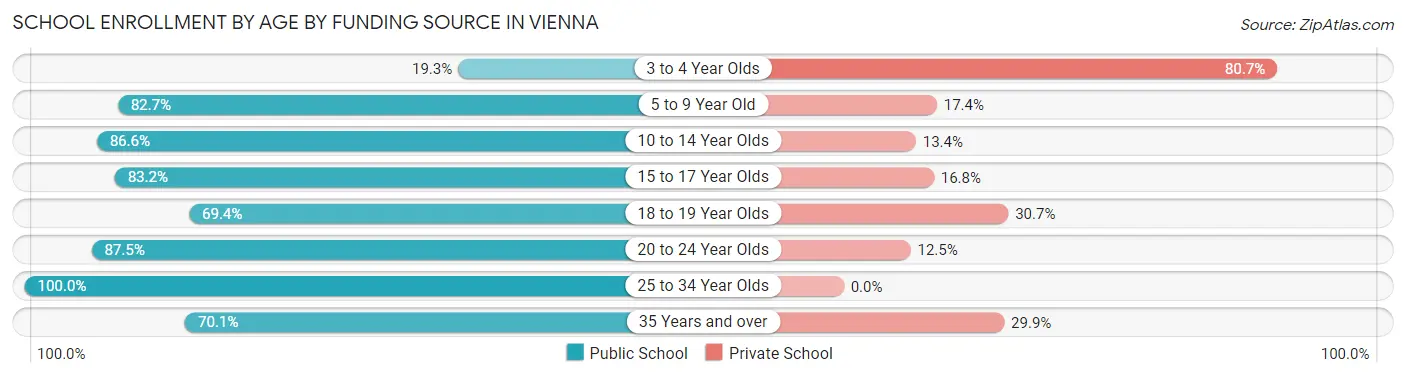
| Age Bracket | Public School | Private School |
| 3 to 4 Year Olds | 68 (19.3%) | 285 (80.7%) |
| 5 to 9 Year Old | 924 (82.7%) | 194 (17.3%) |
| 10 to 14 Year Olds | 1,372 (86.6%) | 213 (13.4%) |
| 15 to 17 Year Olds | 664 (83.2%) | 134 (16.8%) |
| 18 to 19 Year Olds | 224 (69.4%) | 99 (30.6%) |
| 20 to 24 Year Olds | 253 (87.5%) | 36 (12.5%) |
| 25 to 34 Year Olds | 137 (100.0%) | 0 (0.0%) |
| 35 Years and over | 122 (70.1%) | 52 (29.9%) |
| Total | 3,764 (78.8%) | 1,013 (21.2%) |
Educational Attainment by Field of Study in Vienna
Business (1,654 | 19.0%), social sciences (1,427 | 16.4%), engineering (949 | 10.9%), computers & mathematics (636 | 7.3%), and literature & languages (625 | 7.2%) are the most common fields of study among 8,711 individuals in Vienna who have obtained a bachelor's degree or higher.
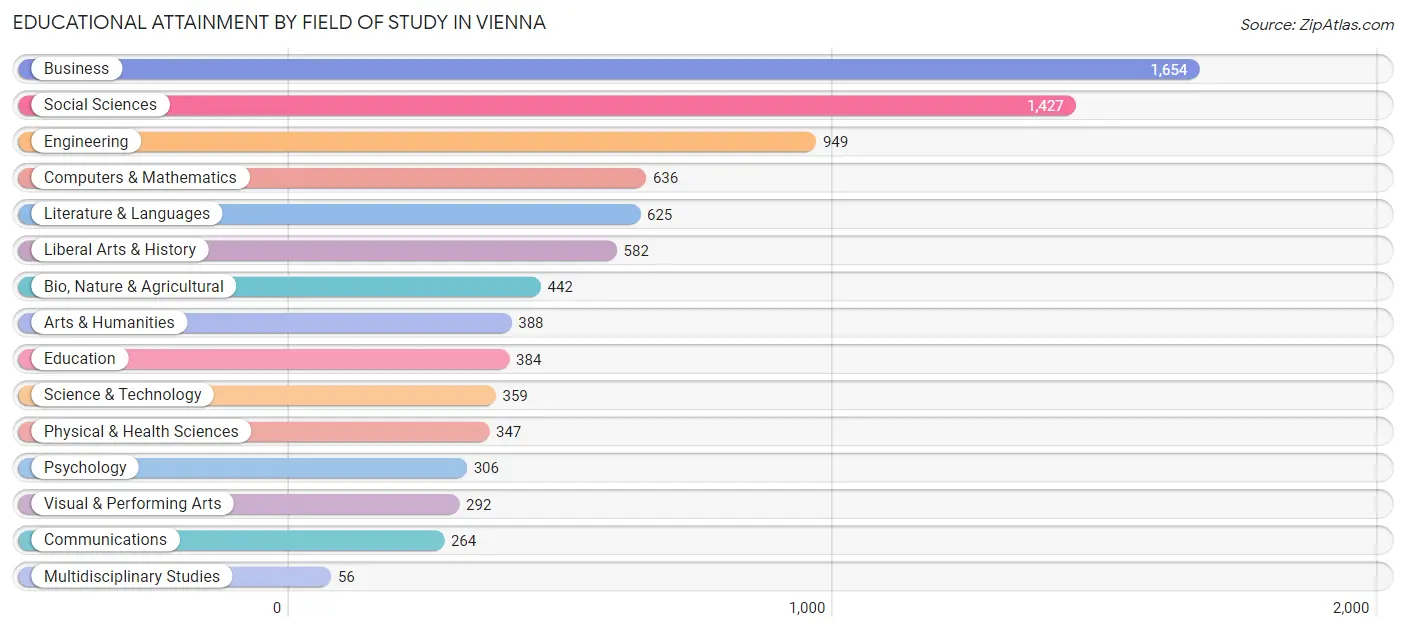
| Field of Study | # Graduates | % Graduates |
| Computers & Mathematics | 636 | 7.3% |
| Bio, Nature & Agricultural | 442 | 5.1% |
| Physical & Health Sciences | 347 | 4.0% |
| Psychology | 306 | 3.5% |
| Social Sciences | 1,427 | 16.4% |
| Engineering | 949 | 10.9% |
| Multidisciplinary Studies | 56 | 0.6% |
| Science & Technology | 359 | 4.1% |
| Business | 1,654 | 19.0% |
| Education | 384 | 4.4% |
| Literature & Languages | 625 | 7.2% |
| Liberal Arts & History | 582 | 6.7% |
| Visual & Performing Arts | 292 | 3.4% |
| Communications | 264 | 3.0% |
| Arts & Humanities | 388 | 4.4% |
| Total | 8,711 | 100.0% |
Transportation & Commute in Vienna
Vehicle Availability by Sex in Vienna
The most prevalent vehicle ownership categories in Vienna are males with 2 vehicles (2,332, accounting for 51.0%) and females with 2 vehicles (1,708, making up 63.8%).
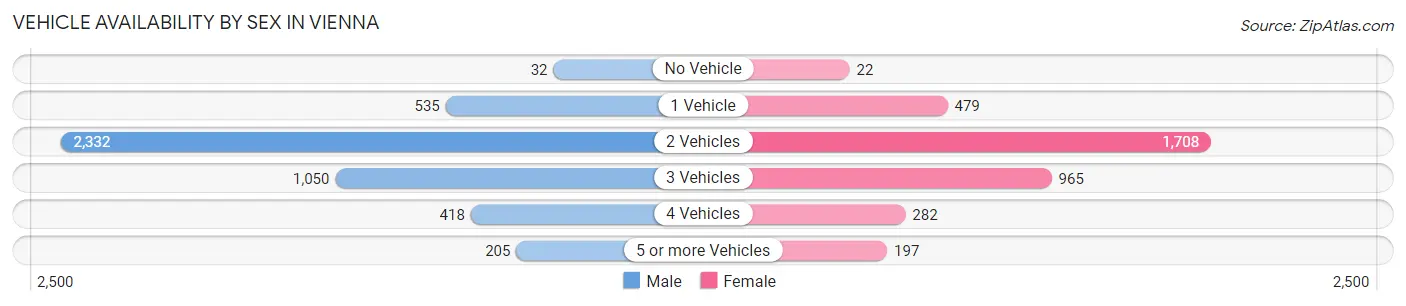
| Vehicles Available | Male | Female |
| No Vehicle | 32 (0.7%) | 22 (0.6%) |
| 1 Vehicle | 535 (11.7%) | 479 (13.1%) |
| 2 Vehicles | 2,332 (51.0%) | 1,708 (46.8%) |
| 3 Vehicles | 1,050 (23.0%) | 965 (26.4%) |
| 4 Vehicles | 418 (9.1%) | 282 (7.7%) |
| 5 or more Vehicles | 205 (4.5%) | 197 (5.4%) |
| Total | 4,572 (100.0%) | 3,653 (100.0%) |
Commute Time in Vienna
The most frequently occuring commute durations in Vienna are 15 to 19 minutes (1,073 commuters, 17.5%), 30 to 34 minutes (872 commuters, 14.2%), and 20 to 24 minutes (813 commuters, 13.3%).
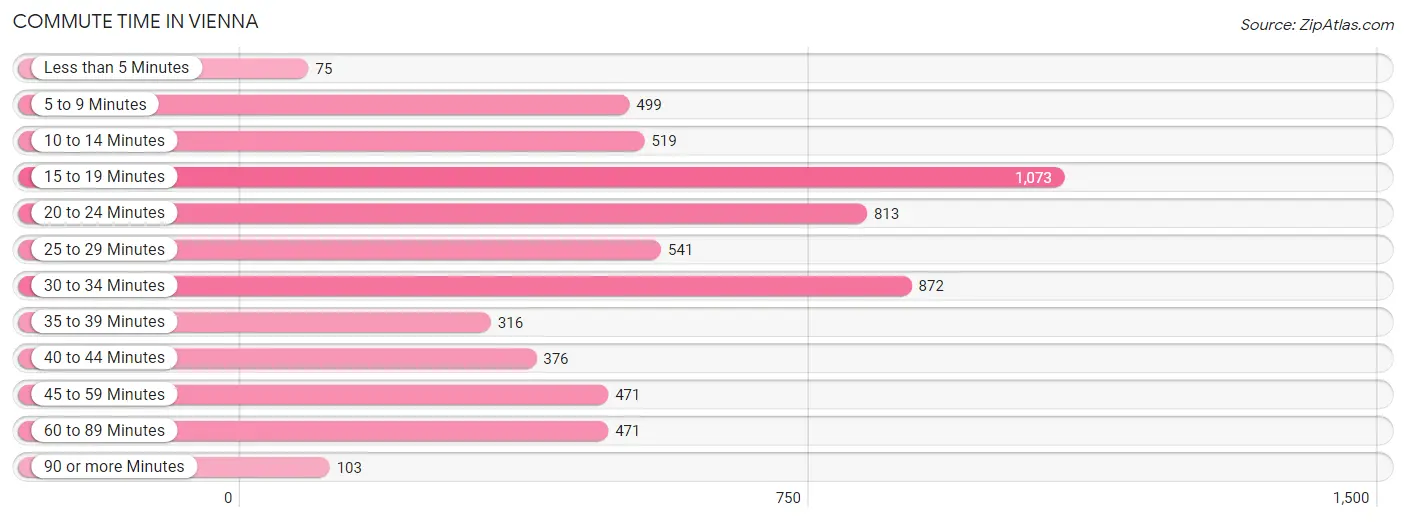
| Commute Time | # Commuters | % Commuters |
| Less than 5 Minutes | 75 | 1.2% |
| 5 to 9 Minutes | 499 | 8.1% |
| 10 to 14 Minutes | 519 | 8.5% |
| 15 to 19 Minutes | 1,073 | 17.5% |
| 20 to 24 Minutes | 813 | 13.3% |
| 25 to 29 Minutes | 541 | 8.8% |
| 30 to 34 Minutes | 872 | 14.2% |
| 35 to 39 Minutes | 316 | 5.2% |
| 40 to 44 Minutes | 376 | 6.1% |
| 45 to 59 Minutes | 471 | 7.7% |
| 60 to 89 Minutes | 471 | 7.7% |
| 90 or more Minutes | 103 | 1.7% |
Commute Time by Sex in Vienna
The most common commute times in Vienna are 30 to 34 minutes (586 commuters, 17.3%) for males and 15 to 19 minutes (583 commuters, 21.3%) for females.
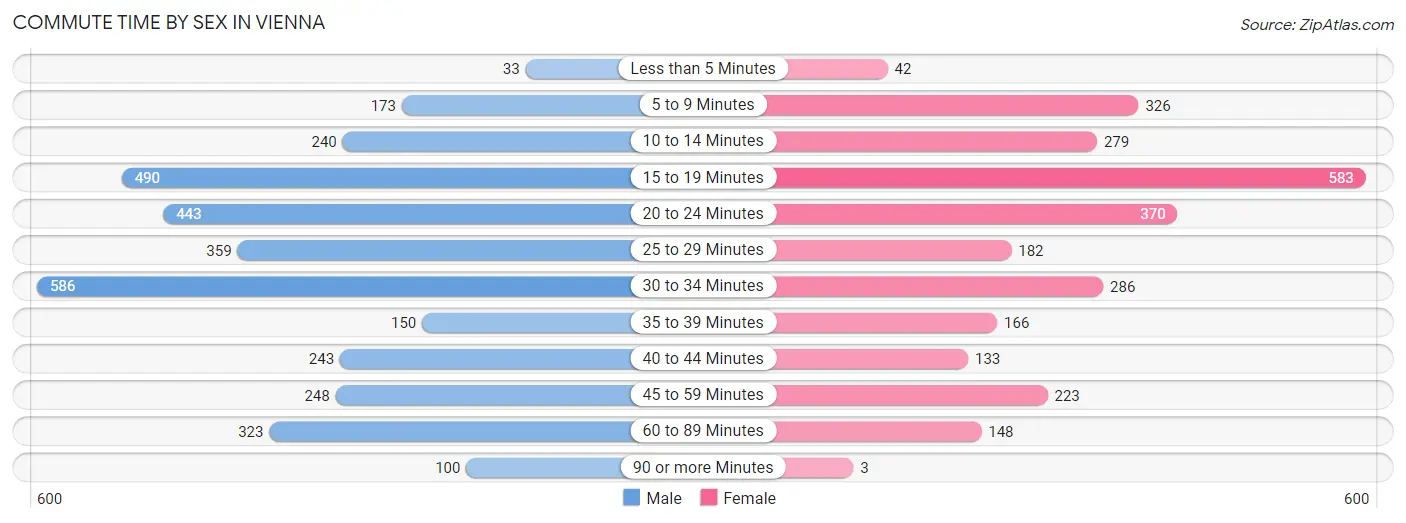
| Commute Time | Male | Female |
| Less than 5 Minutes | 33 (1.0%) | 42 (1.5%) |
| 5 to 9 Minutes | 173 (5.1%) | 326 (11.9%) |
| 10 to 14 Minutes | 240 (7.1%) | 279 (10.2%) |
| 15 to 19 Minutes | 490 (14.5%) | 583 (21.3%) |
| 20 to 24 Minutes | 443 (13.1%) | 370 (13.5%) |
| 25 to 29 Minutes | 359 (10.6%) | 182 (6.6%) |
| 30 to 34 Minutes | 586 (17.3%) | 286 (10.4%) |
| 35 to 39 Minutes | 150 (4.4%) | 166 (6.1%) |
| 40 to 44 Minutes | 243 (7.2%) | 133 (4.9%) |
| 45 to 59 Minutes | 248 (7.3%) | 223 (8.1%) |
| 60 to 89 Minutes | 323 (9.5%) | 148 (5.4%) |
| 90 or more Minutes | 100 (2.9%) | 3 (0.1%) |
Time of Departure to Work by Sex in Vienna
The most frequent times of departure to work in Vienna are 8:00 AM to 8:29 AM (835, 24.6%) for males and 8:00 AM to 8:29 AM (619, 22.6%) for females.
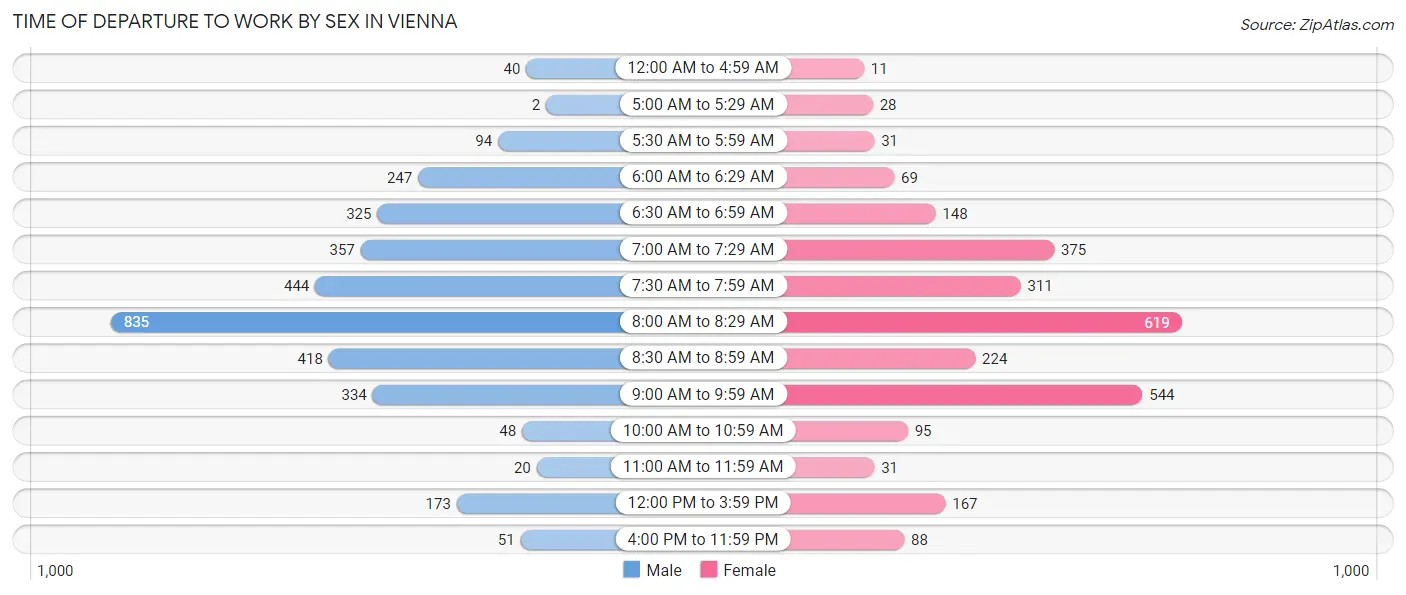
| Time of Departure | Male | Female |
| 12:00 AM to 4:59 AM | 40 (1.2%) | 11 (0.4%) |
| 5:00 AM to 5:29 AM | 2 (0.1%) | 28 (1.0%) |
| 5:30 AM to 5:59 AM | 94 (2.8%) | 31 (1.1%) |
| 6:00 AM to 6:29 AM | 247 (7.3%) | 69 (2.5%) |
| 6:30 AM to 6:59 AM | 325 (9.6%) | 148 (5.4%) |
| 7:00 AM to 7:29 AM | 357 (10.5%) | 375 (13.7%) |
| 7:30 AM to 7:59 AM | 444 (13.1%) | 311 (11.4%) |
| 8:00 AM to 8:29 AM | 835 (24.6%) | 619 (22.6%) |
| 8:30 AM to 8:59 AM | 418 (12.3%) | 224 (8.2%) |
| 9:00 AM to 9:59 AM | 334 (9.9%) | 544 (19.9%) |
| 10:00 AM to 10:59 AM | 48 (1.4%) | 95 (3.5%) |
| 11:00 AM to 11:59 AM | 20 (0.6%) | 31 (1.1%) |
| 12:00 PM to 3:59 PM | 173 (5.1%) | 167 (6.1%) |
| 4:00 PM to 11:59 PM | 51 (1.5%) | 88 (3.2%) |
| Total | 3,388 (100.0%) | 2,741 (100.0%) |
Housing Occupancy in Vienna
Occupancy by Ownership in Vienna
Of the total 5,418 dwellings in Vienna, owner-occupied units account for 4,604 (85.0%), while renter-occupied units make up 814 (15.0%).
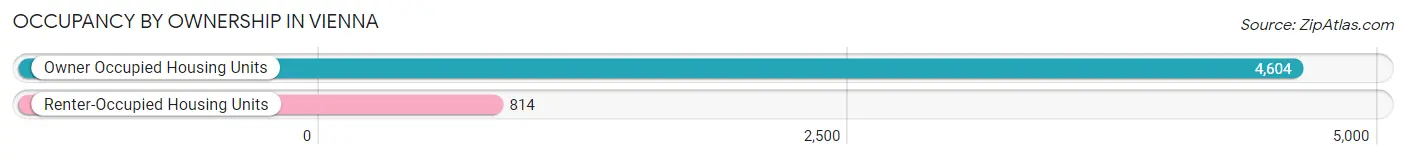
| Occupancy | # Housing Units | % Housing Units |
| Owner Occupied Housing Units | 4,604 | 85.0% |
| Renter-Occupied Housing Units | 814 | 15.0% |
| Total Occupied Housing Units | 5,418 | 100.0% |
Occupancy by Household Size in Vienna
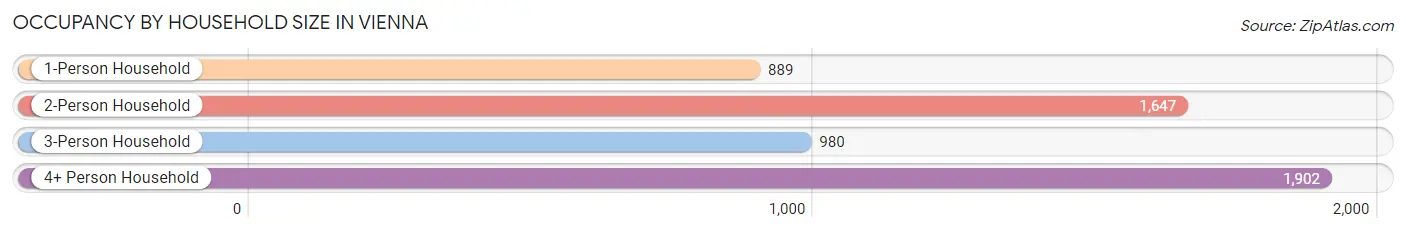
| Household Size | # Housing Units | % Housing Units |
| 1-Person Household | 889 | 16.4% |
| 2-Person Household | 1,647 | 30.4% |
| 3-Person Household | 980 | 18.1% |
| 4+ Person Household | 1,902 | 35.1% |
| Total Housing Units | 5,418 | 100.0% |
Occupancy by Ownership by Household Size in Vienna
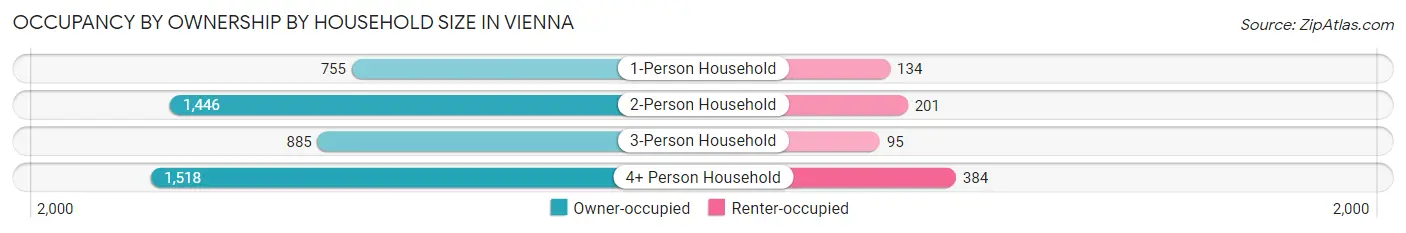
| Household Size | Owner-occupied | Renter-occupied |
| 1-Person Household | 755 (84.9%) | 134 (15.1%) |
| 2-Person Household | 1,446 (87.8%) | 201 (12.2%) |
| 3-Person Household | 885 (90.3%) | 95 (9.7%) |
| 4+ Person Household | 1,518 (79.8%) | 384 (20.2%) |
| Total Housing Units | 4,604 (85.0%) | 814 (15.0%) |
Occupancy by Educational Attainment in Vienna
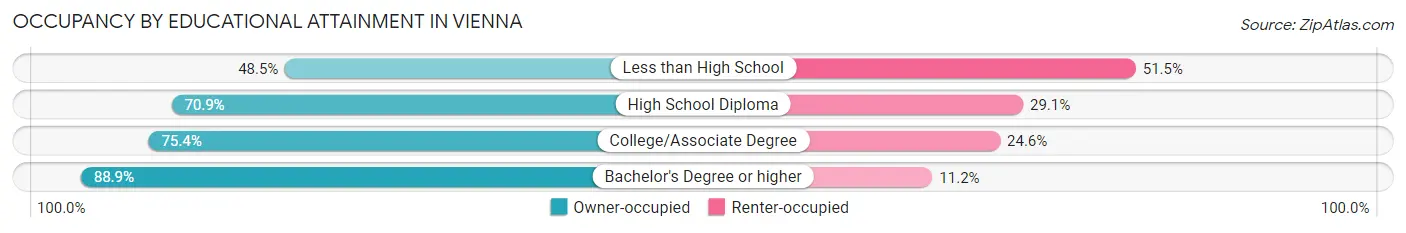
| Household Size | Owner-occupied | Renter-occupied |
| Less than High School | 66 (48.5%) | 70 (51.5%) |
| High School Diploma | 331 (70.9%) | 136 (29.1%) |
| College/Associate Degree | 399 (75.4%) | 130 (24.6%) |
| Bachelor's Degree or higher | 3,808 (88.8%) | 478 (11.2%) |
Occupancy by Age of Householder in Vienna
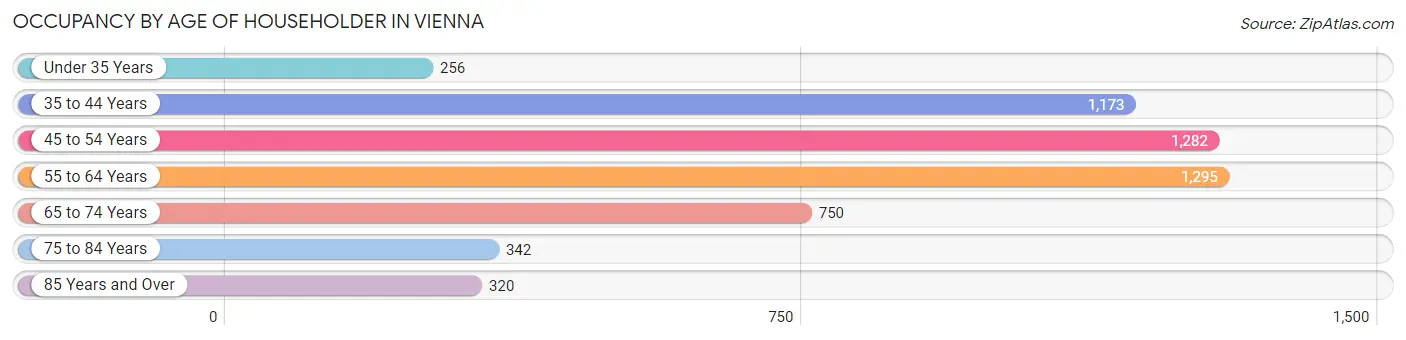
| Age Bracket | # Households | % Households |
| Under 35 Years | 256 | 4.7% |
| 35 to 44 Years | 1,173 | 21.6% |
| 45 to 54 Years | 1,282 | 23.7% |
| 55 to 64 Years | 1,295 | 23.9% |
| 65 to 74 Years | 750 | 13.8% |
| 75 to 84 Years | 342 | 6.3% |
| 85 Years and Over | 320 | 5.9% |
| Total | 5,418 | 100.0% |
Housing Finances in Vienna
Median Income by Occupancy in Vienna
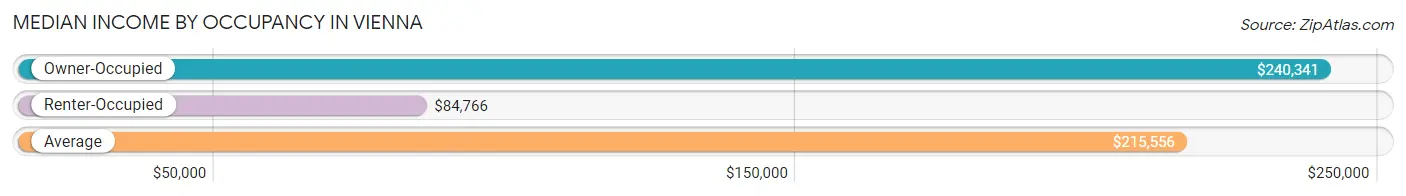
| Occupancy Type | # Households | Median Income |
| Owner-Occupied | 4,604 (85.0%) | $240,341 |
| Renter-Occupied | 814 (15.0%) | $84,766 |
| Average | 5,418 (100.0%) | $215,556 |
Occupancy by Householder Income Bracket in Vienna
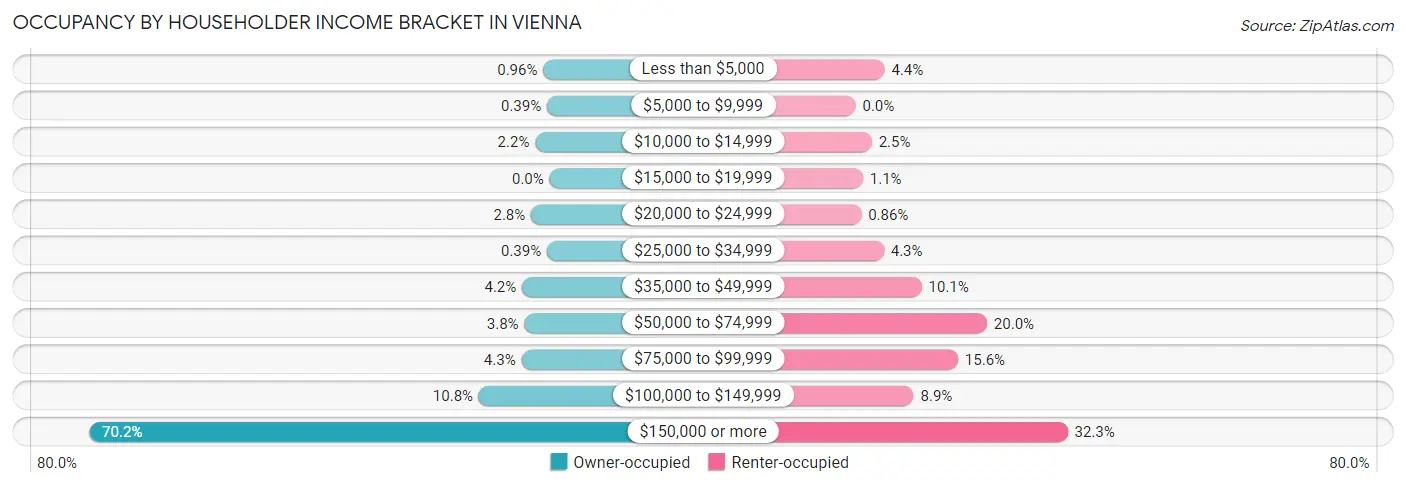
| Income Bracket | Owner-occupied | Renter-occupied |
| Less than $5,000 | 44 (1.0%) | 36 (4.4%) |
| $5,000 to $9,999 | 18 (0.4%) | 0 (0.0%) |
| $10,000 to $14,999 | 101 (2.2%) | 20 (2.5%) |
| $15,000 to $19,999 | 0 (0.0%) | 9 (1.1%) |
| $20,000 to $24,999 | 130 (2.8%) | 7 (0.9%) |
| $25,000 to $34,999 | 18 (0.4%) | 35 (4.3%) |
| $35,000 to $49,999 | 193 (4.2%) | 82 (10.1%) |
| $50,000 to $74,999 | 177 (3.8%) | 163 (20.0%) |
| $75,000 to $99,999 | 197 (4.3%) | 127 (15.6%) |
| $100,000 to $149,999 | 496 (10.8%) | 72 (8.8%) |
| $150,000 or more | 3,230 (70.2%) | 263 (32.3%) |
| Total | 4,604 (100.0%) | 814 (100.0%) |
Monthly Housing Cost Tiers in Vienna
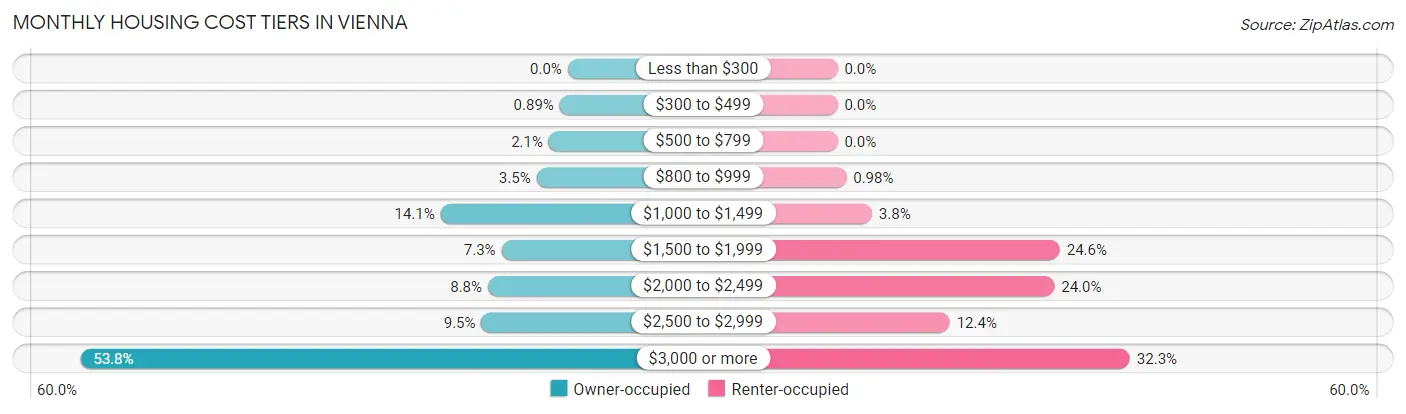
| Monthly Cost | Owner-occupied | Renter-occupied |
| Less than $300 | 0 (0.0%) | 0 (0.0%) |
| $300 to $499 | 41 (0.9%) | 0 (0.0%) |
| $500 to $799 | 96 (2.1%) | 0 (0.0%) |
| $800 to $999 | 159 (3.5%) | 8 (1.0%) |
| $1,000 to $1,499 | 647 (14.1%) | 31 (3.8%) |
| $1,500 to $1,999 | 337 (7.3%) | 200 (24.6%) |
| $2,000 to $2,499 | 406 (8.8%) | 195 (24.0%) |
| $2,500 to $2,999 | 439 (9.5%) | 101 (12.4%) |
| $3,000 or more | 2,479 (53.8%) | 263 (32.3%) |
| Total | 4,604 (100.0%) | 814 (100.0%) |
Physical Housing Characteristics in Vienna
Housing Structures in Vienna
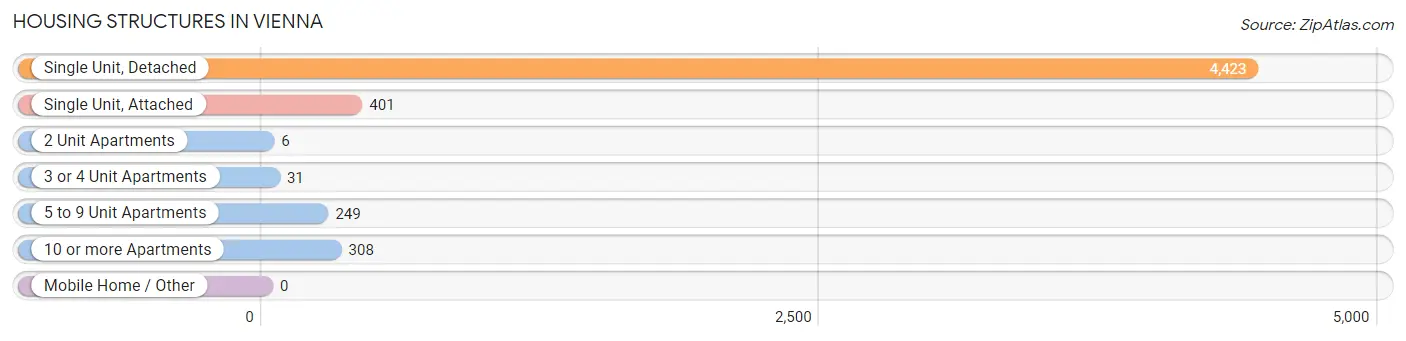
| Structure Type | # Housing Units | % Housing Units |
| Single Unit, Detached | 4,423 | 81.6% |
| Single Unit, Attached | 401 | 7.4% |
| 2 Unit Apartments | 6 | 0.1% |
| 3 or 4 Unit Apartments | 31 | 0.6% |
| 5 to 9 Unit Apartments | 249 | 4.6% |
| 10 or more Apartments | 308 | 5.7% |
| Mobile Home / Other | 0 | 0.0% |
| Total | 5,418 | 100.0% |
Housing Structures by Occupancy in Vienna
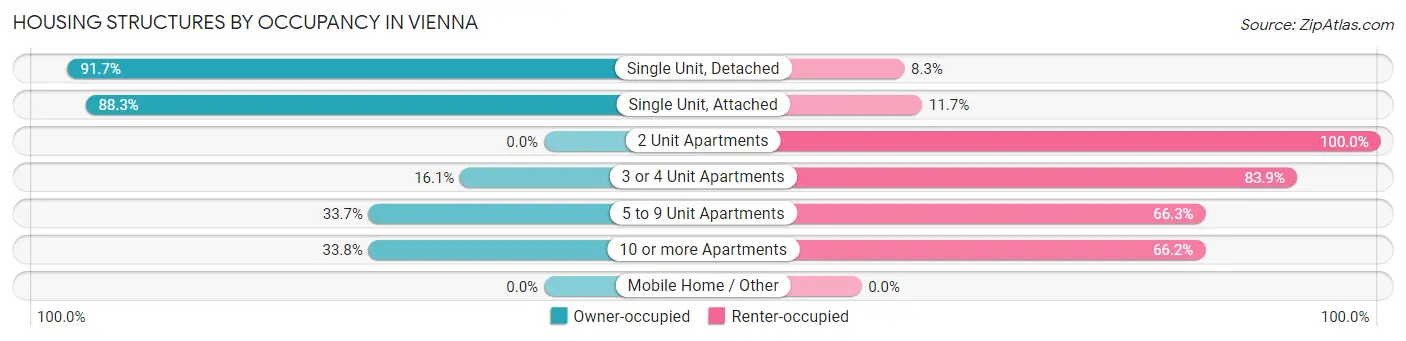
| Structure Type | Owner-occupied | Renter-occupied |
| Single Unit, Detached | 4,057 (91.7%) | 366 (8.3%) |
| Single Unit, Attached | 354 (88.3%) | 47 (11.7%) |
| 2 Unit Apartments | 0 (0.0%) | 6 (100.0%) |
| 3 or 4 Unit Apartments | 5 (16.1%) | 26 (83.9%) |
| 5 to 9 Unit Apartments | 84 (33.7%) | 165 (66.3%) |
| 10 or more Apartments | 104 (33.8%) | 204 (66.2%) |
| Mobile Home / Other | 0 (0.0%) | 0 (0.0%) |
| Total | 4,604 (85.0%) | 814 (15.0%) |
Housing Structures by Number of Rooms in Vienna
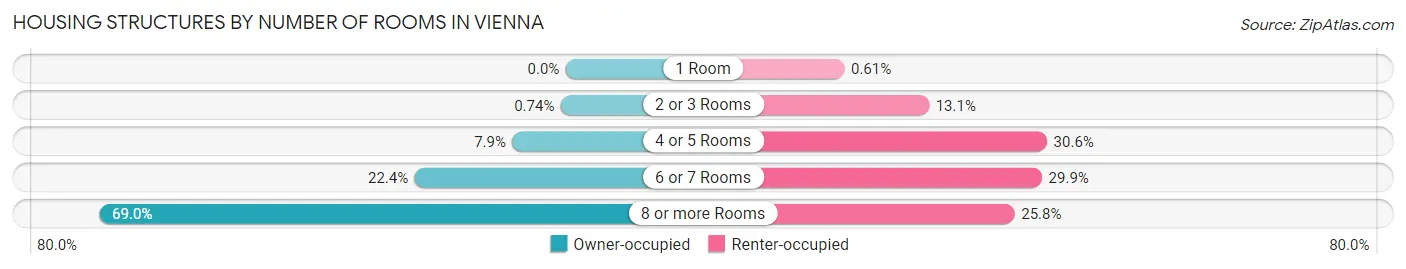
| Number of Rooms | Owner-occupied | Renter-occupied |
| 1 Room | 0 (0.0%) | 5 (0.6%) |
| 2 or 3 Rooms | 34 (0.7%) | 107 (13.1%) |
| 4 or 5 Rooms | 364 (7.9%) | 249 (30.6%) |
| 6 or 7 Rooms | 1,030 (22.4%) | 243 (29.8%) |
| 8 or more Rooms | 3,176 (69.0%) | 210 (25.8%) |
| Total | 4,604 (100.0%) | 814 (100.0%) |
Housing Structure by Heating Type in Vienna
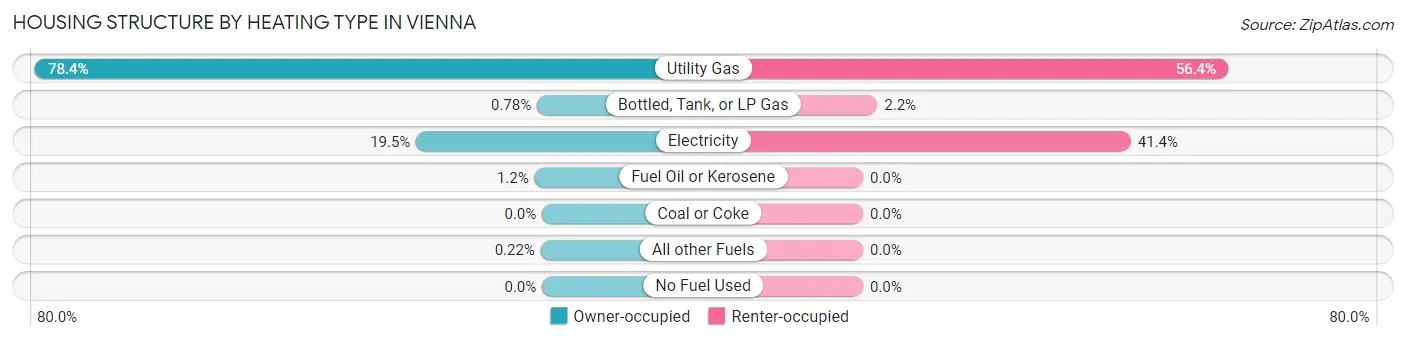
| Heating Type | Owner-occupied | Renter-occupied |
| Utility Gas | 3,608 (78.4%) | 459 (56.4%) |
| Bottled, Tank, or LP Gas | 36 (0.8%) | 18 (2.2%) |
| Electricity | 896 (19.5%) | 337 (41.4%) |
| Fuel Oil or Kerosene | 54 (1.2%) | 0 (0.0%) |
| Coal or Coke | 0 (0.0%) | 0 (0.0%) |
| All other Fuels | 10 (0.2%) | 0 (0.0%) |
| No Fuel Used | 0 (0.0%) | 0 (0.0%) |
| Total | 4,604 (100.0%) | 814 (100.0%) |
Household Vehicle Usage in Vienna
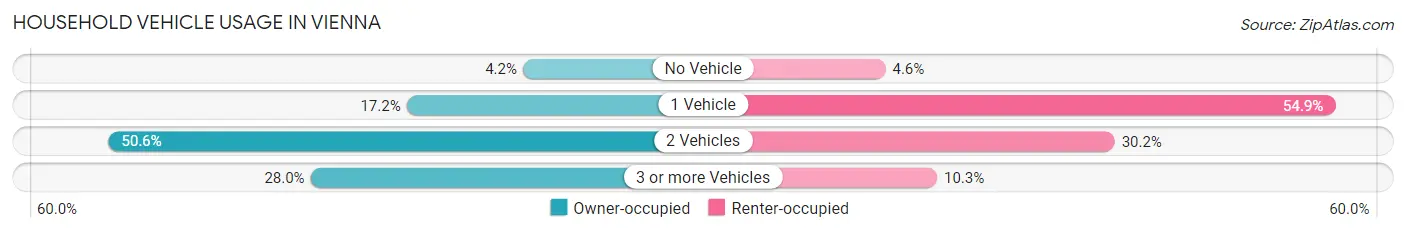
| Vehicles per Household | Owner-occupied | Renter-occupied |
| No Vehicle | 193 (4.2%) | 37 (4.5%) |
| 1 Vehicle | 793 (17.2%) | 447 (54.9%) |
| 2 Vehicles | 2,330 (50.6%) | 246 (30.2%) |
| 3 or more Vehicles | 1,288 (28.0%) | 84 (10.3%) |
| Total | 4,604 (100.0%) | 814 (100.0%) |
Real Estate & Mortgages in Vienna
Real Estate and Mortgage Overview in Vienna
| Characteristic | Without Mortgage | With Mortgage |
| Housing Units | 1,271 | 3,333 |
| Median Property Value | $871,200 | $925,500 |
| Median Household Income | $142,614 | $2,619 |
| Monthly Housing Costs | $1,195 | $2,454 |
| Real Estate Taxes | $9,947 | $41 |
Property Value by Mortgage Status in Vienna
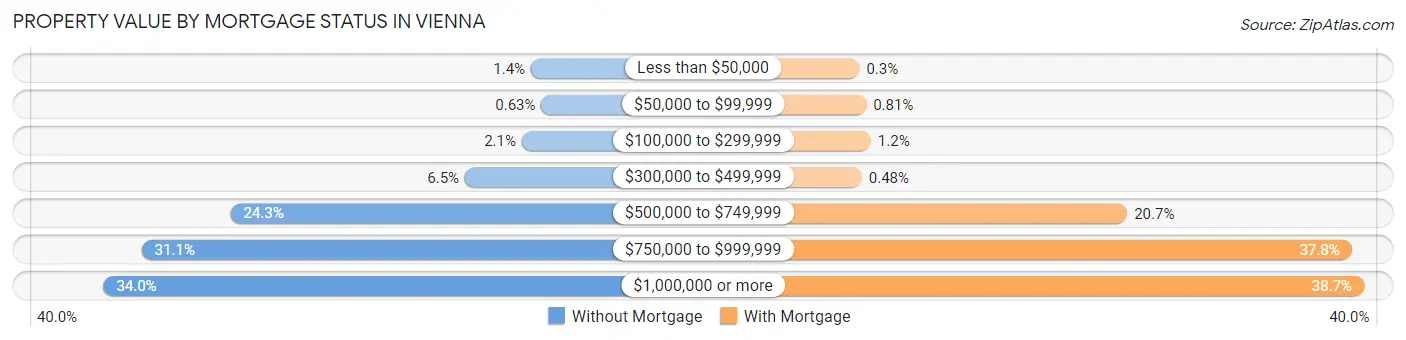
| Property Value | Without Mortgage | With Mortgage |
| Less than $50,000 | 18 (1.4%) | 10 (0.3%) |
| $50,000 to $99,999 | 8 (0.6%) | 27 (0.8%) |
| $100,000 to $299,999 | 27 (2.1%) | 39 (1.2%) |
| $300,000 to $499,999 | 82 (6.5%) | 16 (0.5%) |
| $500,000 to $749,999 | 309 (24.3%) | 690 (20.7%) |
| $750,000 to $999,999 | 395 (31.1%) | 1,260 (37.8%) |
| $1,000,000 or more | 432 (34.0%) | 1,291 (38.7%) |
| Total | 1,271 (100.0%) | 3,333 (100.0%) |
Household Income by Mortgage Status in Vienna
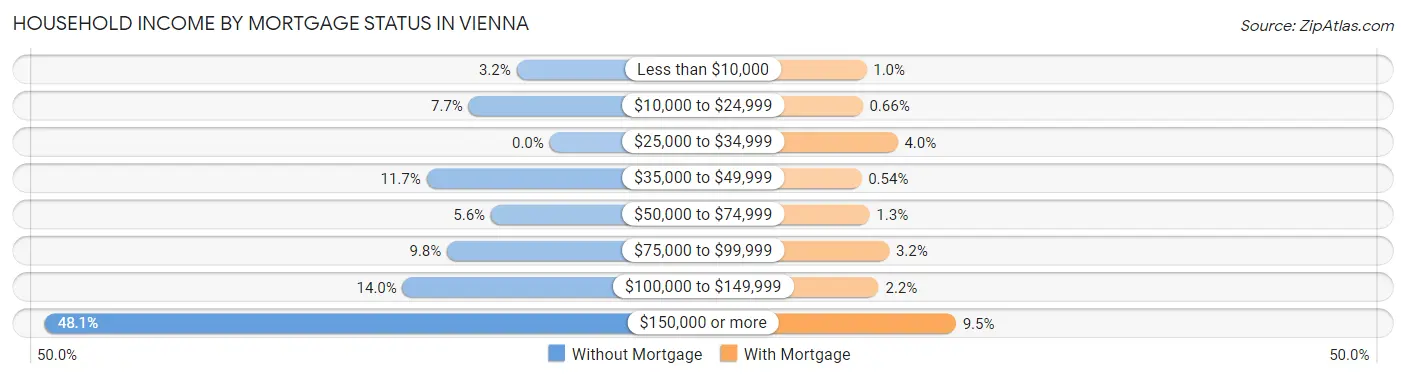
| Household Income | Without Mortgage | With Mortgage |
| Less than $10,000 | 40 (3.2%) | 34 (1.0%) |
| $10,000 to $24,999 | 98 (7.7%) | 22 (0.7%) |
| $25,000 to $34,999 | 0 (0.0%) | 133 (4.0%) |
| $35,000 to $49,999 | 149 (11.7%) | 18 (0.5%) |
| $50,000 to $74,999 | 71 (5.6%) | 44 (1.3%) |
| $75,000 to $99,999 | 124 (9.8%) | 106 (3.2%) |
| $100,000 to $149,999 | 178 (14.0%) | 73 (2.2%) |
| $150,000 or more | 611 (48.1%) | 318 (9.5%) |
| Total | 1,271 (100.0%) | 3,333 (100.0%) |
Property Value to Household Income Ratio in Vienna
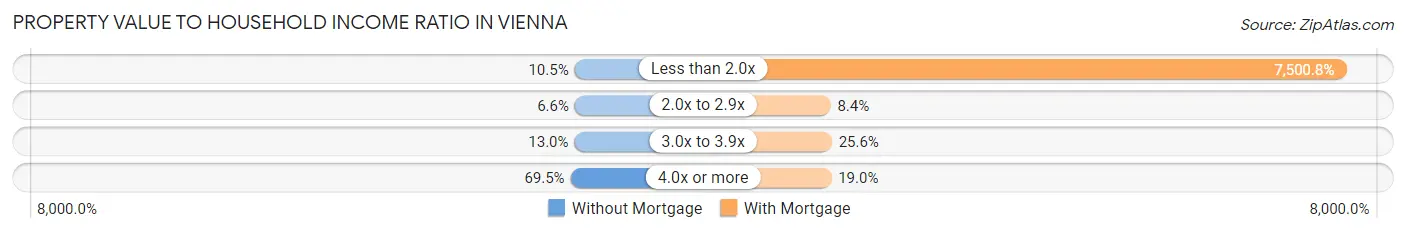
| Value-to-Income Ratio | Without Mortgage | With Mortgage |
| Less than 2.0x | 134 (10.5%) | 250,001 (7,500.8%) |
| 2.0x to 2.9x | 84 (6.6%) | 279 (8.4%) |
| 3.0x to 3.9x | 165 (13.0%) | 852 (25.6%) |
| 4.0x or more | 883 (69.5%) | 634 (19.0%) |
| Total | 1,271 (100.0%) | 3,333 (100.0%) |
Real Estate Taxes by Mortgage Status in Vienna
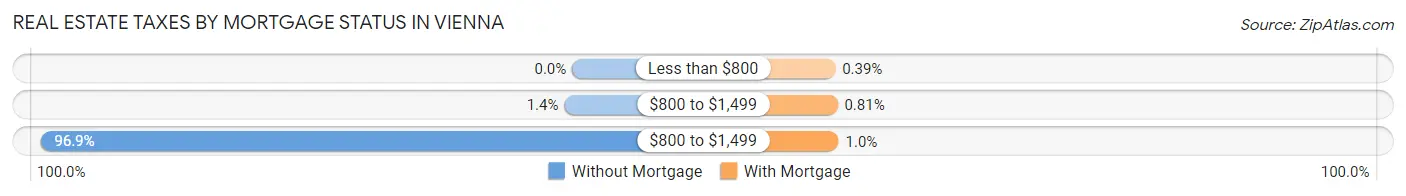
| Property Taxes | Without Mortgage | With Mortgage |
| Less than $800 | 0 (0.0%) | 13 (0.4%) |
| $800 to $1,499 | 18 (1.4%) | 27 (0.8%) |
| $800 to $1,499 | 1,232 (96.9%) | 34 (1.0%) |
| Total | 1,271 (100.0%) | 3,333 (100.0%) |
Health & Disability in Vienna
Health Insurance Coverage by Age in Vienna
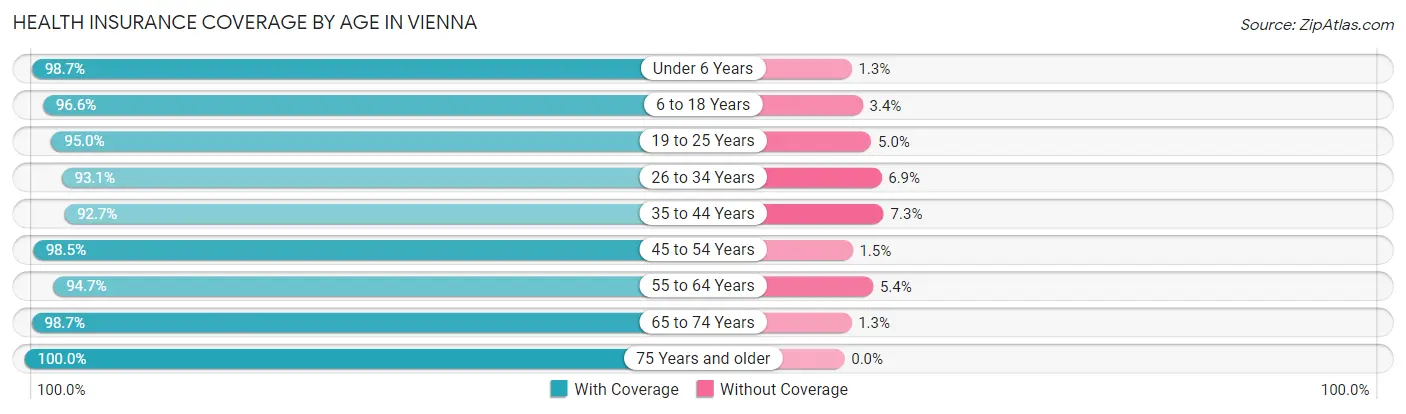
| Age Bracket | With Coverage | Without Coverage |
| Under 6 Years | 1,186 (98.7%) | 16 (1.3%) |
| 6 to 18 Years | 3,443 (96.6%) | 122 (3.4%) |
| 19 to 25 Years | 818 (95.0%) | 43 (5.0%) |
| 26 to 34 Years | 891 (93.1%) | 66 (6.9%) |
| 35 to 44 Years | 2,322 (92.7%) | 184 (7.3%) |
| 45 to 54 Years | 2,339 (98.5%) | 36 (1.5%) |
| 55 to 64 Years | 2,355 (94.7%) | 133 (5.3%) |
| 65 to 74 Years | 1,305 (98.7%) | 17 (1.3%) |
| 75 Years and older | 1,070 (100.0%) | 0 (0.0%) |
| Total | 15,729 (96.2%) | 617 (3.8%) |
Health Insurance Coverage by Citizenship Status in Vienna
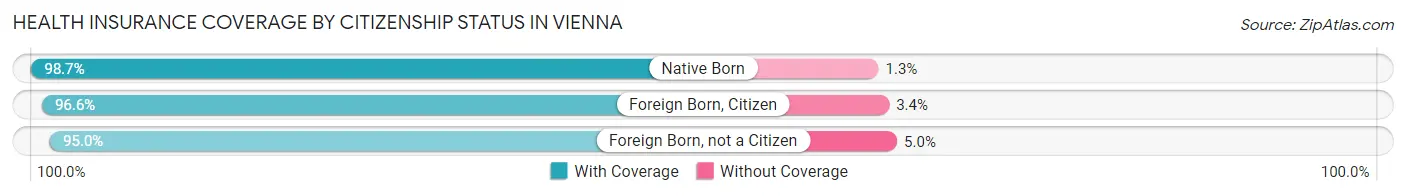
| Citizenship Status | With Coverage | Without Coverage |
| Native Born | 1,186 (98.7%) | 16 (1.3%) |
| Foreign Born, Citizen | 3,443 (96.6%) | 122 (3.4%) |
| Foreign Born, not a Citizen | 818 (95.0%) | 43 (5.0%) |
Health Insurance Coverage by Household Income in Vienna
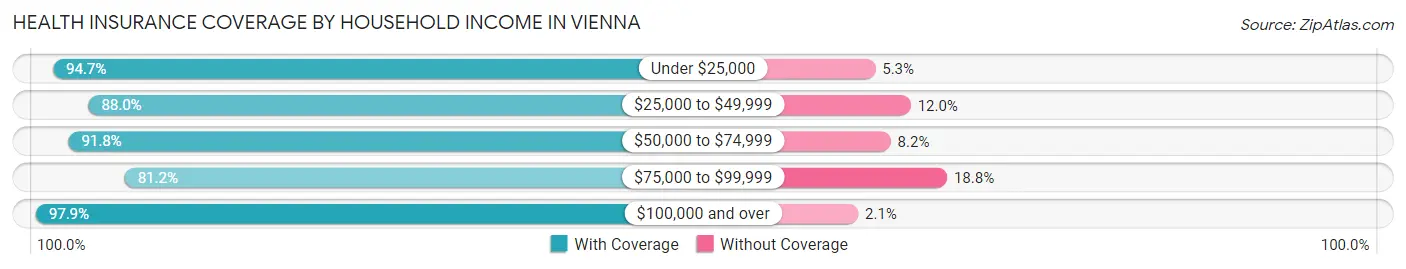
| Household Income | With Coverage | Without Coverage |
| Under $25,000 | 550 (94.7%) | 31 (5.3%) |
| $25,000 to $49,999 | 603 (88.0%) | 82 (12.0%) |
| $50,000 to $74,999 | 915 (91.8%) | 82 (8.2%) |
| $75,000 to $99,999 | 593 (81.2%) | 137 (18.8%) |
| $100,000 and over | 13,059 (97.9%) | 283 (2.1%) |
Public vs Private Health Insurance Coverage by Age in Vienna
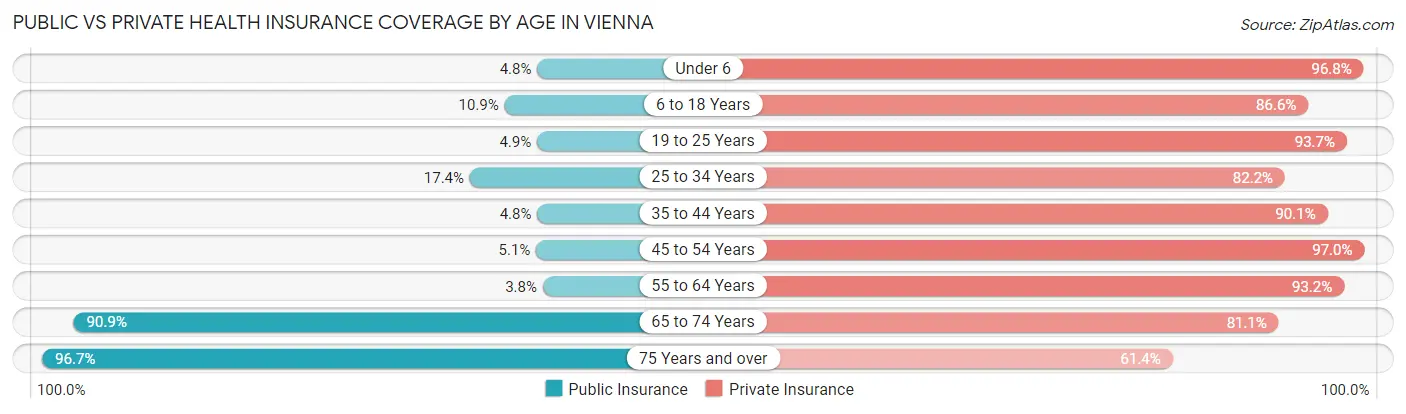
| Age Bracket | Public Insurance | Private Insurance |
| Under 6 | 58 (4.8%) | 1,164 (96.8%) |
| 6 to 18 Years | 389 (10.9%) | 3,086 (86.6%) |
| 19 to 25 Years | 42 (4.9%) | 807 (93.7%) |
| 25 to 34 Years | 166 (17.3%) | 787 (82.2%) |
| 35 to 44 Years | 121 (4.8%) | 2,259 (90.1%) |
| 45 to 54 Years | 120 (5.1%) | 2,303 (97.0%) |
| 55 to 64 Years | 95 (3.8%) | 2,319 (93.2%) |
| 65 to 74 Years | 1,202 (90.9%) | 1,072 (81.1%) |
| 75 Years and over | 1,035 (96.7%) | 657 (61.4%) |
| Total | 3,228 (19.8%) | 14,454 (88.4%) |
Disability Status by Sex by Age in Vienna
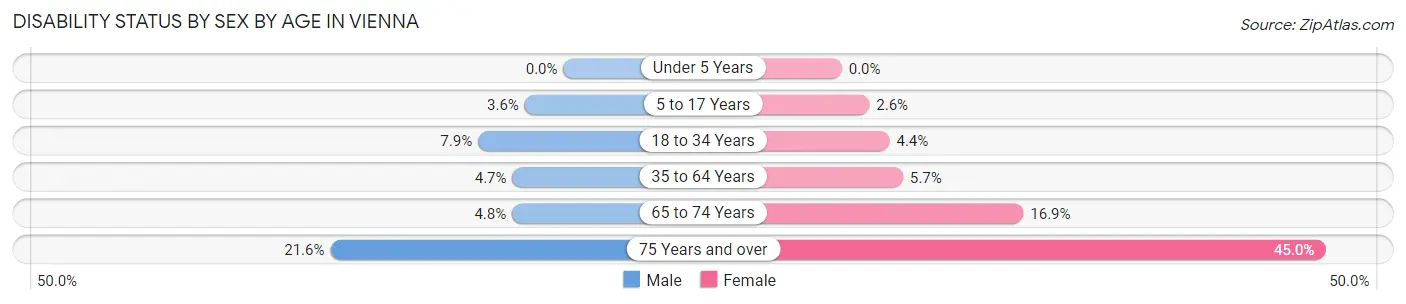
| Age Bracket | Male | Female |
| Under 5 Years | 0 (0.0%) | 0 (0.0%) |
| 5 to 17 Years | 59 (3.6%) | 49 (2.6%) |
| 18 to 34 Years | 76 (7.9%) | 45 (4.4%) |
| 35 to 64 Years | 176 (4.7%) | 207 (5.7%) |
| 65 to 74 Years | 33 (4.8%) | 106 (16.9%) |
| 75 Years and over | 90 (21.6%) | 294 (45.0%) |
Disability Class by Sex by Age in Vienna
Disability Class: Hearing Difficulty
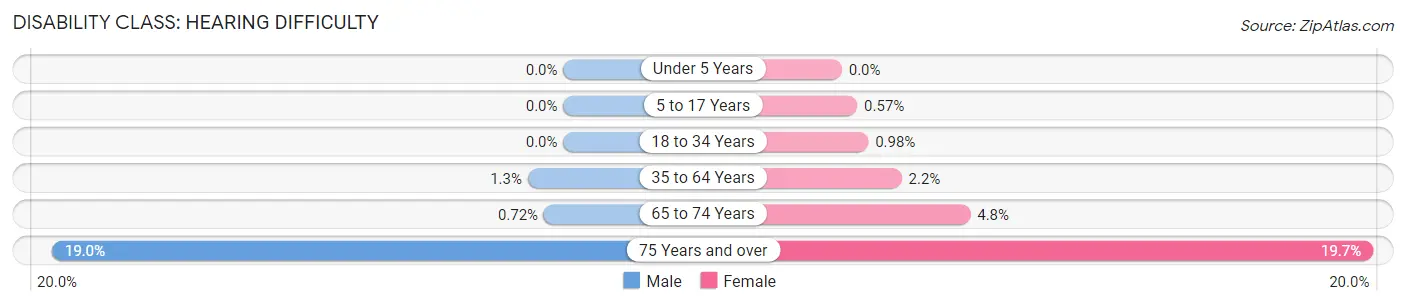
| Age Bracket | Male | Female |
| Under 5 Years | 0 (0.0%) | 0 (0.0%) |
| 5 to 17 Years | 0 (0.0%) | 11 (0.6%) |
| 18 to 34 Years | 0 (0.0%) | 10 (1.0%) |
| 35 to 64 Years | 49 (1.3%) | 81 (2.2%) |
| 65 to 74 Years | 5 (0.7%) | 30 (4.8%) |
| 75 Years and over | 79 (19.0%) | 129 (19.7%) |
Disability Class: Vision Difficulty
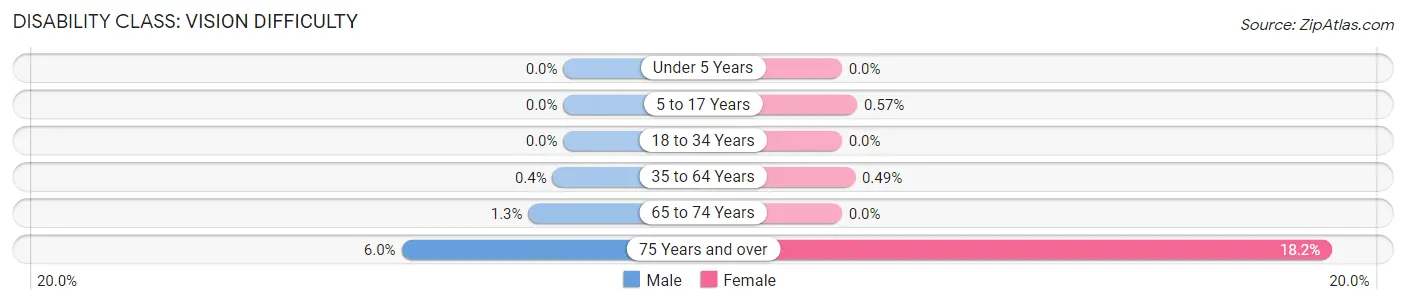
| Age Bracket | Male | Female |
| Under 5 Years | 0 (0.0%) | 0 (0.0%) |
| 5 to 17 Years | 0 (0.0%) | 11 (0.6%) |
| 18 to 34 Years | 0 (0.0%) | 0 (0.0%) |
| 35 to 64 Years | 15 (0.4%) | 18 (0.5%) |
| 65 to 74 Years | 9 (1.3%) | 0 (0.0%) |
| 75 Years and over | 25 (6.0%) | 119 (18.2%) |
Disability Class: Cognitive Difficulty
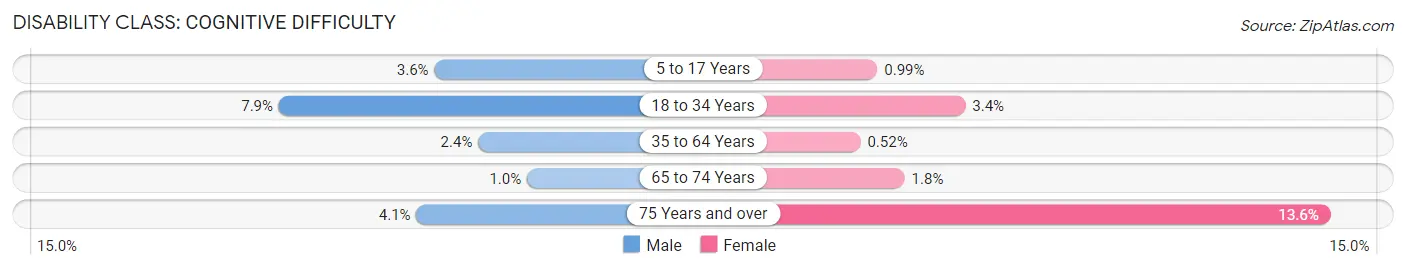
| Age Bracket | Male | Female |
| 5 to 17 Years | 59 (3.6%) | 19 (1.0%) |
| 18 to 34 Years | 76 (7.9%) | 35 (3.4%) |
| 35 to 64 Years | 88 (2.4%) | 19 (0.5%) |
| 65 to 74 Years | 7 (1.0%) | 11 (1.8%) |
| 75 Years and over | 17 (4.1%) | 89 (13.6%) |
Disability Class: Ambulatory Difficulty
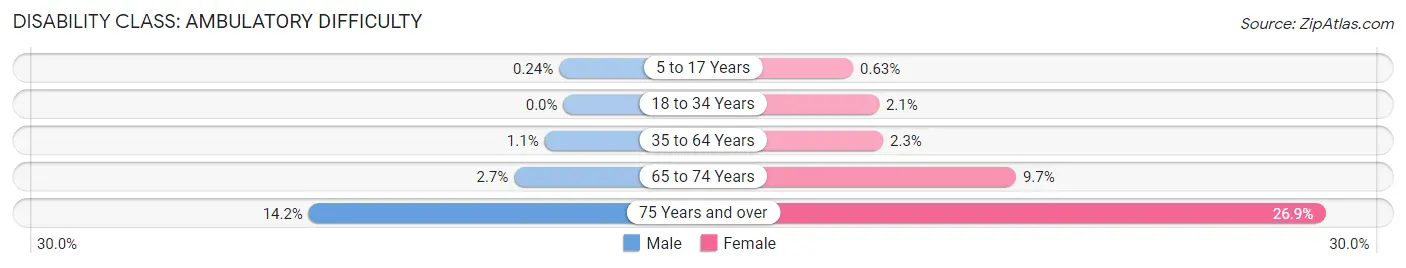
| Age Bracket | Male | Female |
| 5 to 17 Years | 4 (0.2%) | 12 (0.6%) |
| 18 to 34 Years | 0 (0.0%) | 21 (2.1%) |
| 35 to 64 Years | 39 (1.1%) | 84 (2.3%) |
| 65 to 74 Years | 19 (2.7%) | 61 (9.7%) |
| 75 Years and over | 59 (14.2%) | 176 (26.9%) |
Disability Class: Self-Care Difficulty
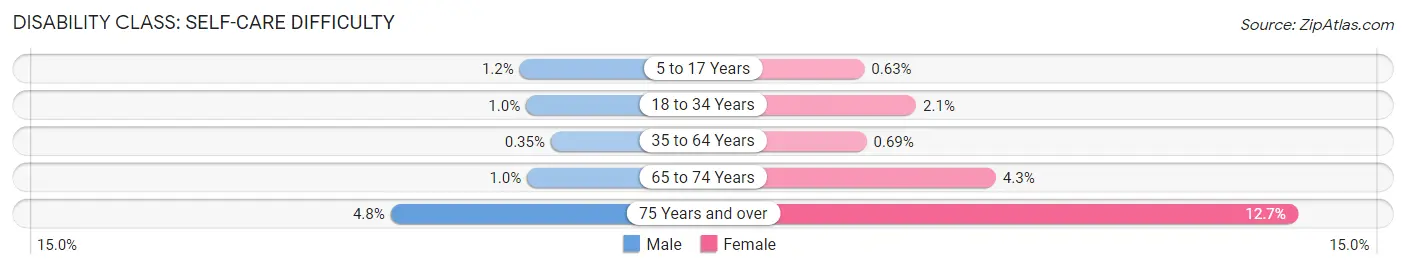
| Age Bracket | Male | Female |
| 5 to 17 Years | 20 (1.2%) | 12 (0.6%) |
| 18 to 34 Years | 10 (1.0%) | 21 (2.1%) |
| 35 to 64 Years | 13 (0.4%) | 25 (0.7%) |
| 65 to 74 Years | 7 (1.0%) | 27 (4.3%) |
| 75 Years and over | 20 (4.8%) | 83 (12.7%) |
Technology Access in Vienna
Computing Device Access in Vienna
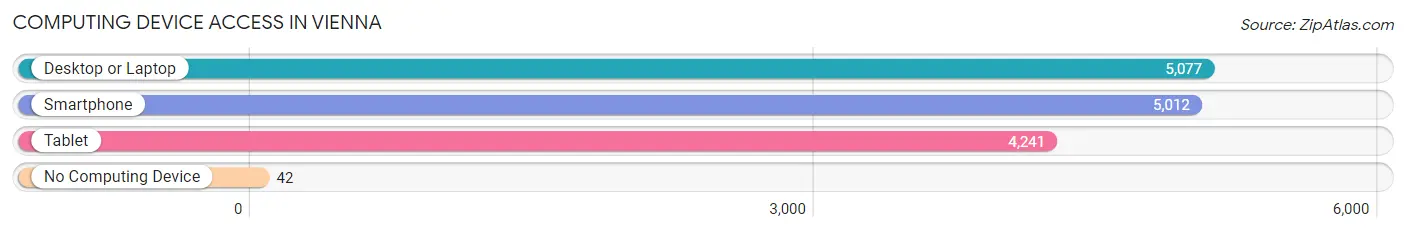
| Device Type | # Households | % Households |
| Desktop or Laptop | 5,077 | 93.7% |
| Smartphone | 5,012 | 92.5% |
| Tablet | 4,241 | 78.3% |
| No Computing Device | 42 | 0.8% |
| Total | 5,418 | 100.0% |
Internet Access in Vienna
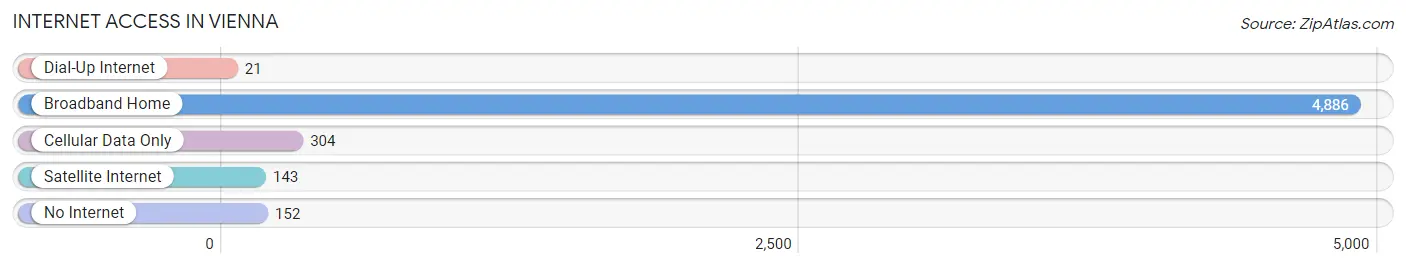
| Internet Type | # Households | % Households |
| Dial-Up Internet | 21 | 0.4% |
| Broadband Home | 4,886 | 90.2% |
| Cellular Data Only | 304 | 5.6% |
| Satellite Internet | 143 | 2.6% |
| No Internet | 152 | 2.8% |
| Total | 5,418 | 100.0% |
Vienna Summary
Vienna, Virginia is a town located in Fairfax County, Virginia, United States. It is a suburb of Washington, D.C., and is part of the Washington metropolitan area. The population was 15,687 at the 2010 census.
History
The area that is now Vienna was first settled in 1767. The town was named after Vienna, Austria, which was the hometown of the first postmaster, William Estelle. The town was incorporated in 1890.
In the late 19th century, Vienna was a popular summer resort for Washingtonians. The town was known for its mineral springs, which were believed to have healing properties. The town also had a number of hotels and boarding houses.
In the early 20th century, Vienna began to grow as a residential community. The town was connected to Washington, D.C. by the Washington and Old Dominion Railroad in 1904. The railroad was later replaced by the Washington Metro in the 1970s.
Geography
Vienna is located in northern Fairfax County, Virginia, at 38°54′N 77°16′W (38.9000, -77.2667). It is bordered to the north by the town of Oakton, to the east by the city of Fairfax, to the south by the town of Dunn Loring, and to the west by the town of Wolf Trap.
The town is located in the Piedmont region of Virginia, and is situated on the banks of Difficult Run, a tributary of the Potomac River. The town is located at an elevation of about 200 feet (61 m).
Economy
Vienna is a major commercial and residential center in the Washington metropolitan area. The town is home to a number of corporate headquarters, including Northrop Grumman, Booz Allen Hamilton, and SAIC.
The town is also home to a number of retail establishments, including the Tysons Corner Center, one of the largest shopping malls in the United States.
Demographics
As of the 2010 census, there were 15,687 people, 6,845 households, and 4,072 families residing in the town. The population density was 3,837.3 people per square mile (1,481.2/km2). There were 7,093 housing units at an average density of 1,764.3 per square mile (681.2/km2). The racial makeup of the town was 75.2% White, 8.3% African American, 0.3% Native American, 11.7% Asian, 0.1% Pacific Islander, 1.7% from other races, and 2.9% from two or more races. Hispanic or Latino of any race were 5.2% of the population.
The median income for a household in the town was $107,811, and the median income for a family was $128,867. Males had a median income of $90,945 versus $60,945 for females. The per capita income for the town was $50,945. About 2.7% of families and 4.2% of the population were below the poverty line, including 4.2% of those under age 18 and 4.2% of those age 65 or over.
Common Questions
What is Per Capita Income in Vienna?
Per Capita income in Vienna is $88,569.
What is the Median Family Income in Vienna?
Median Family Income in Vienna is $249,219.
What is the Median Household income in Vienna?
Median Household Income in Vienna is $215,556.
What is Income or Wage Gap in Vienna?
Income or Wage Gap in Vienna is 45.8%.
Women in Vienna earn 54.2 cents for every dollar earned by a man.
What is Inequality or Gini Index in Vienna?
Inequality or Gini Index in Vienna is 0.46.
What is the Total Population of Vienna?
Total Population of Vienna is 16,401.
What is the Total Male Population of Vienna?
Total Male Population of Vienna is 7,976.
What is the Total Female Population of Vienna?
Total Female Population of Vienna is 8,425.
What is the Ratio of Males per 100 Females in Vienna?
There are 94.67 Males per 100 Females in Vienna.
What is the Ratio of Females per 100 Males in Vienna?
There are 105.63 Females per 100 Males in Vienna.
What is the Median Population Age in Vienna?
Median Population Age in Vienna is 41.2 Years.
What is the Average Family Size in Vienna
Average Family Size in Vienna is 3.4 People.
What is the Average Household Size in Vienna
Average Household Size in Vienna is 3.0 People.
How Large is the Labor Force in Vienna?
There are 8,613 People in the Labor Forcein in Vienna.
What is the Percentage of People in the Labor Force in Vienna?
69.8% of People are in the Labor Force in Vienna.
What is the Unemployment Rate in Vienna?
Unemployment Rate in Vienna is 3.6%.