Clarksville, VA Map & Demographics
Clarksville Map
Clarksville Overview
$33,111
PER CAPITA INCOME
$73,438
AVG FAMILY INCOME
$59,375
AVG HOUSEHOLD INCOME
27.8%
WAGE / INCOME GAP [ % ]
72.2¢/ $1
WAGE / INCOME GAP [ $ ]
0.45
INEQUALITY / GINI INDEX
1,629
TOTAL POPULATION
725
MALE POPULATION
904
FEMALE POPULATION
80.20
MALES / 100 FEMALES
124.69
FEMALES / 100 MALES
50.2
MEDIAN AGE
3.1
AVG FAMILY SIZE
2.1
AVG HOUSEHOLD SIZE
556
LABOR FORCE [ PEOPLE ]
44.7%
PERCENT IN LABOR FORCE
6.8%
UNEMPLOYMENT RATE
Clarksville Zip Codes
Clarksville Area Codes
Income in Clarksville
Income Overview in Clarksville
Per Capita Income in Clarksville is $33,111, while median incomes of families and households are $73,438 and $59,375 respectively.
| Characteristic | Number | Measure |
| Per Capita Income | 1,629 | $33,111 |
| Median Family Income | 379 | $73,438 |
| Mean Family Income | 379 | $87,123 |
| Median Household Income | 759 | $59,375 |
| Mean Household Income | 759 | $69,010 |
| Income Deficit | 379 | $0 |
| Wage / Income Gap (%) | 1,629 | 27.78% |
| Wage / Income Gap ($) | 1,629 | 72.22¢ per $1 |
| Gini / Inequality Index | 1,629 | 0.45 |
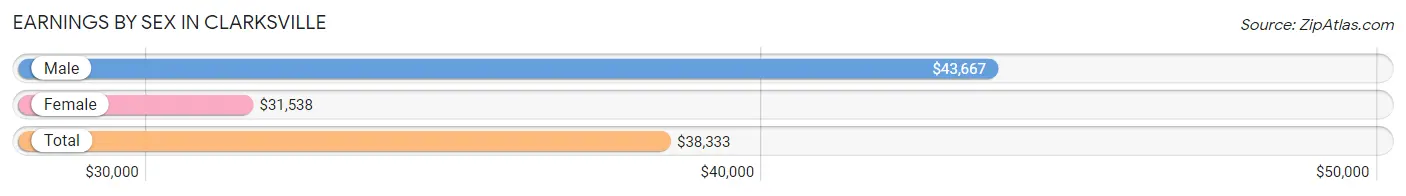
Earnings by Sex in Clarksville
Average Earnings in Clarksville are $38,333, $43,667 for men and $31,538 for women, a difference of 27.8%.
| Sex | Number | Average Earnings |
| Male | 344 (58.1%) | $43,667 |
| Female | 248 (41.9%) | $31,538 |
| Total | 592 (100.0%) | $38,333 |
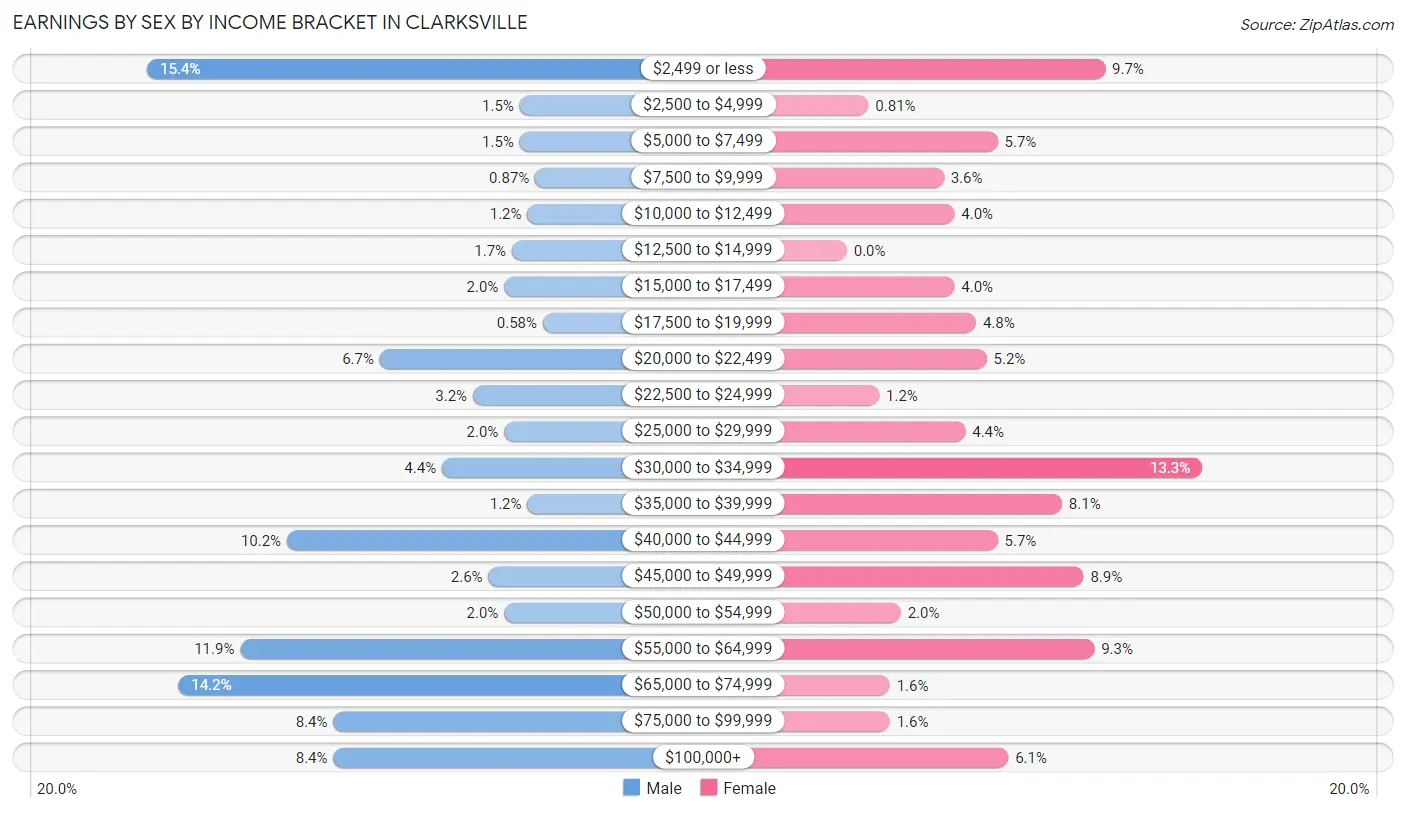
Earnings by Sex by Income Bracket in Clarksville
The most common earnings brackets in Clarksville are $2,499 or less for men (53 | 15.4%) and $30,000 to $34,999 for women (33 | 13.3%).
| Income | Male | Female |
| $2,499 or less | 53 (15.4%) | 24 (9.7%) |
| $2,500 to $4,999 | 5 (1.5%) | 2 (0.8%) |
| $5,000 to $7,499 | 5 (1.5%) | 14 (5.7%) |
| $7,500 to $9,999 | 3 (0.9%) | 9 (3.6%) |
| $10,000 to $12,499 | 4 (1.2%) | 10 (4.0%) |
| $12,500 to $14,999 | 6 (1.7%) | 0 (0.0%) |
| $15,000 to $17,499 | 7 (2.0%) | 10 (4.0%) |
| $17,500 to $19,999 | 2 (0.6%) | 12 (4.8%) |
| $20,000 to $22,499 | 23 (6.7%) | 13 (5.2%) |
| $22,500 to $24,999 | 11 (3.2%) | 3 (1.2%) |
| $25,000 to $29,999 | 7 (2.0%) | 11 (4.4%) |
| $30,000 to $34,999 | 15 (4.4%) | 33 (13.3%) |
| $35,000 to $39,999 | 4 (1.2%) | 20 (8.1%) |
| $40,000 to $44,999 | 35 (10.2%) | 14 (5.7%) |
| $45,000 to $49,999 | 9 (2.6%) | 22 (8.9%) |
| $50,000 to $54,999 | 7 (2.0%) | 5 (2.0%) |
| $55,000 to $64,999 | 41 (11.9%) | 23 (9.3%) |
| $65,000 to $74,999 | 49 (14.2%) | 4 (1.6%) |
| $75,000 to $99,999 | 29 (8.4%) | 4 (1.6%) |
| $100,000+ | 29 (8.4%) | 15 (6.0%) |
| Total | 344 (100.0%) | 248 (100.0%) |
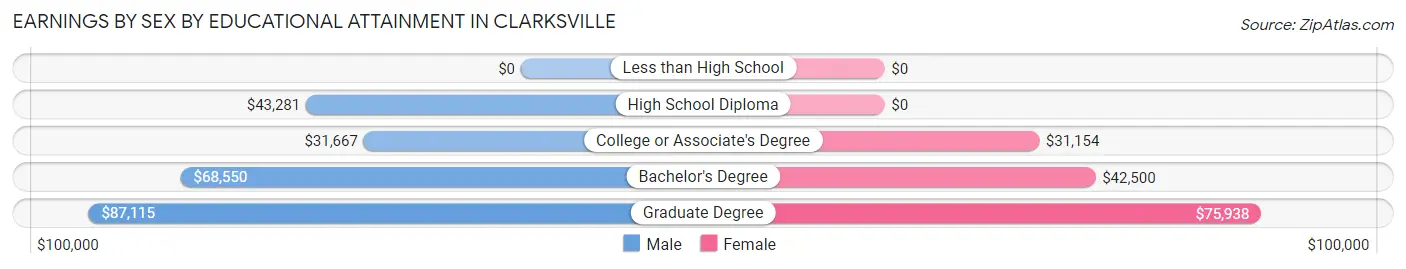
Earnings by Sex by Educational Attainment in Clarksville
Average earnings in Clarksville are $45,625 for men and $31,827 for women, a difference of 30.2%. Men with an educational attainment of graduate degree enjoy the highest average annual earnings of $87,115, while those with college or associate's degree education earn the least with $31,667. Women with an educational attainment of graduate degree earn the most with the average annual earnings of $75,938, while those with college or associate's degree education have the smallest earnings of $31,154.
| Educational Attainment | Male Income | Female Income |
| Less than High School | - | - |
| High School Diploma | $43,281 | $0 |
| College or Associate's Degree | $31,667 | $31,154 |
| Bachelor's Degree | $68,550 | $42,500 |
| Graduate Degree | $87,115 | $75,938 |
| Total | $45,625 | $31,827 |
Family Income in Clarksville
Family Income Brackets in Clarksville
According to the Clarksville family income data, there are 94 families falling into the $75,000 to $99,999 income range, which is the most common income bracket and makes up 24.8% of all families. Conversely, the $10,000 to $14,999 income bracket is the least frequent group with only 7 families (1.8%) belonging to this category.
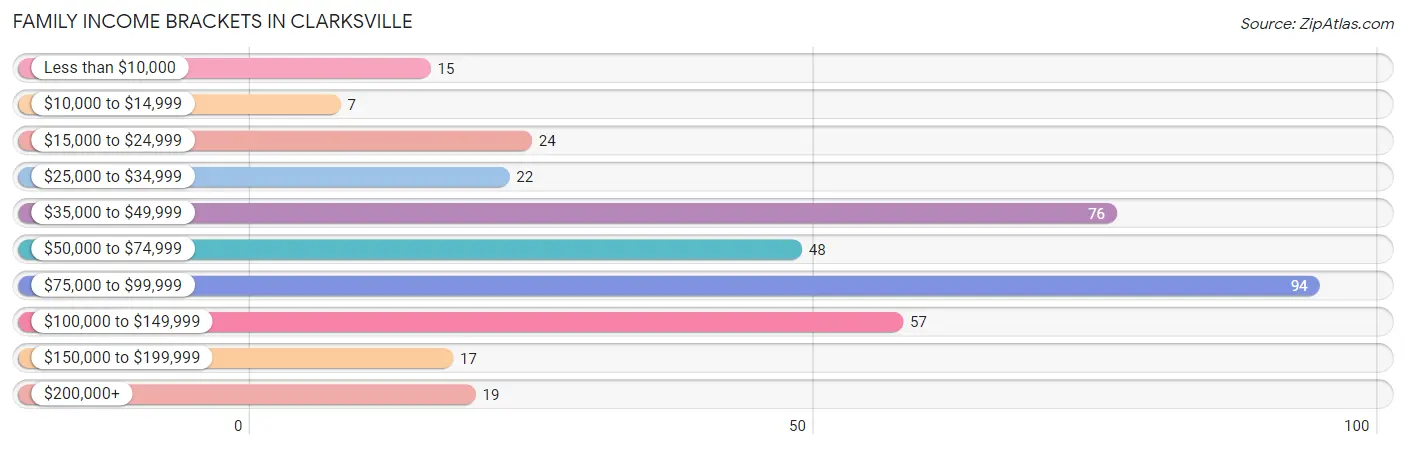
| Income Bracket | # Families | % Families |
| Less than $10,000 | 15 | 4.0% |
| $10,000 to $14,999 | 7 | 1.8% |
| $15,000 to $24,999 | 24 | 6.3% |
| $25,000 to $34,999 | 22 | 5.8% |
| $35,000 to $49,999 | 76 | 20.1% |
| $50,000 to $74,999 | 48 | 12.7% |
| $75,000 to $99,999 | 94 | 24.8% |
| $100,000 to $149,999 | 57 | 15.0% |
| $150,000 to $199,999 | 17 | 4.5% |
| $200,000+ | 19 | 5.0% |
Family Income by Famaliy Size in Clarksville
6-person families (9 | 2.4%) account for the highest median family income in Clarksville with $98,393 per family, while 2-person families (242 | 63.8%) have the highest median income of $37,639 per family member.
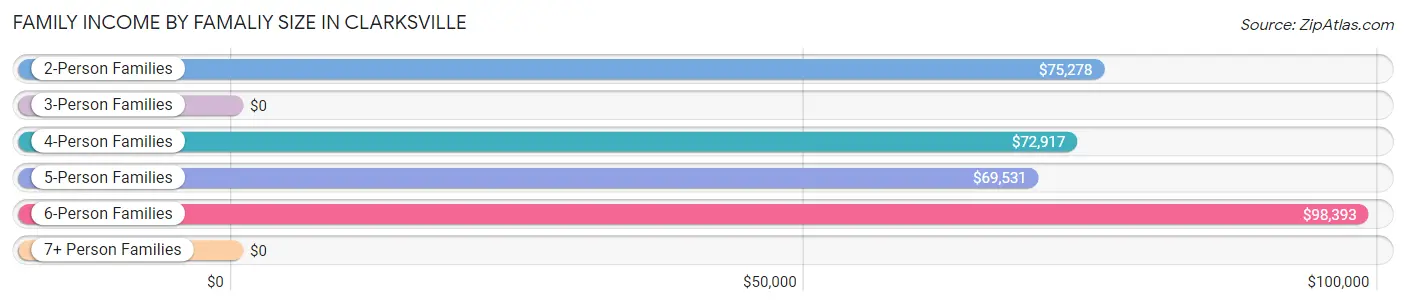
| Income Bracket | # Families | Median Income |
| 2-Person Families | 242 (63.8%) | $75,278 |
| 3-Person Families | 32 (8.4%) | $0 |
| 4-Person Families | 59 (15.6%) | $72,917 |
| 5-Person Families | 32 (8.4%) | $69,531 |
| 6-Person Families | 9 (2.4%) | $98,393 |
| 7+ Person Families | 5 (1.3%) | $0 |
| Total | 379 (100.0%) | $73,438 |
Family Income by Number of Earners in Clarksville
The median family income in Clarksville is $73,438, with families comprising 3+ earners (10) having the highest median family income of $91,250, while families with no earners (105) have the lowest median family income of $47,813, accounting for 2.6% and 27.7% of families, respectively.
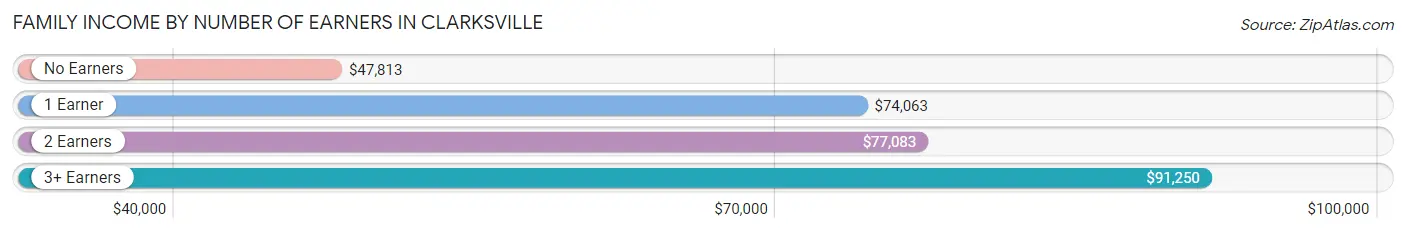
| Number of Earners | # Families | Median Income |
| No Earners | 105 (27.7%) | $47,813 |
| 1 Earner | 133 (35.1%) | $74,063 |
| 2 Earners | 131 (34.6%) | $77,083 |
| 3+ Earners | 10 (2.6%) | $91,250 |
| Total | 379 (100.0%) | $73,438 |
Household Income in Clarksville
Household Income Brackets in Clarksville
With 192 households falling in the category, the $75,000 to $99,999 income range is the most frequent in Clarksville, accounting for 25.3% of all households. In contrast, only 17 households (2.2%) fall into the $150,000 to $199,999 income bracket, making it the least populous group.
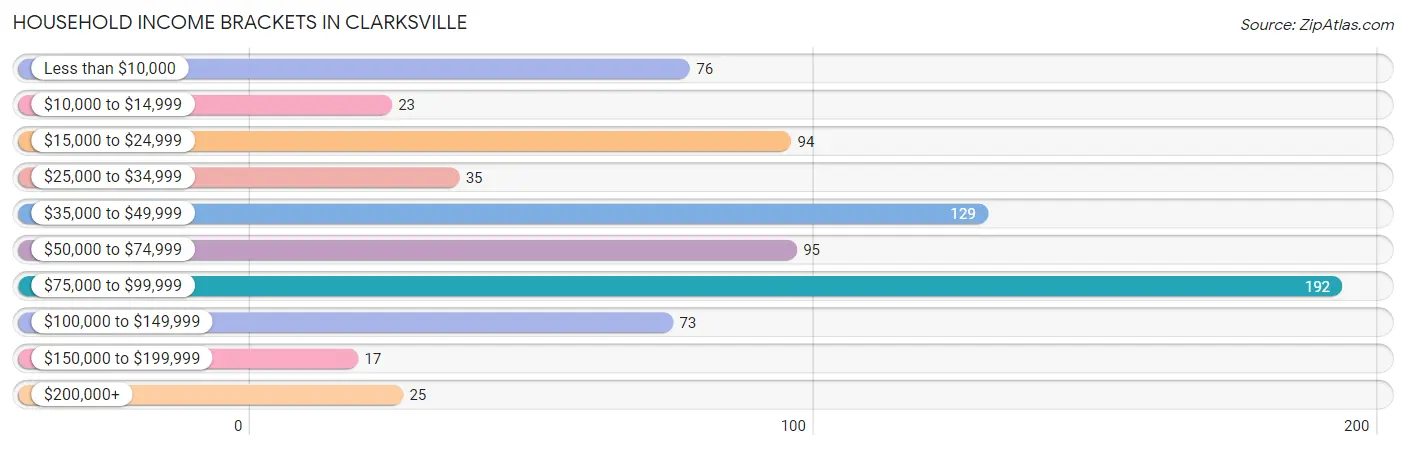
| Income Bracket | # Households | % Households |
| Less than $10,000 | 76 | 10.0% |
| $10,000 to $14,999 | 23 | 3.0% |
| $15,000 to $24,999 | 94 | 12.4% |
| $25,000 to $34,999 | 35 | 4.6% |
| $35,000 to $49,999 | 129 | 17.0% |
| $50,000 to $74,999 | 95 | 12.5% |
| $75,000 to $99,999 | 192 | 25.3% |
| $100,000 to $149,999 | 73 | 9.6% |
| $150,000 to $199,999 | 17 | 2.2% |
| $200,000+ | 25 | 3.3% |
Household Income by Householder Age in Clarksville
The median household income in Clarksville is $59,375, with the highest median household income of $57,500 found in the 25 to 44 years age bracket for the primary householder. A total of 124 households (16.3%) fall into this category. Meanwhile, the 15 to 24 years age bracket for the primary householder has the lowest median household income of $0, with 11 households (1.5%) in this group.
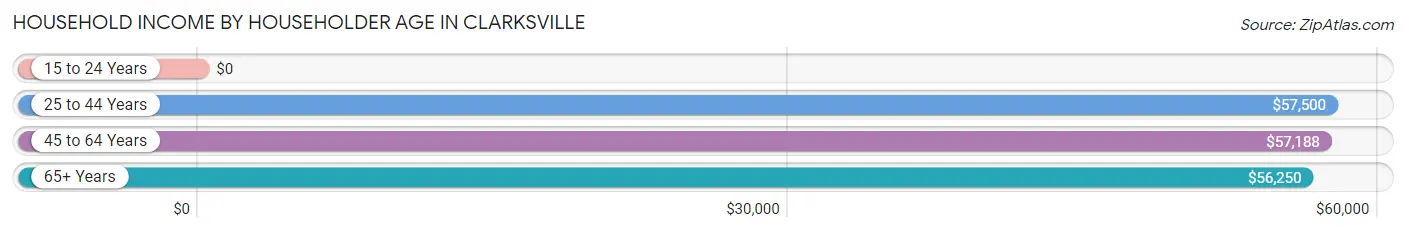
| Income Bracket | # Households | Median Income |
| 15 to 24 Years | 11 (1.5%) | $0 |
| 25 to 44 Years | 124 (16.3%) | $57,500 |
| 45 to 64 Years | 208 (27.4%) | $57,188 |
| 65+ Years | 416 (54.8%) | $56,250 |
| Total | 759 (100.0%) | $59,375 |
Poverty in Clarksville
Income Below Poverty by Sex and Age in Clarksville
With 10.0% poverty level for males and 18.3% for females among the residents of Clarksville, 15 year old males and under 5 year old females are the most vulnerable to poverty, with 4 males (33.3%) and 48 females (64.9%) in their respective age groups living below the poverty level.
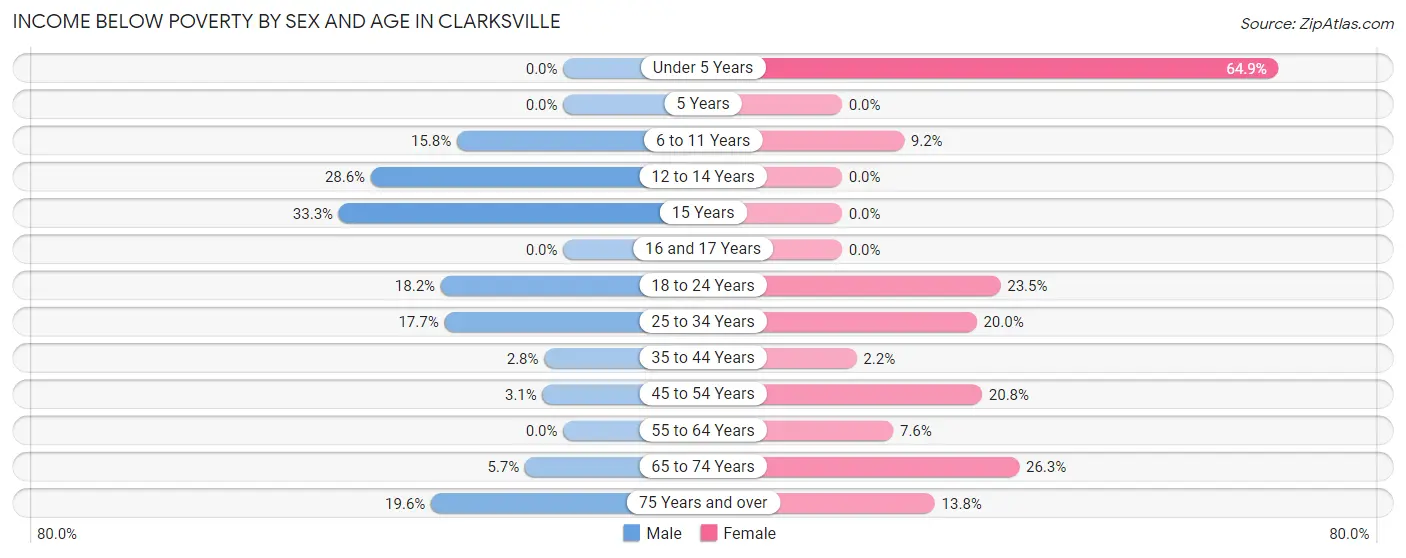
| Age Bracket | Male | Female |
| Under 5 Years | 0 (0.0%) | 48 (64.9%) |
| 5 Years | 0 (0.0%) | 0 (0.0%) |
| 6 to 11 Years | 6 (15.8%) | 7 (9.2%) |
| 12 to 14 Years | 8 (28.6%) | 0 (0.0%) |
| 15 Years | 4 (33.3%) | 0 (0.0%) |
| 16 and 17 Years | 0 (0.0%) | 0 (0.0%) |
| 18 to 24 Years | 4 (18.2%) | 8 (23.5%) |
| 25 to 34 Years | 15 (17.6%) | 12 (20.0%) |
| 35 to 44 Years | 2 (2.8%) | 1 (2.2%) |
| 45 to 54 Years | 2 (3.1%) | 26 (20.8%) |
| 55 to 64 Years | 0 (0.0%) | 7 (7.6%) |
| 65 to 74 Years | 10 (5.7%) | 35 (26.3%) |
| 75 Years and over | 21 (19.6%) | 20 (13.8%) |
| Total | 72 (10.0%) | 164 (18.3%) |
Income Above Poverty by Sex and Age in Clarksville
According to the poverty statistics in Clarksville, males aged under 5 years and females aged 5 years are the age groups that are most secure financially, with 100.0% of males and 100.0% of females in these age groups living above the poverty line.
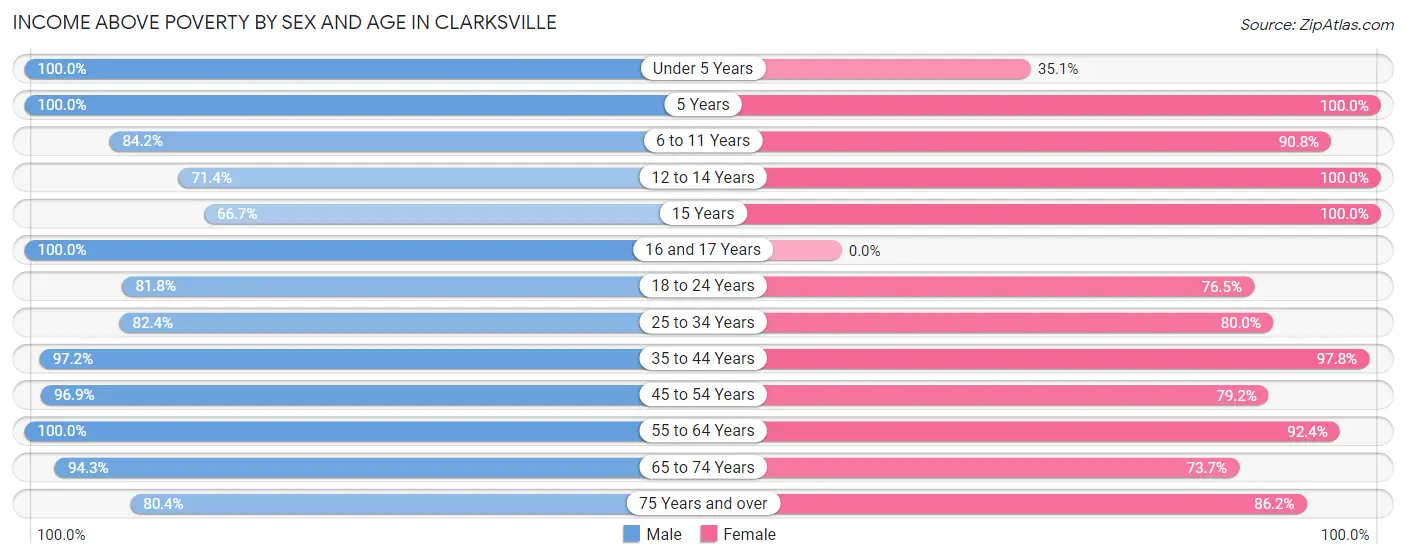
| Age Bracket | Male | Female |
| Under 5 Years | 29 (100.0%) | 26 (35.1%) |
| 5 Years | 4 (100.0%) | 10 (100.0%) |
| 6 to 11 Years | 32 (84.2%) | 69 (90.8%) |
| 12 to 14 Years | 20 (71.4%) | 100 (100.0%) |
| 15 Years | 8 (66.7%) | 3 (100.0%) |
| 16 and 17 Years | 20 (100.0%) | 0 (0.0%) |
| 18 to 24 Years | 18 (81.8%) | 26 (76.5%) |
| 25 to 34 Years | 70 (82.4%) | 48 (80.0%) |
| 35 to 44 Years | 69 (97.2%) | 45 (97.8%) |
| 45 to 54 Years | 63 (96.9%) | 99 (79.2%) |
| 55 to 64 Years | 62 (100.0%) | 85 (92.4%) |
| 65 to 74 Years | 166 (94.3%) | 98 (73.7%) |
| 75 Years and over | 86 (80.4%) | 125 (86.2%) |
| Total | 647 (90.0%) | 734 (81.7%) |
Income Below Poverty Among Married-Couple Families in Clarksville
The poverty statistics for married-couple families in Clarksville show that 3.1% or 9 of the total 289 families live below the poverty line. Families with 3 or 4 children have the highest poverty rate of 7.1%, comprising of 2 families. On the other hand, families with 1 or 2 children have the lowest poverty rate of 0.0%, which includes 0 families.
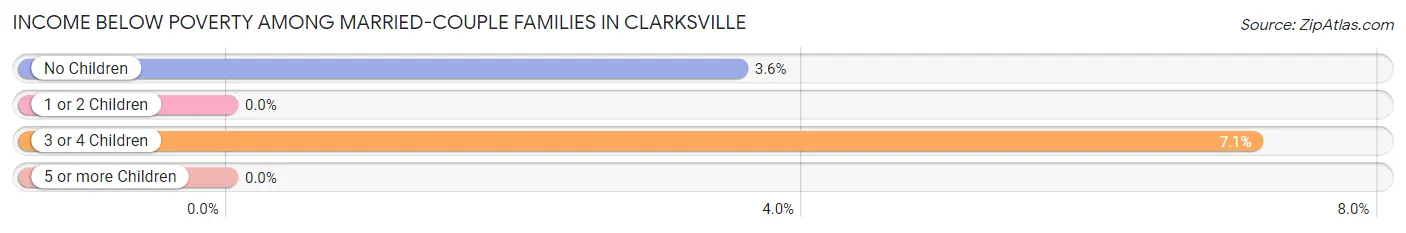
| Children | Above Poverty | Below Poverty |
| No Children | 190 (96.5%) | 7 (3.5%) |
| 1 or 2 Children | 62 (100.0%) | 0 (0.0%) |
| 3 or 4 Children | 26 (92.9%) | 2 (7.1%) |
| 5 or more Children | 2 (100.0%) | 0 (0.0%) |
| Total | 280 (96.9%) | 9 (3.1%) |
Income Below Poverty Among Single-Parent Households in Clarksville
According to the poverty data in Clarksville, 10.0% or 2 single-father households and 37.1% or 26 single-mother households are living below the poverty line. Among single-father households, those with 1 or 2 children have the highest poverty rate, with 2 households (40.0%) experiencing poverty. Likewise, among single-mother households, those with 3 or 4 children have the highest poverty rate, with 11 households (91.7%) falling below the poverty line.
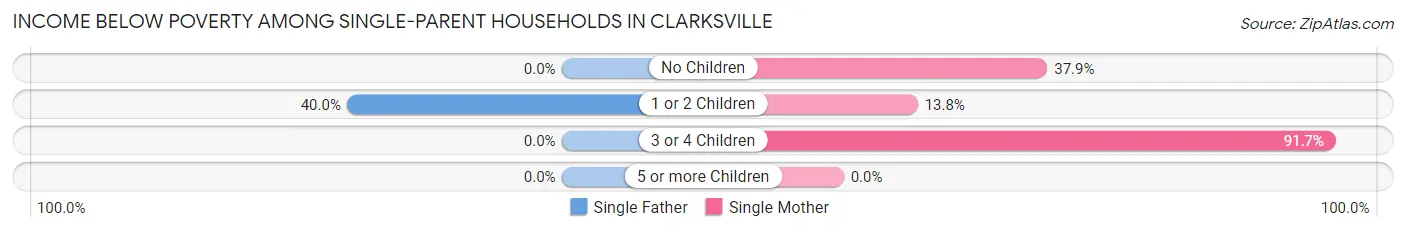
| Children | Single Father | Single Mother |
| No Children | 0 (0.0%) | 11 (37.9%) |
| 1 or 2 Children | 2 (40.0%) | 4 (13.8%) |
| 3 or 4 Children | 0 (0.0%) | 11 (91.7%) |
| 5 or more Children | 0 (0.0%) | 0 (0.0%) |
| Total | 2 (10.0%) | 26 (37.1%) |
Income Below Poverty Among Married-Couple vs Single-Parent Households in Clarksville
The poverty data for Clarksville shows that 9 of the married-couple family households (3.1%) and 28 of the single-parent households (31.1%) are living below the poverty level. Within the married-couple family households, those with 3 or 4 children have the highest poverty rate, with 2 households (7.1%) falling below the poverty line. Among the single-parent households, those with 3 or 4 children have the highest poverty rate, with 11 household (73.3%) living below poverty.
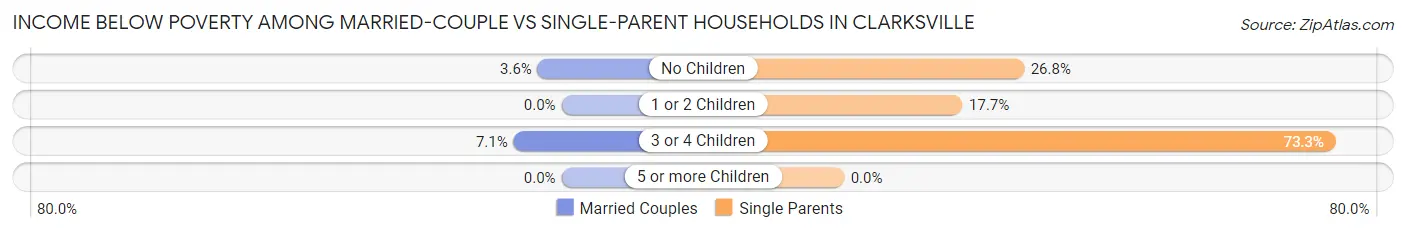
| Children | Married-Couple Families | Single-Parent Households |
| No Children | 7 (3.5%) | 11 (26.8%) |
| 1 or 2 Children | 0 (0.0%) | 6 (17.6%) |
| 3 or 4 Children | 2 (7.1%) | 11 (73.3%) |
| 5 or more Children | 0 (0.0%) | 0 (0.0%) |
| Total | 9 (3.1%) | 28 (31.1%) |
Race in Clarksville
The most populous races in Clarksville are White / Caucasian (1,294 | 79.4%), Black / African American (259 | 15.9%), and Two or more Races (35 | 2.1%).
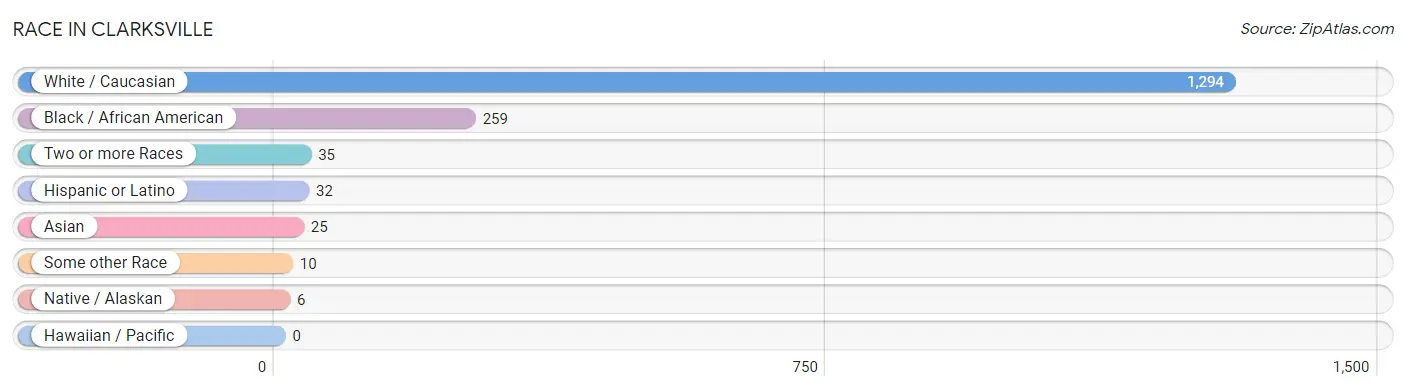
| Race | # Population | % Population |
| Asian | 25 | 1.5% |
| Black / African American | 259 | 15.9% |
| Hawaiian / Pacific | 0 | 0.0% |
| Hispanic or Latino | 32 | 2.0% |
| Native / Alaskan | 6 | 0.4% |
| White / Caucasian | 1,294 | 79.4% |
| Two or more Races | 35 | 2.1% |
| Some other Race | 10 | 0.6% |
| Total | 1,629 | 100.0% |
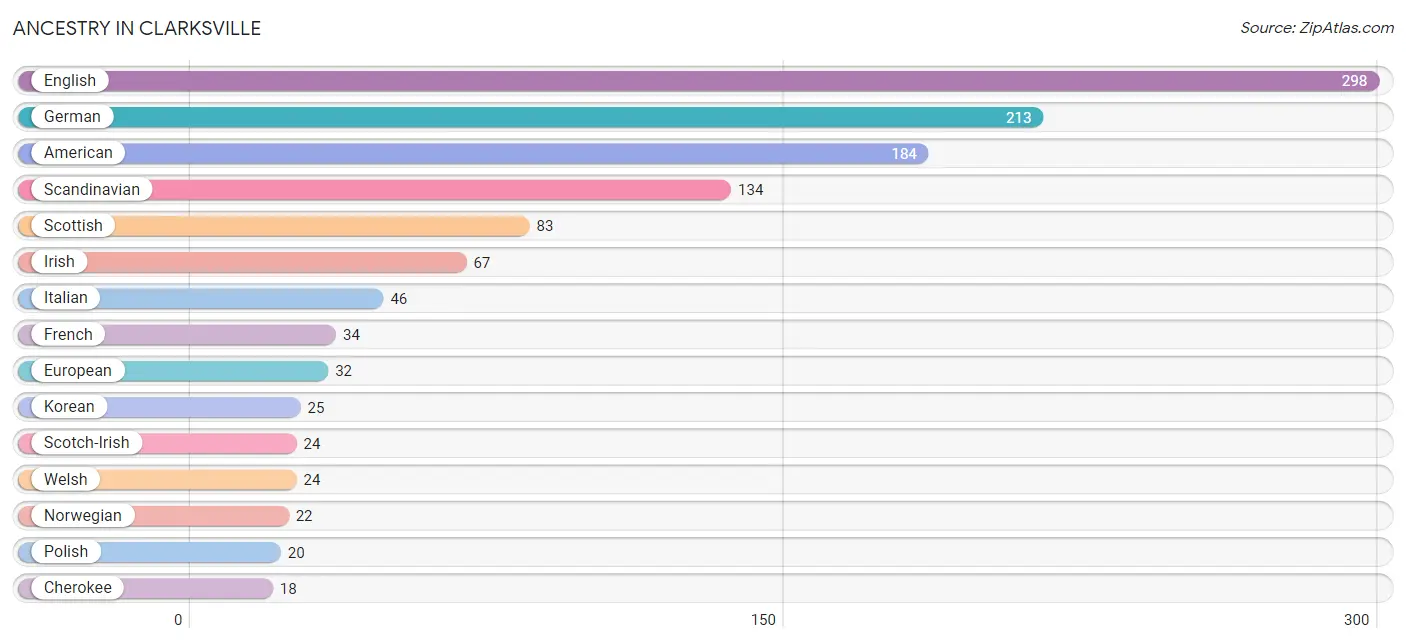
Ancestry in Clarksville
The most populous ancestries reported in Clarksville are English (298 | 18.3%), German (213 | 13.1%), American (184 | 11.3%), Scandinavian (134 | 8.2%), and Scottish (83 | 5.1%), together accounting for 56.0% of all Clarksville residents.
| Ancestry | # Population | % Population |
| Albanian | 8 | 0.5% |
| American | 184 | 11.3% |
| Arab | 7 | 0.4% |
| Austrian | 14 | 0.9% |
| Bhutanese | 2 | 0.1% |
| Blackfeet | 6 | 0.4% |
| Brazilian | 3 | 0.2% |
| Canadian | 3 | 0.2% |
| Central American | 6 | 0.4% |
| Cherokee | 18 | 1.1% |
| Czech | 6 | 0.4% |
| Dutch | 15 | 0.9% |
| Ecuadorian | 3 | 0.2% |
| English | 298 | 18.3% |
| European | 32 | 2.0% |
| French | 34 | 2.1% |
| French Canadian | 14 | 0.9% |
| German | 213 | 13.1% |
| Haitian | 11 | 0.7% |
| Honduran | 4 | 0.3% |
| Hungarian | 9 | 0.5% |
| Irish | 67 | 4.1% |
| Italian | 46 | 2.8% |
| Korean | 25 | 1.5% |
| Lebanese | 7 | 0.4% |
| Lithuanian | 3 | 0.2% |
| Mexican | 13 | 0.8% |
| Mexican American Indian | 6 | 0.4% |
| Norwegian | 22 | 1.3% |
| Polish | 20 | 1.2% |
| Puerto Rican | 3 | 0.2% |
| Russian | 8 | 0.5% |
| Salvadoran | 2 | 0.1% |
| Scandinavian | 134 | 8.2% |
| Scotch-Irish | 24 | 1.5% |
| Scottish | 83 | 5.1% |
| Slavic | 3 | 0.2% |
| Slovak | 3 | 0.2% |
| South American | 3 | 0.2% |
| Spaniard | 7 | 0.4% |
| Swedish | 9 | 0.5% |
| Syrian | 7 | 0.4% |
| Turkish | 3 | 0.2% |
| Welsh | 24 | 1.5% | View All 44 Rows |
Immigrants in Clarksville
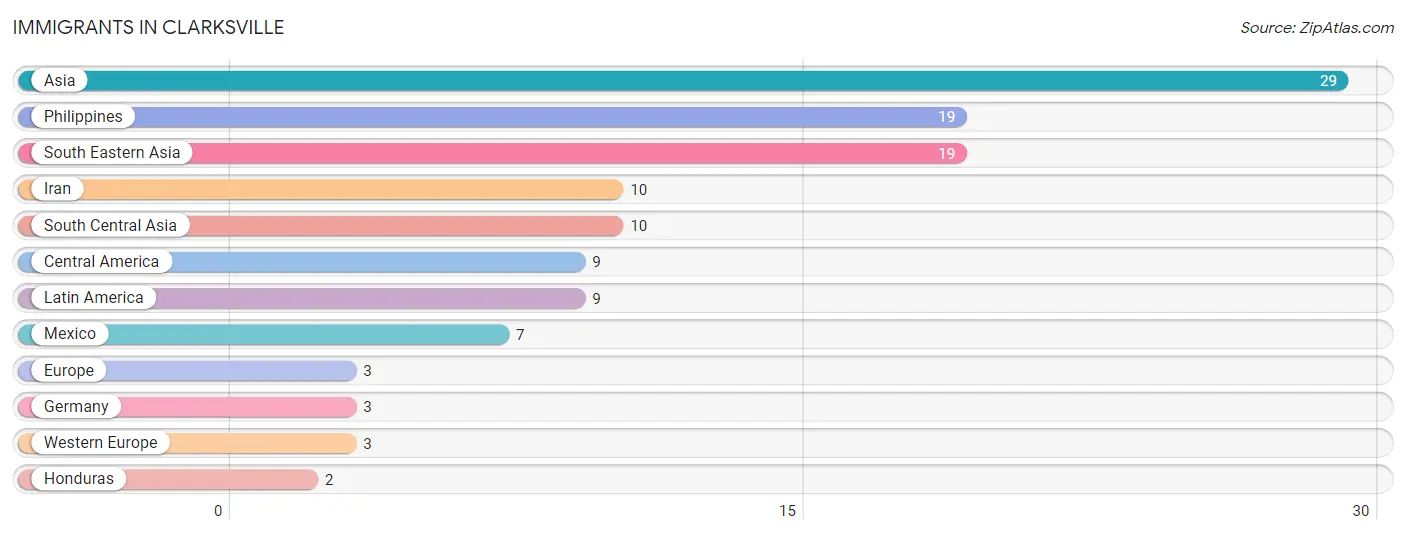
The most numerous immigrant groups reported in Clarksville came from Asia (29 | 1.8%), Philippines (19 | 1.2%), South Eastern Asia (19 | 1.2%), Iran (10 | 0.6%), and South Central Asia (10 | 0.6%), together accounting for 5.3% of all Clarksville residents.
| Immigration Origin | # Population | % Population |
| Asia | 29 | 1.8% |
| Central America | 9 | 0.5% |
| Europe | 3 | 0.2% |
| Germany | 3 | 0.2% |
| Honduras | 2 | 0.1% |
| Iran | 10 | 0.6% |
| Latin America | 9 | 0.5% |
| Mexico | 7 | 0.4% |
| Philippines | 19 | 1.2% |
| South Central Asia | 10 | 0.6% |
| South Eastern Asia | 19 | 1.2% |
| Western Europe | 3 | 0.2% | View All 12 Rows |
Sex and Age in Clarksville
Sex and Age in Clarksville
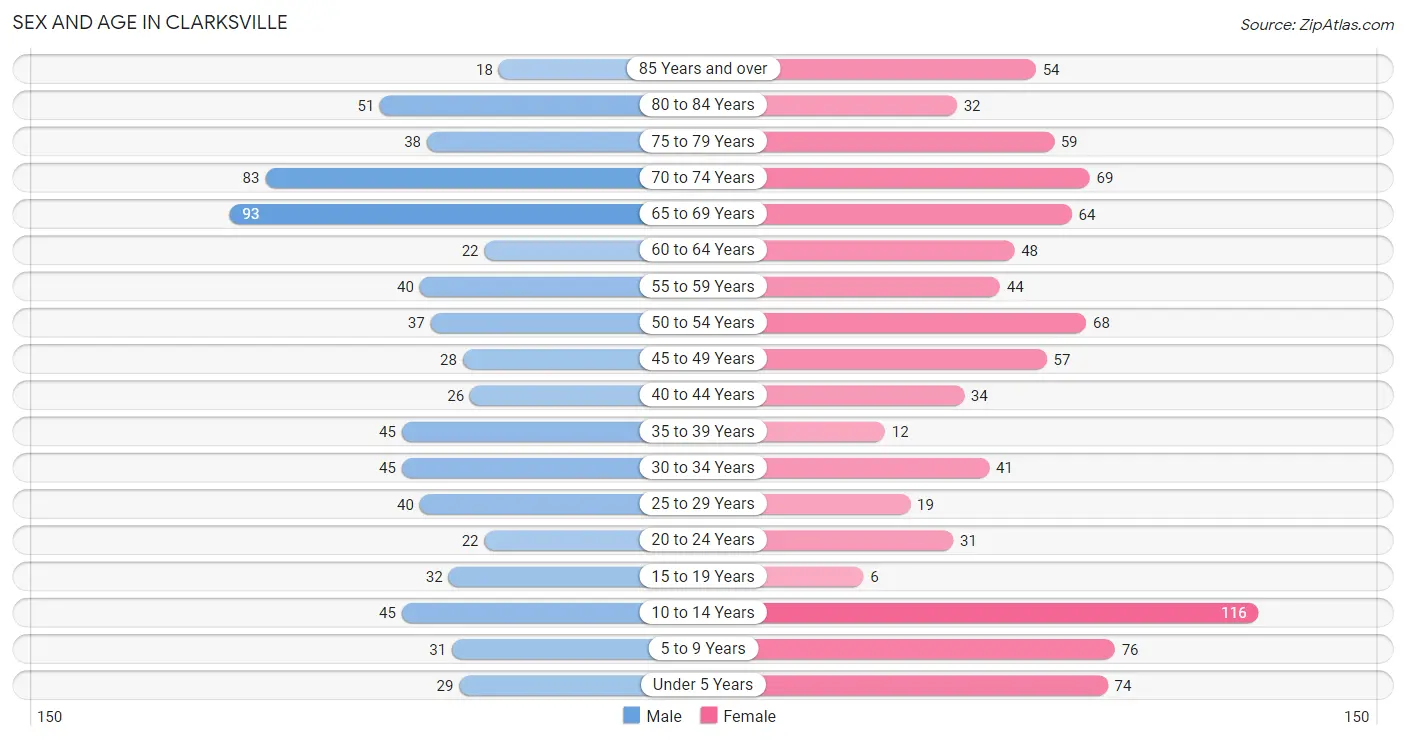
The most populous age groups in Clarksville are 65 to 69 Years (93 | 12.8%) for men and 10 to 14 Years (116 | 12.8%) for women.
| Age Bracket | Male | Female |
| Under 5 Years | 29 (4.0%) | 74 (8.2%) |
| 5 to 9 Years | 31 (4.3%) | 76 (8.4%) |
| 10 to 14 Years | 45 (6.2%) | 116 (12.8%) |
| 15 to 19 Years | 32 (4.4%) | 6 (0.7%) |
| 20 to 24 Years | 22 (3.0%) | 31 (3.4%) |
| 25 to 29 Years | 40 (5.5%) | 19 (2.1%) |
| 30 to 34 Years | 45 (6.2%) | 41 (4.5%) |
| 35 to 39 Years | 45 (6.2%) | 12 (1.3%) |
| 40 to 44 Years | 26 (3.6%) | 34 (3.8%) |
| 45 to 49 Years | 28 (3.9%) | 57 (6.3%) |
| 50 to 54 Years | 37 (5.1%) | 68 (7.5%) |
| 55 to 59 Years | 40 (5.5%) | 44 (4.9%) |
| 60 to 64 Years | 22 (3.0%) | 48 (5.3%) |
| 65 to 69 Years | 93 (12.8%) | 64 (7.1%) |
| 70 to 74 Years | 83 (11.5%) | 69 (7.6%) |
| 75 to 79 Years | 38 (5.2%) | 59 (6.5%) |
| 80 to 84 Years | 51 (7.0%) | 32 (3.5%) |
| 85 Years and over | 18 (2.5%) | 54 (6.0%) |
| Total | 725 (100.0%) | 904 (100.0%) |
Families and Households in Clarksville
Median Family Size in Clarksville
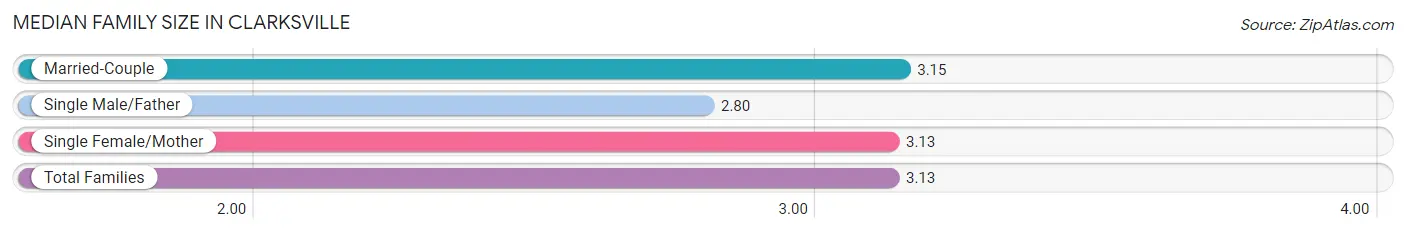
The median family size in Clarksville is 3.13 persons per family, with married-couple families (289 | 76.2%) accounting for the largest median family size of 3.15 persons per family. On the other hand, single male/father families (20 | 5.3%) represent the smallest median family size with 2.80 persons per family.
| Family Type | # Families | Family Size |
| Married-Couple | 289 (76.2%) | 3.15 |
| Single Male/Father | 20 (5.3%) | 2.80 |
| Single Female/Mother | 70 (18.5%) | 3.13 |
| Total Families | 379 (100.0%) | 3.13 |
Median Household Size in Clarksville
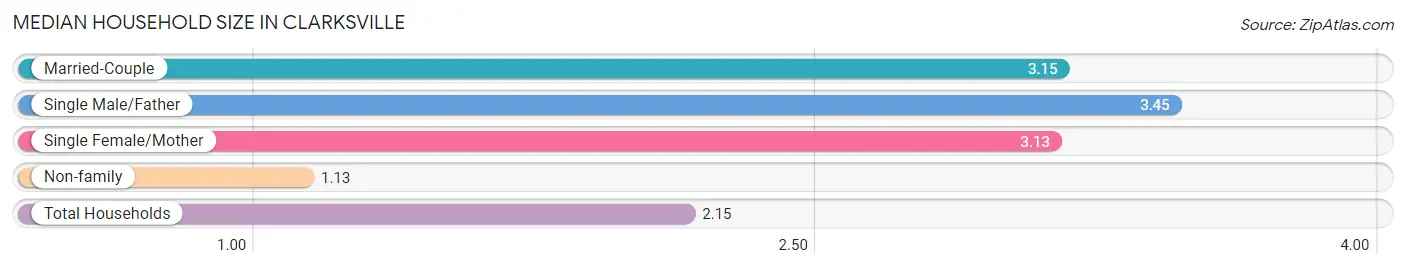
The median household size in Clarksville is 2.15 persons per household, with single male/father households (20 | 2.6%) accounting for the largest median household size of 3.45 persons per household. non-family households (380 | 50.1%) represent the smallest median household size with 1.13 persons per household.
| Household Type | # Households | Household Size |
| Married-Couple | 289 (38.1%) | 3.15 |
| Single Male/Father | 20 (2.6%) | 3.45 |
| Single Female/Mother | 70 (9.2%) | 3.13 |
| Non-family | 380 (50.1%) | 1.13 |
| Total Households | 759 (100.0%) | 2.15 |
Household Size by Marriage Status in Clarksville
Out of a total of 759 households in Clarksville, 379 (49.9%) are family households, while 380 (50.1%) are nonfamily households. The most numerous type of family households are 2-person households, comprising 234, and the most common type of nonfamily households are 1-person households, comprising 348.
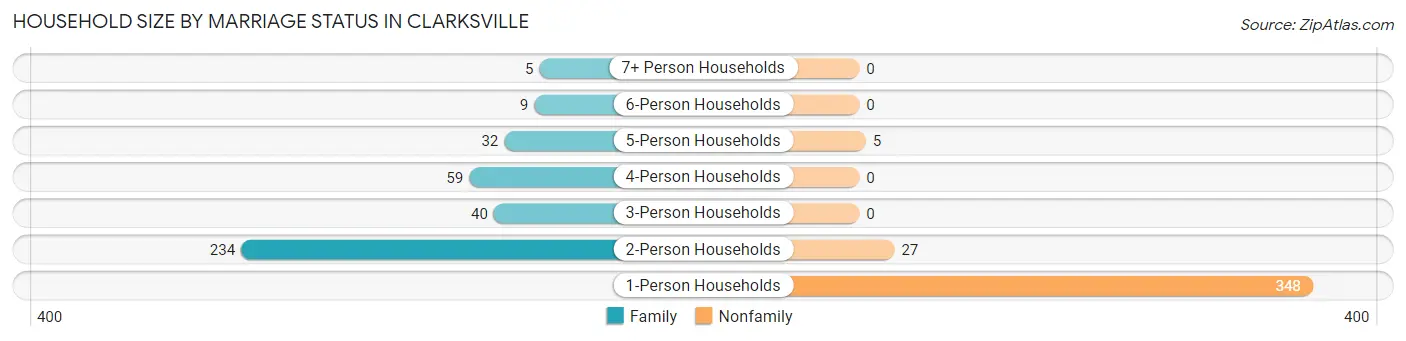
| Household Size | Family Households | Nonfamily Households |
| 1-Person Households | - | 348 (45.9%) |
| 2-Person Households | 234 (30.8%) | 27 (3.6%) |
| 3-Person Households | 40 (5.3%) | 0 (0.0%) |
| 4-Person Households | 59 (7.8%) | 0 (0.0%) |
| 5-Person Households | 32 (4.2%) | 5 (0.7%) |
| 6-Person Households | 9 (1.2%) | 0 (0.0%) |
| 7+ Person Households | 5 (0.7%) | 0 (0.0%) |
| Total | 379 (49.9%) | 380 (50.1%) |
Female Fertility in Clarksville
Fertility by Age in Clarksville
Average fertility rate in Clarksville is 82.0 births per 1,000 women. Women in the age bracket of 20 to 34 years have the highest fertility rate with 198.0 births per 1,000 women. Women in the age bracket of 20 to 34 years acount for 94.7% of all women with births.
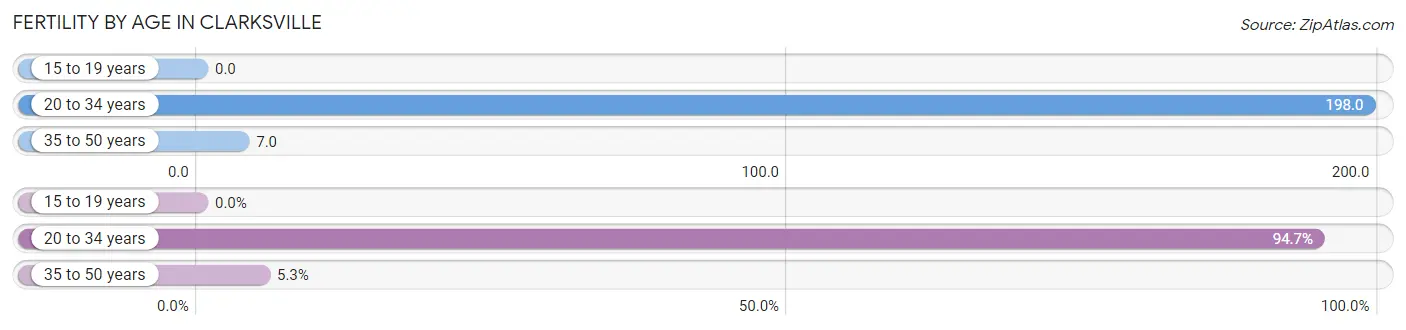
| Age Bracket | Women with Births | Births / 1,000 Women |
| 15 to 19 years | 0 (0.0%) | 0.0 |
| 20 to 34 years | 18 (94.7%) | 198.0 |
| 35 to 50 years | 1 (5.3%) | 7.0 |
| Total | 19 (100.0%) | 82.0 |
Fertility by Age by Marriage Status in Clarksville
52.6% of women with births (19) in Clarksville are married. The highest percentage of unmarried women with births falls into 20 to 34 years age bracket with 50.0% of them unmarried at the time of birth, while the lowest percentage of unmarried women with births belong to 35 to 50 years age bracket with 0.0% of them unmarried.
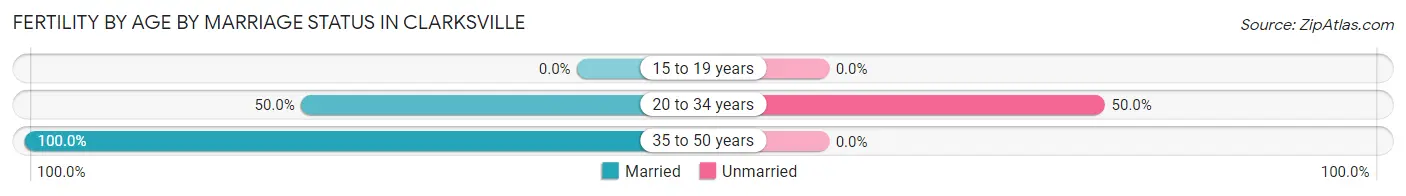
| Age Bracket | Married | Unmarried |
| 15 to 19 years | 0 (0.0%) | 0 (0.0%) |
| 20 to 34 years | 9 (50.0%) | 9 (50.0%) |
| 35 to 50 years | 1 (100.0%) | 0 (0.0%) |
| Total | 10 (52.6%) | 9 (47.4%) |
Fertility by Education in Clarksville
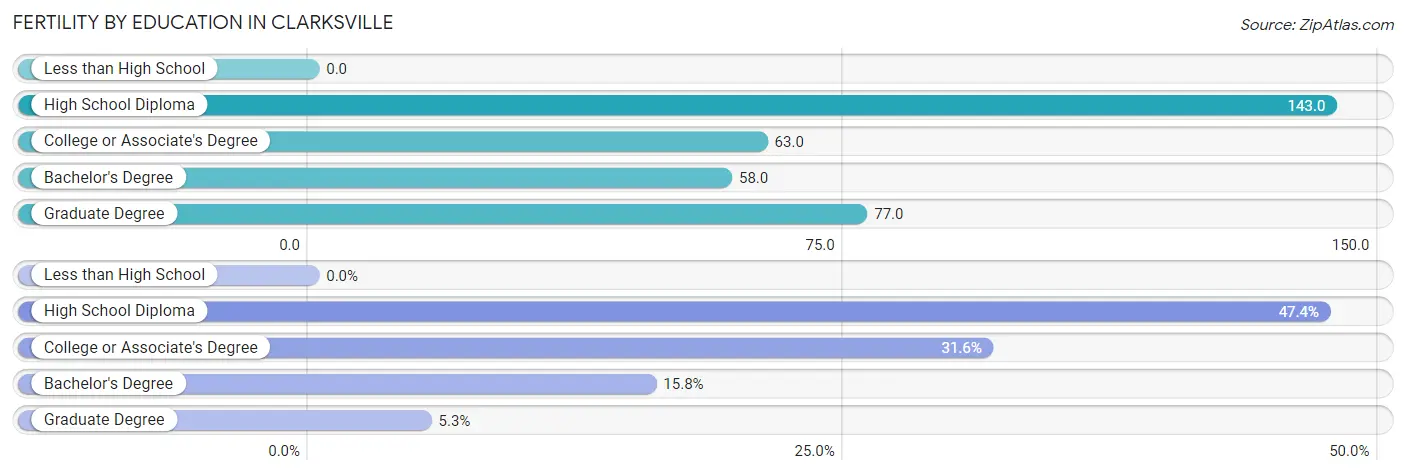
| Educational Attainment | Women with Births | Births / 1,000 Women |
| Less than High School | 0 (0.0%) | 0.0 |
| High School Diploma | 9 (47.4%) | 143.0 |
| College or Associate's Degree | 6 (31.6%) | 63.0 |
| Bachelor's Degree | 3 (15.8%) | 58.0 |
| Graduate Degree | 1 (5.3%) | 77.0 |
| Total | 19 (100.0%) | 82.0 |
Fertility by Education by Marriage Status in Clarksville
47.4% of women with births in Clarksville are unmarried. Women with the educational attainment of college or associate's degree are most likely to be married with 100.0% of them married at childbirth, while women with the educational attainment of high school diploma are least likely to be married with 100.0% of them unmarried at childbirth.
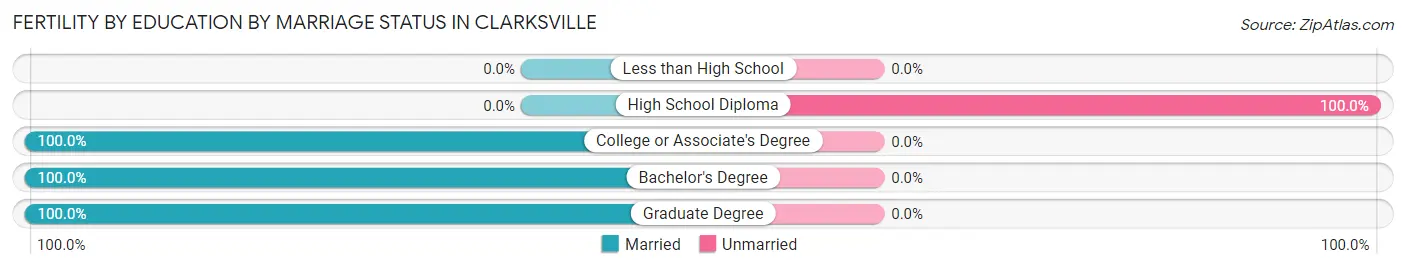
| Educational Attainment | Married | Unmarried |
| Less than High School | 0 (0.0%) | 0 (0.0%) |
| High School Diploma | 0 (0.0%) | 9 (100.0%) |
| College or Associate's Degree | 6 (100.0%) | 0 (0.0%) |
| Bachelor's Degree | 3 (100.0%) | 0 (0.0%) |
| Graduate Degree | 1 (100.0%) | 0 (0.0%) |
| Total | 10 (52.6%) | 9 (47.4%) |
Employment Characteristics in Clarksville
Employment by Class of Employer in Clarksville
Among the 517 employed individuals in Clarksville, private company employees (369 | 71.4%), state government employees (51 | 9.9%), and local government employees (40 | 7.7%) make up the most common classes of employment.
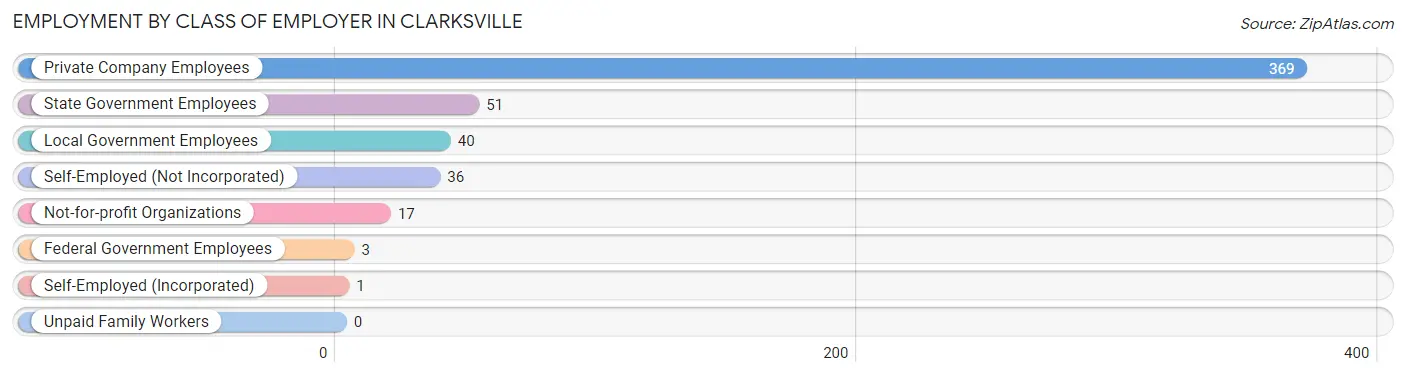
| Employer Class | # Employees | % Employees |
| Private Company Employees | 369 | 71.4% |
| Self-Employed (Incorporated) | 1 | 0.2% |
| Self-Employed (Not Incorporated) | 36 | 7.0% |
| Not-for-profit Organizations | 17 | 3.3% |
| Local Government Employees | 40 | 7.7% |
| State Government Employees | 51 | 9.9% |
| Federal Government Employees | 3 | 0.6% |
| Unpaid Family Workers | 0 | 0.0% |
| Total | 517 | 100.0% |
Employment Status by Age in Clarksville
According to the labor force statistics for Clarksville, out of the total population over 16 years of age (1,243), 44.7% or 556 individuals are in the labor force, with 6.8% or 38 of them unemployed. The age group with the highest labor force participation rate is 30 to 34 years, with 96.5% or 83 individuals in the labor force. Within the labor force, the 20 to 24 years age range has the highest percentage of unemployed individuals, with 44.1% or 15 of them being unemployed.
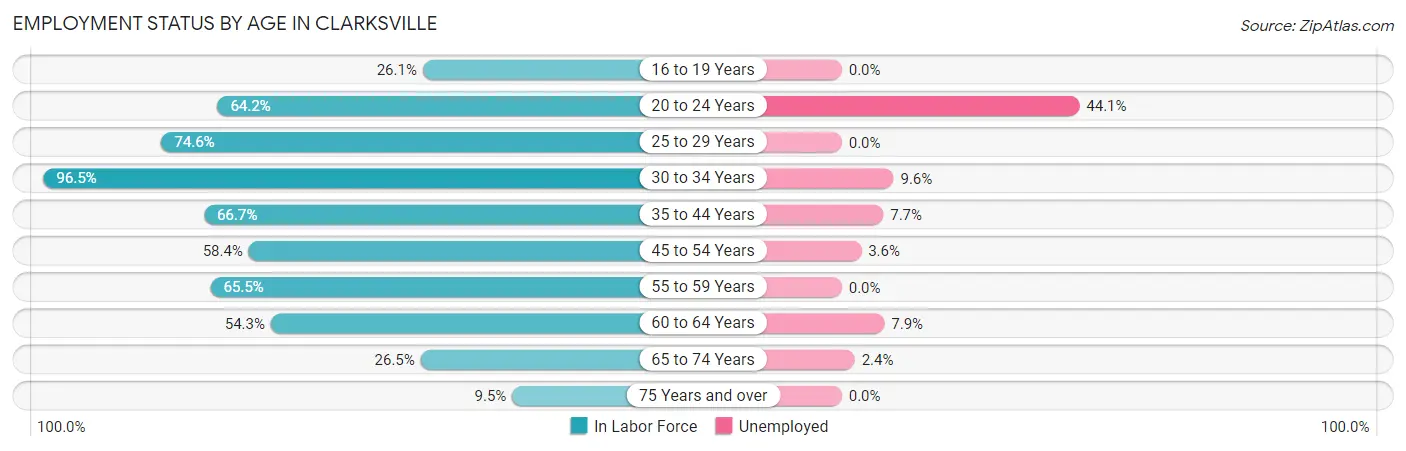
| Age Bracket | In Labor Force | Unemployed |
| 16 to 19 Years | 6 (26.1%) | 0 (0.0%) |
| 20 to 24 Years | 34 (64.2%) | 15 (44.1%) |
| 25 to 29 Years | 44 (74.6%) | 0 (0.0%) |
| 30 to 34 Years | 83 (96.5%) | 8 (9.6%) |
| 35 to 44 Years | 78 (66.7%) | 6 (7.7%) |
| 45 to 54 Years | 111 (58.4%) | 4 (3.6%) |
| 55 to 59 Years | 55 (65.5%) | 0 (0.0%) |
| 60 to 64 Years | 38 (54.3%) | 3 (7.9%) |
| 65 to 74 Years | 82 (26.5%) | 2 (2.4%) |
| 75 Years and over | 24 (9.5%) | 0 (0.0%) |
| Total | 556 (44.7%) | 38 (6.8%) |
Employment Status by Educational Attainment in Clarksville
According to labor force statistics for Clarksville, 67.5% of individuals (409) out of the total population between 25 and 64 years of age (606) are in the labor force, with 5.1% or 21 of them being unemployed. The group with the highest labor force participation rate are those with the educational attainment of bachelor's degree or higher, with 77.9% or 159 individuals in the labor force. Within the labor force, individuals with high school diploma education have the highest percentage of unemployment, with 25.0% or 11 of them being unemployed.
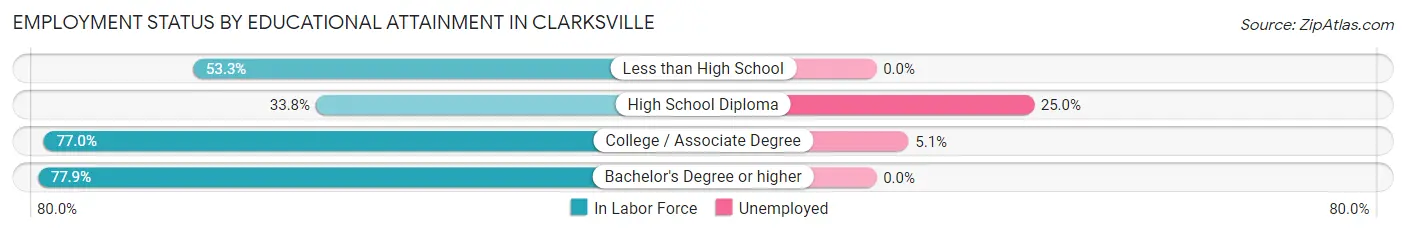
| Educational Attainment | In Labor Force | Unemployed |
| Less than High School | 8 (53.3%) | 0 (0.0%) |
| High School Diploma | 44 (33.8%) | 32 (25.0%) |
| College / Associate Degree | 198 (77.0%) | 13 (5.1%) |
| Bachelor's Degree or higher | 159 (77.9%) | 0 (0.0%) |
| Total | 409 (67.5%) | 31 (5.1%) |
Employment Occupations by Sex in Clarksville
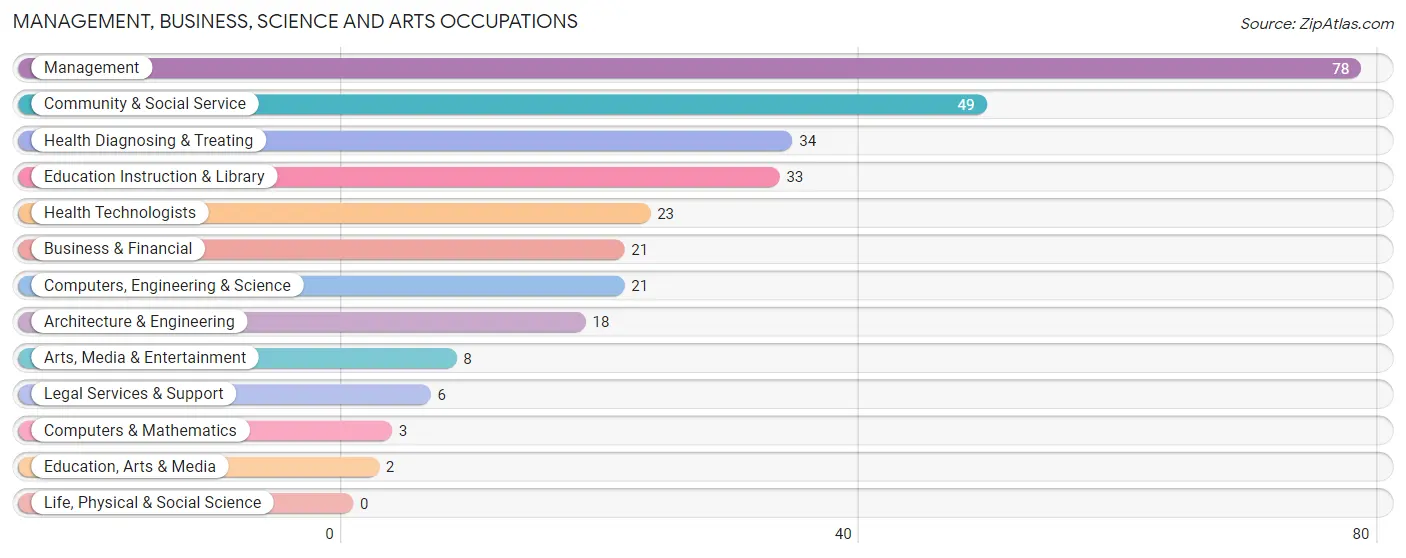
Management, Business, Science and Arts Occupations
The most common Management, Business, Science and Arts occupations in Clarksville are Management (78 | 15.1%), Community & Social Service (49 | 9.5%), Health Diagnosing & Treating (34 | 6.6%), Education Instruction & Library (33 | 6.4%), and Health Technologists (23 | 4.4%).
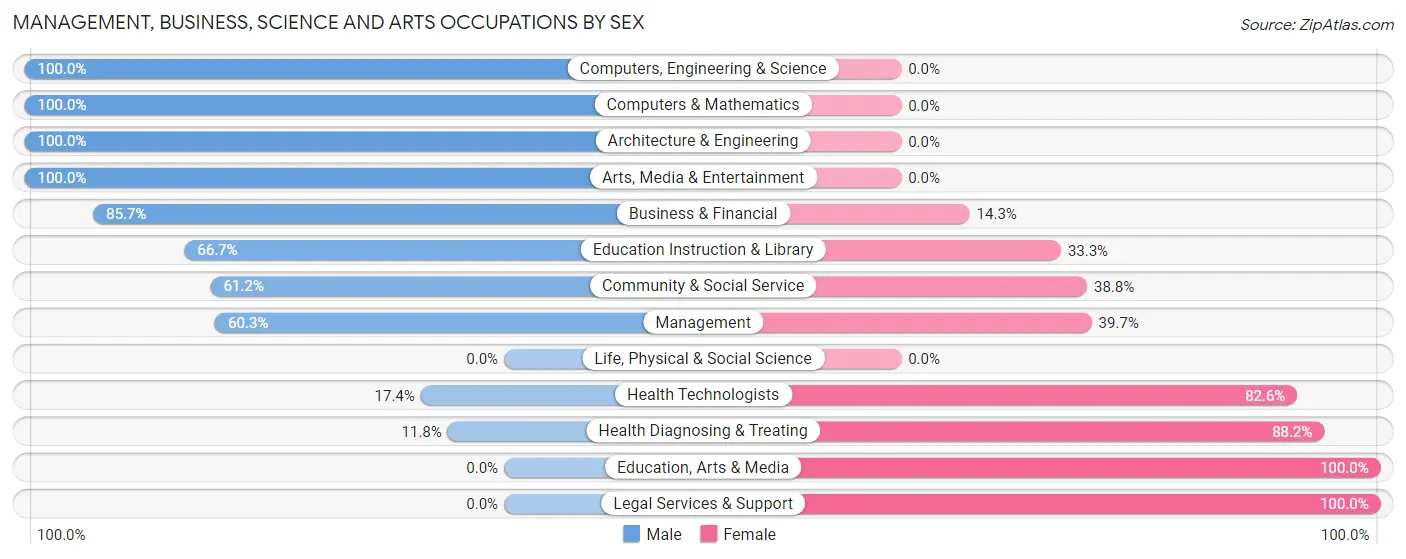
Management, Business, Science and Arts Occupations by Sex
Within the Management, Business, Science and Arts occupations in Clarksville, the most male-oriented occupations are Computers, Engineering & Science (100.0%), Computers & Mathematics (100.0%), and Architecture & Engineering (100.0%), while the most female-oriented occupations are Education, Arts & Media (100.0%), Legal Services & Support (100.0%), and Health Diagnosing & Treating (88.2%).
| Occupation | Male | Female |
| Management | 47 (60.3%) | 31 (39.7%) |
| Business & Financial | 18 (85.7%) | 3 (14.3%) |
| Computers, Engineering & Science | 21 (100.0%) | 0 (0.0%) |
| Computers & Mathematics | 3 (100.0%) | 0 (0.0%) |
| Architecture & Engineering | 18 (100.0%) | 0 (0.0%) |
| Life, Physical & Social Science | 0 (0.0%) | 0 (0.0%) |
| Community & Social Service | 30 (61.2%) | 19 (38.8%) |
| Education, Arts & Media | 0 (0.0%) | 2 (100.0%) |
| Legal Services & Support | 0 (0.0%) | 6 (100.0%) |
| Education Instruction & Library | 22 (66.7%) | 11 (33.3%) |
| Arts, Media & Entertainment | 8 (100.0%) | 0 (0.0%) |
| Health Diagnosing & Treating | 4 (11.8%) | 30 (88.2%) |
| Health Technologists | 4 (17.4%) | 19 (82.6%) |
| Total (Category) | 120 (59.1%) | 83 (40.9%) |
| Total (Overall) | 311 (60.2%) | 206 (39.9%) |
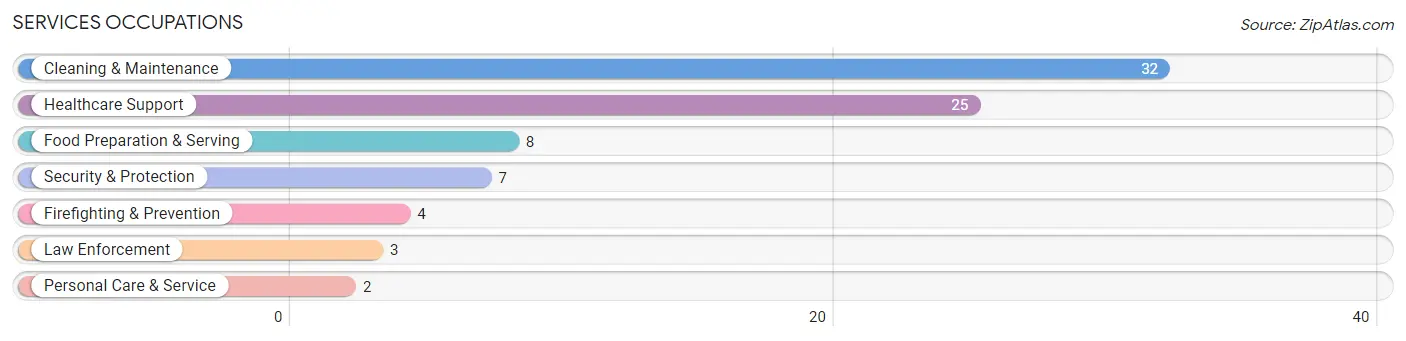
Services Occupations
The most common Services occupations in Clarksville are Cleaning & Maintenance (32 | 6.2%), Healthcare Support (25 | 4.8%), Food Preparation & Serving (8 | 1.5%), Security & Protection (7 | 1.3%), and Firefighting & Prevention (4 | 0.8%).
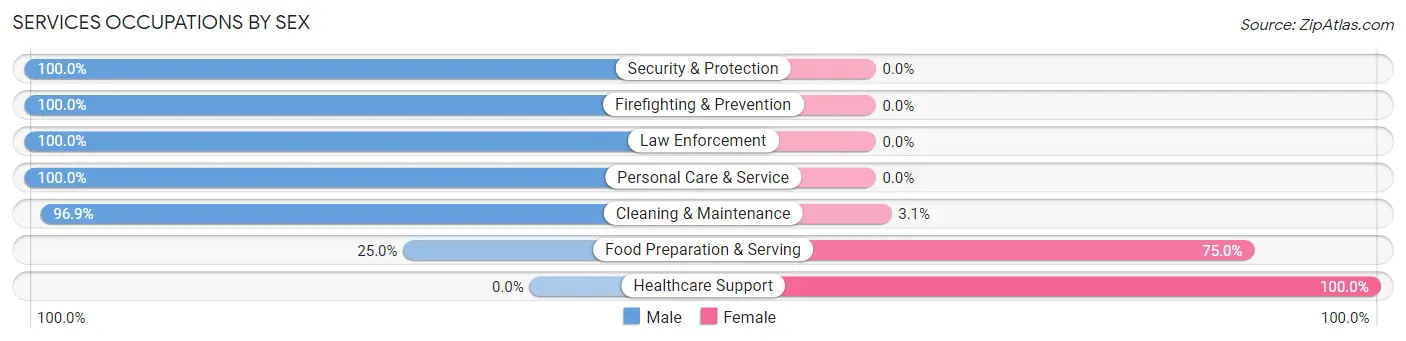
Services Occupations by Sex
Within the Services occupations in Clarksville, the most male-oriented occupations are Security & Protection (100.0%), Firefighting & Prevention (100.0%), and Law Enforcement (100.0%), while the most female-oriented occupations are Healthcare Support (100.0%), Food Preparation & Serving (75.0%), and Cleaning & Maintenance (3.1%).
| Occupation | Male | Female |
| Healthcare Support | 0 (0.0%) | 25 (100.0%) |
| Security & Protection | 7 (100.0%) | 0 (0.0%) |
| Firefighting & Prevention | 4 (100.0%) | 0 (0.0%) |
| Law Enforcement | 3 (100.0%) | 0 (0.0%) |
| Food Preparation & Serving | 2 (25.0%) | 6 (75.0%) |
| Cleaning & Maintenance | 31 (96.9%) | 1 (3.1%) |
| Personal Care & Service | 2 (100.0%) | 0 (0.0%) |
| Total (Category) | 42 (56.8%) | 32 (43.2%) |
| Total (Overall) | 311 (60.2%) | 206 (39.9%) |
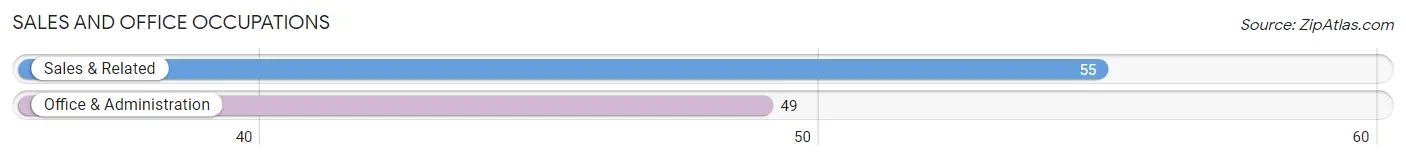
Sales and Office Occupations
The most common Sales and Office occupations in Clarksville are Sales & Related (55 | 10.6%), and Office & Administration (49 | 9.5%).
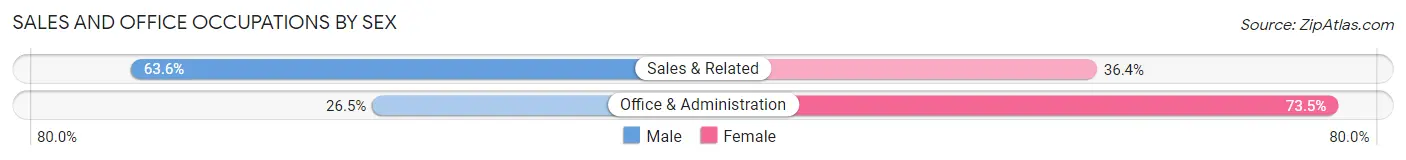
Sales and Office Occupations by Sex
| Occupation | Male | Female |
| Sales & Related | 35 (63.6%) | 20 (36.4%) |
| Office & Administration | 13 (26.5%) | 36 (73.5%) |
| Total (Category) | 48 (46.2%) | 56 (53.8%) |
| Total (Overall) | 311 (60.2%) | 206 (39.9%) |
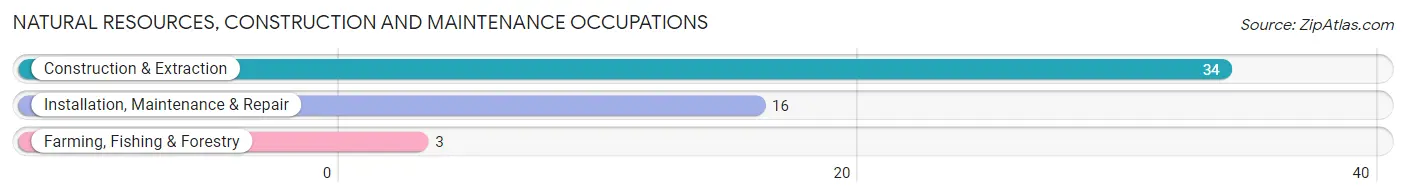
Natural Resources, Construction and Maintenance Occupations
The most common Natural Resources, Construction and Maintenance occupations in Clarksville are Construction & Extraction (34 | 6.6%), Installation, Maintenance & Repair (16 | 3.1%), and Farming, Fishing & Forestry (3 | 0.6%).
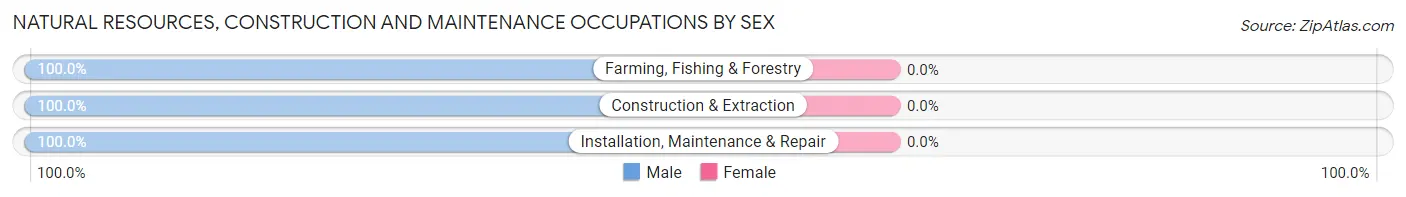
Natural Resources, Construction and Maintenance Occupations by Sex
| Occupation | Male | Female |
| Farming, Fishing & Forestry | 3 (100.0%) | 0 (0.0%) |
| Construction & Extraction | 34 (100.0%) | 0 (0.0%) |
| Installation, Maintenance & Repair | 16 (100.0%) | 0 (0.0%) |
| Total (Category) | 53 (100.0%) | 0 (0.0%) |
| Total (Overall) | 311 (60.2%) | 206 (39.9%) |
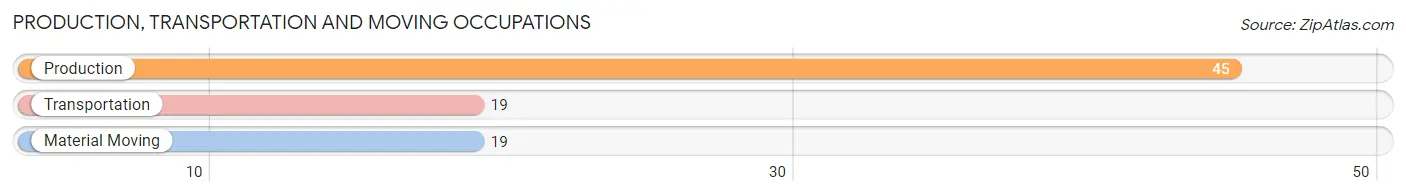
Production, Transportation and Moving Occupations
The most common Production, Transportation and Moving occupations in Clarksville are Production (45 | 8.7%), Transportation (19 | 3.7%), and Material Moving (19 | 3.7%).
Production, Transportation and Moving Occupations by Sex
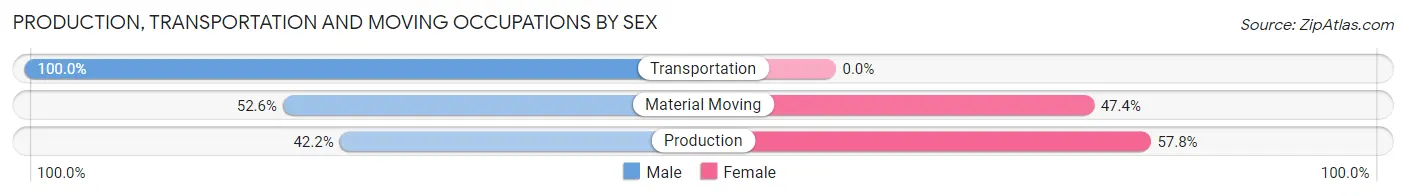
| Occupation | Male | Female |
| Production | 19 (42.2%) | 26 (57.8%) |
| Transportation | 19 (100.0%) | 0 (0.0%) |
| Material Moving | 10 (52.6%) | 9 (47.4%) |
| Total (Category) | 48 (57.8%) | 35 (42.2%) |
| Total (Overall) | 311 (60.2%) | 206 (39.9%) |
Employment Industries by Sex in Clarksville
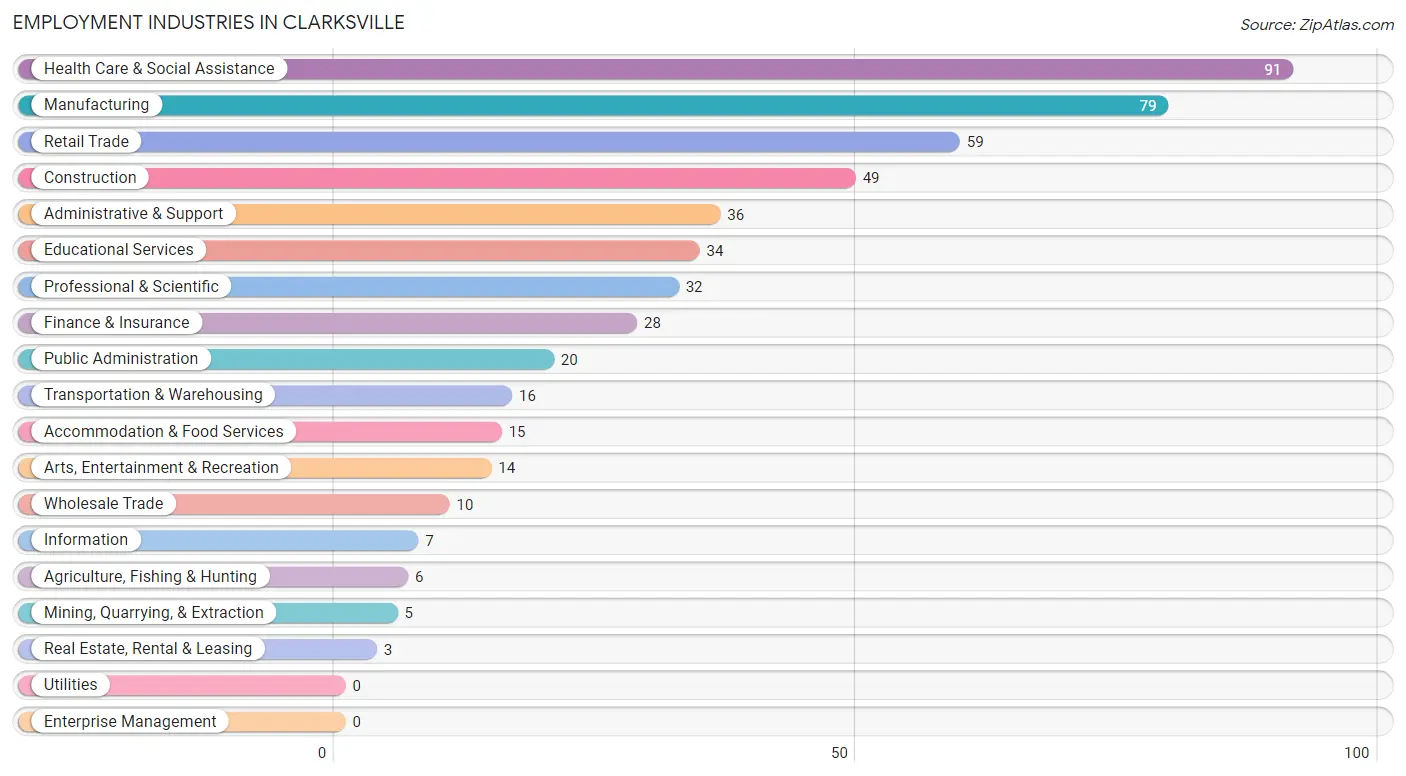
Employment Industries in Clarksville
The major employment industries in Clarksville include Health Care & Social Assistance (91 | 17.6%), Manufacturing (79 | 15.3%), Retail Trade (59 | 11.4%), Construction (49 | 9.5%), and Administrative & Support (36 | 7.0%).
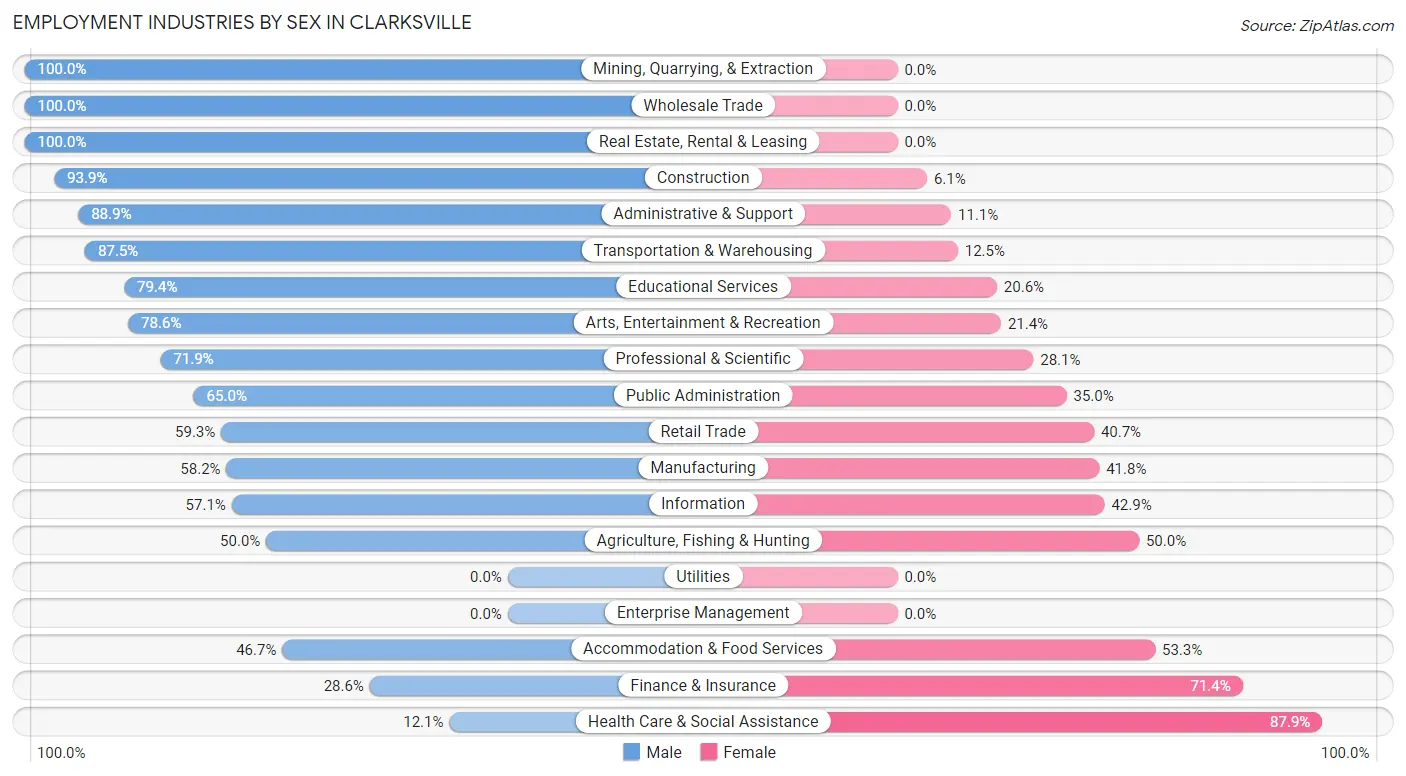
Employment Industries by Sex in Clarksville
The Clarksville industries that see more men than women are Mining, Quarrying, & Extraction (100.0%), Wholesale Trade (100.0%), and Real Estate, Rental & Leasing (100.0%), whereas the industries that tend to have a higher number of women are Health Care & Social Assistance (87.9%), Finance & Insurance (71.4%), and Accommodation & Food Services (53.3%).
| Industry | Male | Female |
| Agriculture, Fishing & Hunting | 3 (50.0%) | 3 (50.0%) |
| Mining, Quarrying, & Extraction | 5 (100.0%) | 0 (0.0%) |
| Construction | 46 (93.9%) | 3 (6.1%) |
| Manufacturing | 46 (58.2%) | 33 (41.8%) |
| Wholesale Trade | 10 (100.0%) | 0 (0.0%) |
| Retail Trade | 35 (59.3%) | 24 (40.7%) |
| Transportation & Warehousing | 14 (87.5%) | 2 (12.5%) |
| Utilities | 0 (0.0%) | 0 (0.0%) |
| Information | 4 (57.1%) | 3 (42.9%) |
| Finance & Insurance | 8 (28.6%) | 20 (71.4%) |
| Real Estate, Rental & Leasing | 3 (100.0%) | 0 (0.0%) |
| Professional & Scientific | 23 (71.9%) | 9 (28.1%) |
| Enterprise Management | 0 (0.0%) | 0 (0.0%) |
| Administrative & Support | 32 (88.9%) | 4 (11.1%) |
| Educational Services | 27 (79.4%) | 7 (20.6%) |
| Health Care & Social Assistance | 11 (12.1%) | 80 (87.9%) |
| Arts, Entertainment & Recreation | 11 (78.6%) | 3 (21.4%) |
| Accommodation & Food Services | 7 (46.7%) | 8 (53.3%) |
| Public Administration | 13 (65.0%) | 7 (35.0%) |
| Total | 311 (60.2%) | 206 (39.9%) |
Education in Clarksville
School Enrollment in Clarksville
The most common levels of schooling among the 340 students in Clarksville are middle school (127 | 37.3%), elementary school (75 | 22.1%), and high school (62 | 18.2%).
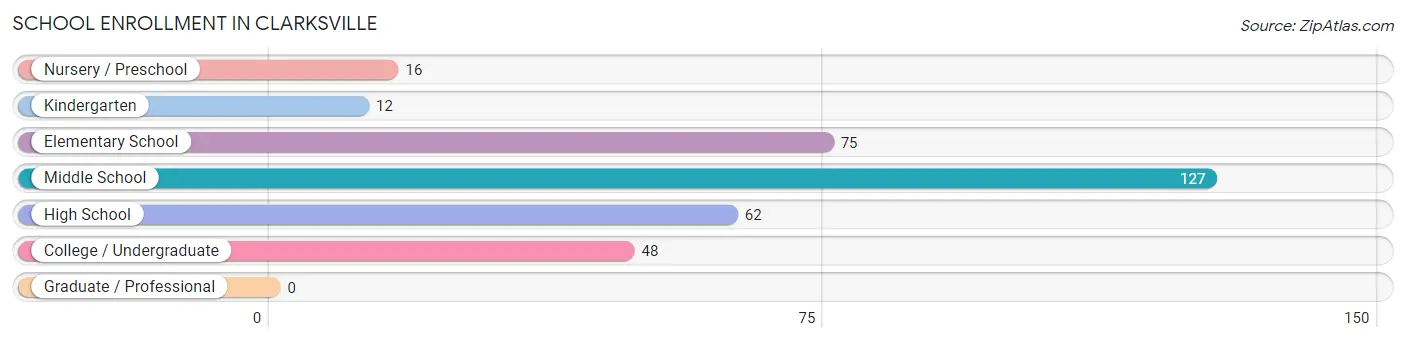
| School Level | # Students | % Students |
| Nursery / Preschool | 16 | 4.7% |
| Kindergarten | 12 | 3.5% |
| Elementary School | 75 | 22.1% |
| Middle School | 127 | 37.3% |
| High School | 62 | 18.2% |
| College / Undergraduate | 48 | 14.1% |
| Graduate / Professional | 0 | 0.0% |
| Total | 340 | 100.0% |
School Enrollment by Age by Funding Source in Clarksville
Out of a total of 340 students who are enrolled in schools in Clarksville, 54 (15.9%) attend a private institution, while the remaining 286 (84.1%) are enrolled in public schools. The age group of 18 to 19 year olds has the highest likelihood of being enrolled in private schools, with 3 (100.0% in the age bracket) enrolled. Conversely, the age group of 3 to 4 year olds has the lowest likelihood of being enrolled in a private school, with 4 (100.0% in the age bracket) attending a public institution.
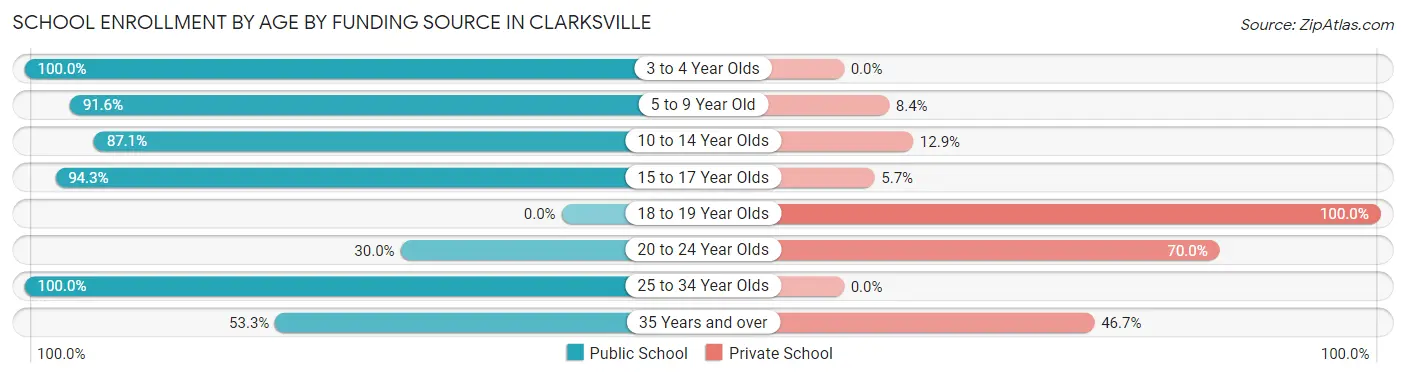
| Age Bracket | Public School | Private School |
| 3 to 4 Year Olds | 4 (100.0%) | 0 (0.0%) |
| 5 to 9 Year Old | 87 (91.6%) | 8 (8.4%) |
| 10 to 14 Year Olds | 135 (87.1%) | 20 (12.9%) |
| 15 to 17 Year Olds | 33 (94.3%) | 2 (5.7%) |
| 18 to 19 Year Olds | 0 (0.0%) | 3 (100.0%) |
| 20 to 24 Year Olds | 6 (30.0%) | 14 (70.0%) |
| 25 to 34 Year Olds | 13 (100.0%) | 0 (0.0%) |
| 35 Years and over | 8 (53.3%) | 7 (46.7%) |
| Total | 286 (84.1%) | 54 (15.9%) |
Educational Attainment by Field of Study in Clarksville
Education (77 | 19.9%), social sciences (66 | 17.0%), business (55 | 14.2%), science & technology (42 | 10.8%), and computers & mathematics (28 | 7.2%) are the most common fields of study among 388 individuals in Clarksville who have obtained a bachelor's degree or higher.
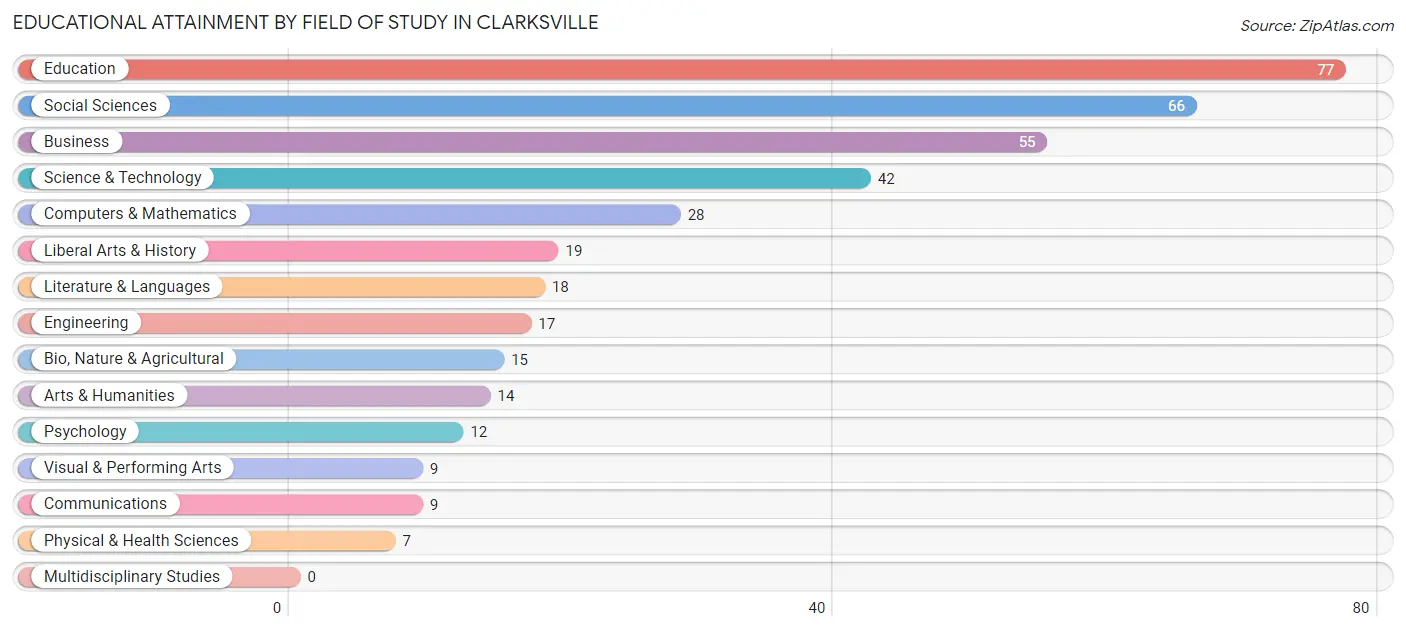
| Field of Study | # Graduates | % Graduates |
| Computers & Mathematics | 28 | 7.2% |
| Bio, Nature & Agricultural | 15 | 3.9% |
| Physical & Health Sciences | 7 | 1.8% |
| Psychology | 12 | 3.1% |
| Social Sciences | 66 | 17.0% |
| Engineering | 17 | 4.4% |
| Multidisciplinary Studies | 0 | 0.0% |
| Science & Technology | 42 | 10.8% |
| Business | 55 | 14.2% |
| Education | 77 | 19.9% |
| Literature & Languages | 18 | 4.6% |
| Liberal Arts & History | 19 | 4.9% |
| Visual & Performing Arts | 9 | 2.3% |
| Communications | 9 | 2.3% |
| Arts & Humanities | 14 | 3.6% |
| Total | 388 | 100.0% |
Transportation & Commute in Clarksville
Vehicle Availability by Sex in Clarksville
The most prevalent vehicle ownership categories in Clarksville are males with 2 vehicles (171, accounting for 55.0%) and females with 2 vehicles (70, making up 83.0%).
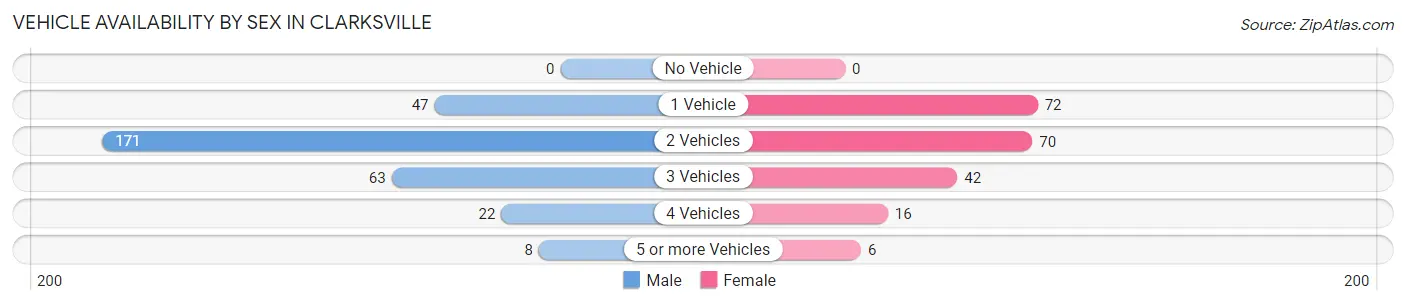
| Vehicles Available | Male | Female |
| No Vehicle | 0 (0.0%) | 0 (0.0%) |
| 1 Vehicle | 47 (15.1%) | 72 (34.9%) |
| 2 Vehicles | 171 (55.0%) | 70 (34.0%) |
| 3 Vehicles | 63 (20.3%) | 42 (20.4%) |
| 4 Vehicles | 22 (7.1%) | 16 (7.8%) |
| 5 or more Vehicles | 8 (2.6%) | 6 (2.9%) |
| Total | 311 (100.0%) | 206 (100.0%) |
Commute Time in Clarksville
The most frequently occuring commute durations in Clarksville are 5 to 9 minutes (136 commuters, 29.8%), 30 to 34 minutes (74 commuters, 16.2%), and 45 to 59 minutes (60 commuters, 13.2%).
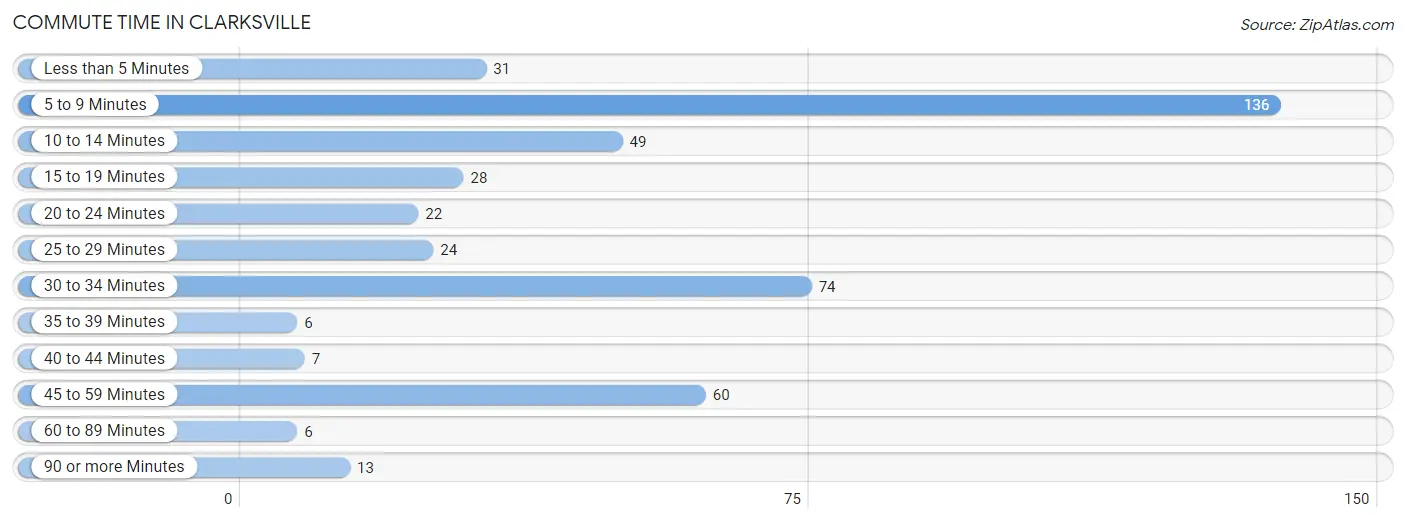
| Commute Time | # Commuters | % Commuters |
| Less than 5 Minutes | 31 | 6.8% |
| 5 to 9 Minutes | 136 | 29.8% |
| 10 to 14 Minutes | 49 | 10.7% |
| 15 to 19 Minutes | 28 | 6.1% |
| 20 to 24 Minutes | 22 | 4.8% |
| 25 to 29 Minutes | 24 | 5.3% |
| 30 to 34 Minutes | 74 | 16.2% |
| 35 to 39 Minutes | 6 | 1.3% |
| 40 to 44 Minutes | 7 | 1.5% |
| 45 to 59 Minutes | 60 | 13.2% |
| 60 to 89 Minutes | 6 | 1.3% |
| 90 or more Minutes | 13 | 2.9% |
Commute Time by Sex in Clarksville
The most common commute times in Clarksville are 5 to 9 minutes (92 commuters, 32.4%) for males and 30 to 34 minutes (45 commuters, 26.2%) for females.
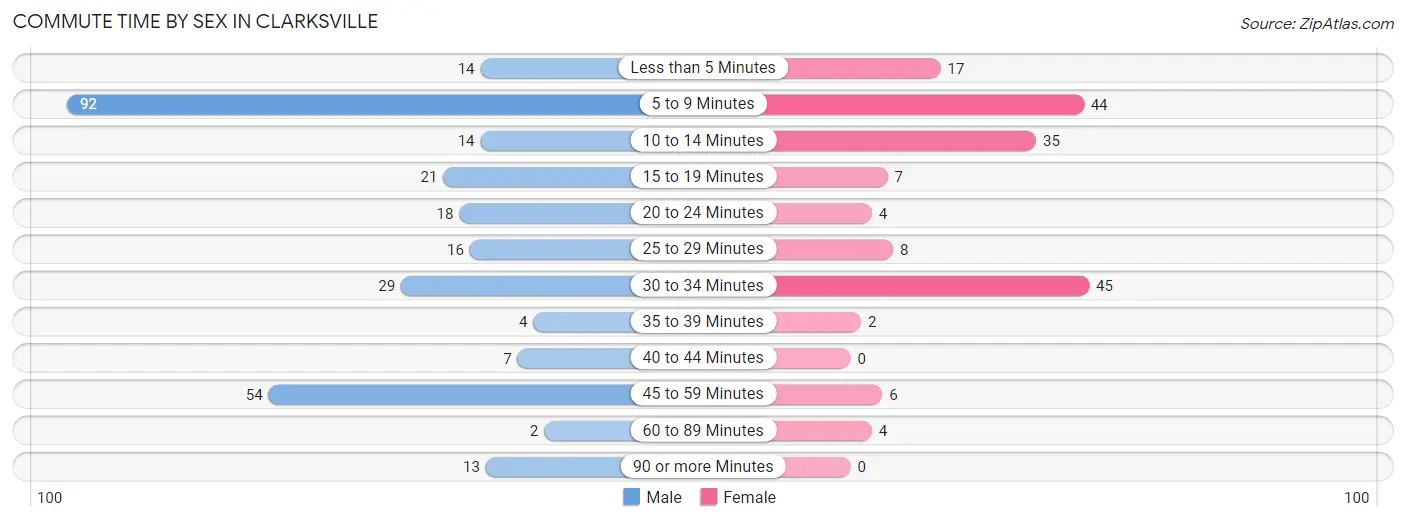
| Commute Time | Male | Female |
| Less than 5 Minutes | 14 (4.9%) | 17 (9.9%) |
| 5 to 9 Minutes | 92 (32.4%) | 44 (25.6%) |
| 10 to 14 Minutes | 14 (4.9%) | 35 (20.3%) |
| 15 to 19 Minutes | 21 (7.4%) | 7 (4.1%) |
| 20 to 24 Minutes | 18 (6.3%) | 4 (2.3%) |
| 25 to 29 Minutes | 16 (5.6%) | 8 (4.6%) |
| 30 to 34 Minutes | 29 (10.2%) | 45 (26.2%) |
| 35 to 39 Minutes | 4 (1.4%) | 2 (1.2%) |
| 40 to 44 Minutes | 7 (2.5%) | 0 (0.0%) |
| 45 to 59 Minutes | 54 (19.0%) | 6 (3.5%) |
| 60 to 89 Minutes | 2 (0.7%) | 4 (2.3%) |
| 90 or more Minutes | 13 (4.6%) | 0 (0.0%) |
Time of Departure to Work by Sex in Clarksville
The most frequent times of departure to work in Clarksville are 11:00 AM to 11:59 AM (41, 14.4%) for males and 8:00 AM to 8:29 AM (30, 17.4%) for females.
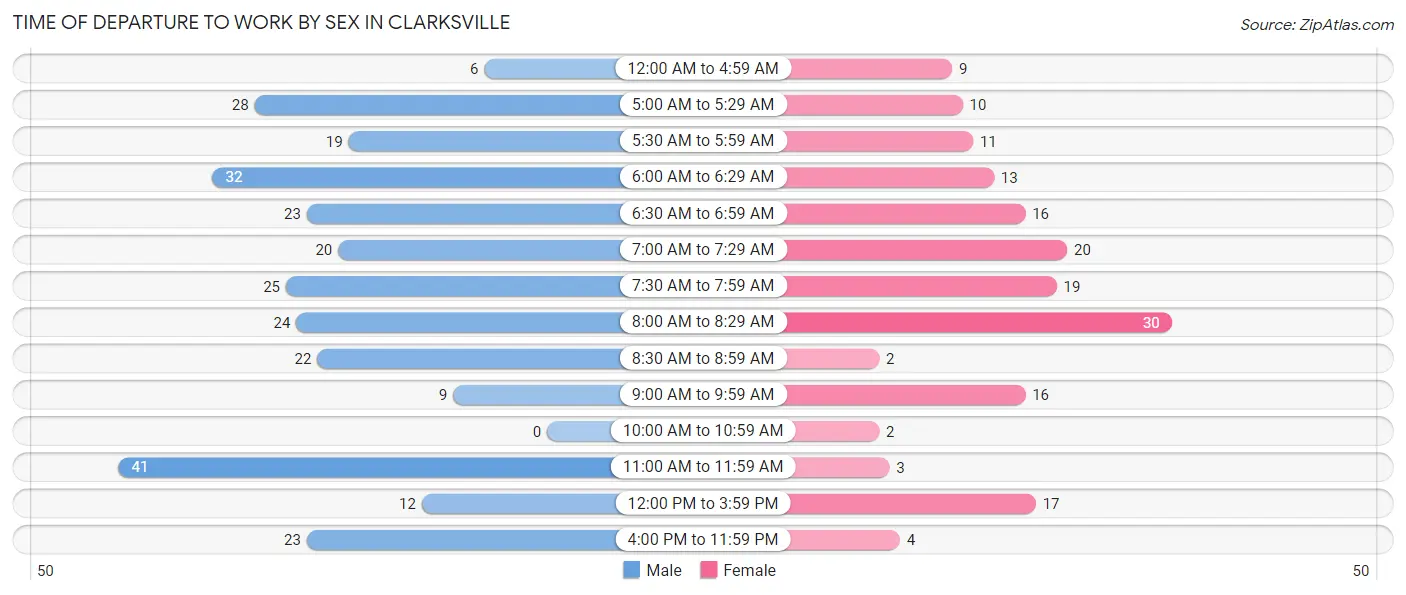
| Time of Departure | Male | Female |
| 12:00 AM to 4:59 AM | 6 (2.1%) | 9 (5.2%) |
| 5:00 AM to 5:29 AM | 28 (9.9%) | 10 (5.8%) |
| 5:30 AM to 5:59 AM | 19 (6.7%) | 11 (6.4%) |
| 6:00 AM to 6:29 AM | 32 (11.3%) | 13 (7.6%) |
| 6:30 AM to 6:59 AM | 23 (8.1%) | 16 (9.3%) |
| 7:00 AM to 7:29 AM | 20 (7.0%) | 20 (11.6%) |
| 7:30 AM to 7:59 AM | 25 (8.8%) | 19 (11.1%) |
| 8:00 AM to 8:29 AM | 24 (8.5%) | 30 (17.4%) |
| 8:30 AM to 8:59 AM | 22 (7.7%) | 2 (1.2%) |
| 9:00 AM to 9:59 AM | 9 (3.2%) | 16 (9.3%) |
| 10:00 AM to 10:59 AM | 0 (0.0%) | 2 (1.2%) |
| 11:00 AM to 11:59 AM | 41 (14.4%) | 3 (1.7%) |
| 12:00 PM to 3:59 PM | 12 (4.2%) | 17 (9.9%) |
| 4:00 PM to 11:59 PM | 23 (8.1%) | 4 (2.3%) |
| Total | 284 (100.0%) | 172 (100.0%) |
Housing Occupancy in Clarksville
Occupancy by Ownership in Clarksville
Of the total 759 dwellings in Clarksville, owner-occupied units account for 539 (71.0%), while renter-occupied units make up 220 (29.0%).
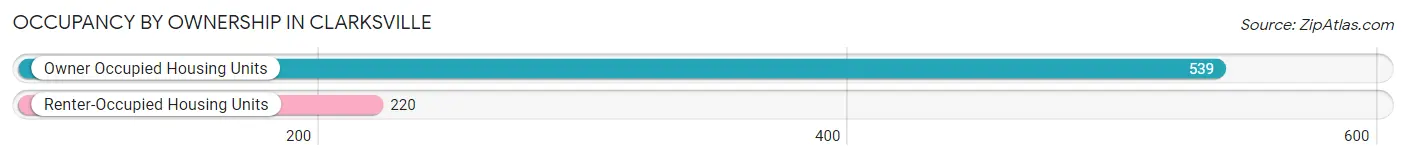
| Occupancy | # Housing Units | % Housing Units |
| Owner Occupied Housing Units | 539 | 71.0% |
| Renter-Occupied Housing Units | 220 | 29.0% |
| Total Occupied Housing Units | 759 | 100.0% |
Occupancy by Household Size in Clarksville
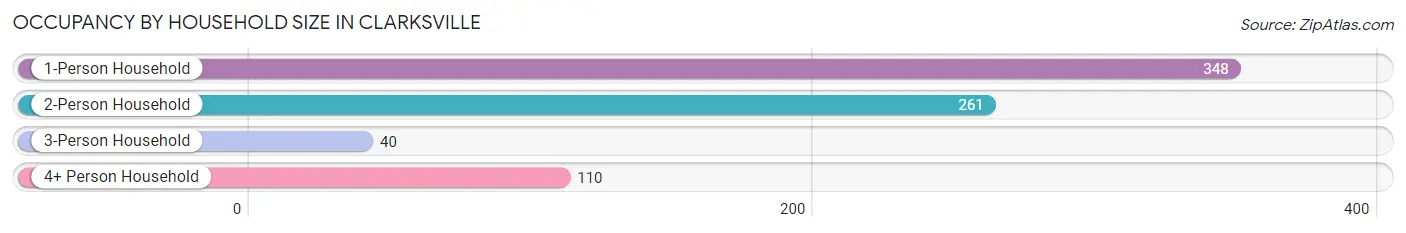
| Household Size | # Housing Units | % Housing Units |
| 1-Person Household | 348 | 45.9% |
| 2-Person Household | 261 | 34.4% |
| 3-Person Household | 40 | 5.3% |
| 4+ Person Household | 110 | 14.5% |
| Total Housing Units | 759 | 100.0% |
Occupancy by Ownership by Household Size in Clarksville
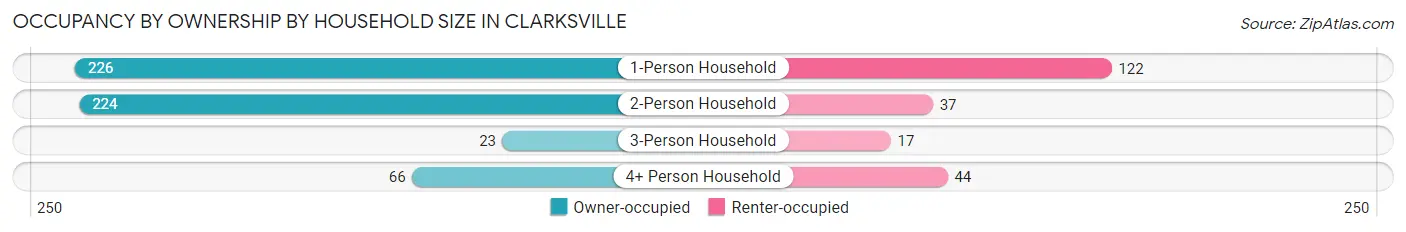
| Household Size | Owner-occupied | Renter-occupied |
| 1-Person Household | 226 (64.9%) | 122 (35.1%) |
| 2-Person Household | 224 (85.8%) | 37 (14.2%) |
| 3-Person Household | 23 (57.5%) | 17 (42.5%) |
| 4+ Person Household | 66 (60.0%) | 44 (40.0%) |
| Total Housing Units | 539 (71.0%) | 220 (29.0%) |
Occupancy by Educational Attainment in Clarksville
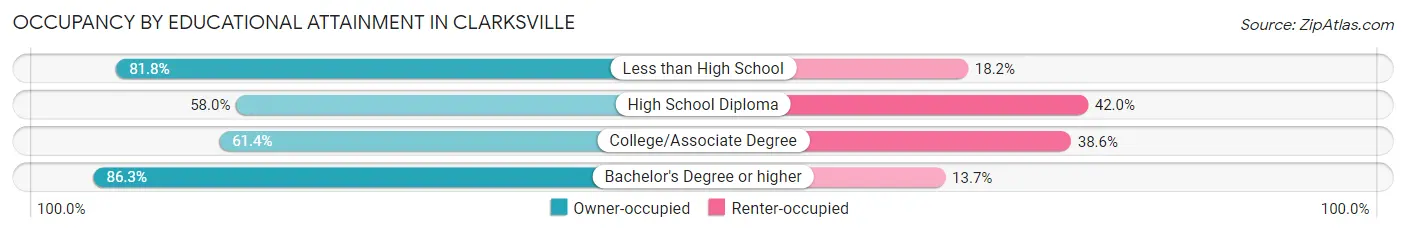
| Household Size | Owner-occupied | Renter-occupied |
| Less than High School | 27 (81.8%) | 6 (18.2%) |
| High School Diploma | 83 (58.0%) | 60 (42.0%) |
| College/Associate Degree | 183 (61.4%) | 115 (38.6%) |
| Bachelor's Degree or higher | 246 (86.3%) | 39 (13.7%) |
Occupancy by Age of Householder in Clarksville
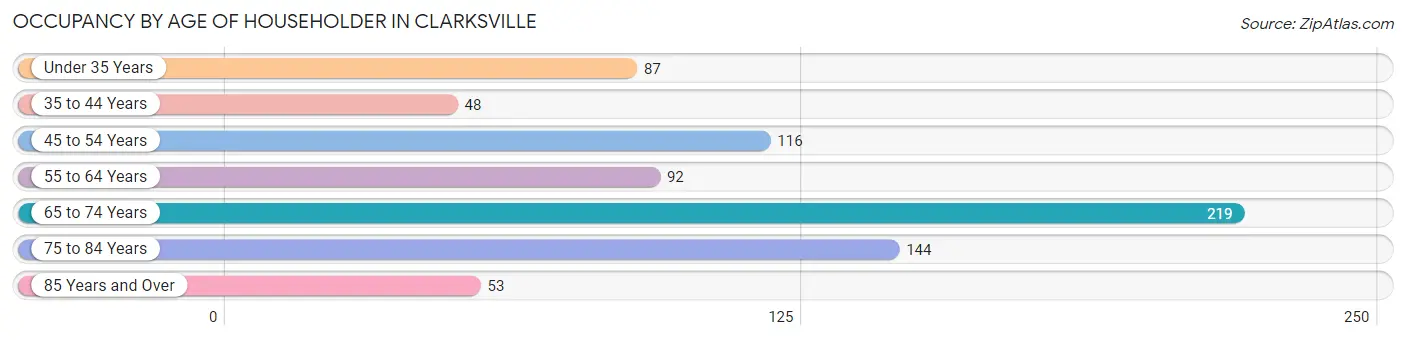
| Age Bracket | # Households | % Households |
| Under 35 Years | 87 | 11.5% |
| 35 to 44 Years | 48 | 6.3% |
| 45 to 54 Years | 116 | 15.3% |
| 55 to 64 Years | 92 | 12.1% |
| 65 to 74 Years | 219 | 28.8% |
| 75 to 84 Years | 144 | 19.0% |
| 85 Years and Over | 53 | 7.0% |
| Total | 759 | 100.0% |
Housing Finances in Clarksville
Median Income by Occupancy in Clarksville
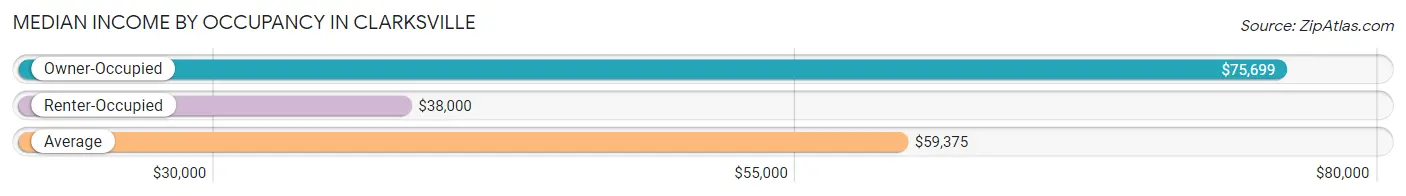
| Occupancy Type | # Households | Median Income |
| Owner-Occupied | 539 (71.0%) | $75,699 |
| Renter-Occupied | 220 (29.0%) | $38,000 |
| Average | 759 (100.0%) | $59,375 |
Occupancy by Householder Income Bracket in Clarksville
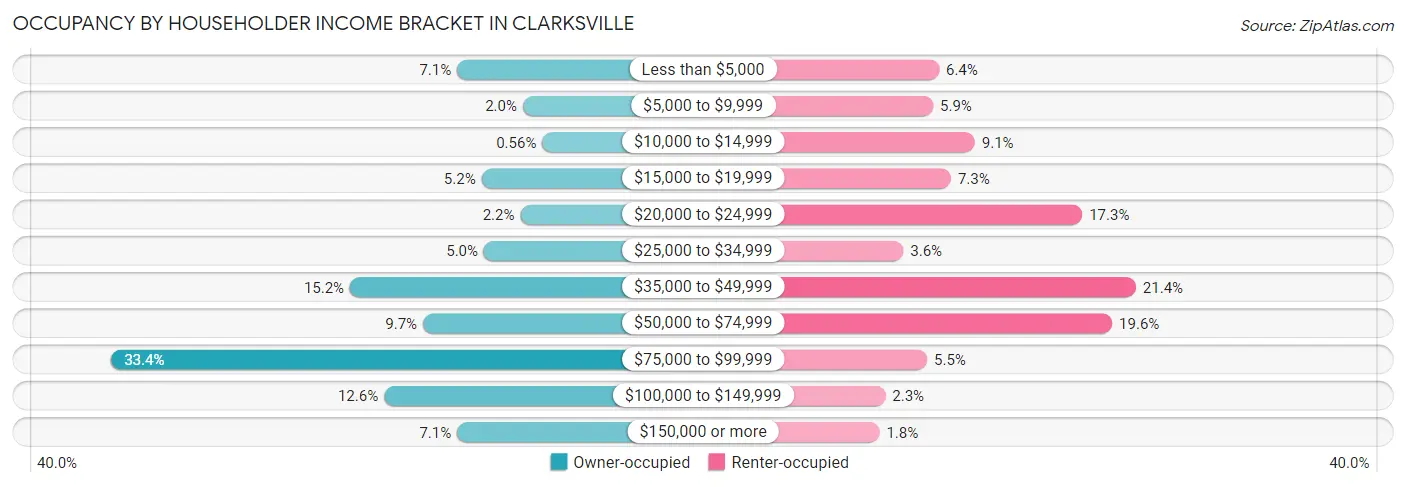
| Income Bracket | Owner-occupied | Renter-occupied |
| Less than $5,000 | 38 (7.0%) | 14 (6.4%) |
| $5,000 to $9,999 | 11 (2.0%) | 13 (5.9%) |
| $10,000 to $14,999 | 3 (0.6%) | 20 (9.1%) |
| $15,000 to $19,999 | 28 (5.2%) | 16 (7.3%) |
| $20,000 to $24,999 | 12 (2.2%) | 38 (17.3%) |
| $25,000 to $34,999 | 27 (5.0%) | 8 (3.6%) |
| $35,000 to $49,999 | 82 (15.2%) | 47 (21.4%) |
| $50,000 to $74,999 | 52 (9.7%) | 43 (19.6%) |
| $75,000 to $99,999 | 180 (33.4%) | 12 (5.4%) |
| $100,000 to $149,999 | 68 (12.6%) | 5 (2.3%) |
| $150,000 or more | 38 (7.0%) | 4 (1.8%) |
| Total | 539 (100.0%) | 220 (100.0%) |
Monthly Housing Cost Tiers in Clarksville
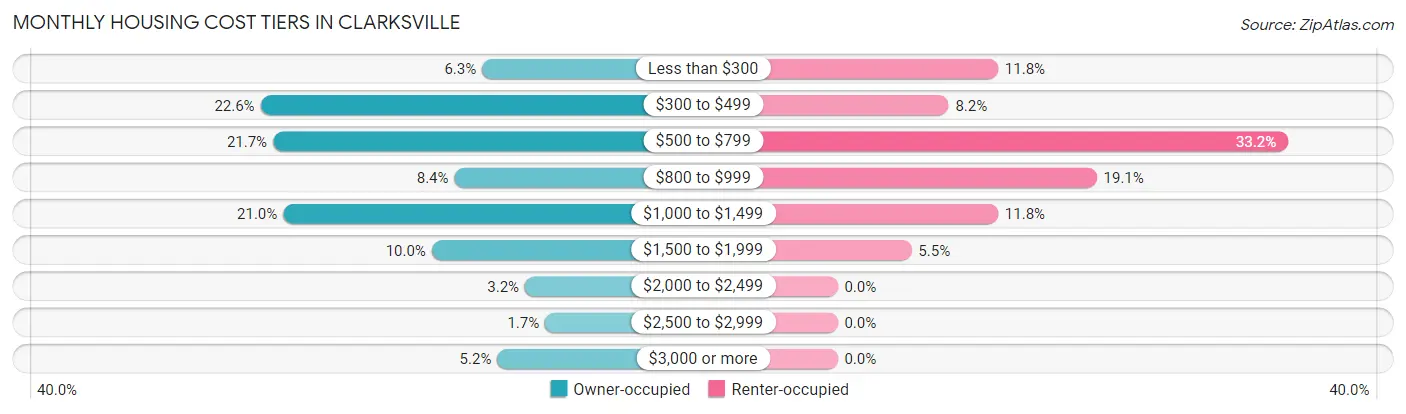
| Monthly Cost | Owner-occupied | Renter-occupied |
| Less than $300 | 34 (6.3%) | 26 (11.8%) |
| $300 to $499 | 122 (22.6%) | 18 (8.2%) |
| $500 to $799 | 117 (21.7%) | 73 (33.2%) |
| $800 to $999 | 45 (8.4%) | 42 (19.1%) |
| $1,000 to $1,499 | 113 (21.0%) | 26 (11.8%) |
| $1,500 to $1,999 | 54 (10.0%) | 12 (5.4%) |
| $2,000 to $2,499 | 17 (3.2%) | 0 (0.0%) |
| $2,500 to $2,999 | 9 (1.7%) | 0 (0.0%) |
| $3,000 or more | 28 (5.2%) | 0 (0.0%) |
| Total | 539 (100.0%) | 220 (100.0%) |
Physical Housing Characteristics in Clarksville
Housing Structures in Clarksville
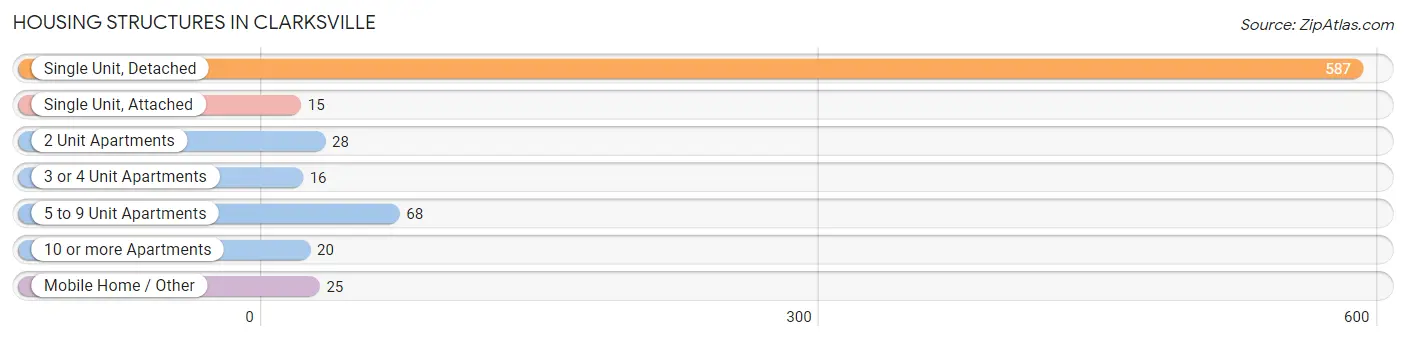
| Structure Type | # Housing Units | % Housing Units |
| Single Unit, Detached | 587 | 77.3% |
| Single Unit, Attached | 15 | 2.0% |
| 2 Unit Apartments | 28 | 3.7% |
| 3 or 4 Unit Apartments | 16 | 2.1% |
| 5 to 9 Unit Apartments | 68 | 9.0% |
| 10 or more Apartments | 20 | 2.6% |
| Mobile Home / Other | 25 | 3.3% |
| Total | 759 | 100.0% |
Housing Structures by Occupancy in Clarksville
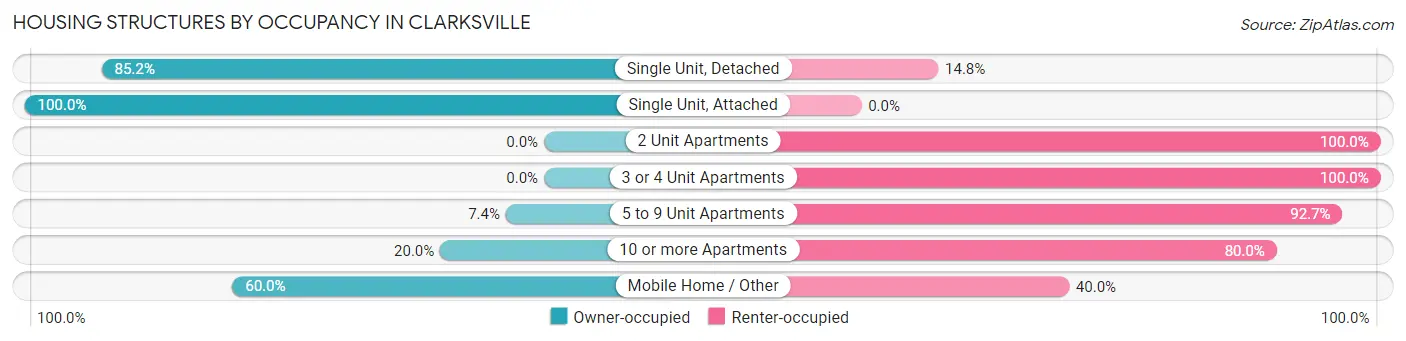
| Structure Type | Owner-occupied | Renter-occupied |
| Single Unit, Detached | 500 (85.2%) | 87 (14.8%) |
| Single Unit, Attached | 15 (100.0%) | 0 (0.0%) |
| 2 Unit Apartments | 0 (0.0%) | 28 (100.0%) |
| 3 or 4 Unit Apartments | 0 (0.0%) | 16 (100.0%) |
| 5 to 9 Unit Apartments | 5 (7.3%) | 63 (92.6%) |
| 10 or more Apartments | 4 (20.0%) | 16 (80.0%) |
| Mobile Home / Other | 15 (60.0%) | 10 (40.0%) |
| Total | 539 (71.0%) | 220 (29.0%) |
Housing Structures by Number of Rooms in Clarksville
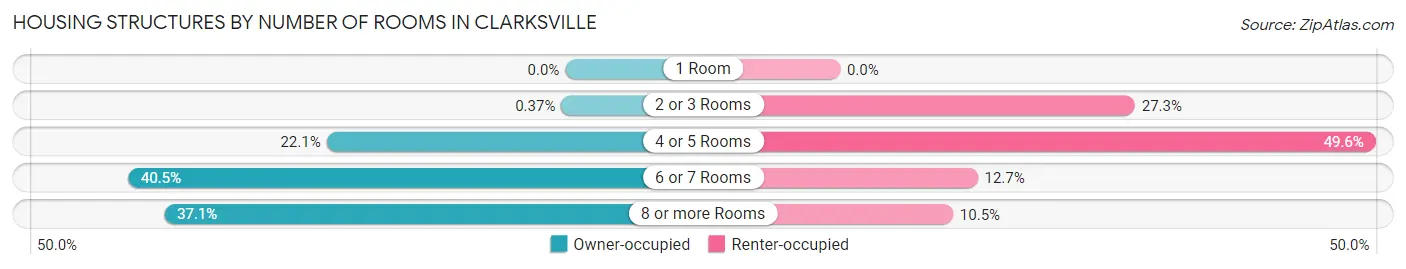
| Number of Rooms | Owner-occupied | Renter-occupied |
| 1 Room | 0 (0.0%) | 0 (0.0%) |
| 2 or 3 Rooms | 2 (0.4%) | 60 (27.3%) |
| 4 or 5 Rooms | 119 (22.1%) | 109 (49.5%) |
| 6 or 7 Rooms | 218 (40.5%) | 28 (12.7%) |
| 8 or more Rooms | 200 (37.1%) | 23 (10.4%) |
| Total | 539 (100.0%) | 220 (100.0%) |
Housing Structure by Heating Type in Clarksville
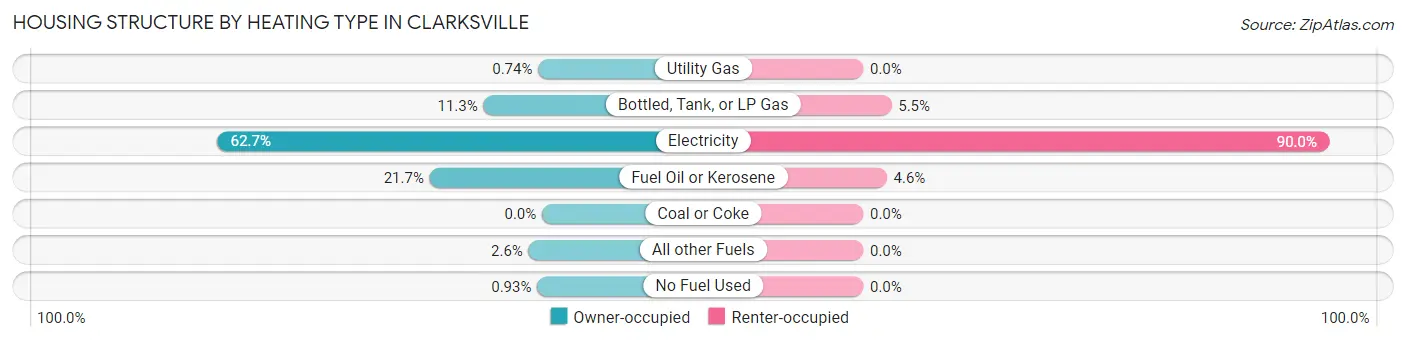
| Heating Type | Owner-occupied | Renter-occupied |
| Utility Gas | 4 (0.7%) | 0 (0.0%) |
| Bottled, Tank, or LP Gas | 61 (11.3%) | 12 (5.4%) |
| Electricity | 338 (62.7%) | 198 (90.0%) |
| Fuel Oil or Kerosene | 117 (21.7%) | 10 (4.5%) |
| Coal or Coke | 0 (0.0%) | 0 (0.0%) |
| All other Fuels | 14 (2.6%) | 0 (0.0%) |
| No Fuel Used | 5 (0.9%) | 0 (0.0%) |
| Total | 539 (100.0%) | 220 (100.0%) |
Household Vehicle Usage in Clarksville
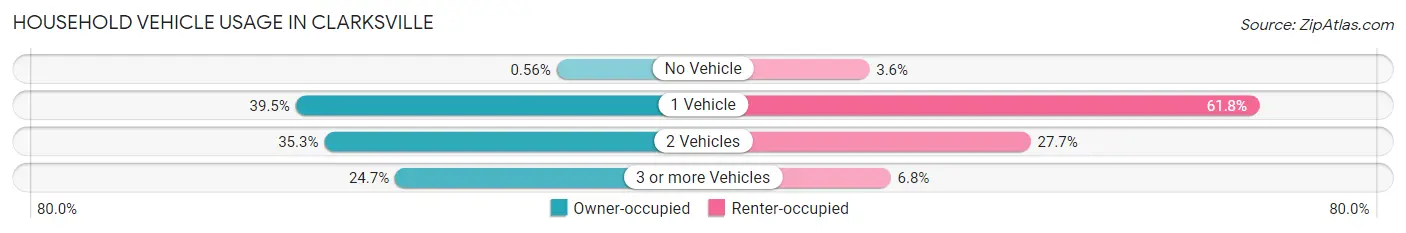
| Vehicles per Household | Owner-occupied | Renter-occupied |
| No Vehicle | 3 (0.6%) | 8 (3.6%) |
| 1 Vehicle | 213 (39.5%) | 136 (61.8%) |
| 2 Vehicles | 190 (35.2%) | 61 (27.7%) |
| 3 or more Vehicles | 133 (24.7%) | 15 (6.8%) |
| Total | 539 (100.0%) | 220 (100.0%) |
Real Estate & Mortgages in Clarksville
Real Estate and Mortgage Overview in Clarksville
| Characteristic | Without Mortgage | With Mortgage |
| Housing Units | 317 | 222 |
| Median Property Value | $189,800 | $183,300 |
| Median Household Income | $61,750 | $19 |
| Monthly Housing Costs | $509 | $11 |
| Real Estate Taxes | $1,332 | $0 |
Property Value by Mortgage Status in Clarksville
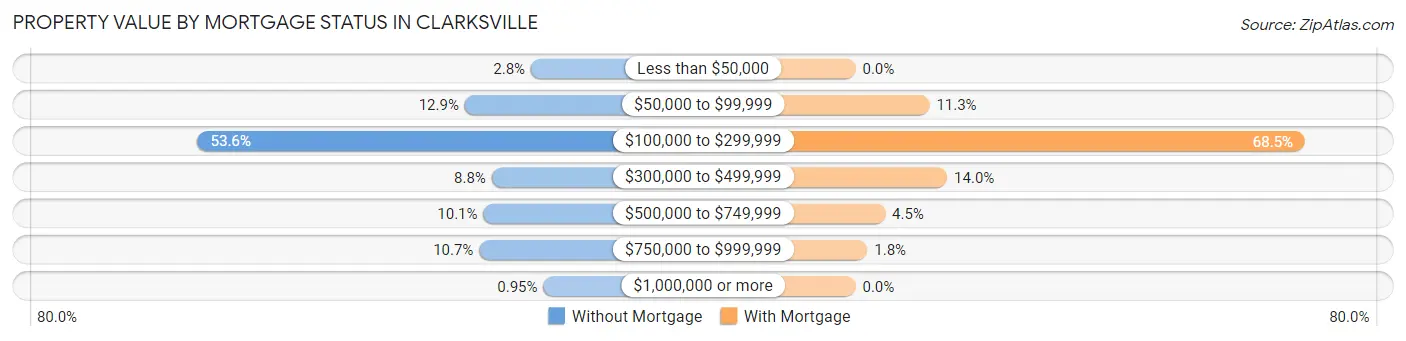
| Property Value | Without Mortgage | With Mortgage |
| Less than $50,000 | 9 (2.8%) | 0 (0.0%) |
| $50,000 to $99,999 | 41 (12.9%) | 25 (11.3%) |
| $100,000 to $299,999 | 170 (53.6%) | 152 (68.5%) |
| $300,000 to $499,999 | 28 (8.8%) | 31 (14.0%) |
| $500,000 to $749,999 | 32 (10.1%) | 10 (4.5%) |
| $750,000 to $999,999 | 34 (10.7%) | 4 (1.8%) |
| $1,000,000 or more | 3 (0.9%) | 0 (0.0%) |
| Total | 317 (100.0%) | 222 (100.0%) |
Household Income by Mortgage Status in Clarksville
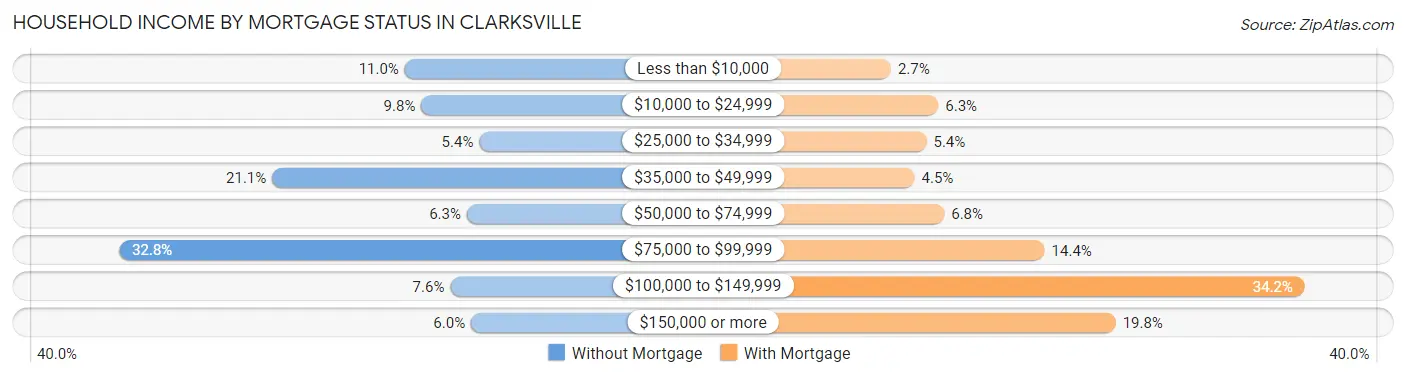
| Household Income | Without Mortgage | With Mortgage |
| Less than $10,000 | 35 (11.0%) | 6 (2.7%) |
| $10,000 to $24,999 | 31 (9.8%) | 14 (6.3%) |
| $25,000 to $34,999 | 17 (5.4%) | 12 (5.4%) |
| $35,000 to $49,999 | 67 (21.1%) | 10 (4.5%) |
| $50,000 to $74,999 | 20 (6.3%) | 15 (6.8%) |
| $75,000 to $99,999 | 104 (32.8%) | 32 (14.4%) |
| $100,000 to $149,999 | 24 (7.6%) | 76 (34.2%) |
| $150,000 or more | 19 (6.0%) | 44 (19.8%) |
| Total | 317 (100.0%) | 222 (100.0%) |
Property Value to Household Income Ratio in Clarksville
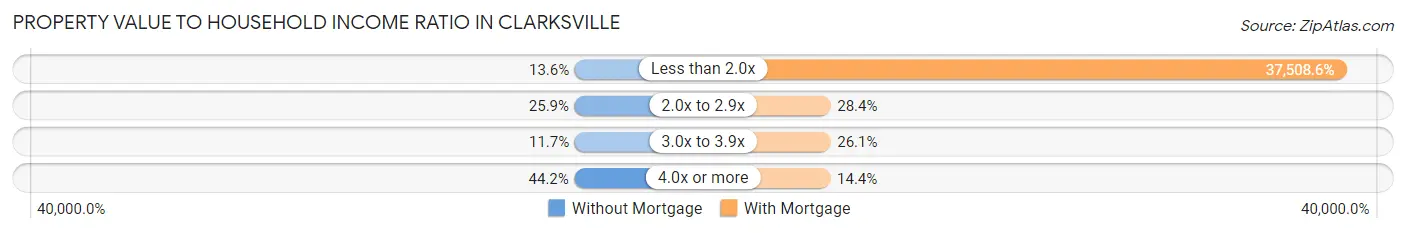
| Value-to-Income Ratio | Without Mortgage | With Mortgage |
| Less than 2.0x | 43 (13.6%) | 83,269 (37,508.6%) |
| 2.0x to 2.9x | 82 (25.9%) | 63 (28.4%) |
| 3.0x to 3.9x | 37 (11.7%) | 58 (26.1%) |
| 4.0x or more | 140 (44.2%) | 32 (14.4%) |
| Total | 317 (100.0%) | 222 (100.0%) |
Real Estate Taxes by Mortgage Status in Clarksville
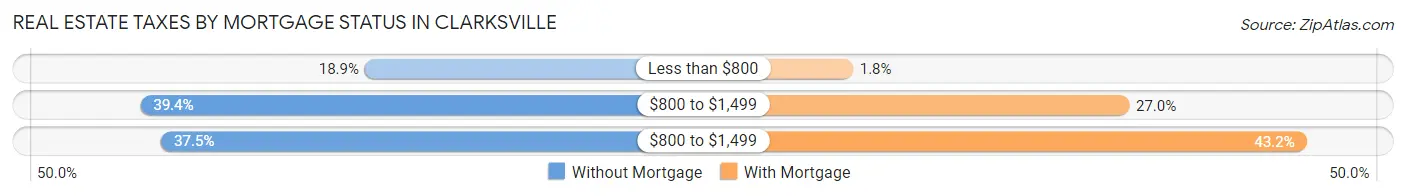
| Property Taxes | Without Mortgage | With Mortgage |
| Less than $800 | 60 (18.9%) | 4 (1.8%) |
| $800 to $1,499 | 125 (39.4%) | 60 (27.0%) |
| $800 to $1,499 | 119 (37.5%) | 96 (43.2%) |
| Total | 317 (100.0%) | 222 (100.0%) |
Health & Disability in Clarksville
Health Insurance Coverage by Age in Clarksville
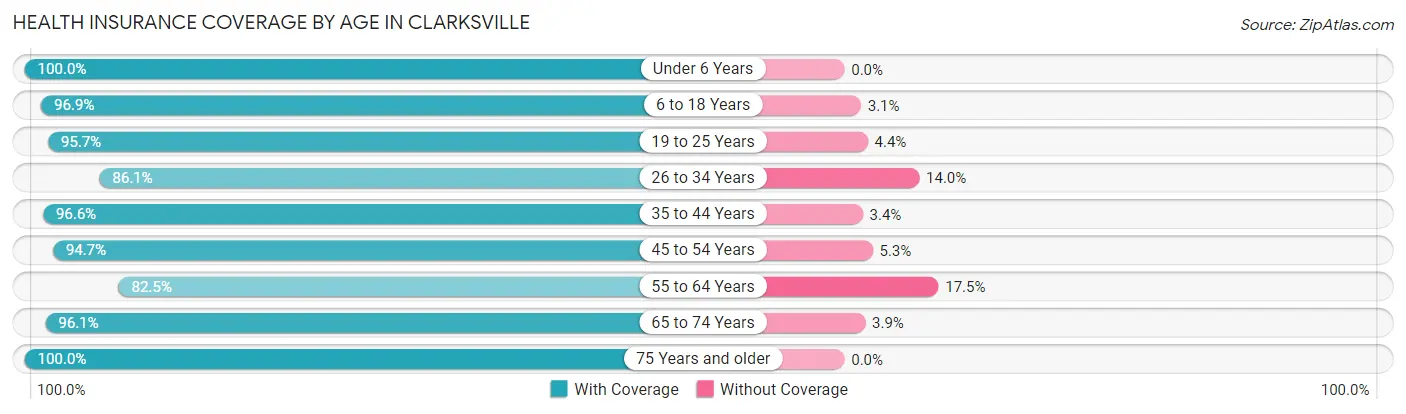
| Age Bracket | With Coverage | Without Coverage |
| Under 6 Years | 117 (100.0%) | 0 (0.0%) |
| 6 to 18 Years | 283 (96.9%) | 9 (3.1%) |
| 19 to 25 Years | 66 (95.7%) | 3 (4.3%) |
| 26 to 34 Years | 111 (86.1%) | 18 (14.0%) |
| 35 to 44 Years | 113 (96.6%) | 4 (3.4%) |
| 45 to 54 Years | 180 (94.7%) | 10 (5.3%) |
| 55 to 64 Years | 127 (82.5%) | 27 (17.5%) |
| 65 to 74 Years | 297 (96.1%) | 12 (3.9%) |
| 75 Years and older | 252 (100.0%) | 0 (0.0%) |
| Total | 1,546 (94.9%) | 83 (5.1%) |
Health Insurance Coverage by Citizenship Status in Clarksville
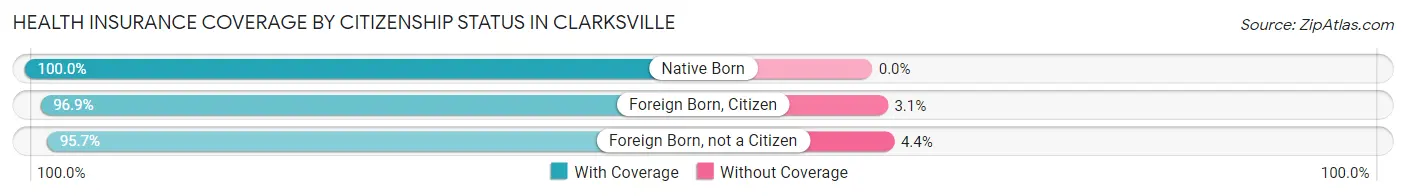
| Citizenship Status | With Coverage | Without Coverage |
| Native Born | 117 (100.0%) | 0 (0.0%) |
| Foreign Born, Citizen | 283 (96.9%) | 9 (3.1%) |
| Foreign Born, not a Citizen | 66 (95.7%) | 3 (4.3%) |
Health Insurance Coverage by Household Income in Clarksville
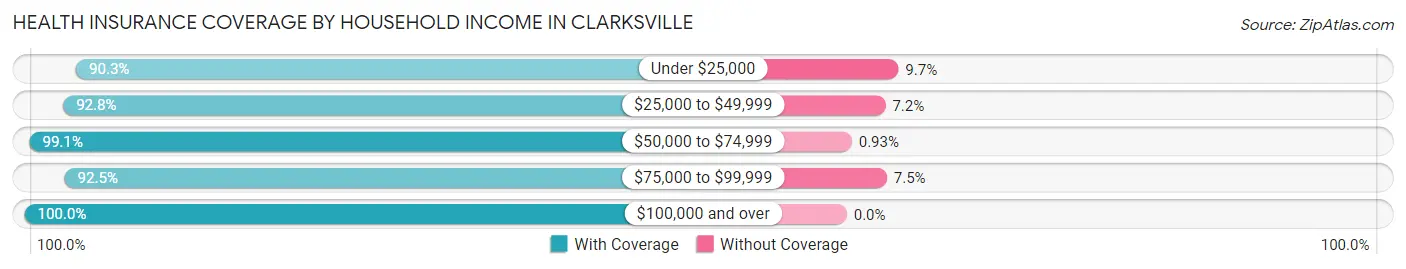
| Household Income | With Coverage | Without Coverage |
| Under $25,000 | 271 (90.3%) | 29 (9.7%) |
| $25,000 to $49,999 | 282 (92.8%) | 22 (7.2%) |
| $50,000 to $74,999 | 318 (99.1%) | 3 (0.9%) |
| $75,000 to $99,999 | 357 (92.5%) | 29 (7.5%) |
| $100,000 and over | 318 (100.0%) | 0 (0.0%) |
Public vs Private Health Insurance Coverage by Age in Clarksville
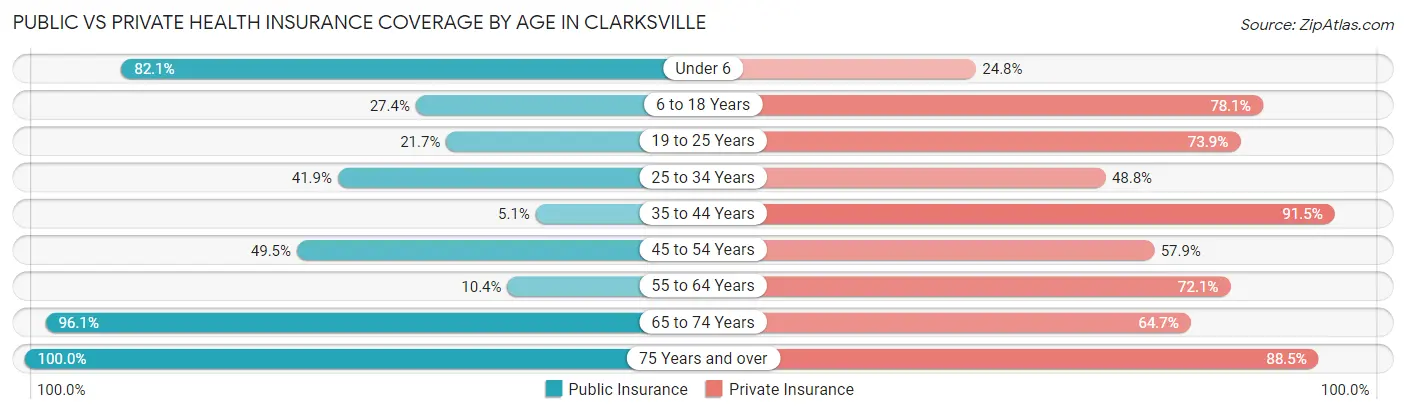
| Age Bracket | Public Insurance | Private Insurance |
| Under 6 | 96 (82.1%) | 29 (24.8%) |
| 6 to 18 Years | 80 (27.4%) | 228 (78.1%) |
| 19 to 25 Years | 15 (21.7%) | 51 (73.9%) |
| 25 to 34 Years | 54 (41.9%) | 63 (48.8%) |
| 35 to 44 Years | 6 (5.1%) | 107 (91.4%) |
| 45 to 54 Years | 94 (49.5%) | 110 (57.9%) |
| 55 to 64 Years | 16 (10.4%) | 111 (72.1%) |
| 65 to 74 Years | 297 (96.1%) | 200 (64.7%) |
| 75 Years and over | 252 (100.0%) | 223 (88.5%) |
| Total | 910 (55.9%) | 1,122 (68.9%) |
Disability Status by Sex by Age in Clarksville
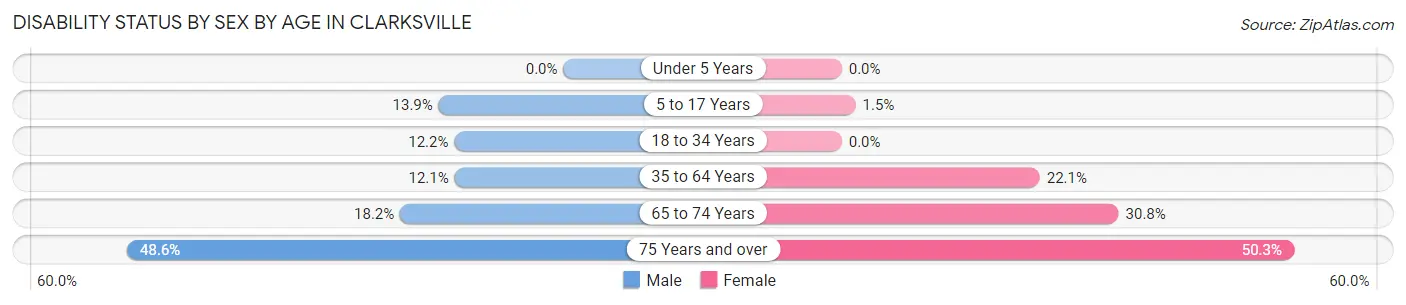
| Age Bracket | Male | Female |
| Under 5 Years | 0 (0.0%) | 0 (0.0%) |
| 5 to 17 Years | 15 (13.9%) | 3 (1.5%) |
| 18 to 34 Years | 13 (12.1%) | 0 (0.0%) |
| 35 to 64 Years | 24 (12.1%) | 58 (22.1%) |
| 65 to 74 Years | 32 (18.2%) | 41 (30.8%) |
| 75 Years and over | 52 (48.6%) | 73 (50.3%) |
Disability Class by Sex by Age in Clarksville
Disability Class: Hearing Difficulty
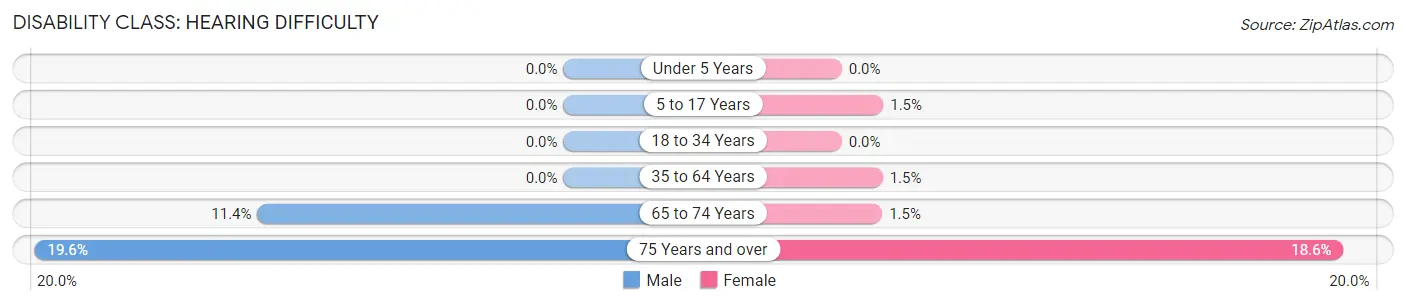
| Age Bracket | Male | Female |
| Under 5 Years | 0 (0.0%) | 0 (0.0%) |
| 5 to 17 Years | 0 (0.0%) | 3 (1.5%) |
| 18 to 34 Years | 0 (0.0%) | 0 (0.0%) |
| 35 to 64 Years | 0 (0.0%) | 4 (1.5%) |
| 65 to 74 Years | 20 (11.4%) | 2 (1.5%) |
| 75 Years and over | 21 (19.6%) | 27 (18.6%) |
Disability Class: Vision Difficulty
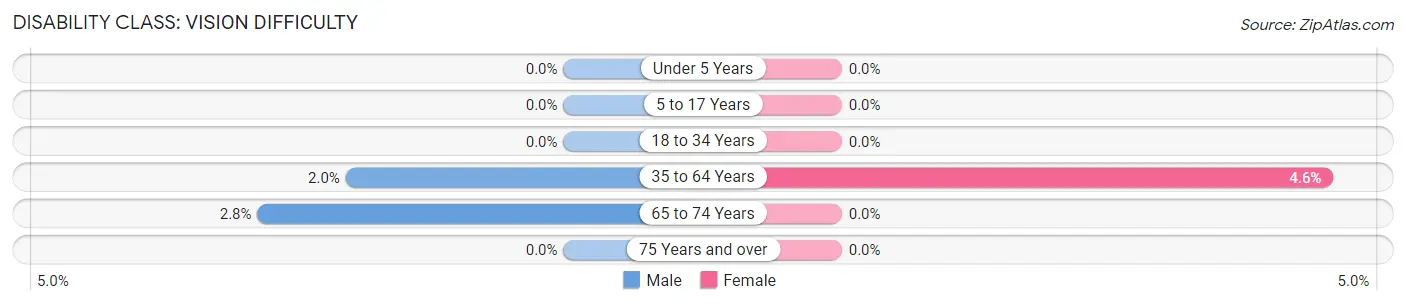
| Age Bracket | Male | Female |
| Under 5 Years | 0 (0.0%) | 0 (0.0%) |
| 5 to 17 Years | 0 (0.0%) | 0 (0.0%) |
| 18 to 34 Years | 0 (0.0%) | 0 (0.0%) |
| 35 to 64 Years | 4 (2.0%) | 12 (4.6%) |
| 65 to 74 Years | 5 (2.8%) | 0 (0.0%) |
| 75 Years and over | 0 (0.0%) | 0 (0.0%) |
Disability Class: Cognitive Difficulty
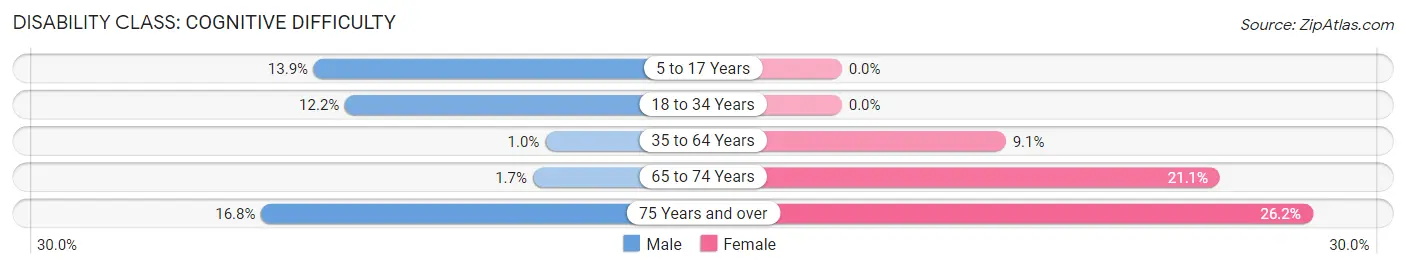
| Age Bracket | Male | Female |
| 5 to 17 Years | 15 (13.9%) | 0 (0.0%) |
| 18 to 34 Years | 13 (12.1%) | 0 (0.0%) |
| 35 to 64 Years | 2 (1.0%) | 24 (9.1%) |
| 65 to 74 Years | 3 (1.7%) | 28 (21.0%) |
| 75 Years and over | 18 (16.8%) | 38 (26.2%) |
Disability Class: Ambulatory Difficulty
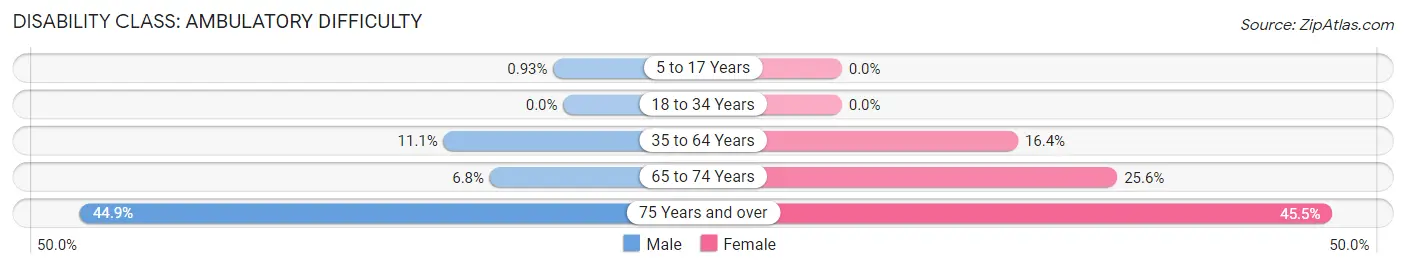
| Age Bracket | Male | Female |
| 5 to 17 Years | 1 (0.9%) | 0 (0.0%) |
| 18 to 34 Years | 0 (0.0%) | 0 (0.0%) |
| 35 to 64 Years | 22 (11.1%) | 43 (16.4%) |
| 65 to 74 Years | 12 (6.8%) | 34 (25.6%) |
| 75 Years and over | 48 (44.9%) | 66 (45.5%) |
Disability Class: Self-Care Difficulty
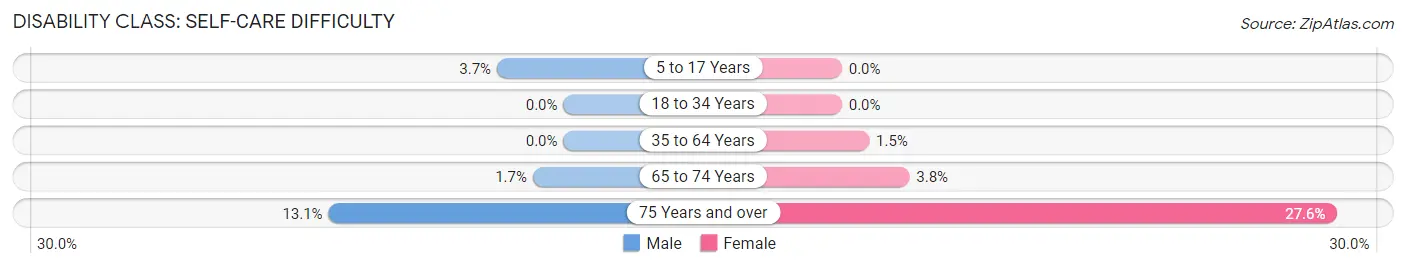
| Age Bracket | Male | Female |
| 5 to 17 Years | 4 (3.7%) | 0 (0.0%) |
| 18 to 34 Years | 0 (0.0%) | 0 (0.0%) |
| 35 to 64 Years | 0 (0.0%) | 4 (1.5%) |
| 65 to 74 Years | 3 (1.7%) | 5 (3.8%) |
| 75 Years and over | 14 (13.1%) | 40 (27.6%) |
Technology Access in Clarksville
Computing Device Access in Clarksville
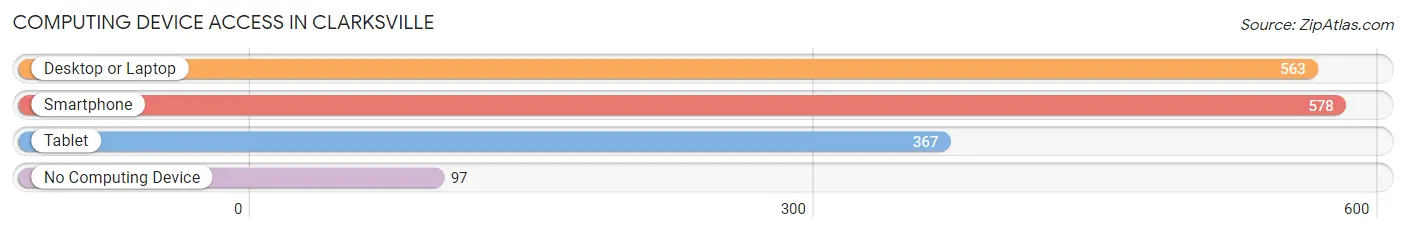
| Device Type | # Households | % Households |
| Desktop or Laptop | 563 | 74.2% |
| Smartphone | 578 | 76.1% |
| Tablet | 367 | 48.3% |
| No Computing Device | 97 | 12.8% |
| Total | 759 | 100.0% |
Internet Access in Clarksville
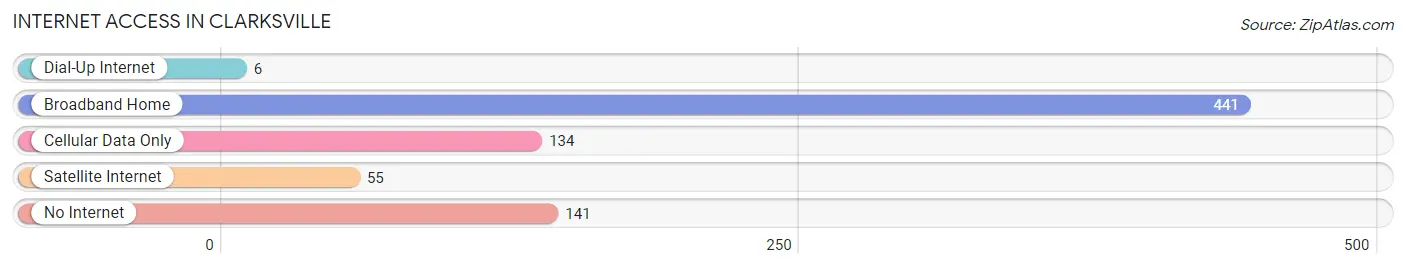
| Internet Type | # Households | % Households |
| Dial-Up Internet | 6 | 0.8% |
| Broadband Home | 441 | 58.1% |
| Cellular Data Only | 134 | 17.6% |
| Satellite Internet | 55 | 7.2% |
| No Internet | 141 | 18.6% |
| Total | 759 | 100.0% |
Clarksville Summary
Clarksville, Virginia is a small town located in Mecklenburg County, Virginia. It is situated on the banks of the Staunton River, which is a tributary of the Roanoke River. The town was founded in 1790 and is the county seat of Mecklenburg County. The population of Clarksville was estimated to be 1,845 in 2019.
Geography
Clarksville is located in the south-central part of Mecklenburg County, Virginia. It is situated on the banks of the Staunton River, which is a tributary of the Roanoke River. The town is located at an elevation of approximately 590 feet above sea level. The town is surrounded by rolling hills and is located in the Piedmont region of Virginia. The climate in Clarksville is humid subtropical, with hot, humid summers and mild winters.
Economy
Clarksville’s economy is largely based on agriculture and tourism. The town is home to several farms, including tobacco, corn, and soybean farms. The town is also home to several wineries, which attract tourists from all over the region. The town is also home to several small businesses, including restaurants, antique stores, and gift shops.
Demographics
According to the 2019 U.S. Census, the population of Clarksville was estimated to be 1,845. The racial makeup of the town was 79.2% White, 17.3% African American, 0.7% Native American, 0.3% Asian, 0.1% Pacific Islander, and 2.4% from other races. The median household income in Clarksville was $37,917, and the median age was 43.7 years.
History
Clarksville was founded in 1790 and is the county seat of Mecklenburg County. The town was named after General George Rogers Clark, who was a Revolutionary War hero. The town was originally a trading post and was a major stop on the Great Wagon Road, which was a major route for settlers heading west. The town was also a major stop on the Virginia Central Railroad, which was a major transportation route in the 19th century. The town was also home to several Civil War battles, including the Battle of Clarksville in 1862.
Clarksville has a rich history and is home to several historic sites, including the Mecklenburg County Courthouse, which was built in 1820. The town is also home to several museums, including the Mecklenburg County Historical Museum and the Clarksville Museum. The town is also home to several parks, including the Clarksville Town Park and the Staunton River State Park.
Conclusion
Clarksville, Virginia is a small town located in Mecklenburg County, Virginia. It is situated on the banks of the Staunton River, which is a tributary of the Roanoke River. The town was founded in 1790 and is the county seat of Mecklenburg County. The population of Clarksville was estimated to be 1,845 in 2019. The town’s economy is largely based on agriculture and tourism, and the town is home to several farms, wineries, and small businesses. The racial makeup of the town was 79.2% White, 17.3% African American, 0.7% Native American, 0.3% Asian, 0.1% Pacific Islander, and 2.4% from other races. The median household income in Clarksville was $37,917, and the median age was 43.7 years. Clarksville has a rich history and is home to several historic sites, museums, and parks.
Common Questions
What is Per Capita Income in Clarksville?
Per Capita income in Clarksville is $33,111.
What is the Median Family Income in Clarksville?
Median Family Income in Clarksville is $73,438.
What is the Median Household income in Clarksville?
Median Household Income in Clarksville is $59,375.
What is Income or Wage Gap in Clarksville?
Income or Wage Gap in Clarksville is 27.8%.
Women in Clarksville earn 72.2 cents for every dollar earned by a man.
What is Inequality or Gini Index in Clarksville?
Inequality or Gini Index in Clarksville is 0.45.
What is the Total Population of Clarksville?
Total Population of Clarksville is 1,629.
What is the Total Male Population of Clarksville?
Total Male Population of Clarksville is 725.
What is the Total Female Population of Clarksville?
Total Female Population of Clarksville is 904.
What is the Ratio of Males per 100 Females in Clarksville?
There are 80.20 Males per 100 Females in Clarksville.
What is the Ratio of Females per 100 Males in Clarksville?
There are 124.69 Females per 100 Males in Clarksville.
What is the Median Population Age in Clarksville?
Median Population Age in Clarksville is 50.2 Years.
What is the Average Family Size in Clarksville
Average Family Size in Clarksville is 3.1 People.
What is the Average Household Size in Clarksville
Average Household Size in Clarksville is 2.1 People.
How Large is the Labor Force in Clarksville?
There are 556 People in the Labor Forcein in Clarksville.
What is the Percentage of People in the Labor Force in Clarksville?
44.7% of People are in the Labor Force in Clarksville.
What is the Unemployment Rate in Clarksville?
Unemployment Rate in Clarksville is 6.8%.