Zip Codes with the Highest Percentage of Population Employed in Architecture & Engineering in Lynchburg, VA
RELATED REPORTS & OPTIONS
Architecture & Engineering
Lynchburg
Compare Zip Codes
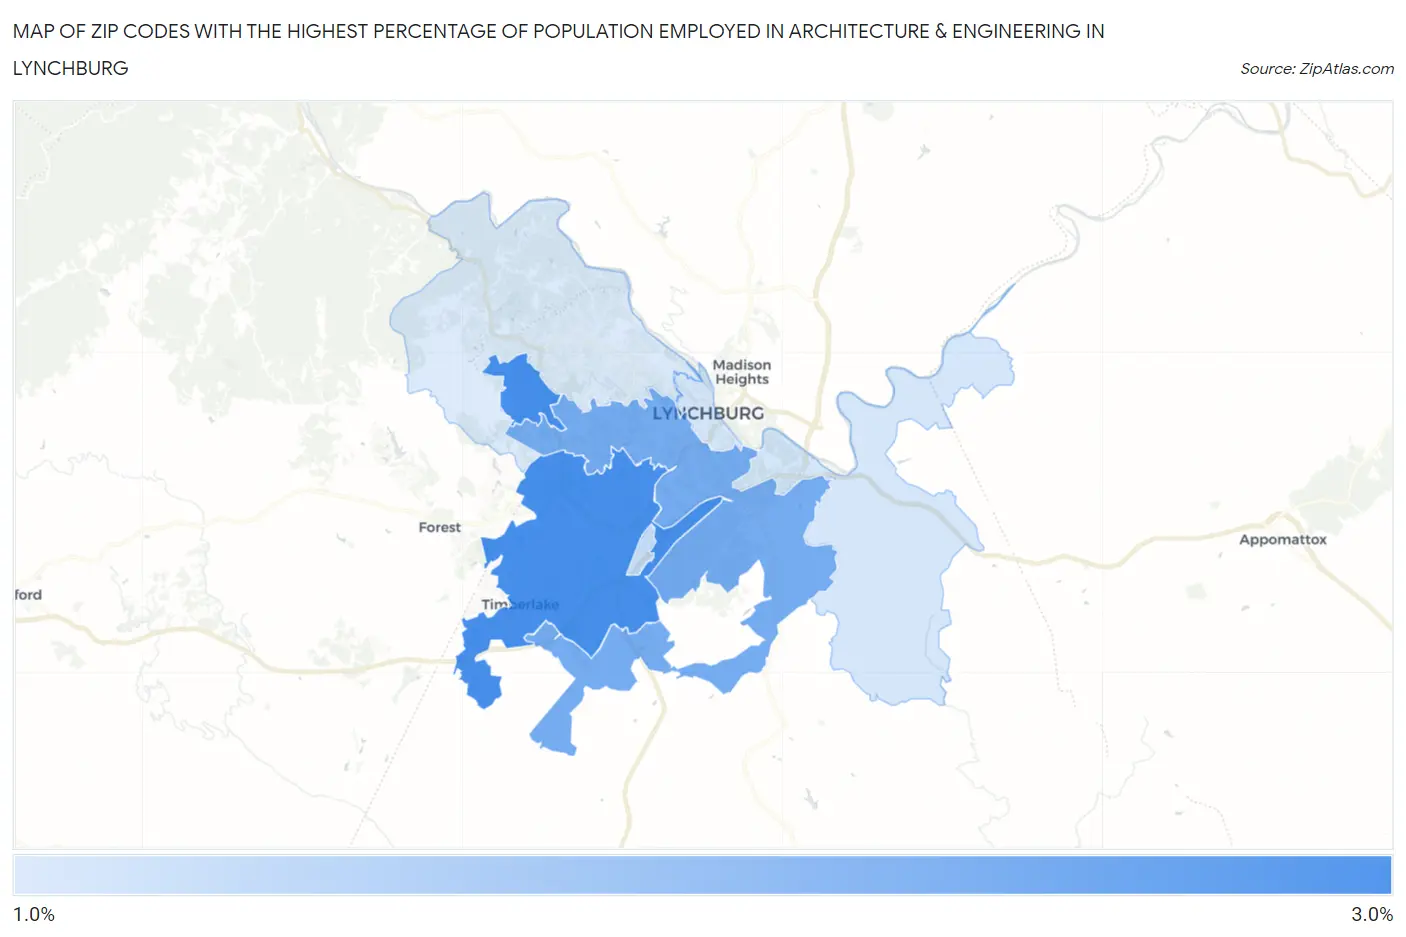
Map of Zip Codes with the Highest Percentage of Population Employed in Architecture & Engineering in Lynchburg
1.2%
2.7%
Zip Codes with the Highest Percentage of Population Employed in Architecture & Engineering in Lynchburg, VA
| Zip Code | % Employed | vs State | vs National | |
| 1. | 24502 | 2.7% | 2.3%(+0.355)#187 | 2.1%(+0.511)#6,329 |
| 2. | 24501 | 2.2% | 2.3%(-0.085)#243 | 2.1%(+0.070)#8,381 |
| 3. | 24515 | 1.4% | 2.3%(-0.880)#371 | 2.1%(-0.725)#13,396 |
| 4. | 24504 | 1.3% | 2.3%(-1.04)#398 | 2.1%(-0.880)#14,538 |
| 5. | 24503 | 1.2% | 2.3%(-1.11)#408 | 2.1%(-0.950)#15,088 |
1
Common Questions
What are the Top 3 Zip Codes with the Highest Percentage of Population Employed in Architecture & Engineering in Lynchburg, VA?
Top 3 Zip Codes with the Highest Percentage of Population Employed in Architecture & Engineering in Lynchburg, VA are:
What zip code has the Highest Percentage of Population Employed in Architecture & Engineering in Lynchburg, VA?
24502 has the Highest Percentage of Population Employed in Architecture & Engineering in Lynchburg, VA with 2.7%.
What is the Percentage of Population Employed in Architecture & Engineering in Lynchburg, VA?
Percentage of Population Employed in Architecture & Engineering in Lynchburg is 1.9%.
What is the Percentage of Population Employed in Architecture & Engineering in Virginia?
Percentage of Population Employed in Architecture & Engineering in Virginia is 2.3%.
What is the Percentage of Population Employed in Architecture & Engineering in the United States?
Percentage of Population Employed in Architecture & Engineering in the United States is 2.1%.