McNair, VA Map & Demographics
McNair Map
McNair Overview
$54,249
PER CAPITA INCOME
$119,628
AVG FAMILY INCOME
$115,696
AVG HOUSEHOLD INCOME
39.4%
WAGE / INCOME GAP [ % ]
60.6¢/ $1
WAGE / INCOME GAP [ $ ]
0.36
INEQUALITY / GINI INDEX
22,187
TOTAL POPULATION
11,736
MALE POPULATION
10,451
FEMALE POPULATION
112.30
MALES / 100 FEMALES
89.05
FEMALES / 100 MALES
30.9
MEDIAN AGE
3.3
AVG FAMILY SIZE
2.5
AVG HOUSEHOLD SIZE
14,262
LABOR FORCE [ PEOPLE ]
79.4%
PERCENT IN LABOR FORCE
3.6%
UNEMPLOYMENT RATE
Income in McNair
Income Overview in McNair
Per Capita Income in McNair is $54,249, while median incomes of families and households are $119,628 and $115,696 respectively.
| Characteristic | Number | Measure |
| Per Capita Income | 22,187 | $54,249 |
| Median Family Income | 4,839 | $119,628 |
| Mean Family Income | 4,839 | $145,297 |
| Median Household Income | 8,759 | $115,696 |
| Mean Household Income | 8,759 | $134,170 |
| Income Deficit | 4,839 | $0 |
| Wage / Income Gap (%) | 22,187 | 39.40% |
| Wage / Income Gap ($) | 22,187 | 60.60¢ per $1 |
| Gini / Inequality Index | 22,187 | 0.36 |
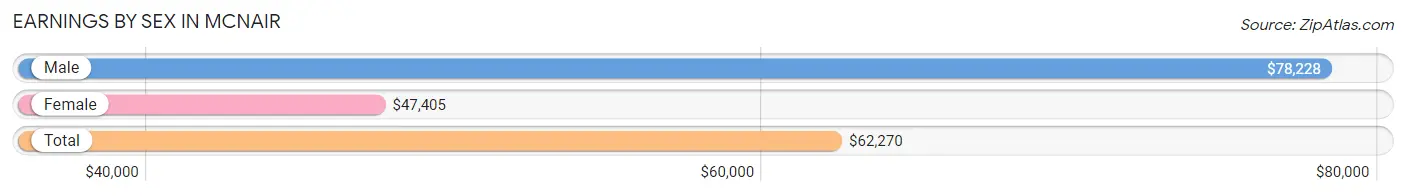
Earnings by Sex in McNair
Average Earnings in McNair are $62,270, $78,228 for men and $47,405 for women, a difference of 39.4%.
| Sex | Number | Average Earnings |
| Male | 8,265 (57.2%) | $78,228 |
| Female | 6,177 (42.8%) | $47,405 |
| Total | 14,442 (100.0%) | $62,270 |
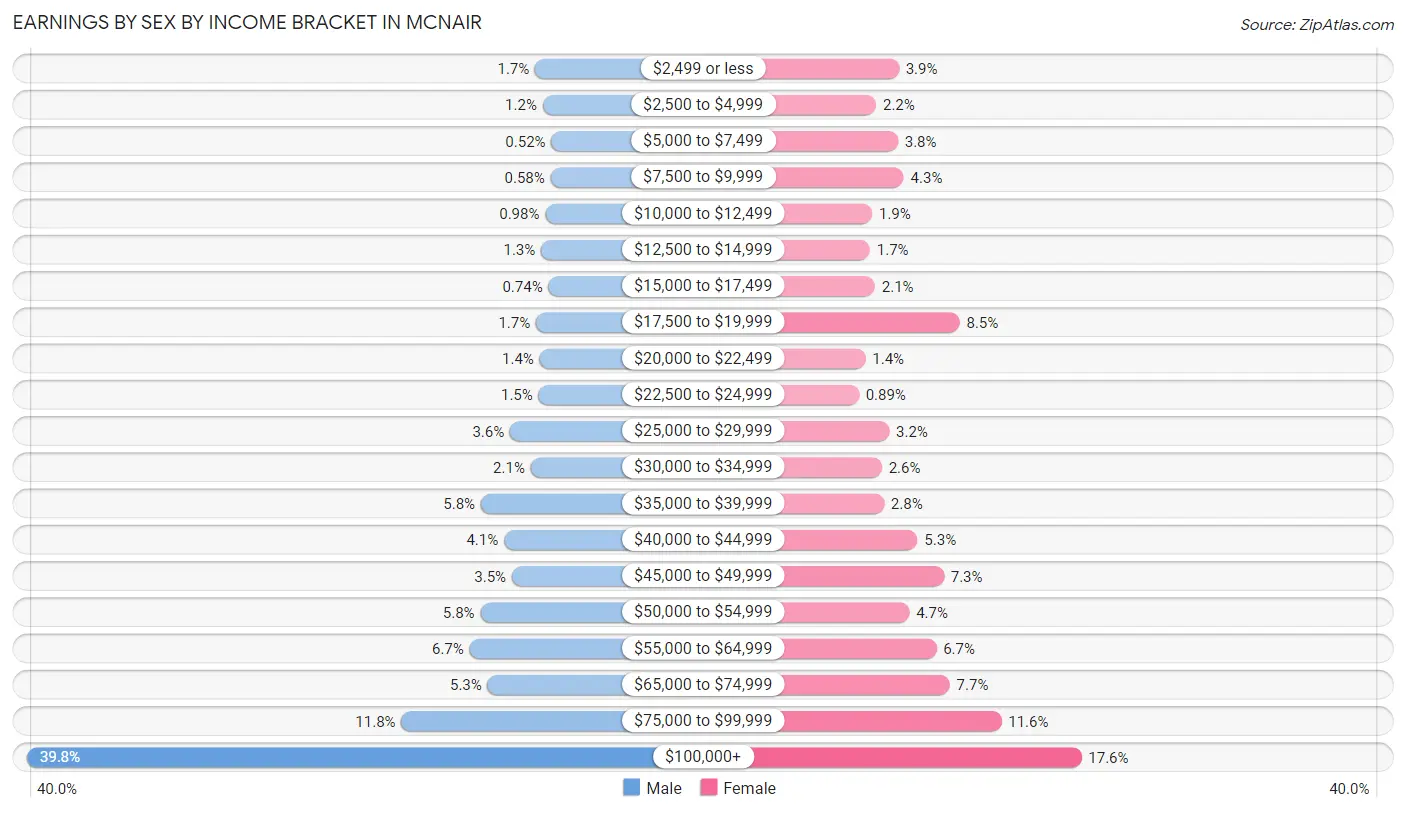
Earnings by Sex by Income Bracket in McNair
The most common earnings brackets in McNair are $100,000+ for men (3,292 | 39.8%) and $100,000+ for women (1,086 | 17.6%).
| Income | Male | Female |
| $2,499 or less | 144 (1.7%) | 240 (3.9%) |
| $2,500 to $4,999 | 97 (1.2%) | 135 (2.2%) |
| $5,000 to $7,499 | 43 (0.5%) | 236 (3.8%) |
| $7,500 to $9,999 | 48 (0.6%) | 263 (4.3%) |
| $10,000 to $12,499 | 81 (1.0%) | 117 (1.9%) |
| $12,500 to $14,999 | 107 (1.3%) | 107 (1.7%) |
| $15,000 to $17,499 | 61 (0.7%) | 130 (2.1%) |
| $17,500 to $19,999 | 138 (1.7%) | 522 (8.5%) |
| $20,000 to $22,499 | 116 (1.4%) | 86 (1.4%) |
| $22,500 to $24,999 | 122 (1.5%) | 55 (0.9%) |
| $25,000 to $29,999 | 299 (3.6%) | 196 (3.2%) |
| $30,000 to $34,999 | 171 (2.1%) | 162 (2.6%) |
| $35,000 to $39,999 | 479 (5.8%) | 172 (2.8%) |
| $40,000 to $44,999 | 336 (4.1%) | 327 (5.3%) |
| $45,000 to $49,999 | 288 (3.5%) | 449 (7.3%) |
| $50,000 to $54,999 | 483 (5.8%) | 289 (4.7%) |
| $55,000 to $64,999 | 550 (6.7%) | 414 (6.7%) |
| $65,000 to $74,999 | 438 (5.3%) | 476 (7.7%) |
| $75,000 to $99,999 | 972 (11.8%) | 715 (11.6%) |
| $100,000+ | 3,292 (39.8%) | 1,086 (17.6%) |
| Total | 8,265 (100.0%) | 6,177 (100.0%) |
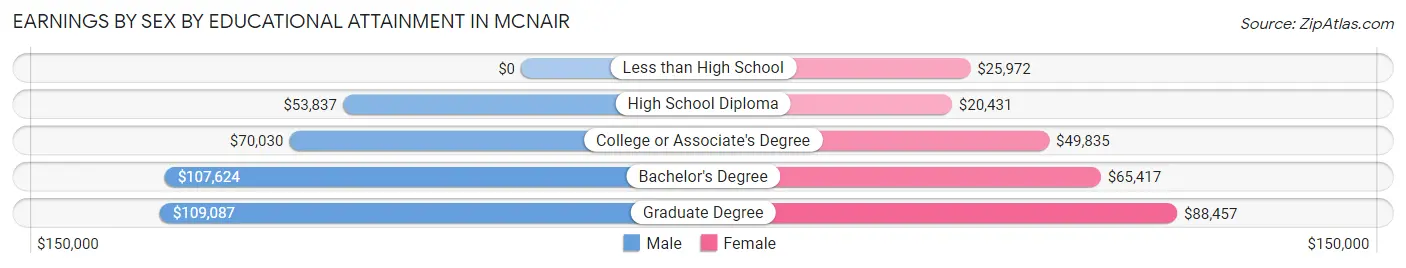
Earnings by Sex by Educational Attainment in McNair
Average earnings in McNair are $94,446 for men and $51,681 for women, a difference of 45.3%. Men with an educational attainment of graduate degree enjoy the highest average annual earnings of $109,087, while those with high school diploma education earn the least with $53,837. Women with an educational attainment of graduate degree earn the most with the average annual earnings of $88,457, while those with high school diploma education have the smallest earnings of $20,431.
| Educational Attainment | Male Income | Female Income |
| Less than High School | - | - |
| High School Diploma | $53,837 | $20,431 |
| College or Associate's Degree | $70,030 | $49,835 |
| Bachelor's Degree | $107,624 | $65,417 |
| Graduate Degree | $109,087 | $88,457 |
| Total | $94,446 | $51,681 |
Family Income in McNair
Family Income Brackets in McNair
According to the McNair family income data, there are 1,200 families falling into the $100,000 to $149,999 income range, which is the most common income bracket and makes up 24.8% of all families. Conversely, the $10,000 to $14,999 income bracket is the least frequent group with only 29 families (0.6%) belonging to this category.
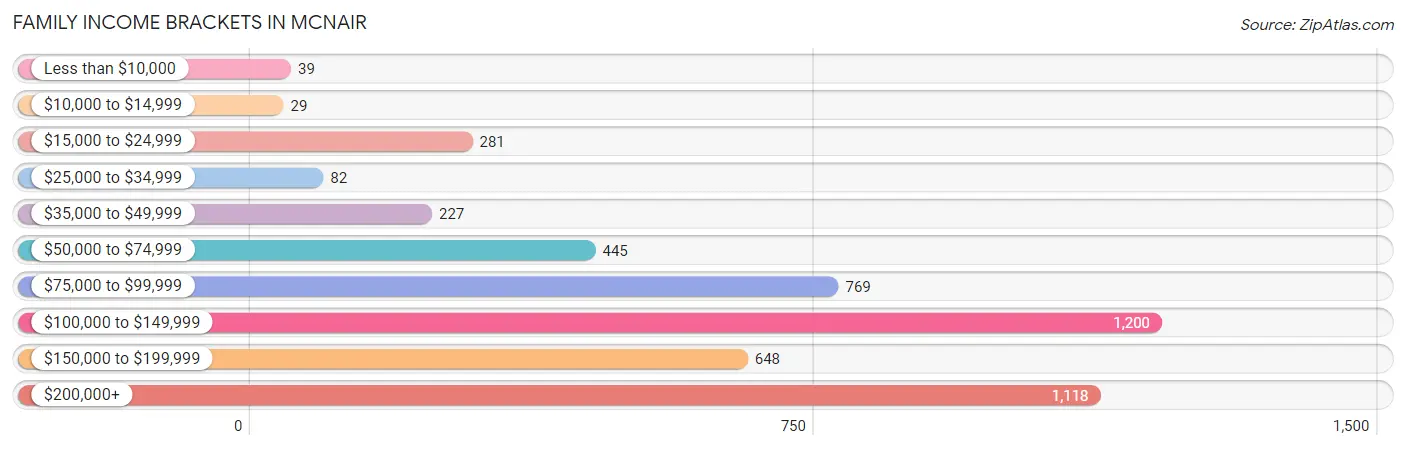
| Income Bracket | # Families | % Families |
| Less than $10,000 | 39 | 0.8% |
| $10,000 to $14,999 | 29 | 0.6% |
| $15,000 to $24,999 | 281 | 5.8% |
| $25,000 to $34,999 | 82 | 1.7% |
| $35,000 to $49,999 | 227 | 4.7% |
| $50,000 to $74,999 | 445 | 9.2% |
| $75,000 to $99,999 | 769 | 15.9% |
| $100,000 to $149,999 | 1,200 | 24.8% |
| $150,000 to $199,999 | 648 | 13.4% |
| $200,000+ | 1,118 | 23.1% |
Family Income by Famaliy Size in McNair
4-person families (1,538 | 31.8%) account for the highest median family income in McNair with $137,028 per family, while 2-person families (1,702 | 35.2%) have the highest median income of $51,696 per family member.
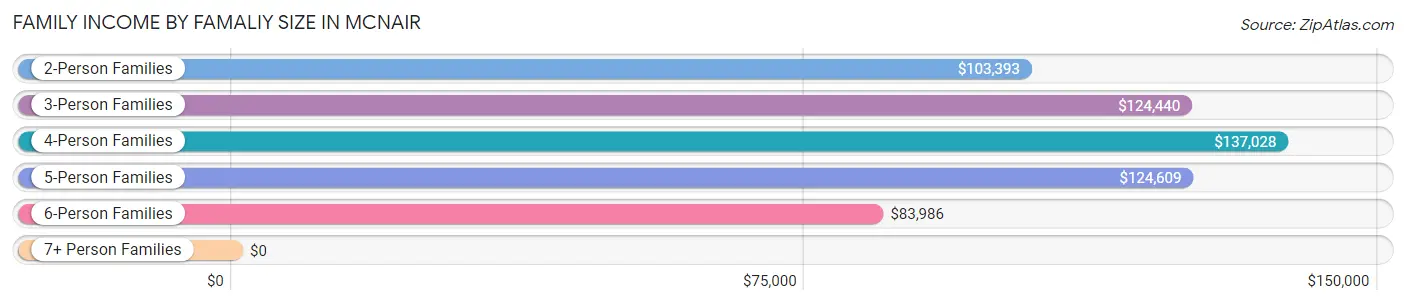
| Income Bracket | # Families | Median Income |
| 2-Person Families | 1,702 (35.2%) | $103,393 |
| 3-Person Families | 1,159 (23.9%) | $124,440 |
| 4-Person Families | 1,538 (31.8%) | $137,028 |
| 5-Person Families | 304 (6.3%) | $124,609 |
| 6-Person Families | 136 (2.8%) | $83,986 |
| 7+ Person Families | 0 (0.0%) | $0 |
| Total | 4,839 (100.0%) | $119,628 |
Family Income by Number of Earners in McNair
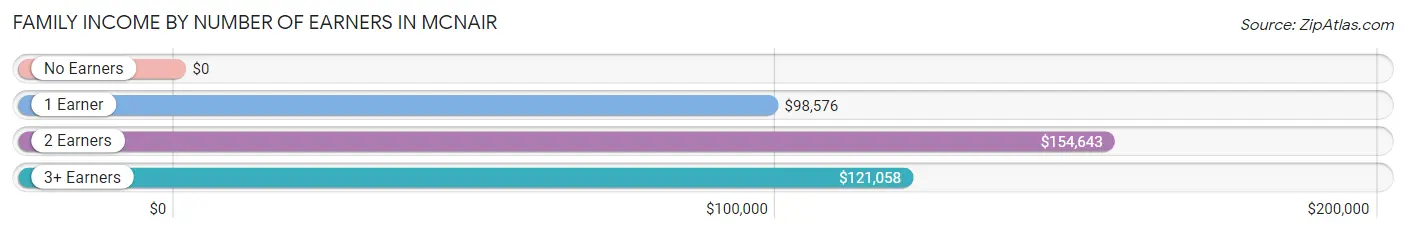
| Number of Earners | # Families | Median Income |
| No Earners | 110 (2.3%) | $0 |
| 1 Earner | 1,669 (34.5%) | $98,576 |
| 2 Earners | 2,644 (54.6%) | $154,643 |
| 3+ Earners | 416 (8.6%) | $121,058 |
| Total | 4,839 (100.0%) | $119,628 |
Household Income in McNair
Household Income Brackets in McNair
With 2,426 households falling in the category, the $100,000 to $149,999 income range is the most frequent in McNair, accounting for 27.7% of all households. In contrast, only 96 households (1.1%) fall into the less than $10,000 income bracket, making it the least populous group.
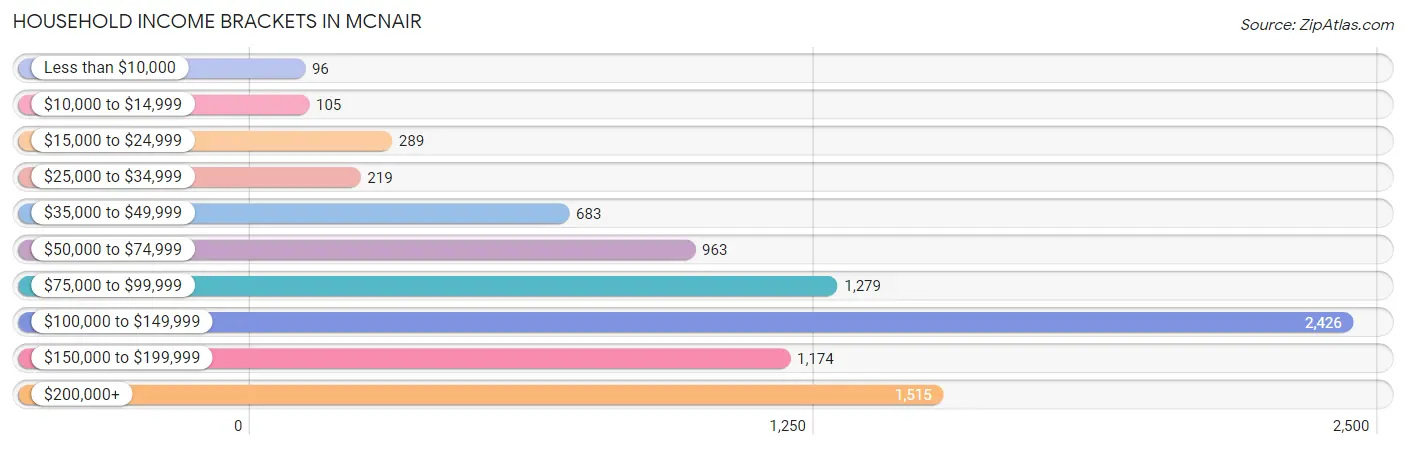
| Income Bracket | # Households | % Households |
| Less than $10,000 | 96 | 1.1% |
| $10,000 to $14,999 | 105 | 1.2% |
| $15,000 to $24,999 | 289 | 3.3% |
| $25,000 to $34,999 | 219 | 2.5% |
| $35,000 to $49,999 | 683 | 7.8% |
| $50,000 to $74,999 | 963 | 11.0% |
| $75,000 to $99,999 | 1,279 | 14.6% |
| $100,000 to $149,999 | 2,426 | 27.7% |
| $150,000 to $199,999 | 1,174 | 13.4% |
| $200,000+ | 1,515 | 17.3% |
Household Income by Householder Age in McNair
The median household income in McNair is $115,696, with the highest median household income of $121,722 found in the 45 to 64 years age bracket for the primary householder. A total of 2,287 households (26.1%) fall into this category. Meanwhile, the 65+ years age bracket for the primary householder has the lowest median household income of $78,816, with 490 households (5.6%) in this group.
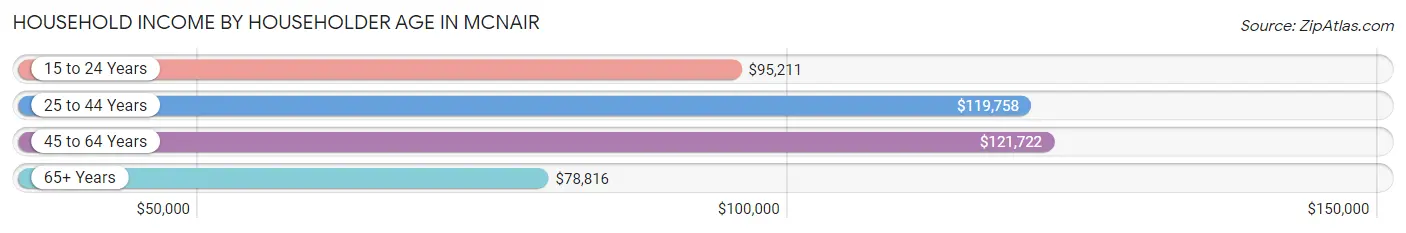
| Income Bracket | # Households | Median Income |
| 15 to 24 Years | 951 (10.9%) | $95,211 |
| 25 to 44 Years | 5,031 (57.4%) | $119,758 |
| 45 to 64 Years | 2,287 (26.1%) | $121,722 |
| 65+ Years | 490 (5.6%) | $78,816 |
| Total | 8,759 (100.0%) | $115,696 |
Poverty in McNair
Income Below Poverty by Sex and Age in McNair
With 4.5% poverty level for males and 9.4% for females among the residents of McNair, 6 to 11 year old males and 5 year old females are the most vulnerable to poverty, with 102 males (15.5%) and 210 females (67.3%) in their respective age groups living below the poverty level.
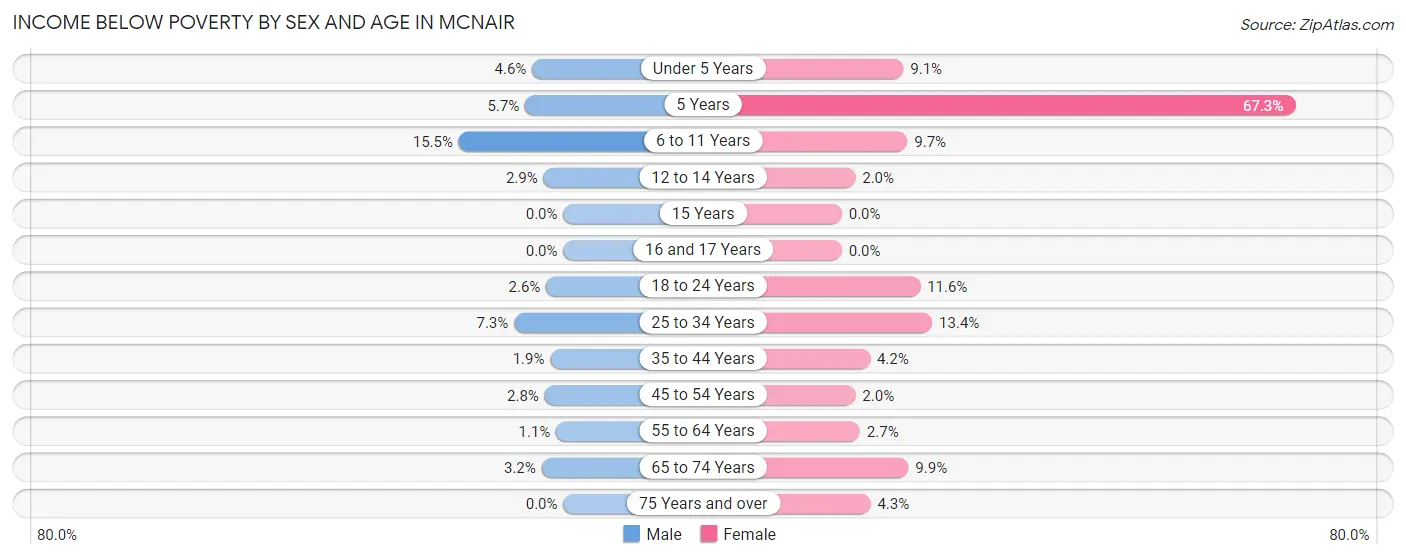
| Age Bracket | Male | Female |
| Under 5 Years | 45 (4.6%) | 65 (9.1%) |
| 5 Years | 14 (5.7%) | 210 (67.3%) |
| 6 to 11 Years | 102 (15.5%) | 47 (9.7%) |
| 12 to 14 Years | 7 (2.9%) | 9 (2.0%) |
| 15 Years | 0 (0.0%) | 0 (0.0%) |
| 16 and 17 Years | 0 (0.0%) | 0 (0.0%) |
| 18 to 24 Years | 38 (2.5%) | 135 (11.6%) |
| 25 to 34 Years | 222 (7.3%) | 362 (13.4%) |
| 35 to 44 Years | 50 (1.9%) | 77 (4.2%) |
| 45 to 54 Years | 31 (2.8%) | 30 (2.0%) |
| 55 to 64 Years | 7 (1.1%) | 16 (2.7%) |
| 65 to 74 Years | 6 (3.2%) | 18 (9.9%) |
| 75 Years and over | 0 (0.0%) | 10 (4.3%) |
| Total | 522 (4.5%) | 979 (9.4%) |
Income Above Poverty by Sex and Age in McNair
According to the poverty statistics in McNair, males aged 15 years and females aged 15 years are the age groups that are most secure financially, with 100.0% of males and 100.0% of females in these age groups living above the poverty line.
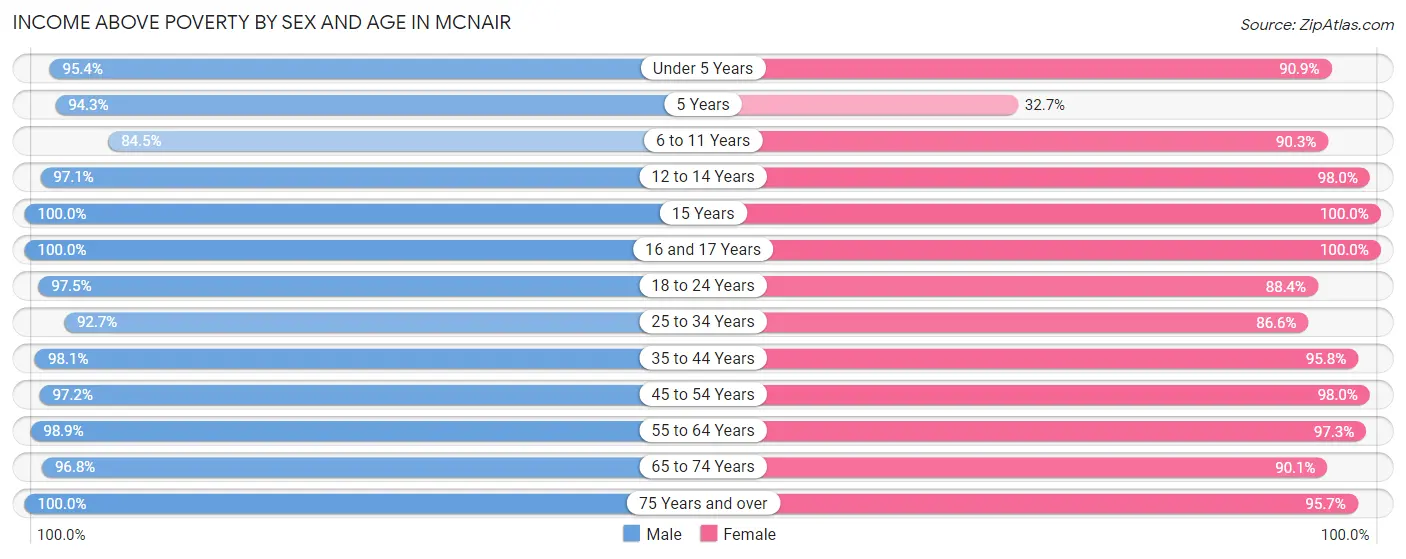
| Age Bracket | Male | Female |
| Under 5 Years | 926 (95.4%) | 646 (90.9%) |
| 5 Years | 232 (94.3%) | 102 (32.7%) |
| 6 to 11 Years | 555 (84.5%) | 436 (90.3%) |
| 12 to 14 Years | 231 (97.1%) | 441 (98.0%) |
| 15 Years | 95 (100.0%) | 25 (100.0%) |
| 16 and 17 Years | 193 (100.0%) | 274 (100.0%) |
| 18 to 24 Years | 1,453 (97.5%) | 1,025 (88.4%) |
| 25 to 34 Years | 2,817 (92.7%) | 2,336 (86.6%) |
| 35 to 44 Years | 2,529 (98.1%) | 1,764 (95.8%) |
| 45 to 54 Years | 1,088 (97.2%) | 1,456 (98.0%) |
| 55 to 64 Years | 652 (98.9%) | 578 (97.3%) |
| 65 to 74 Years | 180 (96.8%) | 164 (90.1%) |
| 75 Years and over | 226 (100.0%) | 225 (95.7%) |
| Total | 11,177 (95.5%) | 9,472 (90.6%) |
Income Below Poverty Among Married-Couple Families in McNair
The poverty statistics for married-couple families in McNair show that 2.6% or 102 of the total 3,856 families live below the poverty line. Families with 3 or 4 children have the highest poverty rate of 8.8%, comprising of 15 families. On the other hand, families with no children have the lowest poverty rate of 2.1%, which includes 30 families.
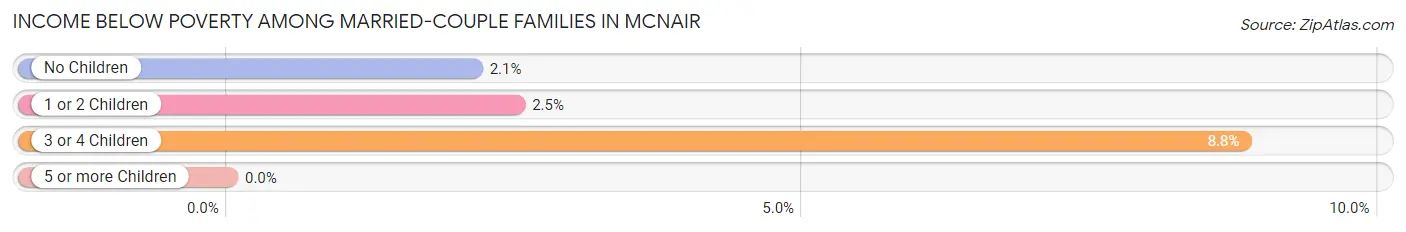
| Children | Above Poverty | Below Poverty |
| No Children | 1,377 (97.9%) | 30 (2.1%) |
| 1 or 2 Children | 2,222 (97.5%) | 57 (2.5%) |
| 3 or 4 Children | 155 (91.2%) | 15 (8.8%) |
| 5 or more Children | 0 (0.0%) | 0 (0.0%) |
| Total | 3,754 (97.4%) | 102 (2.6%) |
Income Below Poverty Among Single-Parent Households in McNair
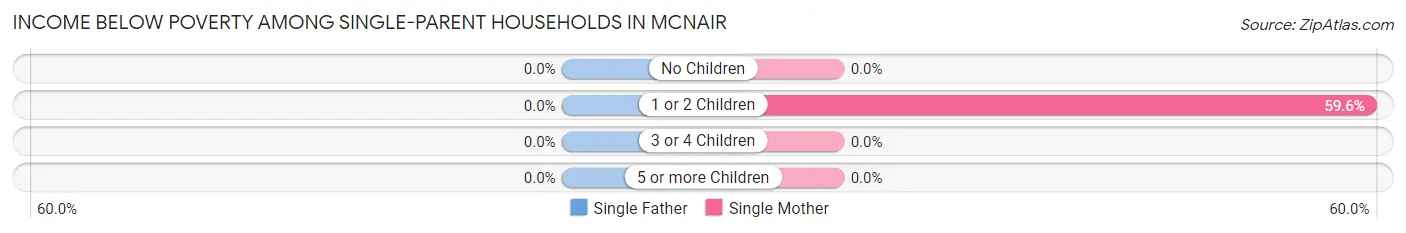
| Children | Single Father | Single Mother |
| No Children | 0 (0.0%) | 0 (0.0%) |
| 1 or 2 Children | 0 (0.0%) | 215 (59.6%) |
| 3 or 4 Children | 0 (0.0%) | 0 (0.0%) |
| 5 or more Children | 0 (0.0%) | 0 (0.0%) |
| Total | 0 (0.0%) | 215 (41.3%) |
Income Below Poverty Among Married-Couple vs Single-Parent Households in McNair
The poverty data for McNair shows that 102 of the married-couple family households (2.6%) and 215 of the single-parent households (21.9%) are living below the poverty level. Within the married-couple family households, those with 3 or 4 children have the highest poverty rate, with 15 households (8.8%) falling below the poverty line. Among the single-parent households, those with 1 or 2 children have the highest poverty rate, with 215 household (53.2%) living below poverty.
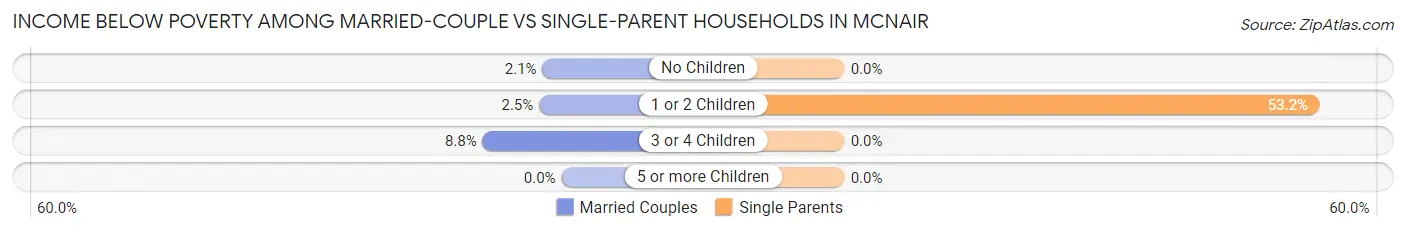
| Children | Married-Couple Families | Single-Parent Households |
| No Children | 30 (2.1%) | 0 (0.0%) |
| 1 or 2 Children | 57 (2.5%) | 215 (53.2%) |
| 3 or 4 Children | 15 (8.8%) | 0 (0.0%) |
| 5 or more Children | 0 (0.0%) | 0 (0.0%) |
| Total | 102 (2.6%) | 215 (21.9%) |
Race in McNair
The most populous races in McNair are Asian (8,252 | 37.2%), White / Caucasian (7,493 | 33.8%), and Black / African American (3,078 | 13.9%).
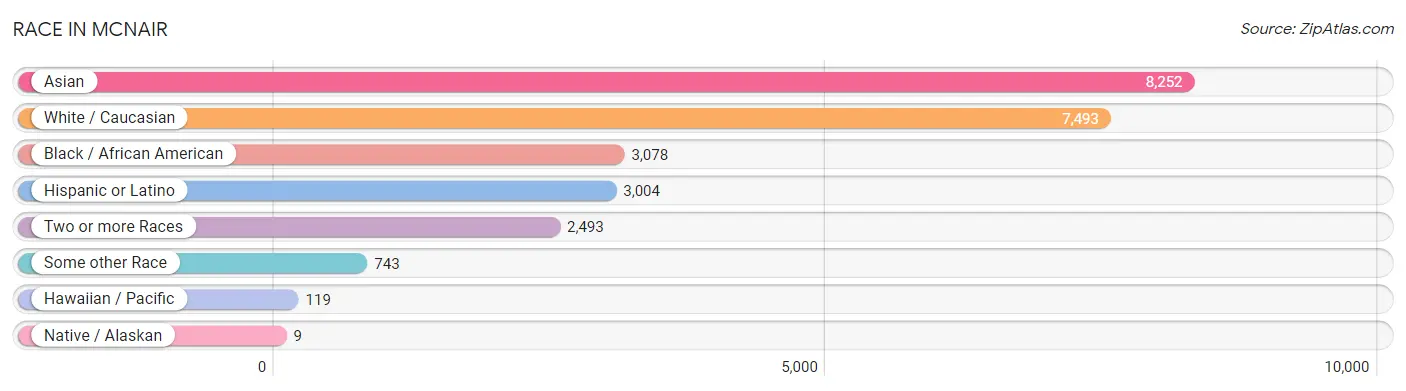
| Race | # Population | % Population |
| Asian | 8,252 | 37.2% |
| Black / African American | 3,078 | 13.9% |
| Hawaiian / Pacific | 119 | 0.5% |
| Hispanic or Latino | 3,004 | 13.5% |
| Native / Alaskan | 9 | 0.0% |
| White / Caucasian | 7,493 | 33.8% |
| Two or more Races | 2,493 | 11.2% |
| Some other Race | 743 | 3.4% |
| Total | 22,187 | 100.0% |
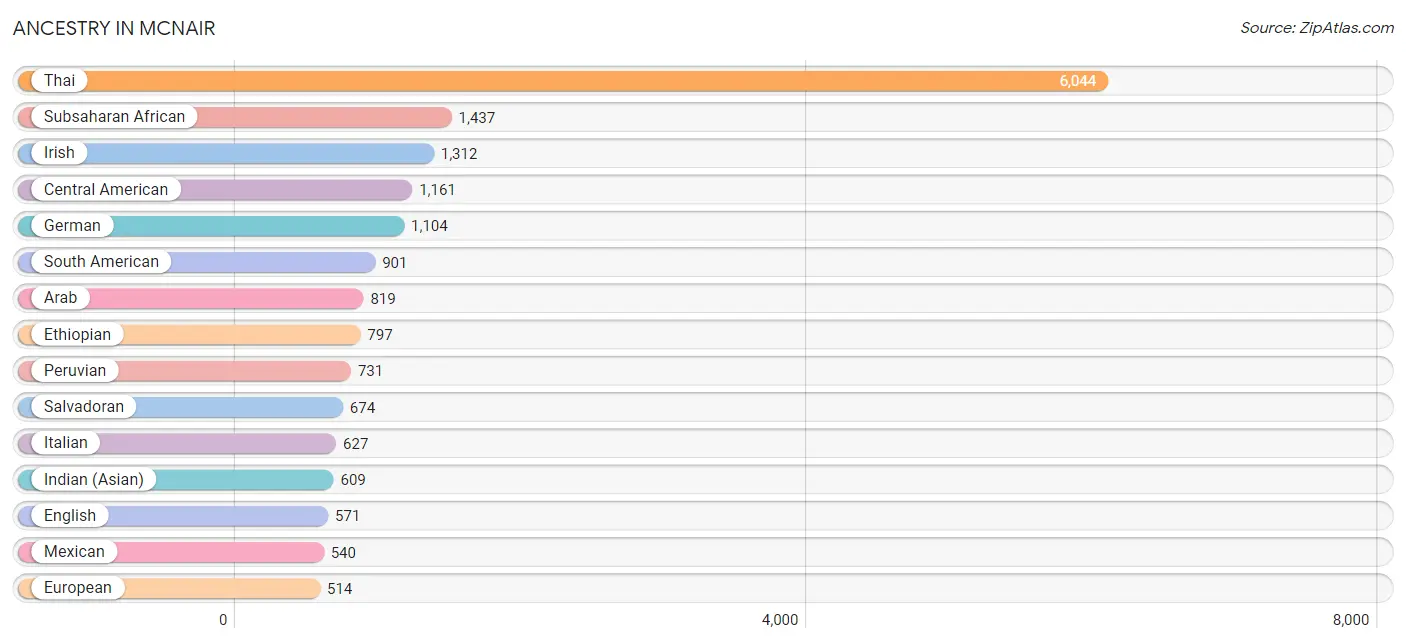
Ancestry in McNair
The most populous ancestries reported in McNair are Thai (6,044 | 27.2%), Subsaharan African (1,437 | 6.5%), Irish (1,312 | 5.9%), Central American (1,161 | 5.2%), and German (1,104 | 5.0%), together accounting for 49.8% of all McNair residents.
| Ancestry | # Population | % Population |
| Afghan | 287 | 1.3% |
| African | 97 | 0.4% |
| American | 373 | 1.7% |
| Arab | 819 | 3.7% |
| Argentinean | 17 | 0.1% |
| Austrian | 48 | 0.2% |
| Bhutanese | 65 | 0.3% |
| Bolivian | 70 | 0.3% |
| Brazilian | 29 | 0.1% |
| British | 254 | 1.1% |
| Burmese | 232 | 1.1% |
| Cambodian | 178 | 0.8% |
| Canadian | 20 | 0.1% |
| Cape Verdean | 16 | 0.1% |
| Celtic | 12 | 0.1% |
| Central American | 1,161 | 5.2% |
| Cherokee | 4 | 0.0% |
| Colombian | 18 | 0.1% |
| Costa Rican | 21 | 0.1% |
| Croatian | 30 | 0.1% |
| Danish | 16 | 0.1% |
| Dominican | 64 | 0.3% |
| Dutch | 194 | 0.9% |
| Eastern European | 72 | 0.3% |
| Ecuadorian | 37 | 0.2% |
| Egyptian | 268 | 1.2% |
| English | 571 | 2.6% |
| Ethiopian | 797 | 3.6% |
| European | 514 | 2.3% |
| Filipino | 14 | 0.1% |
| French | 245 | 1.1% |
| French Canadian | 93 | 0.4% |
| German | 1,104 | 5.0% |
| Greek | 120 | 0.5% |
| Guatemalan | 107 | 0.5% |
| Haitian | 24 | 0.1% |
| Honduran | 337 | 1.5% |
| Hungarian | 137 | 0.6% |
| Indian (Asian) | 609 | 2.7% |
| Irish | 1,312 | 5.9% |
| Italian | 627 | 2.8% |
| Jamaican | 25 | 0.1% |
| Japanese | 10 | 0.1% |
| Jordanian | 87 | 0.4% |
| Korean | 202 | 0.9% |
| Laotian | 162 | 0.7% |
| Latvian | 42 | 0.2% |
| Lebanese | 33 | 0.2% |
| Liberian | 32 | 0.1% |
| Lithuanian | 31 | 0.1% |
| Malaysian | 75 | 0.3% |
| Mexican | 540 | 2.4% |
| Mongolian | 154 | 0.7% |
| Native Hawaiian | 22 | 0.1% |
| Nicaraguan | 22 | 0.1% |
| Nigerian | 15 | 0.1% |
| Northern European | 8 | 0.0% |
| Norwegian | 168 | 0.8% |
| Pakistani | 224 | 1.0% |
| Palestinian | 53 | 0.2% |
| Pennsylvania German | 11 | 0.1% |
| Peruvian | 731 | 3.3% |
| Polish | 260 | 1.2% |
| Puerto Rican | 206 | 0.9% |
| Romanian | 7 | 0.0% |
| Russian | 154 | 0.7% |
| Salvadoran | 674 | 3.0% |
| Scandinavian | 31 | 0.1% |
| Scotch-Irish | 81 | 0.4% |
| Scottish | 171 | 0.8% |
| Serbian | 43 | 0.2% |
| Sierra Leonean | 63 | 0.3% |
| Slovak | 44 | 0.2% |
| Slovene | 17 | 0.1% |
| South American | 901 | 4.1% |
| Spaniard | 13 | 0.1% |
| Sri Lankan | 91 | 0.4% |
| Subsaharan African | 1,437 | 6.5% |
| Sudanese | 316 | 1.4% |
| Swedish | 115 | 0.5% |
| Swiss | 18 | 0.1% |
| Thai | 6,044 | 27.2% |
| Trinidadian and Tobagonian | 9 | 0.0% |
| Ukrainian | 46 | 0.2% |
| Uruguayan | 14 | 0.1% |
| Venezuelan | 14 | 0.1% |
| Welsh | 204 | 0.9% | View All 87 Rows |
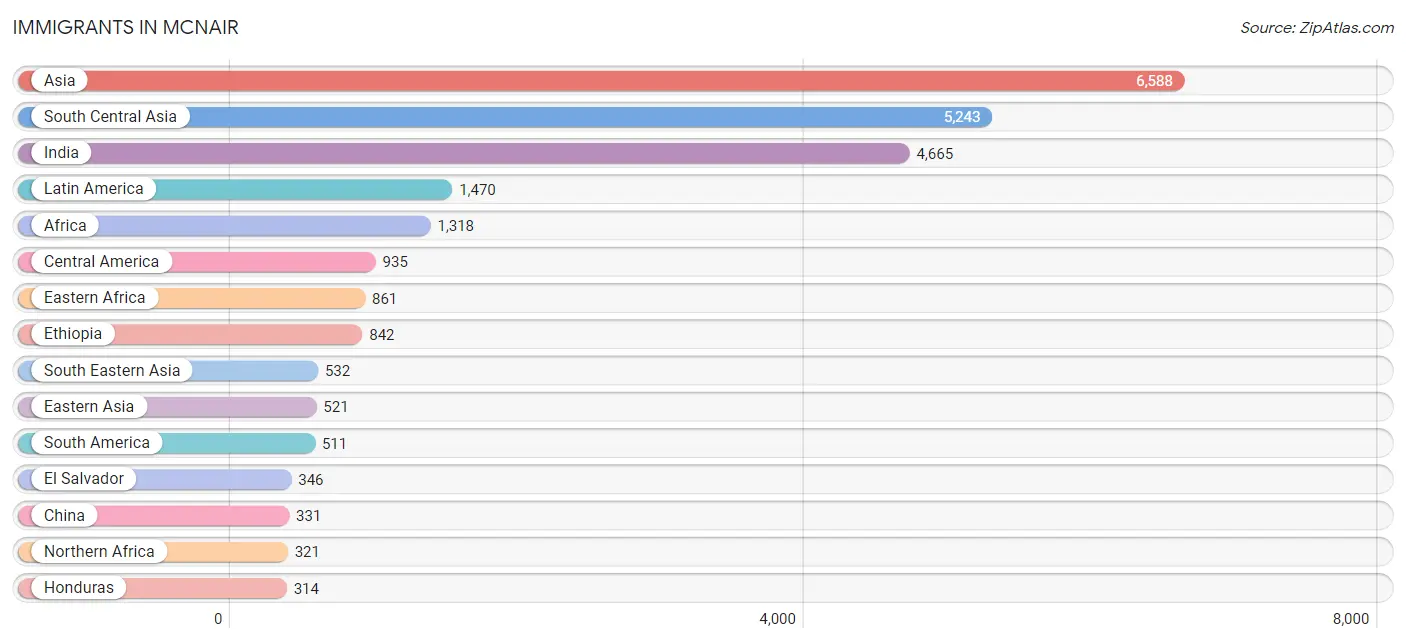
Immigrants in McNair
The most numerous immigrant groups reported in McNair came from Asia (6,588 | 29.7%), South Central Asia (5,243 | 23.6%), India (4,665 | 21.0%), Latin America (1,470 | 6.6%), and Africa (1,318 | 5.9%), together accounting for 86.9% of all McNair residents.
| Immigration Origin | # Population | % Population |
| Afghanistan | 234 | 1.1% |
| Africa | 1,318 | 5.9% |
| Argentina | 17 | 0.1% |
| Asia | 6,588 | 29.7% |
| Bangladesh | 10 | 0.1% |
| Bolivia | 61 | 0.3% |
| Bosnia and Herzegovina | 30 | 0.1% |
| Brazil | 99 | 0.4% |
| Cambodia | 5 | 0.0% |
| Canada | 27 | 0.1% |
| Caribbean | 24 | 0.1% |
| Central America | 935 | 4.2% |
| China | 331 | 1.5% |
| Colombia | 18 | 0.1% |
| Croatia | 9 | 0.0% |
| Czechoslovakia | 13 | 0.1% |
| Eastern Africa | 861 | 3.9% |
| Eastern Asia | 521 | 2.4% |
| Eastern Europe | 126 | 0.6% |
| Ecuador | 25 | 0.1% |
| Egypt | 59 | 0.3% |
| El Salvador | 346 | 1.6% |
| Ethiopia | 842 | 3.8% |
| Europe | 252 | 1.1% |
| France | 11 | 0.1% |
| Germany | 100 | 0.4% |
| Guatemala | 85 | 0.4% |
| Haiti | 24 | 0.1% |
| Honduras | 314 | 1.4% |
| Hong Kong | 8 | 0.0% |
| India | 4,665 | 21.0% |
| Indonesia | 116 | 0.5% |
| Iran | 29 | 0.1% |
| Italy | 7 | 0.0% |
| Japan | 26 | 0.1% |
| Jordan | 98 | 0.4% |
| Kazakhstan | 16 | 0.1% |
| Korea | 58 | 0.3% |
| Kuwait | 21 | 0.1% |
| Laos | 16 | 0.1% |
| Latin America | 1,470 | 6.6% |
| Latvia | 13 | 0.1% |
| Liberia | 32 | 0.1% |
| Malaysia | 124 | 0.6% |
| Mexico | 168 | 0.8% |
| Micronesia | 27 | 0.1% |
| Nepal | 85 | 0.4% |
| Nicaragua | 22 | 0.1% |
| Nigeria | 15 | 0.1% |
| Northern Africa | 321 | 1.5% |
| Northern Europe | 8 | 0.0% |
| Oceania | 27 | 0.1% |
| Pakistan | 186 | 0.8% |
| Peru | 277 | 1.3% |
| Philippines | 89 | 0.4% |
| Romania | 7 | 0.0% |
| Russia | 39 | 0.2% |
| Saudi Arabia | 130 | 0.6% |
| Sierra Leone | 55 | 0.3% |
| South America | 511 | 2.3% |
| South Central Asia | 5,243 | 23.6% |
| South Eastern Asia | 532 | 2.4% |
| Southern Europe | 7 | 0.0% |
| Sri Lanka | 18 | 0.1% |
| Sudan | 258 | 1.2% |
| Taiwan | 43 | 0.2% |
| Thailand | 139 | 0.6% |
| Ukraine | 15 | 0.1% |
| Uruguay | 14 | 0.1% |
| Vietnam | 43 | 0.2% |
| Western Africa | 136 | 0.6% |
| Western Asia | 282 | 1.3% |
| Western Europe | 111 | 0.5% | View All 73 Rows |
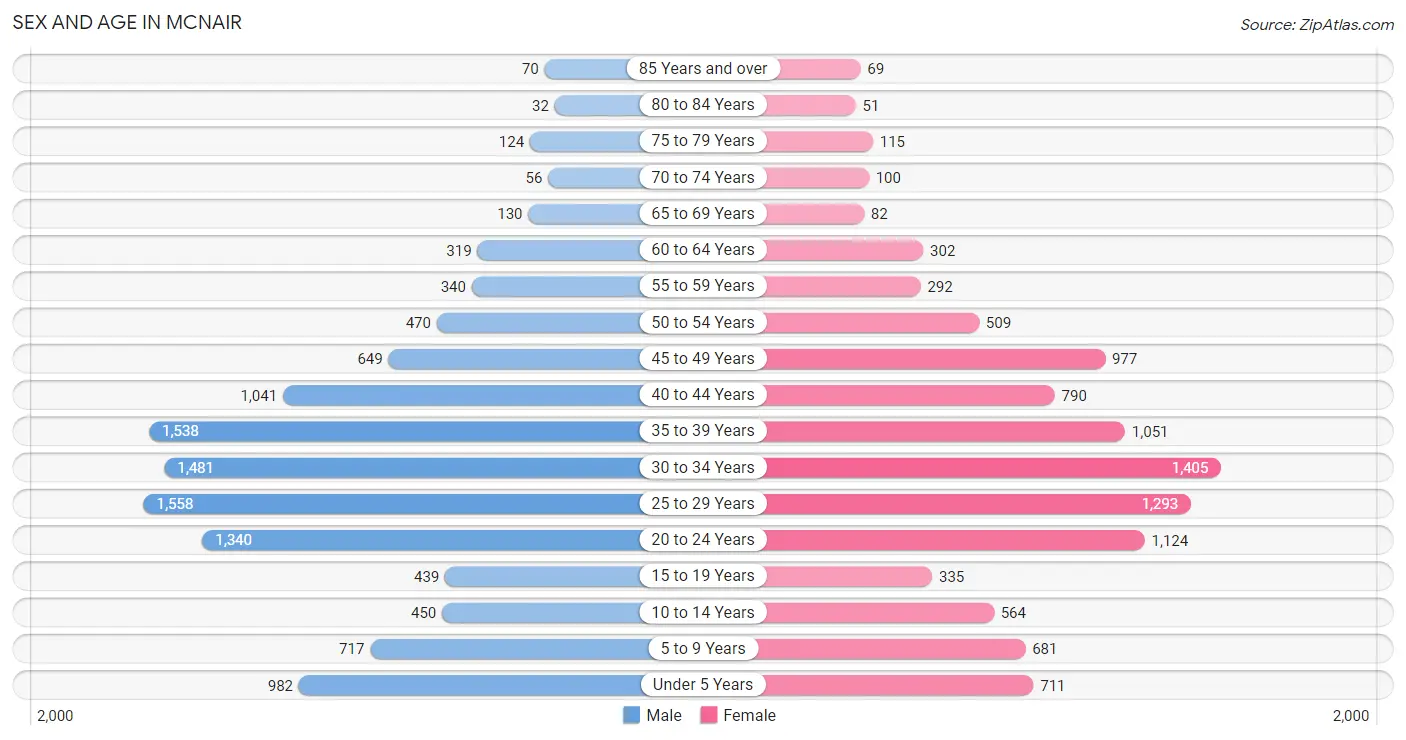
Sex and Age in McNair
Sex and Age in McNair
The most populous age groups in McNair are 25 to 29 Years (1,558 | 13.3%) for men and 30 to 34 Years (1,405 | 13.4%) for women.
| Age Bracket | Male | Female |
| Under 5 Years | 982 (8.4%) | 711 (6.8%) |
| 5 to 9 Years | 717 (6.1%) | 681 (6.5%) |
| 10 to 14 Years | 450 (3.8%) | 564 (5.4%) |
| 15 to 19 Years | 439 (3.7%) | 335 (3.2%) |
| 20 to 24 Years | 1,340 (11.4%) | 1,124 (10.7%) |
| 25 to 29 Years | 1,558 (13.3%) | 1,293 (12.4%) |
| 30 to 34 Years | 1,481 (12.6%) | 1,405 (13.4%) |
| 35 to 39 Years | 1,538 (13.1%) | 1,051 (10.1%) |
| 40 to 44 Years | 1,041 (8.9%) | 790 (7.6%) |
| 45 to 49 Years | 649 (5.5%) | 977 (9.3%) |
| 50 to 54 Years | 470 (4.0%) | 509 (4.9%) |
| 55 to 59 Years | 340 (2.9%) | 292 (2.8%) |
| 60 to 64 Years | 319 (2.7%) | 302 (2.9%) |
| 65 to 69 Years | 130 (1.1%) | 82 (0.8%) |
| 70 to 74 Years | 56 (0.5%) | 100 (1.0%) |
| 75 to 79 Years | 124 (1.1%) | 115 (1.1%) |
| 80 to 84 Years | 32 (0.3%) | 51 (0.5%) |
| 85 Years and over | 70 (0.6%) | 69 (0.7%) |
| Total | 11,736 (100.0%) | 10,451 (100.0%) |
Families and Households in McNair
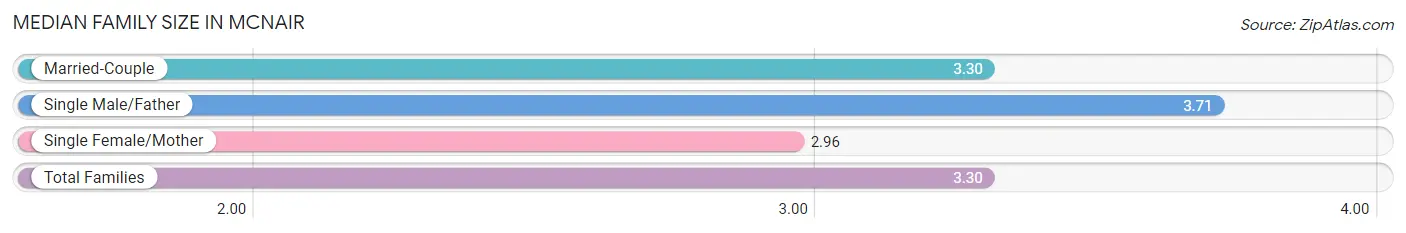
Median Family Size in McNair
The median family size in McNair is 3.30 persons per family, with single male/father families (463 | 9.6%) accounting for the largest median family size of 3.71 persons per family. On the other hand, single female/mother families (520 | 10.7%) represent the smallest median family size with 2.96 persons per family.
| Family Type | # Families | Family Size |
| Married-Couple | 3,856 (79.7%) | 3.30 |
| Single Male/Father | 463 (9.6%) | 3.71 |
| Single Female/Mother | 520 (10.7%) | 2.96 |
| Total Families | 4,839 (100.0%) | 3.30 |
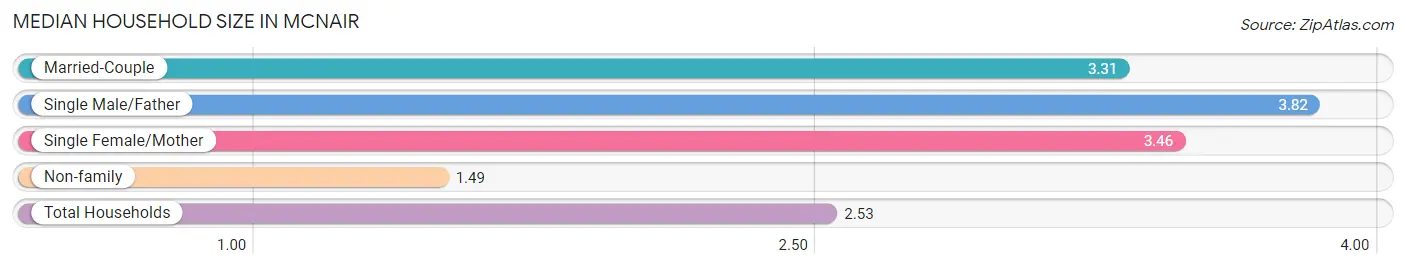
Median Household Size in McNair
The median household size in McNair is 2.53 persons per household, with single male/father households (463 | 5.3%) accounting for the largest median household size of 3.82 persons per household. non-family households (3,920 | 44.8%) represent the smallest median household size with 1.49 persons per household.
| Household Type | # Households | Household Size |
| Married-Couple | 3,856 (44.0%) | 3.31 |
| Single Male/Father | 463 (5.3%) | 3.82 |
| Single Female/Mother | 520 (5.9%) | 3.46 |
| Non-family | 3,920 (44.8%) | 1.49 |
| Total Households | 8,759 (100.0%) | 2.53 |
Household Size by Marriage Status in McNair
Out of a total of 8,759 households in McNair, 4,839 (55.2%) are family households, while 3,920 (44.8%) are nonfamily households. The most numerous type of family households are 4-person households, comprising 1,633, and the most common type of nonfamily households are 1-person households, comprising 2,533.
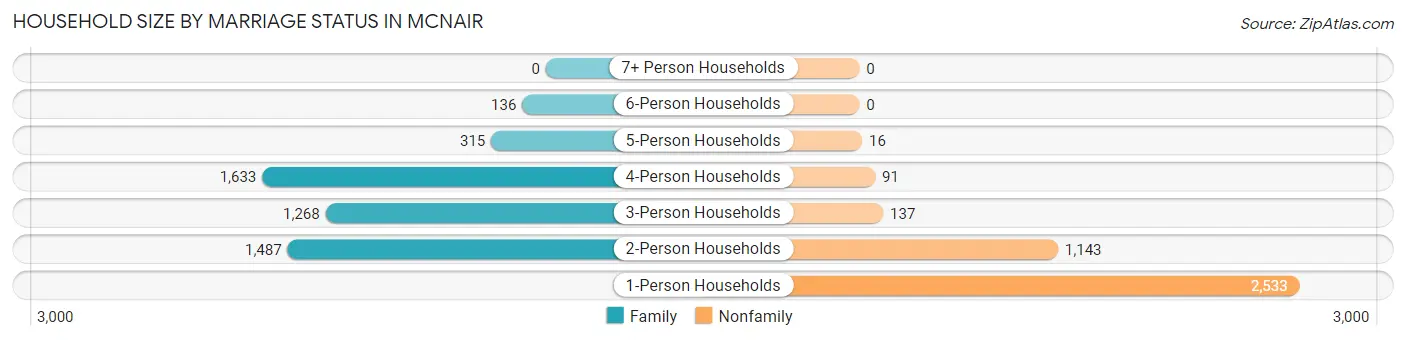
| Household Size | Family Households | Nonfamily Households |
| 1-Person Households | - | 2,533 (28.9%) |
| 2-Person Households | 1,487 (17.0%) | 1,143 (13.1%) |
| 3-Person Households | 1,268 (14.5%) | 137 (1.6%) |
| 4-Person Households | 1,633 (18.6%) | 91 (1.0%) |
| 5-Person Households | 315 (3.6%) | 16 (0.2%) |
| 6-Person Households | 136 (1.5%) | 0 (0.0%) |
| 7+ Person Households | 0 (0.0%) | 0 (0.0%) |
| Total | 4,839 (55.2%) | 3,920 (44.8%) |
Female Fertility in McNair
Fertility by Age in McNair
Average fertility rate in McNair is 58.0 births per 1,000 women. Women in the age bracket of 20 to 34 years have the highest fertility rate with 81.0 births per 1,000 women. Women in the age bracket of 20 to 34 years acount for 74.9% of all women with births.
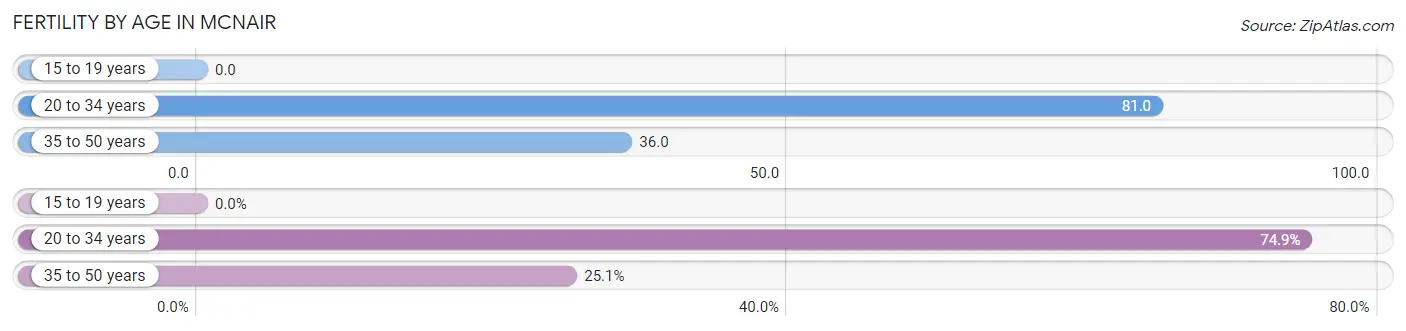
| Age Bracket | Women with Births | Births / 1,000 Women |
| 15 to 19 years | 0 (0.0%) | 0.0 |
| 20 to 34 years | 308 (74.9%) | 81.0 |
| 35 to 50 years | 103 (25.1%) | 36.0 |
| Total | 411 (100.0%) | 58.0 |
Fertility by Age by Marriage Status in McNair
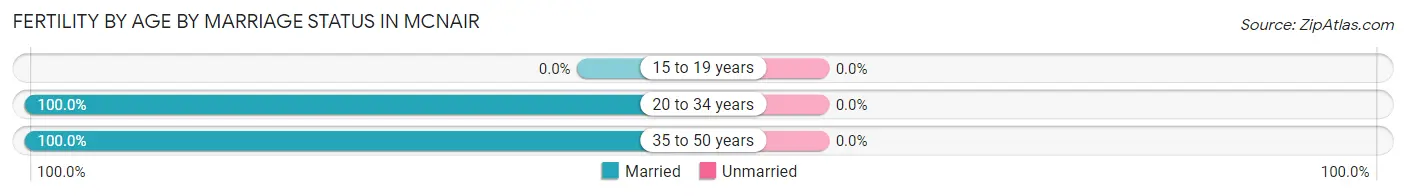
| Age Bracket | Married | Unmarried |
| 15 to 19 years | 0 (0.0%) | 0 (0.0%) |
| 20 to 34 years | 308 (100.0%) | 0 (0.0%) |
| 35 to 50 years | 103 (100.0%) | 0 (0.0%) |
| Total | 411 (100.0%) | 0 (0.0%) |
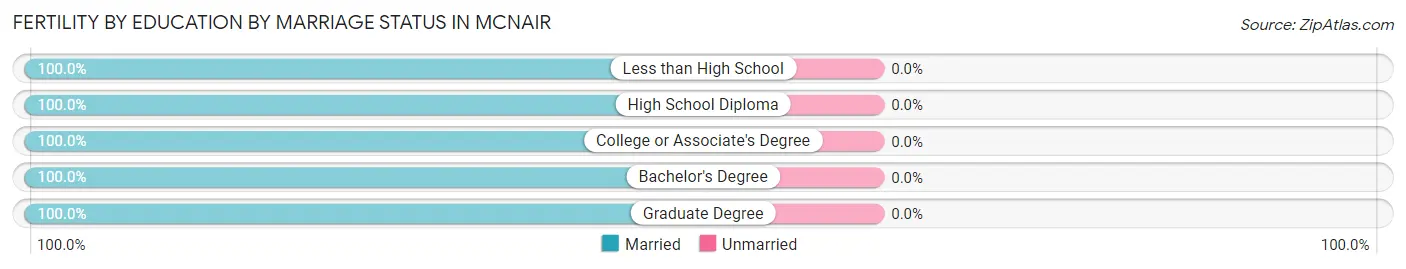
Fertility by Education in McNair
Average fertility rate in McNair is 58.0 births per 1,000 women. Women with the education attainment of graduate degree have the highest fertility rate of 85.0 births per 1,000 women, while women with the education attainment of less than high school have the lowest fertility at 19.0 births per 1,000 women. Women with the education attainment of bachelor's degree represent 54.5% of all women with births.
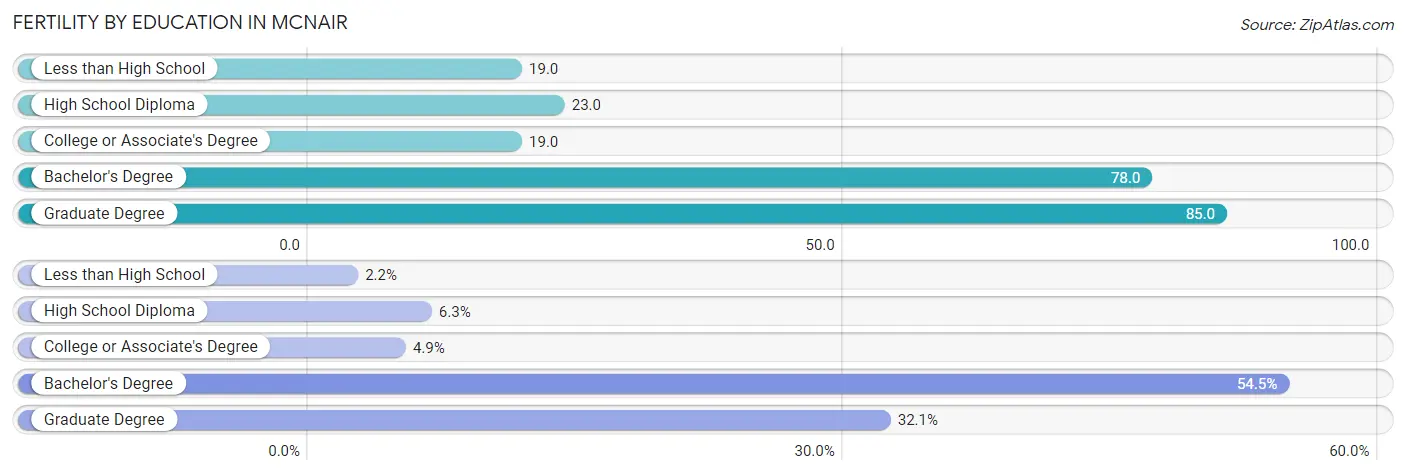
| Educational Attainment | Women with Births | Births / 1,000 Women |
| Less than High School | 9 (2.2%) | 19.0 |
| High School Diploma | 26 (6.3%) | 23.0 |
| College or Associate's Degree | 20 (4.9%) | 19.0 |
| Bachelor's Degree | 224 (54.5%) | 78.0 |
| Graduate Degree | 132 (32.1%) | 85.0 |
| Total | 411 (100.0%) | 58.0 |
Fertility by Education by Marriage Status in McNair
| Educational Attainment | Married | Unmarried |
| Less than High School | 9 (100.0%) | 0 (0.0%) |
| High School Diploma | 26 (100.0%) | 0 (0.0%) |
| College or Associate's Degree | 20 (100.0%) | 0 (0.0%) |
| Bachelor's Degree | 224 (100.0%) | 0 (0.0%) |
| Graduate Degree | 132 (100.0%) | 0 (0.0%) |
| Total | 411 (100.0%) | 0 (0.0%) |
Employment Characteristics in McNair
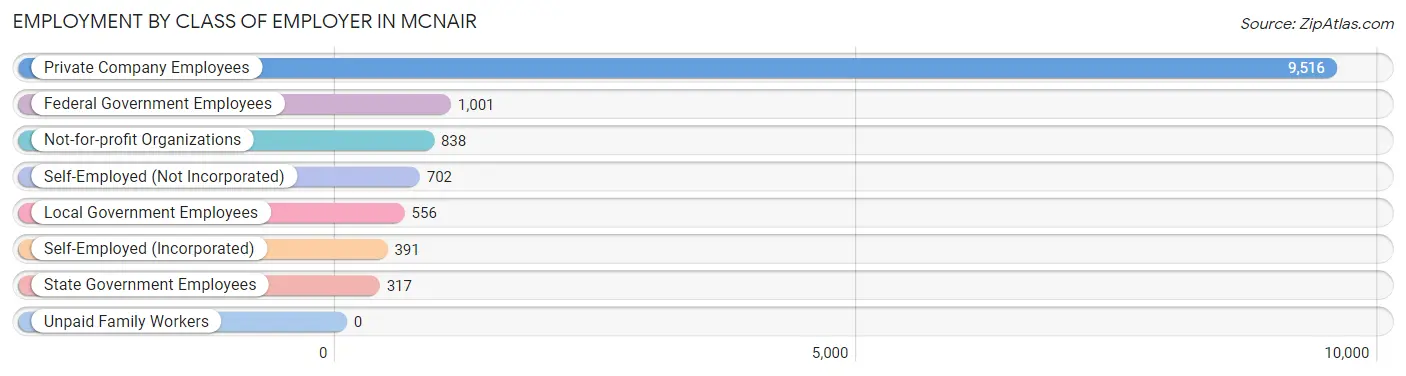
Employment by Class of Employer in McNair
Among the 13,321 employed individuals in McNair, private company employees (9,516 | 71.4%), federal government employees (1,001 | 7.5%), and not-for-profit organizations (838 | 6.3%) make up the most common classes of employment.
| Employer Class | # Employees | % Employees |
| Private Company Employees | 9,516 | 71.4% |
| Self-Employed (Incorporated) | 391 | 2.9% |
| Self-Employed (Not Incorporated) | 702 | 5.3% |
| Not-for-profit Organizations | 838 | 6.3% |
| Local Government Employees | 556 | 4.2% |
| State Government Employees | 317 | 2.4% |
| Federal Government Employees | 1,001 | 7.5% |
| Unpaid Family Workers | 0 | 0.0% |
| Total | 13,321 | 100.0% |
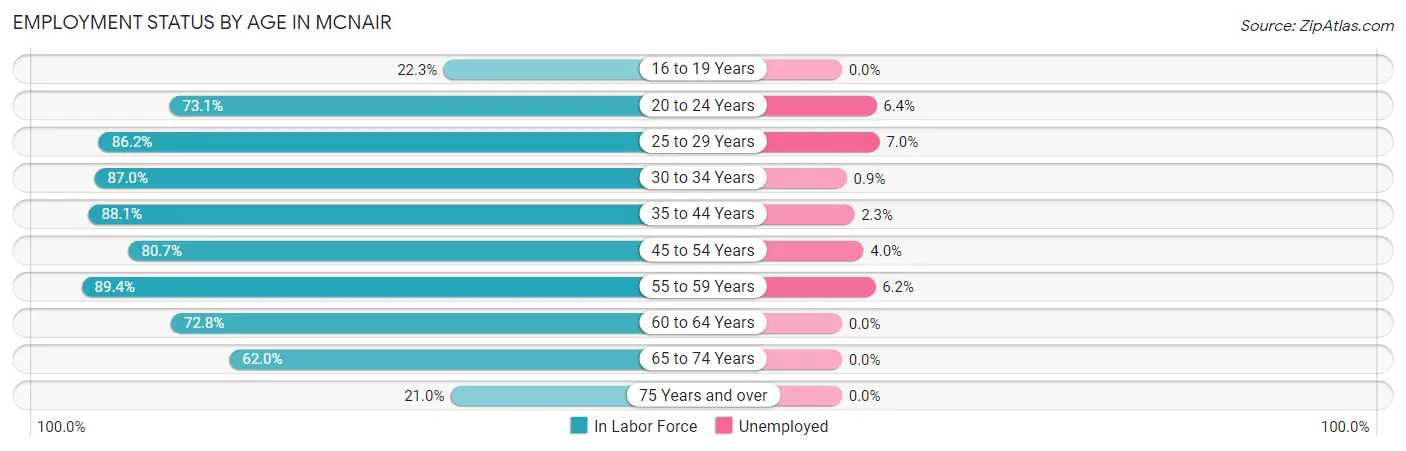
Employment Status by Age in McNair
According to the labor force statistics for McNair, out of the total population over 16 years of age (17,962), 79.4% or 14,262 individuals are in the labor force, with 3.6% or 513 of them unemployed. The age group with the highest labor force participation rate is 55 to 59 years, with 89.4% or 565 individuals in the labor force. Within the labor force, the 25 to 29 years age range has the highest percentage of unemployed individuals, with 7.0% or 172 of them being unemployed.
| Age Bracket | In Labor Force | Unemployed |
| 16 to 19 Years | 146 (22.3%) | 0 (0.0%) |
| 20 to 24 Years | 1,801 (73.1%) | 115 (6.4%) |
| 25 to 29 Years | 2,458 (86.2%) | 172 (7.0%) |
| 30 to 34 Years | 2,511 (87.0%) | 23 (0.9%) |
| 35 to 44 Years | 3,894 (88.1%) | 90 (2.3%) |
| 45 to 54 Years | 2,102 (80.7%) | 84 (4.0%) |
| 55 to 59 Years | 565 (89.4%) | 35 (6.2%) |
| 60 to 64 Years | 452 (72.8%) | 0 (0.0%) |
| 65 to 74 Years | 228 (62.0%) | 0 (0.0%) |
| 75 Years and over | 97 (21.0%) | 0 (0.0%) |
| Total | 14,262 (79.4%) | 513 (3.6%) |
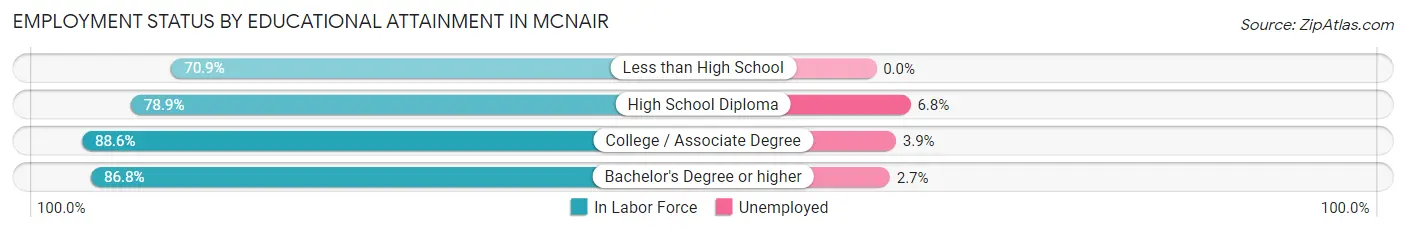
Employment Status by Educational Attainment in McNair
According to labor force statistics for McNair, 85.5% of individuals (11,983) out of the total population between 25 and 64 years of age (14,015) are in the labor force, with 3.4% or 407 of them being unemployed. The group with the highest labor force participation rate are those with the educational attainment of college / associate degree, with 88.6% or 1,998 individuals in the labor force. Within the labor force, individuals with high school diploma education have the highest percentage of unemployment, with 6.8% or 105 of them being unemployed.
| Educational Attainment | In Labor Force | Unemployed |
| Less than High School | 321 (70.9%) | 0 (0.0%) |
| High School Diploma | 1,550 (78.9%) | 134 (6.8%) |
| College / Associate Degree | 1,998 (88.6%) | 88 (3.9%) |
| Bachelor's Degree or higher | 8,110 (86.8%) | 252 (2.7%) |
| Total | 11,983 (85.5%) | 477 (3.4%) |
Employment Occupations by Sex in McNair
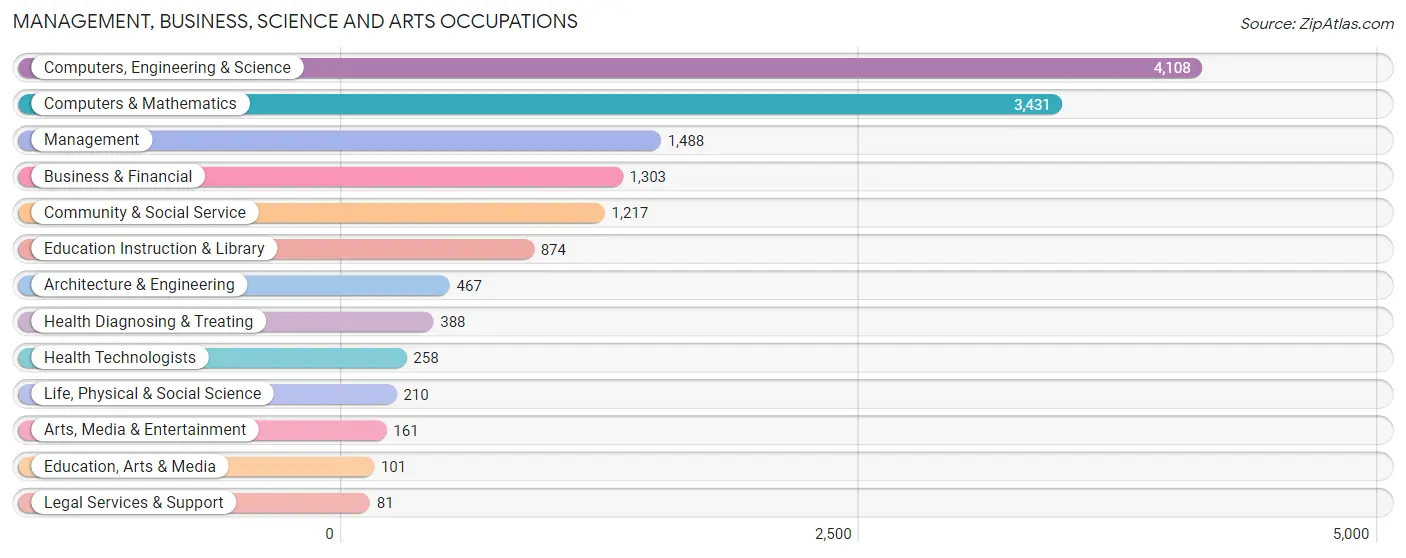
Management, Business, Science and Arts Occupations
The most common Management, Business, Science and Arts occupations in McNair are Computers, Engineering & Science (4,108 | 30.1%), Computers & Mathematics (3,431 | 25.1%), Management (1,488 | 10.9%), Business & Financial (1,303 | 9.5%), and Community & Social Service (1,217 | 8.9%).
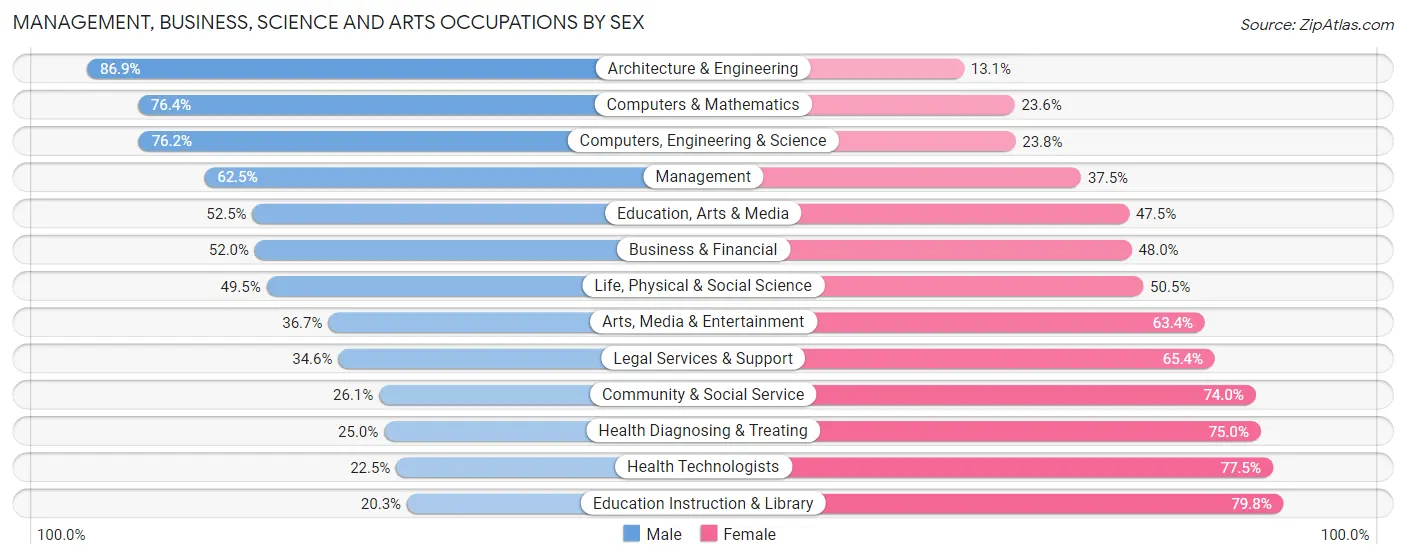
Management, Business, Science and Arts Occupations by Sex
Within the Management, Business, Science and Arts occupations in McNair, the most male-oriented occupations are Architecture & Engineering (86.9%), Computers & Mathematics (76.4%), and Computers, Engineering & Science (76.2%), while the most female-oriented occupations are Education Instruction & Library (79.7%), Health Technologists (77.5%), and Health Diagnosing & Treating (75.0%).
| Occupation | Male | Female |
| Management | 930 (62.5%) | 558 (37.5%) |
| Business & Financial | 677 (52.0%) | 626 (48.0%) |
| Computers, Engineering & Science | 3,130 (76.2%) | 978 (23.8%) |
| Computers & Mathematics | 2,620 (76.4%) | 811 (23.6%) |
| Architecture & Engineering | 406 (86.9%) | 61 (13.1%) |
| Life, Physical & Social Science | 104 (49.5%) | 106 (50.5%) |
| Community & Social Service | 317 (26.1%) | 900 (74.0%) |
| Education, Arts & Media | 53 (52.5%) | 48 (47.5%) |
| Legal Services & Support | 28 (34.6%) | 53 (65.4%) |
| Education Instruction & Library | 177 (20.3%) | 697 (79.7%) |
| Arts, Media & Entertainment | 59 (36.6%) | 102 (63.3%) |
| Health Diagnosing & Treating | 97 (25.0%) | 291 (75.0%) |
| Health Technologists | 58 (22.5%) | 200 (77.5%) |
| Total (Category) | 5,151 (60.6%) | 3,353 (39.4%) |
| Total (Overall) | 8,109 (59.3%) | 5,556 (40.7%) |
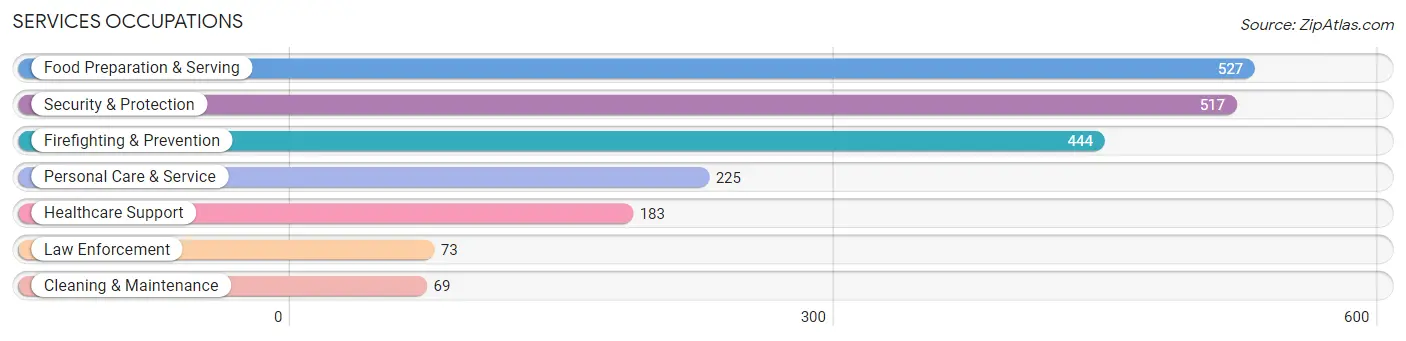
Services Occupations
The most common Services occupations in McNair are Food Preparation & Serving (527 | 3.9%), Security & Protection (517 | 3.8%), Firefighting & Prevention (444 | 3.3%), Personal Care & Service (225 | 1.7%), and Healthcare Support (183 | 1.3%).
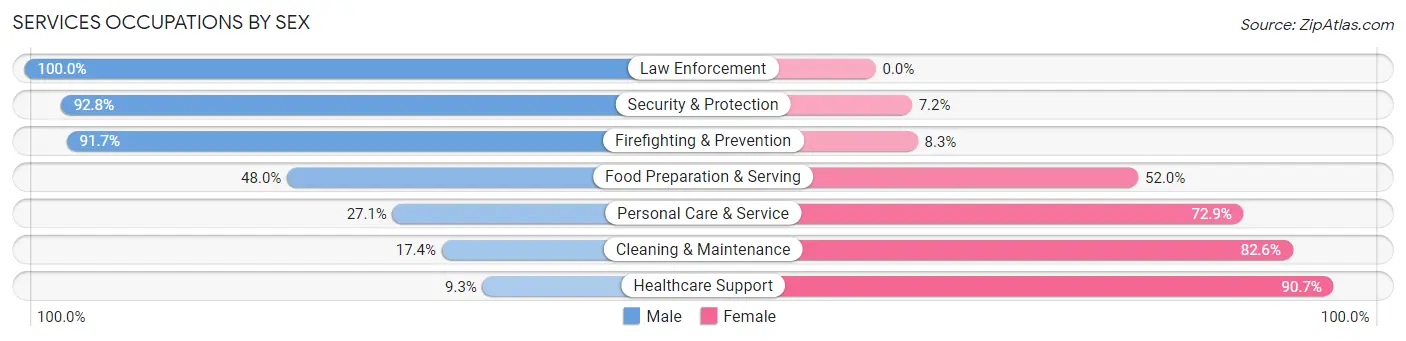
Services Occupations by Sex
Within the Services occupations in McNair, the most male-oriented occupations are Law Enforcement (100.0%), Security & Protection (92.8%), and Firefighting & Prevention (91.7%), while the most female-oriented occupations are Healthcare Support (90.7%), Cleaning & Maintenance (82.6%), and Personal Care & Service (72.9%).
| Occupation | Male | Female |
| Healthcare Support | 17 (9.3%) | 166 (90.7%) |
| Security & Protection | 480 (92.8%) | 37 (7.2%) |
| Firefighting & Prevention | 407 (91.7%) | 37 (8.3%) |
| Law Enforcement | 73 (100.0%) | 0 (0.0%) |
| Food Preparation & Serving | 253 (48.0%) | 274 (52.0%) |
| Cleaning & Maintenance | 12 (17.4%) | 57 (82.6%) |
| Personal Care & Service | 61 (27.1%) | 164 (72.9%) |
| Total (Category) | 823 (54.1%) | 698 (45.9%) |
| Total (Overall) | 8,109 (59.3%) | 5,556 (40.7%) |
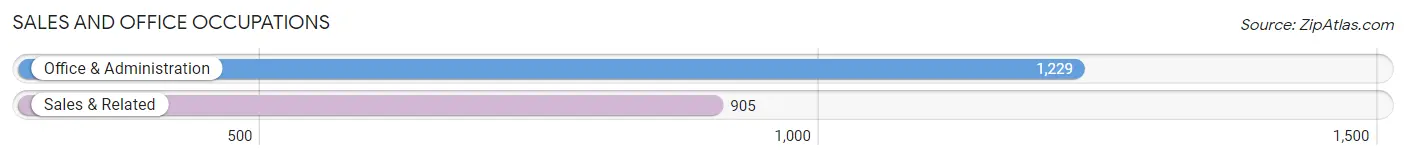
Sales and Office Occupations
The most common Sales and Office occupations in McNair are Office & Administration (1,229 | 9.0%), and Sales & Related (905 | 6.6%).
Sales and Office Occupations by Sex
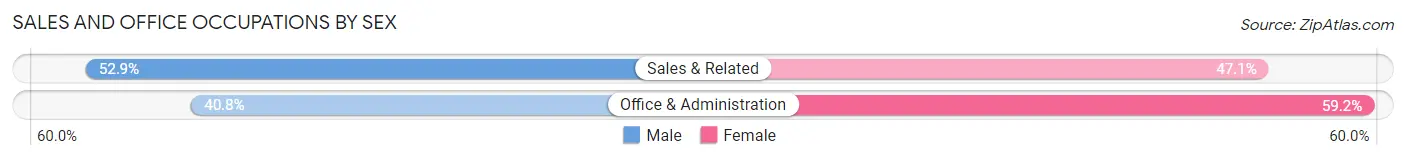
| Occupation | Male | Female |
| Sales & Related | 479 (52.9%) | 426 (47.1%) |
| Office & Administration | 501 (40.8%) | 728 (59.2%) |
| Total (Category) | 980 (45.9%) | 1,154 (54.1%) |
| Total (Overall) | 8,109 (59.3%) | 5,556 (40.7%) |
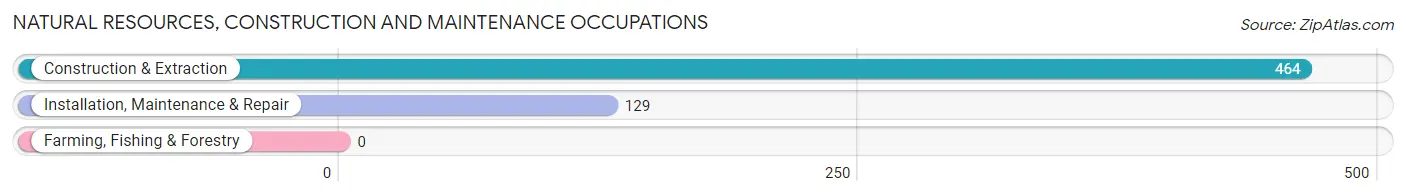
Natural Resources, Construction and Maintenance Occupations
The most common Natural Resources, Construction and Maintenance occupations in McNair are Construction & Extraction (464 | 3.4%), and Installation, Maintenance & Repair (129 | 0.9%).
Natural Resources, Construction and Maintenance Occupations by Sex
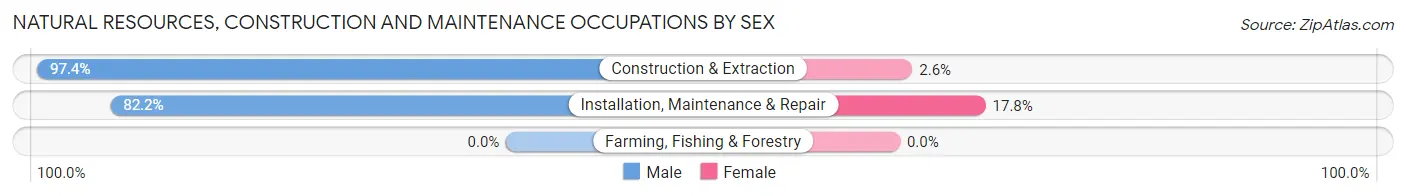
| Occupation | Male | Female |
| Farming, Fishing & Forestry | 0 (0.0%) | 0 (0.0%) |
| Construction & Extraction | 452 (97.4%) | 12 (2.6%) |
| Installation, Maintenance & Repair | 106 (82.2%) | 23 (17.8%) |
| Total (Category) | 558 (94.1%) | 35 (5.9%) |
| Total (Overall) | 8,109 (59.3%) | 5,556 (40.7%) |
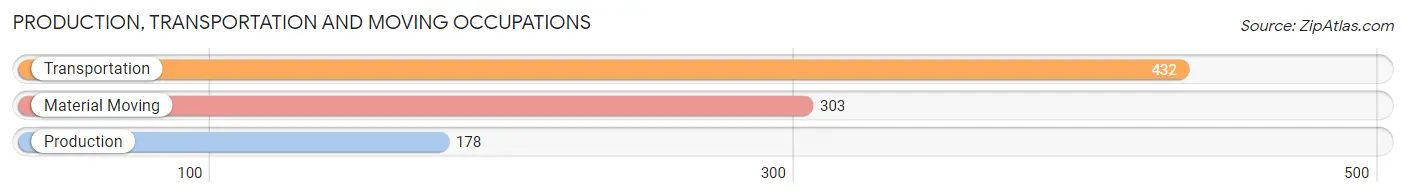
Production, Transportation and Moving Occupations
The most common Production, Transportation and Moving occupations in McNair are Transportation (432 | 3.2%), Material Moving (303 | 2.2%), and Production (178 | 1.3%).
Production, Transportation and Moving Occupations by Sex
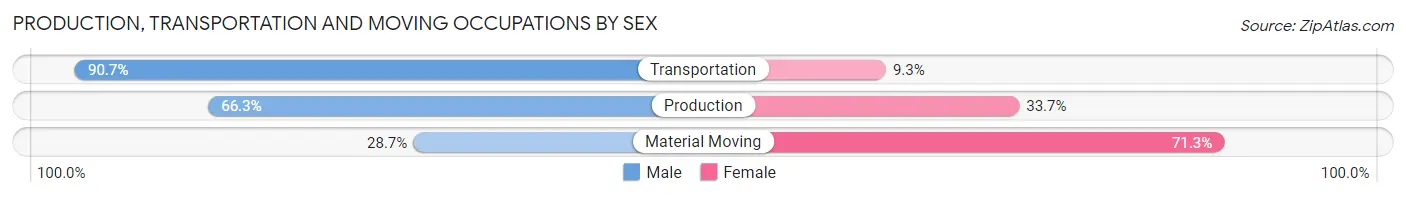
| Occupation | Male | Female |
| Production | 118 (66.3%) | 60 (33.7%) |
| Transportation | 392 (90.7%) | 40 (9.3%) |
| Material Moving | 87 (28.7%) | 216 (71.3%) |
| Total (Category) | 597 (65.4%) | 316 (34.6%) |
| Total (Overall) | 8,109 (59.3%) | 5,556 (40.7%) |
Employment Industries by Sex in McNair
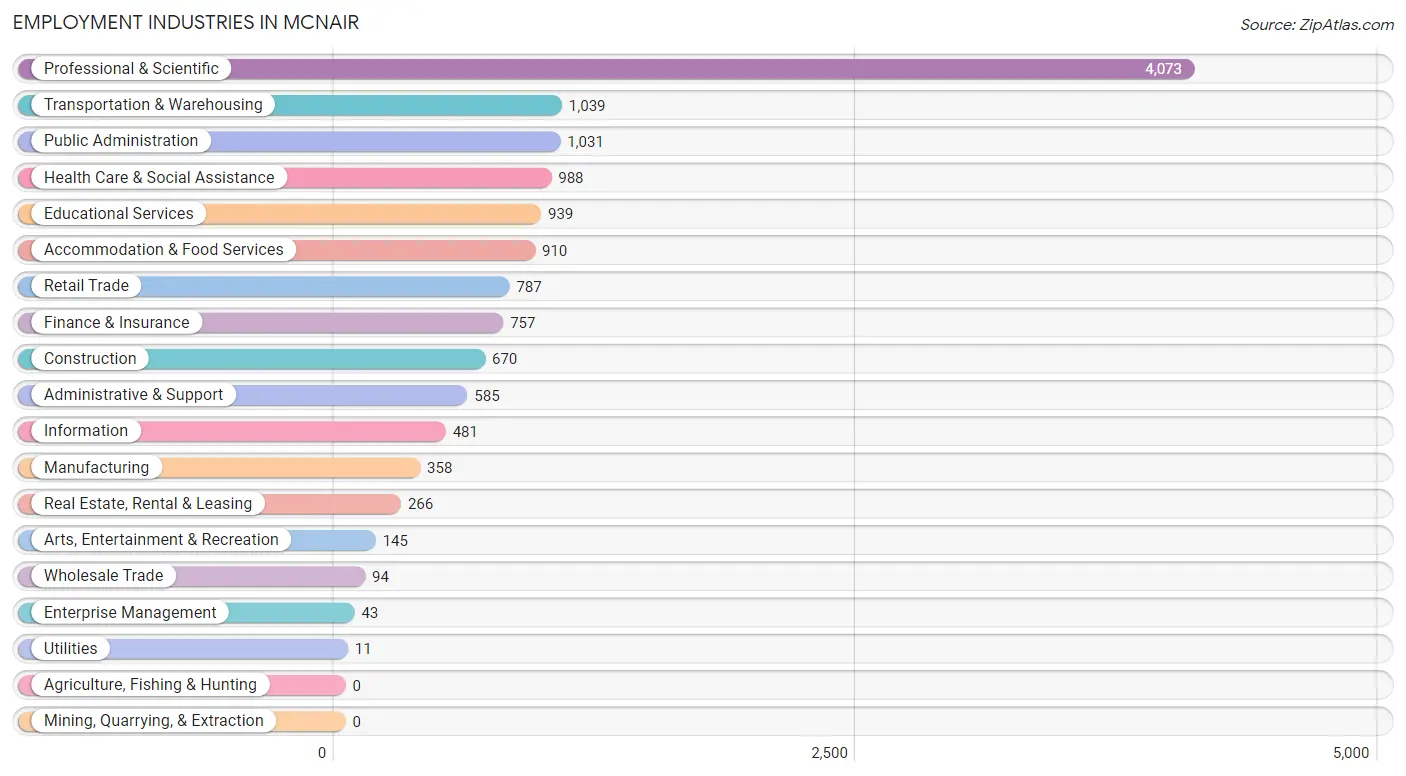
Employment Industries in McNair
The major employment industries in McNair include Professional & Scientific (4,073 | 29.8%), Transportation & Warehousing (1,039 | 7.6%), Public Administration (1,031 | 7.5%), Health Care & Social Assistance (988 | 7.2%), and Educational Services (939 | 6.9%).
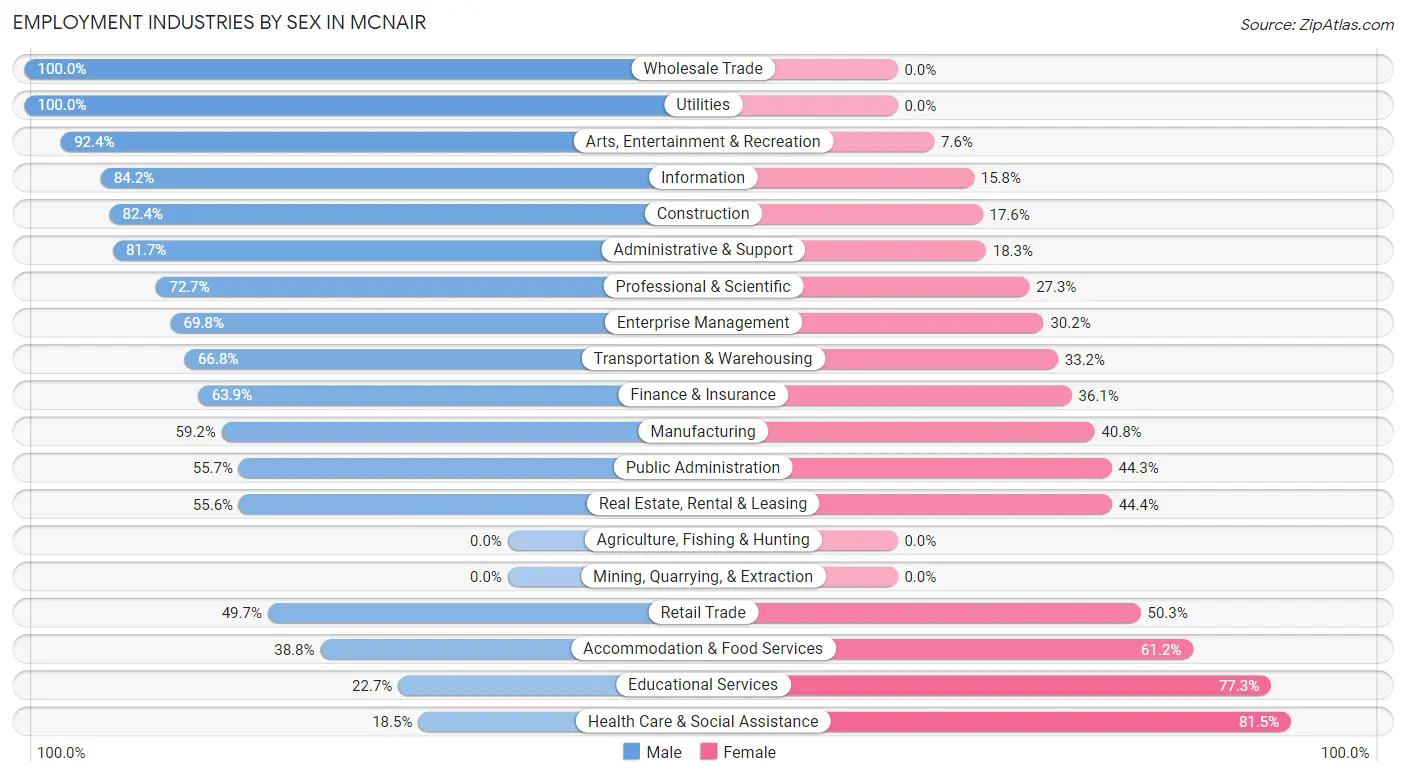
Employment Industries by Sex in McNair
The McNair industries that see more men than women are Wholesale Trade (100.0%), Utilities (100.0%), and Arts, Entertainment & Recreation (92.4%), whereas the industries that tend to have a higher number of women are Health Care & Social Assistance (81.5%), Educational Services (77.3%), and Accommodation & Food Services (61.2%).
| Industry | Male | Female |
| Agriculture, Fishing & Hunting | 0 (0.0%) | 0 (0.0%) |
| Mining, Quarrying, & Extraction | 0 (0.0%) | 0 (0.0%) |
| Construction | 552 (82.4%) | 118 (17.6%) |
| Manufacturing | 212 (59.2%) | 146 (40.8%) |
| Wholesale Trade | 94 (100.0%) | 0 (0.0%) |
| Retail Trade | 391 (49.7%) | 396 (50.3%) |
| Transportation & Warehousing | 694 (66.8%) | 345 (33.2%) |
| Utilities | 11 (100.0%) | 0 (0.0%) |
| Information | 405 (84.2%) | 76 (15.8%) |
| Finance & Insurance | 484 (63.9%) | 273 (36.1%) |
| Real Estate, Rental & Leasing | 148 (55.6%) | 118 (44.4%) |
| Professional & Scientific | 2,962 (72.7%) | 1,111 (27.3%) |
| Enterprise Management | 30 (69.8%) | 13 (30.2%) |
| Administrative & Support | 478 (81.7%) | 107 (18.3%) |
| Educational Services | 213 (22.7%) | 726 (77.3%) |
| Health Care & Social Assistance | 183 (18.5%) | 805 (81.5%) |
| Arts, Entertainment & Recreation | 134 (92.4%) | 11 (7.6%) |
| Accommodation & Food Services | 353 (38.8%) | 557 (61.2%) |
| Public Administration | 574 (55.7%) | 457 (44.3%) |
| Total | 8,109 (59.3%) | 5,556 (40.7%) |
Education in McNair
School Enrollment in McNair
The most common levels of schooling among the 4,513 students in McNair are college / undergraduate (1,151 | 25.5%), elementary school (825 | 18.3%), and middle school (695 | 15.4%).
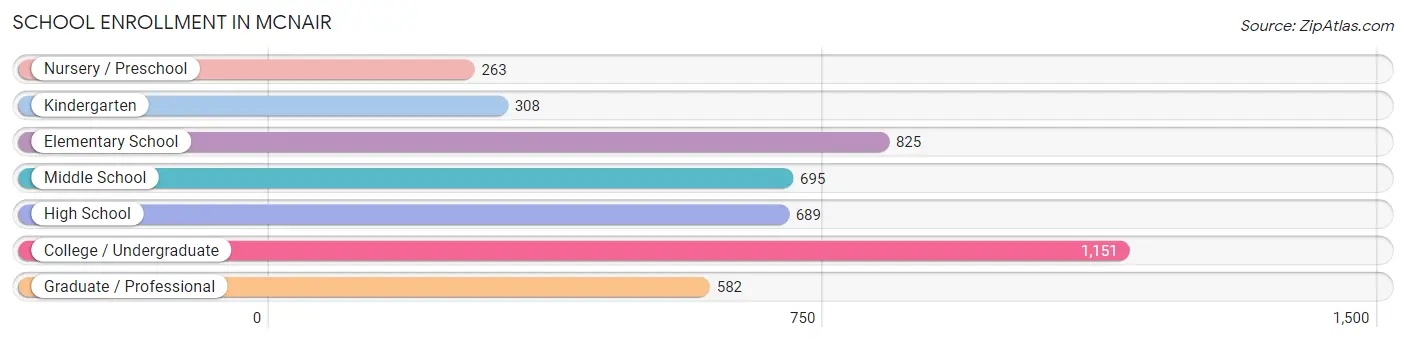
| School Level | # Students | % Students |
| Nursery / Preschool | 263 | 5.8% |
| Kindergarten | 308 | 6.8% |
| Elementary School | 825 | 18.3% |
| Middle School | 695 | 15.4% |
| High School | 689 | 15.3% |
| College / Undergraduate | 1,151 | 25.5% |
| Graduate / Professional | 582 | 12.9% |
| Total | 4,513 | 100.0% |
School Enrollment by Age by Funding Source in McNair
Out of a total of 4,513 students who are enrolled in schools in McNair, 821 (18.2%) attend a private institution, while the remaining 3,692 (81.8%) are enrolled in public schools. The age group of 3 to 4 year olds has the highest likelihood of being enrolled in private schools, with 150 (60.0% in the age bracket) enrolled. Conversely, the age group of 18 to 19 year olds has the lowest likelihood of being enrolled in a private school, with 128 (100.0% in the age bracket) attending a public institution.
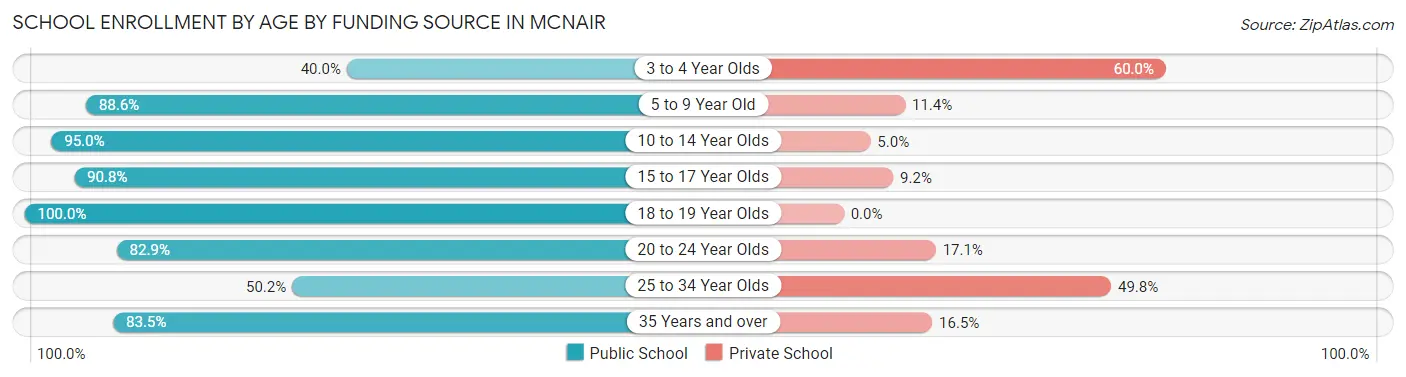
| Age Bracket | Public School | Private School |
| 3 to 4 Year Olds | 100 (40.0%) | 150 (60.0%) |
| 5 to 9 Year Old | 930 (88.6%) | 120 (11.4%) |
| 10 to 14 Year Olds | 821 (95.0%) | 43 (5.0%) |
| 15 to 17 Year Olds | 512 (90.8%) | 52 (9.2%) |
| 18 to 19 Year Olds | 128 (100.0%) | 0 (0.0%) |
| 20 to 24 Year Olds | 783 (82.9%) | 162 (17.1%) |
| 25 to 34 Year Olds | 269 (50.2%) | 267 (49.8%) |
| 35 Years and over | 147 (83.5%) | 29 (16.5%) |
| Total | 3,692 (81.8%) | 821 (18.2%) |
Educational Attainment by Field of Study in McNair
Business (1,866 | 18.2%), engineering (1,723 | 16.8%), computers & mathematics (1,609 | 15.7%), social sciences (905 | 8.8%), and science & technology (860 | 8.4%) are the most common fields of study among 10,270 individuals in McNair who have obtained a bachelor's degree or higher.
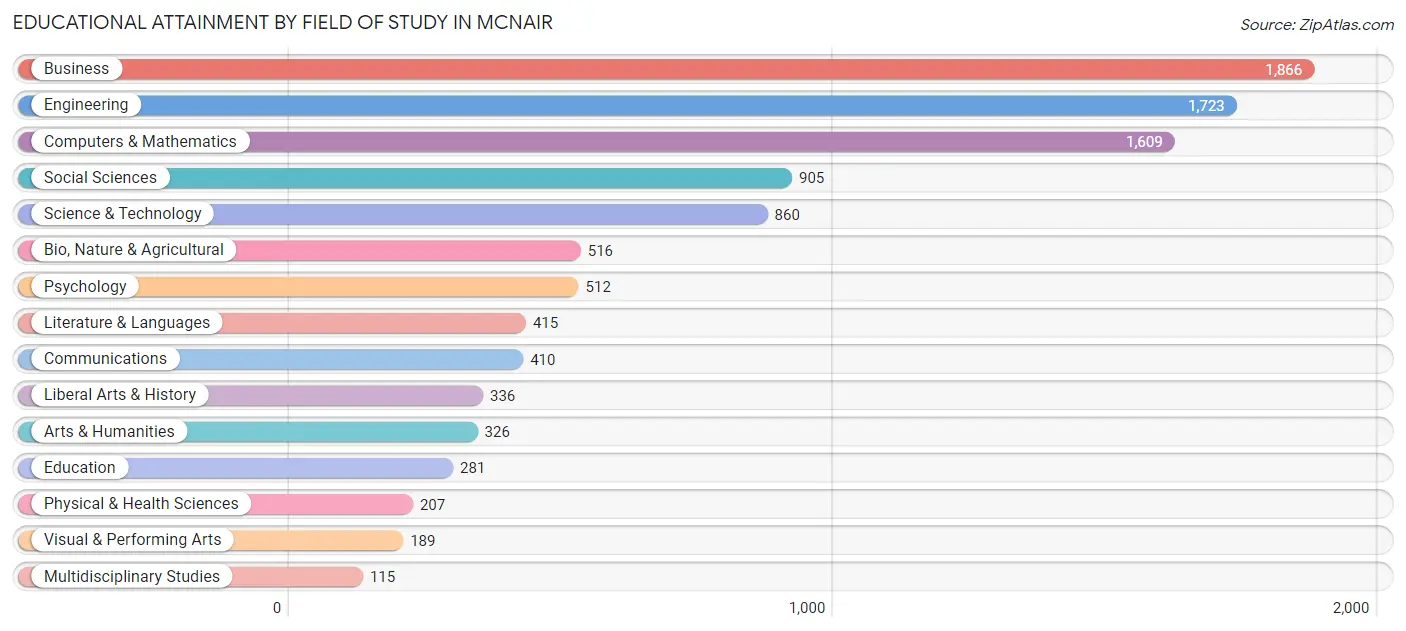
| Field of Study | # Graduates | % Graduates |
| Computers & Mathematics | 1,609 | 15.7% |
| Bio, Nature & Agricultural | 516 | 5.0% |
| Physical & Health Sciences | 207 | 2.0% |
| Psychology | 512 | 5.0% |
| Social Sciences | 905 | 8.8% |
| Engineering | 1,723 | 16.8% |
| Multidisciplinary Studies | 115 | 1.1% |
| Science & Technology | 860 | 8.4% |
| Business | 1,866 | 18.2% |
| Education | 281 | 2.7% |
| Literature & Languages | 415 | 4.0% |
| Liberal Arts & History | 336 | 3.3% |
| Visual & Performing Arts | 189 | 1.8% |
| Communications | 410 | 4.0% |
| Arts & Humanities | 326 | 3.2% |
| Total | 10,270 | 100.0% |
Transportation & Commute in McNair
Vehicle Availability by Sex in McNair
The most prevalent vehicle ownership categories in McNair are males with 2 vehicles (3,111, accounting for 38.7%) and females with 2 vehicles (2,056, making up 58.9%).
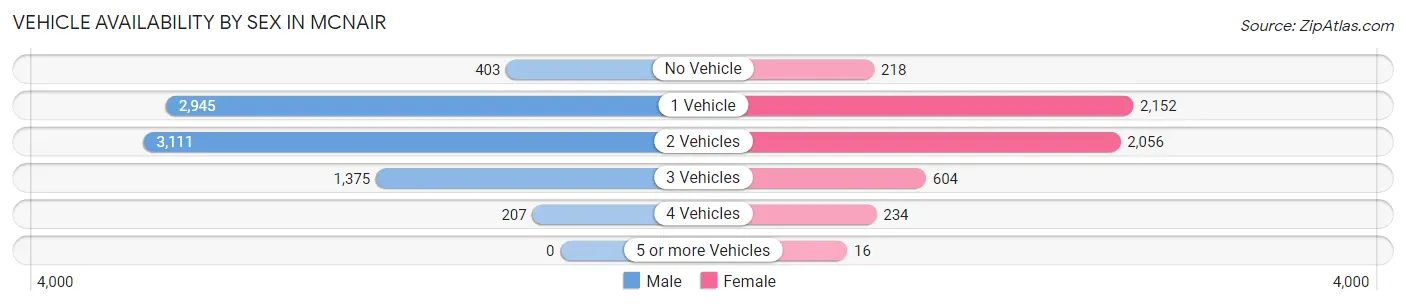
| Vehicles Available | Male | Female |
| No Vehicle | 403 (5.0%) | 218 (4.1%) |
| 1 Vehicle | 2,945 (36.6%) | 2,152 (40.8%) |
| 2 Vehicles | 3,111 (38.7%) | 2,056 (38.9%) |
| 3 Vehicles | 1,375 (17.1%) | 604 (11.4%) |
| 4 Vehicles | 207 (2.6%) | 234 (4.4%) |
| 5 or more Vehicles | 0 (0.0%) | 16 (0.3%) |
| Total | 8,041 (100.0%) | 5,280 (100.0%) |
Commute Time in McNair
The most frequently occuring commute durations in McNair are 10 to 14 minutes (2,575 commuters, 25.0%), 15 to 19 minutes (1,869 commuters, 18.1%), and 30 to 34 minutes (1,141 commuters, 11.1%).
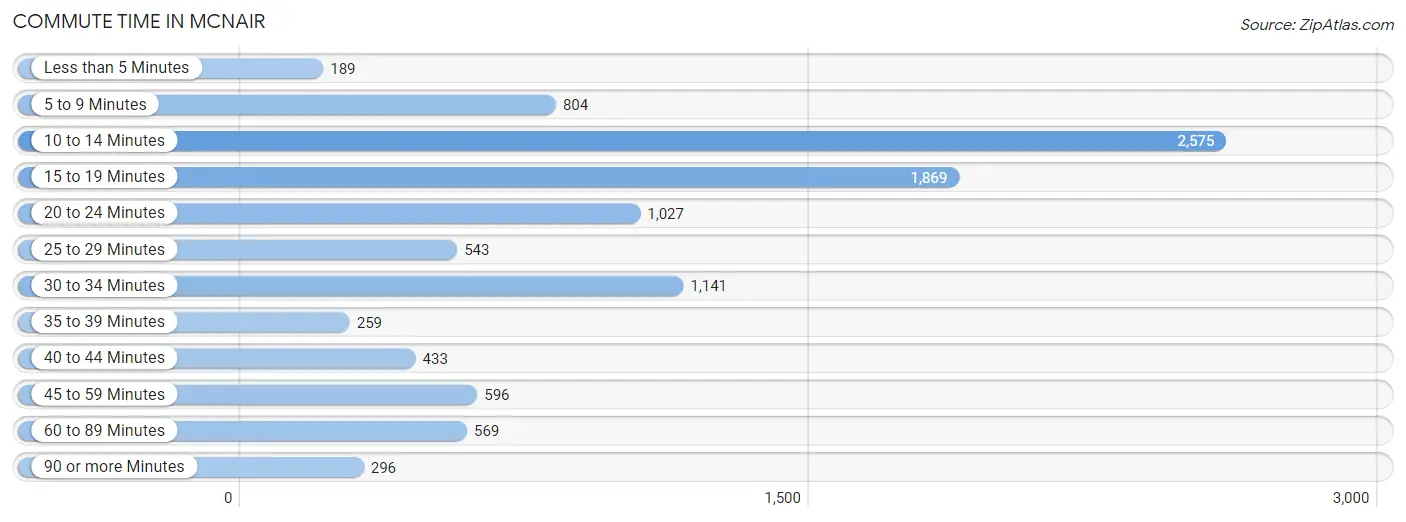
| Commute Time | # Commuters | % Commuters |
| Less than 5 Minutes | 189 | 1.8% |
| 5 to 9 Minutes | 804 | 7.8% |
| 10 to 14 Minutes | 2,575 | 25.0% |
| 15 to 19 Minutes | 1,869 | 18.1% |
| 20 to 24 Minutes | 1,027 | 10.0% |
| 25 to 29 Minutes | 543 | 5.3% |
| 30 to 34 Minutes | 1,141 | 11.1% |
| 35 to 39 Minutes | 259 | 2.5% |
| 40 to 44 Minutes | 433 | 4.2% |
| 45 to 59 Minutes | 596 | 5.8% |
| 60 to 89 Minutes | 569 | 5.5% |
| 90 or more Minutes | 296 | 2.9% |
Commute Time by Sex in McNair
The most common commute times in McNair are 10 to 14 minutes (1,660 commuters, 27.7%) for males and 10 to 14 minutes (915 commuters, 21.3%) for females.
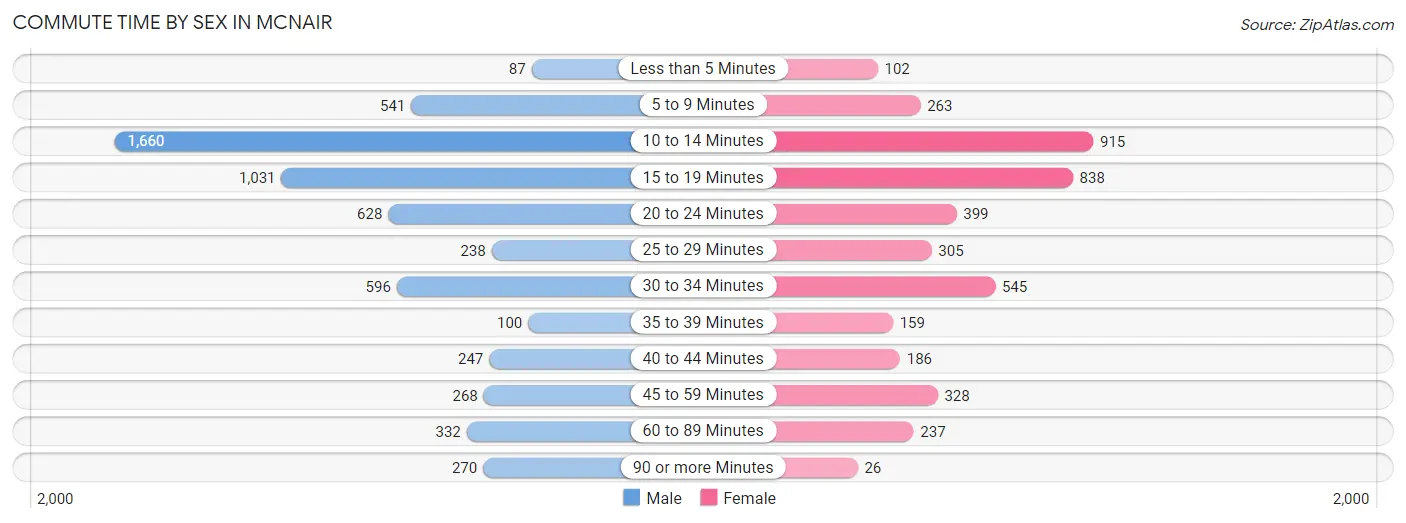
| Commute Time | Male | Female |
| Less than 5 Minutes | 87 (1.5%) | 102 (2.4%) |
| 5 to 9 Minutes | 541 (9.0%) | 263 (6.1%) |
| 10 to 14 Minutes | 1,660 (27.7%) | 915 (21.3%) |
| 15 to 19 Minutes | 1,031 (17.2%) | 838 (19.5%) |
| 20 to 24 Minutes | 628 (10.5%) | 399 (9.3%) |
| 25 to 29 Minutes | 238 (4.0%) | 305 (7.1%) |
| 30 to 34 Minutes | 596 (9.9%) | 545 (12.7%) |
| 35 to 39 Minutes | 100 (1.7%) | 159 (3.7%) |
| 40 to 44 Minutes | 247 (4.1%) | 186 (4.3%) |
| 45 to 59 Minutes | 268 (4.5%) | 328 (7.6%) |
| 60 to 89 Minutes | 332 (5.5%) | 237 (5.5%) |
| 90 or more Minutes | 270 (4.5%) | 26 (0.6%) |
Time of Departure to Work by Sex in McNair
The most frequent times of departure to work in McNair are 8:30 AM to 8:59 AM (860, 14.3%) for males and 8:00 AM to 8:29 AM (658, 15.3%) for females.
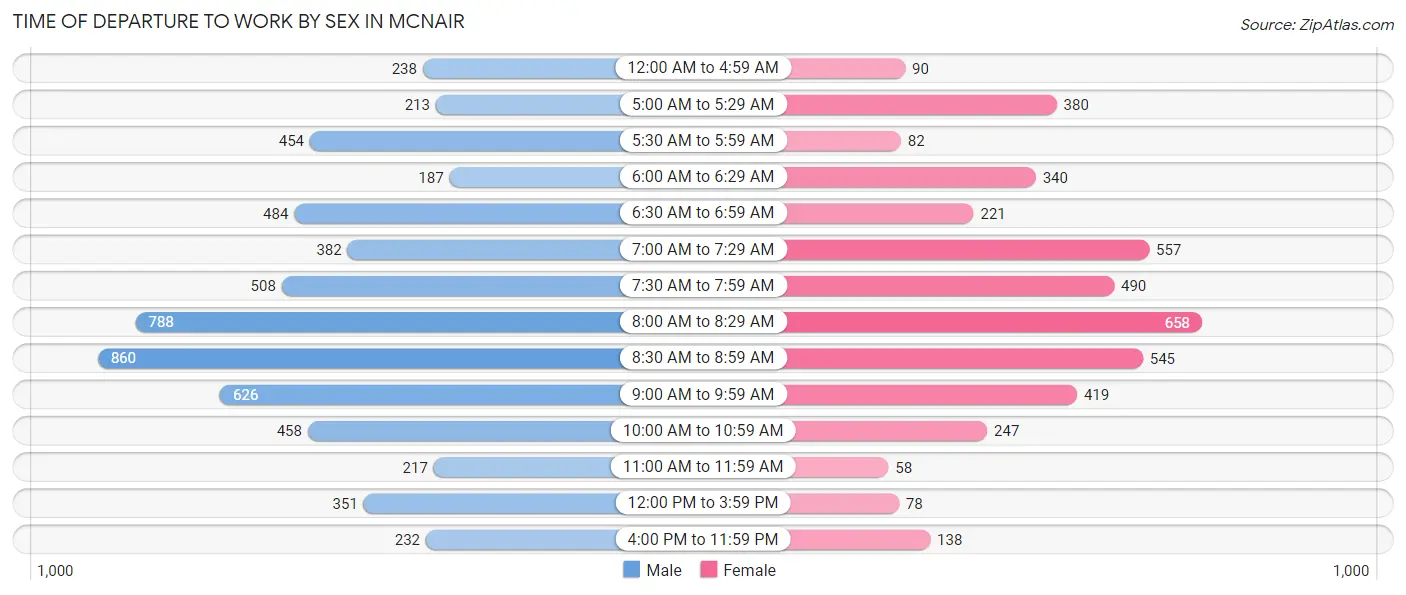
| Time of Departure | Male | Female |
| 12:00 AM to 4:59 AM | 238 (4.0%) | 90 (2.1%) |
| 5:00 AM to 5:29 AM | 213 (3.5%) | 380 (8.8%) |
| 5:30 AM to 5:59 AM | 454 (7.6%) | 82 (1.9%) |
| 6:00 AM to 6:29 AM | 187 (3.1%) | 340 (7.9%) |
| 6:30 AM to 6:59 AM | 484 (8.1%) | 221 (5.1%) |
| 7:00 AM to 7:29 AM | 382 (6.4%) | 557 (12.9%) |
| 7:30 AM to 7:59 AM | 508 (8.5%) | 490 (11.4%) |
| 8:00 AM to 8:29 AM | 788 (13.1%) | 658 (15.3%) |
| 8:30 AM to 8:59 AM | 860 (14.3%) | 545 (12.7%) |
| 9:00 AM to 9:59 AM | 626 (10.4%) | 419 (9.7%) |
| 10:00 AM to 10:59 AM | 458 (7.6%) | 247 (5.7%) |
| 11:00 AM to 11:59 AM | 217 (3.6%) | 58 (1.3%) |
| 12:00 PM to 3:59 PM | 351 (5.9%) | 78 (1.8%) |
| 4:00 PM to 11:59 PM | 232 (3.9%) | 138 (3.2%) |
| Total | 5,998 (100.0%) | 4,303 (100.0%) |
Housing Occupancy in McNair
Occupancy by Ownership in McNair
Of the total 8,759 dwellings in McNair, owner-occupied units account for 1,968 (22.5%), while renter-occupied units make up 6,791 (77.5%).
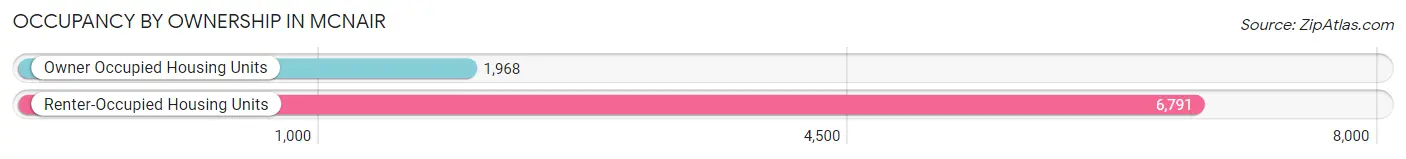
| Occupancy | # Housing Units | % Housing Units |
| Owner Occupied Housing Units | 1,968 | 22.5% |
| Renter-Occupied Housing Units | 6,791 | 77.5% |
| Total Occupied Housing Units | 8,759 | 100.0% |
Occupancy by Household Size in McNair
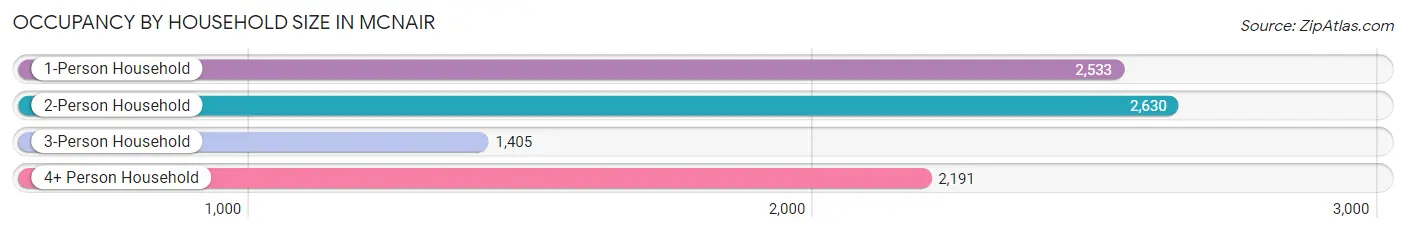
| Household Size | # Housing Units | % Housing Units |
| 1-Person Household | 2,533 | 28.9% |
| 2-Person Household | 2,630 | 30.0% |
| 3-Person Household | 1,405 | 16.0% |
| 4+ Person Household | 2,191 | 25.0% |
| Total Housing Units | 8,759 | 100.0% |
Occupancy by Ownership by Household Size in McNair
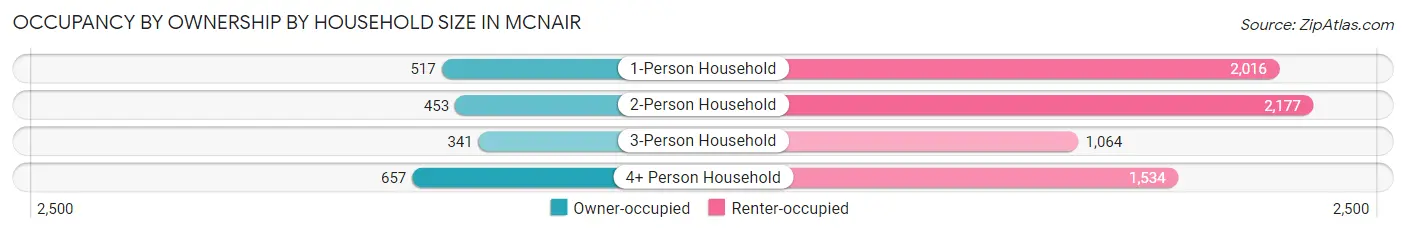
| Household Size | Owner-occupied | Renter-occupied |
| 1-Person Household | 517 (20.4%) | 2,016 (79.6%) |
| 2-Person Household | 453 (17.2%) | 2,177 (82.8%) |
| 3-Person Household | 341 (24.3%) | 1,064 (75.7%) |
| 4+ Person Household | 657 (30.0%) | 1,534 (70.0%) |
| Total Housing Units | 1,968 (22.5%) | 6,791 (77.5%) |
Occupancy by Educational Attainment in McNair
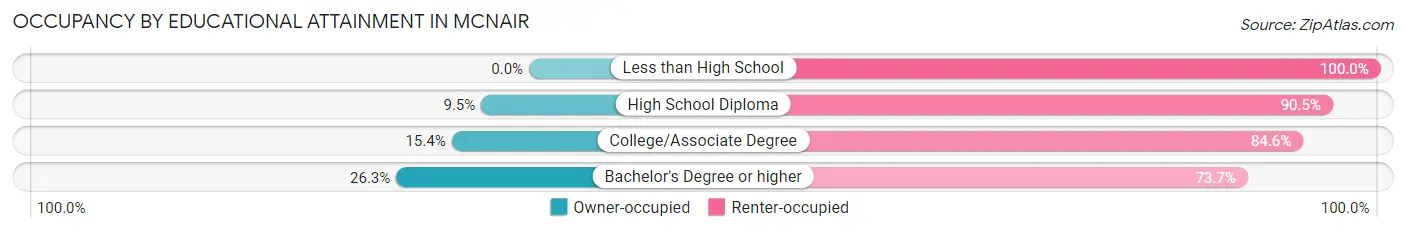
| Household Size | Owner-occupied | Renter-occupied |
| Less than High School | 0 (0.0%) | 146 (100.0%) |
| High School Diploma | 85 (9.5%) | 811 (90.5%) |
| College/Associate Degree | 209 (15.4%) | 1,152 (84.6%) |
| Bachelor's Degree or higher | 1,674 (26.3%) | 4,682 (73.7%) |
Occupancy by Age of Householder in McNair
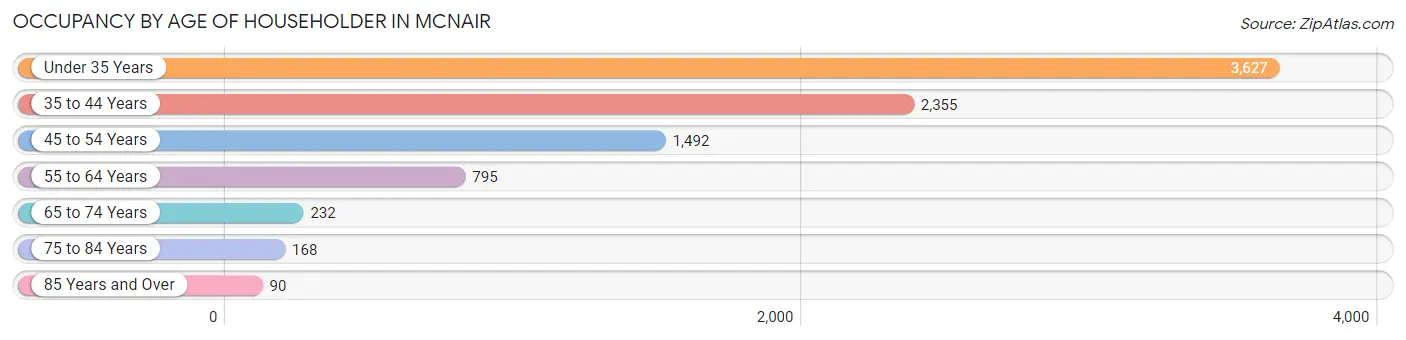
| Age Bracket | # Households | % Households |
| Under 35 Years | 3,627 | 41.4% |
| 35 to 44 Years | 2,355 | 26.9% |
| 45 to 54 Years | 1,492 | 17.0% |
| 55 to 64 Years | 795 | 9.1% |
| 65 to 74 Years | 232 | 2.6% |
| 75 to 84 Years | 168 | 1.9% |
| 85 Years and Over | 90 | 1.0% |
| Total | 8,759 | 100.0% |
Housing Finances in McNair
Median Income by Occupancy in McNair
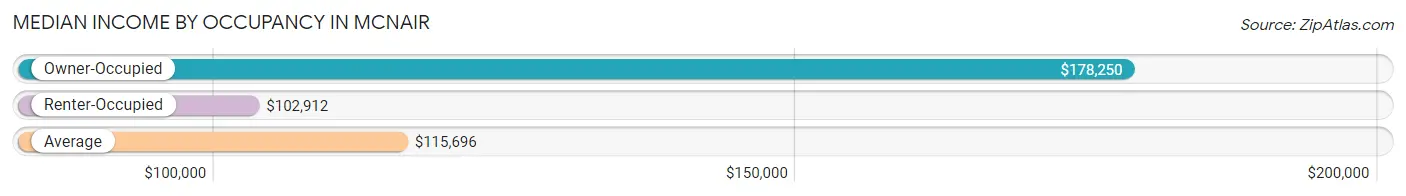
| Occupancy Type | # Households | Median Income |
| Owner-Occupied | 1,968 (22.5%) | $178,250 |
| Renter-Occupied | 6,791 (77.5%) | $102,912 |
| Average | 8,759 (100.0%) | $115,696 |
Occupancy by Householder Income Bracket in McNair
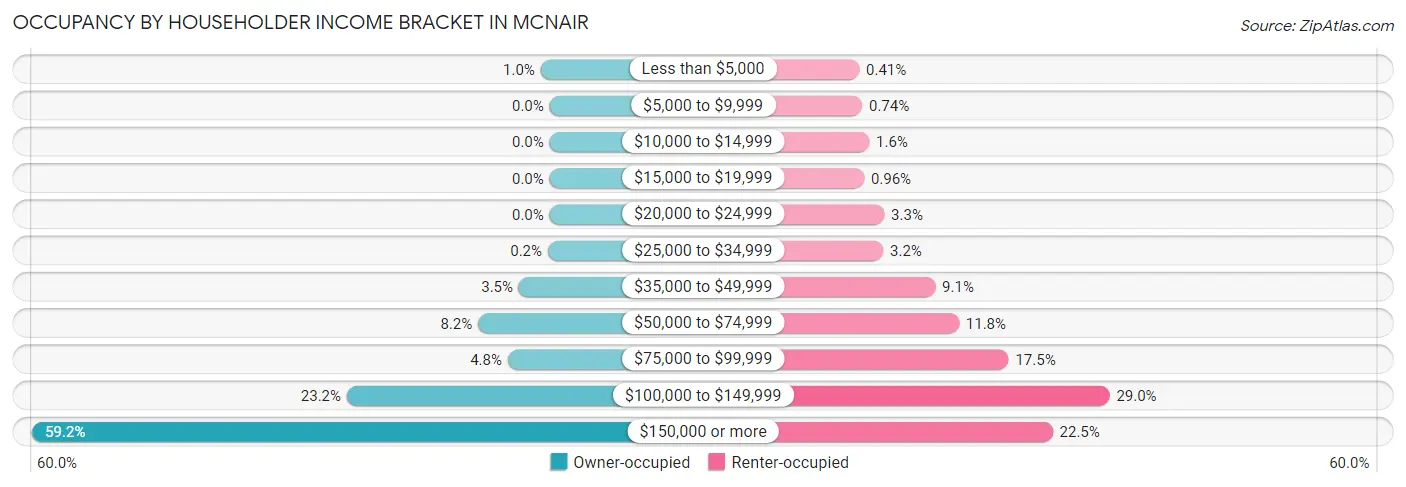
| Income Bracket | Owner-occupied | Renter-occupied |
| Less than $5,000 | 20 (1.0%) | 28 (0.4%) |
| $5,000 to $9,999 | 0 (0.0%) | 50 (0.7%) |
| $10,000 to $14,999 | 0 (0.0%) | 105 (1.5%) |
| $15,000 to $19,999 | 0 (0.0%) | 65 (1.0%) |
| $20,000 to $24,999 | 0 (0.0%) | 222 (3.3%) |
| $25,000 to $34,999 | 4 (0.2%) | 214 (3.2%) |
| $35,000 to $49,999 | 69 (3.5%) | 618 (9.1%) |
| $50,000 to $74,999 | 161 (8.2%) | 802 (11.8%) |
| $75,000 to $99,999 | 94 (4.8%) | 1,187 (17.5%) |
| $100,000 to $149,999 | 456 (23.2%) | 1,971 (29.0%) |
| $150,000 or more | 1,164 (59.2%) | 1,529 (22.5%) |
| Total | 1,968 (100.0%) | 6,791 (100.0%) |
Monthly Housing Cost Tiers in McNair
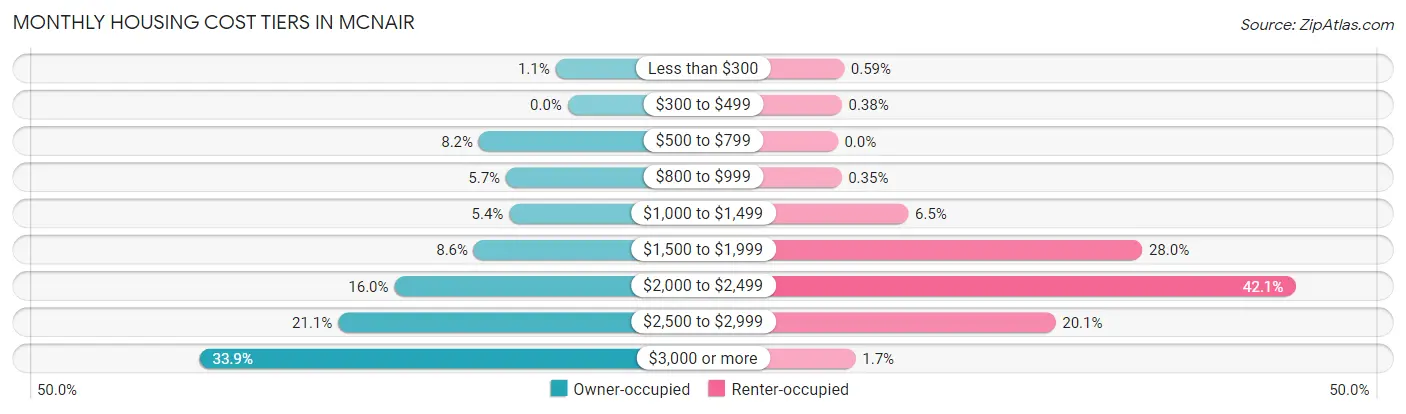
| Monthly Cost | Owner-occupied | Renter-occupied |
| Less than $300 | 22 (1.1%) | 40 (0.6%) |
| $300 to $499 | 0 (0.0%) | 26 (0.4%) |
| $500 to $799 | 161 (8.2%) | 0 (0.0%) |
| $800 to $999 | 112 (5.7%) | 24 (0.4%) |
| $1,000 to $1,499 | 106 (5.4%) | 442 (6.5%) |
| $1,500 to $1,999 | 170 (8.6%) | 1,904 (28.0%) |
| $2,000 to $2,499 | 314 (16.0%) | 2,861 (42.1%) |
| $2,500 to $2,999 | 416 (21.1%) | 1,362 (20.1%) |
| $3,000 or more | 667 (33.9%) | 112 (1.7%) |
| Total | 1,968 (100.0%) | 6,791 (100.0%) |
Physical Housing Characteristics in McNair
Housing Structures in McNair
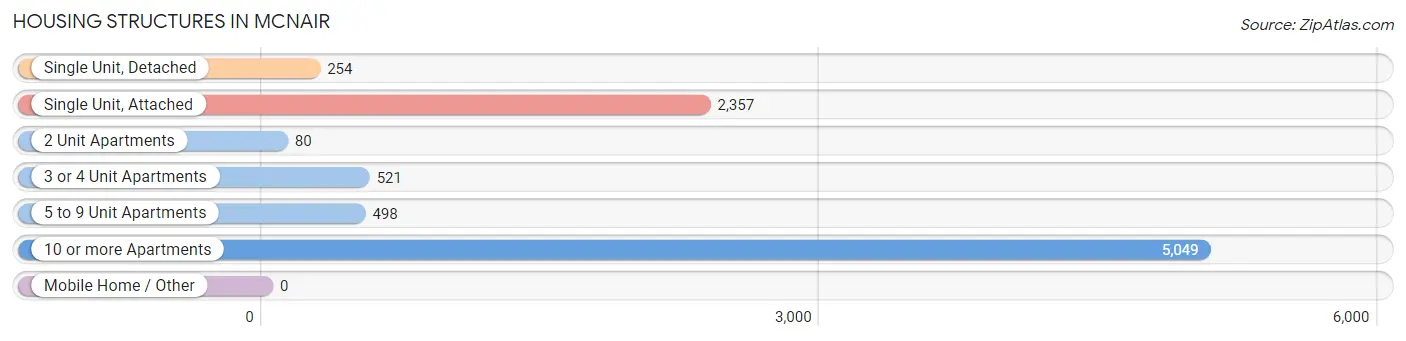
| Structure Type | # Housing Units | % Housing Units |
| Single Unit, Detached | 254 | 2.9% |
| Single Unit, Attached | 2,357 | 26.9% |
| 2 Unit Apartments | 80 | 0.9% |
| 3 or 4 Unit Apartments | 521 | 5.9% |
| 5 to 9 Unit Apartments | 498 | 5.7% |
| 10 or more Apartments | 5,049 | 57.6% |
| Mobile Home / Other | 0 | 0.0% |
| Total | 8,759 | 100.0% |
Housing Structures by Occupancy in McNair
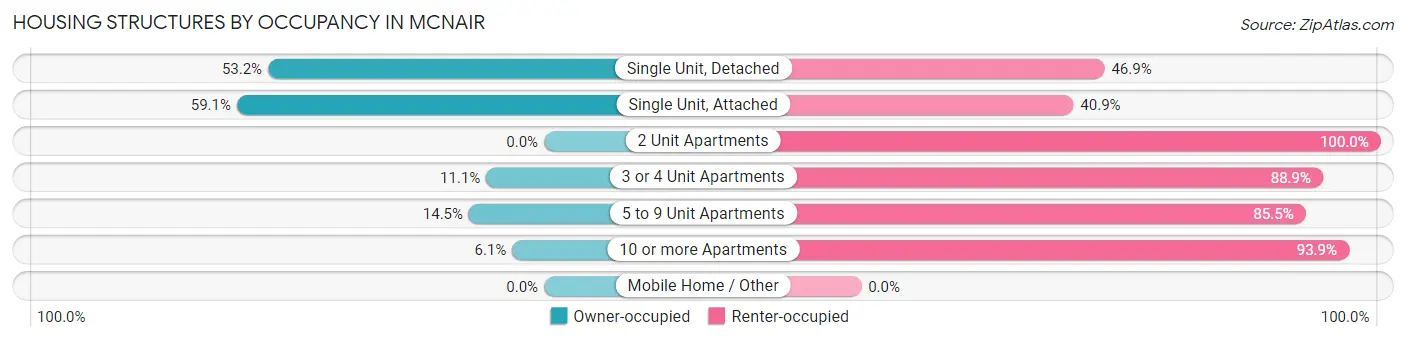
| Structure Type | Owner-occupied | Renter-occupied |
| Single Unit, Detached | 135 (53.1%) | 119 (46.9%) |
| Single Unit, Attached | 1,394 (59.1%) | 963 (40.9%) |
| 2 Unit Apartments | 0 (0.0%) | 80 (100.0%) |
| 3 or 4 Unit Apartments | 58 (11.1%) | 463 (88.9%) |
| 5 to 9 Unit Apartments | 72 (14.5%) | 426 (85.5%) |
| 10 or more Apartments | 309 (6.1%) | 4,740 (93.9%) |
| Mobile Home / Other | 0 (0.0%) | 0 (0.0%) |
| Total | 1,968 (22.5%) | 6,791 (77.5%) |
Housing Structures by Number of Rooms in McNair
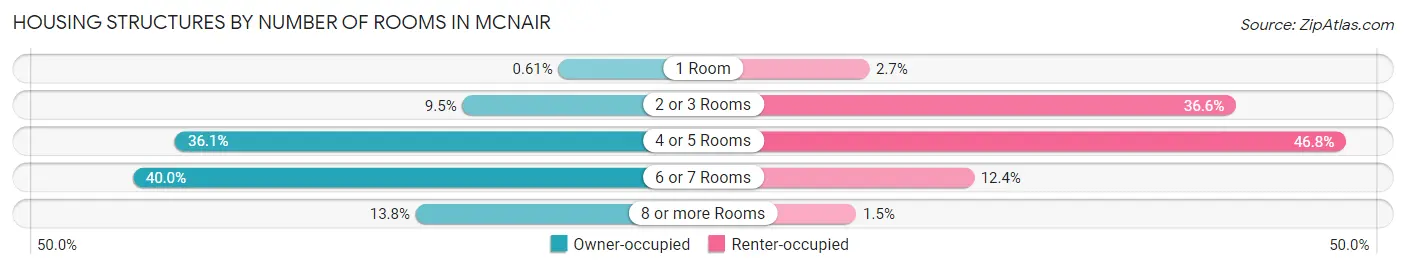
| Number of Rooms | Owner-occupied | Renter-occupied |
| 1 Room | 12 (0.6%) | 183 (2.7%) |
| 2 or 3 Rooms | 187 (9.5%) | 2,488 (36.6%) |
| 4 or 5 Rooms | 710 (36.1%) | 3,178 (46.8%) |
| 6 or 7 Rooms | 787 (40.0%) | 840 (12.4%) |
| 8 or more Rooms | 272 (13.8%) | 102 (1.5%) |
| Total | 1,968 (100.0%) | 6,791 (100.0%) |
Housing Structure by Heating Type in McNair
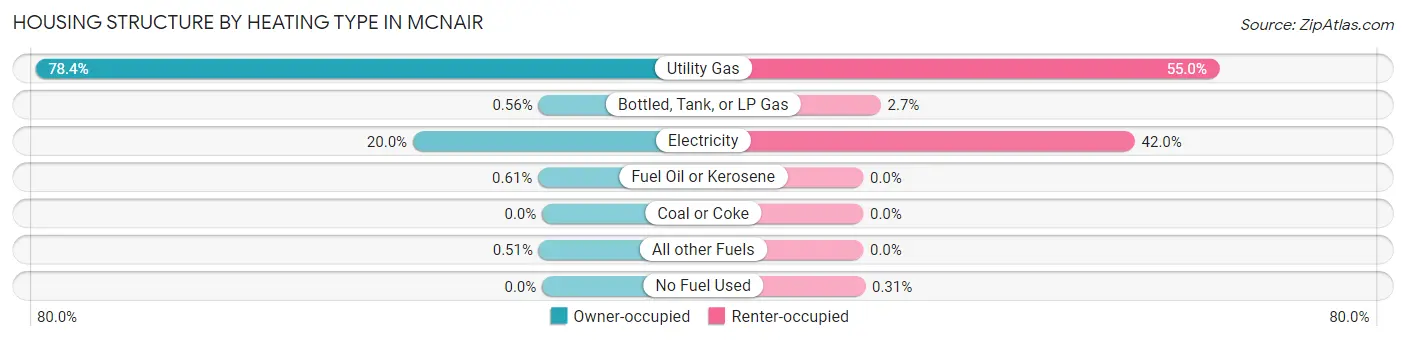
| Heating Type | Owner-occupied | Renter-occupied |
| Utility Gas | 1,542 (78.3%) | 3,734 (55.0%) |
| Bottled, Tank, or LP Gas | 11 (0.6%) | 185 (2.7%) |
| Electricity | 393 (20.0%) | 2,851 (42.0%) |
| Fuel Oil or Kerosene | 12 (0.6%) | 0 (0.0%) |
| Coal or Coke | 0 (0.0%) | 0 (0.0%) |
| All other Fuels | 10 (0.5%) | 0 (0.0%) |
| No Fuel Used | 0 (0.0%) | 21 (0.3%) |
| Total | 1,968 (100.0%) | 6,791 (100.0%) |
Household Vehicle Usage in McNair
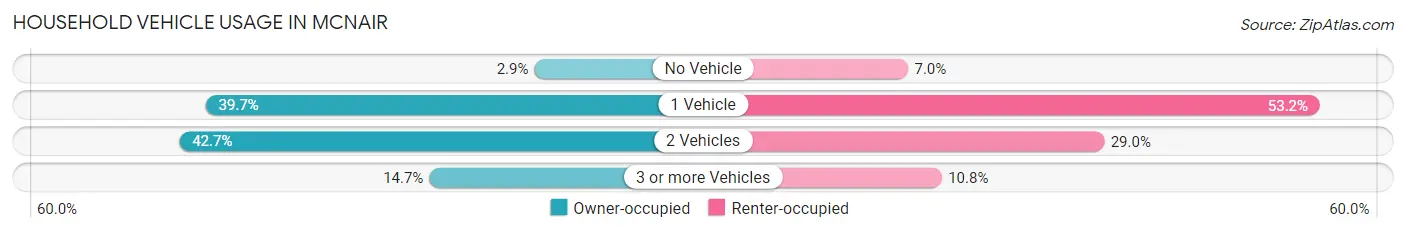
| Vehicles per Household | Owner-occupied | Renter-occupied |
| No Vehicle | 57 (2.9%) | 476 (7.0%) |
| 1 Vehicle | 782 (39.7%) | 3,613 (53.2%) |
| 2 Vehicles | 840 (42.7%) | 1,969 (29.0%) |
| 3 or more Vehicles | 289 (14.7%) | 733 (10.8%) |
| Total | 1,968 (100.0%) | 6,791 (100.0%) |
Real Estate & Mortgages in McNair
Real Estate and Mortgage Overview in McNair
| Characteristic | Without Mortgage | With Mortgage |
| Housing Units | 324 | 1,644 |
| Median Property Value | $553,800 | $525,100 |
| Median Household Income | $144,000 | $1,018 |
| Monthly Housing Costs | $793 | $667 |
| Real Estate Taxes | $5,853 | $28 |
Property Value by Mortgage Status in McNair
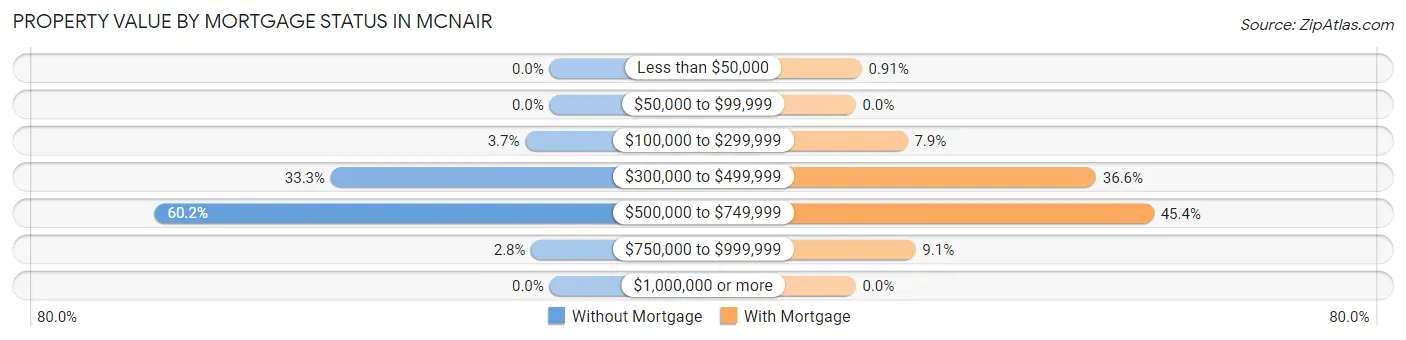
| Property Value | Without Mortgage | With Mortgage |
| Less than $50,000 | 0 (0.0%) | 15 (0.9%) |
| $50,000 to $99,999 | 0 (0.0%) | 0 (0.0%) |
| $100,000 to $299,999 | 12 (3.7%) | 130 (7.9%) |
| $300,000 to $499,999 | 108 (33.3%) | 602 (36.6%) |
| $500,000 to $749,999 | 195 (60.2%) | 747 (45.4%) |
| $750,000 to $999,999 | 9 (2.8%) | 150 (9.1%) |
| $1,000,000 or more | 0 (0.0%) | 0 (0.0%) |
| Total | 324 (100.0%) | 1,644 (100.0%) |
Household Income by Mortgage Status in McNair
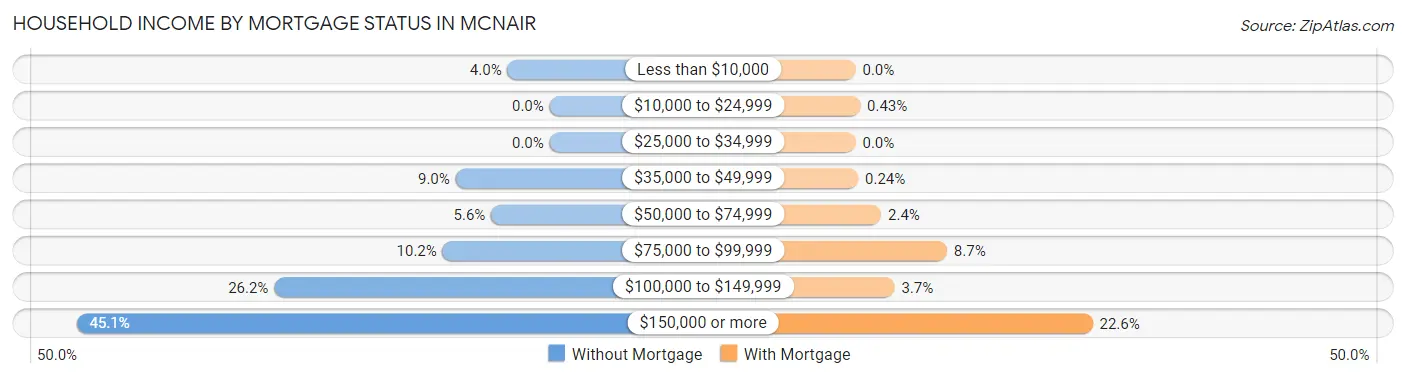
| Household Income | Without Mortgage | With Mortgage |
| Less than $10,000 | 13 (4.0%) | 0 (0.0%) |
| $10,000 to $24,999 | 0 (0.0%) | 7 (0.4%) |
| $25,000 to $34,999 | 0 (0.0%) | 0 (0.0%) |
| $35,000 to $49,999 | 29 (8.9%) | 4 (0.2%) |
| $50,000 to $74,999 | 18 (5.6%) | 40 (2.4%) |
| $75,000 to $99,999 | 33 (10.2%) | 143 (8.7%) |
| $100,000 to $149,999 | 85 (26.2%) | 61 (3.7%) |
| $150,000 or more | 146 (45.1%) | 371 (22.6%) |
| Total | 324 (100.0%) | 1,644 (100.0%) |
Property Value to Household Income Ratio in McNair
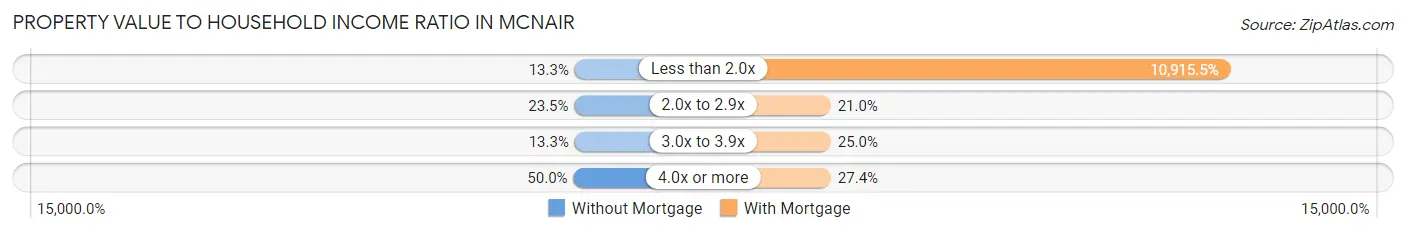
| Value-to-Income Ratio | Without Mortgage | With Mortgage |
| Less than 2.0x | 43 (13.3%) | 179,450 (10,915.4%) |
| 2.0x to 2.9x | 76 (23.5%) | 345 (21.0%) |
| 3.0x to 3.9x | 43 (13.3%) | 411 (25.0%) |
| 4.0x or more | 162 (50.0%) | 451 (27.4%) |
| Total | 324 (100.0%) | 1,644 (100.0%) |
Real Estate Taxes by Mortgage Status in McNair
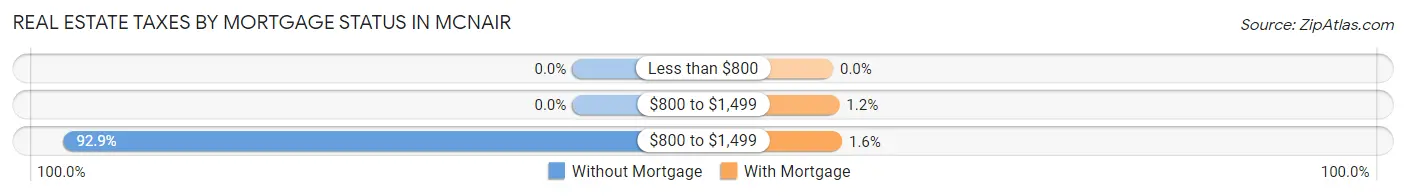
| Property Taxes | Without Mortgage | With Mortgage |
| Less than $800 | 0 (0.0%) | 0 (0.0%) |
| $800 to $1,499 | 0 (0.0%) | 19 (1.2%) |
| $800 to $1,499 | 301 (92.9%) | 27 (1.6%) |
| Total | 324 (100.0%) | 1,644 (100.0%) |
Health & Disability in McNair
Health Insurance Coverage by Age in McNair
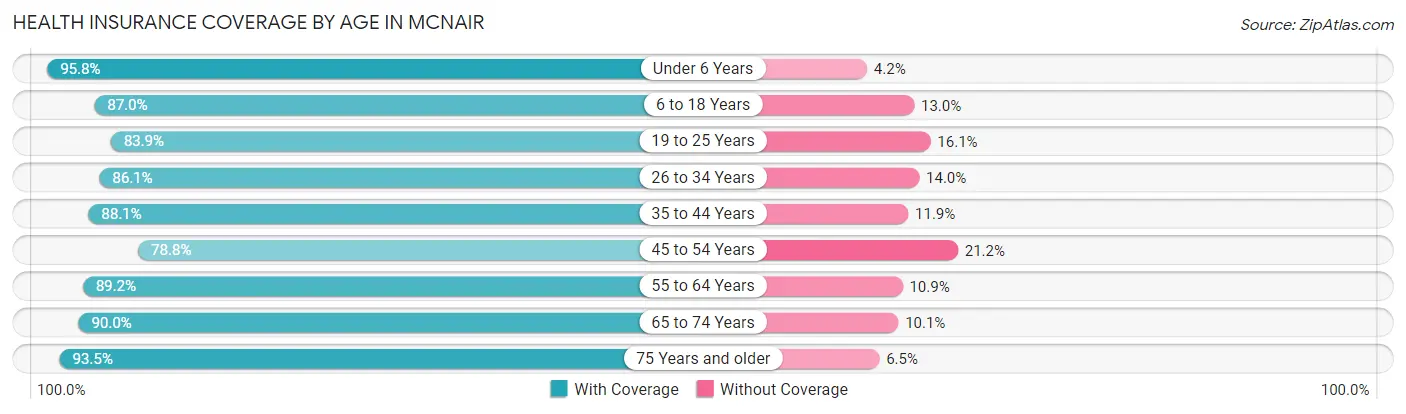
| Age Bracket | With Coverage | Without Coverage |
| Under 6 Years | 2,156 (95.8%) | 95 (4.2%) |
| 6 to 18 Years | 2,221 (87.0%) | 332 (13.0%) |
| 19 to 25 Years | 2,582 (83.9%) | 494 (16.1%) |
| 26 to 34 Years | 4,443 (86.1%) | 720 (14.0%) |
| 35 to 44 Years | 3,894 (88.1%) | 526 (11.9%) |
| 45 to 54 Years | 2,026 (78.8%) | 544 (21.2%) |
| 55 to 64 Years | 1,117 (89.1%) | 136 (10.8%) |
| 65 to 74 Years | 331 (89.9%) | 37 (10.1%) |
| 75 Years and older | 431 (93.5%) | 30 (6.5%) |
| Total | 19,201 (86.8%) | 2,914 (13.2%) |
Health Insurance Coverage by Citizenship Status in McNair
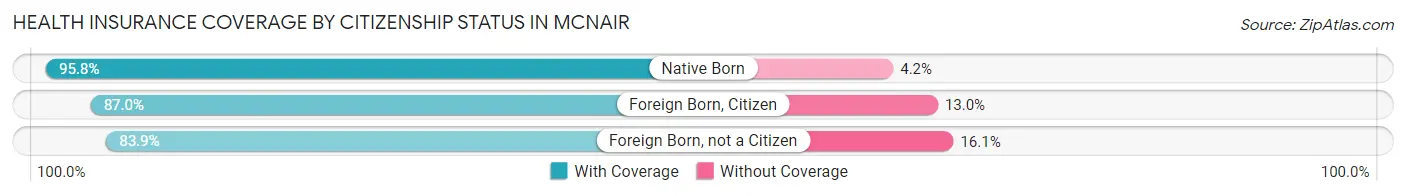
| Citizenship Status | With Coverage | Without Coverage |
| Native Born | 2,156 (95.8%) | 95 (4.2%) |
| Foreign Born, Citizen | 2,221 (87.0%) | 332 (13.0%) |
| Foreign Born, not a Citizen | 2,582 (83.9%) | 494 (16.1%) |
Health Insurance Coverage by Household Income in McNair
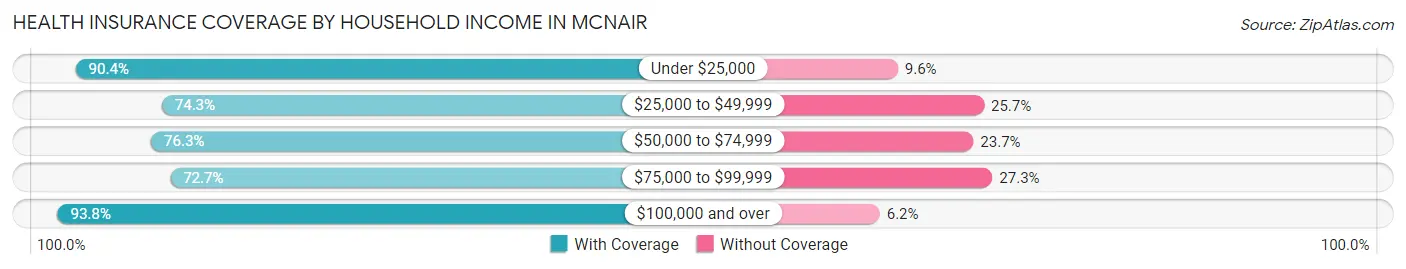
| Household Income | With Coverage | Without Coverage |
| Under $25,000 | 728 (90.4%) | 77 (9.6%) |
| $25,000 to $49,999 | 1,721 (74.3%) | 596 (25.7%) |
| $50,000 to $74,999 | 1,518 (76.3%) | 472 (23.7%) |
| $75,000 to $99,999 | 2,477 (72.7%) | 929 (27.3%) |
| $100,000 and over | 12,756 (93.8%) | 840 (6.2%) |
Public vs Private Health Insurance Coverage by Age in McNair
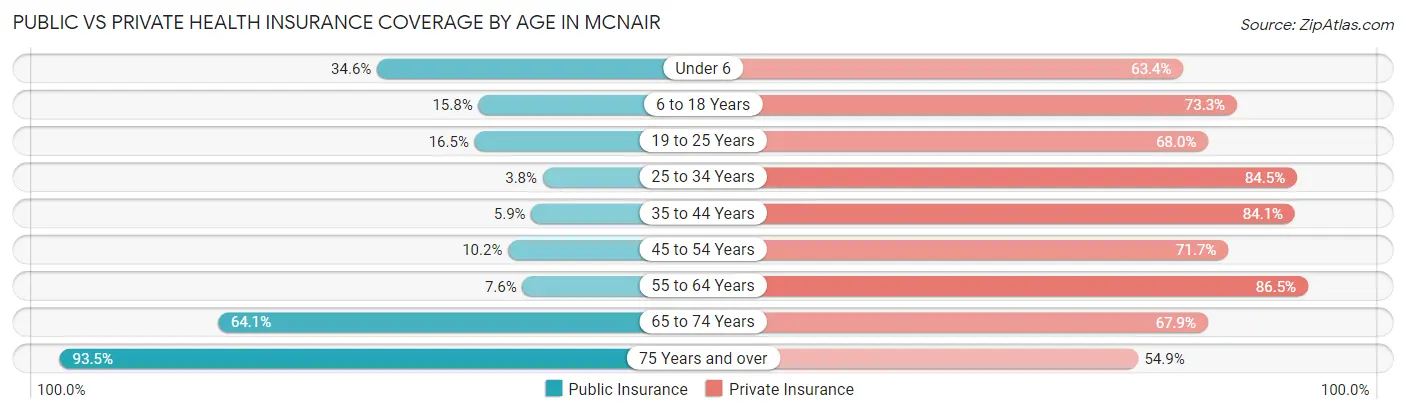
| Age Bracket | Public Insurance | Private Insurance |
| Under 6 | 778 (34.6%) | 1,427 (63.4%) |
| 6 to 18 Years | 402 (15.8%) | 1,872 (73.3%) |
| 19 to 25 Years | 506 (16.5%) | 2,092 (68.0%) |
| 25 to 34 Years | 196 (3.8%) | 4,362 (84.5%) |
| 35 to 44 Years | 262 (5.9%) | 3,717 (84.1%) |
| 45 to 54 Years | 263 (10.2%) | 1,843 (71.7%) |
| 55 to 64 Years | 95 (7.6%) | 1,084 (86.5%) |
| 65 to 74 Years | 236 (64.1%) | 250 (67.9%) |
| 75 Years and over | 431 (93.5%) | 253 (54.9%) |
| Total | 3,169 (14.3%) | 16,900 (76.4%) |
Disability Status by Sex by Age in McNair
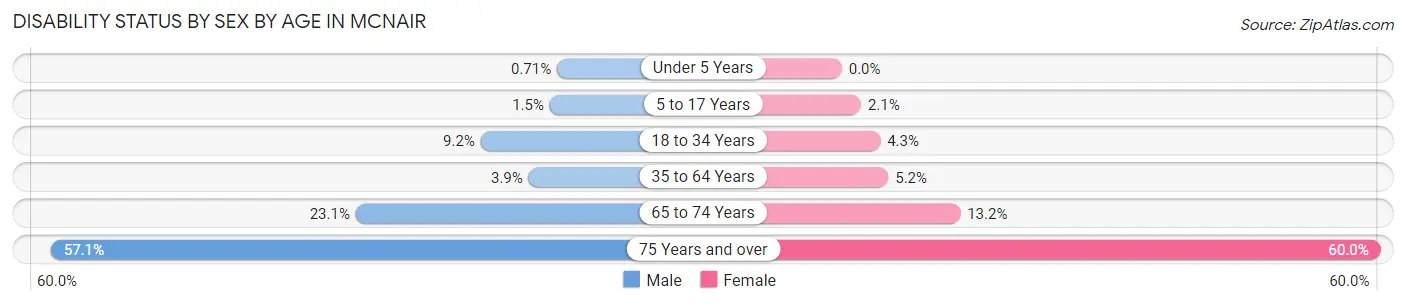
| Age Bracket | Male | Female |
| Under 5 Years | 7 (0.7%) | 0 (0.0%) |
| 5 to 17 Years | 22 (1.5%) | 33 (2.1%) |
| 18 to 34 Years | 414 (9.2%) | 165 (4.3%) |
| 35 to 64 Years | 168 (3.9%) | 202 (5.2%) |
| 65 to 74 Years | 43 (23.1%) | 24 (13.2%) |
| 75 Years and over | 129 (57.1%) | 141 (60.0%) |
Disability Class by Sex by Age in McNair
Disability Class: Hearing Difficulty
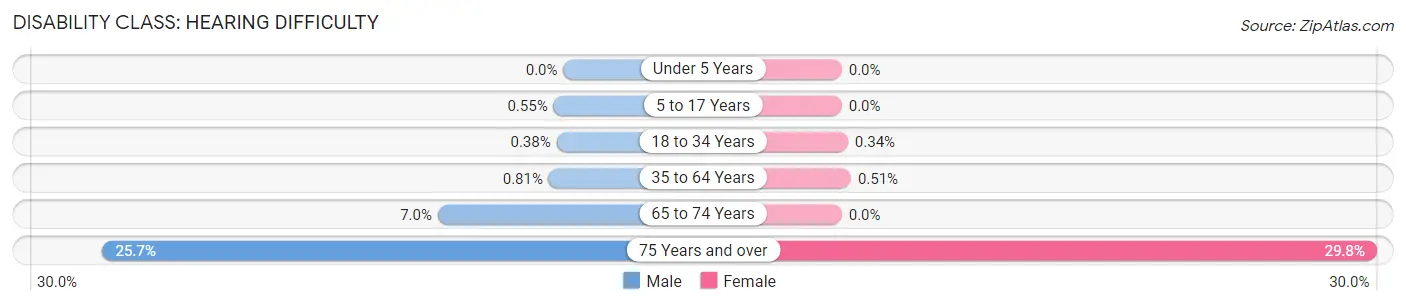
| Age Bracket | Male | Female |
| Under 5 Years | 0 (0.0%) | 0 (0.0%) |
| 5 to 17 Years | 8 (0.5%) | 0 (0.0%) |
| 18 to 34 Years | 17 (0.4%) | 13 (0.3%) |
| 35 to 64 Years | 35 (0.8%) | 20 (0.5%) |
| 65 to 74 Years | 13 (7.0%) | 0 (0.0%) |
| 75 Years and over | 58 (25.7%) | 70 (29.8%) |
Disability Class: Vision Difficulty
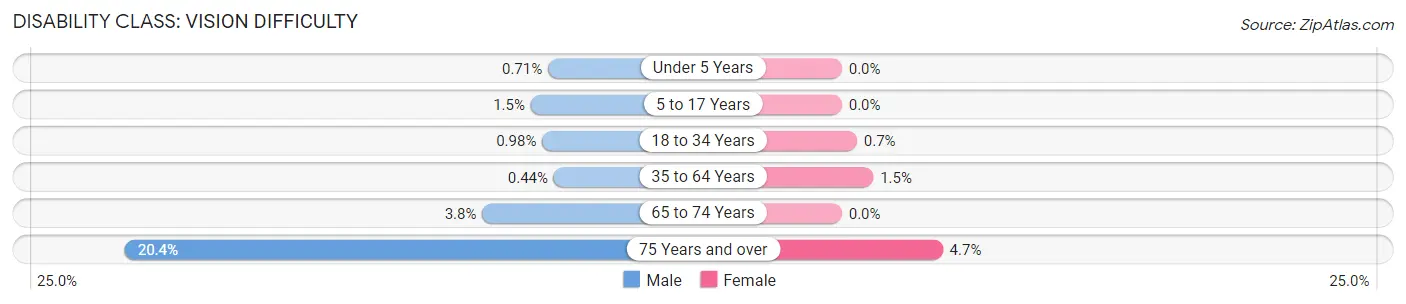
| Age Bracket | Male | Female |
| Under 5 Years | 7 (0.7%) | 0 (0.0%) |
| 5 to 17 Years | 22 (1.5%) | 0 (0.0%) |
| 18 to 34 Years | 44 (1.0%) | 27 (0.7%) |
| 35 to 64 Years | 19 (0.4%) | 57 (1.5%) |
| 65 to 74 Years | 7 (3.8%) | 0 (0.0%) |
| 75 Years and over | 46 (20.3%) | 11 (4.7%) |
Disability Class: Cognitive Difficulty
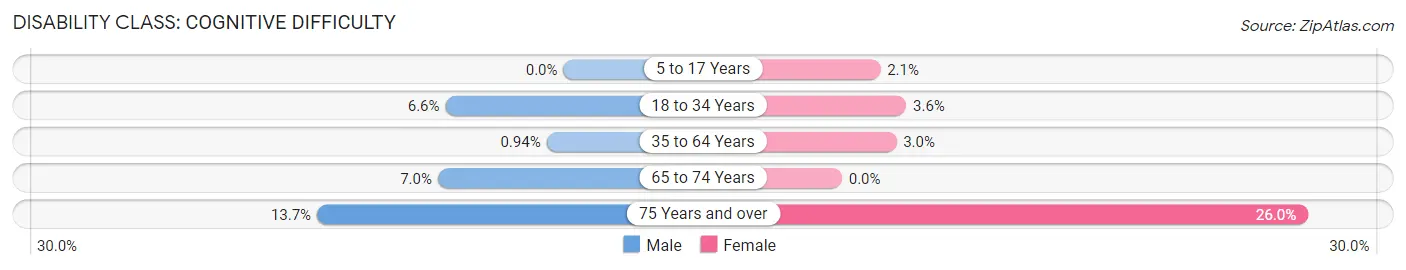
| Age Bracket | Male | Female |
| 5 to 17 Years | 0 (0.0%) | 33 (2.1%) |
| 18 to 34 Years | 295 (6.6%) | 138 (3.6%) |
| 35 to 64 Years | 41 (0.9%) | 118 (3.0%) |
| 65 to 74 Years | 13 (7.0%) | 0 (0.0%) |
| 75 Years and over | 31 (13.7%) | 61 (26.0%) |
Disability Class: Ambulatory Difficulty
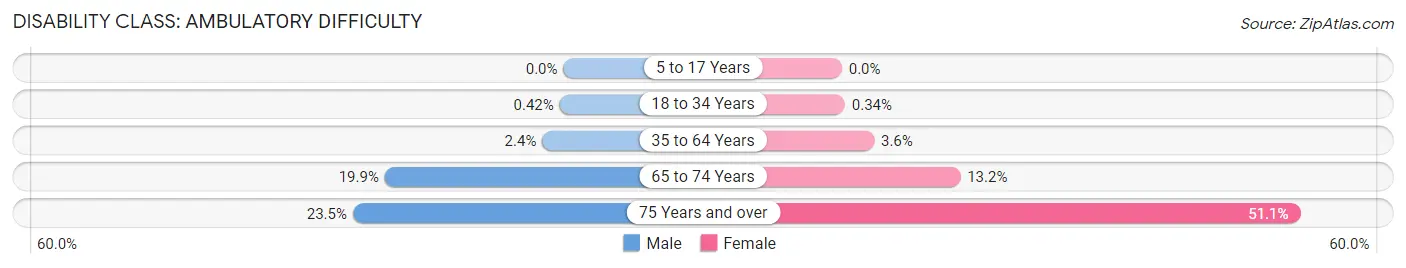
| Age Bracket | Male | Female |
| 5 to 17 Years | 0 (0.0%) | 0 (0.0%) |
| 18 to 34 Years | 19 (0.4%) | 13 (0.3%) |
| 35 to 64 Years | 102 (2.4%) | 140 (3.6%) |
| 65 to 74 Years | 37 (19.9%) | 24 (13.2%) |
| 75 Years and over | 53 (23.4%) | 120 (51.1%) |
Disability Class: Self-Care Difficulty
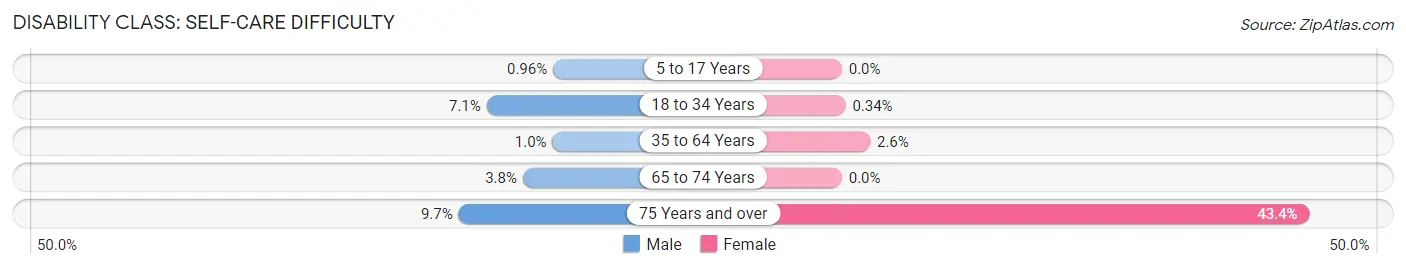
| Age Bracket | Male | Female |
| 5 to 17 Years | 14 (1.0%) | 0 (0.0%) |
| 18 to 34 Years | 320 (7.1%) | 13 (0.3%) |
| 35 to 64 Years | 44 (1.0%) | 102 (2.6%) |
| 65 to 74 Years | 7 (3.8%) | 0 (0.0%) |
| 75 Years and over | 22 (9.7%) | 102 (43.4%) |
Technology Access in McNair
Computing Device Access in McNair
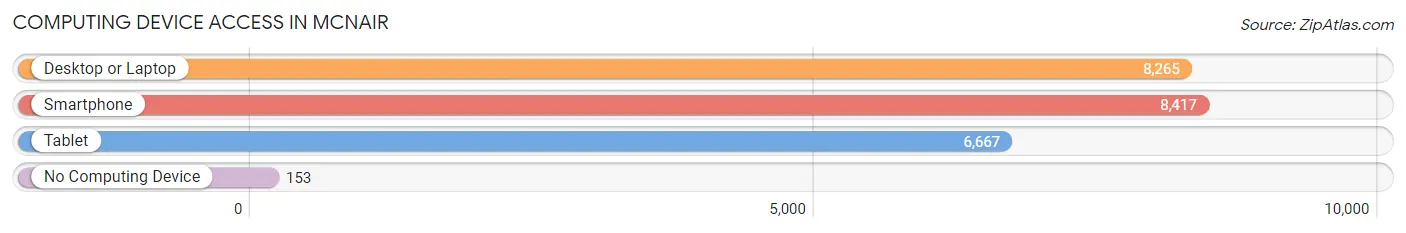
| Device Type | # Households | % Households |
| Desktop or Laptop | 8,265 | 94.4% |
| Smartphone | 8,417 | 96.1% |
| Tablet | 6,667 | 76.1% |
| No Computing Device | 153 | 1.8% |
| Total | 8,759 | 100.0% |
Internet Access in McNair
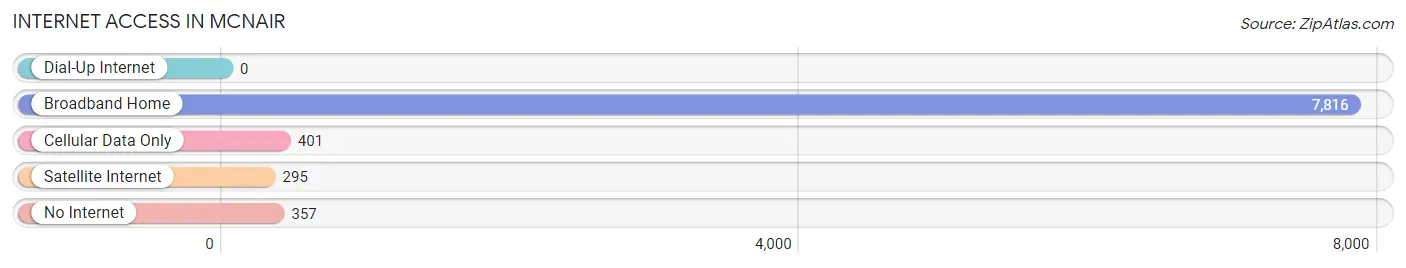
| Internet Type | # Households | % Households |
| Dial-Up Internet | 0 | 0.0% |
| Broadband Home | 7,816 | 89.2% |
| Cellular Data Only | 401 | 4.6% |
| Satellite Internet | 295 | 3.4% |
| No Internet | 357 | 4.1% |
| Total | 8,759 | 100.0% |
McNair Summary
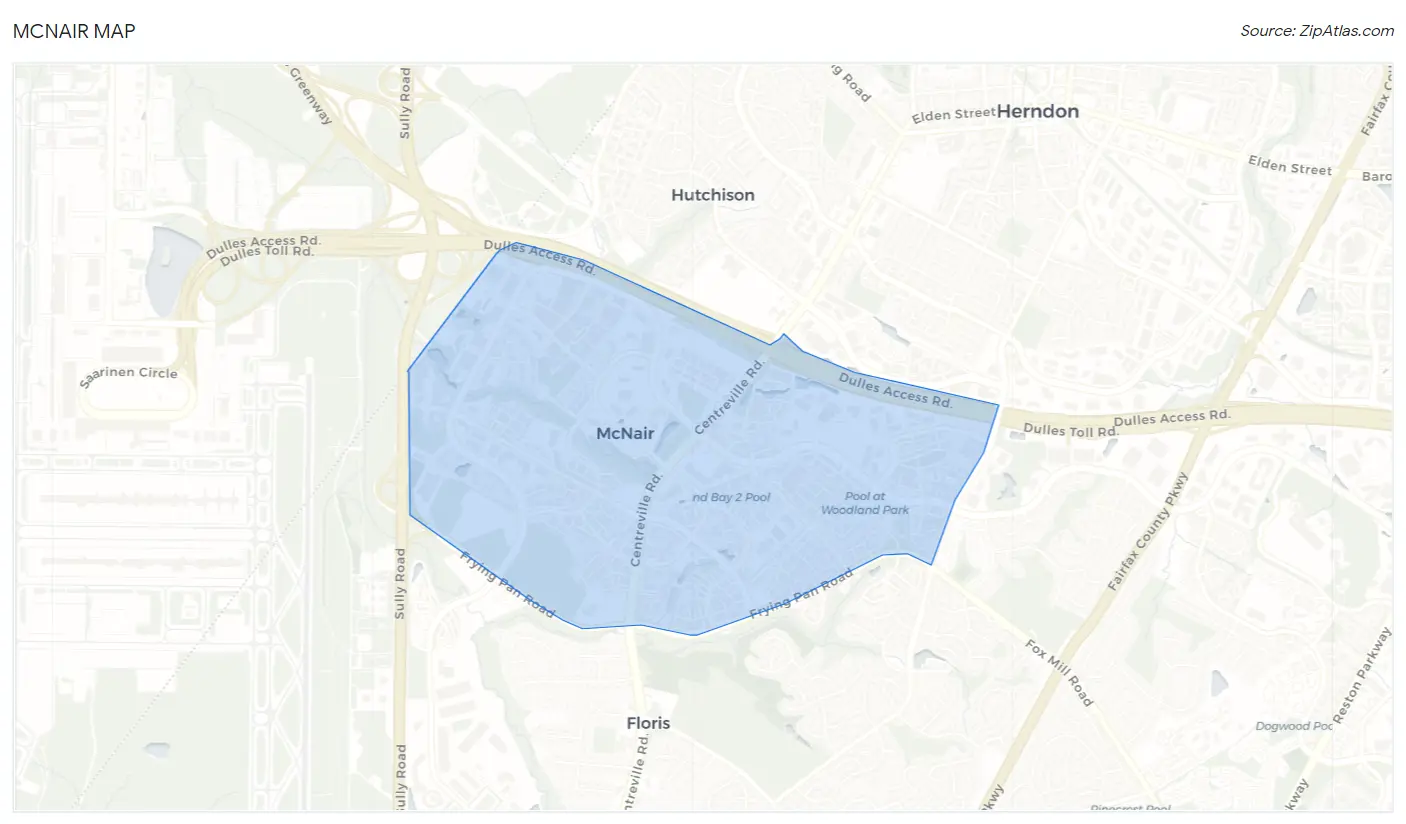
McNair is a small unincorporated community located in Fairfax County, Virginia. It is situated in the southeastern corner of the county, just south of the town of Herndon. The community is bordered by the Dulles Toll Road to the east, the Fairfax County Parkway to the west, and the Dulles International Airport to the south. The population of McNair was estimated to be 1,845 in 2019.
History
McNair was originally part of the Fairfax County plantation of Thomas, Sixth Lord Fairfax. The area was first settled in the late 1700s by the McNair family, who were of Scottish descent. The family owned a large tract of land in the area, which was later divided into smaller parcels and sold off. The community was named after the McNair family, and the name was officially adopted in 1887.
In the early 1900s, the area was largely rural and agricultural. The community was home to several farms, as well as a few small businesses. In the 1950s, the area began to experience rapid growth as the Washington, D.C. metropolitan area expanded. The population of McNair increased significantly, and the community began to develop into a suburban neighborhood.
Geography
McNair is located in the southeastern corner of Fairfax County, Virginia. It is situated just south of the town of Herndon, and is bordered by the Dulles Toll Road to the east, the Fairfax County Parkway to the west, and the Dulles International Airport to the south. The community is located approximately 25 miles west of Washington, D.C.
The terrain of McNair is mostly flat, with some rolling hills. The area is heavily wooded, with a mix of deciduous and evergreen trees. The climate is temperate, with hot summers and cold winters.
Economy
McNair is primarily a residential community, with a few small businesses located in the area. The largest employer in the community is the Dulles International Airport, which is located just south of the community. Other major employers in the area include the U.S. Department of Defense, the U.S. Department of Homeland Security, and the U.S. Department of State.
The median household income in McNair is $112,000, which is significantly higher than the national average. The unemployment rate in the community is low, and the cost of living is relatively high.
Demographics
The population of McNair was estimated to be 1,845 in 2019. The racial makeup of the community is predominantly white (83.3%), followed by Asian (7.7%), African American (4.2%), and Hispanic or Latino (2.7%). The median age in the community is 40.7 years, and the median household income is $112,000.
McNair is a diverse community, with a variety of religious and cultural backgrounds represented. The majority of residents are Christian (63.3%), followed by Hindu (7.7%), Muslim (4.2%), and Buddhist (2.7%). The community is also home to a large number of immigrants, with approximately 20% of the population being foreign-born.
Common Questions
What is Per Capita Income in McNair?
Per Capita income in McNair is $54,249.
What is the Median Family Income in McNair?
Median Family Income in McNair is $119,628.
What is the Median Household income in McNair?
Median Household Income in McNair is $115,696.
What is Income or Wage Gap in McNair?
Income or Wage Gap in McNair is 39.4%.
Women in McNair earn 60.6 cents for every dollar earned by a man.
What is Inequality or Gini Index in McNair?
Inequality or Gini Index in McNair is 0.36.
What is the Total Population of McNair?
Total Population of McNair is 22,187.
What is the Total Male Population of McNair?
Total Male Population of McNair is 11,736.
What is the Total Female Population of McNair?
Total Female Population of McNair is 10,451.
What is the Ratio of Males per 100 Females in McNair?
There are 112.30 Males per 100 Females in McNair.
What is the Ratio of Females per 100 Males in McNair?
There are 89.05 Females per 100 Males in McNair.
What is the Median Population Age in McNair?
Median Population Age in McNair is 30.9 Years.
What is the Average Family Size in McNair
Average Family Size in McNair is 3.3 People.
What is the Average Household Size in McNair
Average Household Size in McNair is 2.5 People.
How Large is the Labor Force in McNair?
There are 14,262 People in the Labor Forcein in McNair.
What is the Percentage of People in the Labor Force in McNair?
79.4% of People are in the Labor Force in McNair.
What is the Unemployment Rate in McNair?
Unemployment Rate in McNair is 3.6%.