Wolf Trap, VA Map & Demographics
Wolf Trap Map
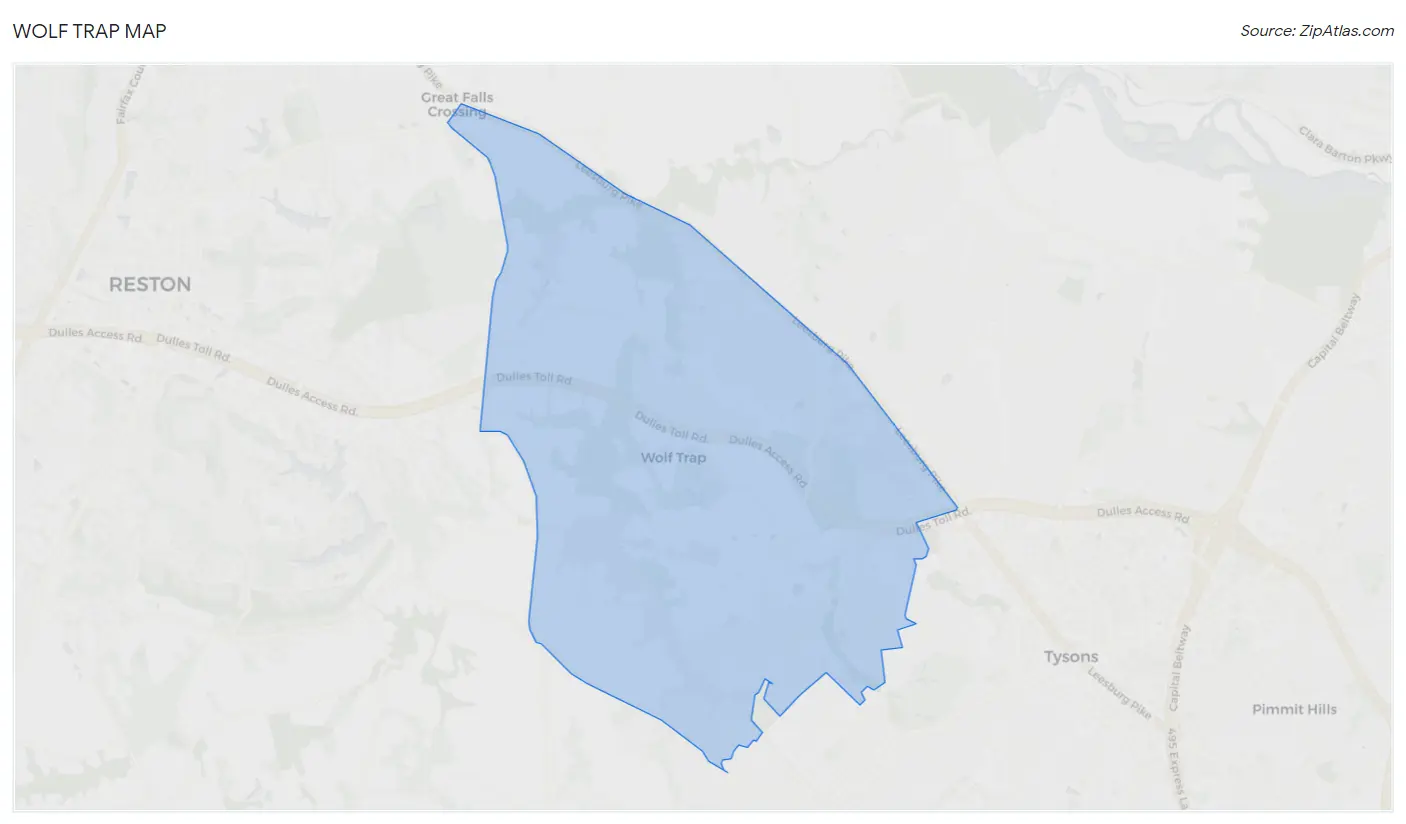
Wolf Trap Overview
$104,924
PER CAPITA INCOME
$250,001
AVG FAMILY INCOME
$246,563
AVG HOUSEHOLD INCOME
60.9%
WAGE / INCOME GAP [ % ]
39.1¢/ $1
WAGE / INCOME GAP [ $ ]
$12,657
FAMILY INCOME DEFICIT
0.42
INEQUALITY / GINI INDEX
15,712
TOTAL POPULATION
7,743
MALE POPULATION
7,969
FEMALE POPULATION
97.16
MALES / 100 FEMALES
102.92
FEMALES / 100 MALES
47.0
MEDIAN AGE
3.2
AVG FAMILY SIZE
2.9
AVG HOUSEHOLD SIZE
7,735
LABOR FORCE [ PEOPLE ]
63.0%
PERCENT IN LABOR FORCE
2.4%
UNEMPLOYMENT RATE
Income in Wolf Trap
Income Overview in Wolf Trap
Per Capita Income in Wolf Trap is $104,924, while median incomes of families and households are $250,001 and $246,563 respectively.
| Characteristic | Number | Measure |
| Per Capita Income | 15,712 | $104,924 |
| Median Family Income | 4,562 | $250,001 |
| Mean Family Income | 4,562 | $332,361 |
| Median Household Income | 5,417 | $246,563 |
| Mean Household Income | 5,417 | $301,790 |
| Income Deficit | 4,562 | $12,657 |
| Wage / Income Gap (%) | 15,712 | 60.86% |
| Wage / Income Gap ($) | 15,712 | 39.14¢ per $1 |
| Gini / Inequality Index | 15,712 | 0.42 |
Earnings by Sex in Wolf Trap
Average Earnings in Wolf Trap are $118,750, $173,375 for men and $67,860 for women, a difference of 60.9%.
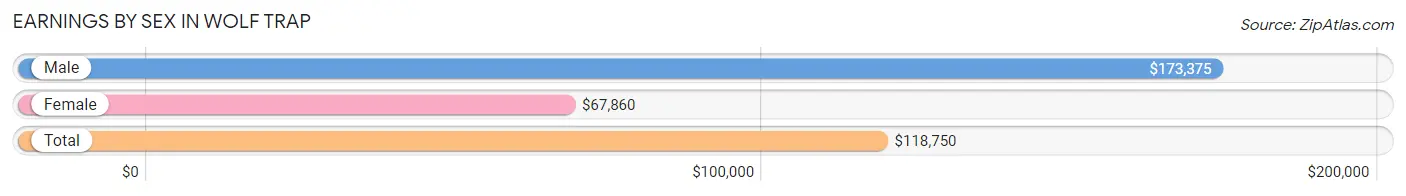
| Sex | Number | Average Earnings |
| Male | 4,516 (54.5%) | $173,375 |
| Female | 3,765 (45.5%) | $67,860 |
| Total | 8,281 (100.0%) | $118,750 |
Earnings by Sex by Income Bracket in Wolf Trap
The most common earnings brackets in Wolf Trap are $100,000+ for men (3,204 | 71.0%) and $100,000+ for women (1,450 | 38.5%).
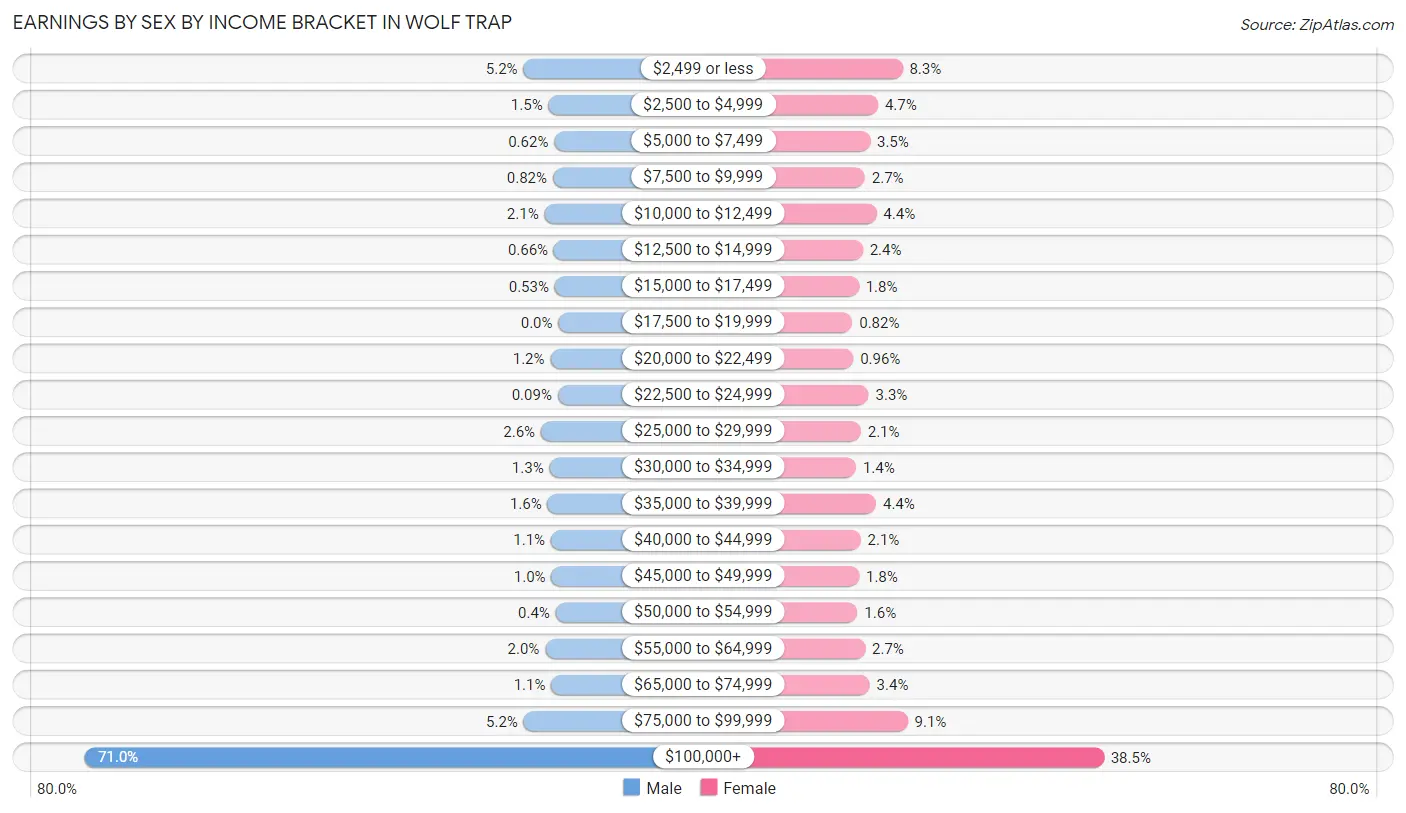
| Income | Male | Female |
| $2,499 or less | 236 (5.2%) | 314 (8.3%) |
| $2,500 to $4,999 | 67 (1.5%) | 176 (4.7%) |
| $5,000 to $7,499 | 28 (0.6%) | 131 (3.5%) |
| $7,500 to $9,999 | 37 (0.8%) | 102 (2.7%) |
| $10,000 to $12,499 | 94 (2.1%) | 167 (4.4%) |
| $12,500 to $14,999 | 30 (0.7%) | 90 (2.4%) |
| $15,000 to $17,499 | 24 (0.5%) | 67 (1.8%) |
| $17,500 to $19,999 | 0 (0.0%) | 31 (0.8%) |
| $20,000 to $22,499 | 54 (1.2%) | 36 (1.0%) |
| $22,500 to $24,999 | 4 (0.1%) | 123 (3.3%) |
| $25,000 to $29,999 | 118 (2.6%) | 79 (2.1%) |
| $30,000 to $34,999 | 60 (1.3%) | 52 (1.4%) |
| $35,000 to $39,999 | 73 (1.6%) | 165 (4.4%) |
| $40,000 to $44,999 | 50 (1.1%) | 78 (2.1%) |
| $45,000 to $49,999 | 47 (1.0%) | 69 (1.8%) |
| $50,000 to $54,999 | 18 (0.4%) | 60 (1.6%) |
| $55,000 to $64,999 | 89 (2.0%) | 103 (2.7%) |
| $65,000 to $74,999 | 48 (1.1%) | 129 (3.4%) |
| $75,000 to $99,999 | 235 (5.2%) | 343 (9.1%) |
| $100,000+ | 3,204 (71.0%) | 1,450 (38.5%) |
| Total | 4,516 (100.0%) | 3,765 (100.0%) |
Earnings by Sex by Educational Attainment in Wolf Trap
Average earnings in Wolf Trap are $179,080 for men and $85,590 for women, a difference of 52.2%. Men with an educational attainment of graduate degree enjoy the highest average annual earnings of $197,660, while those with high school diploma education earn the least with $95,733. Women with an educational attainment of graduate degree earn the most with the average annual earnings of $116,595, while those with high school diploma education have the smallest earnings of $25,795.
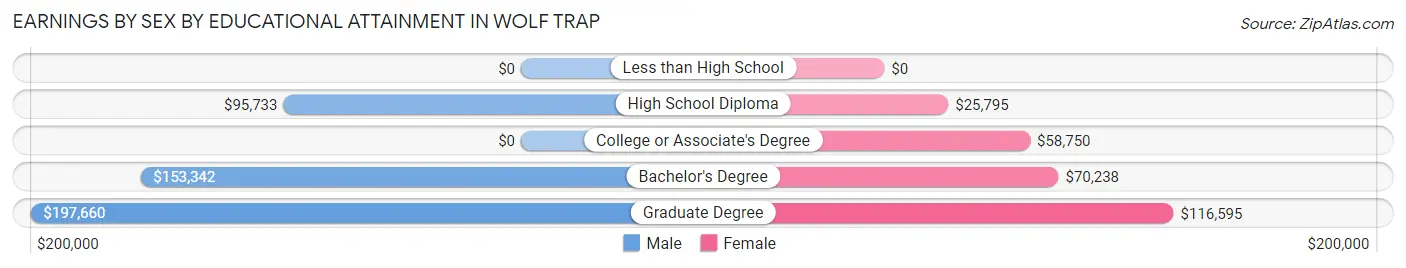
| Educational Attainment | Male Income | Female Income |
| Less than High School | - | - |
| High School Diploma | $95,733 | $25,795 |
| College or Associate's Degree | - | - |
| Bachelor's Degree | $153,342 | $70,238 |
| Graduate Degree | $197,660 | $116,595 |
| Total | $179,080 | $85,590 |
Family Income in Wolf Trap
Family Income Brackets in Wolf Trap
According to the Wolf Trap family income data, there are 3,207 families falling into the $200,000+ income range, which is the most common income bracket and makes up 70.3% of all families. Conversely, the $10,000 to $14,999 income bracket is the least frequent group with only 9 families (0.2%) belonging to this category.
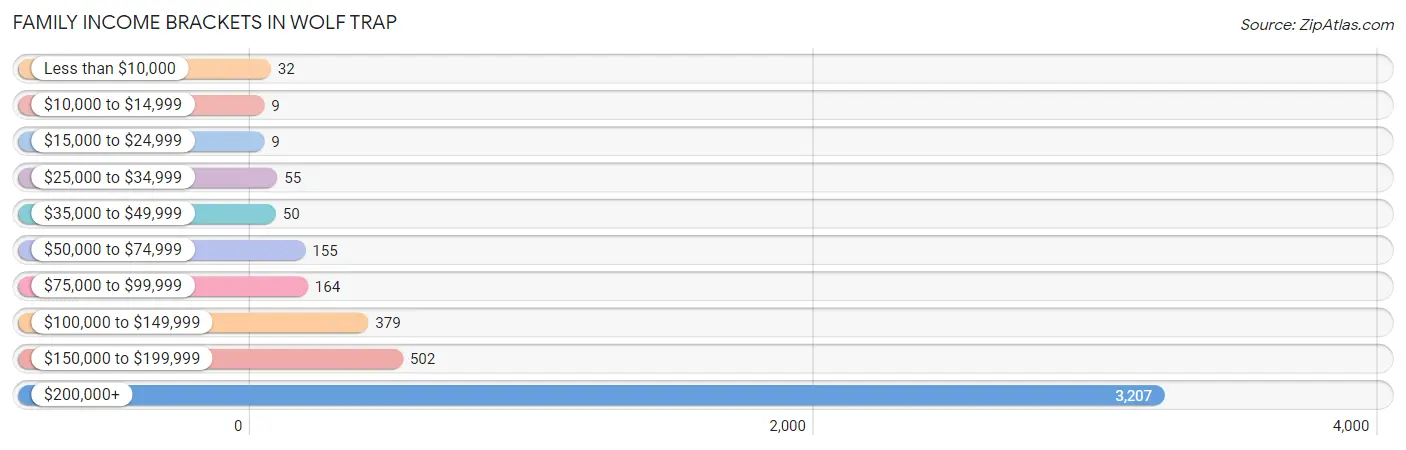
| Income Bracket | # Families | % Families |
| Less than $10,000 | 32 | 0.7% |
| $10,000 to $14,999 | 9 | 0.2% |
| $15,000 to $24,999 | 9 | 0.2% |
| $25,000 to $34,999 | 55 | 1.2% |
| $35,000 to $49,999 | 50 | 1.1% |
| $50,000 to $74,999 | 155 | 3.4% |
| $75,000 to $99,999 | 164 | 3.6% |
| $100,000 to $149,999 | 379 | 8.3% |
| $150,000 to $199,999 | 502 | 11.0% |
| $200,000+ | 3,207 | 70.3% |
Family Income by Famaliy Size in Wolf Trap
3-person families (1,088 | 23.8%) account for the highest median family income in Wolf Trap with $250,001 per family, while 2-person families (1,919 | 42.1%) have the highest median income of $107,977 per family member.
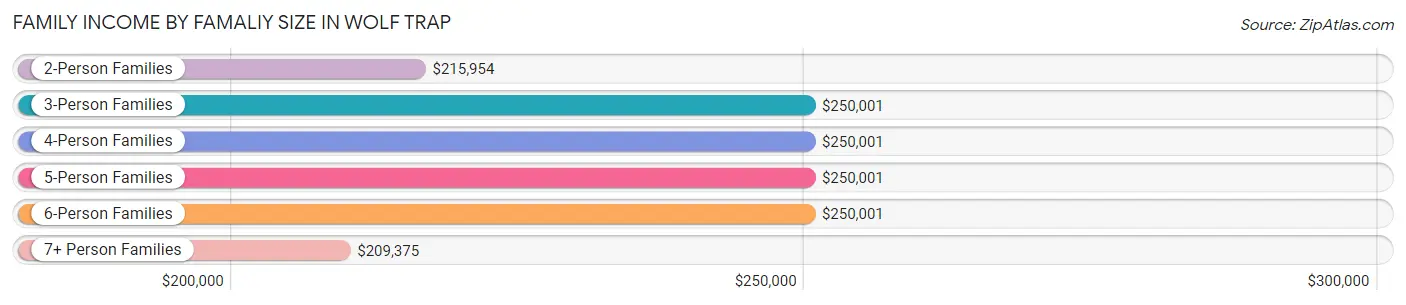
| Income Bracket | # Families | Median Income |
| 2-Person Families | 1,919 (42.1%) | $215,954 |
| 3-Person Families | 1,088 (23.8%) | $250,001 |
| 4-Person Families | 971 (21.3%) | $250,001 |
| 5-Person Families | 481 (10.5%) | $250,001 |
| 6-Person Families | 95 (2.1%) | $250,001 |
| 7+ Person Families | 8 (0.2%) | $209,375 |
| Total | 4,562 (100.0%) | $250,001 |
Family Income by Number of Earners in Wolf Trap
The median family income in Wolf Trap is $250,001, with families comprising 2 earners (2,406) having the highest median family income of $250,001, while families with no earners (619) have the lowest median family income of $161,534, accounting for 52.7% and 13.6% of families, respectively.
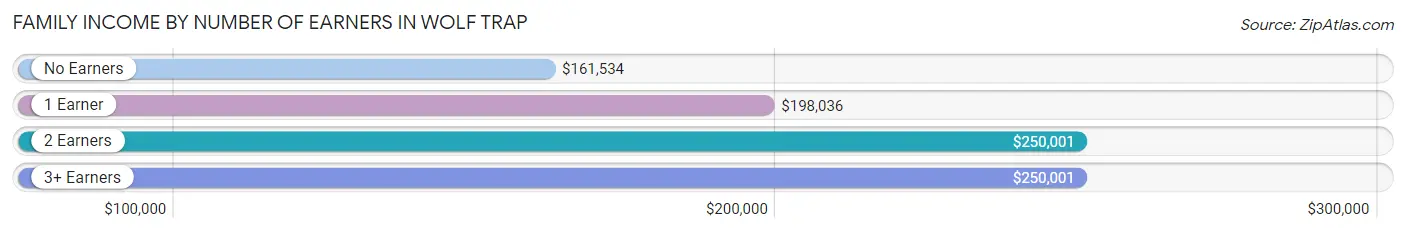
| Number of Earners | # Families | Median Income |
| No Earners | 619 (13.6%) | $161,534 |
| 1 Earner | 1,061 (23.3%) | $198,036 |
| 2 Earners | 2,406 (52.7%) | $250,001 |
| 3+ Earners | 476 (10.4%) | $250,001 |
| Total | 4,562 (100.0%) | $250,001 |
Household Income in Wolf Trap
Household Income Brackets in Wolf Trap
With 3,402 households falling in the category, the $200,000+ income range is the most frequent in Wolf Trap, accounting for 62.8% of all households. In contrast, only 22 households (0.4%) fall into the $10,000 to $14,999 income bracket, making it the least populous group.
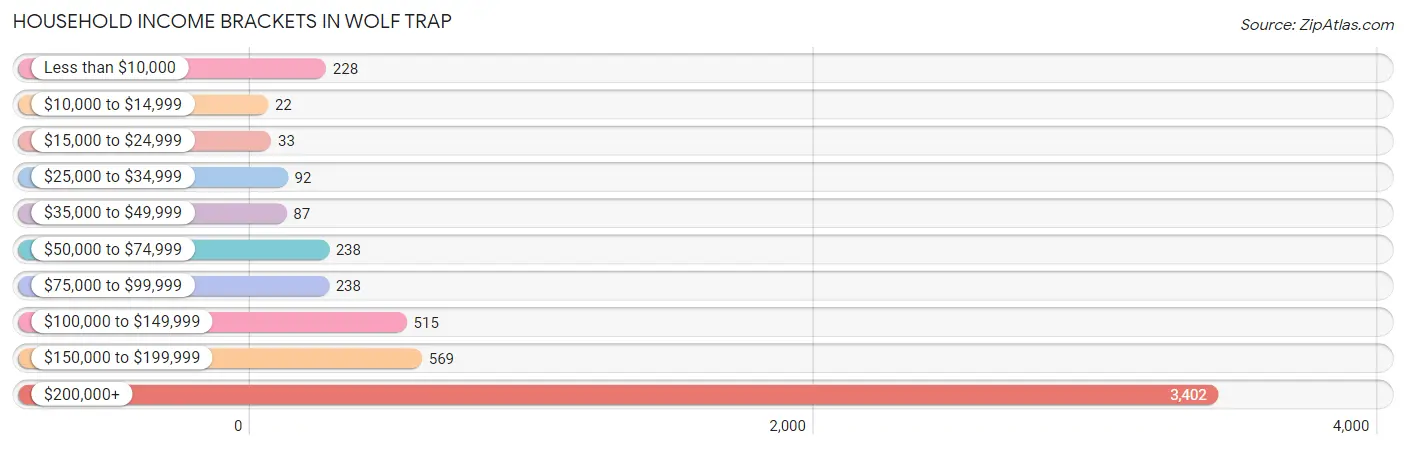
| Income Bracket | # Households | % Households |
| Less than $10,000 | 228 | 4.2% |
| $10,000 to $14,999 | 22 | 0.4% |
| $15,000 to $24,999 | 33 | 0.6% |
| $25,000 to $34,999 | 92 | 1.7% |
| $35,000 to $49,999 | 87 | 1.6% |
| $50,000 to $74,999 | 238 | 4.4% |
| $75,000 to $99,999 | 238 | 4.4% |
| $100,000 to $149,999 | 515 | 9.5% |
| $150,000 to $199,999 | 569 | 10.5% |
| $200,000+ | 3,402 | 62.8% |
Household Income by Householder Age in Wolf Trap
The median household income in Wolf Trap is $246,563, with the highest median household income of $250,001 found in the 25 to 44 years age bracket for the primary householder. A total of 985 households (18.2%) fall into this category. Meanwhile, the 15 to 24 years age bracket for the primary householder has the lowest median household income of $0, with 5 households (0.1%) in this group.
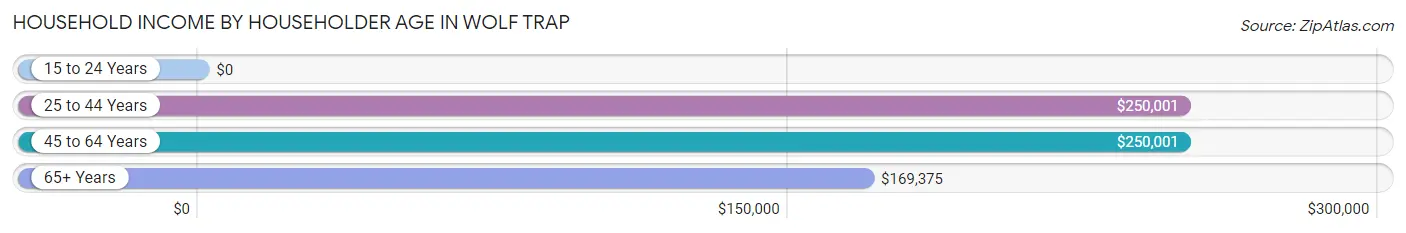
| Income Bracket | # Households | Median Income |
| 15 to 24 Years | 5 (0.1%) | $0 |
| 25 to 44 Years | 985 (18.2%) | $250,001 |
| 45 to 64 Years | 2,839 (52.4%) | $250,001 |
| 65+ Years | 1,588 (29.3%) | $169,375 |
| Total | 5,417 (100.0%) | $246,563 |
Poverty in Wolf Trap
Income Below Poverty by Sex and Age in Wolf Trap
With 3.3% poverty level for males and 2.5% for females among the residents of Wolf Trap, 35 to 44 year old males and 18 to 24 year old females are the most vulnerable to poverty, with 160 males (16.1%) and 51 females (9.3%) in their respective age groups living below the poverty level.
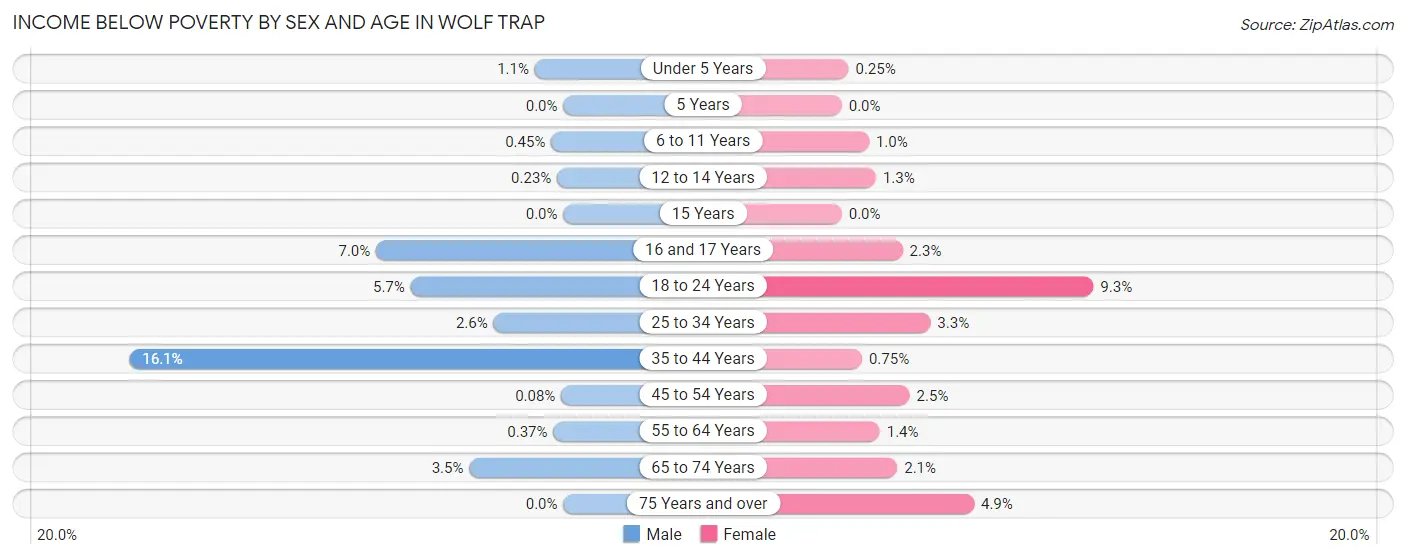
| Age Bracket | Male | Female |
| Under 5 Years | 4 (1.1%) | 1 (0.3%) |
| 5 Years | 0 (0.0%) | 0 (0.0%) |
| 6 to 11 Years | 3 (0.4%) | 8 (1.0%) |
| 12 to 14 Years | 1 (0.2%) | 4 (1.3%) |
| 15 Years | 0 (0.0%) | 0 (0.0%) |
| 16 and 17 Years | 23 (7.0%) | 5 (2.3%) |
| 18 to 24 Years | 20 (5.7%) | 51 (9.3%) |
| 25 to 34 Years | 7 (2.6%) | 11 (3.3%) |
| 35 to 44 Years | 160 (16.1%) | 7 (0.7%) |
| 45 to 54 Years | 1 (0.1%) | 30 (2.5%) |
| 55 to 64 Years | 5 (0.4%) | 20 (1.4%) |
| 65 to 74 Years | 27 (3.5%) | 15 (2.1%) |
| 75 Years and over | 0 (0.0%) | 43 (4.9%) |
| Total | 251 (3.3%) | 195 (2.5%) |
Income Above Poverty by Sex and Age in Wolf Trap
According to the poverty statistics in Wolf Trap, males aged 5 years and females aged 5 years are the age groups that are most secure financially, with 100.0% of males and 100.0% of females in these age groups living above the poverty line.
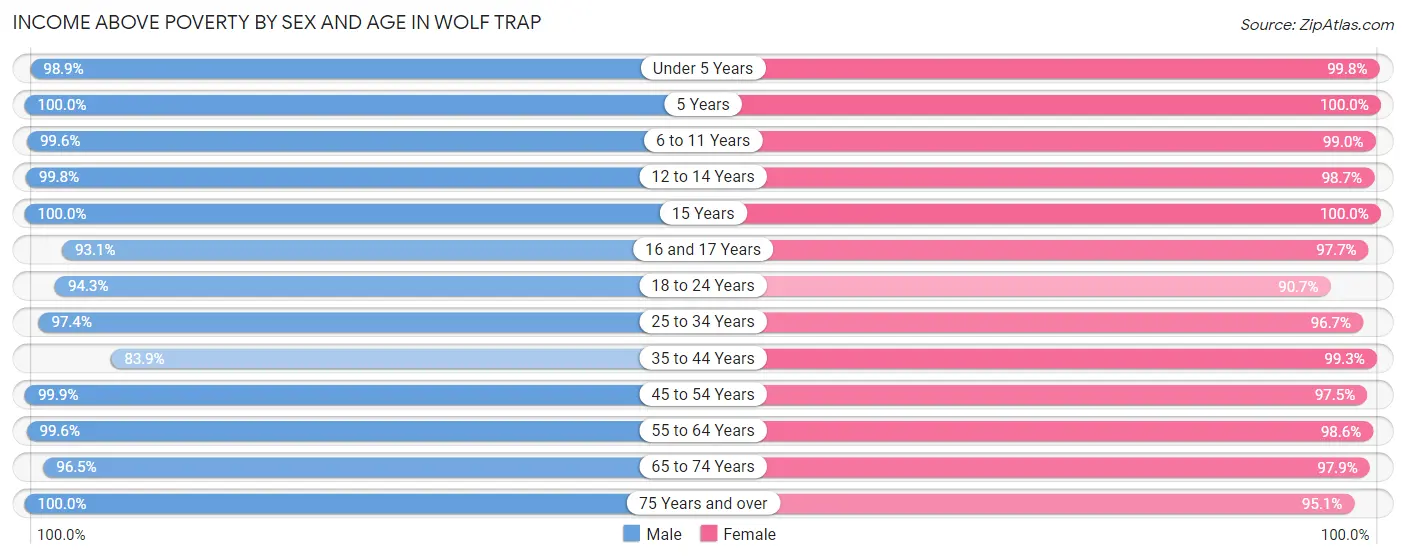
| Age Bracket | Male | Female |
| Under 5 Years | 375 (98.9%) | 397 (99.8%) |
| 5 Years | 91 (100.0%) | 126 (100.0%) |
| 6 to 11 Years | 667 (99.6%) | 788 (99.0%) |
| 12 to 14 Years | 441 (99.8%) | 310 (98.7%) |
| 15 Years | 122 (100.0%) | 76 (100.0%) |
| 16 and 17 Years | 308 (93.0%) | 216 (97.7%) |
| 18 to 24 Years | 333 (94.3%) | 495 (90.7%) |
| 25 to 34 Years | 263 (97.4%) | 323 (96.7%) |
| 35 to 44 Years | 833 (83.9%) | 932 (99.3%) |
| 45 to 54 Years | 1,250 (99.9%) | 1,162 (97.5%) |
| 55 to 64 Years | 1,347 (99.6%) | 1,395 (98.6%) |
| 65 to 74 Years | 746 (96.5%) | 714 (97.9%) |
| 75 Years and over | 703 (100.0%) | 832 (95.1%) |
| Total | 7,479 (96.8%) | 7,766 (97.6%) |
Income Below Poverty Among Married-Couple Families in Wolf Trap
The poverty statistics for married-couple families in Wolf Trap show that 0.5% or 23 of the total 4,246 families live below the poverty line. Families with no children have the highest poverty rate of 0.8%, comprising of 18 families. On the other hand, families with 5 or more children have the lowest poverty rate of 0.0%, which includes 0 families.
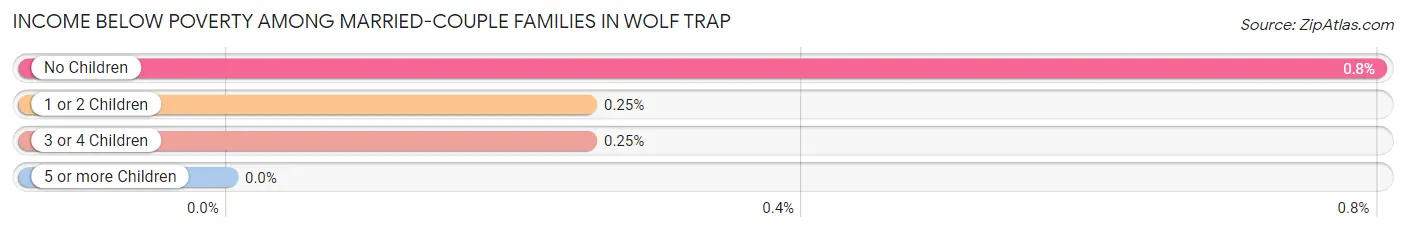
| Children | Above Poverty | Below Poverty |
| No Children | 2,241 (99.2%) | 18 (0.8%) |
| 1 or 2 Children | 1,583 (99.8%) | 4 (0.3%) |
| 3 or 4 Children | 392 (99.8%) | 1 (0.3%) |
| 5 or more Children | 7 (100.0%) | 0 (0.0%) |
| Total | 4,223 (99.5%) | 23 (0.5%) |
Income Below Poverty Among Single-Parent Households in Wolf Trap
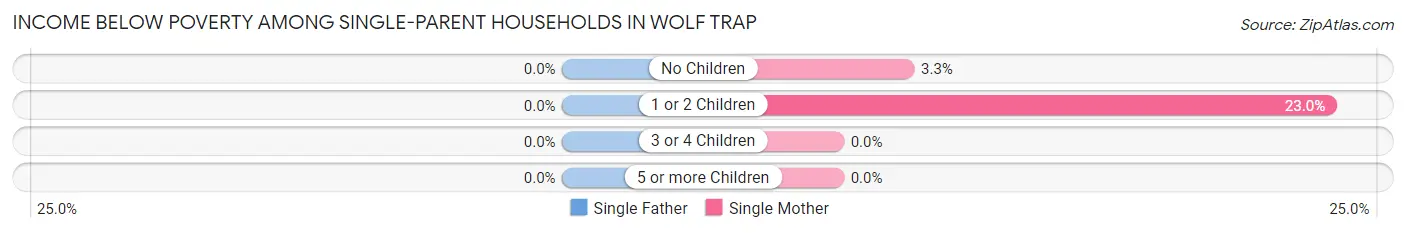
| Children | Single Father | Single Mother |
| No Children | 0 (0.0%) | 6 (3.3%) |
| 1 or 2 Children | 0 (0.0%) | 17 (23.0%) |
| 3 or 4 Children | 0 (0.0%) | 0 (0.0%) |
| 5 or more Children | 0 (0.0%) | 0 (0.0%) |
| Total | 0 (0.0%) | 23 (8.9%) |
Income Below Poverty Among Married-Couple vs Single-Parent Households in Wolf Trap
The poverty data for Wolf Trap shows that 23 of the married-couple family households (0.5%) and 23 of the single-parent households (7.3%) are living below the poverty level. Within the married-couple family households, those with no children have the highest poverty rate, with 18 households (0.8%) falling below the poverty line. Among the single-parent households, those with 1 or 2 children have the highest poverty rate, with 17 household (12.8%) living below poverty.
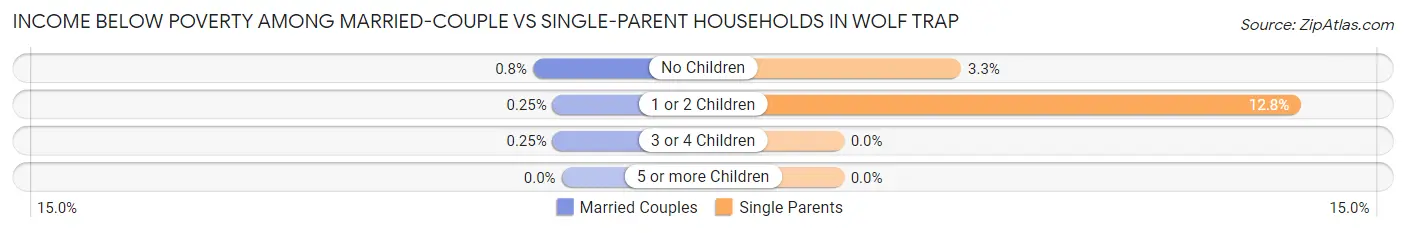
| Children | Married-Couple Families | Single-Parent Households |
| No Children | 18 (0.8%) | 6 (3.3%) |
| 1 or 2 Children | 4 (0.3%) | 17 (12.8%) |
| 3 or 4 Children | 1 (0.3%) | 0 (0.0%) |
| 5 or more Children | 0 (0.0%) | 0 (0.0%) |
| Total | 23 (0.5%) | 23 (7.3%) |
Race in Wolf Trap
The most populous races in Wolf Trap are White / Caucasian (11,513 | 73.3%), Asian (2,915 | 18.5%), and Two or more Races (1,038 | 6.6%).
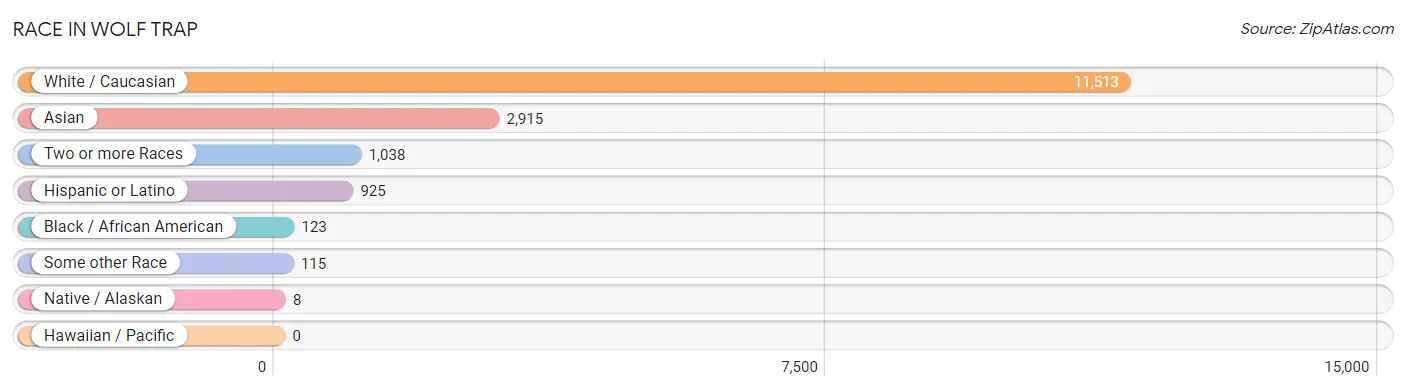
| Race | # Population | % Population |
| Asian | 2,915 | 18.5% |
| Black / African American | 123 | 0.8% |
| Hawaiian / Pacific | 0 | 0.0% |
| Hispanic or Latino | 925 | 5.9% |
| Native / Alaskan | 8 | 0.1% |
| White / Caucasian | 11,513 | 73.3% |
| Two or more Races | 1,038 | 6.6% |
| Some other Race | 115 | 0.7% |
| Total | 15,712 | 100.0% |
Ancestry in Wolf Trap
The most populous ancestries reported in Wolf Trap are English (2,531 | 16.1%), Irish (2,386 | 15.2%), German (2,328 | 14.8%), Thai (1,399 | 8.9%), and American (1,019 | 6.5%), together accounting for 61.5% of all Wolf Trap residents.
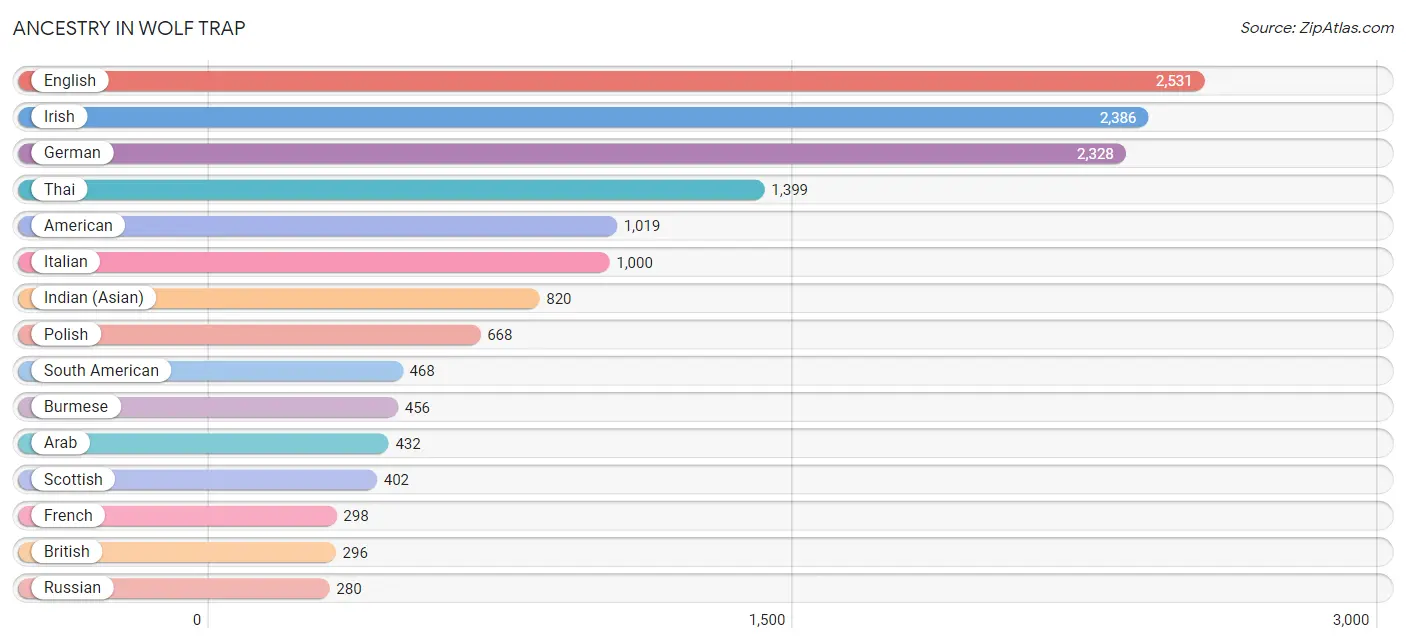
| Ancestry | # Population | % Population |
| Afghan | 1 | 0.0% |
| American | 1,019 | 6.5% |
| Arab | 432 | 2.8% |
| Argentinean | 28 | 0.2% |
| Australian | 6 | 0.0% |
| Austrian | 57 | 0.4% |
| Belgian | 22 | 0.1% |
| Bhutanese | 57 | 0.4% |
| Bolivian | 62 | 0.4% |
| Brazilian | 52 | 0.3% |
| British | 296 | 1.9% |
| Bulgarian | 51 | 0.3% |
| Burmese | 456 | 2.9% |
| Canadian | 78 | 0.5% |
| Carpatho Rusyn | 7 | 0.0% |
| Celtic | 46 | 0.3% |
| Central American | 38 | 0.2% |
| Chilean | 63 | 0.4% |
| Colombian | 84 | 0.5% |
| Croatian | 49 | 0.3% |
| Cuban | 90 | 0.6% |
| Czech | 134 | 0.9% |
| Danish | 85 | 0.5% |
| Dutch | 190 | 1.2% |
| Eastern European | 131 | 0.8% |
| Ecuadorian | 17 | 0.1% |
| Egyptian | 43 | 0.3% |
| English | 2,531 | 16.1% |
| Ethiopian | 30 | 0.2% |
| European | 249 | 1.6% |
| Filipino | 74 | 0.5% |
| Finnish | 14 | 0.1% |
| French | 298 | 1.9% |
| French Canadian | 51 | 0.3% |
| German | 2,328 | 14.8% |
| Greek | 144 | 0.9% |
| Guatemalan | 16 | 0.1% |
| Haitian | 9 | 0.1% |
| Hungarian | 115 | 0.7% |
| Indian (Asian) | 820 | 5.2% |
| Iranian | 272 | 1.7% |
| Irish | 2,386 | 15.2% |
| Italian | 1,000 | 6.4% |
| Korean | 95 | 0.6% |
| Laotian | 7 | 0.0% |
| Latvian | 25 | 0.2% |
| Lebanese | 178 | 1.1% |
| Lithuanian | 60 | 0.4% |
| Luxembourger | 4 | 0.0% |
| Mexican | 156 | 1.0% |
| Mexican American Indian | 8 | 0.1% |
| Northern European | 89 | 0.6% |
| Norwegian | 135 | 0.9% |
| Pakistani | 6 | 0.0% |
| Palestinian | 12 | 0.1% |
| Pennsylvania German | 18 | 0.1% |
| Peruvian | 62 | 0.4% |
| Polish | 668 | 4.3% |
| Portuguese | 38 | 0.2% |
| Puerto Rican | 37 | 0.2% |
| Romanian | 80 | 0.5% |
| Russian | 280 | 1.8% |
| Salvadoran | 22 | 0.1% |
| Scandinavian | 38 | 0.2% |
| Scotch-Irish | 247 | 1.6% |
| Scottish | 402 | 2.6% |
| Serbian | 6 | 0.0% |
| Slavic | 23 | 0.2% |
| Slovak | 79 | 0.5% |
| Slovene | 30 | 0.2% |
| South African | 34 | 0.2% |
| South American | 468 | 3.0% |
| Spaniard | 13 | 0.1% |
| Spanish | 116 | 0.7% |
| Sri Lankan | 168 | 1.1% |
| Subsaharan African | 64 | 0.4% |
| Swedish | 185 | 1.2% |
| Swiss | 39 | 0.3% |
| Syrian | 123 | 0.8% |
| Thai | 1,399 | 8.9% |
| Trinidadian and Tobagonian | 12 | 0.1% |
| Turkish | 21 | 0.1% |
| Ukrainian | 184 | 1.2% |
| Venezuelan | 152 | 1.0% |
| Welsh | 119 | 0.8% | View All 85 Rows |
Immigrants in Wolf Trap
The most numerous immigrant groups reported in Wolf Trap came from Asia (2,433 | 15.5%), South Central Asia (1,294 | 8.2%), India (732 | 4.7%), Europe (725 | 4.6%), and Eastern Asia (691 | 4.4%), together accounting for 37.4% of all Wolf Trap residents.
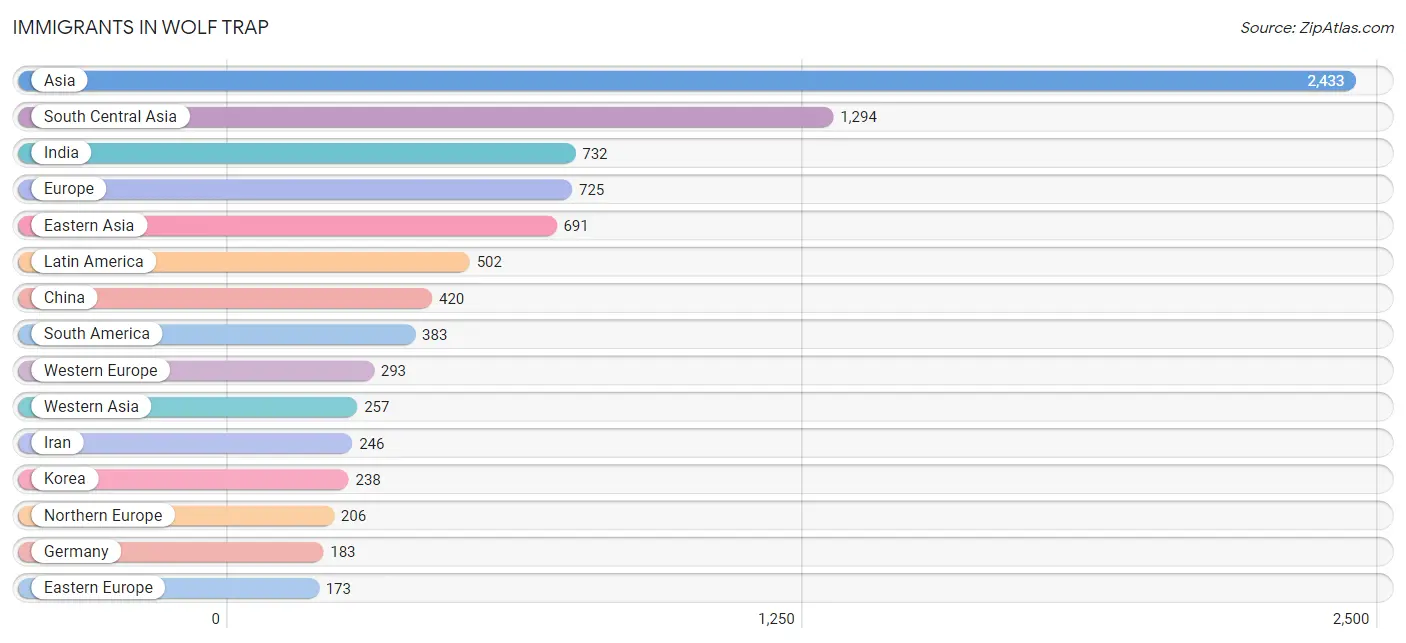
| Immigration Origin | # Population | % Population |
| Afghanistan | 168 | 1.1% |
| Africa | 127 | 0.8% |
| Argentina | 17 | 0.1% |
| Asia | 2,433 | 15.5% |
| Belgium | 9 | 0.1% |
| Bolivia | 27 | 0.2% |
| Brazil | 84 | 0.5% |
| Bulgaria | 61 | 0.4% |
| Canada | 81 | 0.5% |
| Caribbean | 30 | 0.2% |
| Central America | 89 | 0.6% |
| Chile | 17 | 0.1% |
| China | 420 | 2.7% |
| Colombia | 74 | 0.5% |
| Cuba | 30 | 0.2% |
| Czechoslovakia | 5 | 0.0% |
| Eastern Africa | 47 | 0.3% |
| Eastern Asia | 691 | 4.4% |
| Eastern Europe | 173 | 1.1% |
| Ecuador | 11 | 0.1% |
| El Salvador | 12 | 0.1% |
| England | 63 | 0.4% |
| Ethiopia | 30 | 0.2% |
| Europe | 725 | 4.6% |
| France | 101 | 0.6% |
| Germany | 183 | 1.2% |
| Greece | 37 | 0.2% |
| Guatemala | 16 | 0.1% |
| Hong Kong | 7 | 0.0% |
| Hungary | 26 | 0.2% |
| India | 732 | 4.7% |
| Indonesia | 7 | 0.0% |
| Iran | 246 | 1.6% |
| Iraq | 3 | 0.0% |
| Ireland | 8 | 0.1% |
| Italy | 16 | 0.1% |
| Japan | 33 | 0.2% |
| Jordan | 9 | 0.1% |
| Kazakhstan | 35 | 0.2% |
| Kenya | 8 | 0.1% |
| Korea | 238 | 1.5% |
| Latin America | 502 | 3.2% |
| Lebanon | 102 | 0.6% |
| Mexico | 55 | 0.4% |
| Nepal | 58 | 0.4% |
| Northern Europe | 206 | 1.3% |
| Norway | 8 | 0.1% |
| Pakistan | 55 | 0.4% |
| Panama | 6 | 0.0% |
| Peru | 28 | 0.2% |
| Philippines | 59 | 0.4% |
| Poland | 22 | 0.1% |
| Romania | 27 | 0.2% |
| Russia | 18 | 0.1% |
| Saudi Arabia | 42 | 0.3% |
| Scotland | 19 | 0.1% |
| Serbia | 6 | 0.0% |
| South Africa | 80 | 0.5% |
| South America | 383 | 2.4% |
| South Central Asia | 1,294 | 8.2% |
| South Eastern Asia | 170 | 1.1% |
| Southern Europe | 53 | 0.3% |
| Syria | 68 | 0.4% |
| Taiwan | 104 | 0.7% |
| Thailand | 6 | 0.0% |
| Turkey | 10 | 0.1% |
| Venezuela | 125 | 0.8% |
| Vietnam | 98 | 0.6% |
| Western Asia | 257 | 1.6% |
| Western Europe | 293 | 1.9% |
| Yemen | 23 | 0.2% | View All 71 Rows |
Sex and Age in Wolf Trap
Sex and Age in Wolf Trap
The most populous age groups in Wolf Trap are 55 to 59 Years (819 | 10.6%) for men and 55 to 59 Years (708 | 8.9%) for women.
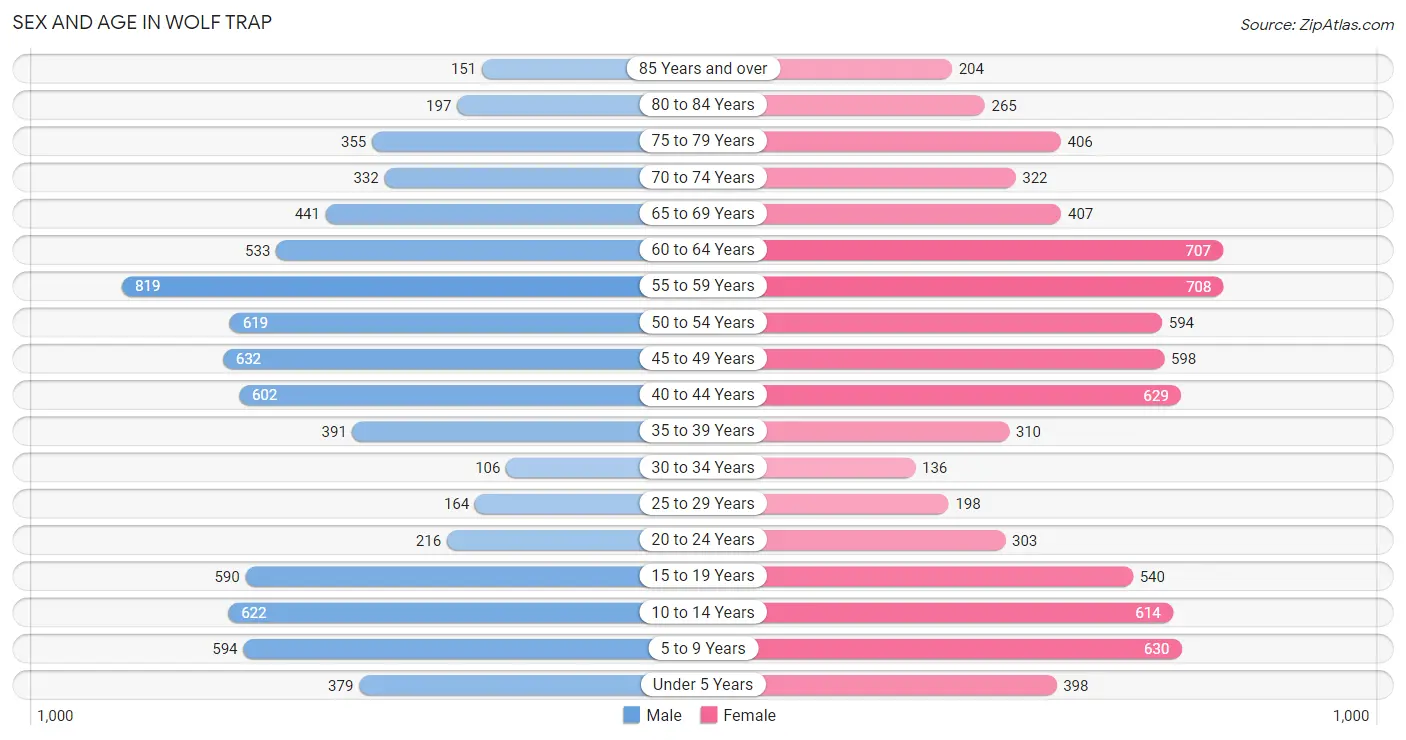
| Age Bracket | Male | Female |
| Under 5 Years | 379 (4.9%) | 398 (5.0%) |
| 5 to 9 Years | 594 (7.7%) | 630 (7.9%) |
| 10 to 14 Years | 622 (8.0%) | 614 (7.7%) |
| 15 to 19 Years | 590 (7.6%) | 540 (6.8%) |
| 20 to 24 Years | 216 (2.8%) | 303 (3.8%) |
| 25 to 29 Years | 164 (2.1%) | 198 (2.5%) |
| 30 to 34 Years | 106 (1.4%) | 136 (1.7%) |
| 35 to 39 Years | 391 (5.1%) | 310 (3.9%) |
| 40 to 44 Years | 602 (7.8%) | 629 (7.9%) |
| 45 to 49 Years | 632 (8.2%) | 598 (7.5%) |
| 50 to 54 Years | 619 (8.0%) | 594 (7.4%) |
| 55 to 59 Years | 819 (10.6%) | 708 (8.9%) |
| 60 to 64 Years | 533 (6.9%) | 707 (8.9%) |
| 65 to 69 Years | 441 (5.7%) | 407 (5.1%) |
| 70 to 74 Years | 332 (4.3%) | 322 (4.0%) |
| 75 to 79 Years | 355 (4.6%) | 406 (5.1%) |
| 80 to 84 Years | 197 (2.5%) | 265 (3.3%) |
| 85 Years and over | 151 (1.9%) | 204 (2.6%) |
| Total | 7,743 (100.0%) | 7,969 (100.0%) |
Families and Households in Wolf Trap
Median Family Size in Wolf Trap
The median family size in Wolf Trap is 3.18 persons per family, with married-couple families (4,246 | 93.1%) accounting for the largest median family size of 3.21 persons per family. On the other hand, single female/mother families (257 | 5.6%) represent the smallest median family size with 2.81 persons per family.
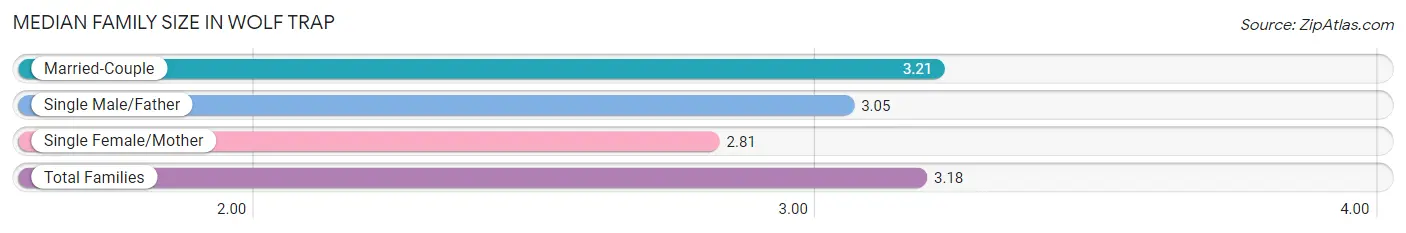
| Family Type | # Families | Family Size |
| Married-Couple | 4,246 (93.1%) | 3.21 |
| Single Male/Father | 59 (1.3%) | 3.05 |
| Single Female/Mother | 257 (5.6%) | 2.81 |
| Total Families | 4,562 (100.0%) | 3.18 |
Median Household Size in Wolf Trap
The median household size in Wolf Trap is 2.90 persons per household, with single male/father households (59 | 1.1%) accounting for the largest median household size of 3.46 persons per household. non-family households (855 | 15.8%) represent the smallest median household size with 1.08 persons per household.
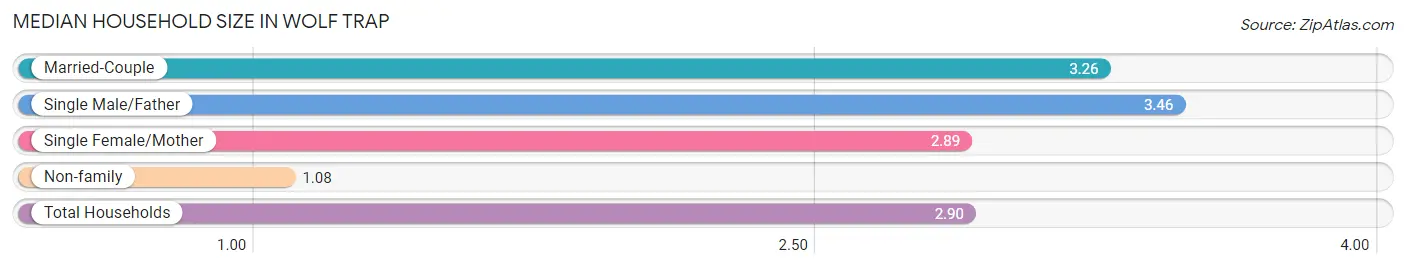
| Household Type | # Households | Household Size |
| Married-Couple | 4,246 (78.4%) | 3.26 |
| Single Male/Father | 59 (1.1%) | 3.46 |
| Single Female/Mother | 257 (4.7%) | 2.89 |
| Non-family | 855 (15.8%) | 1.08 |
| Total Households | 5,417 (100.0%) | 2.90 |
Household Size by Marriage Status in Wolf Trap
Out of a total of 5,417 households in Wolf Trap, 4,562 (84.2%) are family households, while 855 (15.8%) are nonfamily households. The most numerous type of family households are 2-person households, comprising 1,875, and the most common type of nonfamily households are 1-person households, comprising 801.
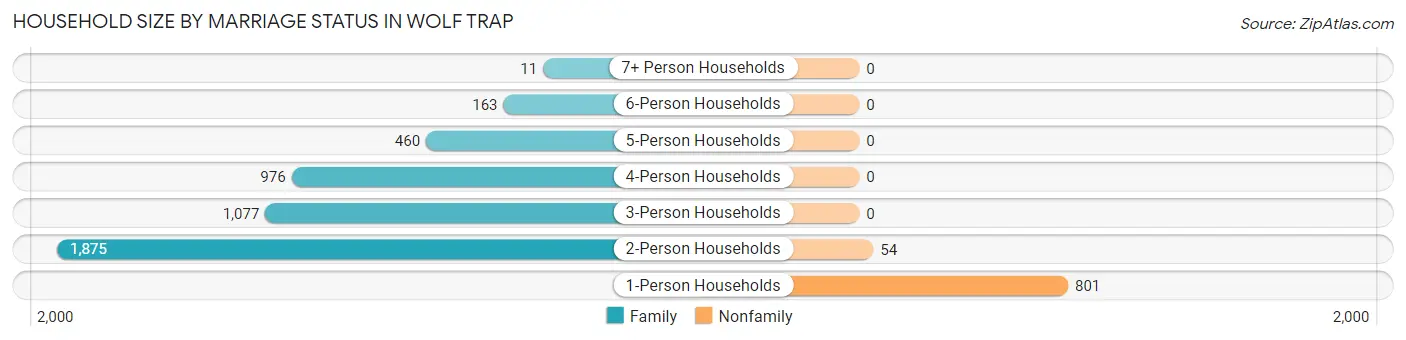
| Household Size | Family Households | Nonfamily Households |
| 1-Person Households | - | 801 (14.8%) |
| 2-Person Households | 1,875 (34.6%) | 54 (1.0%) |
| 3-Person Households | 1,077 (19.9%) | 0 (0.0%) |
| 4-Person Households | 976 (18.0%) | 0 (0.0%) |
| 5-Person Households | 460 (8.5%) | 0 (0.0%) |
| 6-Person Households | 163 (3.0%) | 0 (0.0%) |
| 7+ Person Households | 11 (0.2%) | 0 (0.0%) |
| Total | 4,562 (84.2%) | 855 (15.8%) |
Female Fertility in Wolf Trap
Fertility by Age in Wolf Trap
Average fertility rate in Wolf Trap is 48.0 births per 1,000 women. Women in the age bracket of 35 to 50 years have the highest fertility rate with 66.0 births per 1,000 women. Women in the age bracket of 35 to 50 years acount for 79.5% of all women with births.
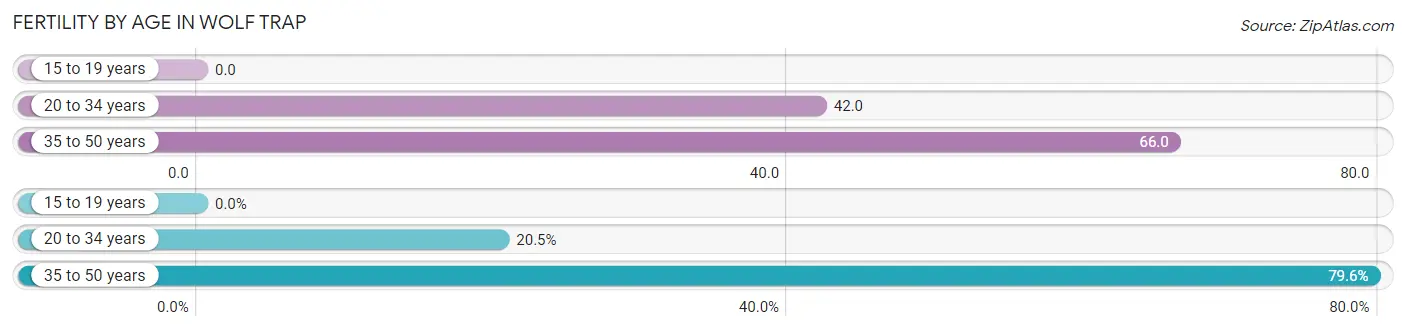
| Age Bracket | Women with Births | Births / 1,000 Women |
| 15 to 19 years | 0 (0.0%) | 0.0 |
| 20 to 34 years | 27 (20.4%) | 42.0 |
| 35 to 50 years | 105 (79.5%) | 66.0 |
| Total | 132 (100.0%) | 48.0 |
Fertility by Age by Marriage Status in Wolf Trap
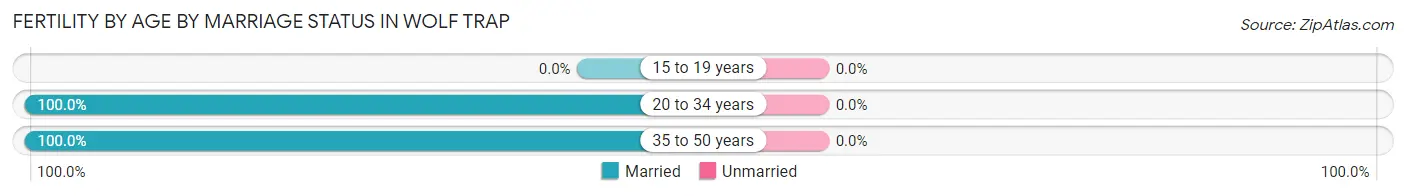
| Age Bracket | Married | Unmarried |
| 15 to 19 years | 0 (0.0%) | 0 (0.0%) |
| 20 to 34 years | 27 (100.0%) | 0 (0.0%) |
| 35 to 50 years | 105 (100.0%) | 0 (0.0%) |
| Total | 132 (100.0%) | 0 (0.0%) |
Fertility by Education in Wolf Trap
Average fertility rate in Wolf Trap is 48.0 births per 1,000 women. Women with the education attainment of graduate degree have the highest fertility rate of 79.0 births per 1,000 women, while women with the education attainment of less than high school have the lowest fertility at 28.0 births per 1,000 women. Women with the education attainment of graduate degree represent 59.1% of all women with births.
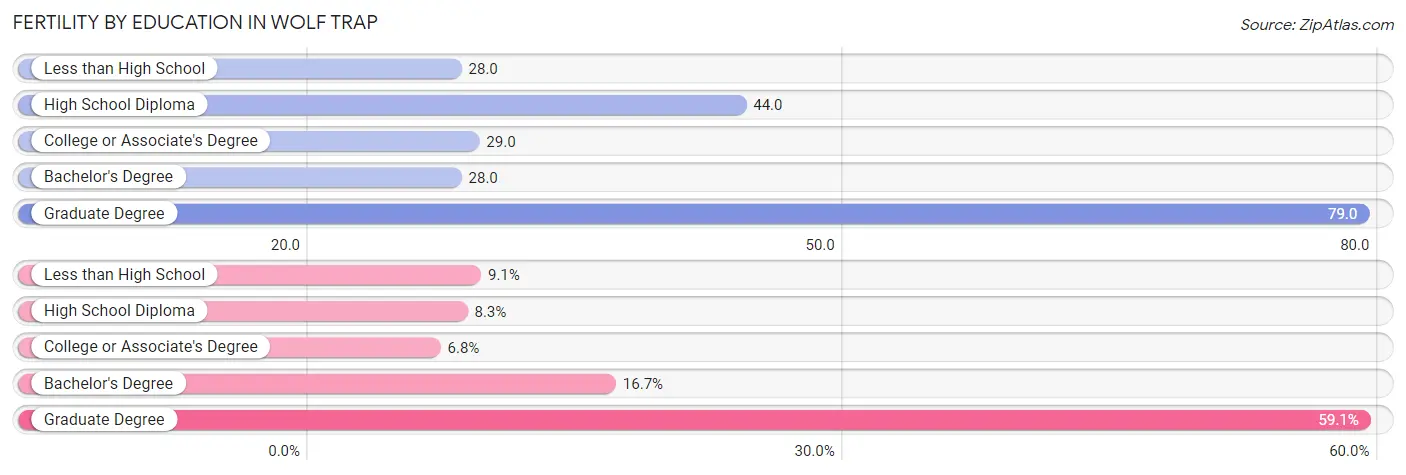
| Educational Attainment | Women with Births | Births / 1,000 Women |
| Less than High School | 12 (9.1%) | 28.0 |
| High School Diploma | 11 (8.3%) | 44.0 |
| College or Associate's Degree | 9 (6.8%) | 29.0 |
| Bachelor's Degree | 22 (16.7%) | 28.0 |
| Graduate Degree | 78 (59.1%) | 79.0 |
| Total | 132 (100.0%) | 48.0 |
Fertility by Education by Marriage Status in Wolf Trap
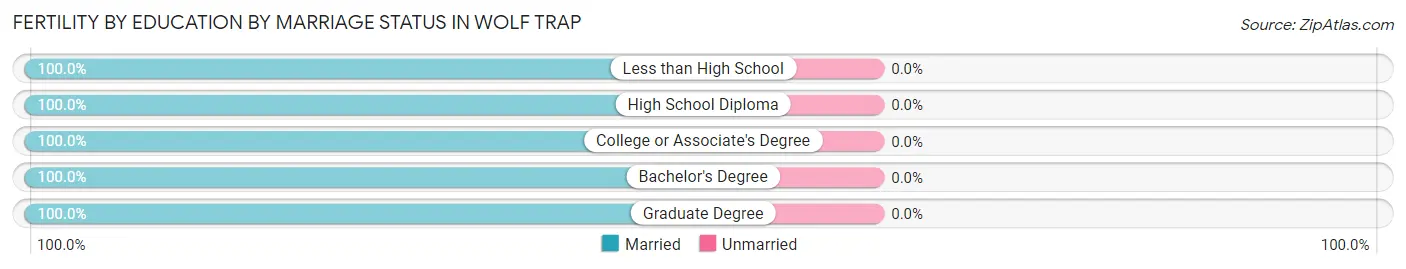
| Educational Attainment | Married | Unmarried |
| Less than High School | 12 (100.0%) | 0 (0.0%) |
| High School Diploma | 11 (100.0%) | 0 (0.0%) |
| College or Associate's Degree | 9 (100.0%) | 0 (0.0%) |
| Bachelor's Degree | 22 (100.0%) | 0 (0.0%) |
| Graduate Degree | 78 (100.0%) | 0 (0.0%) |
| Total | 132 (100.0%) | 0 (0.0%) |
Employment Characteristics in Wolf Trap
Employment by Class of Employer in Wolf Trap
Among the 7,427 employed individuals in Wolf Trap, private company employees (3,983 | 53.6%), federal government employees (1,090 | 14.7%), and not-for-profit organizations (875 | 11.8%) make up the most common classes of employment.
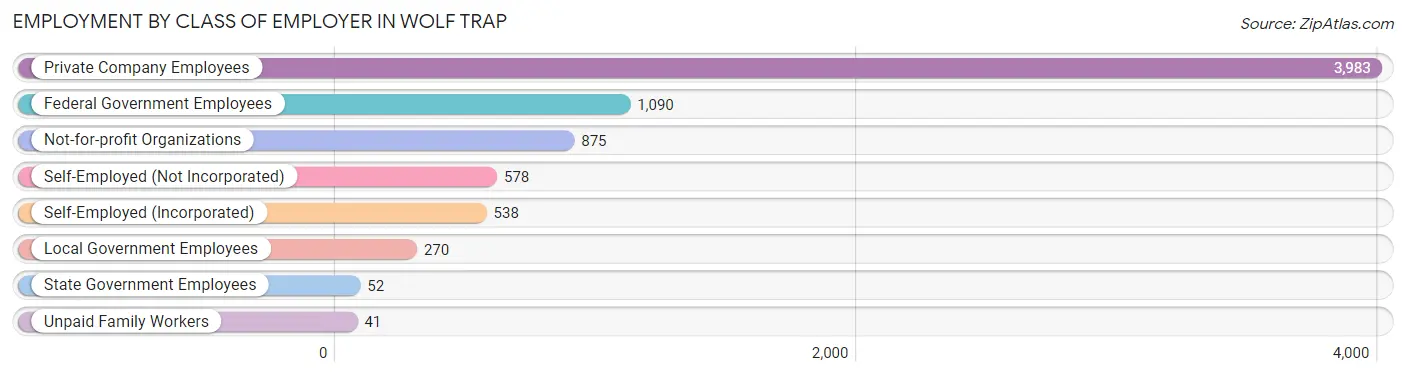
| Employer Class | # Employees | % Employees |
| Private Company Employees | 3,983 | 53.6% |
| Self-Employed (Incorporated) | 538 | 7.2% |
| Self-Employed (Not Incorporated) | 578 | 7.8% |
| Not-for-profit Organizations | 875 | 11.8% |
| Local Government Employees | 270 | 3.6% |
| State Government Employees | 52 | 0.7% |
| Federal Government Employees | 1,090 | 14.7% |
| Unpaid Family Workers | 41 | 0.5% |
| Total | 7,427 | 100.0% |
Employment Status by Age in Wolf Trap
According to the labor force statistics for Wolf Trap, out of the total population over 16 years of age (12,277), 63.0% or 7,735 individuals are in the labor force, with 2.4% or 186 of them unemployed. The age group with the highest labor force participation rate is 30 to 34 years, with 94.2% or 228 individuals in the labor force. Within the labor force, the 20 to 24 years age range has the highest percentage of unemployed individuals, with 14.8% or 56 of them being unemployed.
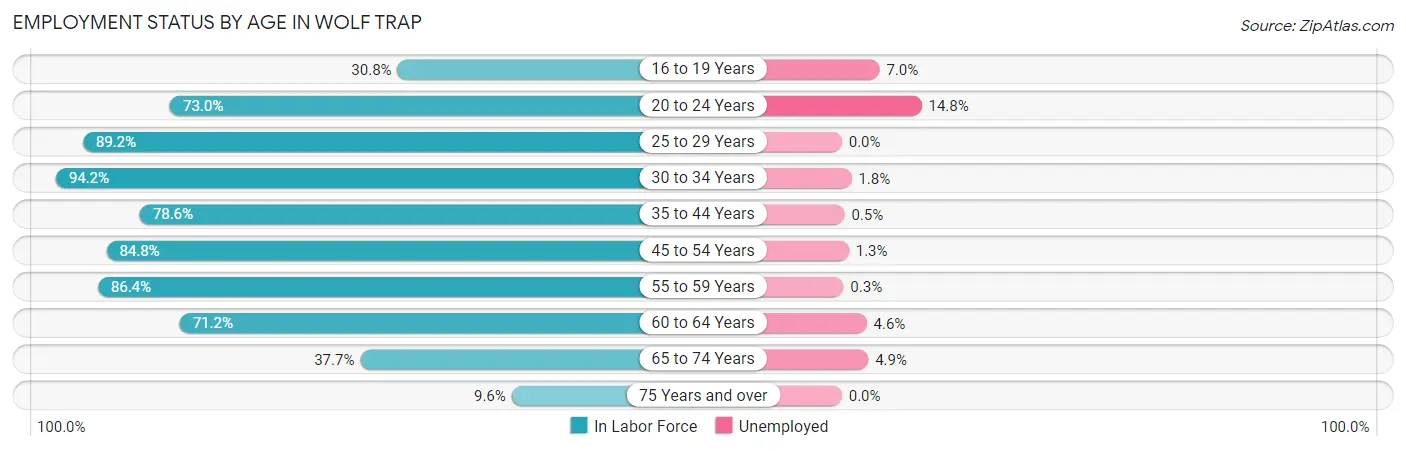
| Age Bracket | In Labor Force | Unemployed |
| 16 to 19 Years | 287 (30.8%) | 20 (7.0%) |
| 20 to 24 Years | 379 (73.0%) | 56 (14.8%) |
| 25 to 29 Years | 323 (89.2%) | 0 (0.0%) |
| 30 to 34 Years | 228 (94.2%) | 4 (1.8%) |
| 35 to 44 Years | 1,519 (78.6%) | 8 (0.5%) |
| 45 to 54 Years | 2,072 (84.8%) | 27 (1.3%) |
| 55 to 59 Years | 1,319 (86.4%) | 4 (0.3%) |
| 60 to 64 Years | 883 (71.2%) | 41 (4.6%) |
| 65 to 74 Years | 566 (37.7%) | 28 (4.9%) |
| 75 Years and over | 151 (9.6%) | 0 (0.0%) |
| Total | 7,735 (63.0%) | 186 (2.4%) |
Employment Status by Educational Attainment in Wolf Trap
According to labor force statistics for Wolf Trap, 81.9% of individuals (6,344) out of the total population between 25 and 64 years of age (7,746) are in the labor force, with 1.3% or 82 of them being unemployed. The group with the highest labor force participation rate are those with the educational attainment of bachelor's degree or higher, with 83.0% or 5,661 individuals in the labor force. Within the labor force, individuals with high school diploma education have the highest percentage of unemployment, with 4.0% or 7 of them being unemployed.
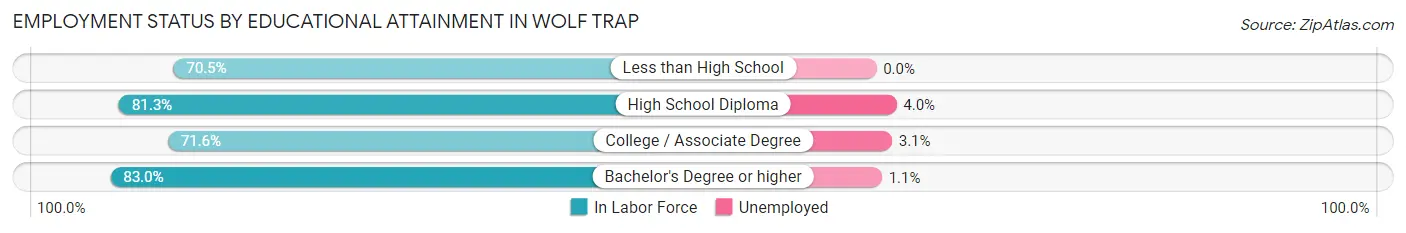
| Educational Attainment | In Labor Force | Unemployed |
| Less than High School | 86 (70.5%) | 0 (0.0%) |
| High School Diploma | 174 (81.3%) | 9 (4.0%) |
| College / Associate Degree | 422 (71.6%) | 18 (3.1%) |
| Bachelor's Degree or higher | 5,661 (83.0%) | 75 (1.1%) |
| Total | 6,344 (81.9%) | 101 (1.3%) |
Employment Occupations by Sex in Wolf Trap
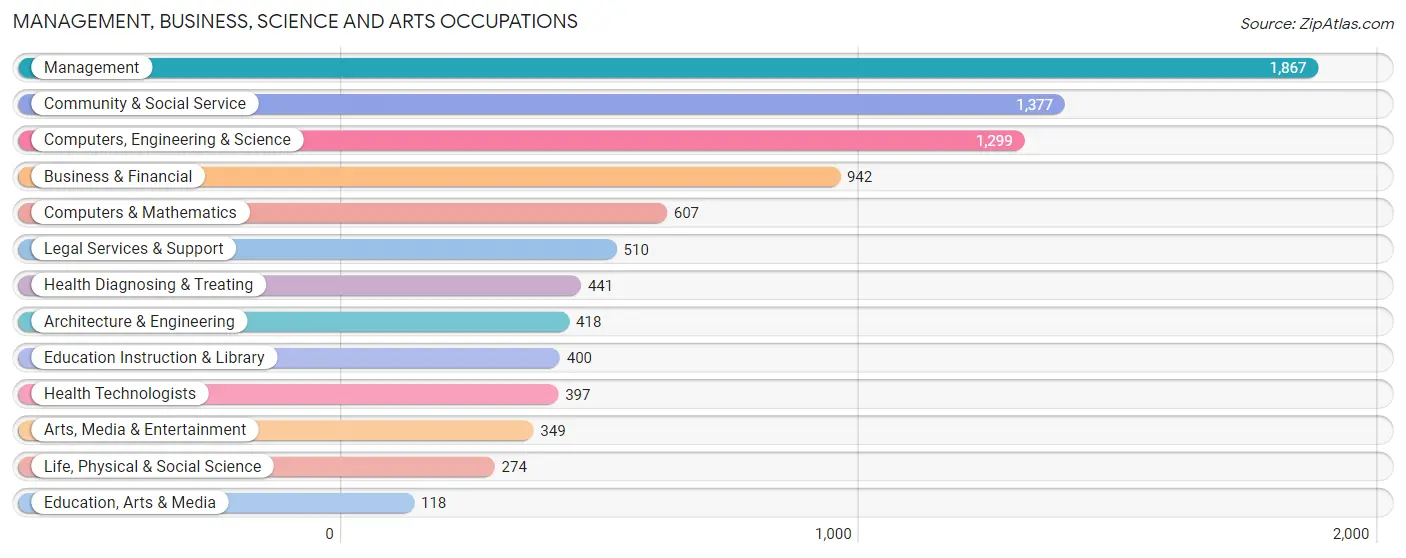
Management, Business, Science and Arts Occupations
The most common Management, Business, Science and Arts occupations in Wolf Trap are Management (1,867 | 24.8%), Community & Social Service (1,377 | 18.3%), Computers, Engineering & Science (1,299 | 17.2%), Business & Financial (942 | 12.5%), and Computers & Mathematics (607 | 8.1%).
Management, Business, Science and Arts Occupations by Sex
Within the Management, Business, Science and Arts occupations in Wolf Trap, the most male-oriented occupations are Architecture & Engineering (79.7%), Legal Services & Support (75.1%), and Computers, Engineering & Science (64.0%), while the most female-oriented occupations are Education Instruction & Library (78.7%), Education, Arts & Media (71.2%), and Arts, Media & Entertainment (55.6%).
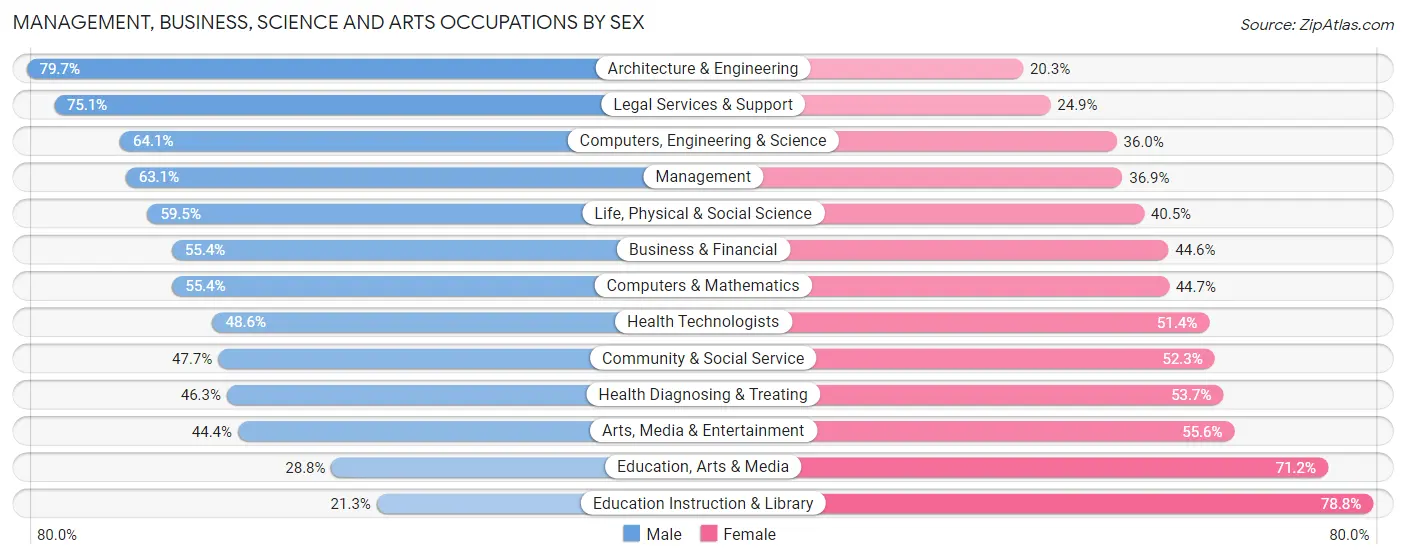
| Occupation | Male | Female |
| Management | 1,178 (63.1%) | 689 (36.9%) |
| Business & Financial | 522 (55.4%) | 420 (44.6%) |
| Computers, Engineering & Science | 832 (64.0%) | 467 (35.9%) |
| Computers & Mathematics | 336 (55.3%) | 271 (44.7%) |
| Architecture & Engineering | 333 (79.7%) | 85 (20.3%) |
| Life, Physical & Social Science | 163 (59.5%) | 111 (40.5%) |
| Community & Social Service | 657 (47.7%) | 720 (52.3%) |
| Education, Arts & Media | 34 (28.8%) | 84 (71.2%) |
| Legal Services & Support | 383 (75.1%) | 127 (24.9%) |
| Education Instruction & Library | 85 (21.2%) | 315 (78.7%) |
| Arts, Media & Entertainment | 155 (44.4%) | 194 (55.6%) |
| Health Diagnosing & Treating | 204 (46.3%) | 237 (53.7%) |
| Health Technologists | 193 (48.6%) | 204 (51.4%) |
| Total (Category) | 3,393 (57.3%) | 2,533 (42.7%) |
| Total (Overall) | 4,152 (55.1%) | 3,377 (44.9%) |
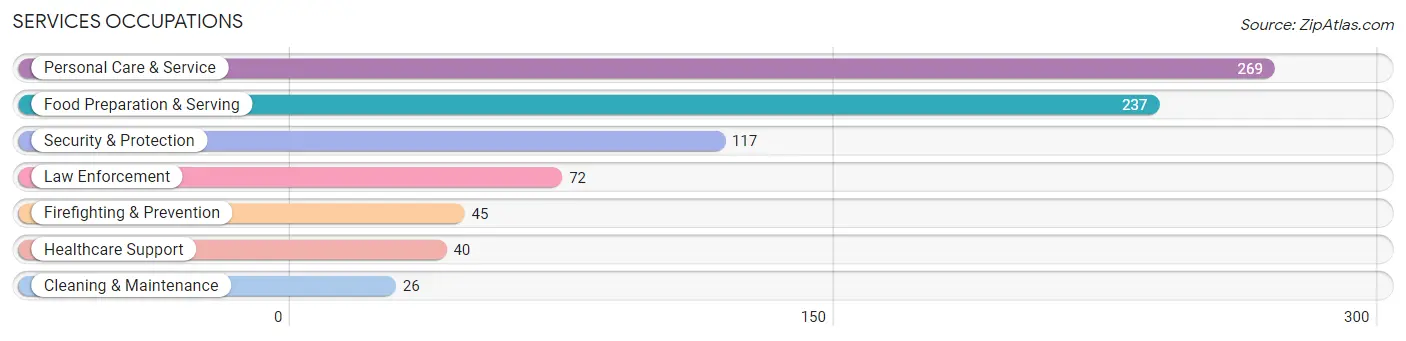
Services Occupations
The most common Services occupations in Wolf Trap are Personal Care & Service (269 | 3.6%), Food Preparation & Serving (237 | 3.2%), Security & Protection (117 | 1.5%), Law Enforcement (72 | 1.0%), and Firefighting & Prevention (45 | 0.6%).
Services Occupations by Sex
Within the Services occupations in Wolf Trap, the most male-oriented occupations are Law Enforcement (94.4%), Security & Protection (82.9%), and Firefighting & Prevention (64.4%), while the most female-oriented occupations are Personal Care & Service (94.4%), Cleaning & Maintenance (65.4%), and Healthcare Support (55.0%).
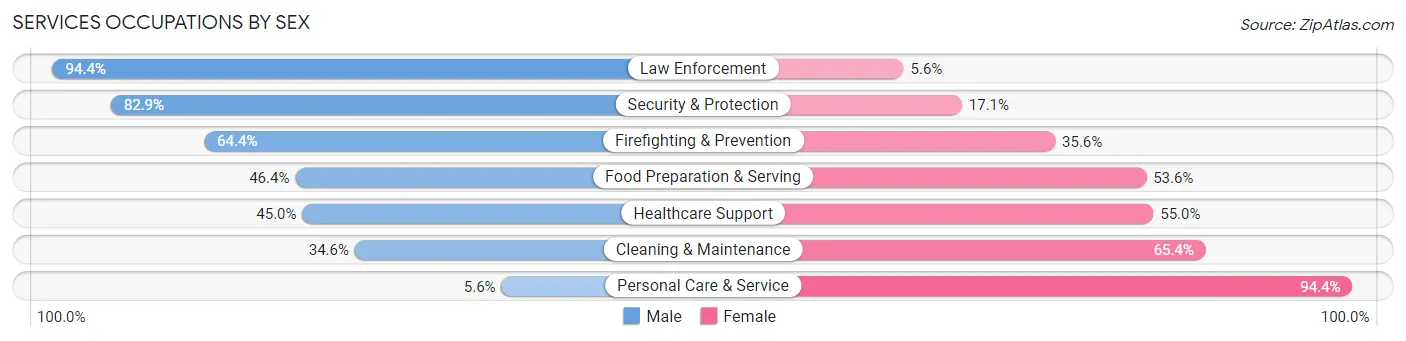
| Occupation | Male | Female |
| Healthcare Support | 18 (45.0%) | 22 (55.0%) |
| Security & Protection | 97 (82.9%) | 20 (17.1%) |
| Firefighting & Prevention | 29 (64.4%) | 16 (35.6%) |
| Law Enforcement | 68 (94.4%) | 4 (5.6%) |
| Food Preparation & Serving | 110 (46.4%) | 127 (53.6%) |
| Cleaning & Maintenance | 9 (34.6%) | 17 (65.4%) |
| Personal Care & Service | 15 (5.6%) | 254 (94.4%) |
| Total (Category) | 249 (36.1%) | 440 (63.9%) |
| Total (Overall) | 4,152 (55.1%) | 3,377 (44.9%) |
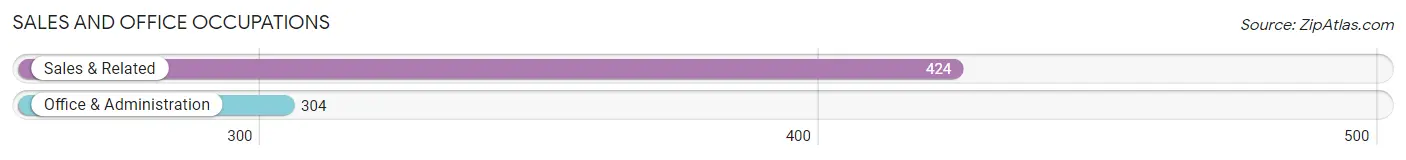
Sales and Office Occupations
The most common Sales and Office occupations in Wolf Trap are Sales & Related (424 | 5.6%), and Office & Administration (304 | 4.0%).
Sales and Office Occupations by Sex
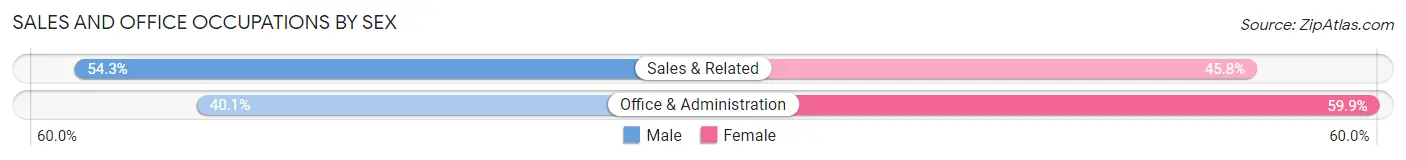
| Occupation | Male | Female |
| Sales & Related | 230 (54.2%) | 194 (45.8%) |
| Office & Administration | 122 (40.1%) | 182 (59.9%) |
| Total (Category) | 352 (48.3%) | 376 (51.6%) |
| Total (Overall) | 4,152 (55.1%) | 3,377 (44.9%) |
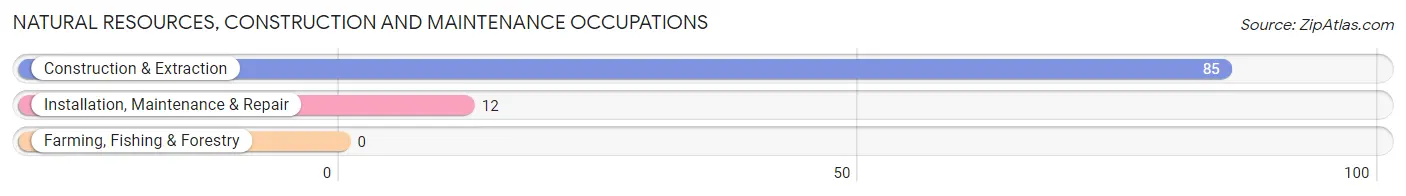
Natural Resources, Construction and Maintenance Occupations
The most common Natural Resources, Construction and Maintenance occupations in Wolf Trap are Construction & Extraction (85 | 1.1%), and Installation, Maintenance & Repair (12 | 0.2%).
Natural Resources, Construction and Maintenance Occupations by Sex
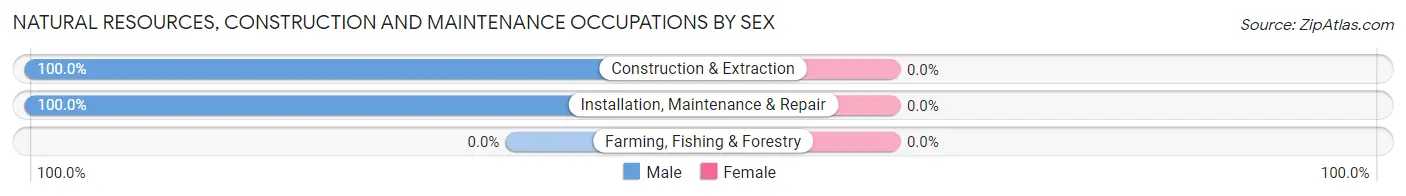
| Occupation | Male | Female |
| Farming, Fishing & Forestry | 0 (0.0%) | 0 (0.0%) |
| Construction & Extraction | 85 (100.0%) | 0 (0.0%) |
| Installation, Maintenance & Repair | 12 (100.0%) | 0 (0.0%) |
| Total (Category) | 97 (100.0%) | 0 (0.0%) |
| Total (Overall) | 4,152 (55.1%) | 3,377 (44.9%) |
Production, Transportation and Moving Occupations
The most common Production, Transportation and Moving occupations in Wolf Trap are Production (56 | 0.7%), Transportation (27 | 0.4%), and Material Moving (6 | 0.1%).
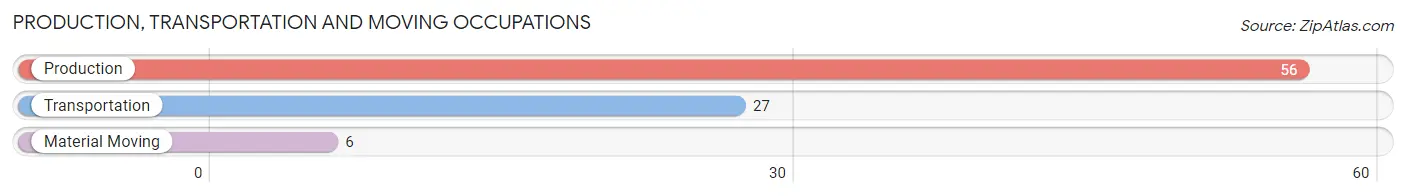
Production, Transportation and Moving Occupations by Sex
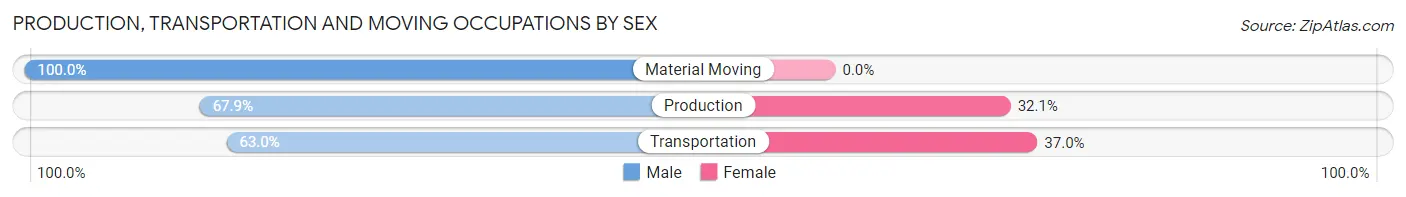
| Occupation | Male | Female |
| Production | 38 (67.9%) | 18 (32.1%) |
| Transportation | 17 (63.0%) | 10 (37.0%) |
| Material Moving | 6 (100.0%) | 0 (0.0%) |
| Total (Category) | 61 (68.5%) | 28 (31.5%) |
| Total (Overall) | 4,152 (55.1%) | 3,377 (44.9%) |
Employment Industries by Sex in Wolf Trap
Employment Industries in Wolf Trap
The major employment industries in Wolf Trap include Professional & Scientific (2,232 | 29.6%), Public Administration (1,064 | 14.1%), Health Care & Social Assistance (650 | 8.6%), Educational Services (566 | 7.5%), and Finance & Insurance (547 | 7.3%).
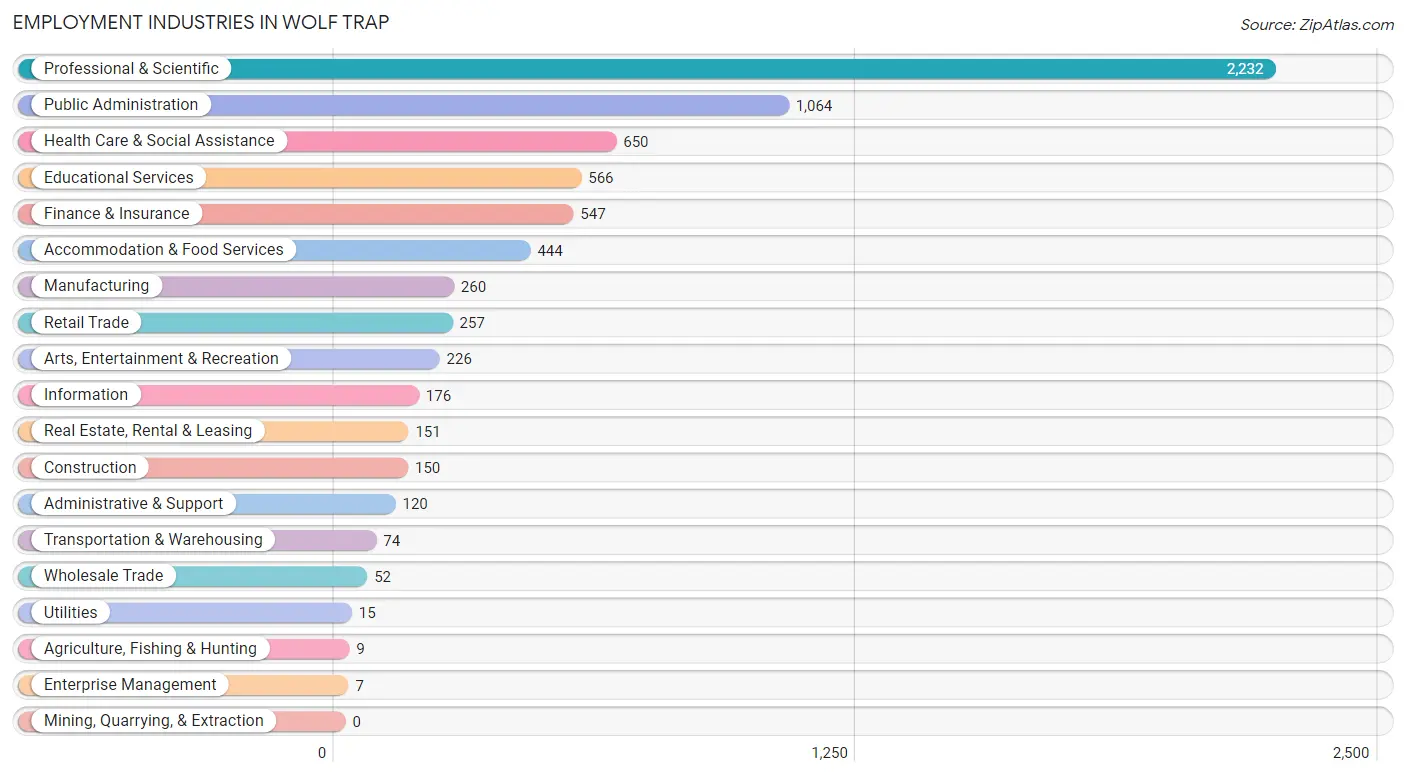
Employment Industries by Sex in Wolf Trap
The Wolf Trap industries that see more men than women are Utilities (100.0%), Enterprise Management (100.0%), and Construction (88.7%), whereas the industries that tend to have a higher number of women are Agriculture, Fishing & Hunting (100.0%), Educational Services (74.9%), and Arts, Entertainment & Recreation (66.4%).
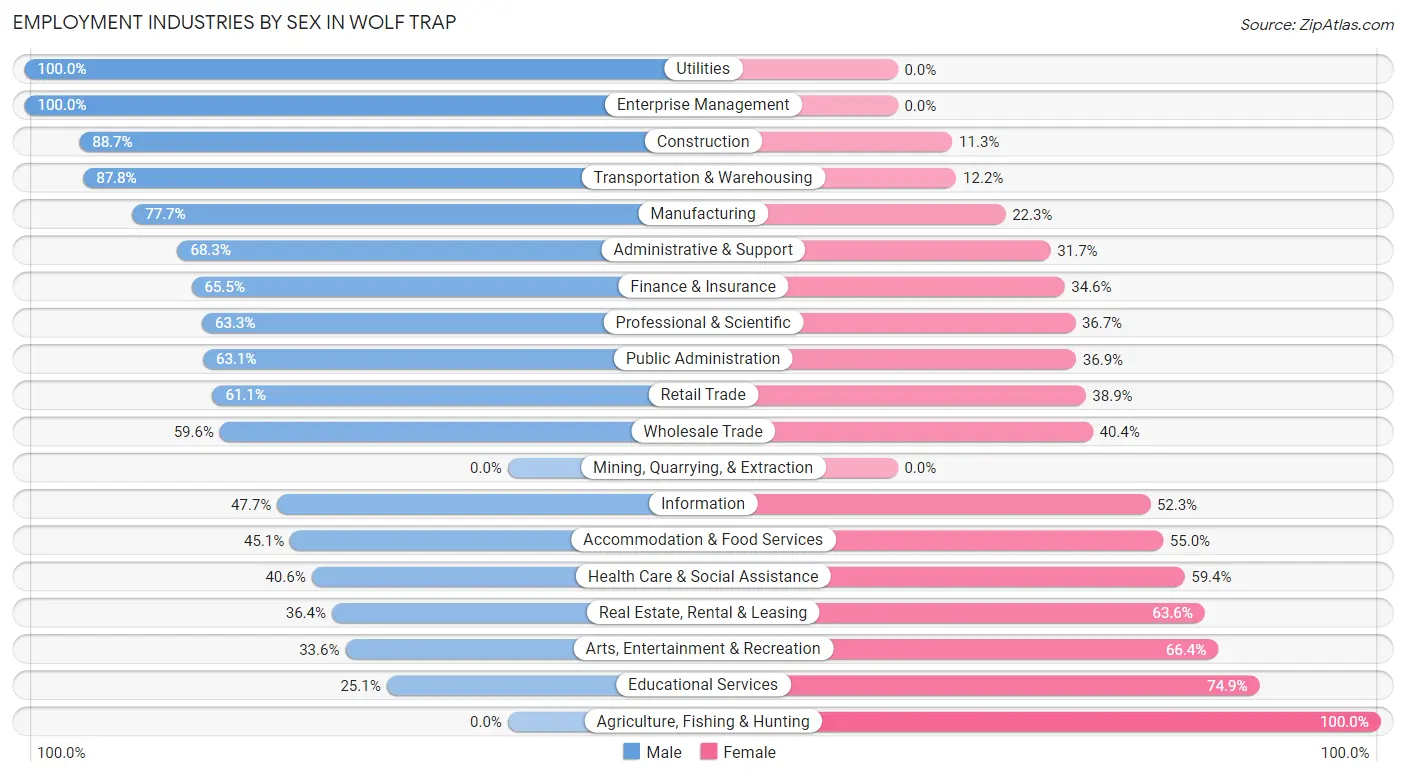
| Industry | Male | Female |
| Agriculture, Fishing & Hunting | 0 (0.0%) | 9 (100.0%) |
| Mining, Quarrying, & Extraction | 0 (0.0%) | 0 (0.0%) |
| Construction | 133 (88.7%) | 17 (11.3%) |
| Manufacturing | 202 (77.7%) | 58 (22.3%) |
| Wholesale Trade | 31 (59.6%) | 21 (40.4%) |
| Retail Trade | 157 (61.1%) | 100 (38.9%) |
| Transportation & Warehousing | 65 (87.8%) | 9 (12.2%) |
| Utilities | 15 (100.0%) | 0 (0.0%) |
| Information | 84 (47.7%) | 92 (52.3%) |
| Finance & Insurance | 358 (65.4%) | 189 (34.5%) |
| Real Estate, Rental & Leasing | 55 (36.4%) | 96 (63.6%) |
| Professional & Scientific | 1,412 (63.3%) | 820 (36.7%) |
| Enterprise Management | 7 (100.0%) | 0 (0.0%) |
| Administrative & Support | 82 (68.3%) | 38 (31.7%) |
| Educational Services | 142 (25.1%) | 424 (74.9%) |
| Health Care & Social Assistance | 264 (40.6%) | 386 (59.4%) |
| Arts, Entertainment & Recreation | 76 (33.6%) | 150 (66.4%) |
| Accommodation & Food Services | 200 (45.1%) | 244 (54.9%) |
| Public Administration | 671 (63.1%) | 393 (36.9%) |
| Total | 4,152 (55.1%) | 3,377 (44.9%) |
Education in Wolf Trap
School Enrollment in Wolf Trap
The most common levels of schooling among the 4,367 students in Wolf Trap are middle school (1,086 | 24.9%), elementary school (1,008 | 23.1%), and high school (986 | 22.6%).
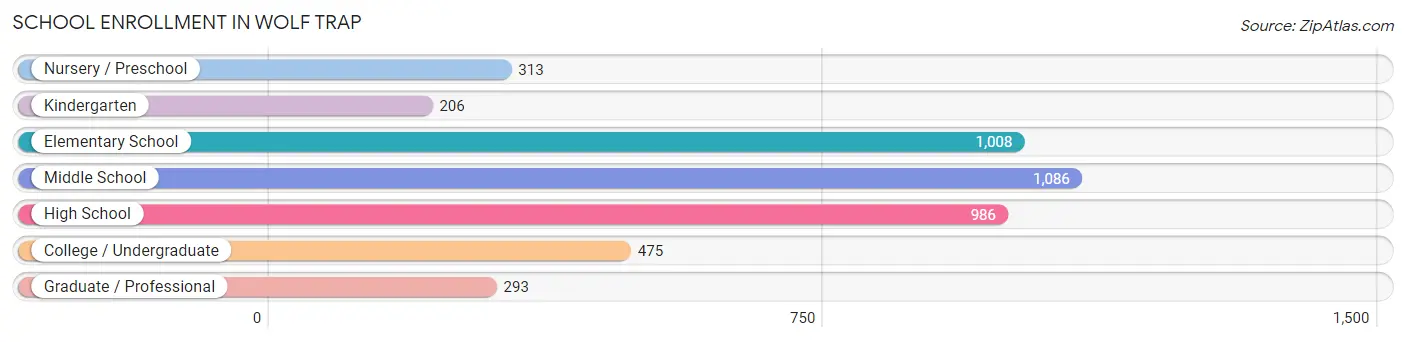
| School Level | # Students | % Students |
| Nursery / Preschool | 313 | 7.2% |
| Kindergarten | 206 | 4.7% |
| Elementary School | 1,008 | 23.1% |
| Middle School | 1,086 | 24.9% |
| High School | 986 | 22.6% |
| College / Undergraduate | 475 | 10.9% |
| Graduate / Professional | 293 | 6.7% |
| Total | 4,367 | 100.0% |
School Enrollment by Age by Funding Source in Wolf Trap
Out of a total of 4,367 students who are enrolled in schools in Wolf Trap, 1,319 (30.2%) attend a private institution, while the remaining 3,048 (69.8%) are enrolled in public schools. The age group of 35 years and over has the highest likelihood of being enrolled in private schools, with 173 (76.9% in the age bracket) enrolled. Conversely, the age group of 10 to 14 year olds has the lowest likelihood of being enrolled in a private school, with 1,017 (82.3% in the age bracket) attending a public institution.
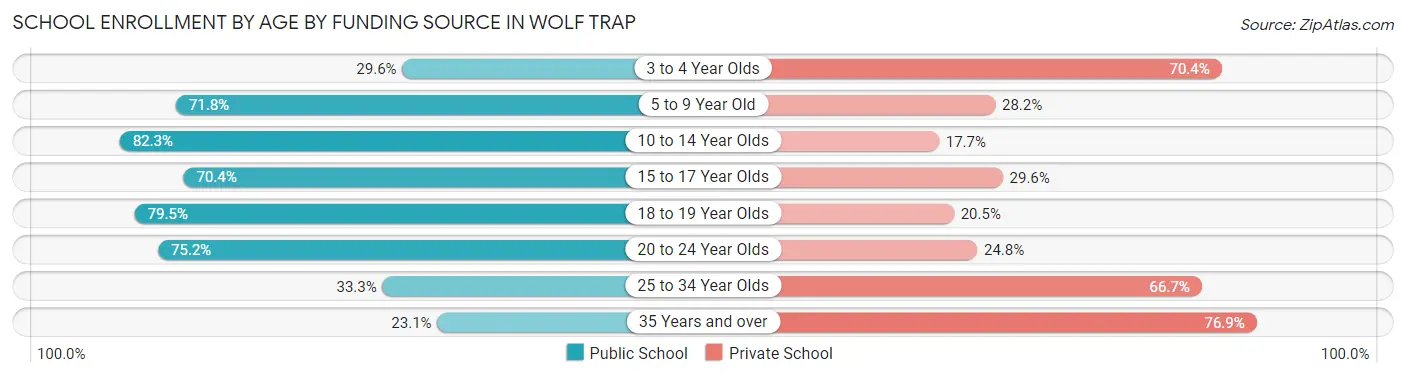
| Age Bracket | Public School | Private School |
| 3 to 4 Year Olds | 72 (29.6%) | 171 (70.4%) |
| 5 to 9 Year Old | 861 (71.8%) | 338 (28.2%) |
| 10 to 14 Year Olds | 1,017 (82.3%) | 219 (17.7%) |
| 15 to 17 Year Olds | 528 (70.4%) | 222 (29.6%) |
| 18 to 19 Year Olds | 252 (79.5%) | 65 (20.5%) |
| 20 to 24 Year Olds | 242 (75.2%) | 80 (24.8%) |
| 25 to 34 Year Olds | 25 (33.3%) | 50 (66.7%) |
| 35 Years and over | 52 (23.1%) | 173 (76.9%) |
| Total | 3,048 (69.8%) | 1,319 (30.2%) |
Educational Attainment by Field of Study in Wolf Trap
Business (1,796 | 18.0%), social sciences (1,621 | 16.2%), engineering (1,427 | 14.3%), computers & mathematics (922 | 9.2%), and literature & languages (649 | 6.5%) are the most common fields of study among 10,002 individuals in Wolf Trap who have obtained a bachelor's degree or higher.
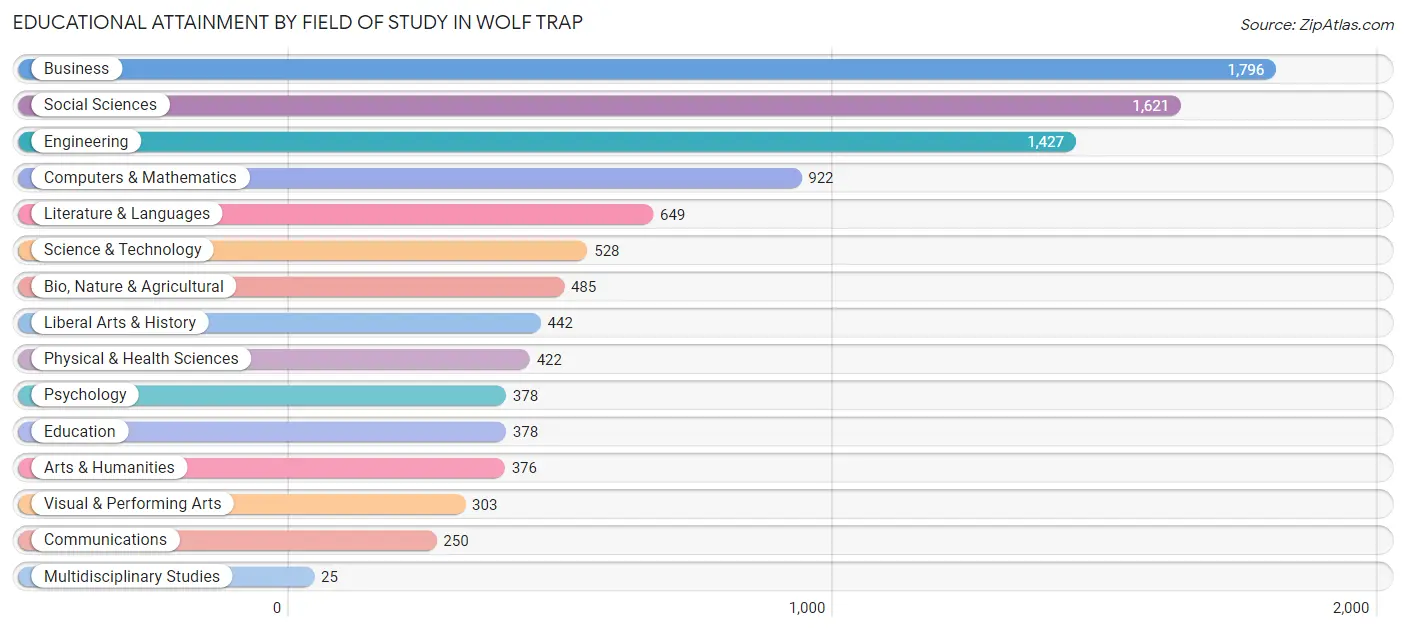
| Field of Study | # Graduates | % Graduates |
| Computers & Mathematics | 922 | 9.2% |
| Bio, Nature & Agricultural | 485 | 4.9% |
| Physical & Health Sciences | 422 | 4.2% |
| Psychology | 378 | 3.8% |
| Social Sciences | 1,621 | 16.2% |
| Engineering | 1,427 | 14.3% |
| Multidisciplinary Studies | 25 | 0.3% |
| Science & Technology | 528 | 5.3% |
| Business | 1,796 | 18.0% |
| Education | 378 | 3.8% |
| Literature & Languages | 649 | 6.5% |
| Liberal Arts & History | 442 | 4.4% |
| Visual & Performing Arts | 303 | 3.0% |
| Communications | 250 | 2.5% |
| Arts & Humanities | 376 | 3.8% |
| Total | 10,002 | 100.0% |
Transportation & Commute in Wolf Trap
Vehicle Availability by Sex in Wolf Trap
The most prevalent vehicle ownership categories in Wolf Trap are males with 2 vehicles (2,208, accounting for 53.8%) and females with 2 vehicles (1,632, making up 66.5%).
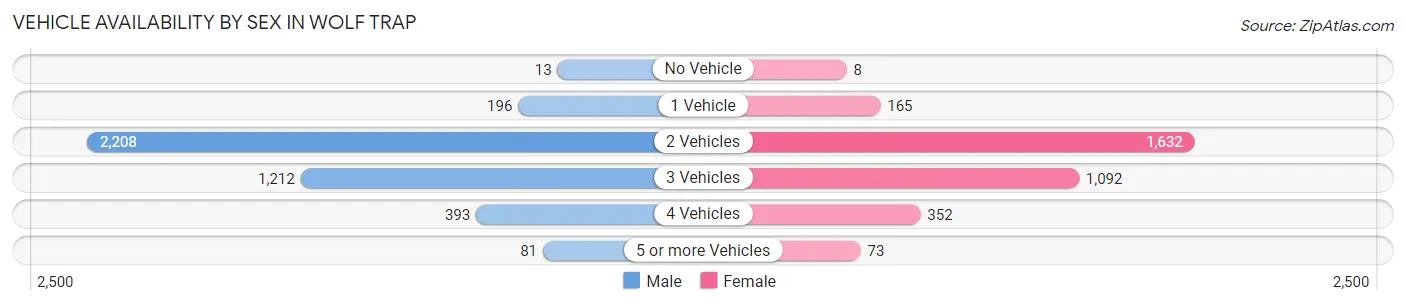
| Vehicles Available | Male | Female |
| No Vehicle | 13 (0.3%) | 8 (0.2%) |
| 1 Vehicle | 196 (4.8%) | 165 (5.0%) |
| 2 Vehicles | 2,208 (53.8%) | 1,632 (49.1%) |
| 3 Vehicles | 1,212 (29.5%) | 1,092 (32.9%) |
| 4 Vehicles | 393 (9.6%) | 352 (10.6%) |
| 5 or more Vehicles | 81 (2.0%) | 73 (2.2%) |
| Total | 4,103 (100.0%) | 3,322 (100.0%) |
Commute Time in Wolf Trap
The most frequently occuring commute durations in Wolf Trap are 15 to 19 minutes (689 commuters, 14.6%), 30 to 34 minutes (660 commuters, 14.0%), and 20 to 24 minutes (654 commuters, 13.9%).
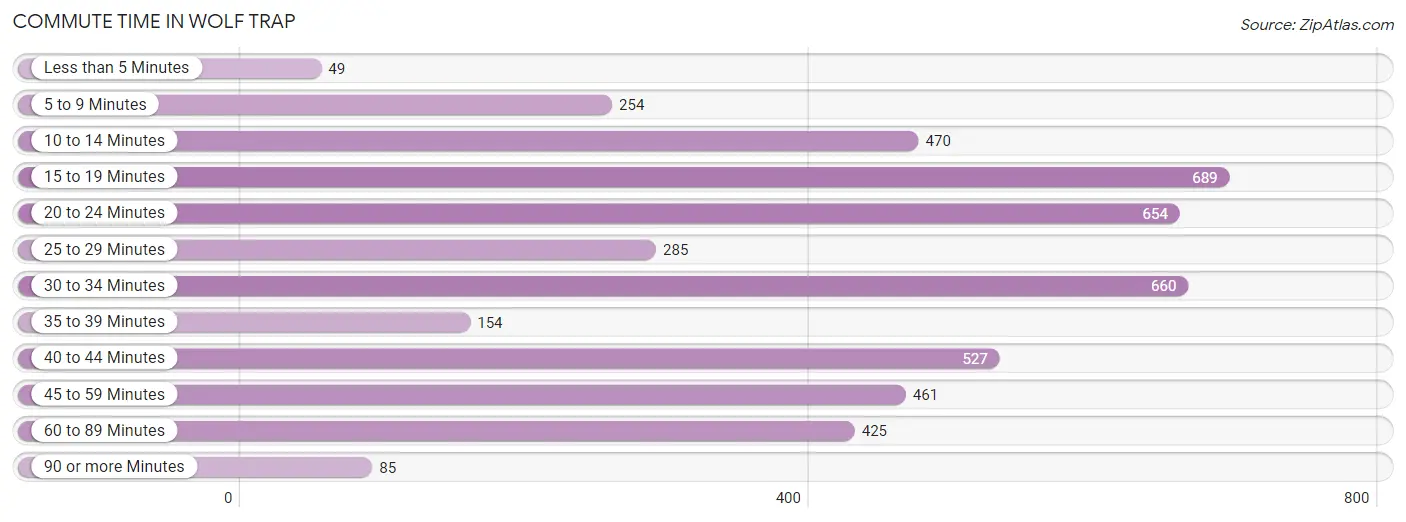
| Commute Time | # Commuters | % Commuters |
| Less than 5 Minutes | 49 | 1.0% |
| 5 to 9 Minutes | 254 | 5.4% |
| 10 to 14 Minutes | 470 | 10.0% |
| 15 to 19 Minutes | 689 | 14.6% |
| 20 to 24 Minutes | 654 | 13.9% |
| 25 to 29 Minutes | 285 | 6.0% |
| 30 to 34 Minutes | 660 | 14.0% |
| 35 to 39 Minutes | 154 | 3.3% |
| 40 to 44 Minutes | 527 | 11.2% |
| 45 to 59 Minutes | 461 | 9.8% |
| 60 to 89 Minutes | 425 | 9.0% |
| 90 or more Minutes | 85 | 1.8% |
Commute Time by Sex in Wolf Trap
The most common commute times in Wolf Trap are 30 to 34 minutes (337 commuters, 12.8%) for males and 15 to 19 minutes (403 commuters, 19.4%) for females.
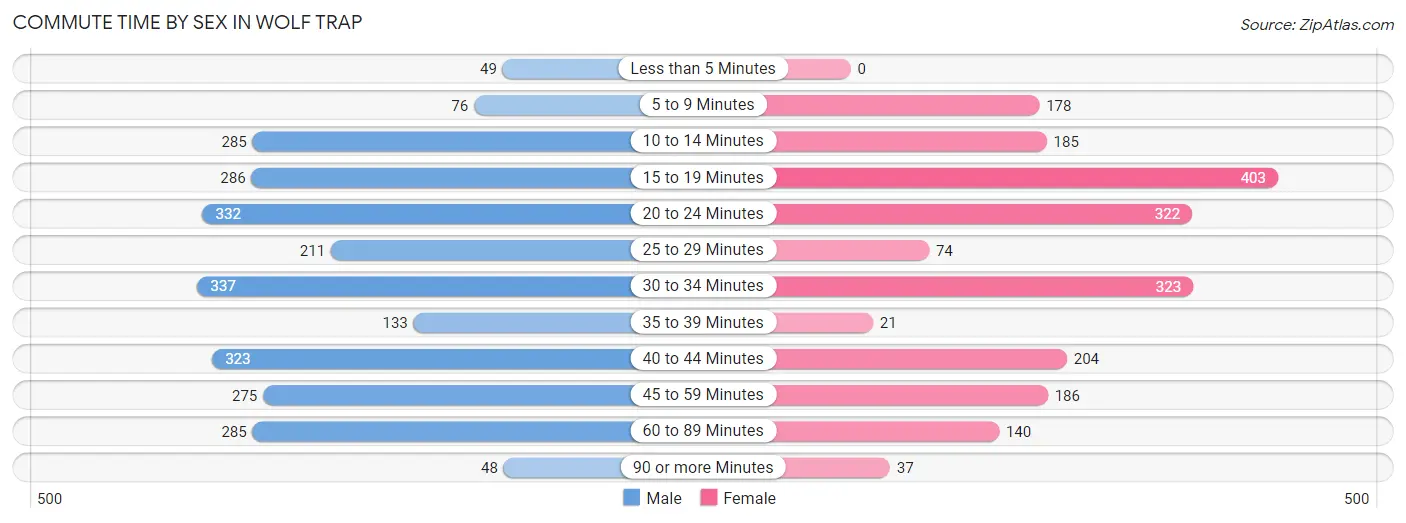
| Commute Time | Male | Female |
| Less than 5 Minutes | 49 (1.9%) | 0 (0.0%) |
| 5 to 9 Minutes | 76 (2.9%) | 178 (8.6%) |
| 10 to 14 Minutes | 285 (10.8%) | 185 (8.9%) |
| 15 to 19 Minutes | 286 (10.8%) | 403 (19.4%) |
| 20 to 24 Minutes | 332 (12.6%) | 322 (15.5%) |
| 25 to 29 Minutes | 211 (8.0%) | 74 (3.6%) |
| 30 to 34 Minutes | 337 (12.8%) | 323 (15.6%) |
| 35 to 39 Minutes | 133 (5.0%) | 21 (1.0%) |
| 40 to 44 Minutes | 323 (12.2%) | 204 (9.8%) |
| 45 to 59 Minutes | 275 (10.4%) | 186 (9.0%) |
| 60 to 89 Minutes | 285 (10.8%) | 140 (6.8%) |
| 90 or more Minutes | 48 (1.8%) | 37 (1.8%) |
Time of Departure to Work by Sex in Wolf Trap
The most frequent times of departure to work in Wolf Trap are 8:00 AM to 8:29 AM (464, 17.6%) for males and 9:00 AM to 9:59 AM (353, 17.0%) for females.
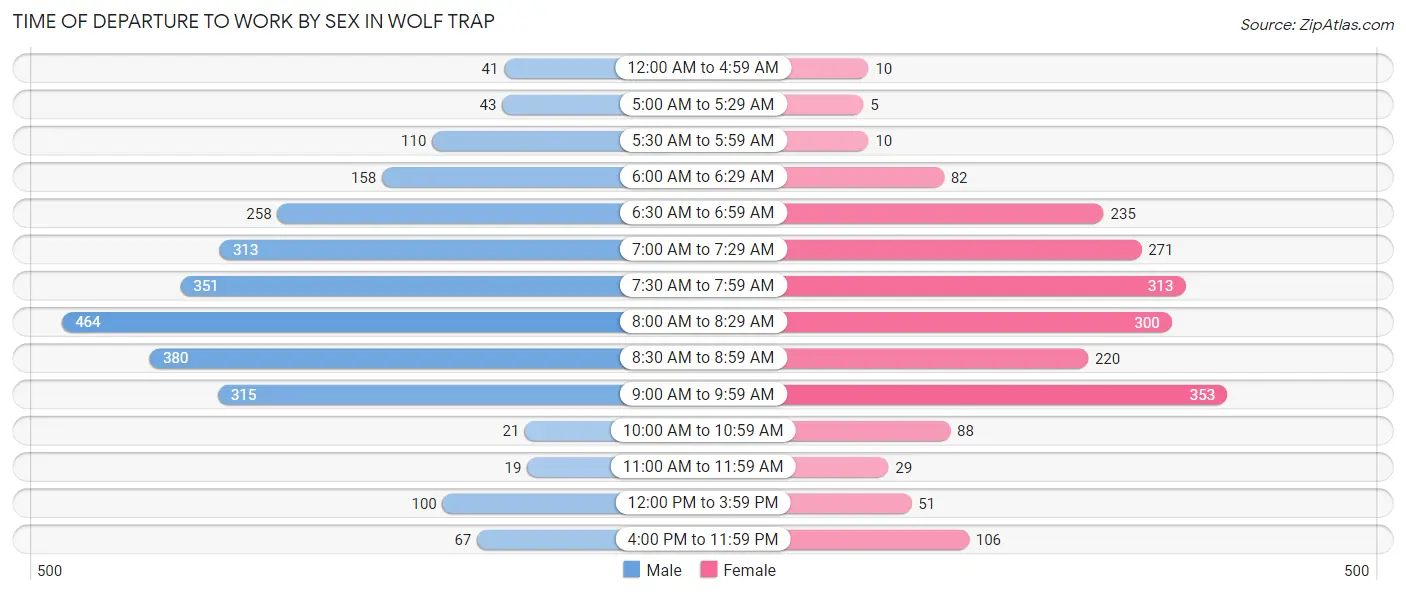
| Time of Departure | Male | Female |
| 12:00 AM to 4:59 AM | 41 (1.5%) | 10 (0.5%) |
| 5:00 AM to 5:29 AM | 43 (1.6%) | 5 (0.2%) |
| 5:30 AM to 5:59 AM | 110 (4.2%) | 10 (0.5%) |
| 6:00 AM to 6:29 AM | 158 (6.0%) | 82 (4.0%) |
| 6:30 AM to 6:59 AM | 258 (9.8%) | 235 (11.3%) |
| 7:00 AM to 7:29 AM | 313 (11.9%) | 271 (13.1%) |
| 7:30 AM to 7:59 AM | 351 (13.3%) | 313 (15.1%) |
| 8:00 AM to 8:29 AM | 464 (17.6%) | 300 (14.5%) |
| 8:30 AM to 8:59 AM | 380 (14.4%) | 220 (10.6%) |
| 9:00 AM to 9:59 AM | 315 (11.9%) | 353 (17.0%) |
| 10:00 AM to 10:59 AM | 21 (0.8%) | 88 (4.3%) |
| 11:00 AM to 11:59 AM | 19 (0.7%) | 29 (1.4%) |
| 12:00 PM to 3:59 PM | 100 (3.8%) | 51 (2.5%) |
| 4:00 PM to 11:59 PM | 67 (2.5%) | 106 (5.1%) |
| Total | 2,640 (100.0%) | 2,073 (100.0%) |
Housing Occupancy in Wolf Trap
Occupancy by Ownership in Wolf Trap
Of the total 5,417 dwellings in Wolf Trap, owner-occupied units account for 5,159 (95.2%), while renter-occupied units make up 258 (4.8%).
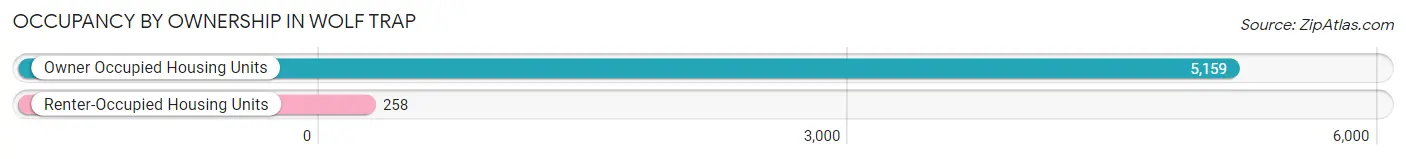
| Occupancy | # Housing Units | % Housing Units |
| Owner Occupied Housing Units | 5,159 | 95.2% |
| Renter-Occupied Housing Units | 258 | 4.8% |
| Total Occupied Housing Units | 5,417 | 100.0% |
Occupancy by Household Size in Wolf Trap
| Household Size | # Housing Units | % Housing Units |
| 1-Person Household | 801 | 14.8% |
| 2-Person Household | 1,929 | 35.6% |
| 3-Person Household | 1,077 | 19.9% |
| 4+ Person Household | 1,610 | 29.7% |
| Total Housing Units | 5,417 | 100.0% |
Occupancy by Ownership by Household Size in Wolf Trap
| Household Size | Owner-occupied | Renter-occupied |
| 1-Person Household | 771 (96.3%) | 30 (3.7%) |
| 2-Person Household | 1,886 (97.8%) | 43 (2.2%) |
| 3-Person Household | 1,030 (95.6%) | 47 (4.4%) |
| 4+ Person Household | 1,472 (91.4%) | 138 (8.6%) |
| Total Housing Units | 5,159 (95.2%) | 258 (4.8%) |
Occupancy by Educational Attainment in Wolf Trap
| Household Size | Owner-occupied | Renter-occupied |
| Less than High School | 51 (100.0%) | 0 (0.0%) |
| High School Diploma | 105 (100.0%) | 0 (0.0%) |
| College/Associate Degree | 380 (84.8%) | 68 (15.2%) |
| Bachelor's Degree or higher | 4,623 (96.1%) | 190 (4.0%) |
Occupancy by Age of Householder in Wolf Trap
| Age Bracket | # Households | % Households |
| Under 35 Years | 79 | 1.5% |
| 35 to 44 Years | 911 | 16.8% |
| 45 to 54 Years | 1,325 | 24.5% |
| 55 to 64 Years | 1,514 | 28.0% |
| 65 to 74 Years | 776 | 14.3% |
| 75 to 84 Years | 600 | 11.1% |
| 85 Years and Over | 212 | 3.9% |
| Total | 5,417 | 100.0% |
Housing Finances in Wolf Trap
Median Income by Occupancy in Wolf Trap
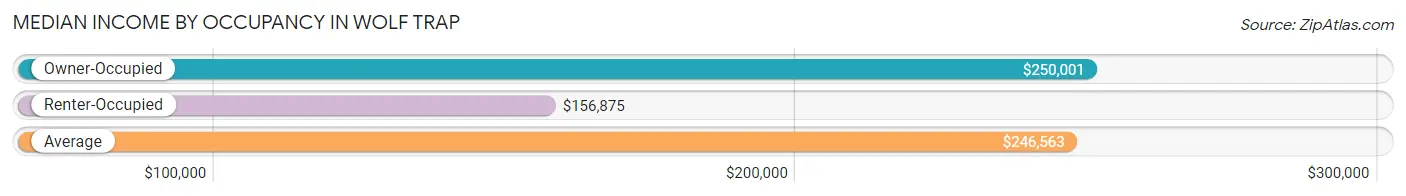
| Occupancy Type | # Households | Median Income |
| Owner-Occupied | 5,159 (95.2%) | $250,001 |
| Renter-Occupied | 258 (4.8%) | $156,875 |
| Average | 5,417 (100.0%) | $246,563 |
Occupancy by Householder Income Bracket in Wolf Trap
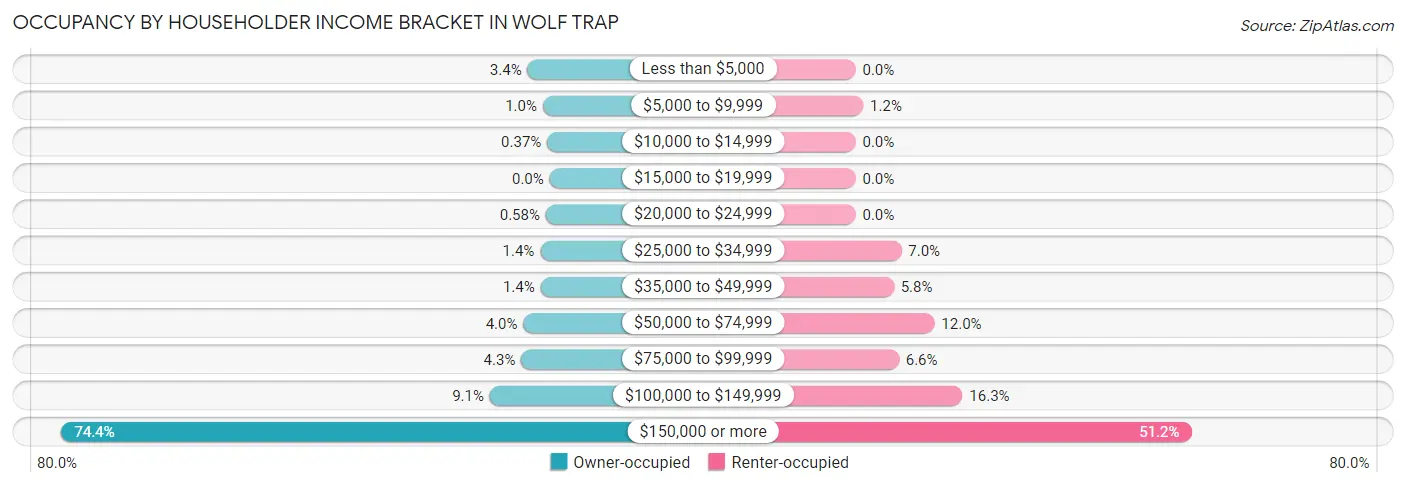
| Income Bracket | Owner-occupied | Renter-occupied |
| Less than $5,000 | 174 (3.4%) | 0 (0.0%) |
| $5,000 to $9,999 | 53 (1.0%) | 3 (1.2%) |
| $10,000 to $14,999 | 19 (0.4%) | 0 (0.0%) |
| $15,000 to $19,999 | 0 (0.0%) | 0 (0.0%) |
| $20,000 to $24,999 | 30 (0.6%) | 0 (0.0%) |
| $25,000 to $34,999 | 74 (1.4%) | 18 (7.0%) |
| $35,000 to $49,999 | 71 (1.4%) | 15 (5.8%) |
| $50,000 to $74,999 | 207 (4.0%) | 31 (12.0%) |
| $75,000 to $99,999 | 223 (4.3%) | 17 (6.6%) |
| $100,000 to $149,999 | 470 (9.1%) | 42 (16.3%) |
| $150,000 or more | 3,838 (74.4%) | 132 (51.2%) |
| Total | 5,159 (100.0%) | 258 (100.0%) |
Monthly Housing Cost Tiers in Wolf Trap
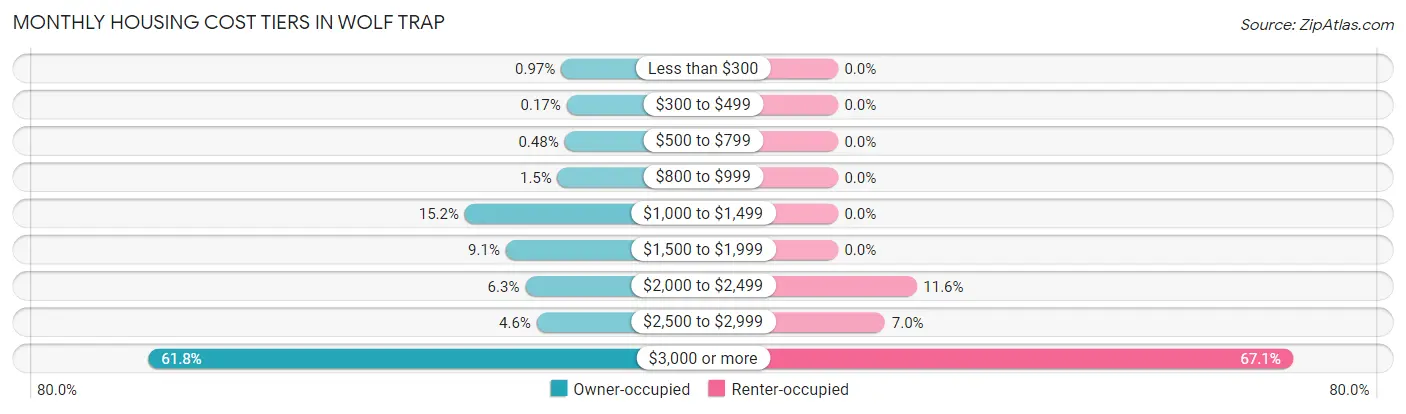
| Monthly Cost | Owner-occupied | Renter-occupied |
| Less than $300 | 50 (1.0%) | 0 (0.0%) |
| $300 to $499 | 9 (0.2%) | 0 (0.0%) |
| $500 to $799 | 25 (0.5%) | 0 (0.0%) |
| $800 to $999 | 77 (1.5%) | 0 (0.0%) |
| $1,000 to $1,499 | 782 (15.2%) | 0 (0.0%) |
| $1,500 to $1,999 | 471 (9.1%) | 0 (0.0%) |
| $2,000 to $2,499 | 323 (6.3%) | 30 (11.6%) |
| $2,500 to $2,999 | 236 (4.6%) | 18 (7.0%) |
| $3,000 or more | 3,186 (61.8%) | 173 (67.0%) |
| Total | 5,159 (100.0%) | 258 (100.0%) |
Physical Housing Characteristics in Wolf Trap
Housing Structures in Wolf Trap
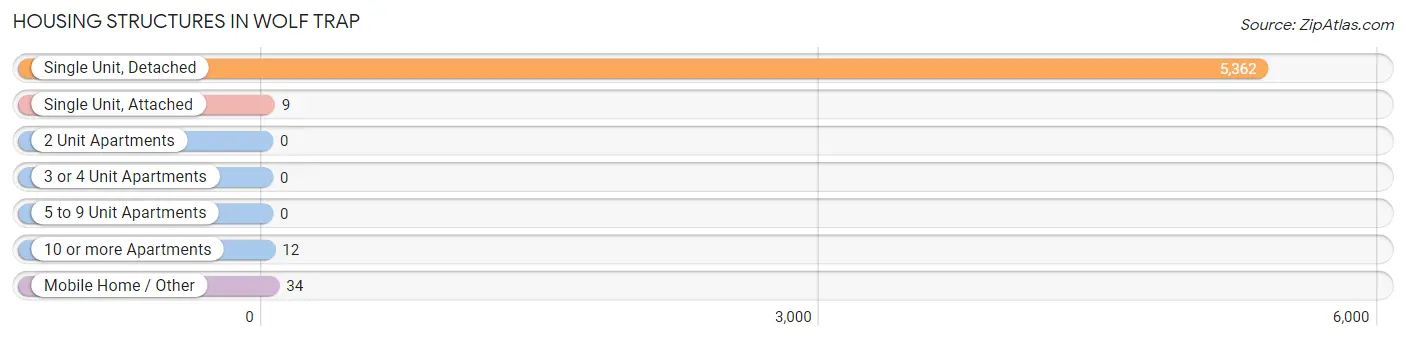
| Structure Type | # Housing Units | % Housing Units |
| Single Unit, Detached | 5,362 | 99.0% |
| Single Unit, Attached | 9 | 0.2% |
| 2 Unit Apartments | 0 | 0.0% |
| 3 or 4 Unit Apartments | 0 | 0.0% |
| 5 to 9 Unit Apartments | 0 | 0.0% |
| 10 or more Apartments | 12 | 0.2% |
| Mobile Home / Other | 34 | 0.6% |
| Total | 5,417 | 100.0% |
Housing Structures by Occupancy in Wolf Trap
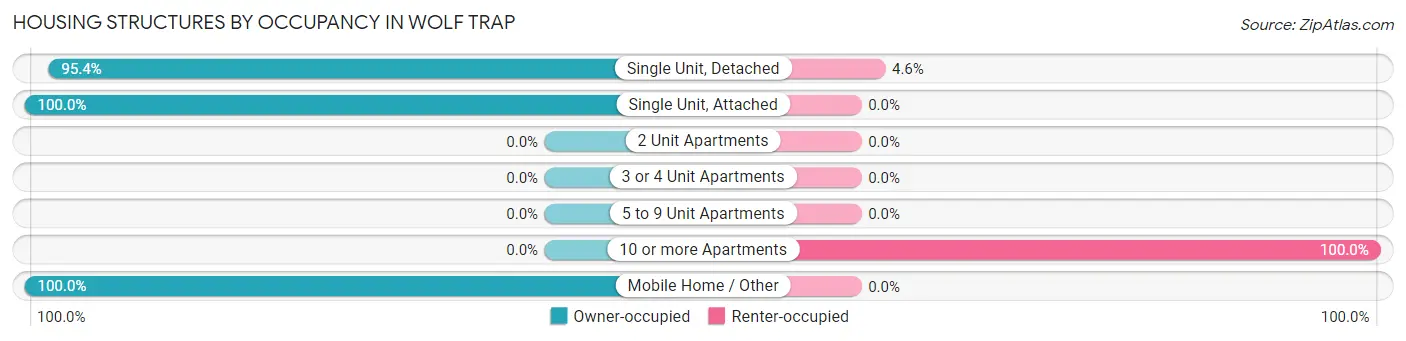
| Structure Type | Owner-occupied | Renter-occupied |
| Single Unit, Detached | 5,116 (95.4%) | 246 (4.6%) |
| Single Unit, Attached | 9 (100.0%) | 0 (0.0%) |
| 2 Unit Apartments | 0 (0.0%) | 0 (0.0%) |
| 3 or 4 Unit Apartments | 0 (0.0%) | 0 (0.0%) |
| 5 to 9 Unit Apartments | 0 (0.0%) | 0 (0.0%) |
| 10 or more Apartments | 0 (0.0%) | 12 (100.0%) |
| Mobile Home / Other | 34 (100.0%) | 0 (0.0%) |
| Total | 5,159 (95.2%) | 258 (4.8%) |
Housing Structures by Number of Rooms in Wolf Trap
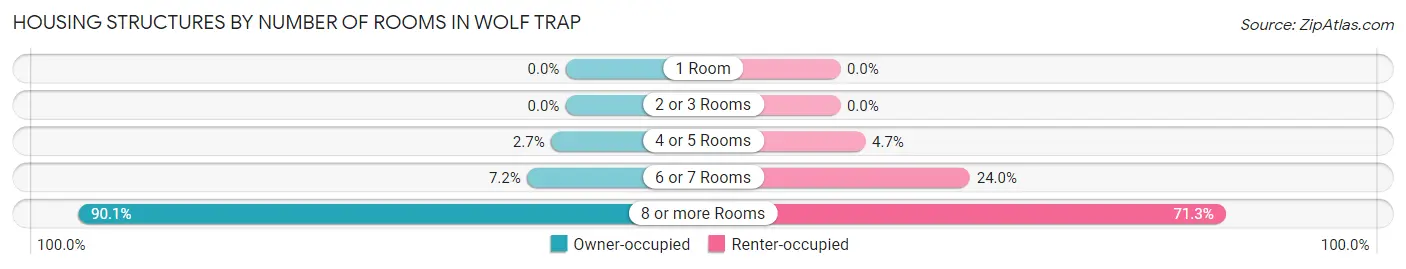
| Number of Rooms | Owner-occupied | Renter-occupied |
| 1 Room | 0 (0.0%) | 0 (0.0%) |
| 2 or 3 Rooms | 0 (0.0%) | 0 (0.0%) |
| 4 or 5 Rooms | 141 (2.7%) | 12 (4.6%) |
| 6 or 7 Rooms | 369 (7.1%) | 62 (24.0%) |
| 8 or more Rooms | 4,649 (90.1%) | 184 (71.3%) |
| Total | 5,159 (100.0%) | 258 (100.0%) |
Housing Structure by Heating Type in Wolf Trap
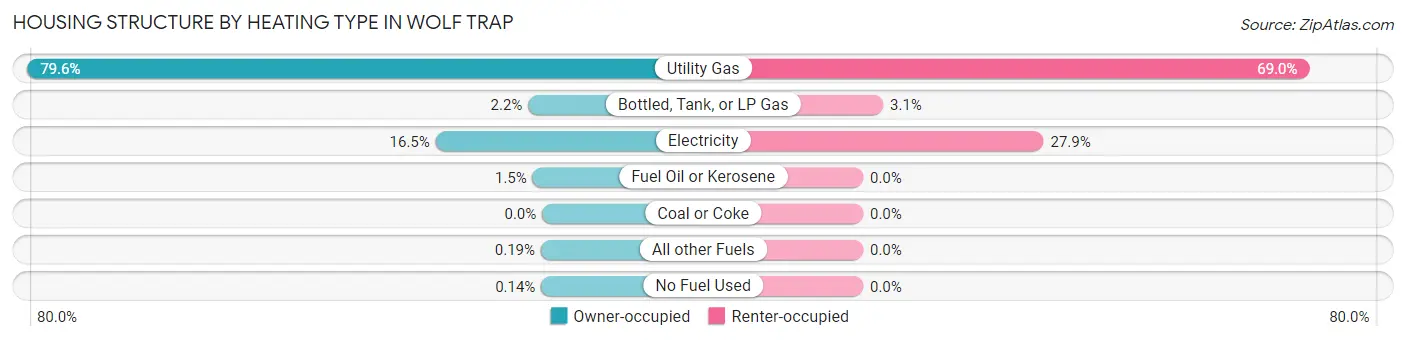
| Heating Type | Owner-occupied | Renter-occupied |
| Utility Gas | 4,106 (79.6%) | 178 (69.0%) |
| Bottled, Tank, or LP Gas | 111 (2.1%) | 8 (3.1%) |
| Electricity | 849 (16.5%) | 72 (27.9%) |
| Fuel Oil or Kerosene | 76 (1.5%) | 0 (0.0%) |
| Coal or Coke | 0 (0.0%) | 0 (0.0%) |
| All other Fuels | 10 (0.2%) | 0 (0.0%) |
| No Fuel Used | 7 (0.1%) | 0 (0.0%) |
| Total | 5,159 (100.0%) | 258 (100.0%) |
Household Vehicle Usage in Wolf Trap
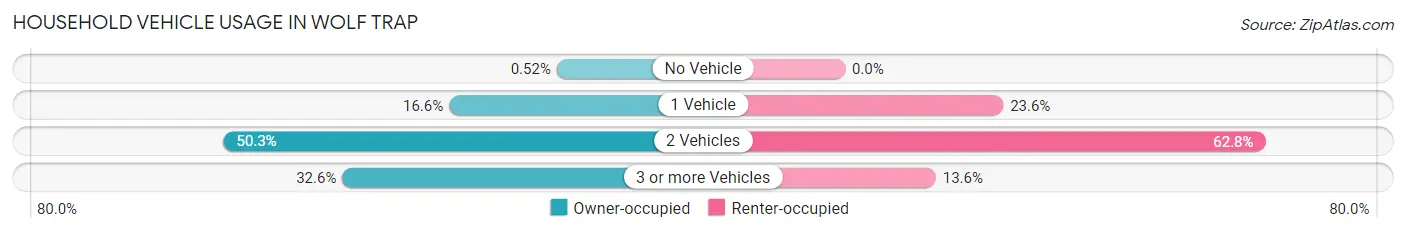
| Vehicles per Household | Owner-occupied | Renter-occupied |
| No Vehicle | 27 (0.5%) | 0 (0.0%) |
| 1 Vehicle | 857 (16.6%) | 61 (23.6%) |
| 2 Vehicles | 2,595 (50.3%) | 162 (62.8%) |
| 3 or more Vehicles | 1,680 (32.6%) | 35 (13.6%) |
| Total | 5,159 (100.0%) | 258 (100.0%) |
Real Estate & Mortgages in Wolf Trap
Real Estate and Mortgage Overview in Wolf Trap
| Characteristic | Without Mortgage | With Mortgage |
| Housing Units | 1,434 | 3,725 |
| Median Property Value | $1,031,800 | $1,126,200 |
| Median Household Income | $190,833 | $2,928 |
| Monthly Housing Costs | $1,365 | $3,165 |
| Real Estate Taxes | $10,001 | $37 |
Property Value by Mortgage Status in Wolf Trap
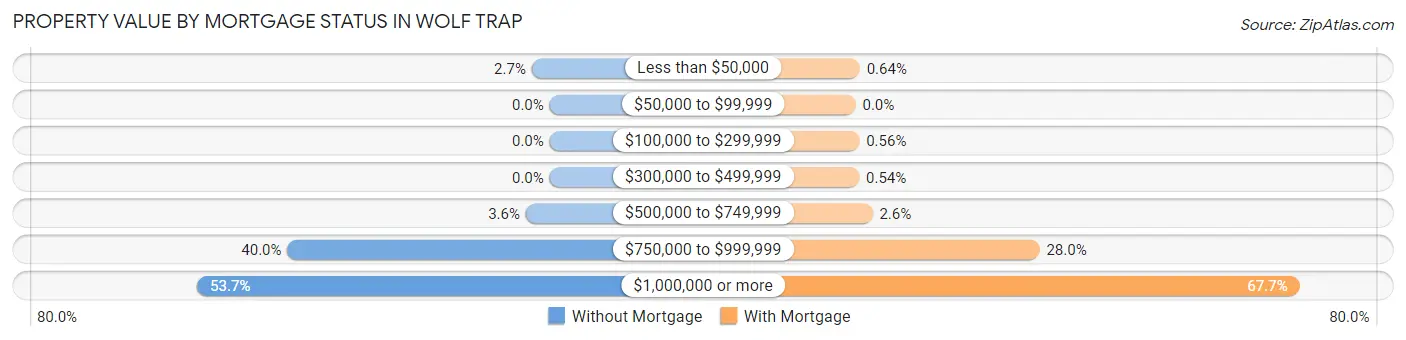
| Property Value | Without Mortgage | With Mortgage |
| Less than $50,000 | 39 (2.7%) | 24 (0.6%) |
| $50,000 to $99,999 | 0 (0.0%) | 0 (0.0%) |
| $100,000 to $299,999 | 0 (0.0%) | 21 (0.6%) |
| $300,000 to $499,999 | 0 (0.0%) | 20 (0.5%) |
| $500,000 to $749,999 | 52 (3.6%) | 96 (2.6%) |
| $750,000 to $999,999 | 573 (40.0%) | 1,044 (28.0%) |
| $1,000,000 or more | 770 (53.7%) | 2,520 (67.6%) |
| Total | 1,434 (100.0%) | 3,725 (100.0%) |
Household Income by Mortgage Status in Wolf Trap
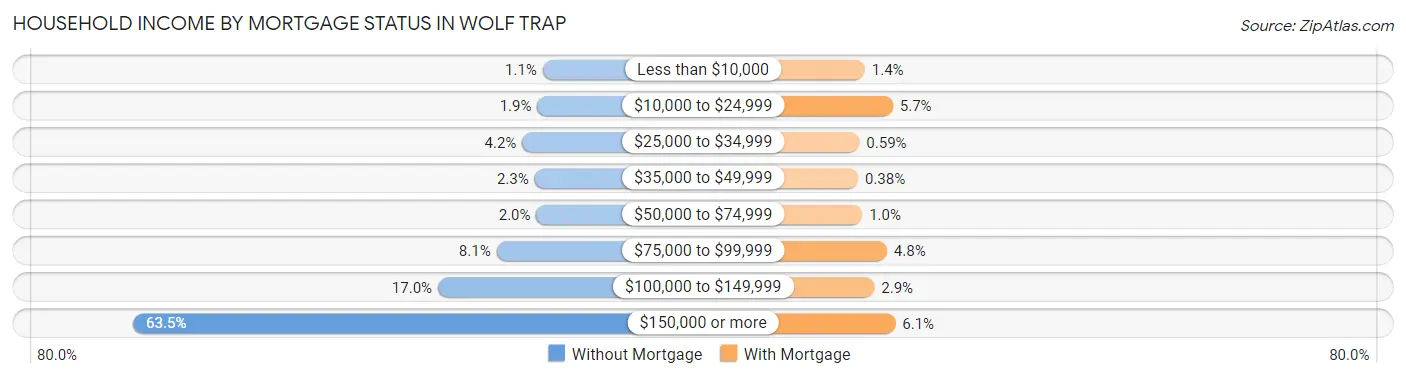
| Household Income | Without Mortgage | With Mortgage |
| Less than $10,000 | 15 (1.1%) | 53 (1.4%) |
| $10,000 to $24,999 | 27 (1.9%) | 212 (5.7%) |
| $25,000 to $34,999 | 60 (4.2%) | 22 (0.6%) |
| $35,000 to $49,999 | 33 (2.3%) | 14 (0.4%) |
| $50,000 to $74,999 | 29 (2.0%) | 38 (1.0%) |
| $75,000 to $99,999 | 116 (8.1%) | 178 (4.8%) |
| $100,000 to $149,999 | 244 (17.0%) | 107 (2.9%) |
| $150,000 or more | 910 (63.5%) | 226 (6.1%) |
| Total | 1,434 (100.0%) | 3,725 (100.0%) |
Property Value to Household Income Ratio in Wolf Trap
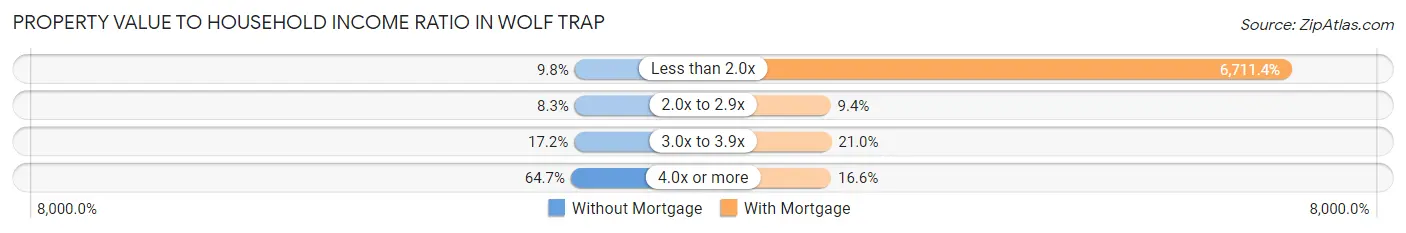
| Value-to-Income Ratio | Without Mortgage | With Mortgage |
| Less than 2.0x | 140 (9.8%) | 250,001 (6,711.4%) |
| 2.0x to 2.9x | 119 (8.3%) | 350 (9.4%) |
| 3.0x to 3.9x | 247 (17.2%) | 782 (21.0%) |
| 4.0x or more | 928 (64.7%) | 620 (16.6%) |
| Total | 1,434 (100.0%) | 3,725 (100.0%) |
Real Estate Taxes by Mortgage Status in Wolf Trap
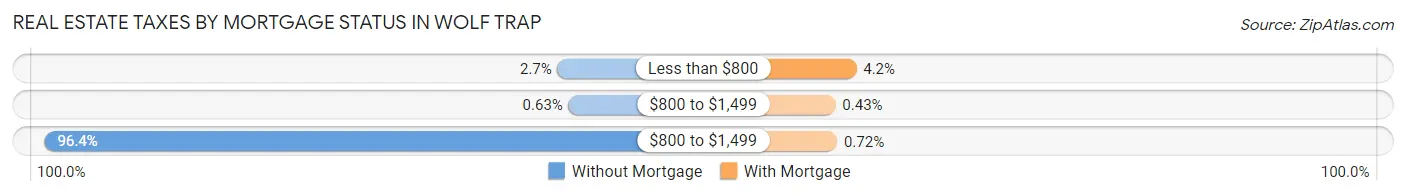
| Property Taxes | Without Mortgage | With Mortgage |
| Less than $800 | 38 (2.6%) | 158 (4.2%) |
| $800 to $1,499 | 9 (0.6%) | 16 (0.4%) |
| $800 to $1,499 | 1,382 (96.4%) | 27 (0.7%) |
| Total | 1,434 (100.0%) | 3,725 (100.0%) |
Health & Disability in Wolf Trap
Health Insurance Coverage by Age in Wolf Trap
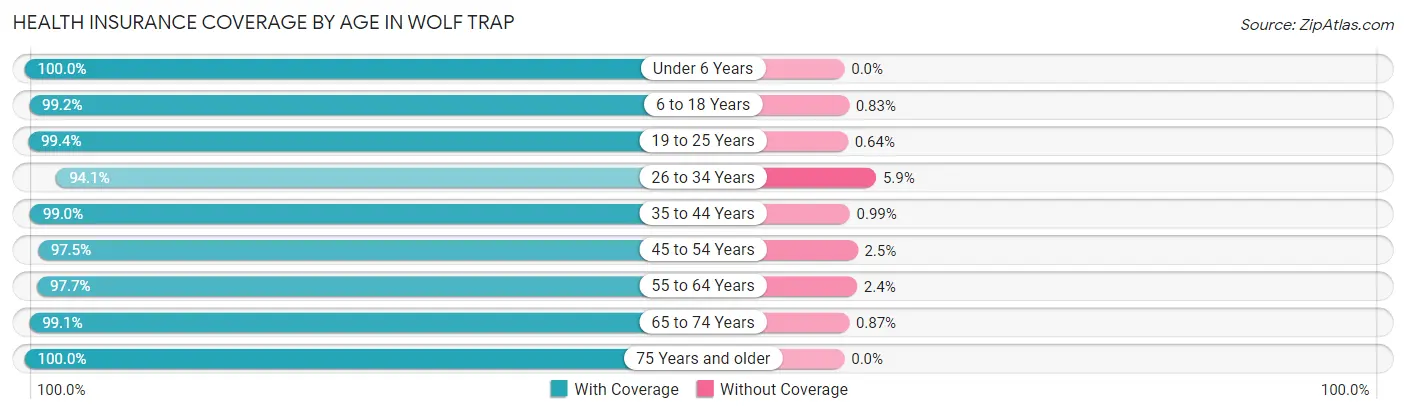
| Age Bracket | With Coverage | Without Coverage |
| Under 6 Years | 994 (100.0%) | 0 (0.0%) |
| 6 to 18 Years | 3,211 (99.2%) | 27 (0.8%) |
| 19 to 25 Years | 779 (99.4%) | 5 (0.6%) |
| 26 to 34 Years | 446 (94.1%) | 28 (5.9%) |
| 35 to 44 Years | 1,905 (99.0%) | 19 (1.0%) |
| 45 to 54 Years | 2,377 (97.5%) | 60 (2.5%) |
| 55 to 64 Years | 2,702 (97.7%) | 65 (2.4%) |
| 65 to 74 Years | 1,489 (99.1%) | 13 (0.9%) |
| 75 Years and older | 1,578 (100.0%) | 0 (0.0%) |
| Total | 15,481 (98.6%) | 217 (1.4%) |
Health Insurance Coverage by Citizenship Status in Wolf Trap
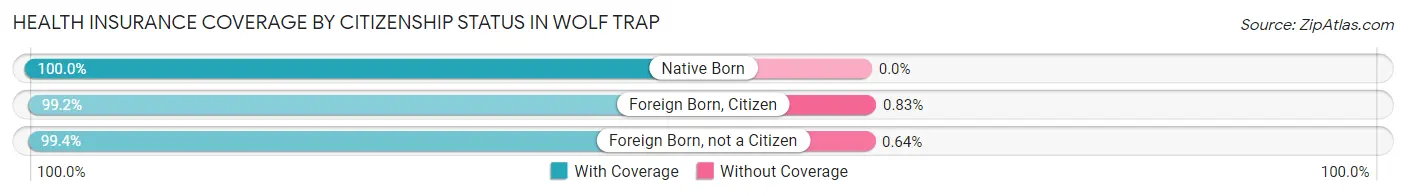
| Citizenship Status | With Coverage | Without Coverage |
| Native Born | 994 (100.0%) | 0 (0.0%) |
| Foreign Born, Citizen | 3,211 (99.2%) | 27 (0.8%) |
| Foreign Born, not a Citizen | 779 (99.4%) | 5 (0.6%) |
Health Insurance Coverage by Household Income in Wolf Trap
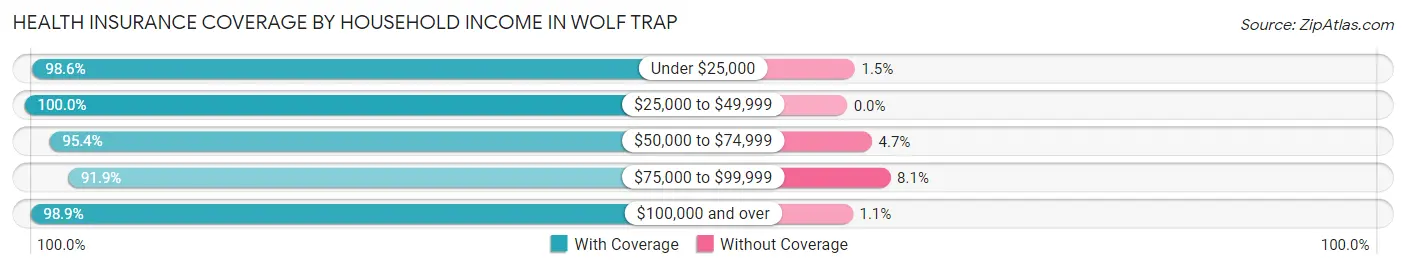
| Household Income | With Coverage | Without Coverage |
| Under $25,000 | 339 (98.6%) | 5 (1.5%) |
| $25,000 to $49,999 | 373 (100.0%) | 0 (0.0%) |
| $50,000 to $74,999 | 390 (95.4%) | 19 (4.6%) |
| $75,000 to $99,999 | 464 (91.9%) | 41 (8.1%) |
| $100,000 and over | 13,912 (98.9%) | 151 (1.1%) |
Public vs Private Health Insurance Coverage by Age in Wolf Trap
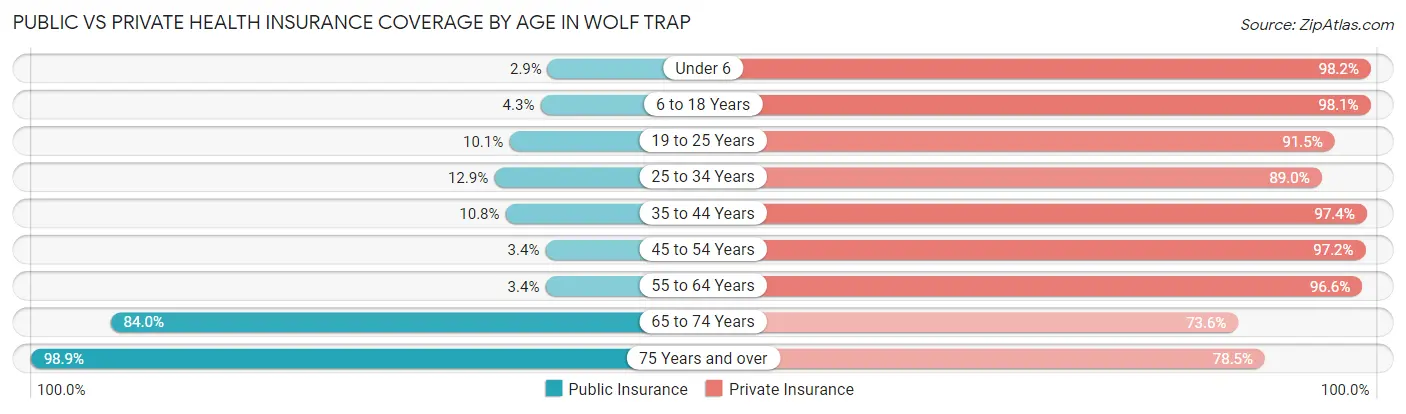
| Age Bracket | Public Insurance | Private Insurance |
| Under 6 | 29 (2.9%) | 976 (98.2%) |
| 6 to 18 Years | 139 (4.3%) | 3,177 (98.1%) |
| 19 to 25 Years | 79 (10.1%) | 717 (91.4%) |
| 25 to 34 Years | 61 (12.9%) | 422 (89.0%) |
| 35 to 44 Years | 207 (10.8%) | 1,874 (97.4%) |
| 45 to 54 Years | 82 (3.4%) | 2,368 (97.2%) |
| 55 to 64 Years | 93 (3.4%) | 2,672 (96.6%) |
| 65 to 74 Years | 1,262 (84.0%) | 1,105 (73.6%) |
| 75 Years and over | 1,560 (98.9%) | 1,239 (78.5%) |
| Total | 3,512 (22.4%) | 14,550 (92.7%) |
Disability Status by Sex by Age in Wolf Trap
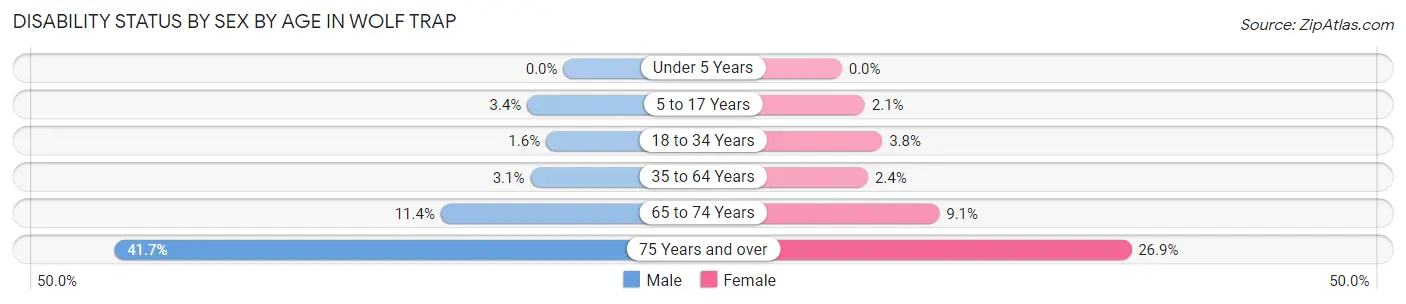
| Age Bracket | Male | Female |
| Under 5 Years | 0 (0.0%) | 0 (0.0%) |
| 5 to 17 Years | 56 (3.4%) | 33 (2.1%) |
| 18 to 34 Years | 10 (1.6%) | 33 (3.7%) |
| 35 to 64 Years | 110 (3.1%) | 86 (2.4%) |
| 65 to 74 Years | 88 (11.4%) | 66 (9.0%) |
| 75 Years and over | 293 (41.7%) | 235 (26.9%) |
Disability Class by Sex by Age in Wolf Trap
Disability Class: Hearing Difficulty
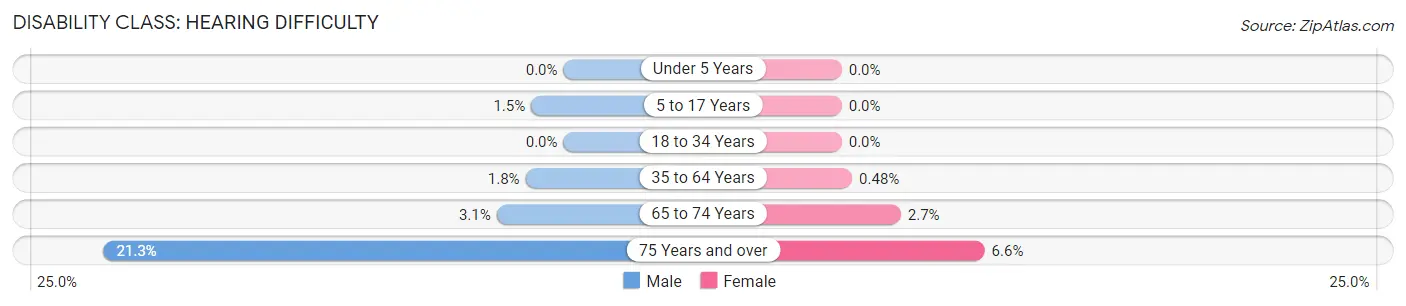
| Age Bracket | Male | Female |
| Under 5 Years | 0 (0.0%) | 0 (0.0%) |
| 5 to 17 Years | 25 (1.5%) | 0 (0.0%) |
| 18 to 34 Years | 0 (0.0%) | 0 (0.0%) |
| 35 to 64 Years | 63 (1.8%) | 17 (0.5%) |
| 65 to 74 Years | 24 (3.1%) | 20 (2.7%) |
| 75 Years and over | 150 (21.3%) | 58 (6.6%) |
Disability Class: Vision Difficulty
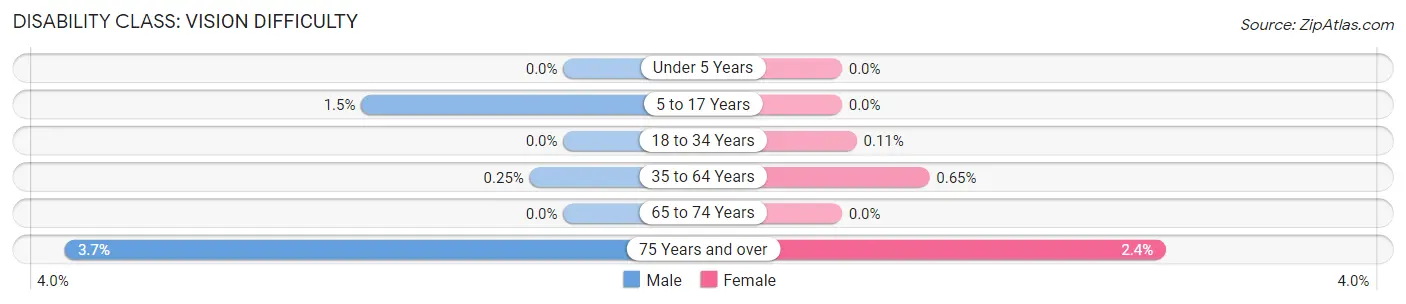
| Age Bracket | Male | Female |
| Under 5 Years | 0 (0.0%) | 0 (0.0%) |
| 5 to 17 Years | 25 (1.5%) | 0 (0.0%) |
| 18 to 34 Years | 0 (0.0%) | 1 (0.1%) |
| 35 to 64 Years | 9 (0.3%) | 23 (0.6%) |
| 65 to 74 Years | 0 (0.0%) | 0 (0.0%) |
| 75 Years and over | 26 (3.7%) | 21 (2.4%) |
Disability Class: Cognitive Difficulty
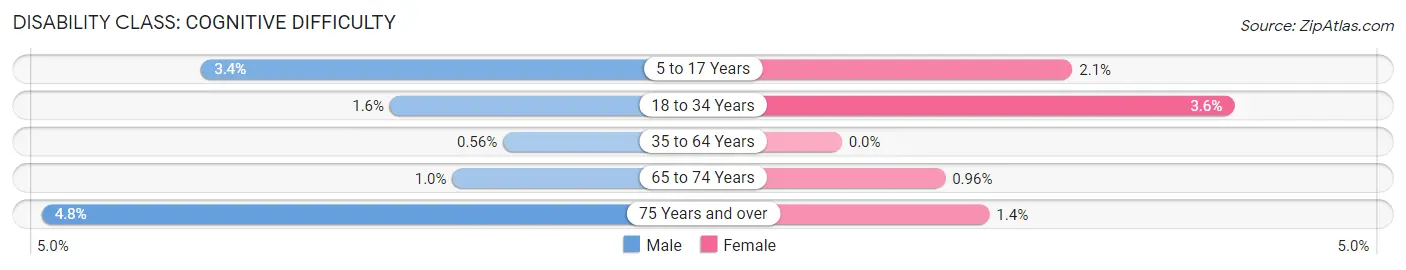
| Age Bracket | Male | Female |
| 5 to 17 Years | 56 (3.4%) | 33 (2.1%) |
| 18 to 34 Years | 10 (1.6%) | 32 (3.6%) |
| 35 to 64 Years | 20 (0.6%) | 0 (0.0%) |
| 65 to 74 Years | 8 (1.0%) | 7 (1.0%) |
| 75 Years and over | 34 (4.8%) | 12 (1.4%) |
Disability Class: Ambulatory Difficulty
| Age Bracket | Male | Female |
| 5 to 17 Years | 25 (1.5%) | 0 (0.0%) |
| 18 to 34 Years | 0 (0.0%) | 16 (1.8%) |
| 35 to 64 Years | 5 (0.1%) | 53 (1.5%) |
| 65 to 74 Years | 64 (8.3%) | 39 (5.3%) |
| 75 Years and over | 126 (17.9%) | 197 (22.5%) |
Disability Class: Self-Care Difficulty
| Age Bracket | Male | Female |
| 5 to 17 Years | 25 (1.5%) | 10 (0.6%) |
| 18 to 34 Years | 4 (0.6%) | 15 (1.7%) |
| 35 to 64 Years | 20 (0.6%) | 15 (0.4%) |
| 65 to 74 Years | 0 (0.0%) | 6 (0.8%) |
| 75 Years and over | 32 (4.5%) | 28 (3.2%) |
Technology Access in Wolf Trap
Computing Device Access in Wolf Trap
| Device Type | # Households | % Households |
| Desktop or Laptop | 5,312 | 98.1% |
| Smartphone | 5,271 | 97.3% |
| Tablet | 4,718 | 87.1% |
| No Computing Device | 29 | 0.5% |
| Total | 5,417 | 100.0% |
Internet Access in Wolf Trap
| Internet Type | # Households | % Households |
| Dial-Up Internet | 5 | 0.1% |
| Broadband Home | 5,163 | 95.3% |
| Cellular Data Only | 180 | 3.3% |
| Satellite Internet | 144 | 2.7% |
| No Internet | 49 | 0.9% |
| Total | 5,417 | 100.0% |
Wolf Trap Summary
Wolf Trap, Virginia is a small unincorporated community located in Fairfax County, Virginia. It is situated in the northern part of the county, just south of the city of Vienna. The community is named after a nearby stream, Wolf Trap Run, which was named for a Native American legend about a wolf that was trapped in the area.
History
The area that is now Wolf Trap was originally inhabited by Native Americans, including the Doeg, Piscataway, and Iroquois tribes. The first European settlers arrived in the area in the late 17th century, and the area was part of the Fairfax County land grant. The area was primarily used for farming and timber production until the late 19th century, when the Washington and Old Dominion Railroad was built through the area. This allowed for the development of the community, and the first post office was established in 1891.
In the early 20th century, Wolf Trap became a popular summer resort destination for Washington, D.C. residents. The area was known for its natural beauty, and many of the original summer homes still stand today. In 1966, the Wolf Trap Foundation for the Performing Arts was established, and the Wolf Trap National Park for the Performing Arts was opened in 1971. The park is now a popular destination for outdoor concerts and performances.
Geography
Wolf Trap is located in northern Fairfax County, Virginia, just south of the city of Vienna. It is situated in the Piedmont region of Virginia, and is part of the Washington metropolitan area. The community is located at an elevation of about 400 feet above sea level. The area is characterized by rolling hills and wooded areas, and is home to several streams, including Wolf Trap Run.
Economy
The economy of Wolf Trap is largely based on the service industry. The area is home to several restaurants, retail stores, and other businesses that serve the local community. The Wolf Trap National Park for the Performing Arts is a major economic driver for the area, as it attracts visitors from all over the region. The park also hosts a variety of events throughout the year, including concerts, plays, and other performances.
Demographics
As of the 2010 census, the population of Wolf Trap was 1,845. The racial makeup of the community was 87.3% White, 5.2% African American, 0.3% Native American, 3.2% Asian, and 3.9% from other races. The median household income was $117,917, and the median age was 40.7 years.
Wolf Trap is a small, close-knit community with a strong sense of community. The area is home to a variety of parks and recreational facilities, and the Wolf Trap National Park for the Performing Arts is a popular destination for visitors from all over the region. The area is also home to a variety of restaurants, retail stores, and other businesses that serve the local community.
Common Questions
What is Per Capita Income in Wolf Trap?
Per Capita income in Wolf Trap is $104,924.
What is the Median Family Income in Wolf Trap?
Median Family Income in Wolf Trap is $250,001.
What is the Median Household income in Wolf Trap?
Median Household Income in Wolf Trap is $246,563.
What is Income or Wage Gap in Wolf Trap?
Income or Wage Gap in Wolf Trap is 60.9%.
Women in Wolf Trap earn 39.1 cents for every dollar earned by a man.
What is Family Income Deficit in Wolf Trap?
Family Income Deficit in Wolf Trap is $12,657.
Families that are below poverty line in Wolf Trap earn $12,657 less on average than the poverty threshold level.
What is Inequality or Gini Index in Wolf Trap?
Inequality or Gini Index in Wolf Trap is 0.42.
What is the Total Population of Wolf Trap?
Total Population of Wolf Trap is 15,712.
What is the Total Male Population of Wolf Trap?
Total Male Population of Wolf Trap is 7,743.
What is the Total Female Population of Wolf Trap?
Total Female Population of Wolf Trap is 7,969.
What is the Ratio of Males per 100 Females in Wolf Trap?
There are 97.16 Males per 100 Females in Wolf Trap.
What is the Ratio of Females per 100 Males in Wolf Trap?
There are 102.92 Females per 100 Males in Wolf Trap.
What is the Median Population Age in Wolf Trap?
Median Population Age in Wolf Trap is 47.0 Years.
What is the Average Family Size in Wolf Trap
Average Family Size in Wolf Trap is 3.2 People.
What is the Average Household Size in Wolf Trap
Average Household Size in Wolf Trap is 2.9 People.
How Large is the Labor Force in Wolf Trap?
There are 7,735 People in the Labor Forcein in Wolf Trap.
What is the Percentage of People in the Labor Force in Wolf Trap?
63.0% of People are in the Labor Force in Wolf Trap.
What is the Unemployment Rate in Wolf Trap?
Unemployment Rate in Wolf Trap is 2.4%.