Lake Barcroft, VA Map & Demographics
Lake Barcroft Map
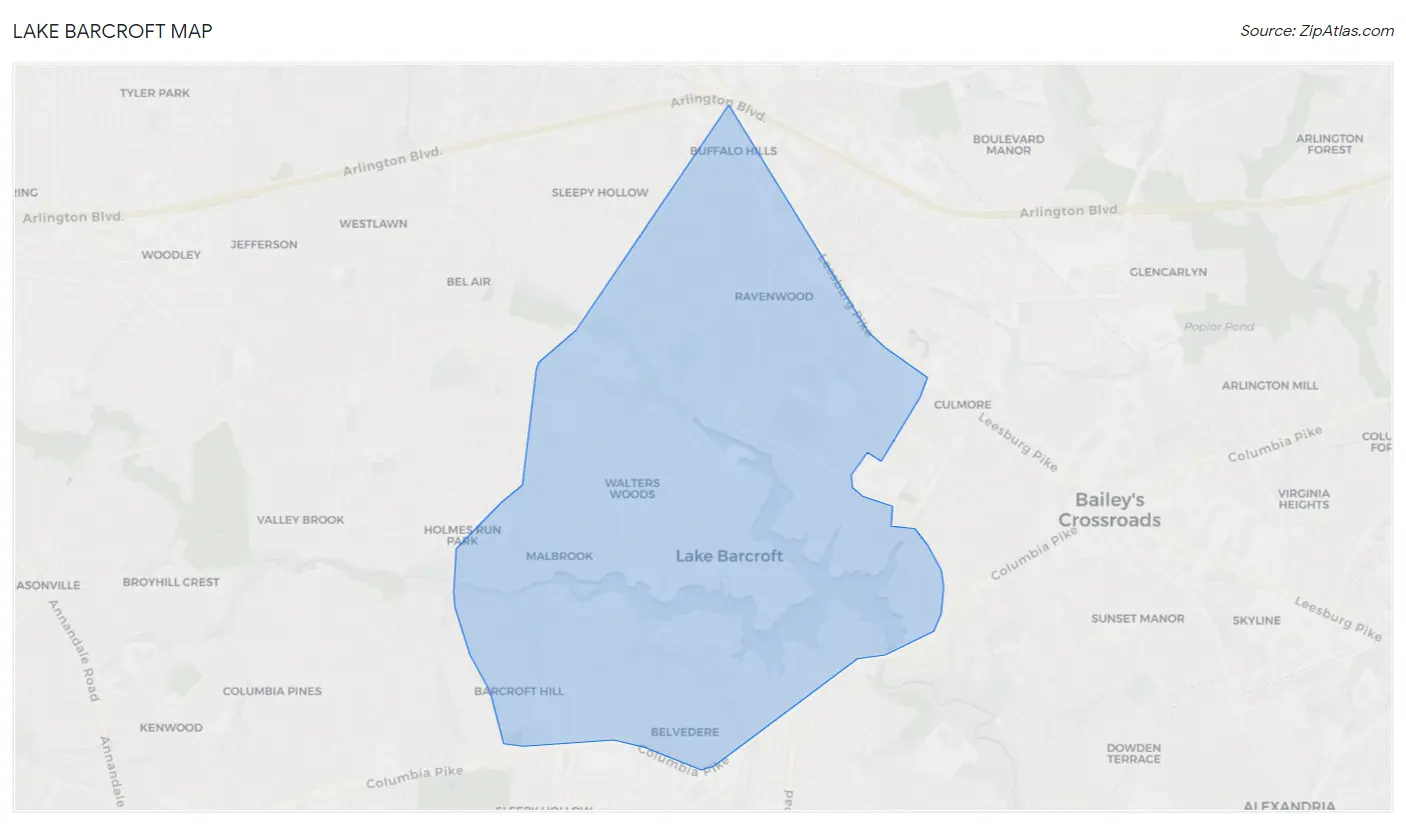
Lake Barcroft Overview
$72,366
PER CAPITA INCOME
$178,533
AVG FAMILY INCOME
$140,391
AVG HOUSEHOLD INCOME
30.5%
WAGE / INCOME GAP [ % ]
69.5¢/ $1
WAGE / INCOME GAP [ $ ]
0.45
INEQUALITY / GINI INDEX
10,591
TOTAL POPULATION
5,257
MALE POPULATION
5,334
FEMALE POPULATION
98.56
MALES / 100 FEMALES
101.46
FEMALES / 100 MALES
44.3
MEDIAN AGE
3.3
AVG FAMILY SIZE
2.7
AVG HOUSEHOLD SIZE
6,065
LABOR FORCE [ PEOPLE ]
69.5%
PERCENT IN LABOR FORCE
5.2%
UNEMPLOYMENT RATE
Income in Lake Barcroft
Income Overview in Lake Barcroft
Per Capita Income in Lake Barcroft is $72,366, while median incomes of families and households are $178,533 and $140,391 respectively.
| Characteristic | Number | Measure |
| Per Capita Income | 10,591 | $72,366 |
| Median Family Income | 2,735 | $178,533 |
| Mean Family Income | 2,735 | $222,540 |
| Median Household Income | 3,897 | $140,391 |
| Mean Household Income | 3,897 | $191,069 |
| Income Deficit | 2,735 | $0 |
| Wage / Income Gap (%) | 10,591 | 30.51% |
| Wage / Income Gap ($) | 10,591 | 69.49¢ per $1 |
| Gini / Inequality Index | 10,591 | 0.45 |
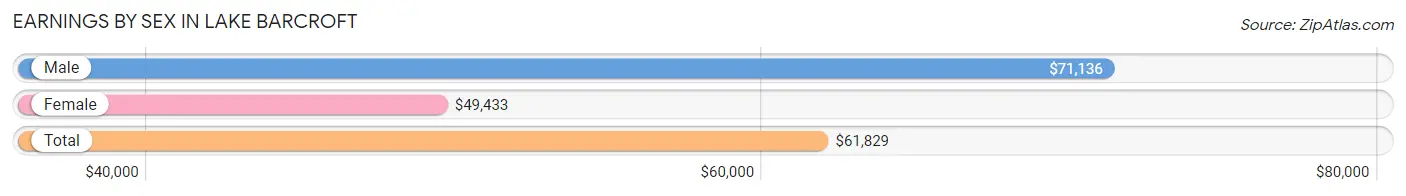
Earnings by Sex in Lake Barcroft
Average Earnings in Lake Barcroft are $61,829, $71,136 for men and $49,433 for women, a difference of 30.5%.
| Sex | Number | Average Earnings |
| Male | 3,356 (53.7%) | $71,136 |
| Female | 2,890 (46.3%) | $49,433 |
| Total | 6,246 (100.0%) | $61,829 |
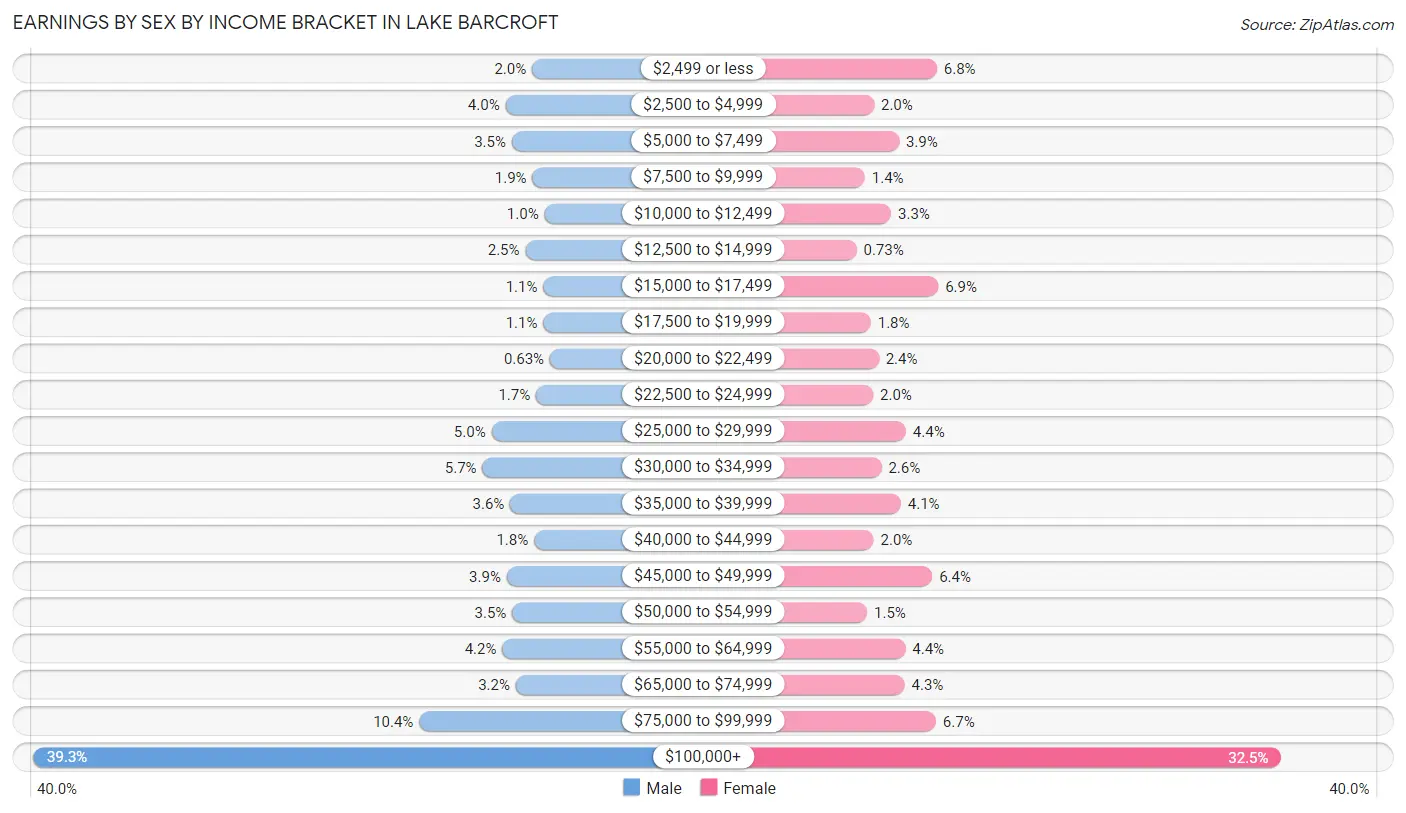
Earnings by Sex by Income Bracket in Lake Barcroft
The most common earnings brackets in Lake Barcroft are $100,000+ for men (1,319 | 39.3%) and $100,000+ for women (939 | 32.5%).
| Income | Male | Female |
| $2,499 or less | 66 (2.0%) | 195 (6.8%) |
| $2,500 to $4,999 | 133 (4.0%) | 59 (2.0%) |
| $5,000 to $7,499 | 117 (3.5%) | 113 (3.9%) |
| $7,500 to $9,999 | 65 (1.9%) | 39 (1.3%) |
| $10,000 to $12,499 | 35 (1.0%) | 96 (3.3%) |
| $12,500 to $14,999 | 83 (2.5%) | 21 (0.7%) |
| $15,000 to $17,499 | 38 (1.1%) | 198 (6.9%) |
| $17,500 to $19,999 | 38 (1.1%) | 52 (1.8%) |
| $20,000 to $22,499 | 21 (0.6%) | 69 (2.4%) |
| $22,500 to $24,999 | 56 (1.7%) | 57 (2.0%) |
| $25,000 to $29,999 | 168 (5.0%) | 128 (4.4%) |
| $30,000 to $34,999 | 191 (5.7%) | 75 (2.6%) |
| $35,000 to $39,999 | 121 (3.6%) | 117 (4.1%) |
| $40,000 to $44,999 | 61 (1.8%) | 58 (2.0%) |
| $45,000 to $49,999 | 130 (3.9%) | 185 (6.4%) |
| $50,000 to $54,999 | 116 (3.5%) | 44 (1.5%) |
| $55,000 to $64,999 | 141 (4.2%) | 127 (4.4%) |
| $65,000 to $74,999 | 107 (3.2%) | 125 (4.3%) |
| $75,000 to $99,999 | 350 (10.4%) | 193 (6.7%) |
| $100,000+ | 1,319 (39.3%) | 939 (32.5%) |
| Total | 3,356 (100.0%) | 2,890 (100.0%) |
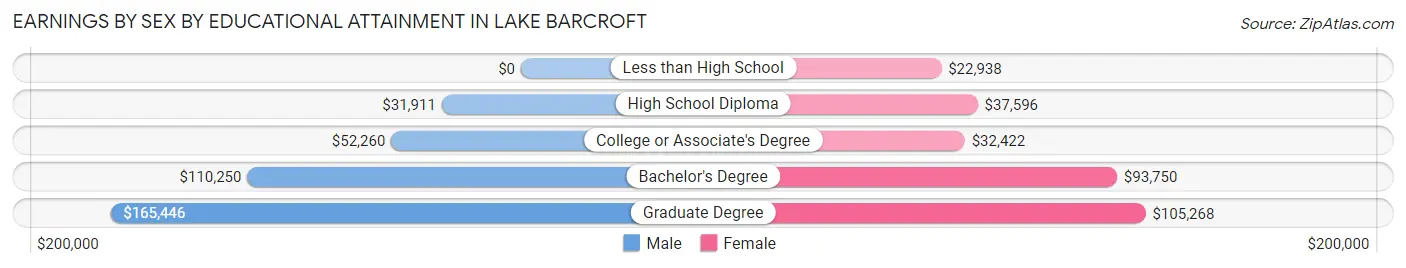
Earnings by Sex by Educational Attainment in Lake Barcroft
Average earnings in Lake Barcroft are $86,331 for men and $64,375 for women, a difference of 25.4%. Men with an educational attainment of graduate degree enjoy the highest average annual earnings of $165,446, while those with high school diploma education earn the least with $31,911. Women with an educational attainment of graduate degree earn the most with the average annual earnings of $105,268, while those with less than high school education have the smallest earnings of $22,938.
| Educational Attainment | Male Income | Female Income |
| Less than High School | - | - |
| High School Diploma | $31,911 | $37,596 |
| College or Associate's Degree | $52,260 | $32,422 |
| Bachelor's Degree | $110,250 | $93,750 |
| Graduate Degree | $165,446 | $105,268 |
| Total | $86,331 | $64,375 |
Family Income in Lake Barcroft
Family Income Brackets in Lake Barcroft
According to the Lake Barcroft family income data, there are 1,217 families falling into the $200,000+ income range, which is the most common income bracket and makes up 44.5% of all families.
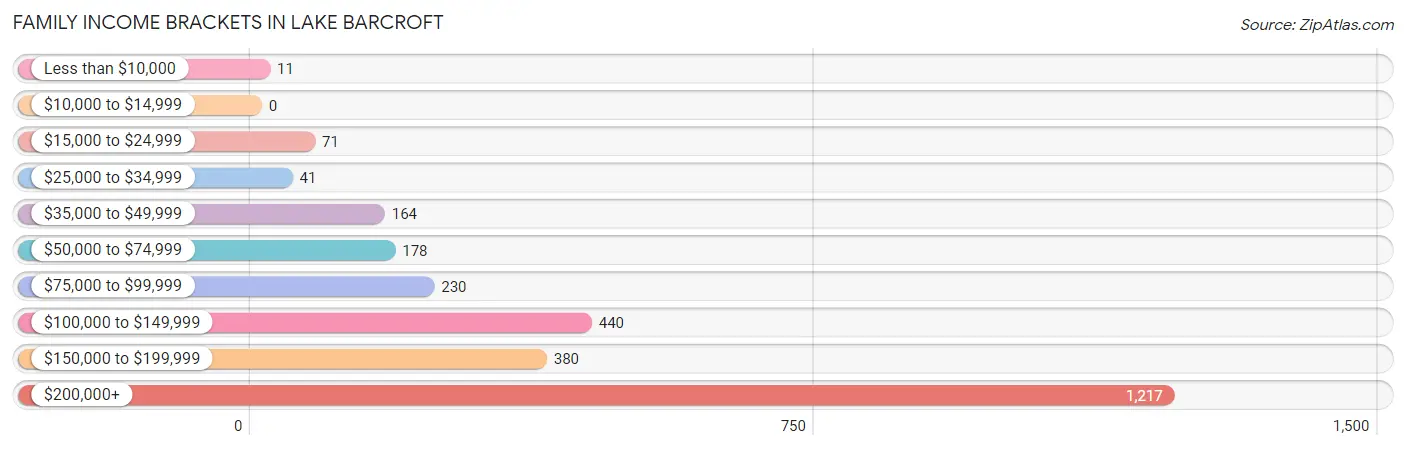
| Income Bracket | # Families | % Families |
| Less than $10,000 | 11 | 0.4% |
| $10,000 to $14,999 | 0 | 0.0% |
| $15,000 to $24,999 | 71 | 2.6% |
| $25,000 to $34,999 | 41 | 1.5% |
| $35,000 to $49,999 | 164 | 6.0% |
| $50,000 to $74,999 | 178 | 6.5% |
| $75,000 to $99,999 | 230 | 8.4% |
| $100,000 to $149,999 | 440 | 16.1% |
| $150,000 to $199,999 | 380 | 13.9% |
| $200,000+ | 1,217 | 44.5% |
Family Income by Famaliy Size in Lake Barcroft
5-person families (293 | 10.7%) account for the highest median family income in Lake Barcroft with $250,001 per family, while 2-person families (1,302 | 47.6%) have the highest median income of $79,896 per family member.
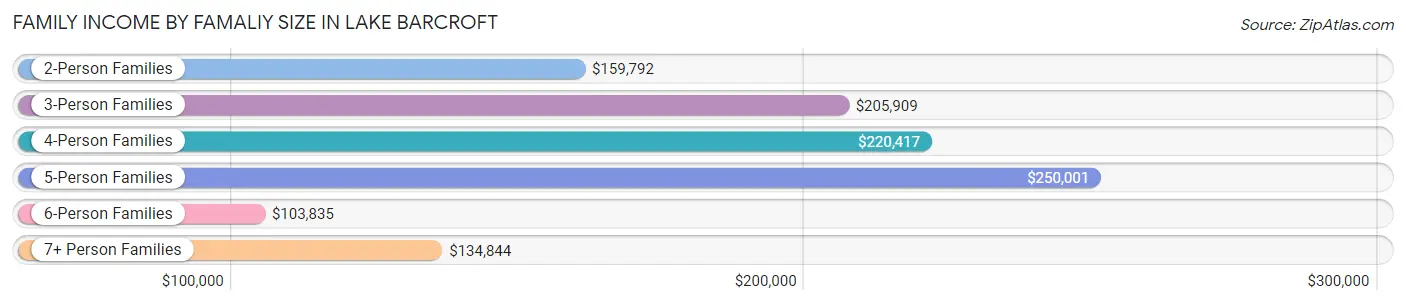
| Income Bracket | # Families | Median Income |
| 2-Person Families | 1,302 (47.6%) | $159,792 |
| 3-Person Families | 516 (18.9%) | $205,909 |
| 4-Person Families | 492 (18.0%) | $220,417 |
| 5-Person Families | 293 (10.7%) | $250,001 |
| 6-Person Families | 85 (3.1%) | $103,835 |
| 7+ Person Families | 47 (1.7%) | $134,844 |
| Total | 2,735 (100.0%) | $178,533 |
Family Income by Number of Earners in Lake Barcroft
The median family income in Lake Barcroft is $178,533, with families comprising 2 earners (1,234) having the highest median family income of $242,619, while families with 1 earner (858) have the lowest median family income of $141,250, accounting for 45.1% and 31.4% of families, respectively.
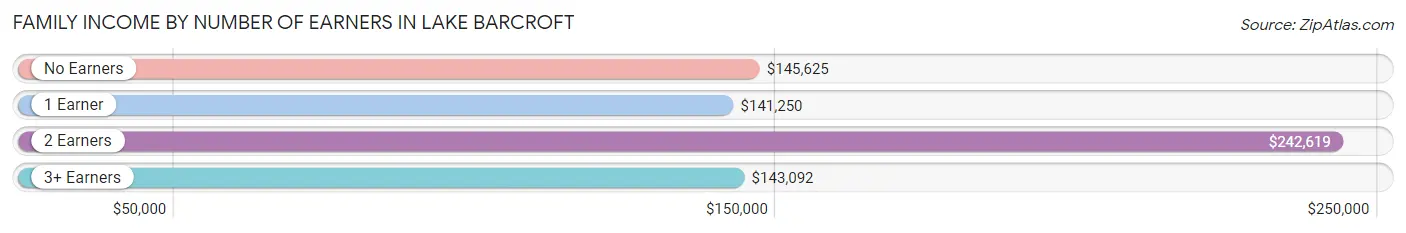
| Number of Earners | # Families | Median Income |
| No Earners | 248 (9.1%) | $145,625 |
| 1 Earner | 858 (31.4%) | $141,250 |
| 2 Earners | 1,234 (45.1%) | $242,619 |
| 3+ Earners | 395 (14.4%) | $143,092 |
| Total | 2,735 (100.0%) | $178,533 |
Household Income in Lake Barcroft
Household Income Brackets in Lake Barcroft
With 1,411 households falling in the category, the $200,000+ income range is the most frequent in Lake Barcroft, accounting for 36.2% of all households. In contrast, only 16 households (0.4%) fall into the $10,000 to $14,999 income bracket, making it the least populous group.
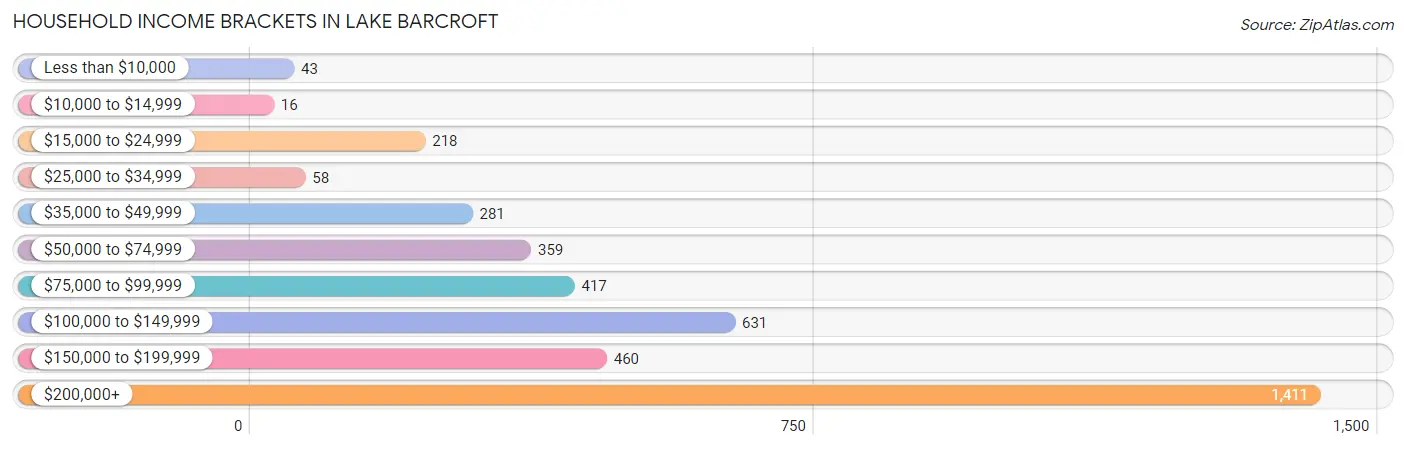
| Income Bracket | # Households | % Households |
| Less than $10,000 | 43 | 1.1% |
| $10,000 to $14,999 | 16 | 0.4% |
| $15,000 to $24,999 | 218 | 5.6% |
| $25,000 to $34,999 | 58 | 1.5% |
| $35,000 to $49,999 | 281 | 7.2% |
| $50,000 to $74,999 | 359 | 9.2% |
| $75,000 to $99,999 | 417 | 10.7% |
| $100,000 to $149,999 | 631 | 16.2% |
| $150,000 to $199,999 | 460 | 11.8% |
| $200,000+ | 1,411 | 36.2% |
Household Income by Householder Age in Lake Barcroft
The median household income in Lake Barcroft is $140,391, with the highest median household income of $187,039 found in the 45 to 64 years age bracket for the primary householder. A total of 1,595 households (40.9%) fall into this category. Meanwhile, the 15 to 24 years age bracket for the primary householder has the lowest median household income of $91,613, with 98 households (2.5%) in this group.
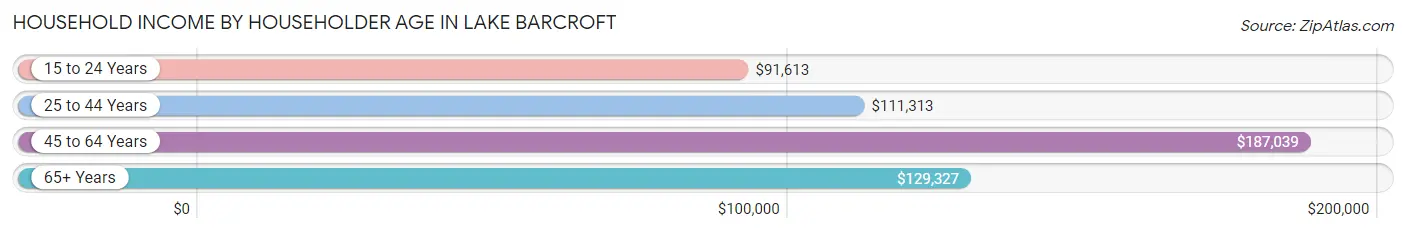
| Income Bracket | # Households | Median Income |
| 15 to 24 Years | 98 (2.5%) | $91,613 |
| 25 to 44 Years | 937 (24.0%) | $111,313 |
| 45 to 64 Years | 1,595 (40.9%) | $187,039 |
| 65+ Years | 1,267 (32.5%) | $129,327 |
| Total | 3,897 (100.0%) | $140,391 |
Poverty in Lake Barcroft
Income Below Poverty by Sex and Age in Lake Barcroft
With 2.7% poverty level for males and 4.0% for females among the residents of Lake Barcroft, 12 to 14 year old males and 15 year old females are the most vulnerable to poverty, with 18 males (7.9%) and 9 females (10.7%) in their respective age groups living below the poverty level.
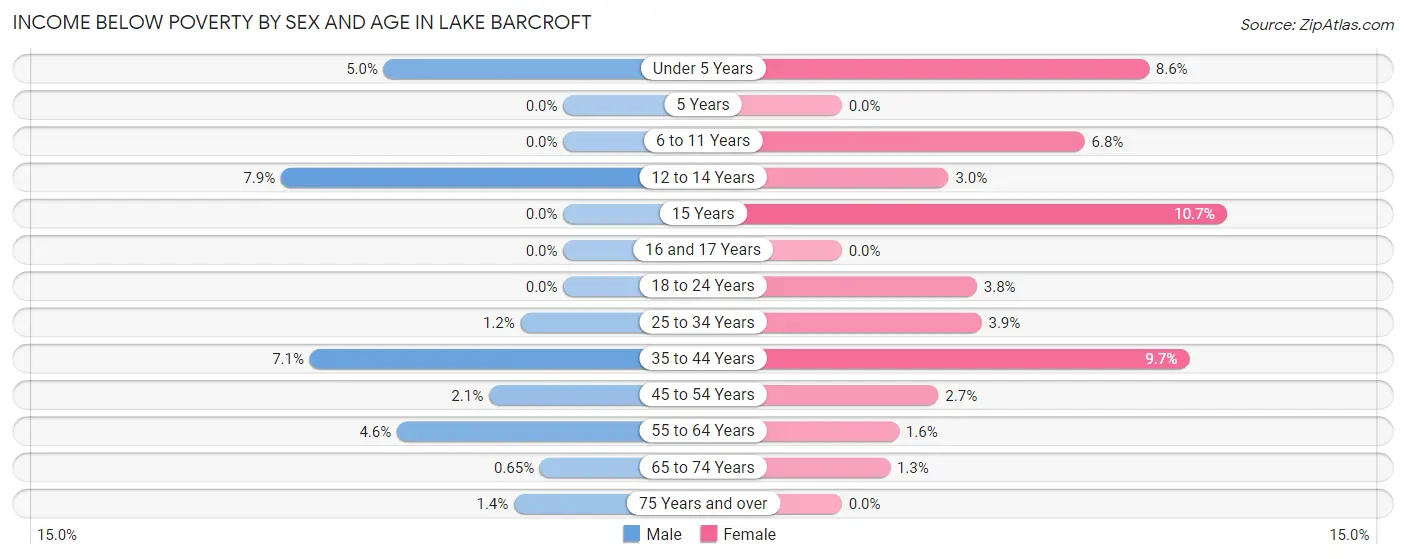
| Age Bracket | Male | Female |
| Under 5 Years | 11 (5.0%) | 20 (8.6%) |
| 5 Years | 0 (0.0%) | 0 (0.0%) |
| 6 to 11 Years | 0 (0.0%) | 25 (6.8%) |
| 12 to 14 Years | 18 (7.9%) | 7 (3.0%) |
| 15 Years | 0 (0.0%) | 9 (10.7%) |
| 16 and 17 Years | 0 (0.0%) | 0 (0.0%) |
| 18 to 24 Years | 0 (0.0%) | 16 (3.8%) |
| 25 to 34 Years | 6 (1.2%) | 21 (3.9%) |
| 35 to 44 Years | 46 (7.1%) | 73 (9.7%) |
| 45 to 54 Years | 20 (2.1%) | 21 (2.7%) |
| 55 to 64 Years | 33 (4.6%) | 11 (1.6%) |
| 65 to 74 Years | 4 (0.6%) | 9 (1.3%) |
| 75 Years and over | 5 (1.4%) | 0 (0.0%) |
| Total | 143 (2.7%) | 212 (4.0%) |
Income Above Poverty by Sex and Age in Lake Barcroft
According to the poverty statistics in Lake Barcroft, males aged 5 years and females aged 5 years are the age groups that are most secure financially, with 100.0% of males and 100.0% of females in these age groups living above the poverty line.
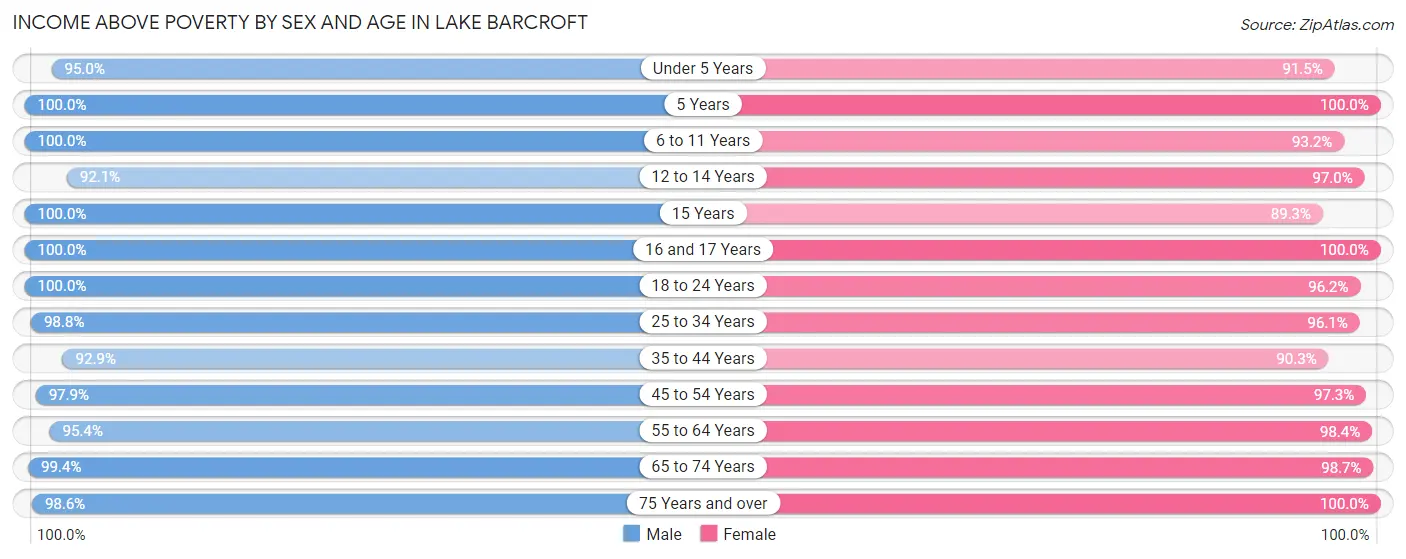
| Age Bracket | Male | Female |
| Under 5 Years | 209 (95.0%) | 214 (91.4%) |
| 5 Years | 39 (100.0%) | 34 (100.0%) |
| 6 to 11 Years | 298 (100.0%) | 345 (93.2%) |
| 12 to 14 Years | 211 (92.1%) | 229 (97.0%) |
| 15 Years | 87 (100.0%) | 75 (89.3%) |
| 16 and 17 Years | 137 (100.0%) | 88 (100.0%) |
| 18 to 24 Years | 401 (100.0%) | 409 (96.2%) |
| 25 to 34 Years | 499 (98.8%) | 519 (96.1%) |
| 35 to 44 Years | 606 (92.9%) | 682 (90.3%) |
| 45 to 54 Years | 945 (97.9%) | 761 (97.3%) |
| 55 to 64 Years | 679 (95.4%) | 679 (98.4%) |
| 65 to 74 Years | 610 (99.4%) | 662 (98.7%) |
| 75 Years and over | 360 (98.6%) | 425 (100.0%) |
| Total | 5,081 (97.3%) | 5,122 (96.0%) |
Income Below Poverty Among Married-Couple Families in Lake Barcroft
The poverty statistics for married-couple families in Lake Barcroft show that 1.7% or 35 of the total 2,126 families live below the poverty line. Families with 1 or 2 children have the highest poverty rate of 4.6%, comprising of 32 families. On the other hand, families with 3 or 4 children have the lowest poverty rate of 0.0%, which includes 0 families.
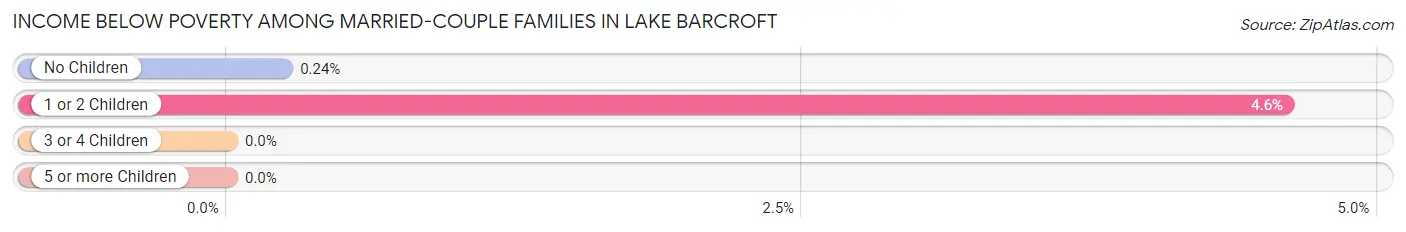
| Children | Above Poverty | Below Poverty |
| No Children | 1,253 (99.8%) | 3 (0.2%) |
| 1 or 2 Children | 663 (95.4%) | 32 (4.6%) |
| 3 or 4 Children | 175 (100.0%) | 0 (0.0%) |
| 5 or more Children | 0 (0.0%) | 0 (0.0%) |
| Total | 2,091 (98.4%) | 35 (1.7%) |
Income Below Poverty Among Single-Parent Households in Lake Barcroft
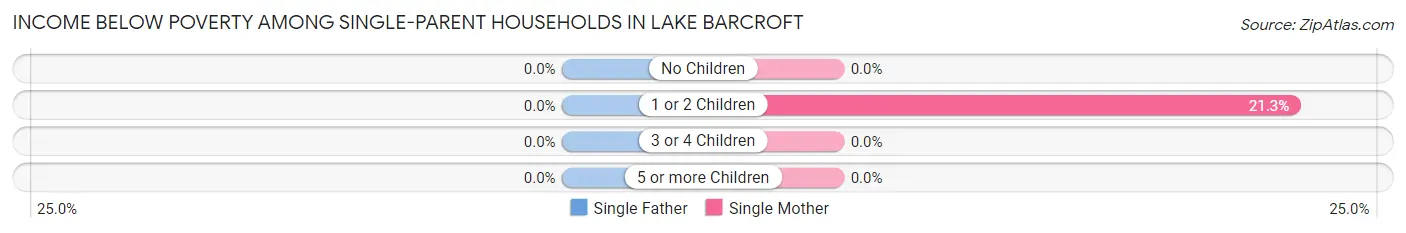
| Children | Single Father | Single Mother |
| No Children | 0 (0.0%) | 0 (0.0%) |
| 1 or 2 Children | 0 (0.0%) | 23 (21.3%) |
| 3 or 4 Children | 0 (0.0%) | 0 (0.0%) |
| 5 or more Children | 0 (0.0%) | 0 (0.0%) |
| Total | 0 (0.0%) | 23 (6.0%) |
Income Below Poverty Among Married-Couple vs Single-Parent Households in Lake Barcroft
The poverty data for Lake Barcroft shows that 35 of the married-couple family households (1.7%) and 23 of the single-parent households (3.8%) are living below the poverty level. Within the married-couple family households, those with 1 or 2 children have the highest poverty rate, with 32 households (4.6%) falling below the poverty line. Among the single-parent households, those with 1 or 2 children have the highest poverty rate, with 23 household (14.3%) living below poverty.
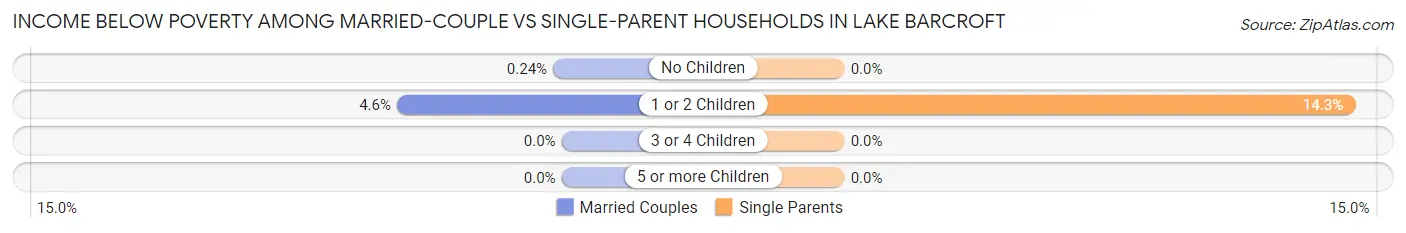
| Children | Married-Couple Families | Single-Parent Households |
| No Children | 3 (0.2%) | 0 (0.0%) |
| 1 or 2 Children | 32 (4.6%) | 23 (14.3%) |
| 3 or 4 Children | 0 (0.0%) | 0 (0.0%) |
| 5 or more Children | 0 (0.0%) | 0 (0.0%) |
| Total | 35 (1.7%) | 23 (3.8%) |
Race in Lake Barcroft
The most populous races in Lake Barcroft are White / Caucasian (6,703 | 63.3%), Hispanic or Latino (1,765 | 16.7%), and Asian (1,476 | 13.9%).
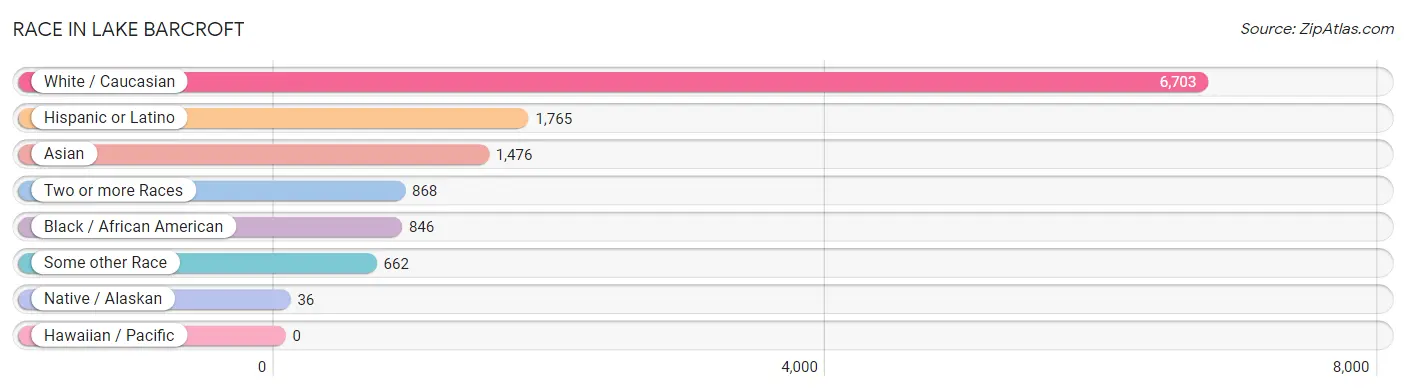
| Race | # Population | % Population |
| Asian | 1,476 | 13.9% |
| Black / African American | 846 | 8.0% |
| Hawaiian / Pacific | 0 | 0.0% |
| Hispanic or Latino | 1,765 | 16.7% |
| Native / Alaskan | 36 | 0.3% |
| White / Caucasian | 6,703 | 63.3% |
| Two or more Races | 868 | 8.2% |
| Some other Race | 662 | 6.2% |
| Total | 10,591 | 100.0% |
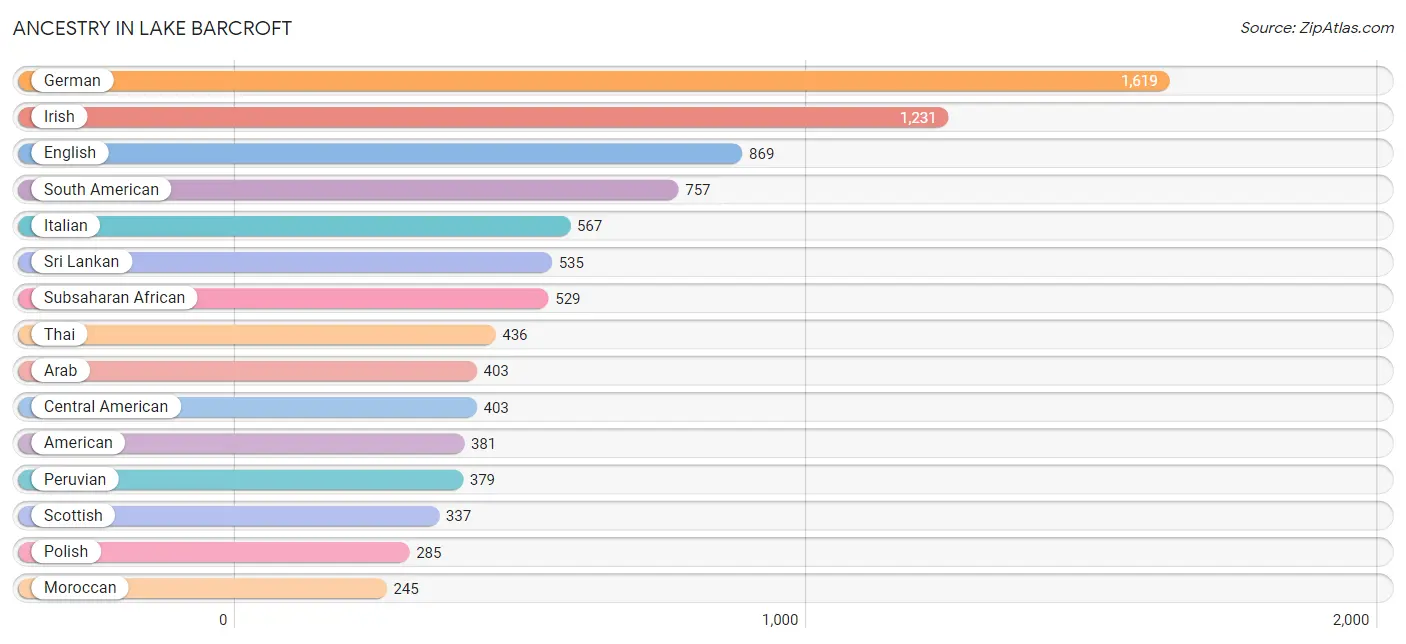
Ancestry in Lake Barcroft
The most populous ancestries reported in Lake Barcroft are German (1,619 | 15.3%), Irish (1,231 | 11.6%), English (869 | 8.2%), South American (757 | 7.1%), and Italian (567 | 5.3%), together accounting for 47.6% of all Lake Barcroft residents.
| Ancestry | # Population | % Population |
| Afghan | 10 | 0.1% |
| African | 210 | 2.0% |
| American | 381 | 3.6% |
| Arab | 403 | 3.8% |
| Argentinean | 56 | 0.5% |
| Armenian | 4 | 0.0% |
| Austrian | 81 | 0.8% |
| Belgian | 31 | 0.3% |
| Bhutanese | 114 | 1.1% |
| Blackfeet | 14 | 0.1% |
| Bolivian | 227 | 2.1% |
| Brazilian | 14 | 0.1% |
| British | 61 | 0.6% |
| Burmese | 55 | 0.5% |
| Canadian | 33 | 0.3% |
| Central American | 403 | 3.8% |
| Cherokee | 45 | 0.4% |
| Chilean | 13 | 0.1% |
| Colombian | 24 | 0.2% |
| Costa Rican | 8 | 0.1% |
| Croatian | 43 | 0.4% |
| Cuban | 41 | 0.4% |
| Czech | 29 | 0.3% |
| Czechoslovakian | 5 | 0.1% |
| Danish | 25 | 0.2% |
| Dominican | 17 | 0.2% |
| Dutch | 56 | 0.5% |
| Eastern European | 188 | 1.8% |
| Ecuadorian | 44 | 0.4% |
| Egyptian | 17 | 0.2% |
| English | 869 | 8.2% |
| Estonian | 6 | 0.1% |
| Ethiopian | 152 | 1.4% |
| European | 234 | 2.2% |
| Filipino | 19 | 0.2% |
| Finnish | 4 | 0.0% |
| French | 220 | 2.1% |
| French Canadian | 20 | 0.2% |
| German | 1,619 | 15.3% |
| Greek | 79 | 0.7% |
| Guatemalan | 163 | 1.5% |
| Hungarian | 61 | 0.6% |
| Indian (Asian) | 110 | 1.0% |
| Indonesian | 6 | 0.1% |
| Iranian | 138 | 1.3% |
| Iraqi | 10 | 0.1% |
| Irish | 1,231 | 11.6% |
| Iroquois | 6 | 0.1% |
| Italian | 567 | 5.3% |
| Jamaican | 42 | 0.4% |
| Jordanian | 9 | 0.1% |
| Korean | 162 | 1.5% |
| Laotian | 2 | 0.0% |
| Latvian | 24 | 0.2% |
| Lebanese | 6 | 0.1% |
| Liberian | 114 | 1.1% |
| Lithuanian | 61 | 0.6% |
| Luxembourger | 6 | 0.1% |
| Mexican | 123 | 1.2% |
| Mexican American Indian | 18 | 0.2% |
| Moroccan | 245 | 2.3% |
| Nicaraguan | 23 | 0.2% |
| Nigerian | 25 | 0.2% |
| Northern European | 6 | 0.1% |
| Norwegian | 160 | 1.5% |
| Pakistani | 15 | 0.1% |
| Palestinian | 46 | 0.4% |
| Peruvian | 379 | 3.6% |
| Polish | 285 | 2.7% |
| Portuguese | 18 | 0.2% |
| Puerto Rican | 99 | 0.9% |
| Romanian | 9 | 0.1% |
| Russian | 104 | 1.0% |
| Salvadoran | 209 | 2.0% |
| Scandinavian | 30 | 0.3% |
| Scotch-Irish | 151 | 1.4% |
| Scottish | 337 | 3.2% |
| Seminole | 4 | 0.0% |
| Senegalese | 13 | 0.1% |
| Sioux | 9 | 0.1% |
| Slavic | 38 | 0.4% |
| Slovak | 10 | 0.1% |
| Slovene | 8 | 0.1% |
| Somali | 5 | 0.1% |
| South African | 6 | 0.1% |
| South American | 757 | 7.1% |
| South American Indian | 18 | 0.2% |
| Spaniard | 35 | 0.3% |
| Spanish | 22 | 0.2% |
| Sri Lankan | 535 | 5.1% |
| Subsaharan African | 529 | 5.0% |
| Sudanese | 2 | 0.0% |
| Swedish | 158 | 1.5% |
| Swiss | 42 | 0.4% |
| Syrian | 7 | 0.1% |
| Thai | 436 | 4.1% |
| Turkish | 6 | 0.1% |
| Ukrainian | 117 | 1.1% |
| Venezuelan | 14 | 0.1% |
| Vietnamese | 17 | 0.2% |
| Welsh | 87 | 0.8% |
| Yugoslavian | 13 | 0.1% | View All 102 Rows |
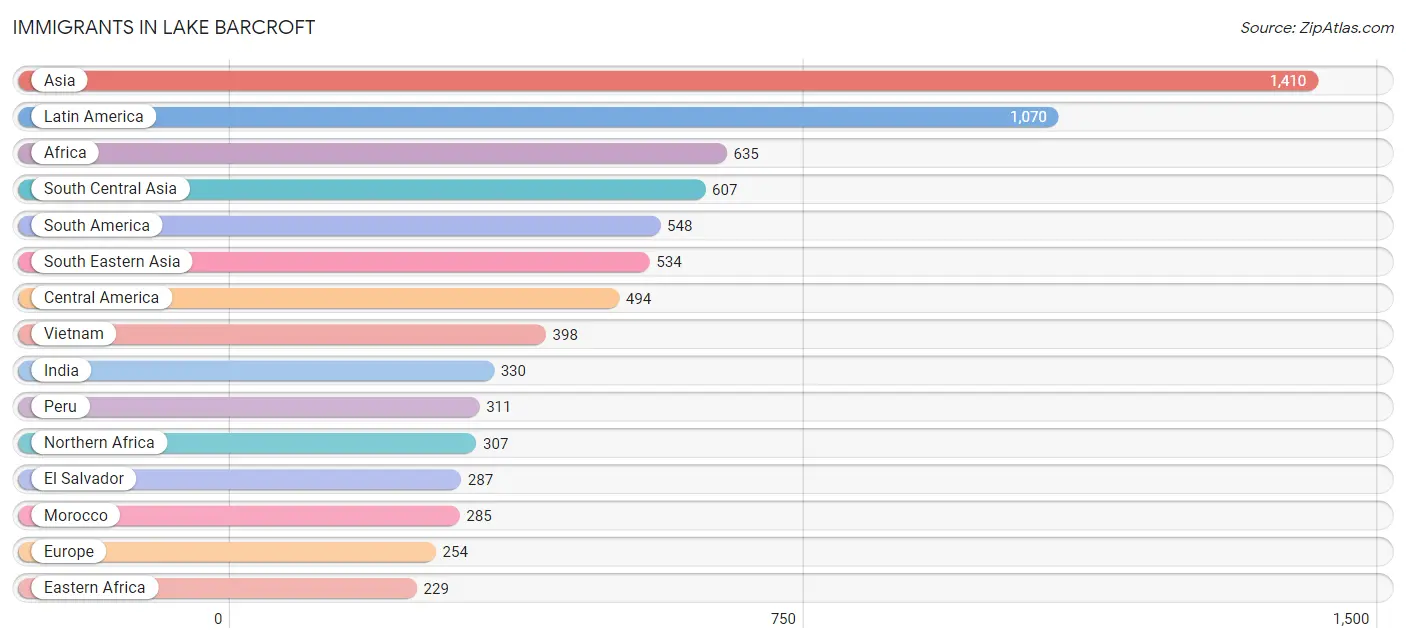
Immigrants in Lake Barcroft
The most numerous immigrant groups reported in Lake Barcroft came from Asia (1,410 | 13.3%), Latin America (1,070 | 10.1%), Africa (635 | 6.0%), South Central Asia (607 | 5.7%), and South America (548 | 5.2%), together accounting for 40.3% of all Lake Barcroft residents.
| Immigration Origin | # Population | % Population |
| Afghanistan | 4 | 0.0% |
| Africa | 635 | 6.0% |
| Argentina | 20 | 0.2% |
| Asia | 1,410 | 13.3% |
| Austria | 29 | 0.3% |
| Bangladesh | 12 | 0.1% |
| Belgium | 4 | 0.0% |
| Bolivia | 121 | 1.1% |
| Bosnia and Herzegovina | 13 | 0.1% |
| Brazil | 16 | 0.2% |
| Canada | 8 | 0.1% |
| Caribbean | 28 | 0.3% |
| Central America | 494 | 4.7% |
| Chile | 17 | 0.2% |
| China | 59 | 0.6% |
| Colombia | 44 | 0.4% |
| Costa Rica | 8 | 0.1% |
| Cuba | 5 | 0.1% |
| Dominican Republic | 6 | 0.1% |
| Eastern Africa | 229 | 2.2% |
| Eastern Asia | 173 | 1.6% |
| Eastern Europe | 77 | 0.7% |
| Ecuador | 10 | 0.1% |
| Egypt | 17 | 0.2% |
| El Salvador | 287 | 2.7% |
| England | 27 | 0.3% |
| Eritrea | 18 | 0.2% |
| Ethiopia | 122 | 1.1% |
| Europe | 254 | 2.4% |
| France | 21 | 0.2% |
| Germany | 74 | 0.7% |
| Guatemala | 120 | 1.1% |
| Hungary | 5 | 0.1% |
| India | 330 | 3.1% |
| Indonesia | 2 | 0.0% |
| Iran | 128 | 1.2% |
| Iraq | 10 | 0.1% |
| Ireland | 6 | 0.1% |
| Israel | 34 | 0.3% |
| Italy | 3 | 0.0% |
| Jamaica | 9 | 0.1% |
| Japan | 86 | 0.8% |
| Jordan | 9 | 0.1% |
| Kenya | 8 | 0.1% |
| Korea | 28 | 0.3% |
| Latin America | 1,070 | 10.1% |
| Lebanon | 12 | 0.1% |
| Liberia | 18 | 0.2% |
| Lithuania | 10 | 0.1% |
| Malaysia | 6 | 0.1% |
| Mexico | 69 | 0.6% |
| Middle Africa | 6 | 0.1% |
| Morocco | 285 | 2.7% |
| Nicaragua | 10 | 0.1% |
| Nigeria | 25 | 0.2% |
| Northern Africa | 307 | 2.9% |
| Northern Europe | 38 | 0.4% |
| Pakistan | 101 | 0.9% |
| Peru | 311 | 2.9% |
| Philippines | 104 | 1.0% |
| Poland | 6 | 0.1% |
| Portugal | 8 | 0.1% |
| Romania | 15 | 0.1% |
| Russia | 4 | 0.0% |
| Senegal | 13 | 0.1% |
| Singapore | 3 | 0.0% |
| Somalia | 64 | 0.6% |
| South America | 548 | 5.2% |
| South Central Asia | 607 | 5.7% |
| South Eastern Asia | 534 | 5.0% |
| Southern Europe | 11 | 0.1% |
| Taiwan | 15 | 0.1% |
| Thailand | 15 | 0.1% |
| Trinidad and Tobago | 8 | 0.1% |
| Turkey | 6 | 0.1% |
| Ukraine | 15 | 0.1% |
| Venezuela | 9 | 0.1% |
| Vietnam | 398 | 3.8% |
| Western Africa | 56 | 0.5% |
| Western Asia | 71 | 0.7% |
| Western Europe | 128 | 1.2% |
| Zaire | 6 | 0.1% |
| Zimbabwe | 17 | 0.2% | View All 83 Rows |
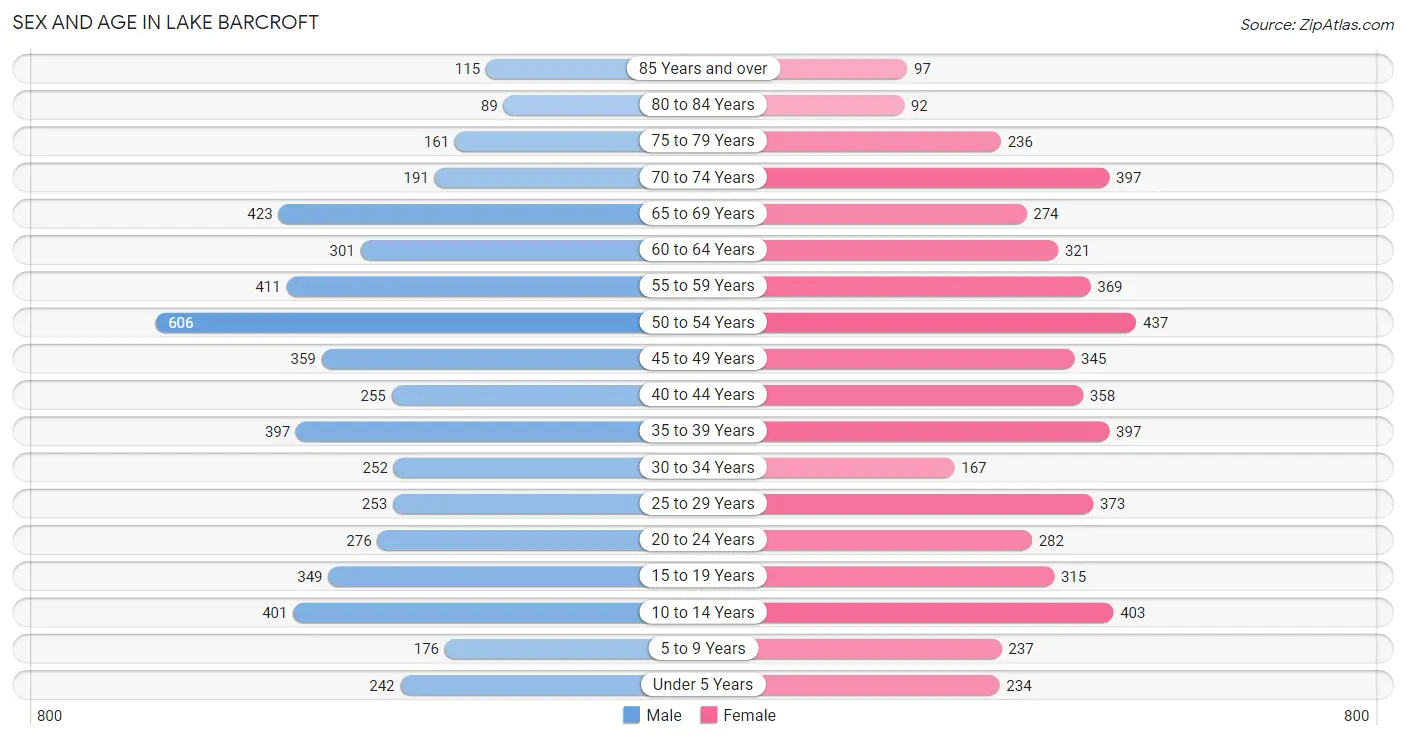
Sex and Age in Lake Barcroft
Sex and Age in Lake Barcroft
The most populous age groups in Lake Barcroft are 50 to 54 Years (606 | 11.5%) for men and 50 to 54 Years (437 | 8.2%) for women.
| Age Bracket | Male | Female |
| Under 5 Years | 242 (4.6%) | 234 (4.4%) |
| 5 to 9 Years | 176 (3.4%) | 237 (4.4%) |
| 10 to 14 Years | 401 (7.6%) | 403 (7.6%) |
| 15 to 19 Years | 349 (6.6%) | 315 (5.9%) |
| 20 to 24 Years | 276 (5.2%) | 282 (5.3%) |
| 25 to 29 Years | 253 (4.8%) | 373 (7.0%) |
| 30 to 34 Years | 252 (4.8%) | 167 (3.1%) |
| 35 to 39 Years | 397 (7.5%) | 397 (7.4%) |
| 40 to 44 Years | 255 (4.9%) | 358 (6.7%) |
| 45 to 49 Years | 359 (6.8%) | 345 (6.5%) |
| 50 to 54 Years | 606 (11.5%) | 437 (8.2%) |
| 55 to 59 Years | 411 (7.8%) | 369 (6.9%) |
| 60 to 64 Years | 301 (5.7%) | 321 (6.0%) |
| 65 to 69 Years | 423 (8.1%) | 274 (5.1%) |
| 70 to 74 Years | 191 (3.6%) | 397 (7.4%) |
| 75 to 79 Years | 161 (3.1%) | 236 (4.4%) |
| 80 to 84 Years | 89 (1.7%) | 92 (1.7%) |
| 85 Years and over | 115 (2.2%) | 97 (1.8%) |
| Total | 5,257 (100.0%) | 5,334 (100.0%) |
Families and Households in Lake Barcroft
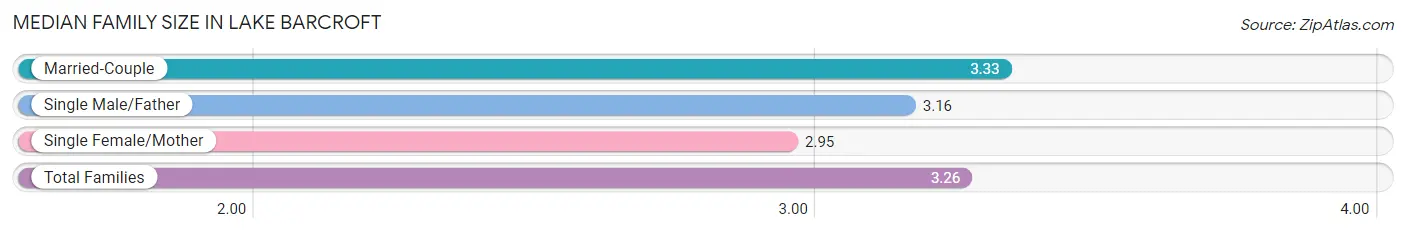
Median Family Size in Lake Barcroft
The median family size in Lake Barcroft is 3.26 persons per family, with married-couple families (2,126 | 77.7%) accounting for the largest median family size of 3.33 persons per family. On the other hand, single female/mother families (384 | 14.0%) represent the smallest median family size with 2.95 persons per family.
| Family Type | # Families | Family Size |
| Married-Couple | 2,126 (77.7%) | 3.33 |
| Single Male/Father | 225 (8.2%) | 3.16 |
| Single Female/Mother | 384 (14.0%) | 2.95 |
| Total Families | 2,735 (100.0%) | 3.26 |
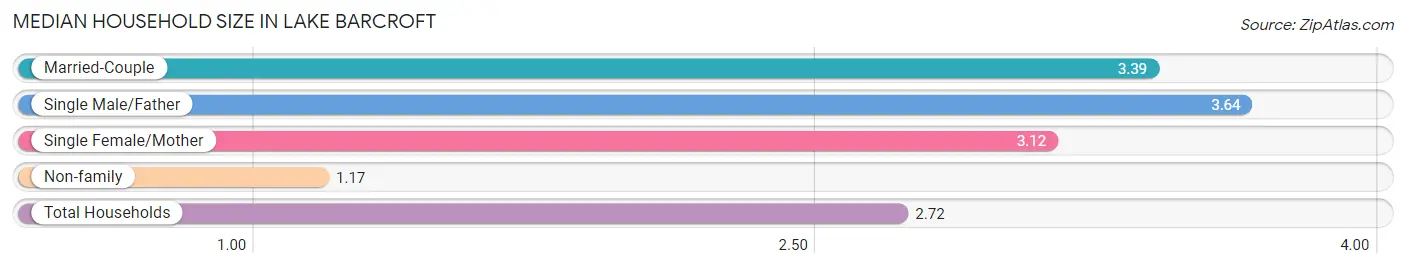
Median Household Size in Lake Barcroft
The median household size in Lake Barcroft is 2.72 persons per household, with single male/father households (225 | 5.8%) accounting for the largest median household size of 3.64 persons per household. non-family households (1,162 | 29.8%) represent the smallest median household size with 1.17 persons per household.
| Household Type | # Households | Household Size |
| Married-Couple | 2,126 (54.5%) | 3.39 |
| Single Male/Father | 225 (5.8%) | 3.64 |
| Single Female/Mother | 384 (9.9%) | 3.12 |
| Non-family | 1,162 (29.8%) | 1.17 |
| Total Households | 3,897 (100.0%) | 2.72 |
Household Size by Marriage Status in Lake Barcroft
Out of a total of 3,897 households in Lake Barcroft, 2,735 (70.2%) are family households, while 1,162 (29.8%) are nonfamily households. The most numerous type of family households are 2-person households, comprising 1,236, and the most common type of nonfamily households are 1-person households, comprising 994.
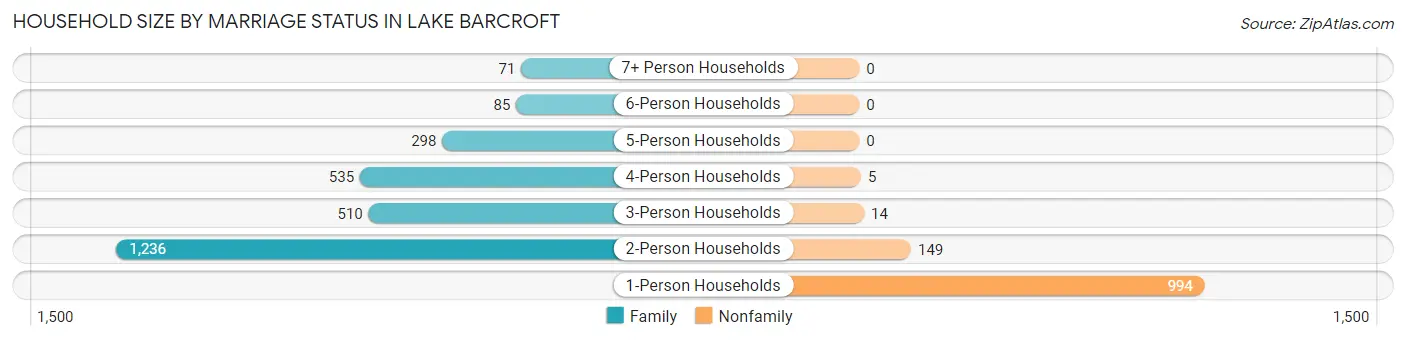
| Household Size | Family Households | Nonfamily Households |
| 1-Person Households | - | 994 (25.5%) |
| 2-Person Households | 1,236 (31.7%) | 149 (3.8%) |
| 3-Person Households | 510 (13.1%) | 14 (0.4%) |
| 4-Person Households | 535 (13.7%) | 5 (0.1%) |
| 5-Person Households | 298 (7.6%) | 0 (0.0%) |
| 6-Person Households | 85 (2.2%) | 0 (0.0%) |
| 7+ Person Households | 71 (1.8%) | 0 (0.0%) |
| Total | 2,735 (70.2%) | 1,162 (29.8%) |
Female Fertility in Lake Barcroft
Fertility by Age in Lake Barcroft
Average fertility rate in Lake Barcroft is 21.0 births per 1,000 women. Women in the age bracket of 35 to 50 years have the highest fertility rate with 33.0 births per 1,000 women. Women in the age bracket of 35 to 50 years acount for 79.2% of all women with births.
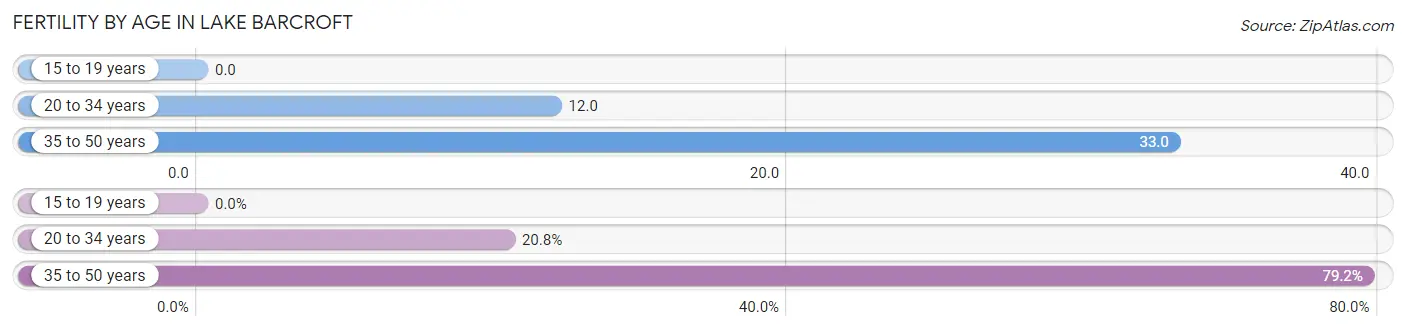
| Age Bracket | Women with Births | Births / 1,000 Women |
| 15 to 19 years | 0 (0.0%) | 0.0 |
| 20 to 34 years | 10 (20.8%) | 12.0 |
| 35 to 50 years | 38 (79.2%) | 33.0 |
| Total | 48 (100.0%) | 21.0 |
Fertility by Age by Marriage Status in Lake Barcroft
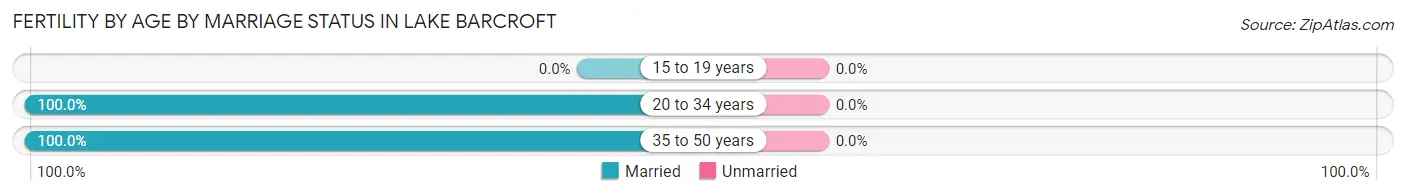
| Age Bracket | Married | Unmarried |
| 15 to 19 years | 0 (0.0%) | 0 (0.0%) |
| 20 to 34 years | 10 (100.0%) | 0 (0.0%) |
| 35 to 50 years | 38 (100.0%) | 0 (0.0%) |
| Total | 48 (100.0%) | 0 (0.0%) |
Fertility by Education in Lake Barcroft
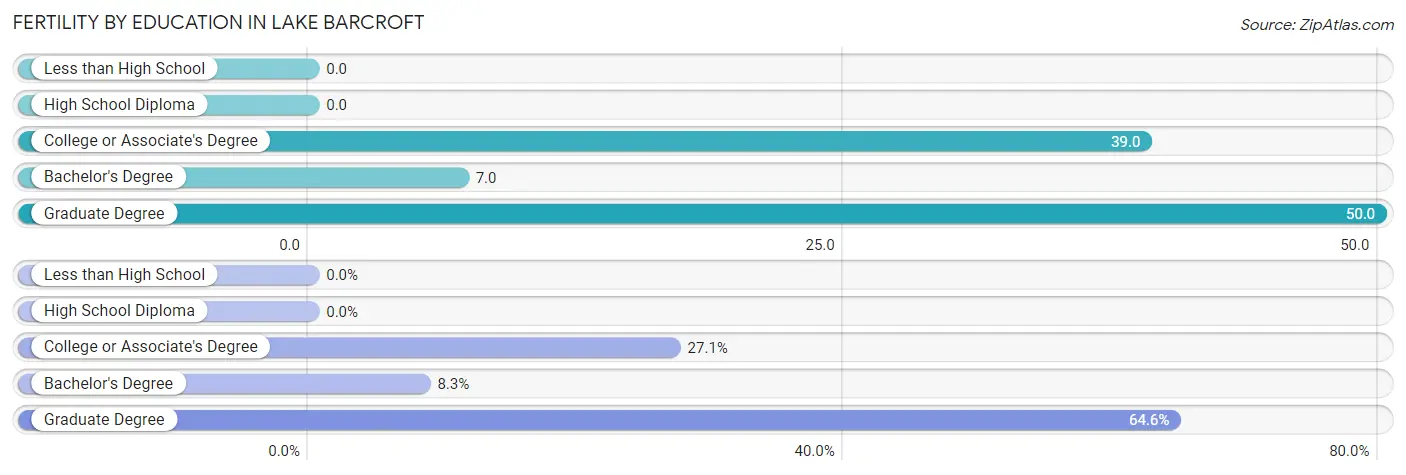
| Educational Attainment | Women with Births | Births / 1,000 Women |
| Less than High School | 0 (0.0%) | 0.0 |
| High School Diploma | 0 (0.0%) | 0.0 |
| College or Associate's Degree | 13 (27.1%) | 39.0 |
| Bachelor's Degree | 4 (8.3%) | 7.0 |
| Graduate Degree | 31 (64.6%) | 50.0 |
| Total | 48 (100.0%) | 21.0 |
Fertility by Education by Marriage Status in Lake Barcroft
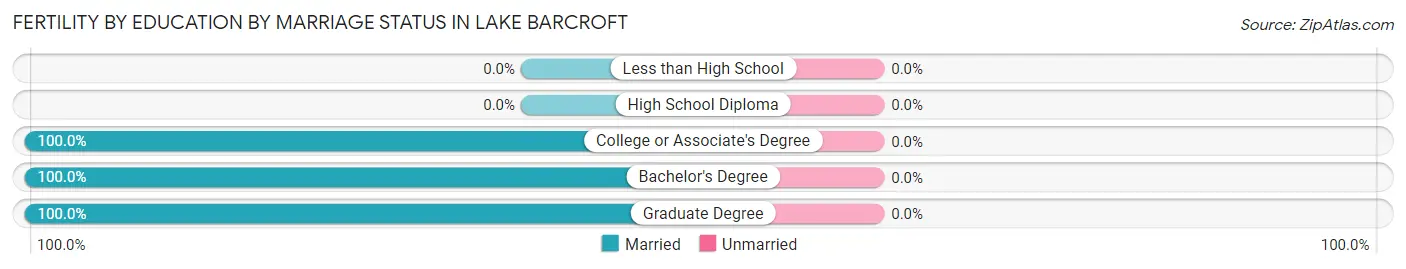
| Educational Attainment | Married | Unmarried |
| Less than High School | 0 (0.0%) | 0 (0.0%) |
| High School Diploma | 0 (0.0%) | 0 (0.0%) |
| College or Associate's Degree | 13 (100.0%) | 0 (0.0%) |
| Bachelor's Degree | 4 (100.0%) | 0 (0.0%) |
| Graduate Degree | 31 (100.0%) | 0 (0.0%) |
| Total | 48 (100.0%) | 0 (0.0%) |
Employment Characteristics in Lake Barcroft
Employment by Class of Employer in Lake Barcroft
Among the 5,692 employed individuals in Lake Barcroft, private company employees (3,144 | 55.2%), federal government employees (933 | 16.4%), and not-for-profit organizations (527 | 9.3%) make up the most common classes of employment.
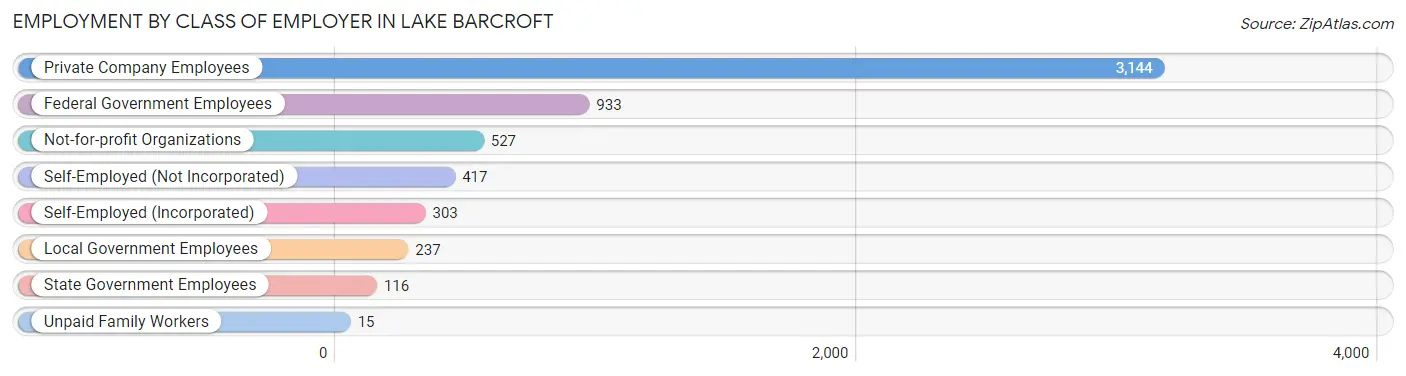
| Employer Class | # Employees | % Employees |
| Private Company Employees | 3,144 | 55.2% |
| Self-Employed (Incorporated) | 303 | 5.3% |
| Self-Employed (Not Incorporated) | 417 | 7.3% |
| Not-for-profit Organizations | 527 | 9.3% |
| Local Government Employees | 237 | 4.2% |
| State Government Employees | 116 | 2.0% |
| Federal Government Employees | 933 | 16.4% |
| Unpaid Family Workers | 15 | 0.3% |
| Total | 5,692 | 100.0% |
Employment Status by Age in Lake Barcroft
According to the labor force statistics for Lake Barcroft, out of the total population over 16 years of age (8,727), 69.5% or 6,065 individuals are in the labor force, with 5.2% or 315 of them unemployed. The age group with the highest labor force participation rate is 25 to 29 years, with 94.7% or 593 individuals in the labor force. Within the labor force, the 16 to 19 years age range has the highest percentage of unemployed individuals, with 21.8% or 45 of them being unemployed.
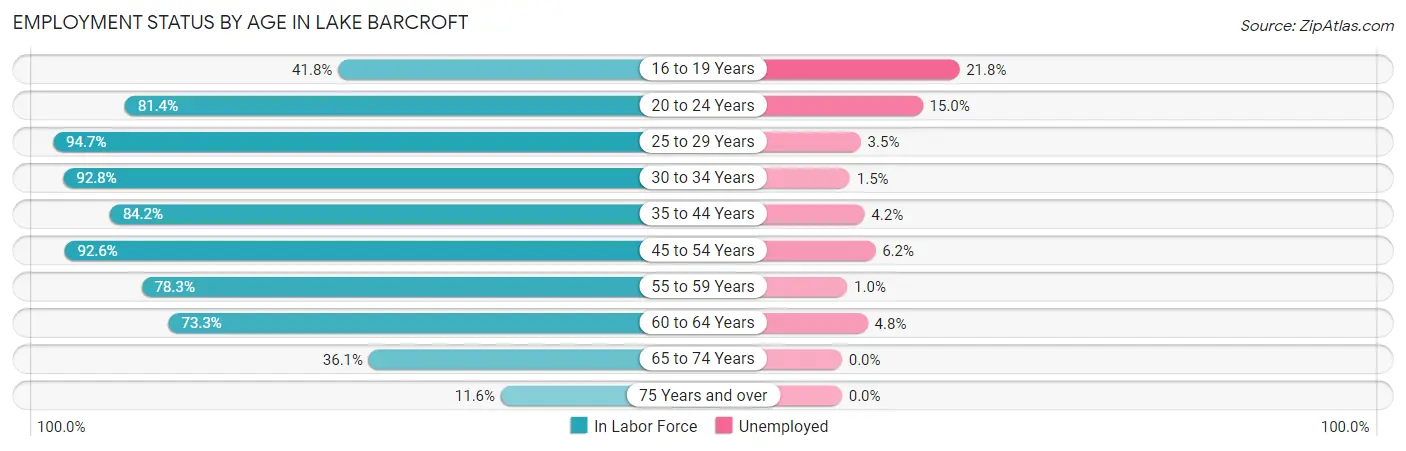
| Age Bracket | In Labor Force | Unemployed |
| 16 to 19 Years | 206 (41.8%) | 45 (21.8%) |
| 20 to 24 Years | 454 (81.4%) | 68 (15.0%) |
| 25 to 29 Years | 593 (94.7%) | 21 (3.5%) |
| 30 to 34 Years | 389 (92.8%) | 6 (1.5%) |
| 35 to 44 Years | 1,185 (84.2%) | 50 (4.2%) |
| 45 to 54 Years | 1,618 (92.6%) | 100 (6.2%) |
| 55 to 59 Years | 611 (78.3%) | 6 (1.0%) |
| 60 to 64 Years | 456 (73.3%) | 22 (4.8%) |
| 65 to 74 Years | 464 (36.1%) | 0 (0.0%) |
| 75 Years and over | 92 (11.6%) | 0 (0.0%) |
| Total | 6,065 (69.5%) | 315 (5.2%) |
Employment Status by Educational Attainment in Lake Barcroft
According to labor force statistics for Lake Barcroft, 86.6% of individuals (4,850) out of the total population between 25 and 64 years of age (5,601) are in the labor force, with 4.2% or 204 of them being unemployed. The group with the highest labor force participation rate are those with the educational attainment of college / associate degree, with 88.5% or 810 individuals in the labor force. Within the labor force, individuals with less than high school education have the highest percentage of unemployment, with 7.5% or 32 of them being unemployed.
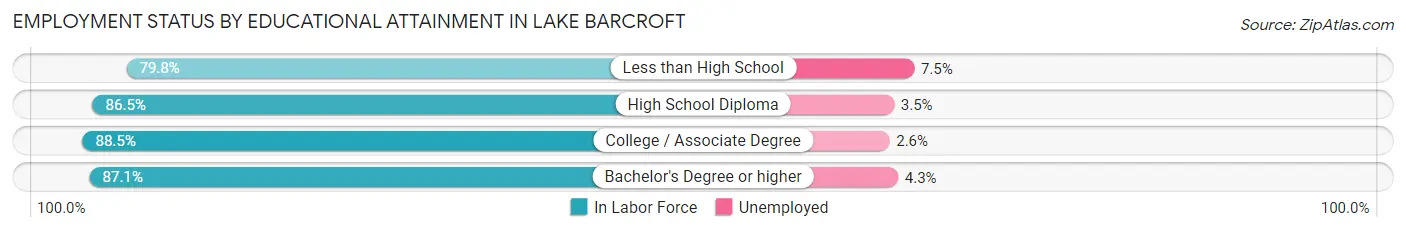
| Educational Attainment | In Labor Force | Unemployed |
| Less than High School | 427 (79.8%) | 40 (7.5%) |
| High School Diploma | 461 (86.5%) | 19 (3.5%) |
| College / Associate Degree | 810 (88.5%) | 24 (2.6%) |
| Bachelor's Degree or higher | 3,151 (87.1%) | 156 (4.3%) |
| Total | 4,850 (86.6%) | 235 (4.2%) |
Employment Occupations by Sex in Lake Barcroft
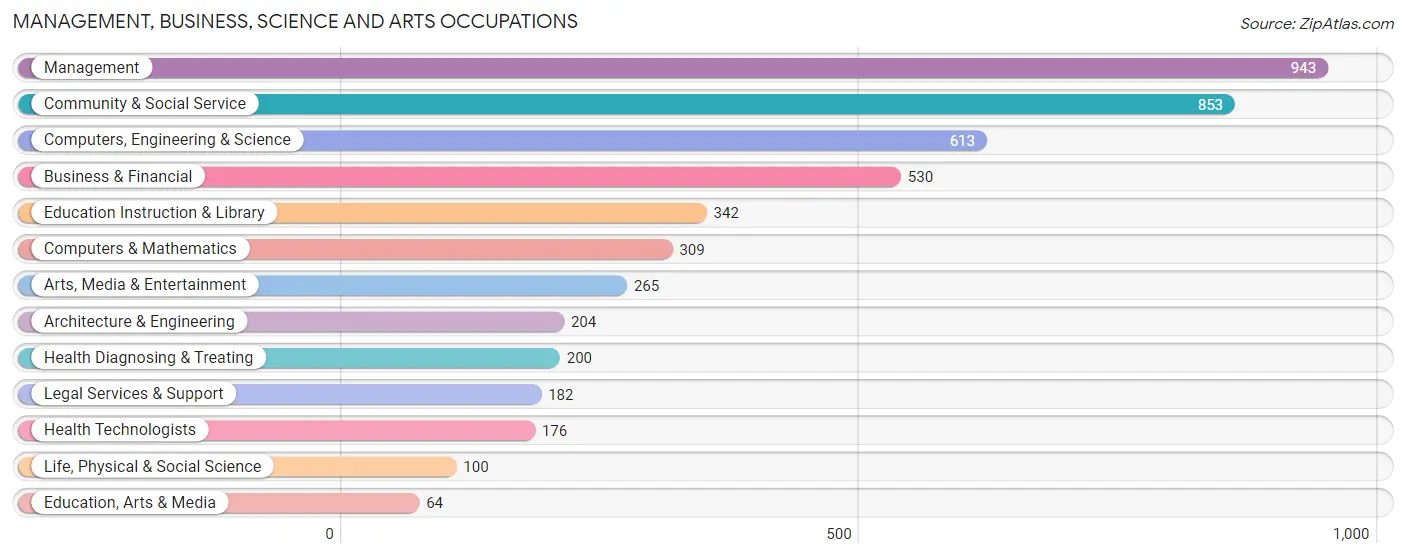
Management, Business, Science and Arts Occupations
The most common Management, Business, Science and Arts occupations in Lake Barcroft are Management (943 | 16.5%), Community & Social Service (853 | 14.9%), Computers, Engineering & Science (613 | 10.7%), Business & Financial (530 | 9.2%), and Education Instruction & Library (342 | 6.0%).
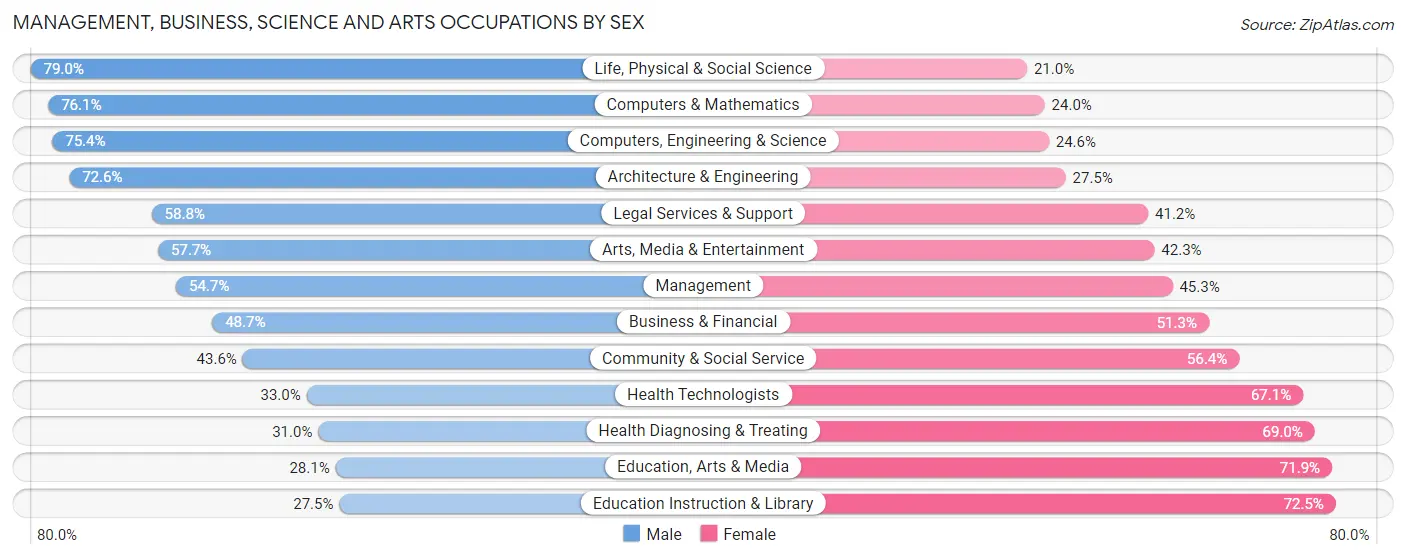
Management, Business, Science and Arts Occupations by Sex
Within the Management, Business, Science and Arts occupations in Lake Barcroft, the most male-oriented occupations are Life, Physical & Social Science (79.0%), Computers & Mathematics (76.0%), and Computers, Engineering & Science (75.4%), while the most female-oriented occupations are Education Instruction & Library (72.5%), Education, Arts & Media (71.9%), and Health Diagnosing & Treating (69.0%).
| Occupation | Male | Female |
| Management | 516 (54.7%) | 427 (45.3%) |
| Business & Financial | 258 (48.7%) | 272 (51.3%) |
| Computers, Engineering & Science | 462 (75.4%) | 151 (24.6%) |
| Computers & Mathematics | 235 (76.0%) | 74 (23.9%) |
| Architecture & Engineering | 148 (72.6%) | 56 (27.5%) |
| Life, Physical & Social Science | 79 (79.0%) | 21 (21.0%) |
| Community & Social Service | 372 (43.6%) | 481 (56.4%) |
| Education, Arts & Media | 18 (28.1%) | 46 (71.9%) |
| Legal Services & Support | 107 (58.8%) | 75 (41.2%) |
| Education Instruction & Library | 94 (27.5%) | 248 (72.5%) |
| Arts, Media & Entertainment | 153 (57.7%) | 112 (42.3%) |
| Health Diagnosing & Treating | 62 (31.0%) | 138 (69.0%) |
| Health Technologists | 58 (33.0%) | 118 (67.0%) |
| Total (Category) | 1,670 (53.2%) | 1,469 (46.8%) |
| Total (Overall) | 3,067 (53.5%) | 2,661 (46.5%) |
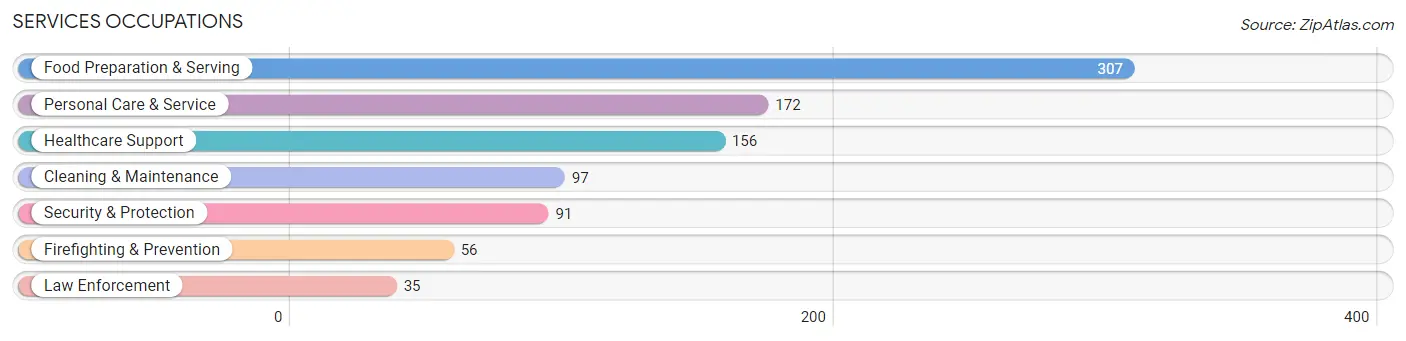
Services Occupations
The most common Services occupations in Lake Barcroft are Food Preparation & Serving (307 | 5.4%), Personal Care & Service (172 | 3.0%), Healthcare Support (156 | 2.7%), Cleaning & Maintenance (97 | 1.7%), and Security & Protection (91 | 1.6%).
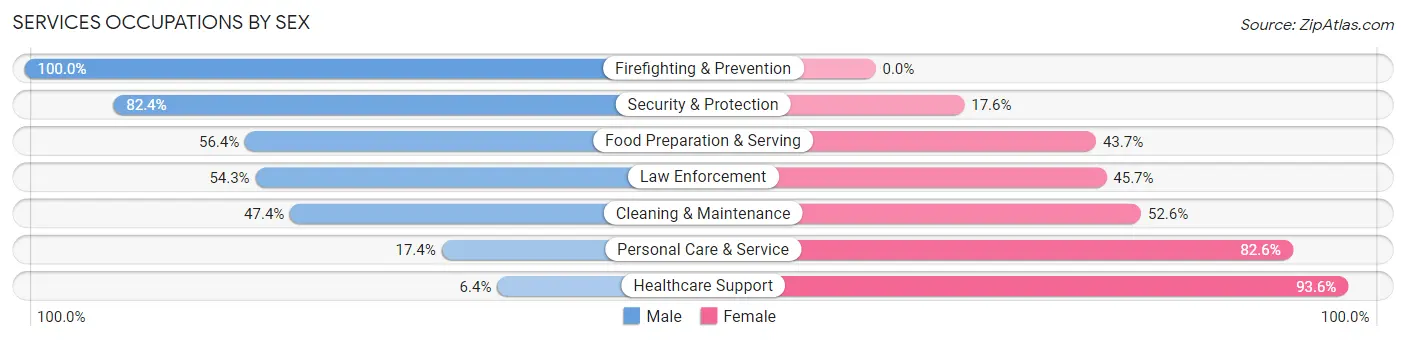
Services Occupations by Sex
Within the Services occupations in Lake Barcroft, the most male-oriented occupations are Firefighting & Prevention (100.0%), Security & Protection (82.4%), and Food Preparation & Serving (56.4%), while the most female-oriented occupations are Healthcare Support (93.6%), Personal Care & Service (82.6%), and Cleaning & Maintenance (52.6%).
| Occupation | Male | Female |
| Healthcare Support | 10 (6.4%) | 146 (93.6%) |
| Security & Protection | 75 (82.4%) | 16 (17.6%) |
| Firefighting & Prevention | 56 (100.0%) | 0 (0.0%) |
| Law Enforcement | 19 (54.3%) | 16 (45.7%) |
| Food Preparation & Serving | 173 (56.4%) | 134 (43.6%) |
| Cleaning & Maintenance | 46 (47.4%) | 51 (52.6%) |
| Personal Care & Service | 30 (17.4%) | 142 (82.6%) |
| Total (Category) | 334 (40.6%) | 489 (59.4%) |
| Total (Overall) | 3,067 (53.5%) | 2,661 (46.5%) |
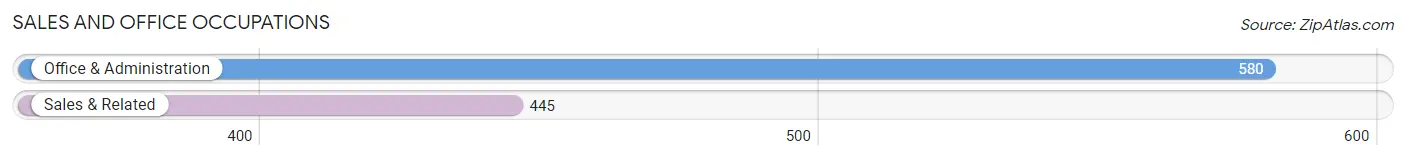
Sales and Office Occupations
The most common Sales and Office occupations in Lake Barcroft are Office & Administration (580 | 10.1%), and Sales & Related (445 | 7.8%).
Sales and Office Occupations by Sex
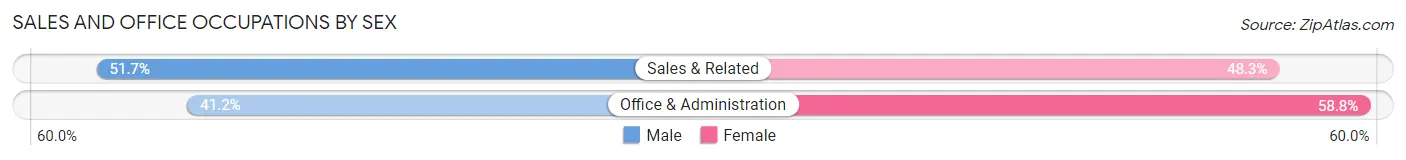
| Occupation | Male | Female |
| Sales & Related | 230 (51.7%) | 215 (48.3%) |
| Office & Administration | 239 (41.2%) | 341 (58.8%) |
| Total (Category) | 469 (45.8%) | 556 (54.2%) |
| Total (Overall) | 3,067 (53.5%) | 2,661 (46.5%) |
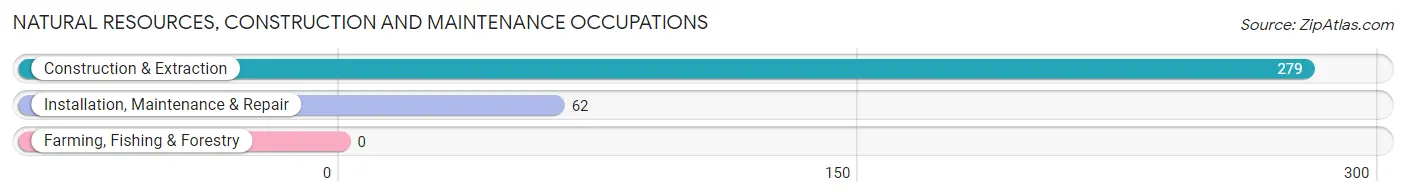
Natural Resources, Construction and Maintenance Occupations
The most common Natural Resources, Construction and Maintenance occupations in Lake Barcroft are Construction & Extraction (279 | 4.9%), and Installation, Maintenance & Repair (62 | 1.1%).
Natural Resources, Construction and Maintenance Occupations by Sex
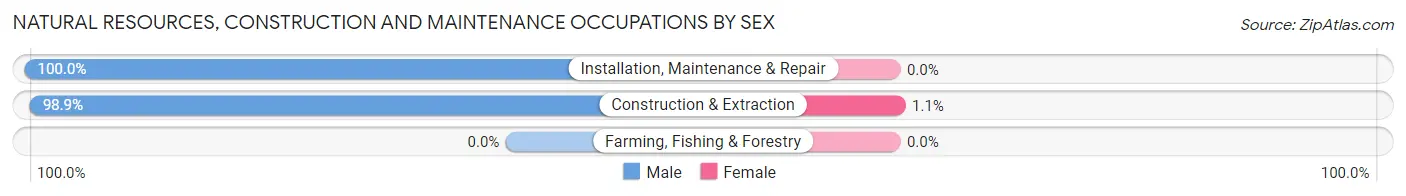
| Occupation | Male | Female |
| Farming, Fishing & Forestry | 0 (0.0%) | 0 (0.0%) |
| Construction & Extraction | 276 (98.9%) | 3 (1.1%) |
| Installation, Maintenance & Repair | 62 (100.0%) | 0 (0.0%) |
| Total (Category) | 338 (99.1%) | 3 (0.9%) |
| Total (Overall) | 3,067 (53.5%) | 2,661 (46.5%) |
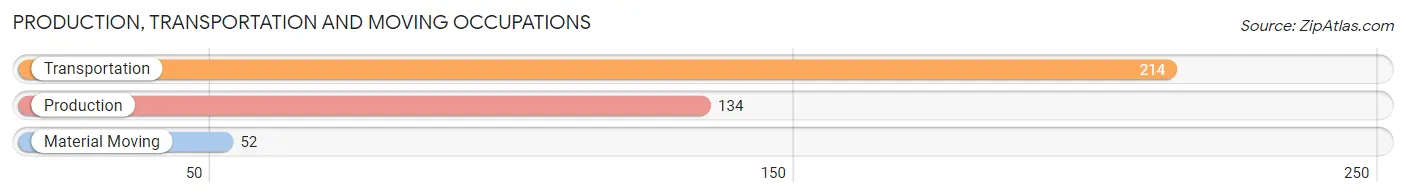
Production, Transportation and Moving Occupations
The most common Production, Transportation and Moving occupations in Lake Barcroft are Transportation (214 | 3.7%), Production (134 | 2.3%), and Material Moving (52 | 0.9%).
Production, Transportation and Moving Occupations by Sex
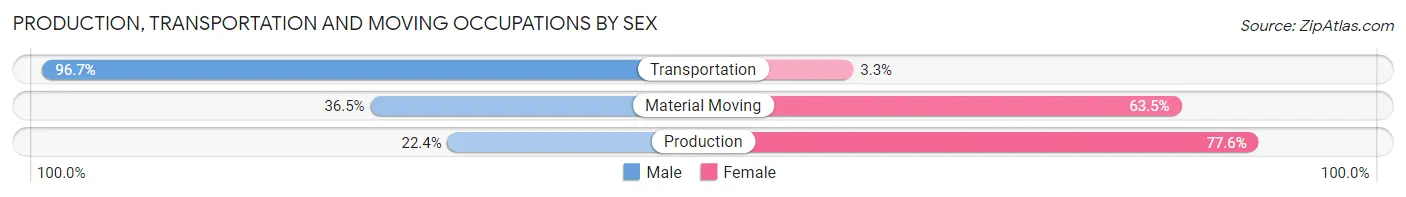
| Occupation | Male | Female |
| Production | 30 (22.4%) | 104 (77.6%) |
| Transportation | 207 (96.7%) | 7 (3.3%) |
| Material Moving | 19 (36.5%) | 33 (63.5%) |
| Total (Category) | 256 (64.0%) | 144 (36.0%) |
| Total (Overall) | 3,067 (53.5%) | 2,661 (46.5%) |
Employment Industries by Sex in Lake Barcroft
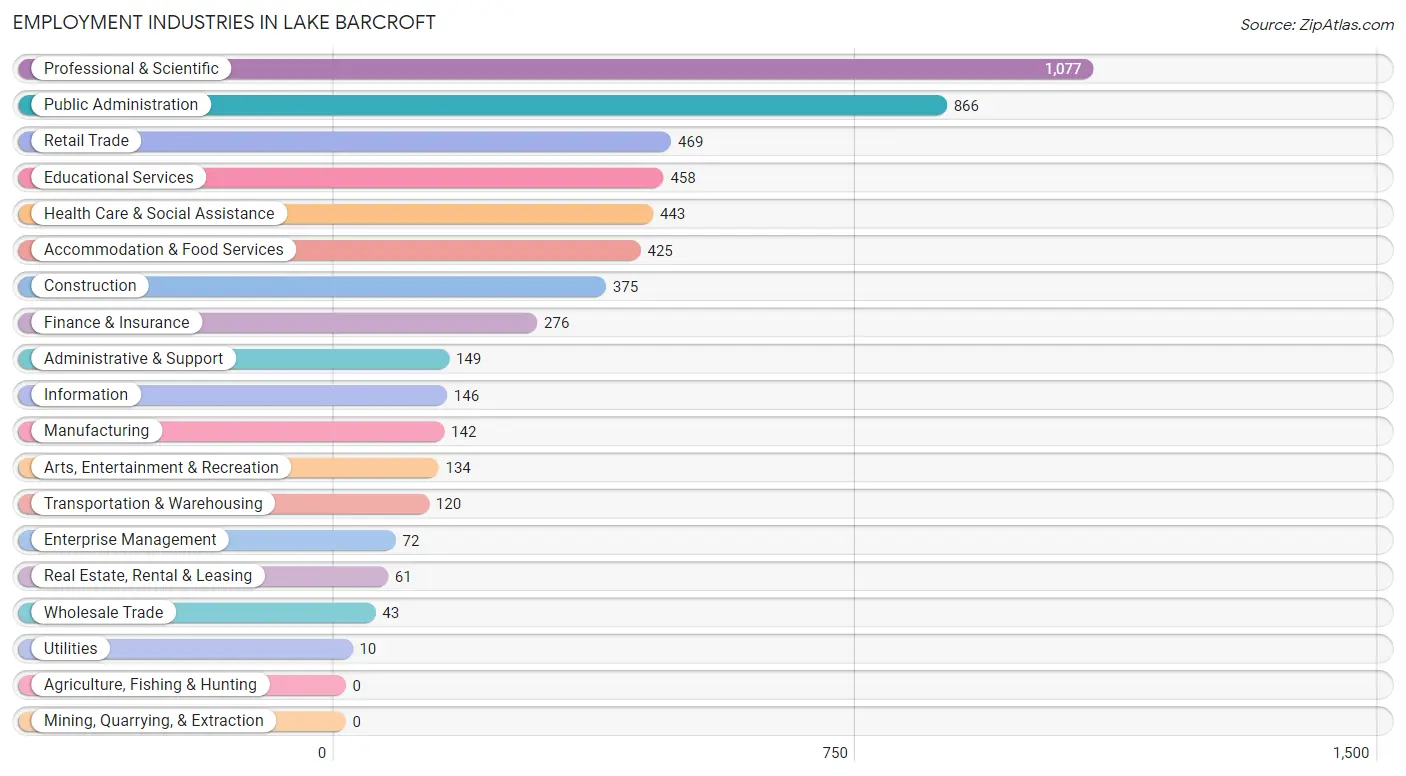
Employment Industries in Lake Barcroft
The major employment industries in Lake Barcroft include Professional & Scientific (1,077 | 18.8%), Public Administration (866 | 15.1%), Retail Trade (469 | 8.2%), Educational Services (458 | 8.0%), and Health Care & Social Assistance (443 | 7.7%).
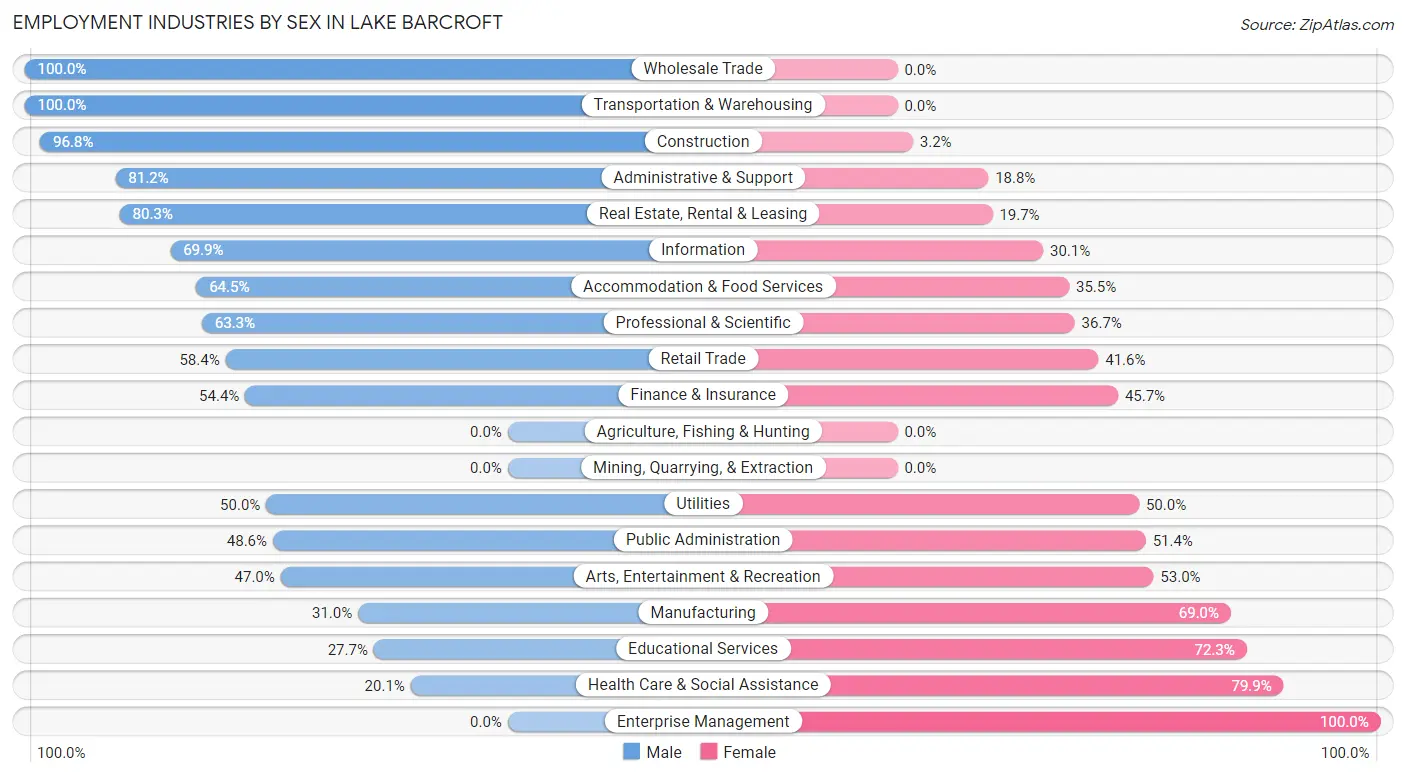
Employment Industries by Sex in Lake Barcroft
The Lake Barcroft industries that see more men than women are Wholesale Trade (100.0%), Transportation & Warehousing (100.0%), and Construction (96.8%), whereas the industries that tend to have a higher number of women are Enterprise Management (100.0%), Health Care & Social Assistance (79.9%), and Educational Services (72.3%).
| Industry | Male | Female |
| Agriculture, Fishing & Hunting | 0 (0.0%) | 0 (0.0%) |
| Mining, Quarrying, & Extraction | 0 (0.0%) | 0 (0.0%) |
| Construction | 363 (96.8%) | 12 (3.2%) |
| Manufacturing | 44 (31.0%) | 98 (69.0%) |
| Wholesale Trade | 43 (100.0%) | 0 (0.0%) |
| Retail Trade | 274 (58.4%) | 195 (41.6%) |
| Transportation & Warehousing | 120 (100.0%) | 0 (0.0%) |
| Utilities | 5 (50.0%) | 5 (50.0%) |
| Information | 102 (69.9%) | 44 (30.1%) |
| Finance & Insurance | 150 (54.3%) | 126 (45.7%) |
| Real Estate, Rental & Leasing | 49 (80.3%) | 12 (19.7%) |
| Professional & Scientific | 682 (63.3%) | 395 (36.7%) |
| Enterprise Management | 0 (0.0%) | 72 (100.0%) |
| Administrative & Support | 121 (81.2%) | 28 (18.8%) |
| Educational Services | 127 (27.7%) | 331 (72.3%) |
| Health Care & Social Assistance | 89 (20.1%) | 354 (79.9%) |
| Arts, Entertainment & Recreation | 63 (47.0%) | 71 (53.0%) |
| Accommodation & Food Services | 274 (64.5%) | 151 (35.5%) |
| Public Administration | 421 (48.6%) | 445 (51.4%) |
| Total | 3,067 (53.5%) | 2,661 (46.5%) |
Education in Lake Barcroft
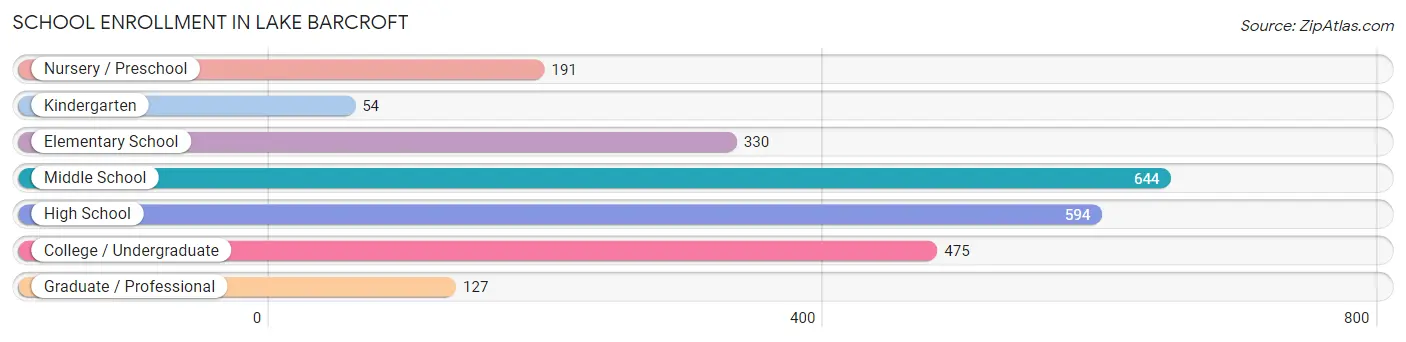
School Enrollment in Lake Barcroft
The most common levels of schooling among the 2,415 students in Lake Barcroft are middle school (644 | 26.7%), high school (594 | 24.6%), and college / undergraduate (475 | 19.7%).
| School Level | # Students | % Students |
| Nursery / Preschool | 191 | 7.9% |
| Kindergarten | 54 | 2.2% |
| Elementary School | 330 | 13.7% |
| Middle School | 644 | 26.7% |
| High School | 594 | 24.6% |
| College / Undergraduate | 475 | 19.7% |
| Graduate / Professional | 127 | 5.3% |
| Total | 2,415 | 100.0% |
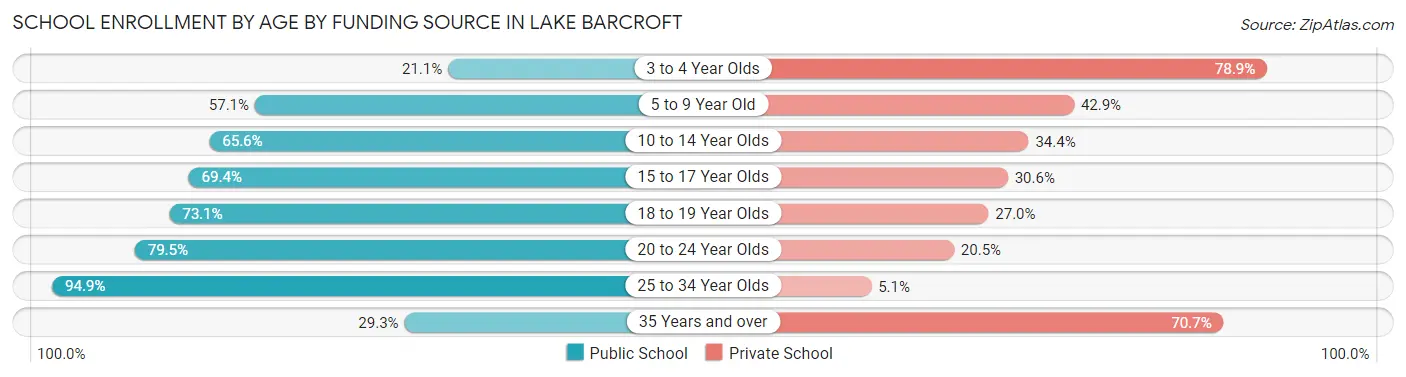
School Enrollment by Age by Funding Source in Lake Barcroft
Out of a total of 2,415 students who are enrolled in schools in Lake Barcroft, 925 (38.3%) attend a private institution, while the remaining 1,490 (61.7%) are enrolled in public schools. The age group of 3 to 4 year olds has the highest likelihood of being enrolled in private schools, with 112 (78.9% in the age bracket) enrolled. Conversely, the age group of 25 to 34 year olds has the lowest likelihood of being enrolled in a private school, with 111 (94.9% in the age bracket) attending a public institution.
| Age Bracket | Public School | Private School |
| 3 to 4 Year Olds | 30 (21.1%) | 112 (78.9%) |
| 5 to 9 Year Old | 229 (57.1%) | 172 (42.9%) |
| 10 to 14 Year Olds | 524 (65.6%) | 275 (34.4%) |
| 15 to 17 Year Olds | 275 (69.4%) | 121 (30.6%) |
| 18 to 19 Year Olds | 103 (73.1%) | 38 (27.0%) |
| 20 to 24 Year Olds | 151 (79.5%) | 39 (20.5%) |
| 25 to 34 Year Olds | 111 (94.9%) | 6 (5.1%) |
| 35 Years and over | 67 (29.3%) | 162 (70.7%) |
| Total | 1,490 (61.7%) | 925 (38.3%) |
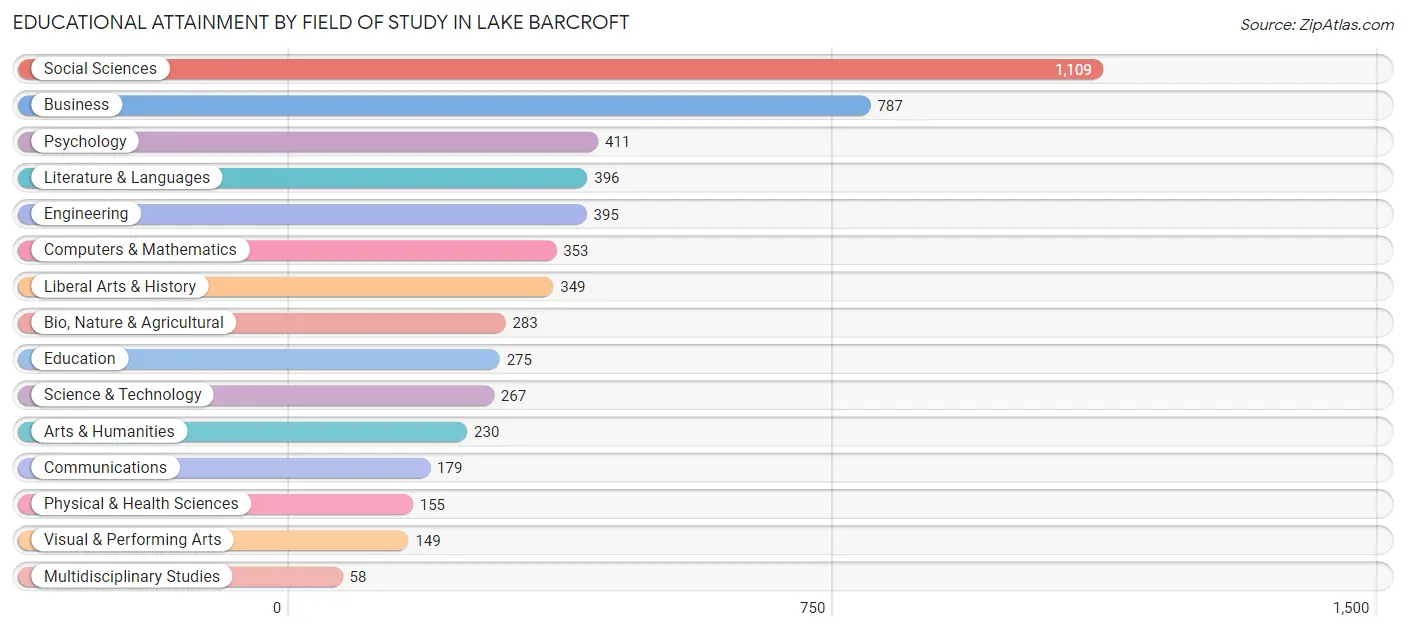
Educational Attainment by Field of Study in Lake Barcroft
Social sciences (1,109 | 20.5%), business (787 | 14.6%), psychology (411 | 7.6%), literature & languages (396 | 7.3%), and engineering (395 | 7.3%) are the most common fields of study among 5,396 individuals in Lake Barcroft who have obtained a bachelor's degree or higher.
| Field of Study | # Graduates | % Graduates |
| Computers & Mathematics | 353 | 6.5% |
| Bio, Nature & Agricultural | 283 | 5.2% |
| Physical & Health Sciences | 155 | 2.9% |
| Psychology | 411 | 7.6% |
| Social Sciences | 1,109 | 20.5% |
| Engineering | 395 | 7.3% |
| Multidisciplinary Studies | 58 | 1.1% |
| Science & Technology | 267 | 5.0% |
| Business | 787 | 14.6% |
| Education | 275 | 5.1% |
| Literature & Languages | 396 | 7.3% |
| Liberal Arts & History | 349 | 6.5% |
| Visual & Performing Arts | 149 | 2.8% |
| Communications | 179 | 3.3% |
| Arts & Humanities | 230 | 4.3% |
| Total | 5,396 | 100.0% |
Transportation & Commute in Lake Barcroft
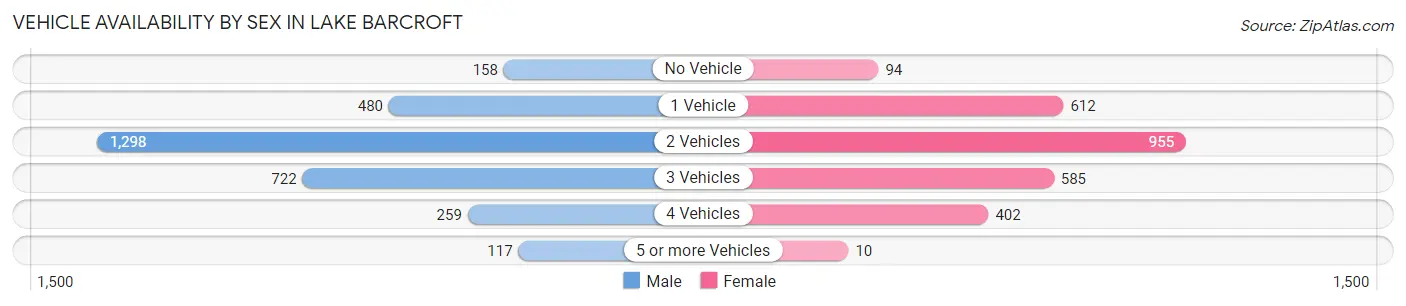
Vehicle Availability by Sex in Lake Barcroft
The most prevalent vehicle ownership categories in Lake Barcroft are males with 2 vehicles (1,298, accounting for 42.8%) and females with 2 vehicles (955, making up 48.8%).
| Vehicles Available | Male | Female |
| No Vehicle | 158 (5.2%) | 94 (3.5%) |
| 1 Vehicle | 480 (15.8%) | 612 (23.0%) |
| 2 Vehicles | 1,298 (42.8%) | 955 (35.9%) |
| 3 Vehicles | 722 (23.8%) | 585 (22.0%) |
| 4 Vehicles | 259 (8.5%) | 402 (15.1%) |
| 5 or more Vehicles | 117 (3.9%) | 10 (0.4%) |
| Total | 3,034 (100.0%) | 2,658 (100.0%) |
Commute Time in Lake Barcroft
The most frequently occuring commute durations in Lake Barcroft are 20 to 24 minutes (779 commuters, 18.0%), 30 to 34 minutes (690 commuters, 16.0%), and 45 to 59 minutes (611 commuters, 14.1%).
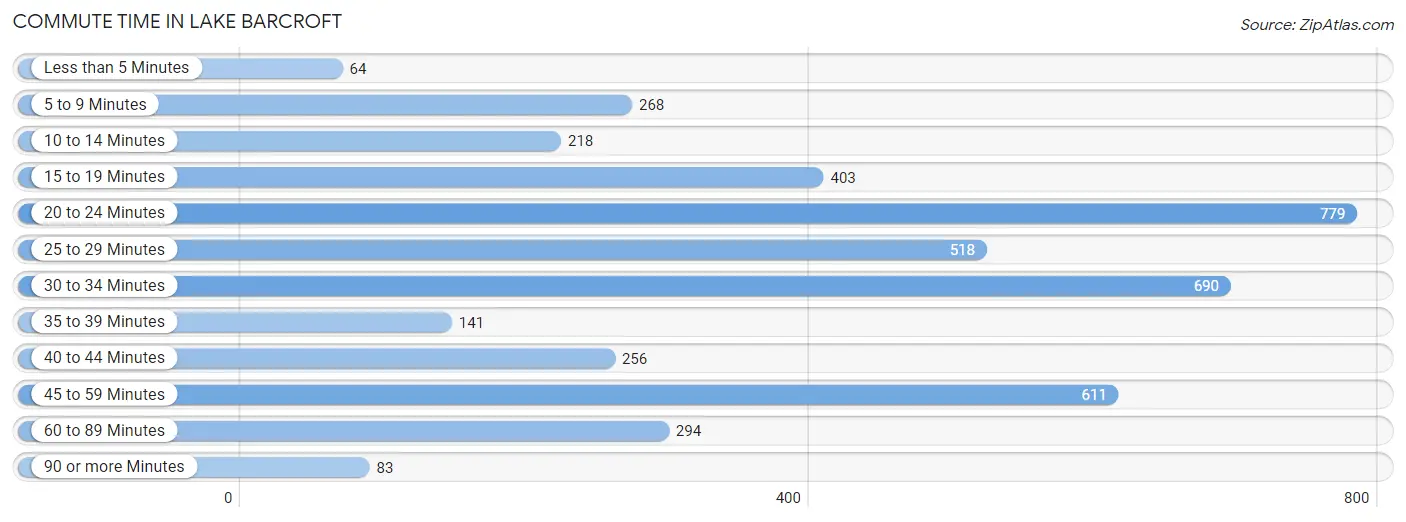
| Commute Time | # Commuters | % Commuters |
| Less than 5 Minutes | 64 | 1.5% |
| 5 to 9 Minutes | 268 | 6.2% |
| 10 to 14 Minutes | 218 | 5.0% |
| 15 to 19 Minutes | 403 | 9.3% |
| 20 to 24 Minutes | 779 | 18.0% |
| 25 to 29 Minutes | 518 | 12.0% |
| 30 to 34 Minutes | 690 | 16.0% |
| 35 to 39 Minutes | 141 | 3.3% |
| 40 to 44 Minutes | 256 | 5.9% |
| 45 to 59 Minutes | 611 | 14.1% |
| 60 to 89 Minutes | 294 | 6.8% |
| 90 or more Minutes | 83 | 1.9% |
Commute Time by Sex in Lake Barcroft
The most common commute times in Lake Barcroft are 45 to 59 minutes (421 commuters, 17.6%) for males and 20 to 24 minutes (376 commuters, 19.4%) for females.
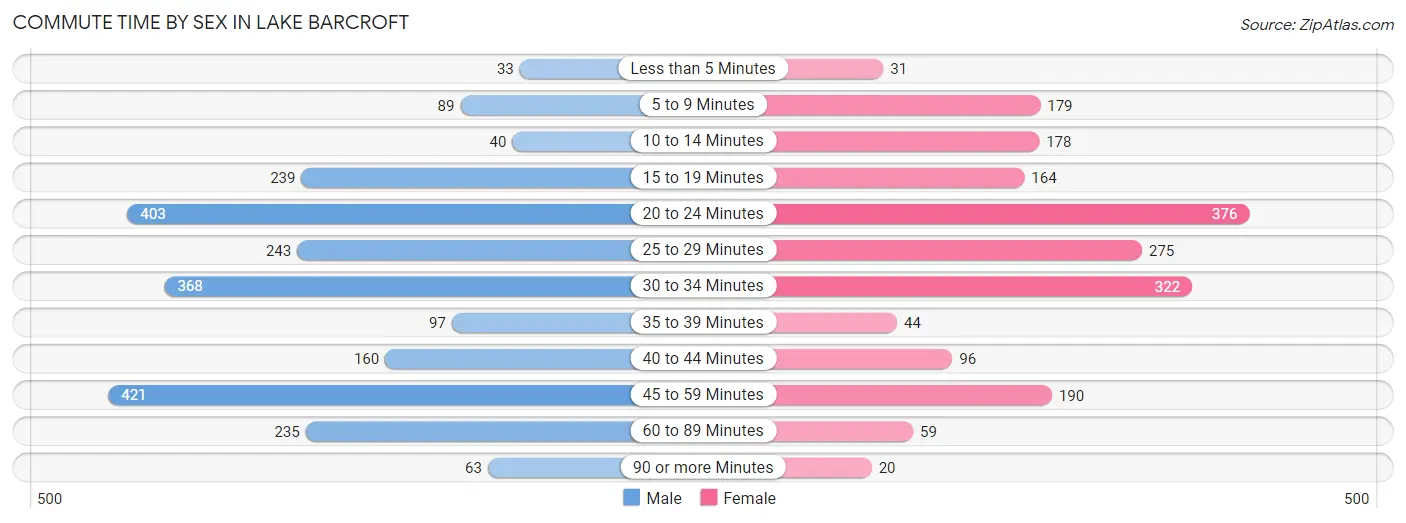
| Commute Time | Male | Female |
| Less than 5 Minutes | 33 (1.4%) | 31 (1.6%) |
| 5 to 9 Minutes | 89 (3.7%) | 179 (9.3%) |
| 10 to 14 Minutes | 40 (1.7%) | 178 (9.2%) |
| 15 to 19 Minutes | 239 (10.0%) | 164 (8.5%) |
| 20 to 24 Minutes | 403 (16.9%) | 376 (19.4%) |
| 25 to 29 Minutes | 243 (10.2%) | 275 (14.2%) |
| 30 to 34 Minutes | 368 (15.4%) | 322 (16.7%) |
| 35 to 39 Minutes | 97 (4.1%) | 44 (2.3%) |
| 40 to 44 Minutes | 160 (6.7%) | 96 (5.0%) |
| 45 to 59 Minutes | 421 (17.6%) | 190 (9.8%) |
| 60 to 89 Minutes | 235 (9.8%) | 59 (3.0%) |
| 90 or more Minutes | 63 (2.6%) | 20 (1.0%) |
Time of Departure to Work by Sex in Lake Barcroft
The most frequent times of departure to work in Lake Barcroft are 7:00 AM to 7:29 AM (308, 12.9%) for males and 9:00 AM to 9:59 AM (299, 15.5%) for females.
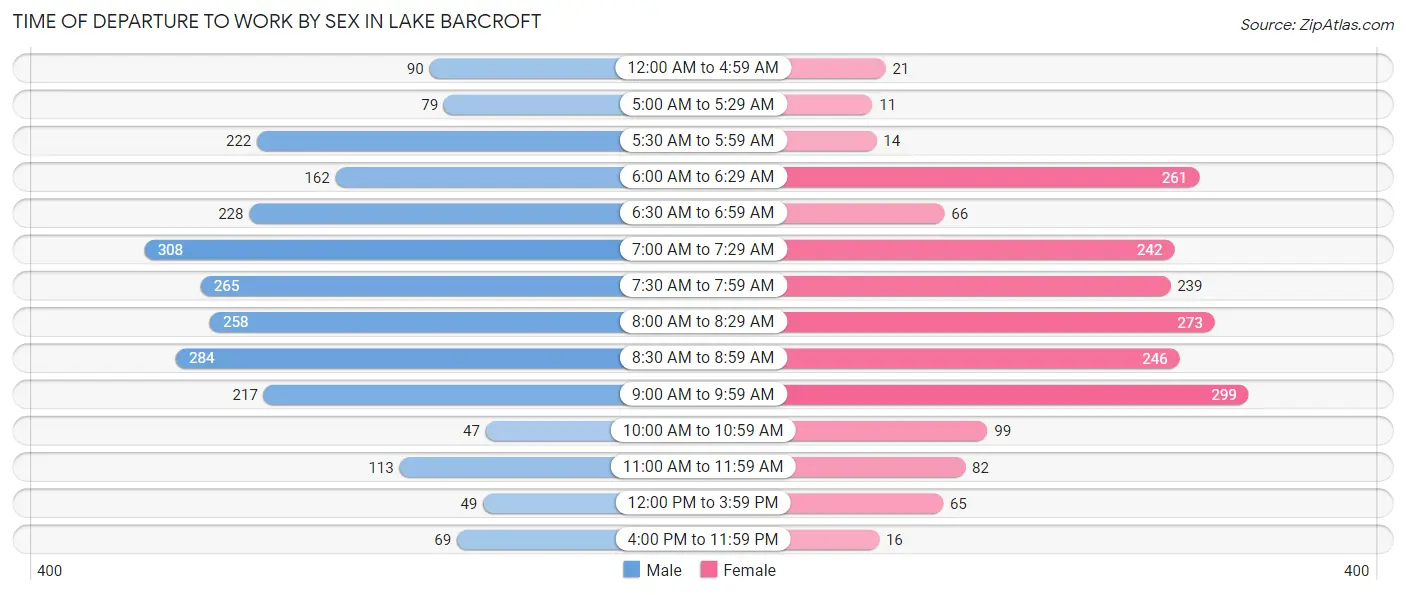
| Time of Departure | Male | Female |
| 12:00 AM to 4:59 AM | 90 (3.8%) | 21 (1.1%) |
| 5:00 AM to 5:29 AM | 79 (3.3%) | 11 (0.6%) |
| 5:30 AM to 5:59 AM | 222 (9.3%) | 14 (0.7%) |
| 6:00 AM to 6:29 AM | 162 (6.8%) | 261 (13.5%) |
| 6:30 AM to 6:59 AM | 228 (9.5%) | 66 (3.4%) |
| 7:00 AM to 7:29 AM | 308 (12.9%) | 242 (12.5%) |
| 7:30 AM to 7:59 AM | 265 (11.1%) | 239 (12.4%) |
| 8:00 AM to 8:29 AM | 258 (10.8%) | 273 (14.1%) |
| 8:30 AM to 8:59 AM | 284 (11.9%) | 246 (12.7%) |
| 9:00 AM to 9:59 AM | 217 (9.1%) | 299 (15.5%) |
| 10:00 AM to 10:59 AM | 47 (2.0%) | 99 (5.1%) |
| 11:00 AM to 11:59 AM | 113 (4.7%) | 82 (4.2%) |
| 12:00 PM to 3:59 PM | 49 (2.1%) | 65 (3.4%) |
| 4:00 PM to 11:59 PM | 69 (2.9%) | 16 (0.8%) |
| Total | 2,391 (100.0%) | 1,934 (100.0%) |
Housing Occupancy in Lake Barcroft
Occupancy by Ownership in Lake Barcroft
Of the total 3,897 dwellings in Lake Barcroft, owner-occupied units account for 2,685 (68.9%), while renter-occupied units make up 1,212 (31.1%).
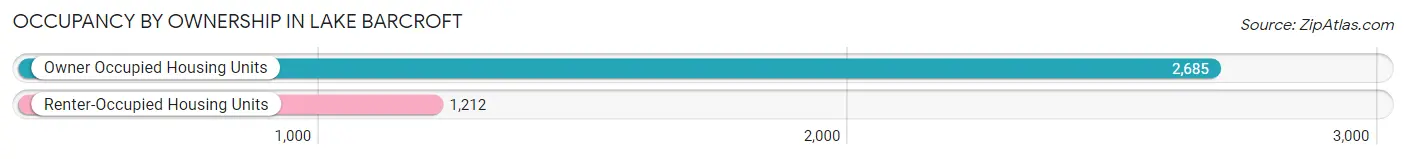
| Occupancy | # Housing Units | % Housing Units |
| Owner Occupied Housing Units | 2,685 | 68.9% |
| Renter-Occupied Housing Units | 1,212 | 31.1% |
| Total Occupied Housing Units | 3,897 | 100.0% |
Occupancy by Household Size in Lake Barcroft
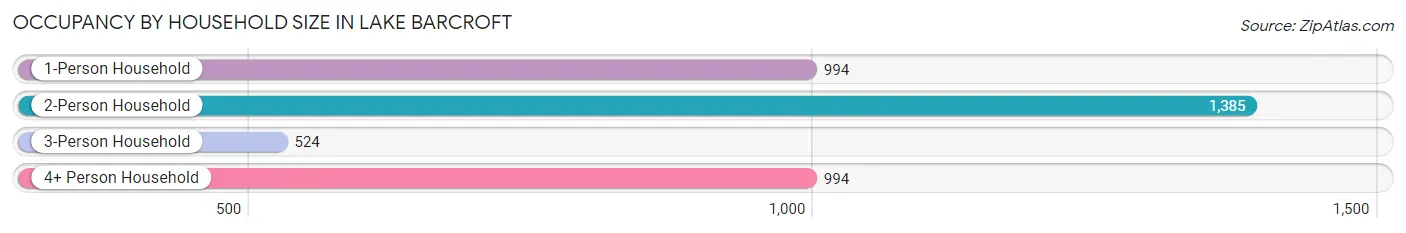
| Household Size | # Housing Units | % Housing Units |
| 1-Person Household | 994 | 25.5% |
| 2-Person Household | 1,385 | 35.5% |
| 3-Person Household | 524 | 13.5% |
| 4+ Person Household | 994 | 25.5% |
| Total Housing Units | 3,897 | 100.0% |
Occupancy by Ownership by Household Size in Lake Barcroft
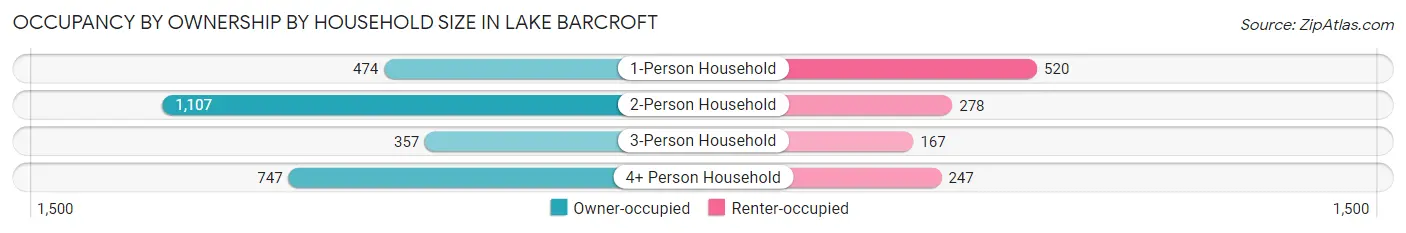
| Household Size | Owner-occupied | Renter-occupied |
| 1-Person Household | 474 (47.7%) | 520 (52.3%) |
| 2-Person Household | 1,107 (79.9%) | 278 (20.1%) |
| 3-Person Household | 357 (68.1%) | 167 (31.9%) |
| 4+ Person Household | 747 (75.1%) | 247 (24.8%) |
| Total Housing Units | 2,685 (68.9%) | 1,212 (31.1%) |
Occupancy by Educational Attainment in Lake Barcroft
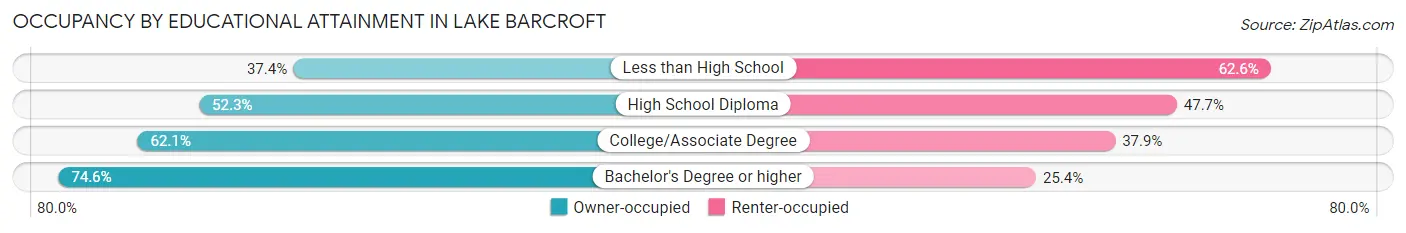
| Household Size | Owner-occupied | Renter-occupied |
| Less than High School | 70 (37.4%) | 117 (62.6%) |
| High School Diploma | 147 (52.3%) | 134 (47.7%) |
| College/Associate Degree | 452 (62.1%) | 276 (37.9%) |
| Bachelor's Degree or higher | 2,016 (74.6%) | 685 (25.4%) |
Occupancy by Age of Householder in Lake Barcroft
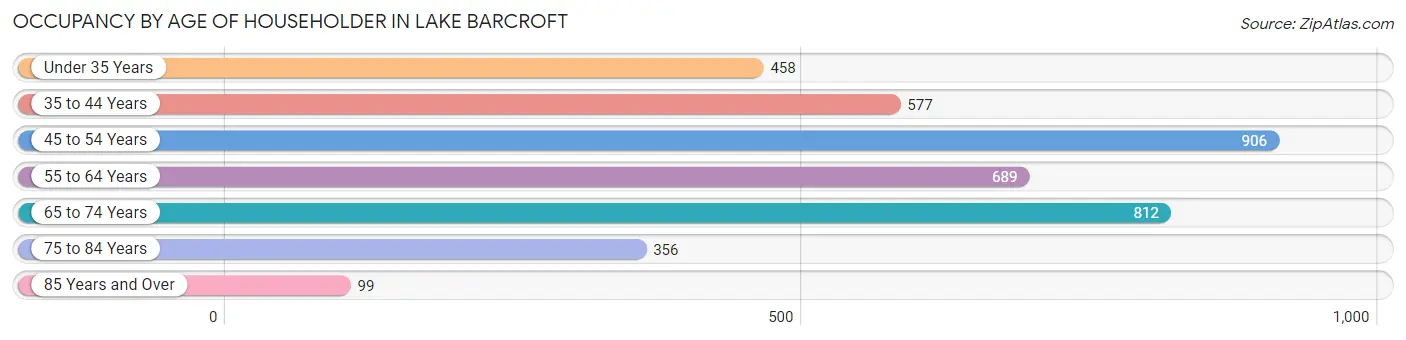
| Age Bracket | # Households | % Households |
| Under 35 Years | 458 | 11.7% |
| 35 to 44 Years | 577 | 14.8% |
| 45 to 54 Years | 906 | 23.3% |
| 55 to 64 Years | 689 | 17.7% |
| 65 to 74 Years | 812 | 20.8% |
| 75 to 84 Years | 356 | 9.1% |
| 85 Years and Over | 99 | 2.5% |
| Total | 3,897 | 100.0% |
Housing Finances in Lake Barcroft
Median Income by Occupancy in Lake Barcroft
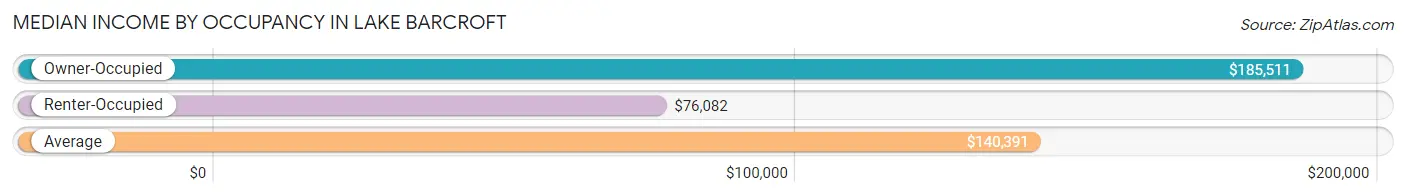
| Occupancy Type | # Households | Median Income |
| Owner-Occupied | 2,685 (68.9%) | $185,511 |
| Renter-Occupied | 1,212 (31.1%) | $76,082 |
| Average | 3,897 (100.0%) | $140,391 |
Occupancy by Householder Income Bracket in Lake Barcroft
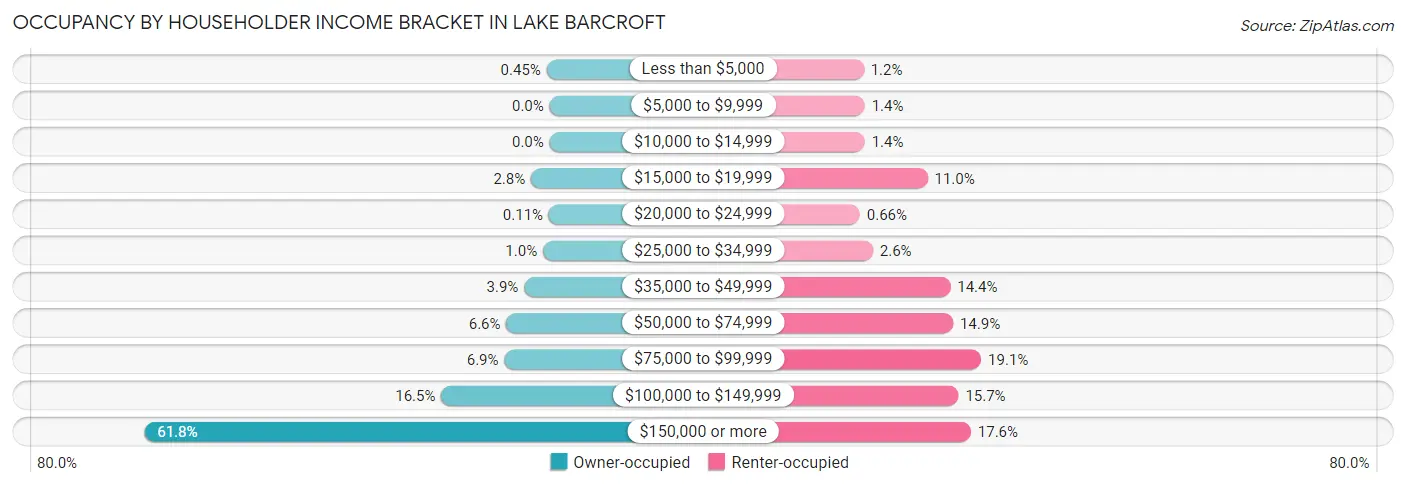
| Income Bracket | Owner-occupied | Renter-occupied |
| Less than $5,000 | 12 (0.4%) | 15 (1.2%) |
| $5,000 to $9,999 | 0 (0.0%) | 17 (1.4%) |
| $10,000 to $14,999 | 0 (0.0%) | 17 (1.4%) |
| $15,000 to $19,999 | 76 (2.8%) | 133 (11.0%) |
| $20,000 to $24,999 | 3 (0.1%) | 8 (0.7%) |
| $25,000 to $34,999 | 27 (1.0%) | 32 (2.6%) |
| $35,000 to $49,999 | 104 (3.9%) | 175 (14.4%) |
| $50,000 to $74,999 | 177 (6.6%) | 180 (14.8%) |
| $75,000 to $99,999 | 185 (6.9%) | 232 (19.1%) |
| $100,000 to $149,999 | 443 (16.5%) | 190 (15.7%) |
| $150,000 or more | 1,658 (61.8%) | 213 (17.6%) |
| Total | 2,685 (100.0%) | 1,212 (100.0%) |
Monthly Housing Cost Tiers in Lake Barcroft
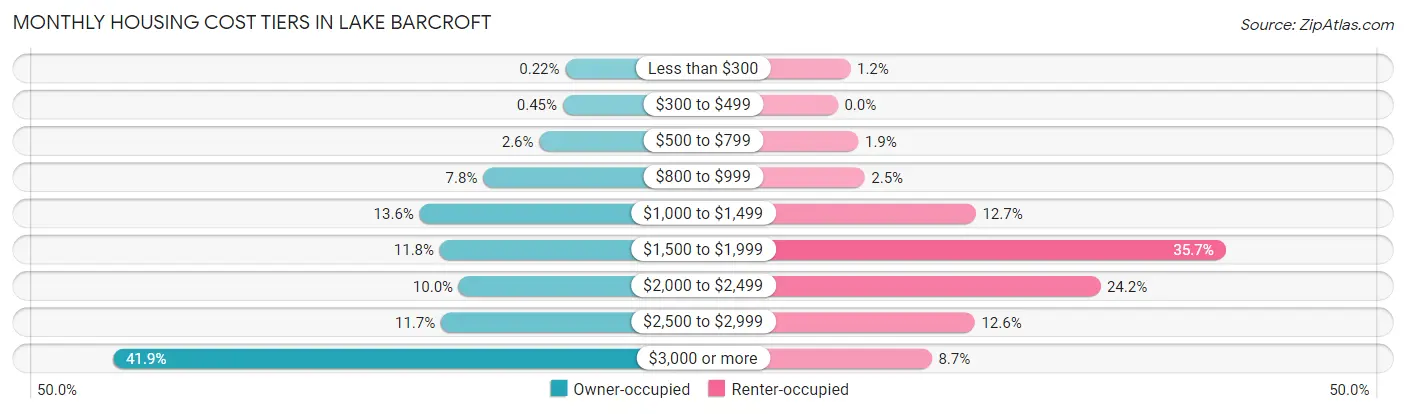
| Monthly Cost | Owner-occupied | Renter-occupied |
| Less than $300 | 6 (0.2%) | 14 (1.2%) |
| $300 to $499 | 12 (0.4%) | 0 (0.0%) |
| $500 to $799 | 70 (2.6%) | 23 (1.9%) |
| $800 to $999 | 209 (7.8%) | 30 (2.5%) |
| $1,000 to $1,499 | 366 (13.6%) | 154 (12.7%) |
| $1,500 to $1,999 | 316 (11.8%) | 433 (35.7%) |
| $2,000 to $2,499 | 269 (10.0%) | 293 (24.2%) |
| $2,500 to $2,999 | 313 (11.7%) | 153 (12.6%) |
| $3,000 or more | 1,124 (41.9%) | 105 (8.7%) |
| Total | 2,685 (100.0%) | 1,212 (100.0%) |
Physical Housing Characteristics in Lake Barcroft
Housing Structures in Lake Barcroft
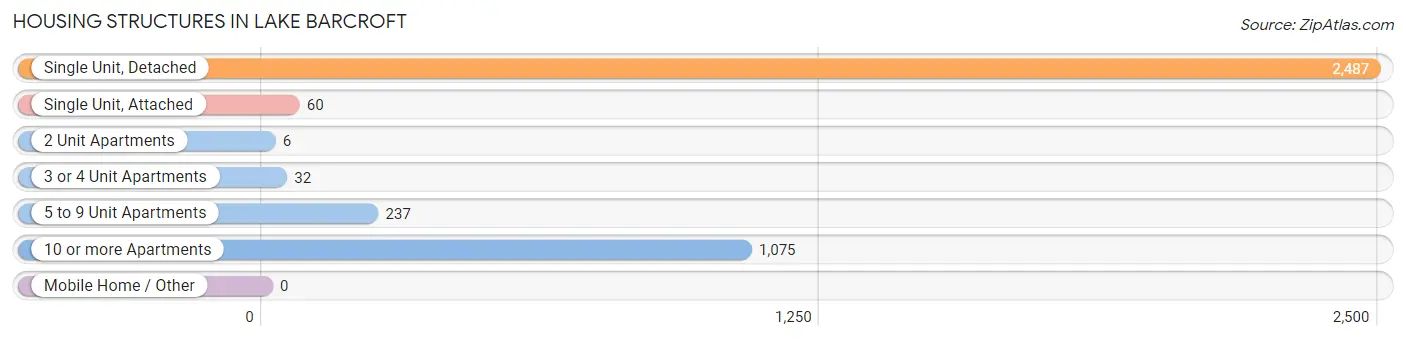
| Structure Type | # Housing Units | % Housing Units |
| Single Unit, Detached | 2,487 | 63.8% |
| Single Unit, Attached | 60 | 1.5% |
| 2 Unit Apartments | 6 | 0.2% |
| 3 or 4 Unit Apartments | 32 | 0.8% |
| 5 to 9 Unit Apartments | 237 | 6.1% |
| 10 or more Apartments | 1,075 | 27.6% |
| Mobile Home / Other | 0 | 0.0% |
| Total | 3,897 | 100.0% |
Housing Structures by Occupancy in Lake Barcroft
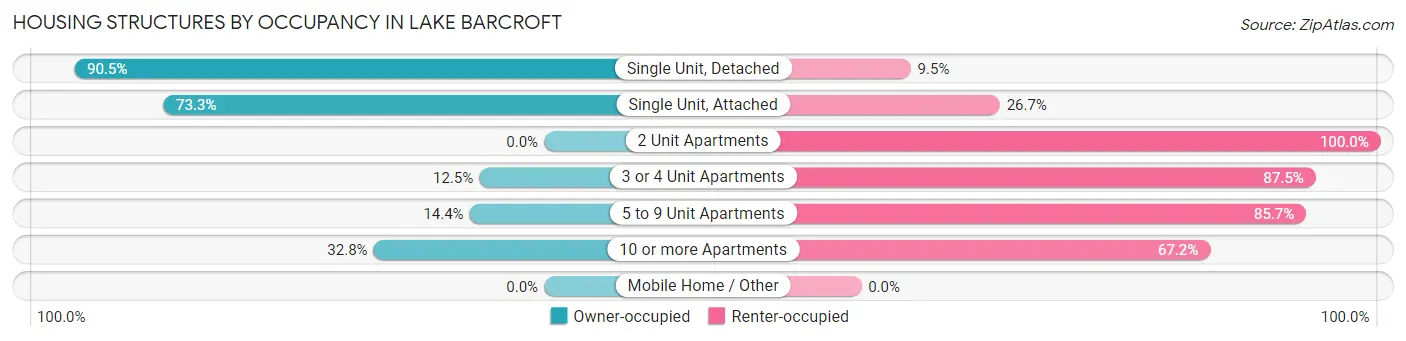
| Structure Type | Owner-occupied | Renter-occupied |
| Single Unit, Detached | 2,250 (90.5%) | 237 (9.5%) |
| Single Unit, Attached | 44 (73.3%) | 16 (26.7%) |
| 2 Unit Apartments | 0 (0.0%) | 6 (100.0%) |
| 3 or 4 Unit Apartments | 4 (12.5%) | 28 (87.5%) |
| 5 to 9 Unit Apartments | 34 (14.3%) | 203 (85.7%) |
| 10 or more Apartments | 353 (32.8%) | 722 (67.2%) |
| Mobile Home / Other | 0 (0.0%) | 0 (0.0%) |
| Total | 2,685 (68.9%) | 1,212 (31.1%) |
Housing Structures by Number of Rooms in Lake Barcroft
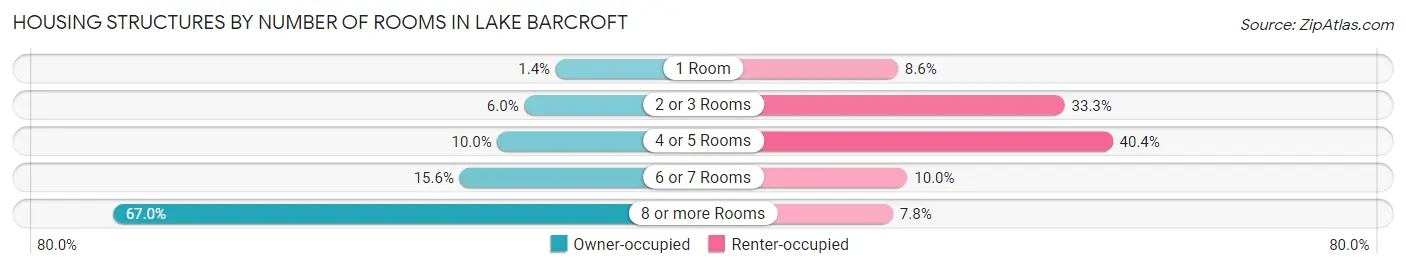
| Number of Rooms | Owner-occupied | Renter-occupied |
| 1 Room | 37 (1.4%) | 104 (8.6%) |
| 2 or 3 Rooms | 162 (6.0%) | 403 (33.3%) |
| 4 or 5 Rooms | 269 (10.0%) | 489 (40.4%) |
| 6 or 7 Rooms | 419 (15.6%) | 121 (10.0%) |
| 8 or more Rooms | 1,798 (67.0%) | 95 (7.8%) |
| Total | 2,685 (100.0%) | 1,212 (100.0%) |
Housing Structure by Heating Type in Lake Barcroft
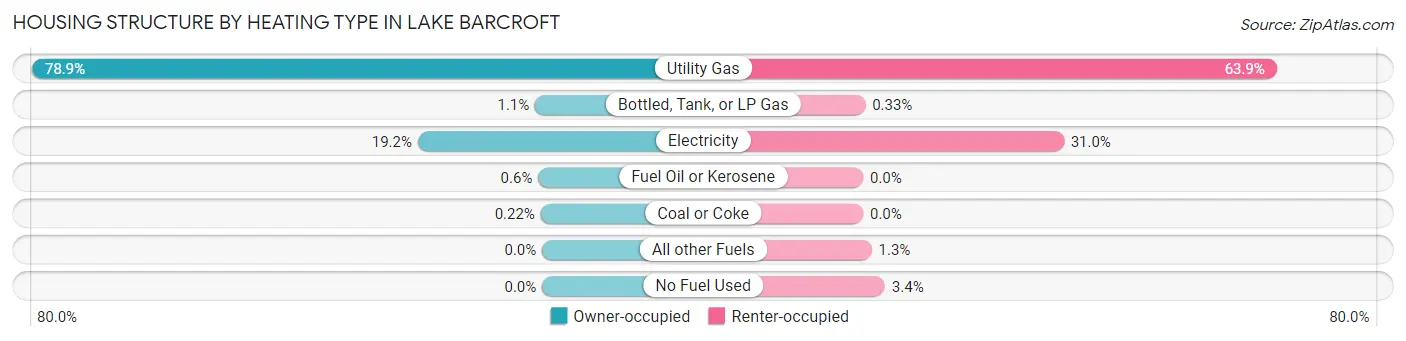
| Heating Type | Owner-occupied | Renter-occupied |
| Utility Gas | 2,118 (78.9%) | 775 (63.9%) |
| Bottled, Tank, or LP Gas | 29 (1.1%) | 4 (0.3%) |
| Electricity | 516 (19.2%) | 376 (31.0%) |
| Fuel Oil or Kerosene | 16 (0.6%) | 0 (0.0%) |
| Coal or Coke | 6 (0.2%) | 0 (0.0%) |
| All other Fuels | 0 (0.0%) | 16 (1.3%) |
| No Fuel Used | 0 (0.0%) | 41 (3.4%) |
| Total | 2,685 (100.0%) | 1,212 (100.0%) |
Household Vehicle Usage in Lake Barcroft
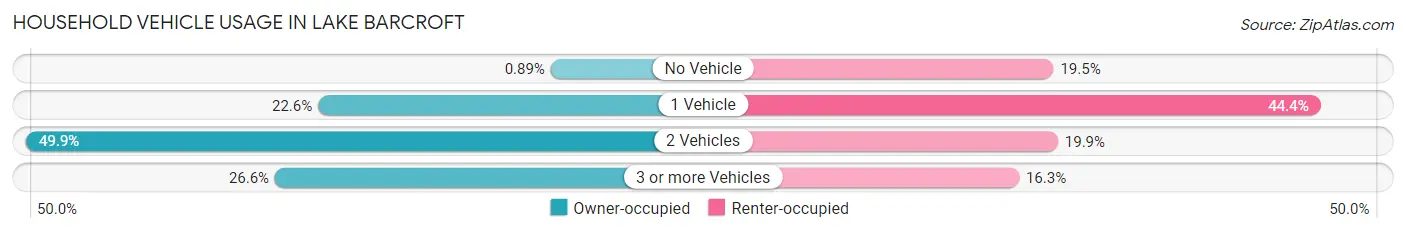
| Vehicles per Household | Owner-occupied | Renter-occupied |
| No Vehicle | 24 (0.9%) | 236 (19.5%) |
| 1 Vehicle | 607 (22.6%) | 538 (44.4%) |
| 2 Vehicles | 1,339 (49.9%) | 241 (19.9%) |
| 3 or more Vehicles | 715 (26.6%) | 197 (16.3%) |
| Total | 2,685 (100.0%) | 1,212 (100.0%) |
Real Estate & Mortgages in Lake Barcroft
Real Estate and Mortgage Overview in Lake Barcroft
| Characteristic | Without Mortgage | With Mortgage |
| Housing Units | 808 | 1,877 |
| Median Property Value | $852,800 | $814,200 |
| Median Household Income | $161,071 | $1,205 |
| Monthly Housing Costs | $1,208 | $1,105 |
| Real Estate Taxes | $10,000 | $42 |
Property Value by Mortgage Status in Lake Barcroft
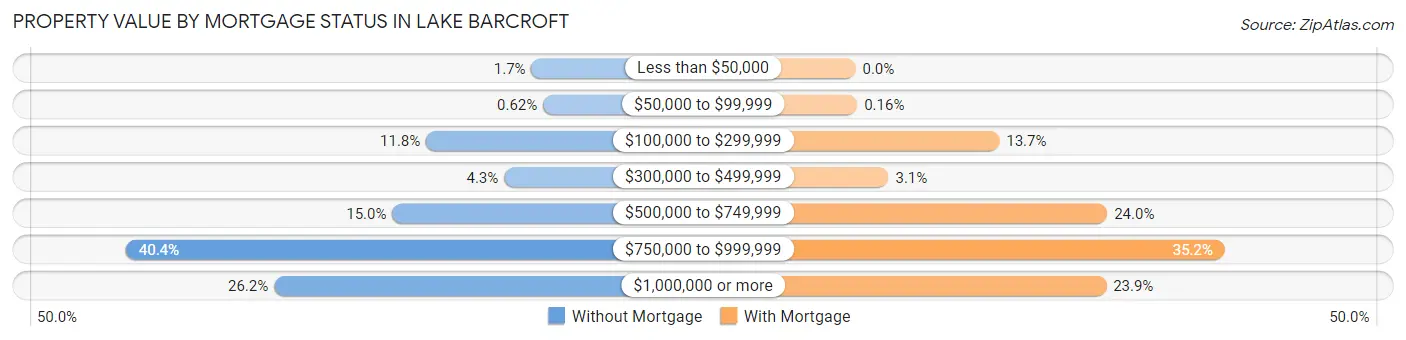
| Property Value | Without Mortgage | With Mortgage |
| Less than $50,000 | 14 (1.7%) | 0 (0.0%) |
| $50,000 to $99,999 | 5 (0.6%) | 3 (0.2%) |
| $100,000 to $299,999 | 95 (11.8%) | 257 (13.7%) |
| $300,000 to $499,999 | 35 (4.3%) | 59 (3.1%) |
| $500,000 to $749,999 | 121 (15.0%) | 450 (24.0%) |
| $750,000 to $999,999 | 326 (40.4%) | 660 (35.2%) |
| $1,000,000 or more | 212 (26.2%) | 448 (23.9%) |
| Total | 808 (100.0%) | 1,877 (100.0%) |
Household Income by Mortgage Status in Lake Barcroft
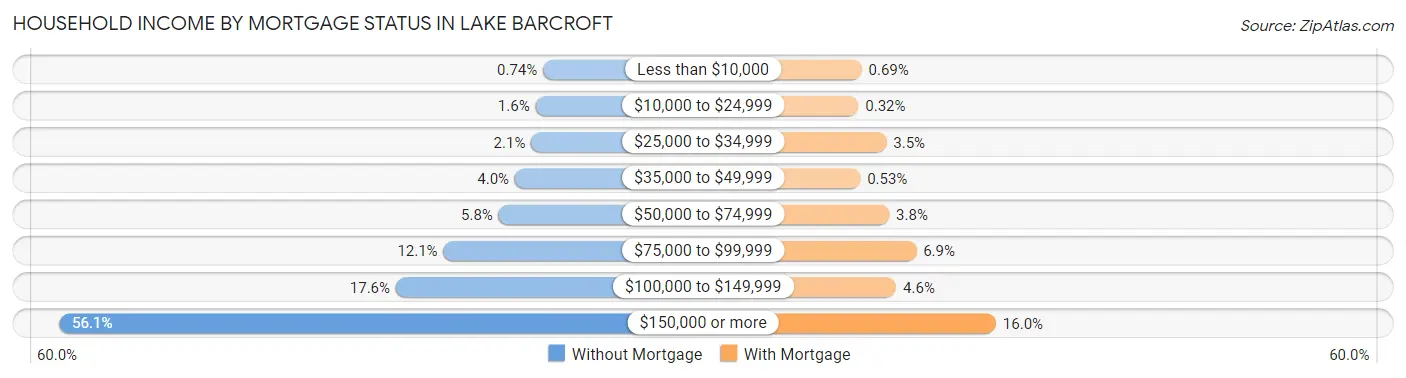
| Household Income | Without Mortgage | With Mortgage |
| Less than $10,000 | 6 (0.7%) | 13 (0.7%) |
| $10,000 to $24,999 | 13 (1.6%) | 6 (0.3%) |
| $25,000 to $34,999 | 17 (2.1%) | 66 (3.5%) |
| $35,000 to $49,999 | 32 (4.0%) | 10 (0.5%) |
| $50,000 to $74,999 | 47 (5.8%) | 72 (3.8%) |
| $75,000 to $99,999 | 98 (12.1%) | 130 (6.9%) |
| $100,000 to $149,999 | 142 (17.6%) | 87 (4.6%) |
| $150,000 or more | 453 (56.1%) | 301 (16.0%) |
| Total | 808 (100.0%) | 1,877 (100.0%) |
Property Value to Household Income Ratio in Lake Barcroft
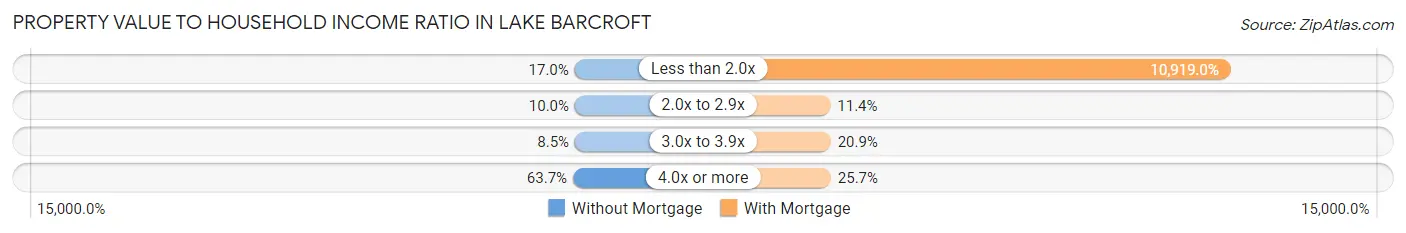
| Value-to-Income Ratio | Without Mortgage | With Mortgage |
| Less than 2.0x | 137 (17.0%) | 204,950 (10,919.0%) |
| 2.0x to 2.9x | 81 (10.0%) | 213 (11.4%) |
| 3.0x to 3.9x | 69 (8.5%) | 393 (20.9%) |
| 4.0x or more | 515 (63.7%) | 482 (25.7%) |
| Total | 808 (100.0%) | 1,877 (100.0%) |
Real Estate Taxes by Mortgage Status in Lake Barcroft
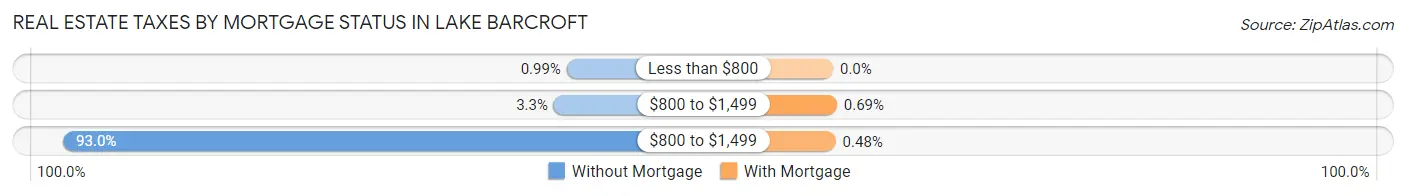
| Property Taxes | Without Mortgage | With Mortgage |
| Less than $800 | 8 (1.0%) | 0 (0.0%) |
| $800 to $1,499 | 27 (3.3%) | 13 (0.7%) |
| $800 to $1,499 | 751 (92.9%) | 9 (0.5%) |
| Total | 808 (100.0%) | 1,877 (100.0%) |
Health & Disability in Lake Barcroft
Health Insurance Coverage by Age in Lake Barcroft
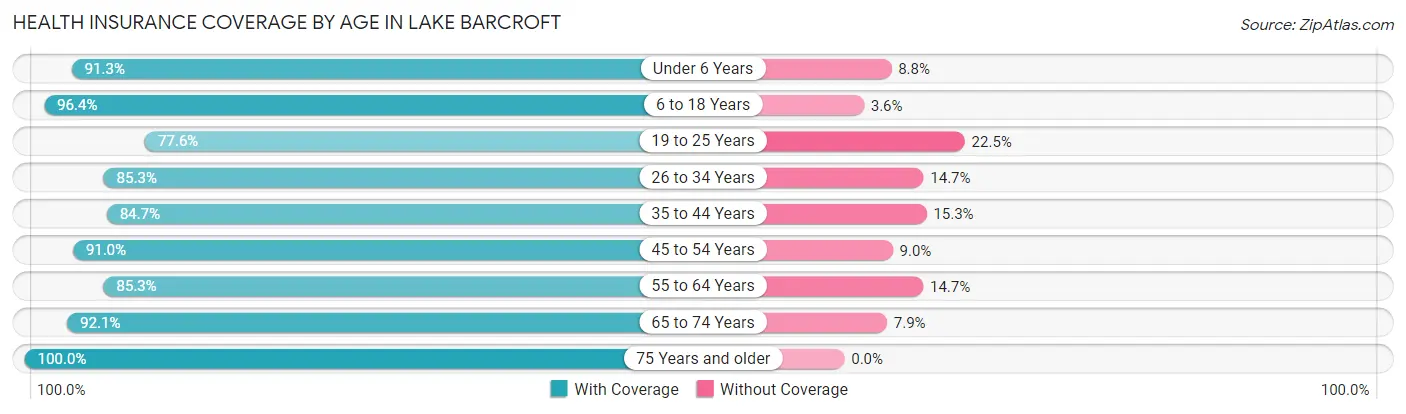
| Age Bracket | With Coverage | Without Coverage |
| Under 6 Years | 511 (91.2%) | 49 (8.7%) |
| 6 to 18 Years | 1,647 (96.4%) | 62 (3.6%) |
| 19 to 25 Years | 601 (77.5%) | 174 (22.5%) |
| 26 to 34 Years | 781 (85.3%) | 135 (14.7%) |
| 35 to 44 Years | 1,177 (84.7%) | 213 (15.3%) |
| 45 to 54 Years | 1,585 (91.0%) | 157 (9.0%) |
| 55 to 64 Years | 1,196 (85.3%) | 206 (14.7%) |
| 65 to 74 Years | 1,183 (92.1%) | 102 (7.9%) |
| 75 Years and older | 790 (100.0%) | 0 (0.0%) |
| Total | 9,471 (89.6%) | 1,098 (10.4%) |
Health Insurance Coverage by Citizenship Status in Lake Barcroft
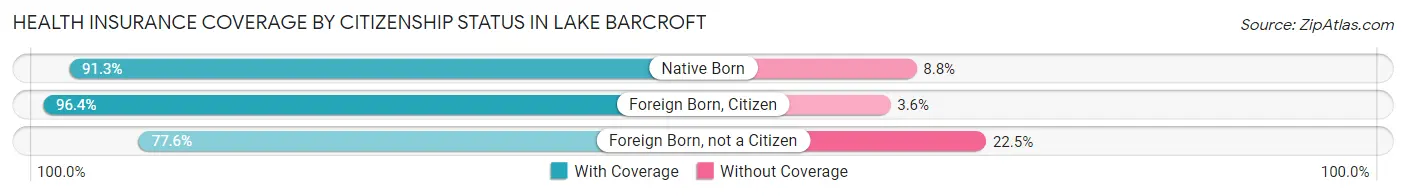
| Citizenship Status | With Coverage | Without Coverage |
| Native Born | 511 (91.2%) | 49 (8.7%) |
| Foreign Born, Citizen | 1,647 (96.4%) | 62 (3.6%) |
| Foreign Born, not a Citizen | 601 (77.5%) | 174 (22.5%) |
Health Insurance Coverage by Household Income in Lake Barcroft
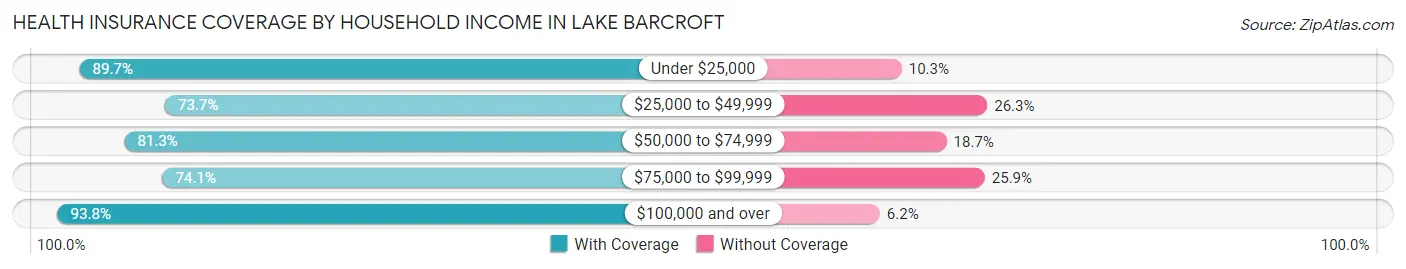
| Household Income | With Coverage | Without Coverage |
| Under $25,000 | 400 (89.7%) | 46 (10.3%) |
| $25,000 to $49,999 | 543 (73.7%) | 194 (26.3%) |
| $50,000 to $74,999 | 556 (81.3%) | 128 (18.7%) |
| $75,000 to $99,999 | 705 (74.1%) | 246 (25.9%) |
| $100,000 and over | 7,266 (93.8%) | 480 (6.2%) |
Public vs Private Health Insurance Coverage by Age in Lake Barcroft
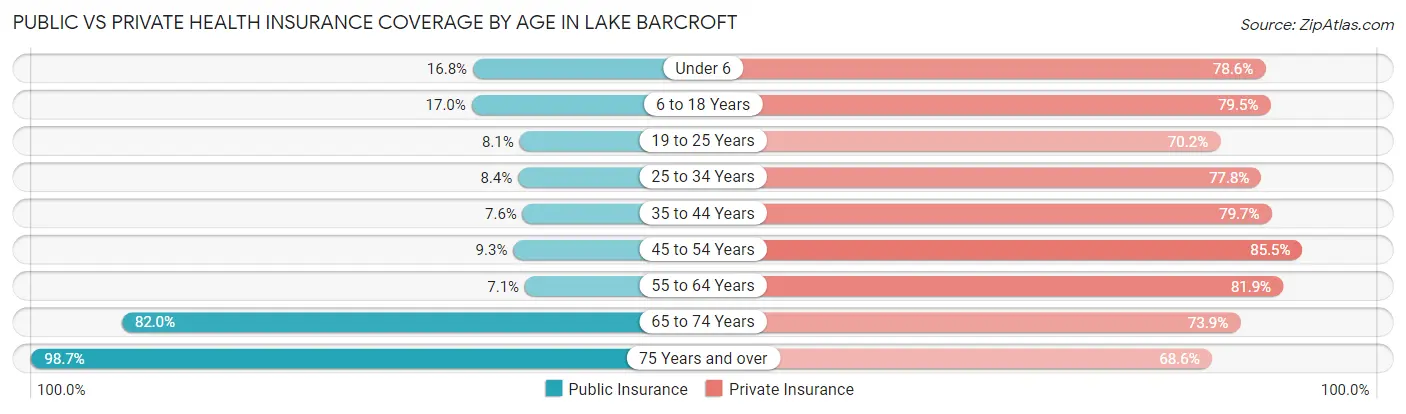
| Age Bracket | Public Insurance | Private Insurance |
| Under 6 | 94 (16.8%) | 440 (78.6%) |
| 6 to 18 Years | 291 (17.0%) | 1,359 (79.5%) |
| 19 to 25 Years | 63 (8.1%) | 544 (70.2%) |
| 25 to 34 Years | 77 (8.4%) | 713 (77.8%) |
| 35 to 44 Years | 105 (7.5%) | 1,108 (79.7%) |
| 45 to 54 Years | 162 (9.3%) | 1,489 (85.5%) |
| 55 to 64 Years | 100 (7.1%) | 1,148 (81.9%) |
| 65 to 74 Years | 1,053 (82.0%) | 950 (73.9%) |
| 75 Years and over | 780 (98.7%) | 542 (68.6%) |
| Total | 2,725 (25.8%) | 8,293 (78.5%) |
Disability Status by Sex by Age in Lake Barcroft
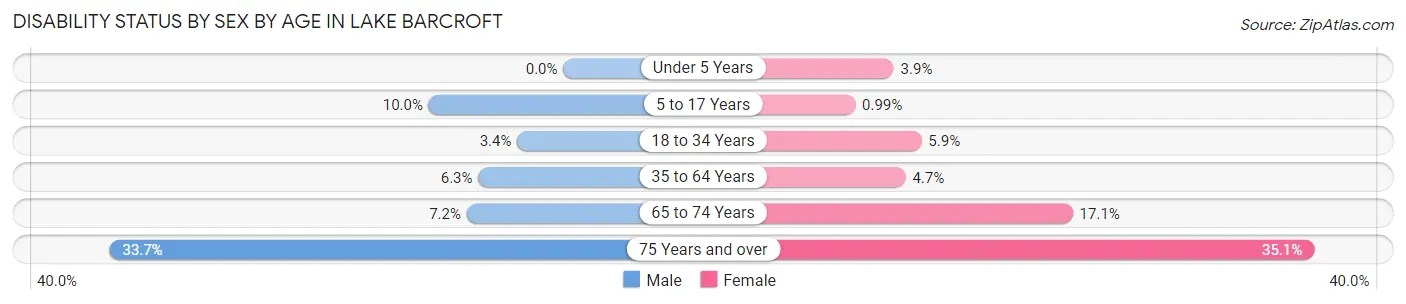
| Age Bracket | Male | Female |
| Under 5 Years | 0 (0.0%) | 9 (3.8%) |
| 5 to 17 Years | 80 (10.0%) | 8 (1.0%) |
| 18 to 34 Years | 31 (3.4%) | 57 (5.9%) |
| 35 to 64 Years | 146 (6.3%) | 105 (4.7%) |
| 65 to 74 Years | 44 (7.2%) | 115 (17.1%) |
| 75 Years and over | 123 (33.7%) | 149 (35.1%) |
Disability Class by Sex by Age in Lake Barcroft
Disability Class: Hearing Difficulty
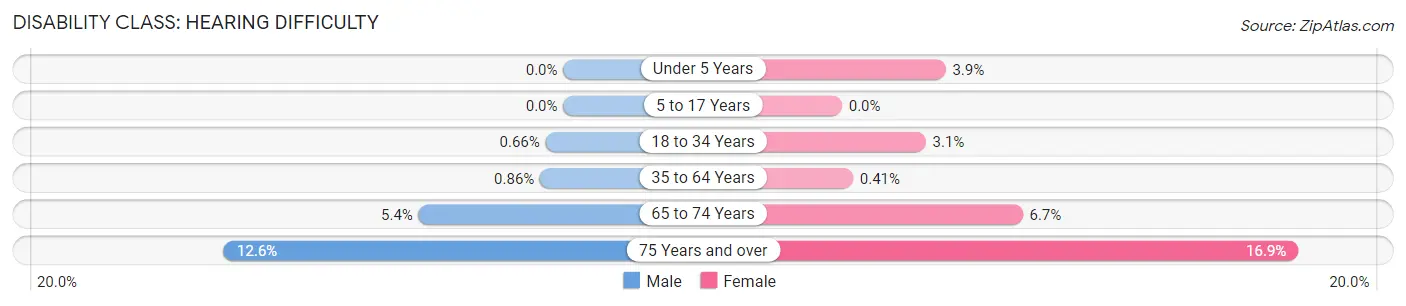
| Age Bracket | Male | Female |
| Under 5 Years | 0 (0.0%) | 9 (3.8%) |
| 5 to 17 Years | 0 (0.0%) | 0 (0.0%) |
| 18 to 34 Years | 6 (0.7%) | 30 (3.1%) |
| 35 to 64 Years | 20 (0.9%) | 9 (0.4%) |
| 65 to 74 Years | 33 (5.4%) | 45 (6.7%) |
| 75 Years and over | 46 (12.6%) | 72 (16.9%) |
Disability Class: Vision Difficulty
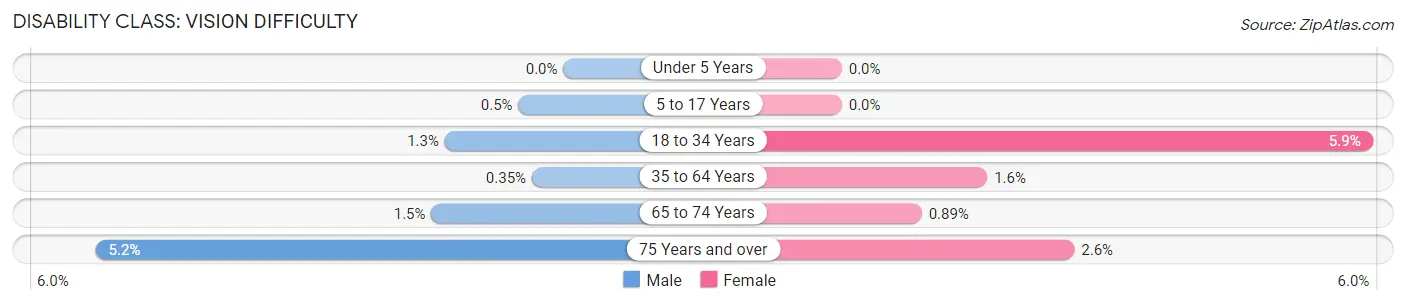
| Age Bracket | Male | Female |
| Under 5 Years | 0 (0.0%) | 0 (0.0%) |
| 5 to 17 Years | 4 (0.5%) | 0 (0.0%) |
| 18 to 34 Years | 12 (1.3%) | 57 (5.9%) |
| 35 to 64 Years | 8 (0.4%) | 36 (1.6%) |
| 65 to 74 Years | 9 (1.5%) | 6 (0.9%) |
| 75 Years and over | 19 (5.2%) | 11 (2.6%) |
Disability Class: Cognitive Difficulty
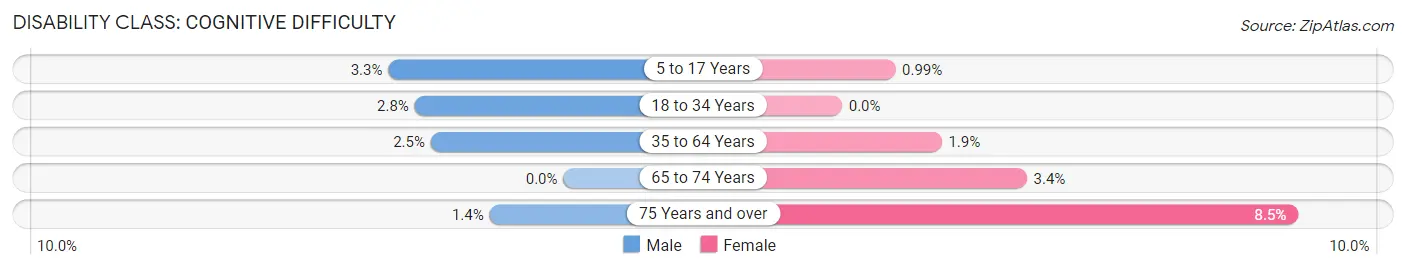
| Age Bracket | Male | Female |
| 5 to 17 Years | 26 (3.3%) | 8 (1.0%) |
| 18 to 34 Years | 25 (2.8%) | 0 (0.0%) |
| 35 to 64 Years | 57 (2.5%) | 41 (1.8%) |
| 65 to 74 Years | 0 (0.0%) | 23 (3.4%) |
| 75 Years and over | 5 (1.4%) | 36 (8.5%) |
Disability Class: Ambulatory Difficulty
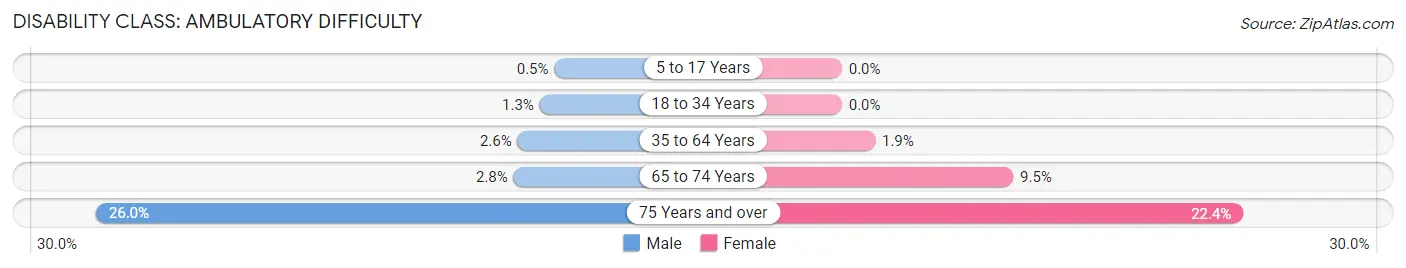
| Age Bracket | Male | Female |
| 5 to 17 Years | 4 (0.5%) | 0 (0.0%) |
| 18 to 34 Years | 12 (1.3%) | 0 (0.0%) |
| 35 to 64 Years | 59 (2.5%) | 41 (1.8%) |
| 65 to 74 Years | 17 (2.8%) | 64 (9.5%) |
| 75 Years and over | 95 (26.0%) | 95 (22.4%) |
Disability Class: Self-Care Difficulty
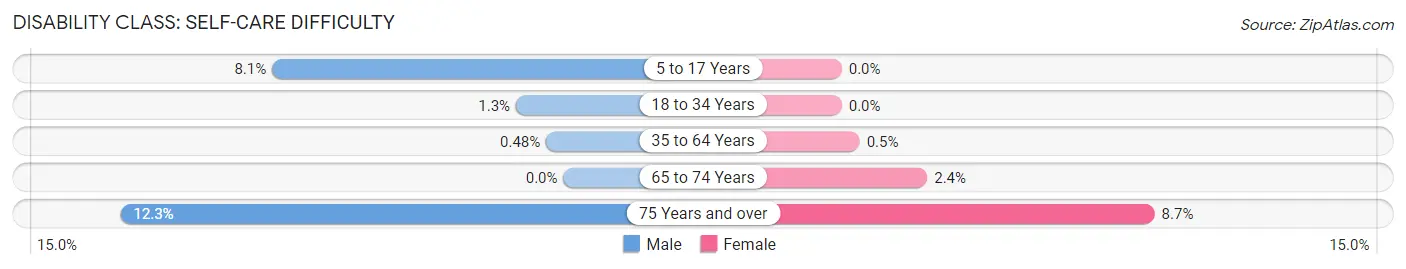
| Age Bracket | Male | Female |
| 5 to 17 Years | 65 (8.1%) | 0 (0.0%) |
| 18 to 34 Years | 12 (1.3%) | 0 (0.0%) |
| 35 to 64 Years | 11 (0.5%) | 11 (0.5%) |
| 65 to 74 Years | 0 (0.0%) | 16 (2.4%) |
| 75 Years and over | 45 (12.3%) | 37 (8.7%) |
Technology Access in Lake Barcroft
Computing Device Access in Lake Barcroft
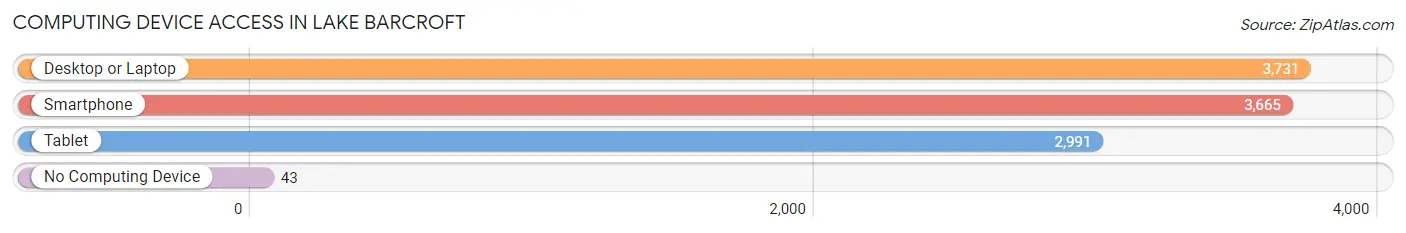
| Device Type | # Households | % Households |
| Desktop or Laptop | 3,731 | 95.7% |
| Smartphone | 3,665 | 94.1% |
| Tablet | 2,991 | 76.7% |
| No Computing Device | 43 | 1.1% |
| Total | 3,897 | 100.0% |
Internet Access in Lake Barcroft
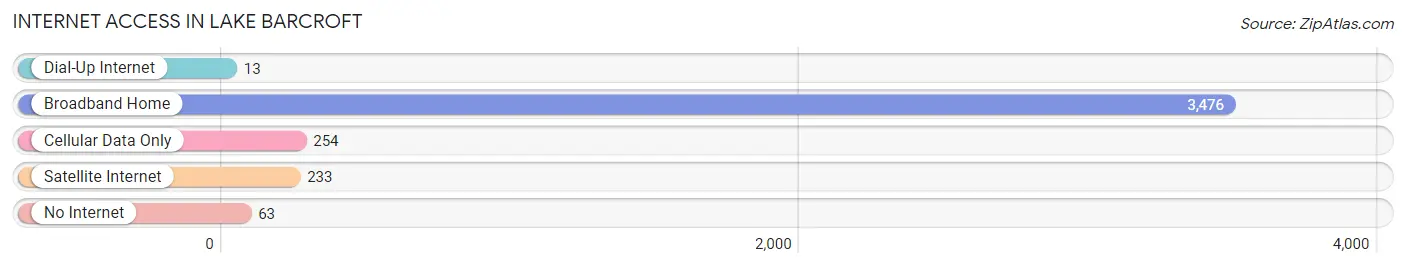
| Internet Type | # Households | % Households |
| Dial-Up Internet | 13 | 0.3% |
| Broadband Home | 3,476 | 89.2% |
| Cellular Data Only | 254 | 6.5% |
| Satellite Internet | 233 | 6.0% |
| No Internet | 63 | 1.6% |
| Total | 3,897 | 100.0% |
Lake Barcroft Summary
History
Lake Barcroft is a census-designated place (CDP) located in Fairfax County, Virginia. It is situated on the south shore of the lake of the same name, which is a man-made reservoir created in 1918. The lake was created by damming the Four Mile Run, a tributary of the Potomac River. The lake was originally created to provide water for the City of Alexandria, but it is now used for recreational purposes.
The area around Lake Barcroft was first settled in the late 1700s by farmers and planters. The area was known as Four Mile Run, and the lake was known as Four Mile Run Reservoir. In the early 1900s, the area was developed as a summer resort community. The lake was renamed Lake Barcroft in honor of the Barcroft family, who owned much of the land around the lake.
The Lake Barcroft community was officially established in 1958, when the Fairfax County Board of Supervisors approved the creation of the Lake Barcroft Community Association. The association was formed to manage the lake and the surrounding area. The association is responsible for maintaining the lake, enforcing the rules and regulations, and providing recreational activities for the community.
Geography
Lake Barcroft is located in Fairfax County, Virginia, approximately 10 miles south of Washington, D.C. The lake is situated on the south shore of the lake of the same name, which is a man-made reservoir created in 1918. The lake is approximately 1.5 miles long and 0.5 miles wide. The lake is surrounded by residential neighborhoods and is a popular spot for swimming, fishing, and boating.
The lake is fed by the Four Mile Run, a tributary of the Potomac River. The lake is also connected to the Potomac River by a canal. The lake is surrounded by the communities of Bailey’s Crossroads, Falls Church, and Arlington.
Economy
The economy of Lake Barcroft is largely based on tourism and recreation. The lake is a popular spot for swimming, fishing, and boating. There are several marinas located on the lake, as well as boat rentals and fishing charters. The lake is also home to several restaurants and bars, which cater to the tourists and locals alike.
The Lake Barcroft community is also home to several small businesses, including a grocery store, a hardware store, and a gas station. There are also several professional services located in the area, such as doctors, lawyers, and accountants.
Demographics
As of the 2010 census, the population of Lake Barcroft was 5,845. The population is predominantly white (90.3%), with a small percentage of African Americans (3.2%), Asians (3.1%), and Hispanics (2.2%). The median household income is $107,945, and the median home value is $541,000.
The majority of the population is employed in professional and managerial occupations (44.2%), followed by sales and office occupations (25.2%), and service occupations (14.2%). The unemployment rate is 3.2%.
Conclusion
Lake Barcroft is a census-designated place located in Fairfax County, Virginia. It is situated on the south shore of the lake of the same name, which is a man-made reservoir created in 1918. The lake was originally created to provide water for the City of Alexandria, but it is now used for recreational purposes. The economy of Lake Barcroft is largely based on tourism and recreation, and the population is predominantly white. The median household income is $107,945, and the median home value is $541,000.
Common Questions
What is Per Capita Income in Lake Barcroft?
Per Capita income in Lake Barcroft is $72,366.
What is the Median Family Income in Lake Barcroft?
Median Family Income in Lake Barcroft is $178,533.
What is the Median Household income in Lake Barcroft?
Median Household Income in Lake Barcroft is $140,391.
What is Income or Wage Gap in Lake Barcroft?
Income or Wage Gap in Lake Barcroft is 30.5%.
Women in Lake Barcroft earn 69.5 cents for every dollar earned by a man.
What is Inequality or Gini Index in Lake Barcroft?
Inequality or Gini Index in Lake Barcroft is 0.45.
What is the Total Population of Lake Barcroft?
Total Population of Lake Barcroft is 10,591.
What is the Total Male Population of Lake Barcroft?
Total Male Population of Lake Barcroft is 5,257.
What is the Total Female Population of Lake Barcroft?
Total Female Population of Lake Barcroft is 5,334.
What is the Ratio of Males per 100 Females in Lake Barcroft?
There are 98.56 Males per 100 Females in Lake Barcroft.
What is the Ratio of Females per 100 Males in Lake Barcroft?
There are 101.46 Females per 100 Males in Lake Barcroft.
What is the Median Population Age in Lake Barcroft?
Median Population Age in Lake Barcroft is 44.3 Years.
What is the Average Family Size in Lake Barcroft
Average Family Size in Lake Barcroft is 3.3 People.
What is the Average Household Size in Lake Barcroft
Average Household Size in Lake Barcroft is 2.7 People.
How Large is the Labor Force in Lake Barcroft?
There are 6,065 People in the Labor Forcein in Lake Barcroft.
What is the Percentage of People in the Labor Force in Lake Barcroft?
69.5% of People are in the Labor Force in Lake Barcroft.
What is the Unemployment Rate in Lake Barcroft?
Unemployment Rate in Lake Barcroft is 5.2%.