Zip Codes with the Highest Percentage of Population Employed in Farming, Fishing & Forestry in West Chester, PA
RELATED REPORTS & OPTIONS
Farming, Fishing & Forestry
West Chester
Compare Zip Codes
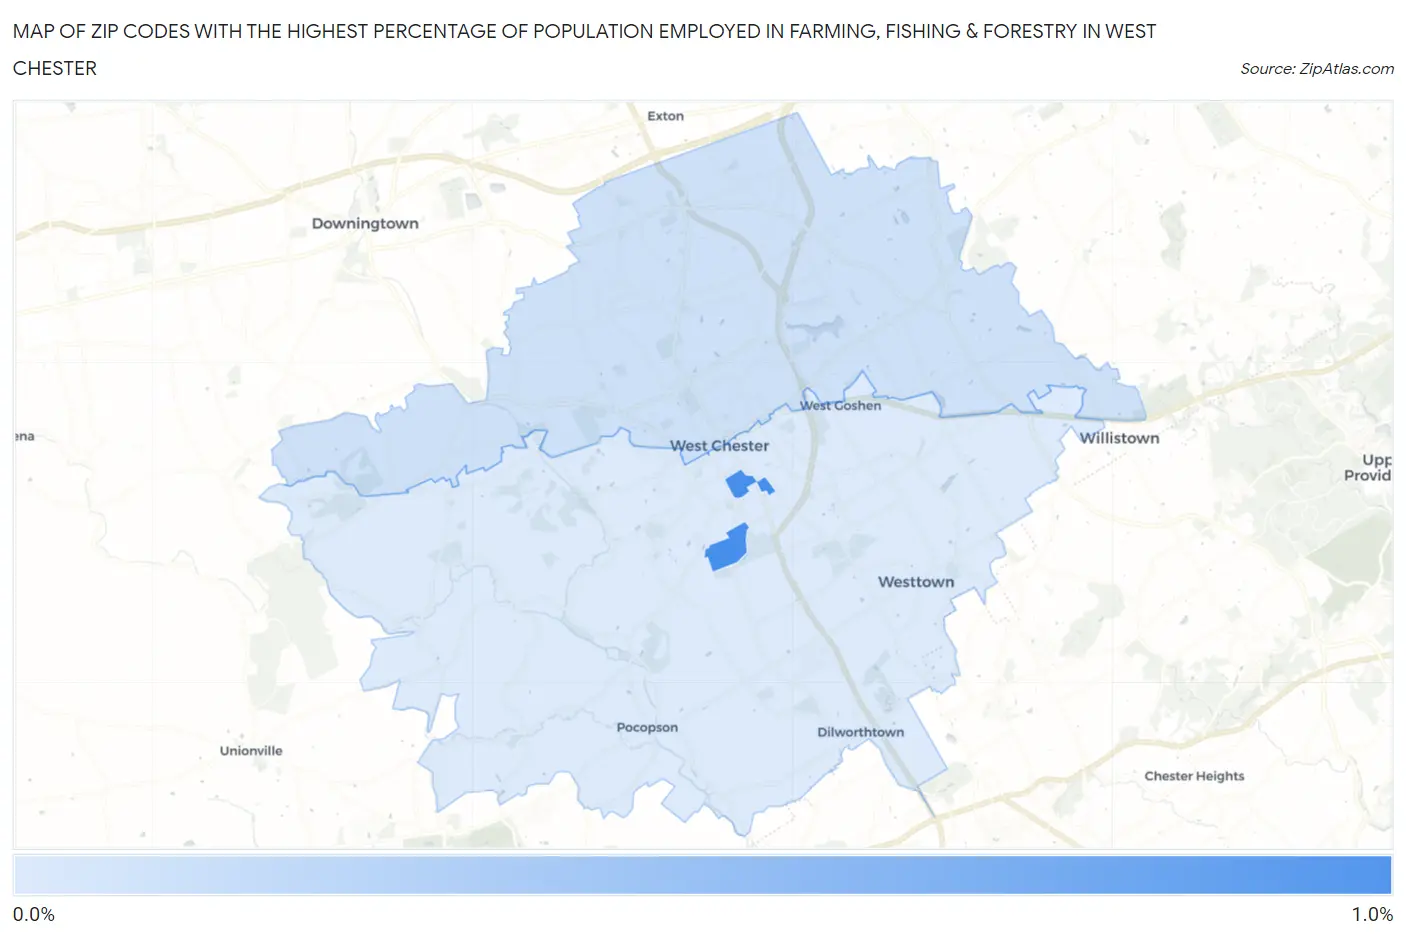
Map of Zip Codes with the Highest Percentage of Population Employed in Farming, Fishing & Forestry in West Chester
0.088%
0.99%
Zip Codes with the Highest Percentage of Population Employed in Farming, Fishing & Forestry in West Chester, PA
| Zip Code | % Employed | vs State | vs National | |
| 1. | 19383 | 0.99% | 0.41%(+0.588)#349 | 0.61%(+0.389)#9,775 |
| 2. | 19380 | 0.17% | 0.41%(-0.238)#703 | 0.61%(-0.437)#16,599 |
| 3. | 19382 | 0.088% | 0.41%(-0.318)#783 | 0.61%(-0.517)#17,962 |
1
Common Questions
What are the Top Zip Codes with the Highest Percentage of Population Employed in Farming, Fishing & Forestry in West Chester, PA?
Top Zip Codes with the Highest Percentage of Population Employed in Farming, Fishing & Forestry in West Chester, PA are:
What zip code has the Highest Percentage of Population Employed in Farming, Fishing & Forestry in West Chester, PA?
19383 has the Highest Percentage of Population Employed in Farming, Fishing & Forestry in West Chester, PA with 0.99%.
What is the Percentage of Population Employed in Farming, Fishing & Forestry in Pennsylvania?
Percentage of Population Employed in Farming, Fishing & Forestry in Pennsylvania is 0.41%.
What is the Percentage of Population Employed in Farming, Fishing & Forestry in the United States?
Percentage of Population Employed in Farming, Fishing & Forestry in the United States is 0.61%.