Clarion borough, PA Map & Demographics
Clarion borough Overview
$25,864
PER CAPITA INCOME
$69,412
AVG FAMILY INCOME
$43,178
AVG HOUSEHOLD INCOME
55.9%
WAGE / INCOME GAP [ % ]
44.1¢/ $1
WAGE / INCOME GAP [ $ ]
0.49
INEQUALITY / GINI INDEX
4,205
TOTAL POPULATION
1,796
MALE POPULATION
2,409
FEMALE POPULATION
74.55
MALES / 100 FEMALES
134.13
FEMALES / 100 MALES
25.0
MEDIAN AGE
3.0
AVG FAMILY SIZE
2.3
AVG HOUSEHOLD SIZE
2,380
LABOR FORCE [ PEOPLE ]
67.7%
PERCENT IN LABOR FORCE
10.2%
UNEMPLOYMENT RATE
Income in Clarion borough
Income Overview in Clarion borough
Per Capita Income in Clarion borough is $25,864, while median incomes of families and households are $69,412 and $43,178 respectively.
| Characteristic | Number | Measure |
| Per Capita Income | 4,205 | $25,864 |
| Median Family Income | 748 | $69,412 |
| Mean Family Income | 748 | $87,903 |
| Median Household Income | 1,536 | $43,178 |
| Mean Household Income | 1,536 | $64,949 |
| Income Deficit | 748 | $0 |
| Wage / Income Gap (%) | 4,205 | 55.94% |
| Wage / Income Gap ($) | 4,205 | 44.06¢ per $1 |
| Gini / Inequality Index | 4,205 | 0.49 |
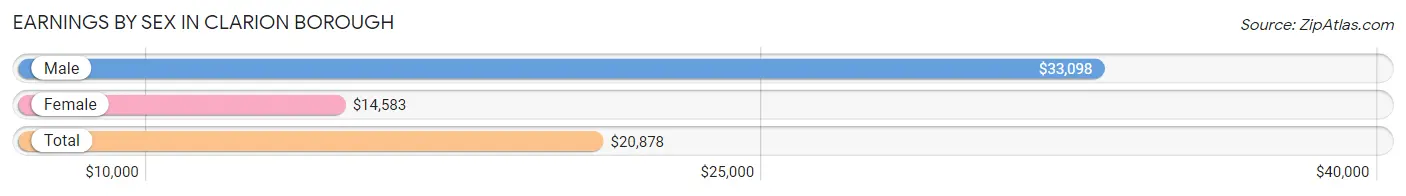
Earnings by Sex in Clarion borough
Average Earnings in Clarion borough are $20,878, $33,098 for men and $14,583 for women, a difference of 55.9%.
| Sex | Number | Average Earnings |
| Male | 1,078 (42.7%) | $33,098 |
| Female | 1,444 (57.3%) | $14,583 |
| Total | 2,522 (100.0%) | $20,878 |
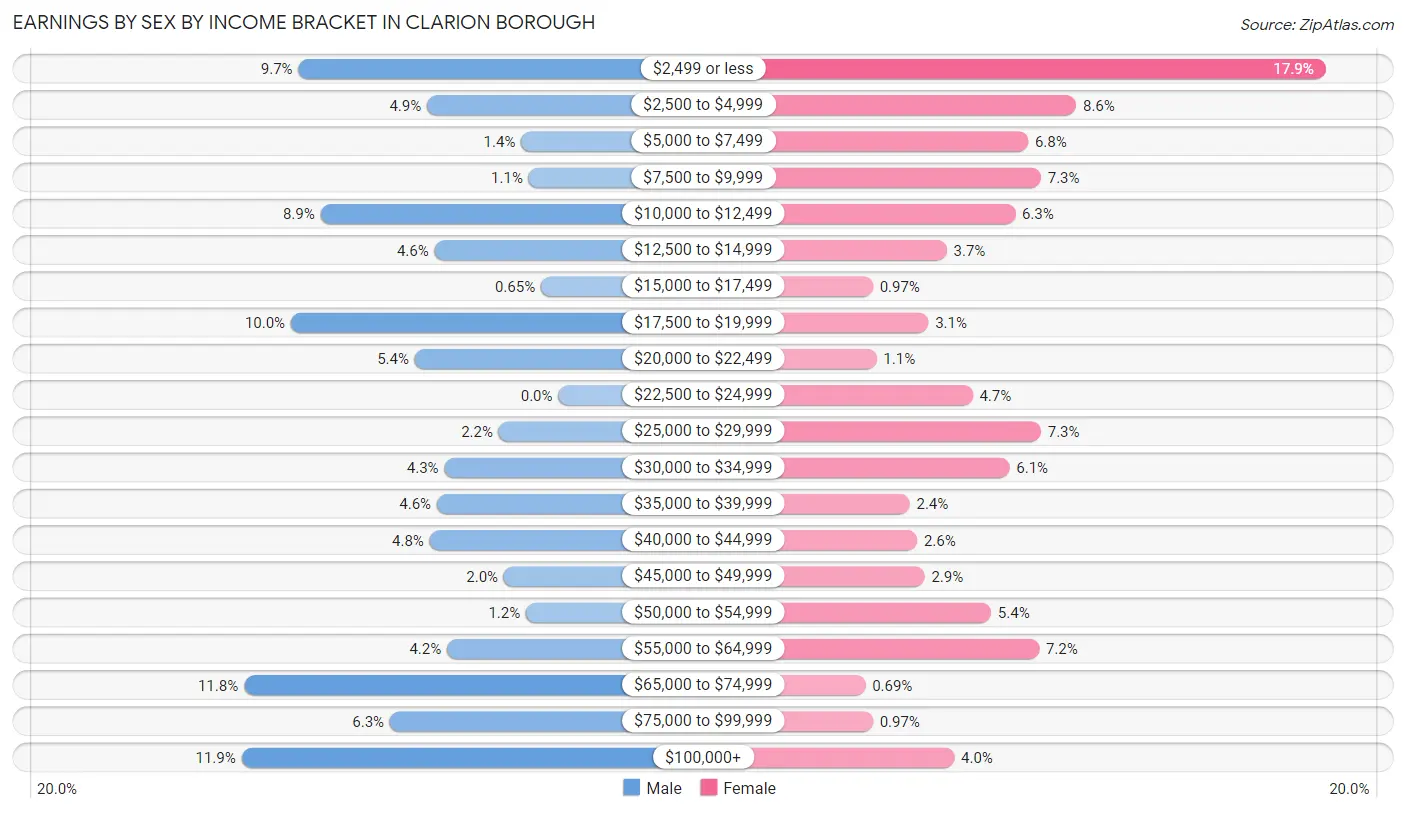
Earnings by Sex by Income Bracket in Clarion borough
The most common earnings brackets in Clarion borough are $100,000+ for men (128 | 11.9%) and $2,499 or less for women (259 | 17.9%).
| Income | Male | Female |
| $2,499 or less | 105 (9.7%) | 259 (17.9%) |
| $2,500 to $4,999 | 53 (4.9%) | 124 (8.6%) |
| $5,000 to $7,499 | 15 (1.4%) | 98 (6.8%) |
| $7,500 to $9,999 | 12 (1.1%) | 105 (7.3%) |
| $10,000 to $12,499 | 96 (8.9%) | 91 (6.3%) |
| $12,500 to $14,999 | 50 (4.6%) | 54 (3.7%) |
| $15,000 to $17,499 | 7 (0.6%) | 14 (1.0%) |
| $17,500 to $19,999 | 108 (10.0%) | 44 (3.0%) |
| $20,000 to $22,499 | 58 (5.4%) | 16 (1.1%) |
| $22,500 to $24,999 | 0 (0.0%) | 68 (4.7%) |
| $25,000 to $29,999 | 24 (2.2%) | 105 (7.3%) |
| $30,000 to $34,999 | 46 (4.3%) | 88 (6.1%) |
| $35,000 to $39,999 | 49 (4.5%) | 34 (2.4%) |
| $40,000 to $44,999 | 52 (4.8%) | 38 (2.6%) |
| $45,000 to $49,999 | 22 (2.0%) | 42 (2.9%) |
| $50,000 to $54,999 | 13 (1.2%) | 78 (5.4%) |
| $55,000 to $64,999 | 45 (4.2%) | 104 (7.2%) |
| $65,000 to $74,999 | 127 (11.8%) | 10 (0.7%) |
| $75,000 to $99,999 | 68 (6.3%) | 14 (1.0%) |
| $100,000+ | 128 (11.9%) | 58 (4.0%) |
| Total | 1,078 (100.0%) | 1,444 (100.0%) |
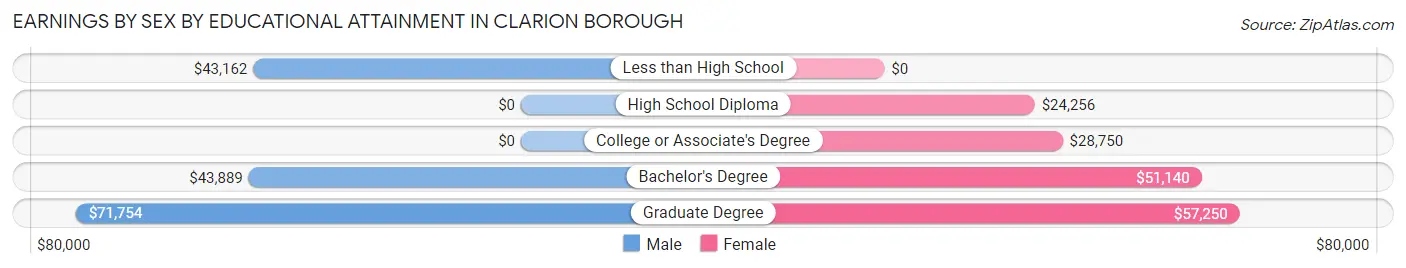
Earnings by Sex by Educational Attainment in Clarion borough
Average earnings in Clarion borough are $53,269 for men and $34,615 for women, a difference of 35.0%. Men with an educational attainment of graduate degree enjoy the highest average annual earnings of $71,754, while those with less than high school education earn the least with $43,162. Women with an educational attainment of graduate degree earn the most with the average annual earnings of $57,250, while those with high school diploma education have the smallest earnings of $24,256.
| Educational Attainment | Male Income | Female Income |
| Less than High School | $43,162 | $0 |
| High School Diploma | - | - |
| College or Associate's Degree | - | - |
| Bachelor's Degree | $43,889 | $51,140 |
| Graduate Degree | $71,754 | $57,250 |
| Total | $53,269 | $34,615 |
Family Income in Clarion borough
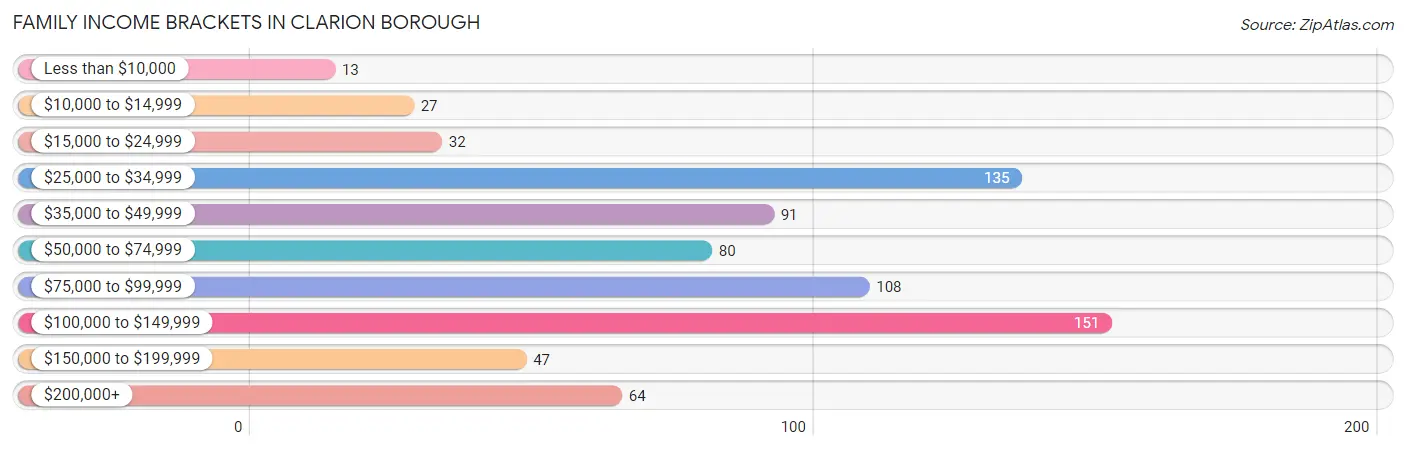
Family Income Brackets in Clarion borough
According to the Clarion borough family income data, there are 151 families falling into the $100,000 to $149,999 income range, which is the most common income bracket and makes up 20.2% of all families. Conversely, the less than $10,000 income bracket is the least frequent group with only 13 families (1.7%) belonging to this category.
| Income Bracket | # Families | % Families |
| Less than $10,000 | 13 | 1.7% |
| $10,000 to $14,999 | 27 | 3.6% |
| $15,000 to $24,999 | 32 | 4.3% |
| $25,000 to $34,999 | 135 | 18.0% |
| $35,000 to $49,999 | 91 | 12.2% |
| $50,000 to $74,999 | 80 | 10.7% |
| $75,000 to $99,999 | 108 | 14.4% |
| $100,000 to $149,999 | 151 | 20.2% |
| $150,000 to $199,999 | 47 | 6.3% |
| $200,000+ | 64 | 8.6% |
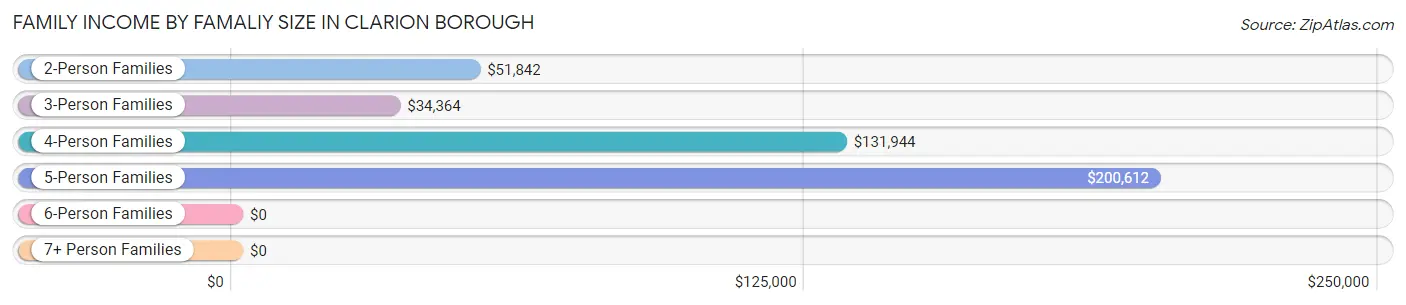
Family Income by Famaliy Size in Clarion borough
5-person families (71 | 9.5%) account for the highest median family income in Clarion borough with $200,612 per family, while 5-person families (71 | 9.5%) have the highest median income of $40,122 per family member.
| Income Bracket | # Families | Median Income |
| 2-Person Families | 356 (47.6%) | $51,842 |
| 3-Person Families | 136 (18.2%) | $34,364 |
| 4-Person Families | 150 (20.1%) | $131,944 |
| 5-Person Families | 71 (9.5%) | $200,612 |
| 6-Person Families | 35 (4.7%) | $0 |
| 7+ Person Families | 0 (0.0%) | $0 |
| Total | 748 (100.0%) | $69,412 |
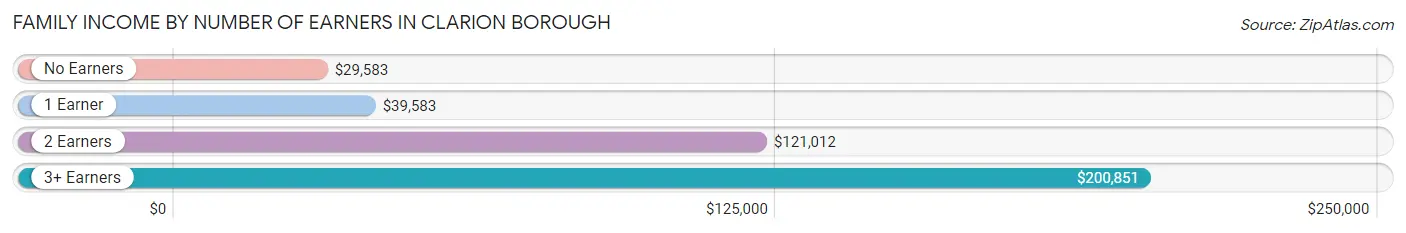
Family Income by Number of Earners in Clarion borough
The median family income in Clarion borough is $69,412, with families comprising 3+ earners (62) having the highest median family income of $200,851, while families with no earners (87) have the lowest median family income of $29,583, accounting for 8.3% and 11.6% of families, respectively.
| Number of Earners | # Families | Median Income |
| No Earners | 87 (11.6%) | $29,583 |
| 1 Earner | 258 (34.5%) | $39,583 |
| 2 Earners | 341 (45.6%) | $121,012 |
| 3+ Earners | 62 (8.3%) | $200,851 |
| Total | 748 (100.0%) | $69,412 |
Household Income in Clarion borough
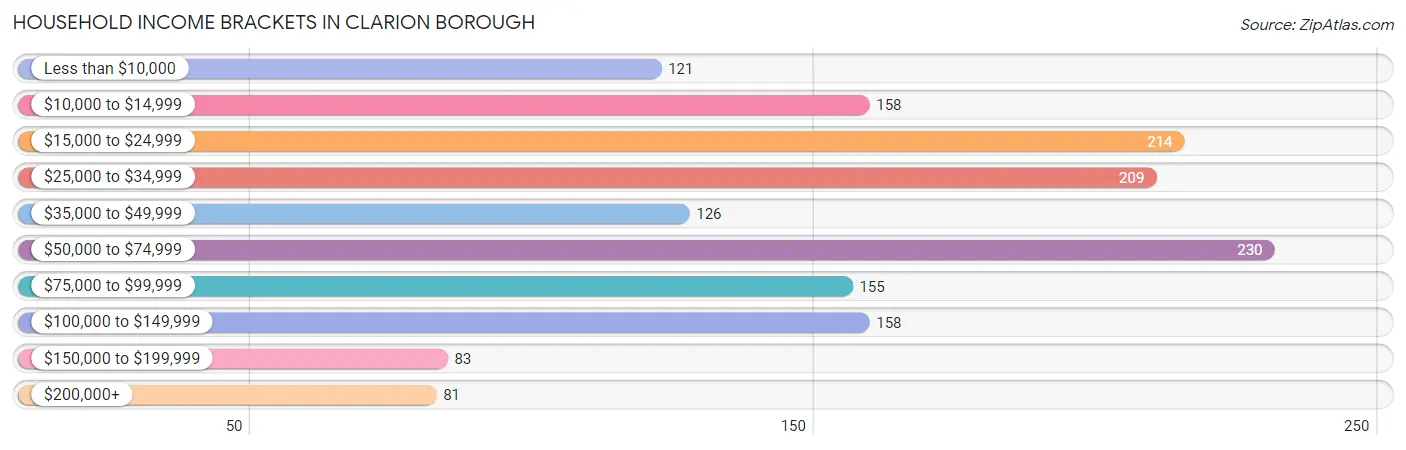
Household Income Brackets in Clarion borough
With 230 households falling in the category, the $50,000 to $74,999 income range is the most frequent in Clarion borough, accounting for 15.0% of all households. In contrast, only 81 households (5.3%) fall into the $200,000+ income bracket, making it the least populous group.
| Income Bracket | # Households | % Households |
| Less than $10,000 | 121 | 7.9% |
| $10,000 to $14,999 | 158 | 10.3% |
| $15,000 to $24,999 | 214 | 13.9% |
| $25,000 to $34,999 | 209 | 13.6% |
| $35,000 to $49,999 | 126 | 8.2% |
| $50,000 to $74,999 | 230 | 15.0% |
| $75,000 to $99,999 | 155 | 10.1% |
| $100,000 to $149,999 | 158 | 10.3% |
| $150,000 to $199,999 | 83 | 5.4% |
| $200,000+ | 81 | 5.3% |
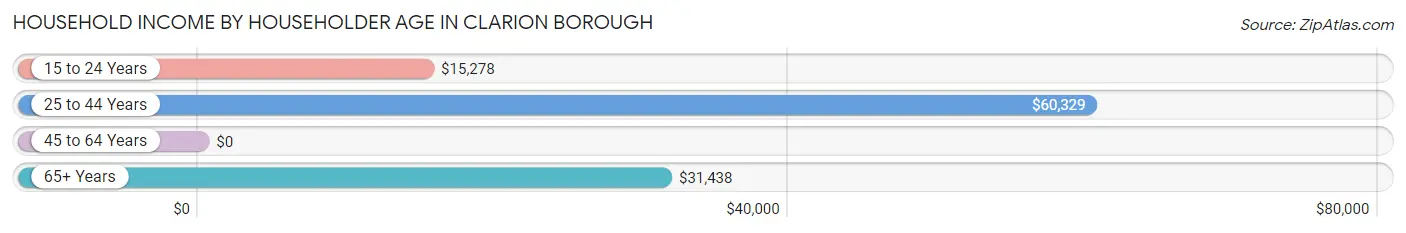
Household Income by Householder Age in Clarion borough
The median household income in Clarion borough is $43,178, with the highest median household income of $60,329 found in the 25 to 44 years age bracket for the primary householder. A total of 583 households (38.0%) fall into this category. Meanwhile, the 45 to 64 years age bracket for the primary householder has the lowest median household income of $0, with 340 households (22.1%) in this group.
| Income Bracket | # Households | Median Income |
| 15 to 24 Years | 240 (15.6%) | $15,278 |
| 25 to 44 Years | 583 (38.0%) | $60,329 |
| 45 to 64 Years | 340 (22.1%) | $0 |
| 65+ Years | 373 (24.3%) | $31,438 |
| Total | 1,536 (100.0%) | $43,178 |
Poverty in Clarion borough
Income Below Poverty by Sex and Age in Clarion borough
With 13.5% poverty level for males and 26.6% for females among the residents of Clarion borough, 5 year old males and 18 to 24 year old females are the most vulnerable to poverty, with 18 males (54.5%) and 319 females (78.6%) in their respective age groups living below the poverty level.
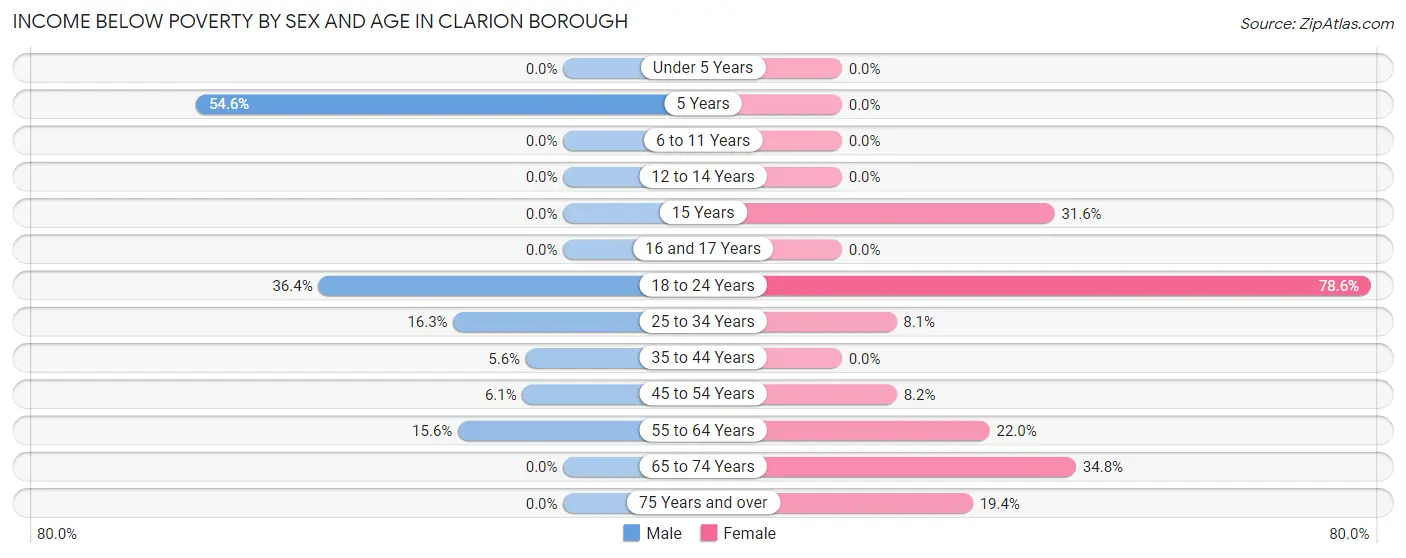
| Age Bracket | Male | Female |
| Under 5 Years | 0 (0.0%) | 0 (0.0%) |
| 5 Years | 18 (54.5%) | 0 (0.0%) |
| 6 to 11 Years | 0 (0.0%) | 0 (0.0%) |
| 12 to 14 Years | 0 (0.0%) | 0 (0.0%) |
| 15 Years | 0 (0.0%) | 6 (31.6%) |
| 16 and 17 Years | 0 (0.0%) | 0 (0.0%) |
| 18 to 24 Years | 120 (36.4%) | 319 (78.6%) |
| 25 to 34 Years | 47 (16.3%) | 33 (8.1%) |
| 35 to 44 Years | 12 (5.6%) | 0 (0.0%) |
| 45 to 54 Years | 8 (6.1%) | 16 (8.2%) |
| 55 to 64 Years | 20 (15.6%) | 27 (22.0%) |
| 65 to 74 Years | 0 (0.0%) | 65 (34.8%) |
| 75 Years and over | 0 (0.0%) | 21 (19.4%) |
| Total | 225 (13.5%) | 487 (26.6%) |
Income Above Poverty by Sex and Age in Clarion borough
According to the poverty statistics in Clarion borough, males aged under 5 years and females aged under 5 years are the age groups that are most secure financially, with 100.0% of males and 100.0% of females in these age groups living above the poverty line.
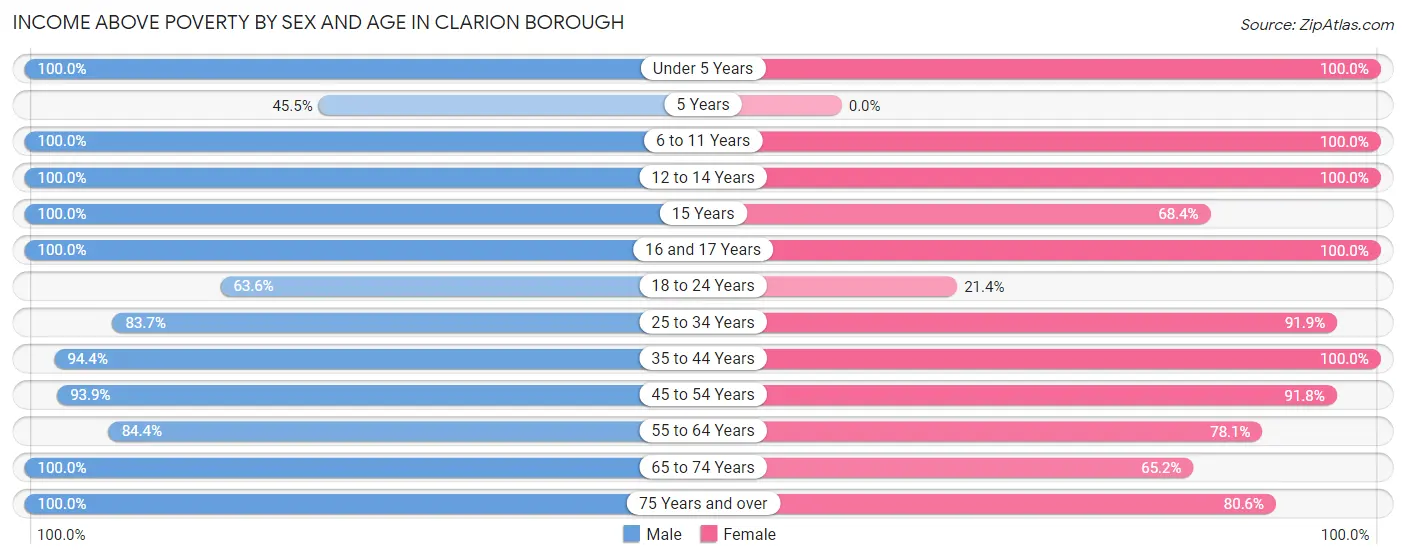
| Age Bracket | Male | Female |
| Under 5 Years | 119 (100.0%) | 87 (100.0%) |
| 5 Years | 15 (45.5%) | 0 (0.0%) |
| 6 to 11 Years | 190 (100.0%) | 59 (100.0%) |
| 12 to 14 Years | 48 (100.0%) | 111 (100.0%) |
| 15 Years | 18 (100.0%) | 13 (68.4%) |
| 16 and 17 Years | 12 (100.0%) | 17 (100.0%) |
| 18 to 24 Years | 210 (63.6%) | 87 (21.4%) |
| 25 to 34 Years | 241 (83.7%) | 375 (91.9%) |
| 35 to 44 Years | 204 (94.4%) | 107 (100.0%) |
| 45 to 54 Years | 124 (93.9%) | 180 (91.8%) |
| 55 to 64 Years | 108 (84.4%) | 96 (78.0%) |
| 65 to 74 Years | 74 (100.0%) | 122 (65.2%) |
| 75 Years and over | 85 (100.0%) | 87 (80.6%) |
| Total | 1,448 (86.6%) | 1,341 (73.4%) |
Income Below Poverty Among Married-Couple Families in Clarion borough
The poverty statistics for married-couple families in Clarion borough show that 2.9% or 14 of the total 478 families live below the poverty line. Families with no children have the highest poverty rate of 3.7%, comprising of 7 families. On the other hand, families with 3 or 4 children have the lowest poverty rate of 0.0%, which includes 0 families.
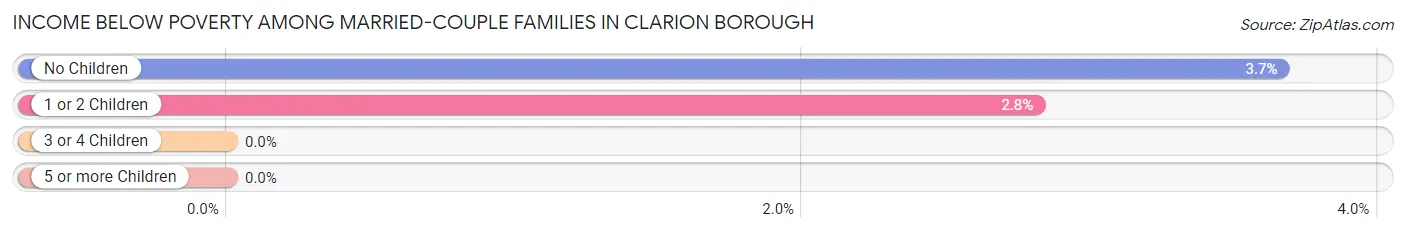
| Children | Above Poverty | Below Poverty |
| No Children | 184 (96.3%) | 7 (3.7%) |
| 1 or 2 Children | 242 (97.2%) | 7 (2.8%) |
| 3 or 4 Children | 38 (100.0%) | 0 (0.0%) |
| 5 or more Children | 0 (0.0%) | 0 (0.0%) |
| Total | 464 (97.1%) | 14 (2.9%) |
Income Below Poverty Among Single-Parent Households in Clarion borough
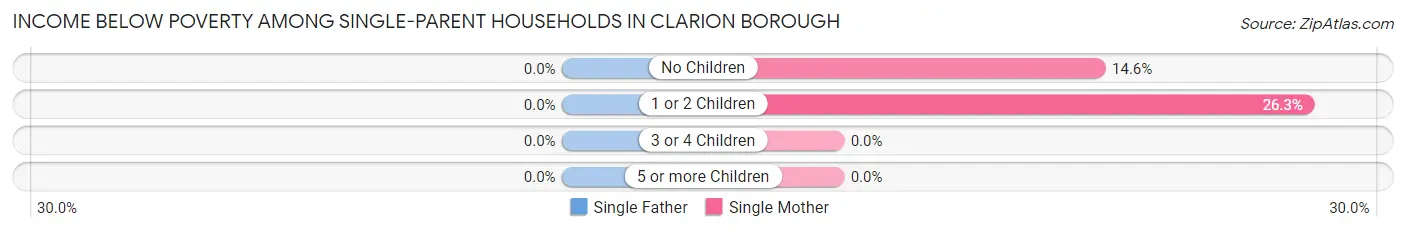
| Children | Single Father | Single Mother |
| No Children | 0 (0.0%) | 13 (14.6%) |
| 1 or 2 Children | 0 (0.0%) | 20 (26.3%) |
| 3 or 4 Children | 0 (0.0%) | 0 (0.0%) |
| 5 or more Children | 0 (0.0%) | 0 (0.0%) |
| Total | 0 (0.0%) | 33 (17.0%) |
Income Below Poverty Among Married-Couple vs Single-Parent Households in Clarion borough
The poverty data for Clarion borough shows that 14 of the married-couple family households (2.9%) and 33 of the single-parent households (12.2%) are living below the poverty level. Within the married-couple family households, those with no children have the highest poverty rate, with 7 households (3.7%) falling below the poverty line. Among the single-parent households, those with 1 or 2 children have the highest poverty rate, with 20 household (16.1%) living below poverty.
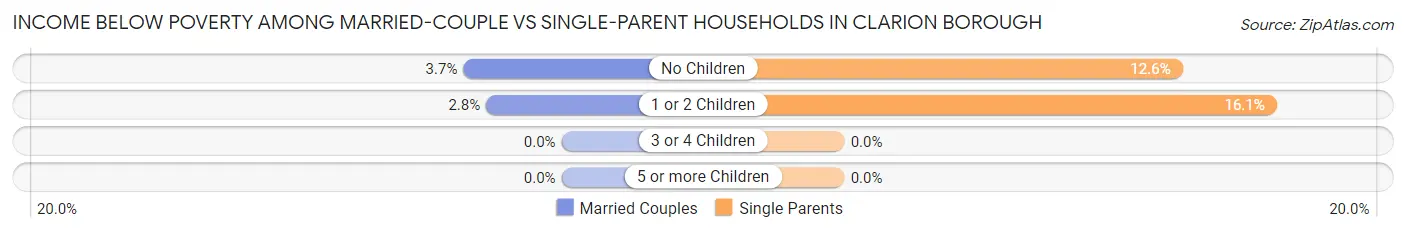
| Children | Married-Couple Families | Single-Parent Households |
| No Children | 7 (3.7%) | 13 (12.6%) |
| 1 or 2 Children | 7 (2.8%) | 20 (16.1%) |
| 3 or 4 Children | 0 (0.0%) | 0 (0.0%) |
| 5 or more Children | 0 (0.0%) | 0 (0.0%) |
| Total | 14 (2.9%) | 33 (12.2%) |
Race in Clarion borough
The most populous races in Clarion borough are White / Caucasian (3,722 | 88.5%), Black / African American (304 | 7.2%), and Hispanic or Latino (175 | 4.2%).
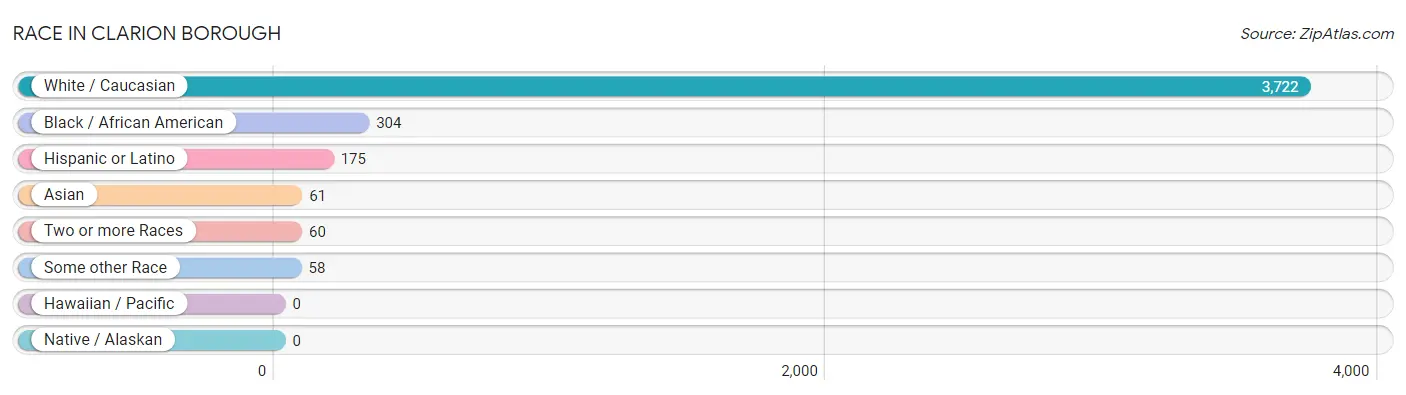
| Race | # Population | % Population |
| Asian | 61 | 1.5% |
| Black / African American | 304 | 7.2% |
| Hawaiian / Pacific | 0 | 0.0% |
| Hispanic or Latino | 175 | 4.2% |
| Native / Alaskan | 0 | 0.0% |
| White / Caucasian | 3,722 | 88.5% |
| Two or more Races | 60 | 1.4% |
| Some other Race | 58 | 1.4% |
| Total | 4,205 | 100.0% |
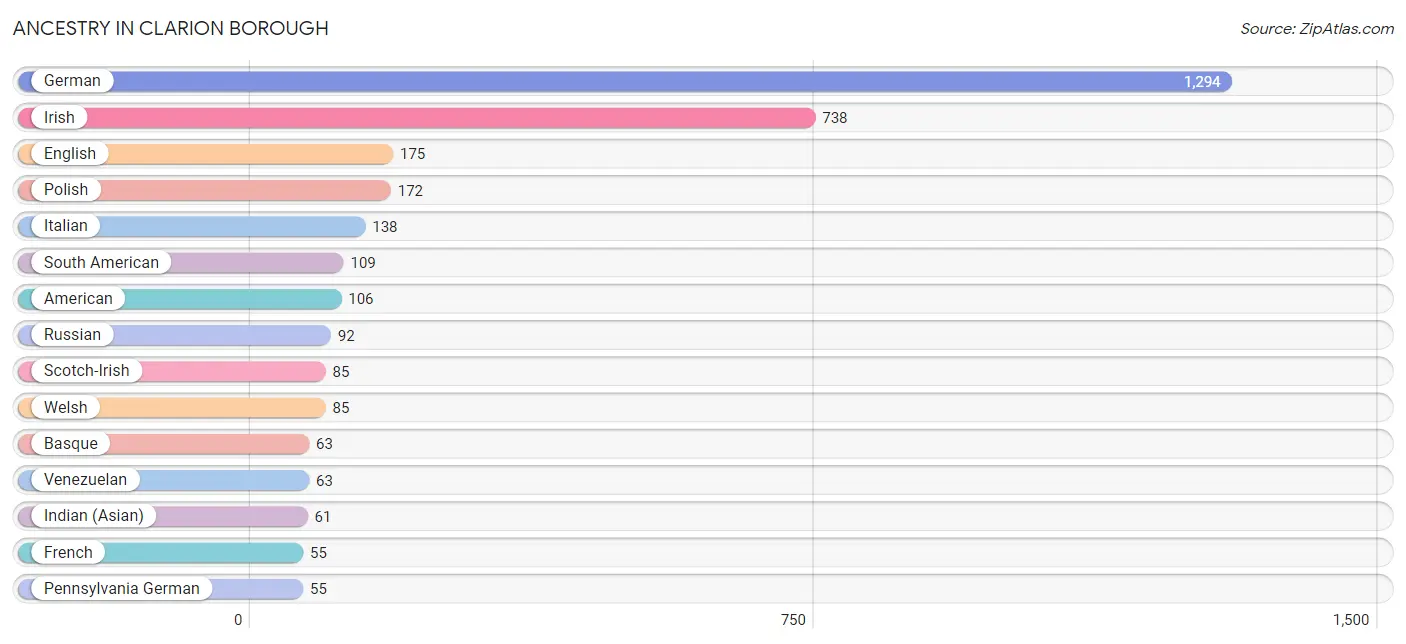
Ancestry in Clarion borough
The most populous ancestries reported in Clarion borough are German (1,294 | 30.8%), Irish (738 | 17.5%), English (175 | 4.2%), Polish (172 | 4.1%), and Italian (138 | 3.3%), together accounting for 59.9% of all Clarion borough residents.
| Ancestry | # Population | % Population |
| American | 106 | 2.5% |
| Basque | 63 | 1.5% |
| British | 10 | 0.2% |
| Chilean | 46 | 1.1% |
| Dutch | 54 | 1.3% |
| English | 175 | 4.2% |
| European | 48 | 1.1% |
| French | 55 | 1.3% |
| French Canadian | 9 | 0.2% |
| German | 1,294 | 30.8% |
| Greek | 5 | 0.1% |
| Hungarian | 20 | 0.5% |
| Indian (Asian) | 61 | 1.5% |
| Irish | 738 | 17.5% |
| Italian | 138 | 3.3% |
| Lithuanian | 7 | 0.2% |
| Mexican | 13 | 0.3% |
| Pennsylvania German | 55 | 1.3% |
| Polish | 172 | 4.1% |
| Puerto Rican | 46 | 1.1% |
| Russian | 92 | 2.2% |
| Scotch-Irish | 85 | 2.0% |
| Scottish | 28 | 0.7% |
| Serbian | 3 | 0.1% |
| Slavic | 5 | 0.1% |
| Slovak | 14 | 0.3% |
| South American | 109 | 2.6% |
| Spaniard | 4 | 0.1% |
| Spanish | 3 | 0.1% |
| Swedish | 10 | 0.2% |
| Swiss | 5 | 0.1% |
| Venezuelan | 63 | 1.5% |
| Welsh | 85 | 2.0% | View All 33 Rows |
Immigrants in Clarion borough
The most numerous immigrant groups reported in Clarion borough came from Latin America (109 | 2.6%), South America (109 | 2.6%), Venezuela (70 | 1.7%), Asia (49 | 1.2%), and China (49 | 1.2%), together accounting for 9.2% of all Clarion borough residents.
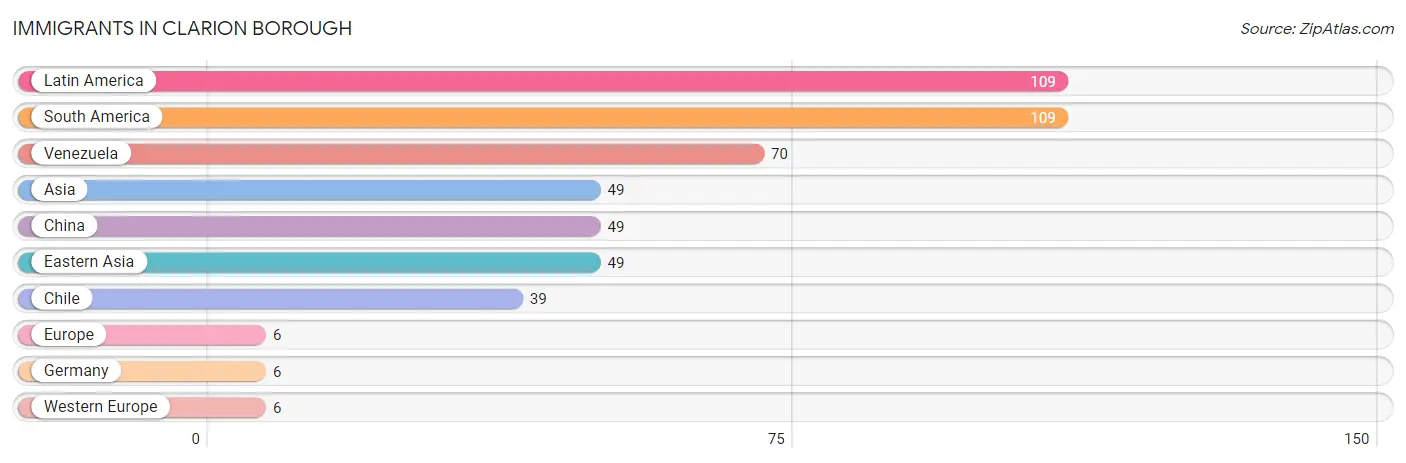
| Immigration Origin | # Population | % Population |
| Asia | 49 | 1.2% |
| Chile | 39 | 0.9% |
| China | 49 | 1.2% |
| Eastern Asia | 49 | 1.2% |
| Europe | 6 | 0.1% |
| Germany | 6 | 0.1% |
| Latin America | 109 | 2.6% |
| South America | 109 | 2.6% |
| Venezuela | 70 | 1.7% |
| Western Europe | 6 | 0.1% | View All 10 Rows |
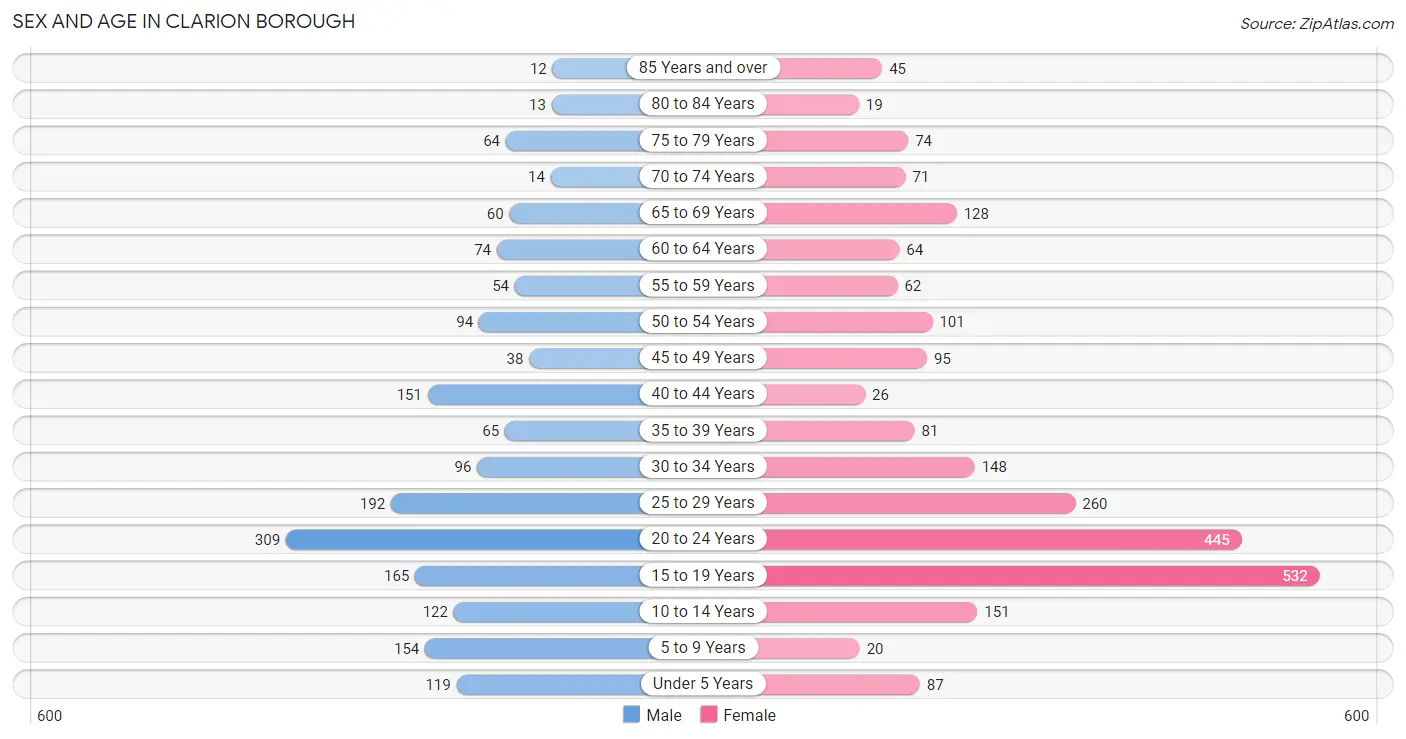
Sex and Age in Clarion borough
Sex and Age in Clarion borough
The most populous age groups in Clarion borough are 20 to 24 Years (309 | 17.2%) for men and 15 to 19 Years (532 | 22.1%) for women.
| Age Bracket | Male | Female |
| Under 5 Years | 119 (6.6%) | 87 (3.6%) |
| 5 to 9 Years | 154 (8.6%) | 20 (0.8%) |
| 10 to 14 Years | 122 (6.8%) | 151 (6.3%) |
| 15 to 19 Years | 165 (9.2%) | 532 (22.1%) |
| 20 to 24 Years | 309 (17.2%) | 445 (18.5%) |
| 25 to 29 Years | 192 (10.7%) | 260 (10.8%) |
| 30 to 34 Years | 96 (5.3%) | 148 (6.1%) |
| 35 to 39 Years | 65 (3.6%) | 81 (3.4%) |
| 40 to 44 Years | 151 (8.4%) | 26 (1.1%) |
| 45 to 49 Years | 38 (2.1%) | 95 (3.9%) |
| 50 to 54 Years | 94 (5.2%) | 101 (4.2%) |
| 55 to 59 Years | 54 (3.0%) | 62 (2.6%) |
| 60 to 64 Years | 74 (4.1%) | 64 (2.7%) |
| 65 to 69 Years | 60 (3.3%) | 128 (5.3%) |
| 70 to 74 Years | 14 (0.8%) | 71 (2.9%) |
| 75 to 79 Years | 64 (3.6%) | 74 (3.1%) |
| 80 to 84 Years | 13 (0.7%) | 19 (0.8%) |
| 85 Years and over | 12 (0.7%) | 45 (1.9%) |
| Total | 1,796 (100.0%) | 2,409 (100.0%) |
Families and Households in Clarion borough
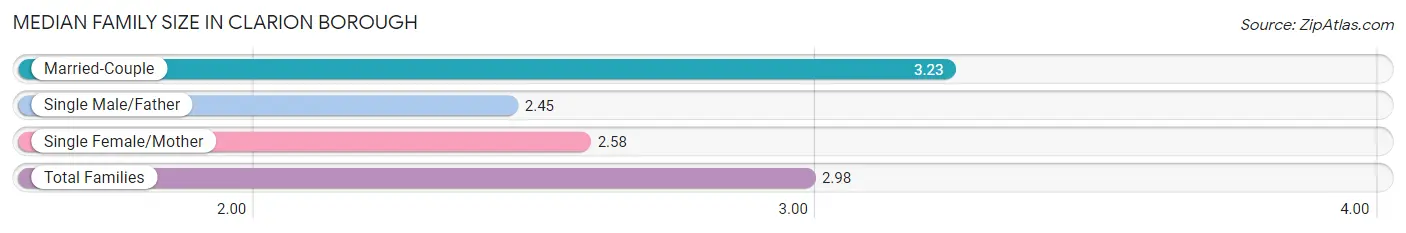
Median Family Size in Clarion borough
The median family size in Clarion borough is 2.98 persons per family, with married-couple families (478 | 63.9%) accounting for the largest median family size of 3.23 persons per family. On the other hand, single male/father families (76 | 10.2%) represent the smallest median family size with 2.45 persons per family.
| Family Type | # Families | Family Size |
| Married-Couple | 478 (63.9%) | 3.23 |
| Single Male/Father | 76 (10.2%) | 2.45 |
| Single Female/Mother | 194 (25.9%) | 2.58 |
| Total Families | 748 (100.0%) | 2.98 |
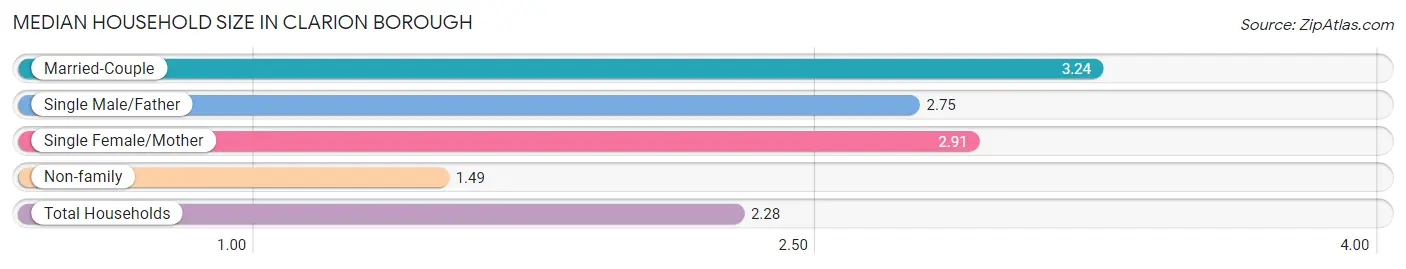
Median Household Size in Clarion borough
The median household size in Clarion borough is 2.28 persons per household, with married-couple households (478 | 31.1%) accounting for the largest median household size of 3.24 persons per household. non-family households (788 | 51.3%) represent the smallest median household size with 1.49 persons per household.
| Household Type | # Households | Household Size |
| Married-Couple | 478 (31.1%) | 3.24 |
| Single Male/Father | 76 (5.0%) | 2.75 |
| Single Female/Mother | 194 (12.6%) | 2.91 |
| Non-family | 788 (51.3%) | 1.49 |
| Total Households | 1,536 (100.0%) | 2.28 |
Household Size by Marriage Status in Clarion borough
Out of a total of 1,536 households in Clarion borough, 748 (48.7%) are family households, while 788 (51.3%) are nonfamily households. The most numerous type of family households are 2-person households, comprising 321, and the most common type of nonfamily households are 1-person households, comprising 500.
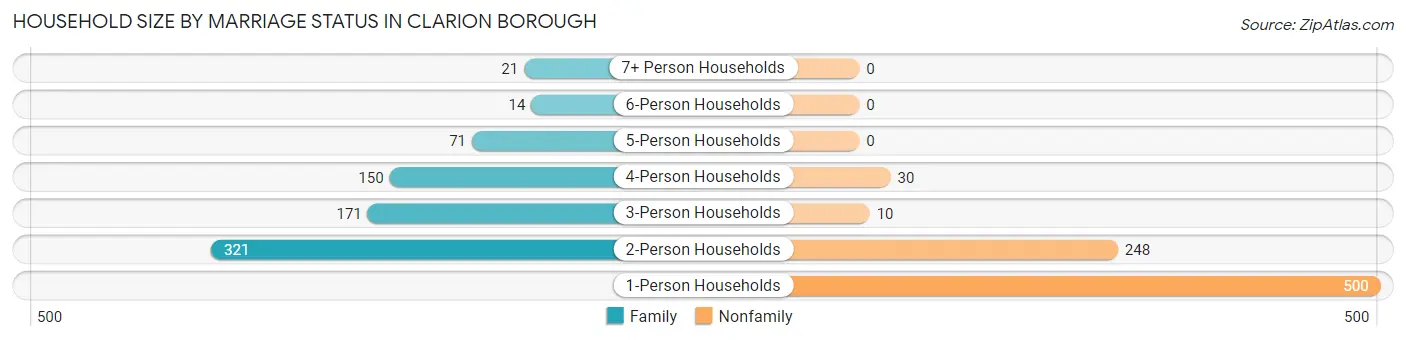
| Household Size | Family Households | Nonfamily Households |
| 1-Person Households | - | 500 (32.6%) |
| 2-Person Households | 321 (20.9%) | 248 (16.2%) |
| 3-Person Households | 171 (11.1%) | 10 (0.6%) |
| 4-Person Households | 150 (9.8%) | 30 (1.9%) |
| 5-Person Households | 71 (4.6%) | 0 (0.0%) |
| 6-Person Households | 14 (0.9%) | 0 (0.0%) |
| 7+ Person Households | 21 (1.4%) | 0 (0.0%) |
| Total | 748 (48.7%) | 788 (51.3%) |
Female Fertility in Clarion borough
Fertility by Age in Clarion borough
Average fertility rate in Clarion borough is 20.0 births per 1,000 women. Women in the age bracket of 20 to 34 years have the highest fertility rate with 38.0 births per 1,000 women. Women in the age bracket of 20 to 34 years acount for 100.0% of all women with births.
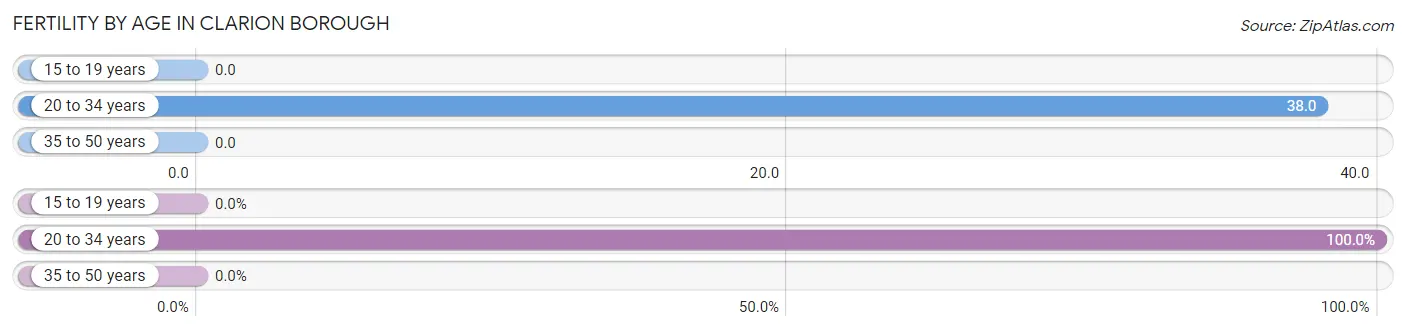
| Age Bracket | Women with Births | Births / 1,000 Women |
| 15 to 19 years | 0 (0.0%) | 0.0 |
| 20 to 34 years | 32 (100.0%) | 38.0 |
| 35 to 50 years | 0 (0.0%) | 0.0 |
| Total | 32 (100.0%) | 20.0 |
Fertility by Age by Marriage Status in Clarion borough
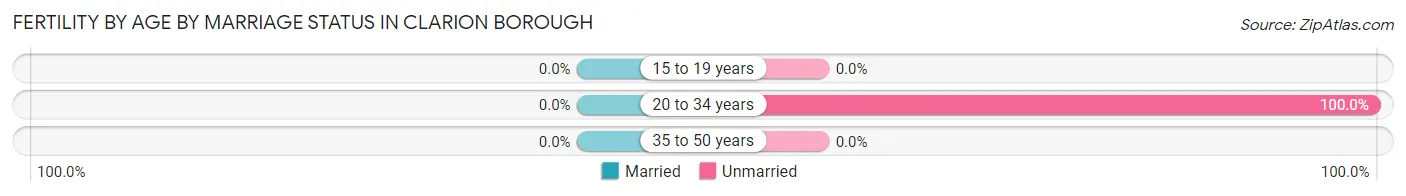
| Age Bracket | Married | Unmarried |
| 15 to 19 years | 0 (0.0%) | 0 (0.0%) |
| 20 to 34 years | 0 (0.0%) | 32 (100.0%) |
| 35 to 50 years | 0 (0.0%) | 0 (0.0%) |
| Total | 0 (0.0%) | 32 (100.0%) |
Fertility by Education in Clarion borough
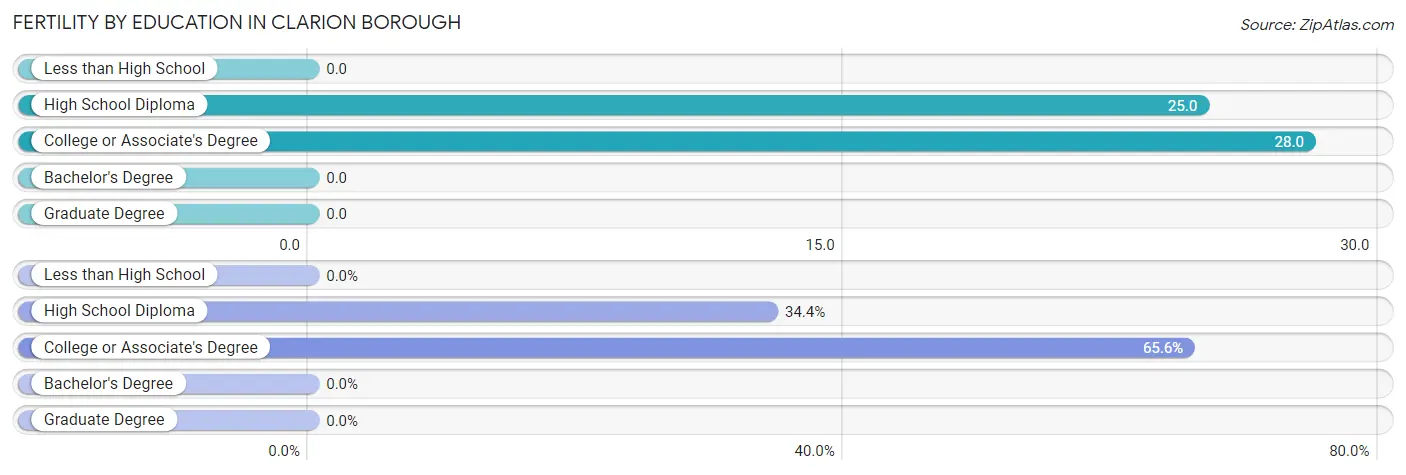
| Educational Attainment | Women with Births | Births / 1,000 Women |
| Less than High School | 0 (0.0%) | 0.0 |
| High School Diploma | 11 (34.4%) | 25.0 |
| College or Associate's Degree | 21 (65.6%) | 28.0 |
| Bachelor's Degree | 0 (0.0%) | 0.0 |
| Graduate Degree | 0 (0.0%) | 0.0 |
| Total | 32 (100.0%) | 20.0 |
Fertility by Education by Marriage Status in Clarion borough
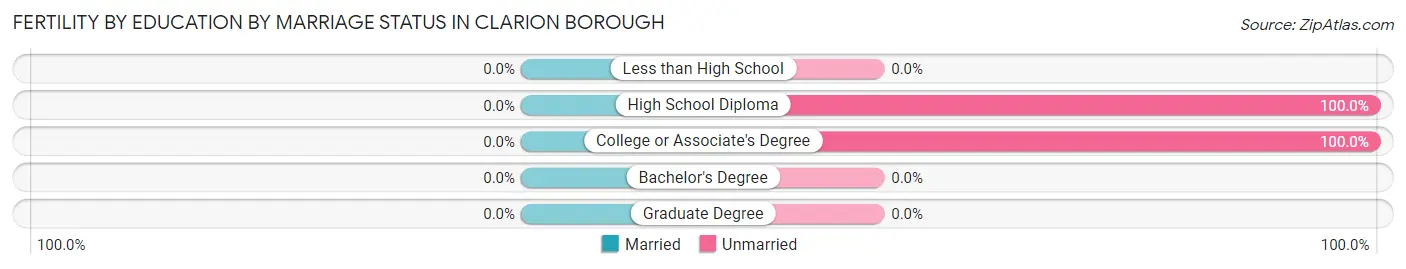
| Educational Attainment | Married | Unmarried |
| Less than High School | 0 (0.0%) | 0 (0.0%) |
| High School Diploma | 0 (0.0%) | 11 (100.0%) |
| College or Associate's Degree | 0 (0.0%) | 21 (100.0%) |
| Bachelor's Degree | 0 (0.0%) | 0 (0.0%) |
| Graduate Degree | 0 (0.0%) | 0 (0.0%) |
| Total | 0 (0.0%) | 32 (100.0%) |
Employment Characteristics in Clarion borough
Employment by Class of Employer in Clarion borough
Among the 2,007 employed individuals in Clarion borough, private company employees (1,044 | 52.0%), state government employees (444 | 22.1%), and not-for-profit organizations (259 | 12.9%) make up the most common classes of employment.
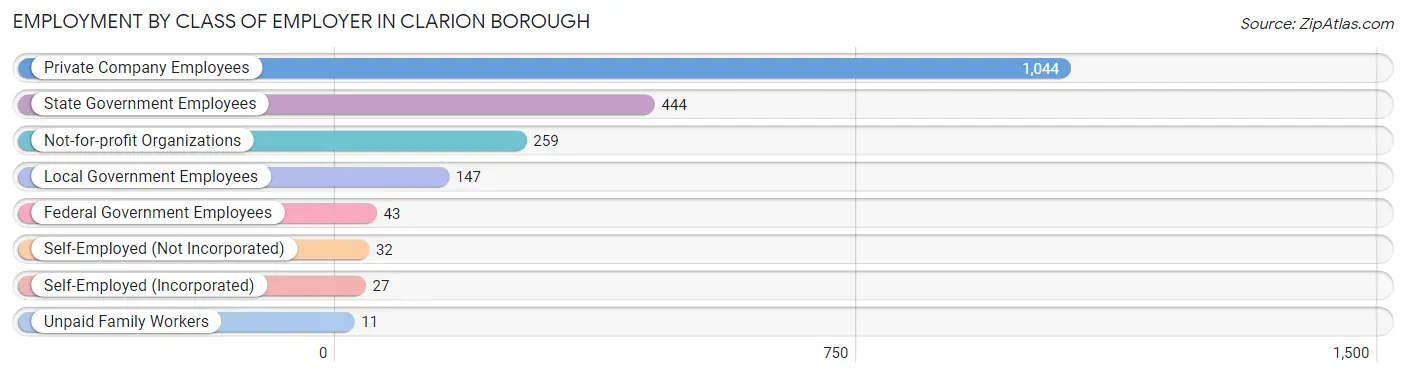
| Employer Class | # Employees | % Employees |
| Private Company Employees | 1,044 | 52.0% |
| Self-Employed (Incorporated) | 27 | 1.3% |
| Self-Employed (Not Incorporated) | 32 | 1.6% |
| Not-for-profit Organizations | 259 | 12.9% |
| Local Government Employees | 147 | 7.3% |
| State Government Employees | 444 | 22.1% |
| Federal Government Employees | 43 | 2.1% |
| Unpaid Family Workers | 11 | 0.5% |
| Total | 2,007 | 100.0% |
Employment Status by Age in Clarion borough
According to the labor force statistics for Clarion borough, out of the total population over 16 years of age (3,515), 67.7% or 2,380 individuals are in the labor force, with 10.2% or 243 of them unemployed. The age group with the highest labor force participation rate is 35 to 44 years, with 96.6% or 312 individuals in the labor force. Within the labor force, the 16 to 19 years age range has the highest percentage of unemployed individuals, with 43.0% or 220 of them being unemployed.
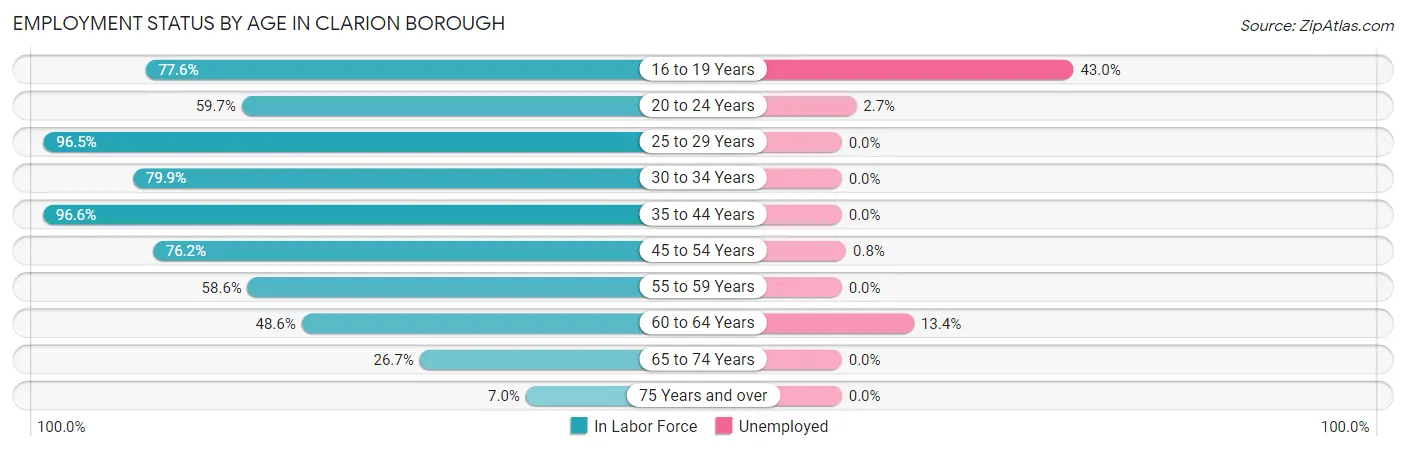
| Age Bracket | In Labor Force | Unemployed |
| 16 to 19 Years | 512 (77.6%) | 220 (43.0%) |
| 20 to 24 Years | 450 (59.7%) | 12 (2.7%) |
| 25 to 29 Years | 436 (96.5%) | 0 (0.0%) |
| 30 to 34 Years | 195 (79.9%) | 0 (0.0%) |
| 35 to 44 Years | 312 (96.6%) | 0 (0.0%) |
| 45 to 54 Years | 250 (76.2%) | 2 (0.8%) |
| 55 to 59 Years | 68 (58.6%) | 0 (0.0%) |
| 60 to 64 Years | 67 (48.6%) | 9 (13.4%) |
| 65 to 74 Years | 73 (26.7%) | 0 (0.0%) |
| 75 Years and over | 16 (7.0%) | 0 (0.0%) |
| Total | 2,380 (67.7%) | 243 (10.2%) |
Employment Status by Educational Attainment in Clarion borough
According to labor force statistics for Clarion borough, 82.9% of individuals (1,327) out of the total population between 25 and 64 years of age (1,601) are in the labor force, with 0.8% or 11 of them being unemployed. The group with the highest labor force participation rate are those with the educational attainment of college / associate degree, with 90.2% or 268 individuals in the labor force. Within the labor force, individuals with less than high school education have the highest percentage of unemployment, with 20.9% or 9 of them being unemployed.
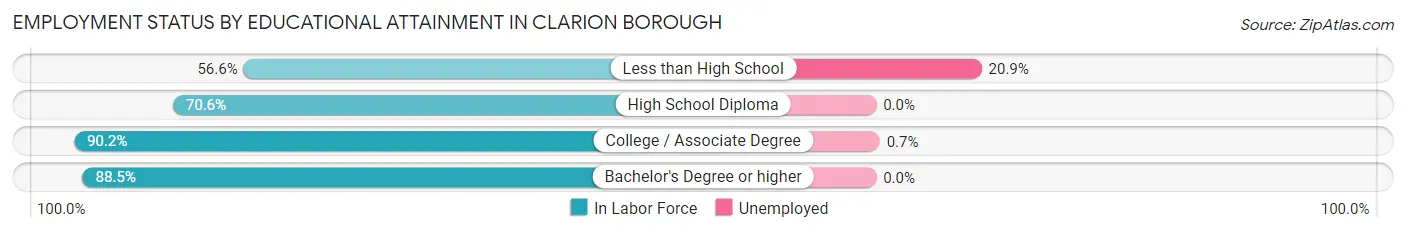
| Educational Attainment | In Labor Force | Unemployed |
| Less than High School | 43 (56.6%) | 16 (20.9%) |
| High School Diploma | 276 (70.6%) | 0 (0.0%) |
| College / Associate Degree | 268 (90.2%) | 2 (0.7%) |
| Bachelor's Degree or higher | 741 (88.5%) | 0 (0.0%) |
| Total | 1,327 (82.9%) | 13 (0.8%) |
Employment Occupations by Sex in Clarion borough
Management, Business, Science and Arts Occupations
The most common Management, Business, Science and Arts occupations in Clarion borough are Community & Social Service (371 | 17.5%), Education Instruction & Library (223 | 10.5%), Management (193 | 9.1%), Business & Financial (89 | 4.2%), and Health Diagnosing & Treating (81 | 3.8%).
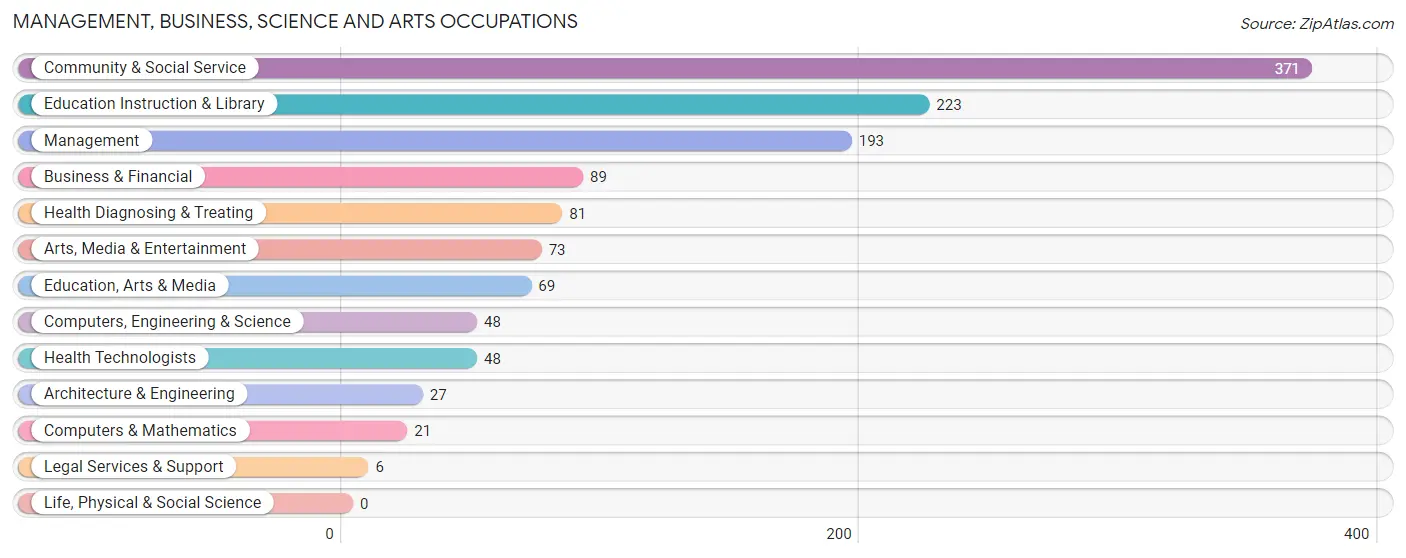
Management, Business, Science and Arts Occupations by Sex
Within the Management, Business, Science and Arts occupations in Clarion borough, the most male-oriented occupations are Computers & Mathematics (100.0%), Computers, Engineering & Science (83.3%), and Management (80.3%), while the most female-oriented occupations are Legal Services & Support (100.0%), Arts, Media & Entertainment (90.4%), and Community & Social Service (73.1%).
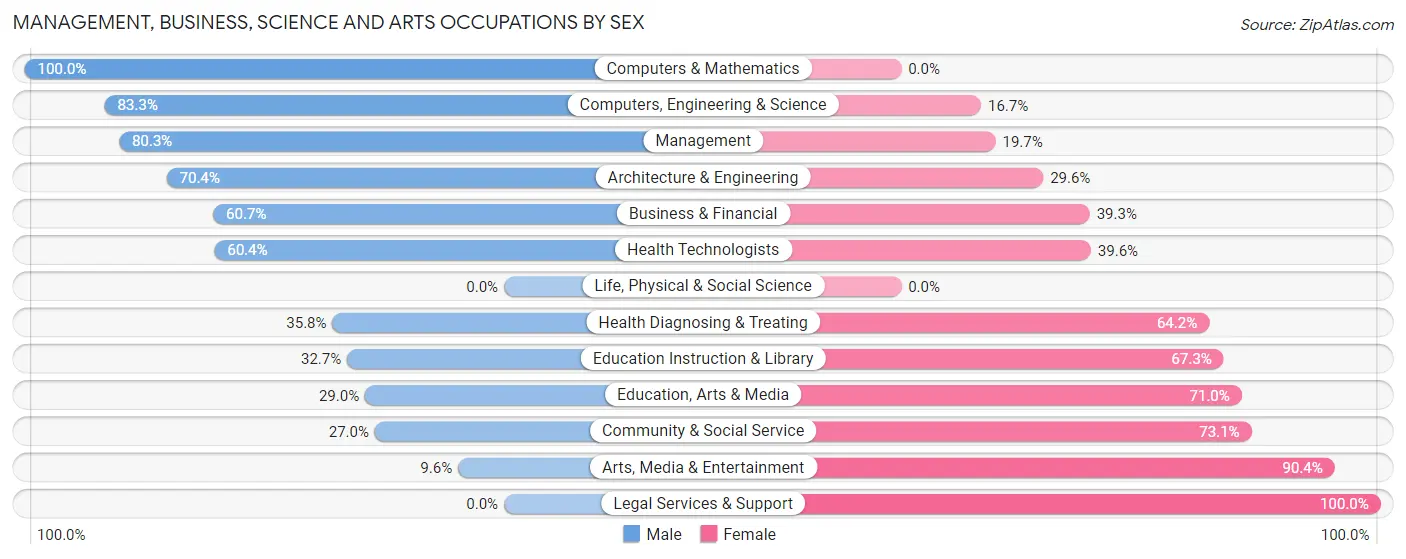
| Occupation | Male | Female |
| Management | 155 (80.3%) | 38 (19.7%) |
| Business & Financial | 54 (60.7%) | 35 (39.3%) |
| Computers, Engineering & Science | 40 (83.3%) | 8 (16.7%) |
| Computers & Mathematics | 21 (100.0%) | 0 (0.0%) |
| Architecture & Engineering | 19 (70.4%) | 8 (29.6%) |
| Life, Physical & Social Science | 0 (0.0%) | 0 (0.0%) |
| Community & Social Service | 100 (27.0%) | 271 (73.1%) |
| Education, Arts & Media | 20 (29.0%) | 49 (71.0%) |
| Legal Services & Support | 0 (0.0%) | 6 (100.0%) |
| Education Instruction & Library | 73 (32.7%) | 150 (67.3%) |
| Arts, Media & Entertainment | 7 (9.6%) | 66 (90.4%) |
| Health Diagnosing & Treating | 29 (35.8%) | 52 (64.2%) |
| Health Technologists | 29 (60.4%) | 19 (39.6%) |
| Total (Category) | 378 (48.3%) | 404 (51.7%) |
| Total (Overall) | 979 (46.3%) | 1,135 (53.7%) |
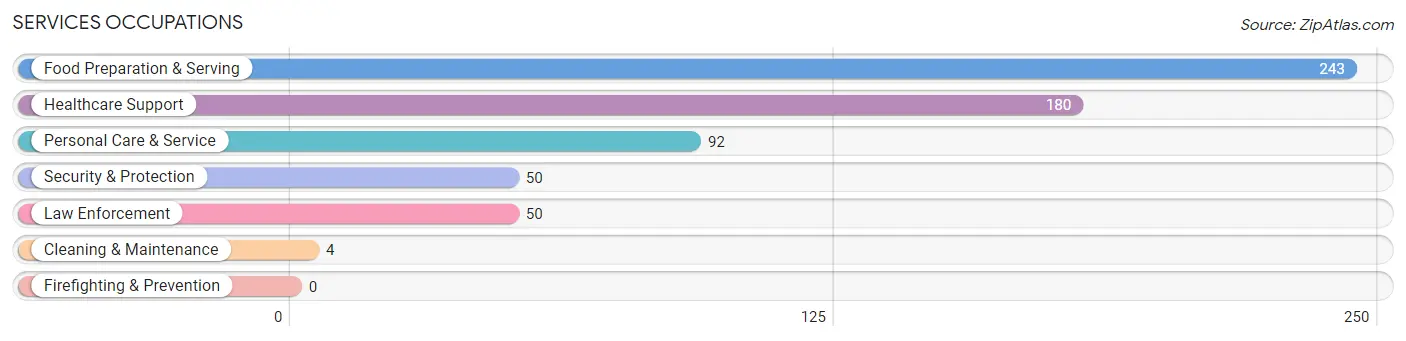
Services Occupations
The most common Services occupations in Clarion borough are Food Preparation & Serving (243 | 11.5%), Healthcare Support (180 | 8.5%), Personal Care & Service (92 | 4.3%), Security & Protection (50 | 2.4%), and Law Enforcement (50 | 2.4%).
Services Occupations by Sex
Within the Services occupations in Clarion borough, the most male-oriented occupations are Security & Protection (86.0%), Law Enforcement (86.0%), and Food Preparation & Serving (38.3%), while the most female-oriented occupations are Cleaning & Maintenance (100.0%), Healthcare Support (77.8%), and Personal Care & Service (70.7%).
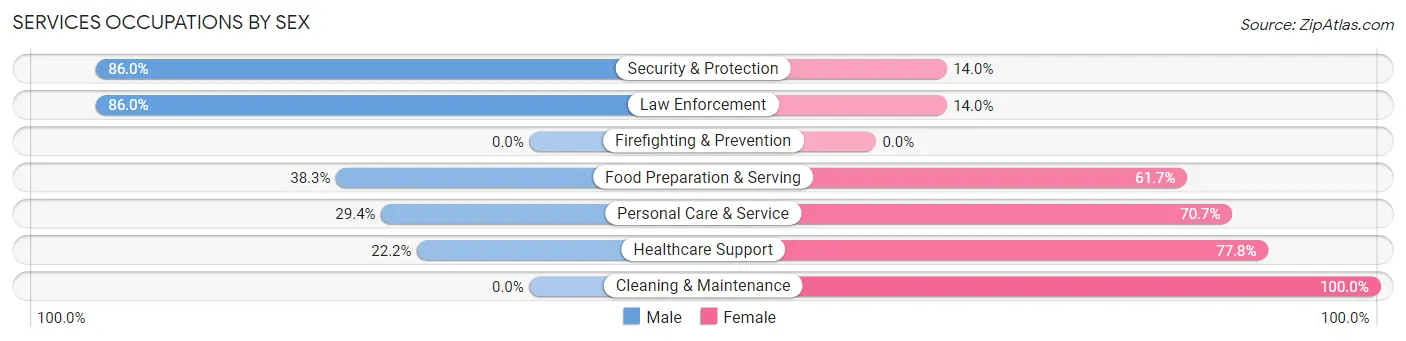
| Occupation | Male | Female |
| Healthcare Support | 40 (22.2%) | 140 (77.8%) |
| Security & Protection | 43 (86.0%) | 7 (14.0%) |
| Firefighting & Prevention | 0 (0.0%) | 0 (0.0%) |
| Law Enforcement | 43 (86.0%) | 7 (14.0%) |
| Food Preparation & Serving | 93 (38.3%) | 150 (61.7%) |
| Cleaning & Maintenance | 0 (0.0%) | 4 (100.0%) |
| Personal Care & Service | 27 (29.3%) | 65 (70.7%) |
| Total (Category) | 203 (35.7%) | 366 (64.3%) |
| Total (Overall) | 979 (46.3%) | 1,135 (53.7%) |
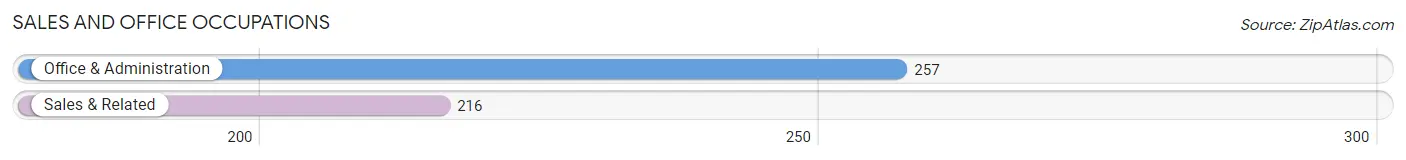
Sales and Office Occupations
The most common Sales and Office occupations in Clarion borough are Office & Administration (257 | 12.2%), and Sales & Related (216 | 10.2%).
Sales and Office Occupations by Sex
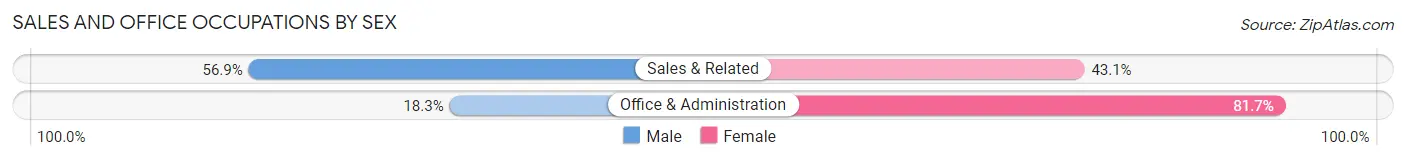
| Occupation | Male | Female |
| Sales & Related | 123 (56.9%) | 93 (43.1%) |
| Office & Administration | 47 (18.3%) | 210 (81.7%) |
| Total (Category) | 170 (35.9%) | 303 (64.1%) |
| Total (Overall) | 979 (46.3%) | 1,135 (53.7%) |
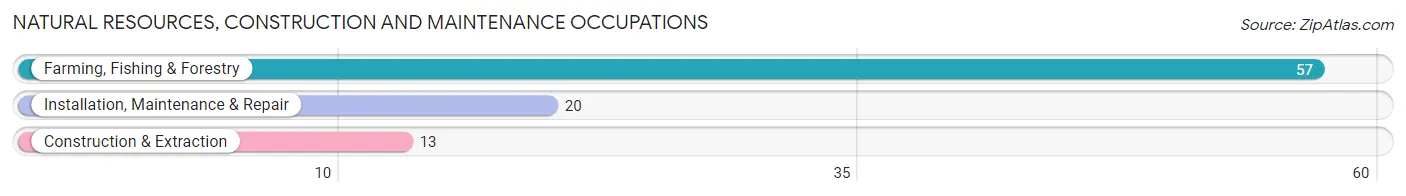
Natural Resources, Construction and Maintenance Occupations
The most common Natural Resources, Construction and Maintenance occupations in Clarion borough are Farming, Fishing & Forestry (57 | 2.7%), Installation, Maintenance & Repair (20 | 0.9%), and Construction & Extraction (13 | 0.6%).
Natural Resources, Construction and Maintenance Occupations by Sex
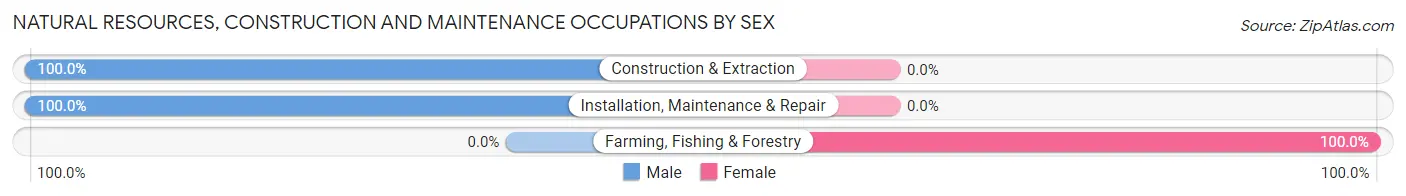
| Occupation | Male | Female |
| Farming, Fishing & Forestry | 0 (0.0%) | 57 (100.0%) |
| Construction & Extraction | 13 (100.0%) | 0 (0.0%) |
| Installation, Maintenance & Repair | 20 (100.0%) | 0 (0.0%) |
| Total (Category) | 33 (36.7%) | 57 (63.3%) |
| Total (Overall) | 979 (46.3%) | 1,135 (53.7%) |
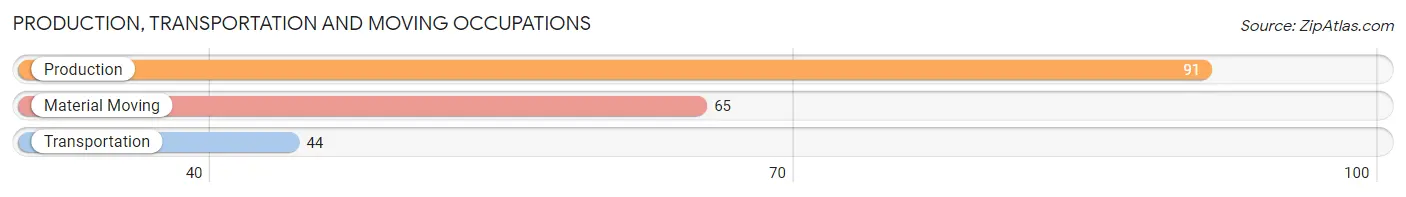
Production, Transportation and Moving Occupations
The most common Production, Transportation and Moving occupations in Clarion borough are Production (91 | 4.3%), Material Moving (65 | 3.1%), and Transportation (44 | 2.1%).
Production, Transportation and Moving Occupations by Sex
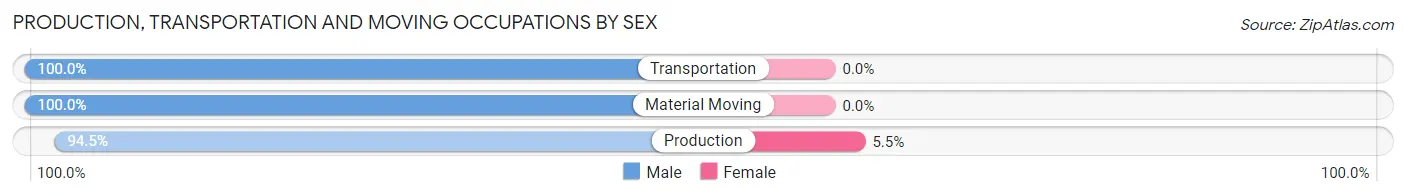
| Occupation | Male | Female |
| Production | 86 (94.5%) | 5 (5.5%) |
| Transportation | 44 (100.0%) | 0 (0.0%) |
| Material Moving | 65 (100.0%) | 0 (0.0%) |
| Total (Category) | 195 (97.5%) | 5 (2.5%) |
| Total (Overall) | 979 (46.3%) | 1,135 (53.7%) |
Employment Industries by Sex in Clarion borough
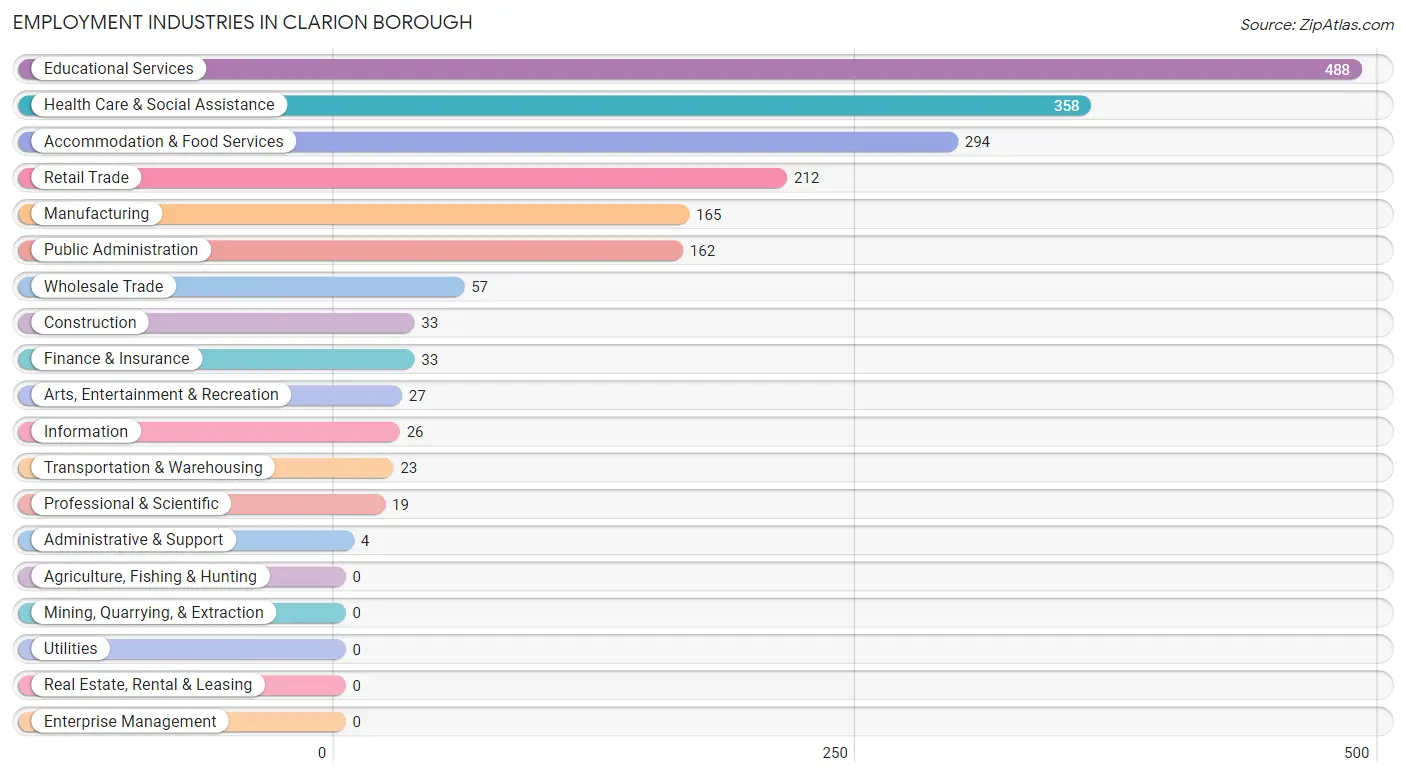
Employment Industries in Clarion borough
The major employment industries in Clarion borough include Educational Services (488 | 23.1%), Health Care & Social Assistance (358 | 16.9%), Accommodation & Food Services (294 | 13.9%), Retail Trade (212 | 10.0%), and Manufacturing (165 | 7.8%).
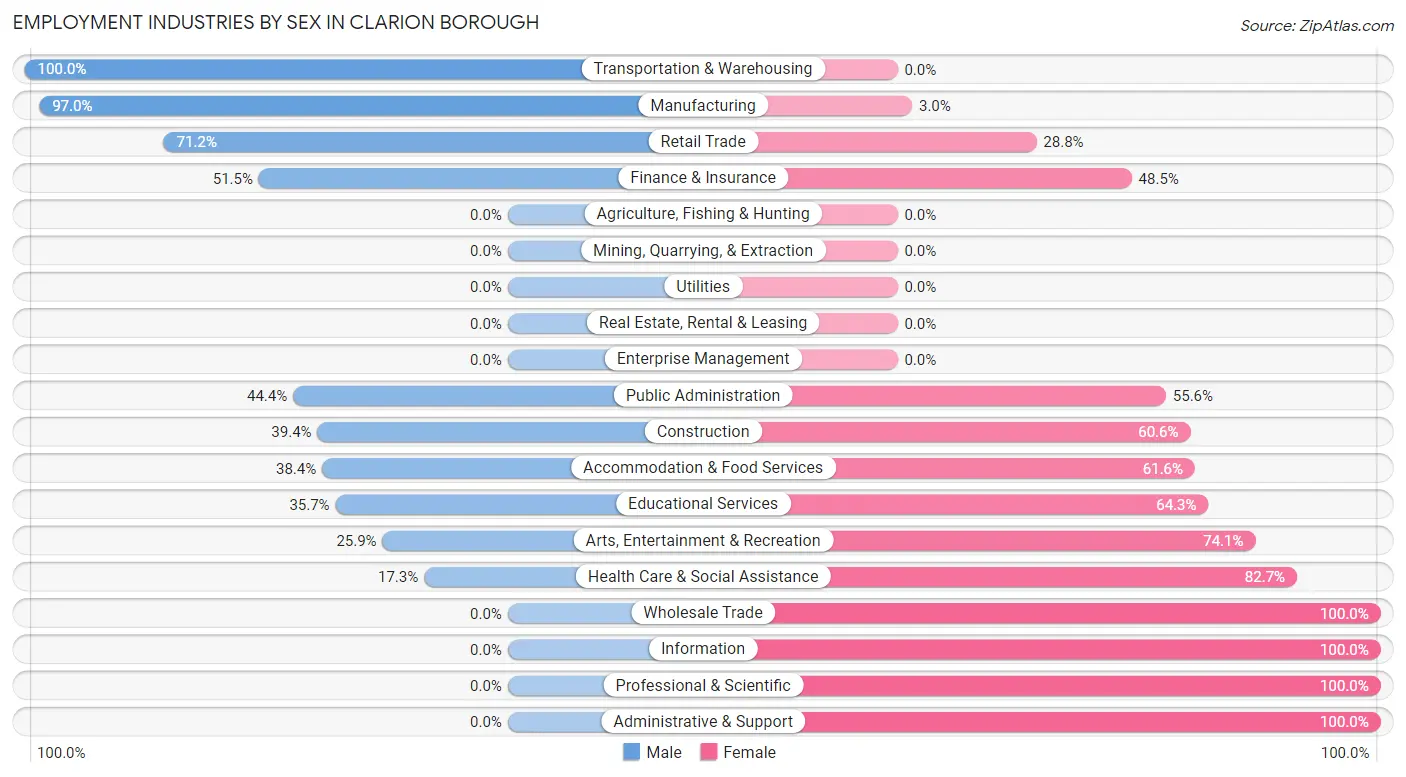
Employment Industries by Sex in Clarion borough
The Clarion borough industries that see more men than women are Transportation & Warehousing (100.0%), Manufacturing (97.0%), and Retail Trade (71.2%), whereas the industries that tend to have a higher number of women are Wholesale Trade (100.0%), Information (100.0%), and Professional & Scientific (100.0%).
| Industry | Male | Female |
| Agriculture, Fishing & Hunting | 0 (0.0%) | 0 (0.0%) |
| Mining, Quarrying, & Extraction | 0 (0.0%) | 0 (0.0%) |
| Construction | 13 (39.4%) | 20 (60.6%) |
| Manufacturing | 160 (97.0%) | 5 (3.0%) |
| Wholesale Trade | 0 (0.0%) | 57 (100.0%) |
| Retail Trade | 151 (71.2%) | 61 (28.8%) |
| Transportation & Warehousing | 23 (100.0%) | 0 (0.0%) |
| Utilities | 0 (0.0%) | 0 (0.0%) |
| Information | 0 (0.0%) | 26 (100.0%) |
| Finance & Insurance | 17 (51.5%) | 16 (48.5%) |
| Real Estate, Rental & Leasing | 0 (0.0%) | 0 (0.0%) |
| Professional & Scientific | 0 (0.0%) | 19 (100.0%) |
| Enterprise Management | 0 (0.0%) | 0 (0.0%) |
| Administrative & Support | 0 (0.0%) | 4 (100.0%) |
| Educational Services | 174 (35.7%) | 314 (64.3%) |
| Health Care & Social Assistance | 62 (17.3%) | 296 (82.7%) |
| Arts, Entertainment & Recreation | 7 (25.9%) | 20 (74.1%) |
| Accommodation & Food Services | 113 (38.4%) | 181 (61.6%) |
| Public Administration | 72 (44.4%) | 90 (55.6%) |
| Total | 979 (46.3%) | 1,135 (53.7%) |
Education in Clarion borough
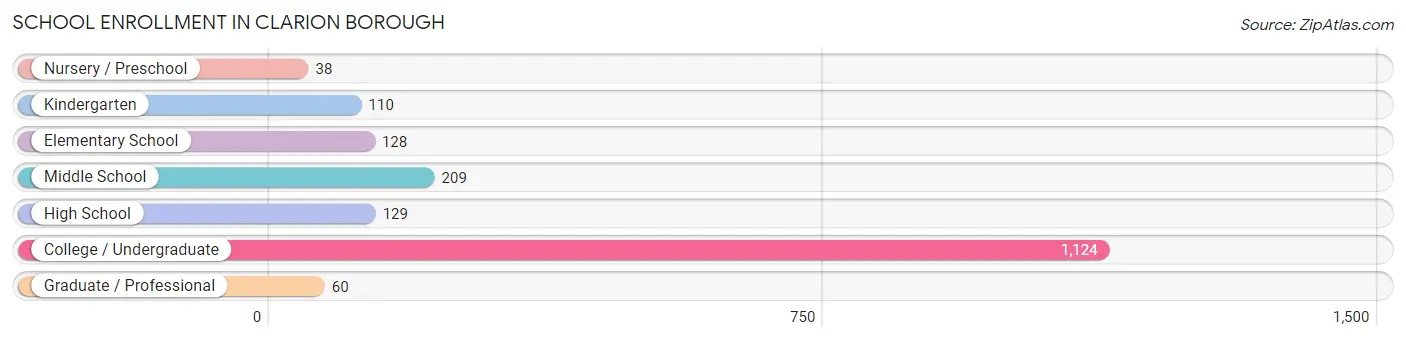
School Enrollment in Clarion borough
The most common levels of schooling among the 1,798 students in Clarion borough are college / undergraduate (1,124 | 62.5%), middle school (209 | 11.6%), and high school (129 | 7.2%).
| School Level | # Students | % Students |
| Nursery / Preschool | 38 | 2.1% |
| Kindergarten | 110 | 6.1% |
| Elementary School | 128 | 7.1% |
| Middle School | 209 | 11.6% |
| High School | 129 | 7.2% |
| College / Undergraduate | 1,124 | 62.5% |
| Graduate / Professional | 60 | 3.3% |
| Total | 1,798 | 100.0% |
School Enrollment by Age by Funding Source in Clarion borough
Out of a total of 1,798 students who are enrolled in schools in Clarion borough, 189 (10.5%) attend a private institution, while the remaining 1,609 (89.5%) are enrolled in public schools. The age group of 3 to 4 year olds has the highest likelihood of being enrolled in private schools, with 19 (50.0% in the age bracket) enrolled. Conversely, the age group of 10 to 14 year olds has the lowest likelihood of being enrolled in a private school, with 273 (100.0% in the age bracket) attending a public institution.
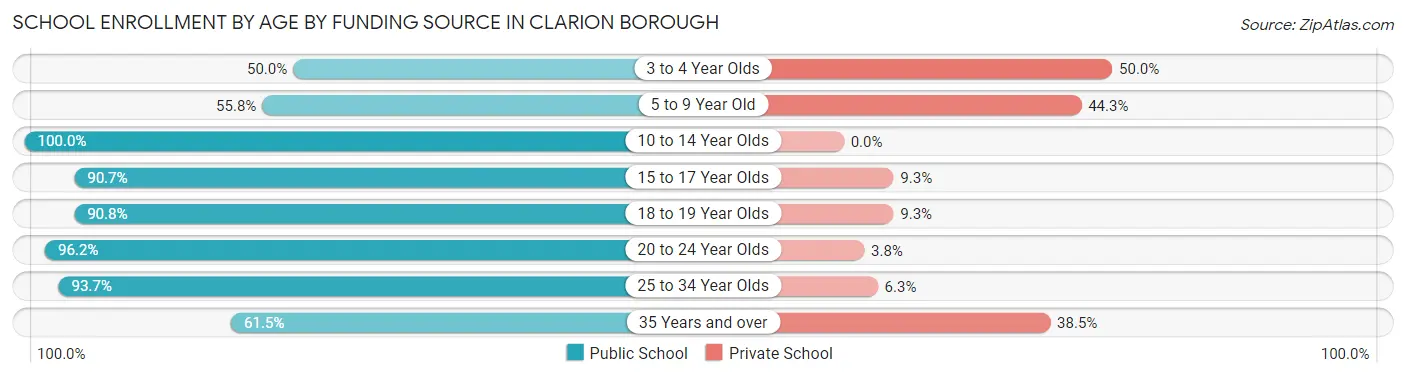
| Age Bracket | Public School | Private School |
| 3 to 4 Year Olds | 19 (50.0%) | 19 (50.0%) |
| 5 to 9 Year Old | 97 (55.7%) | 77 (44.3%) |
| 10 to 14 Year Olds | 273 (100.0%) | 0 (0.0%) |
| 15 to 17 Year Olds | 49 (90.7%) | 5 (9.3%) |
| 18 to 19 Year Olds | 559 (90.7%) | 57 (9.2%) |
| 20 to 24 Year Olds | 530 (96.2%) | 21 (3.8%) |
| 25 to 34 Year Olds | 74 (93.7%) | 5 (6.3%) |
| 35 Years and over | 8 (61.5%) | 5 (38.5%) |
| Total | 1,609 (89.5%) | 189 (10.5%) |
Educational Attainment by Field of Study in Clarion borough
Education (253 | 24.0%), business (183 | 17.4%), arts & humanities (163 | 15.5%), engineering (80 | 7.6%), and social sciences (78 | 7.4%) are the most common fields of study among 1,052 individuals in Clarion borough who have obtained a bachelor's degree or higher.
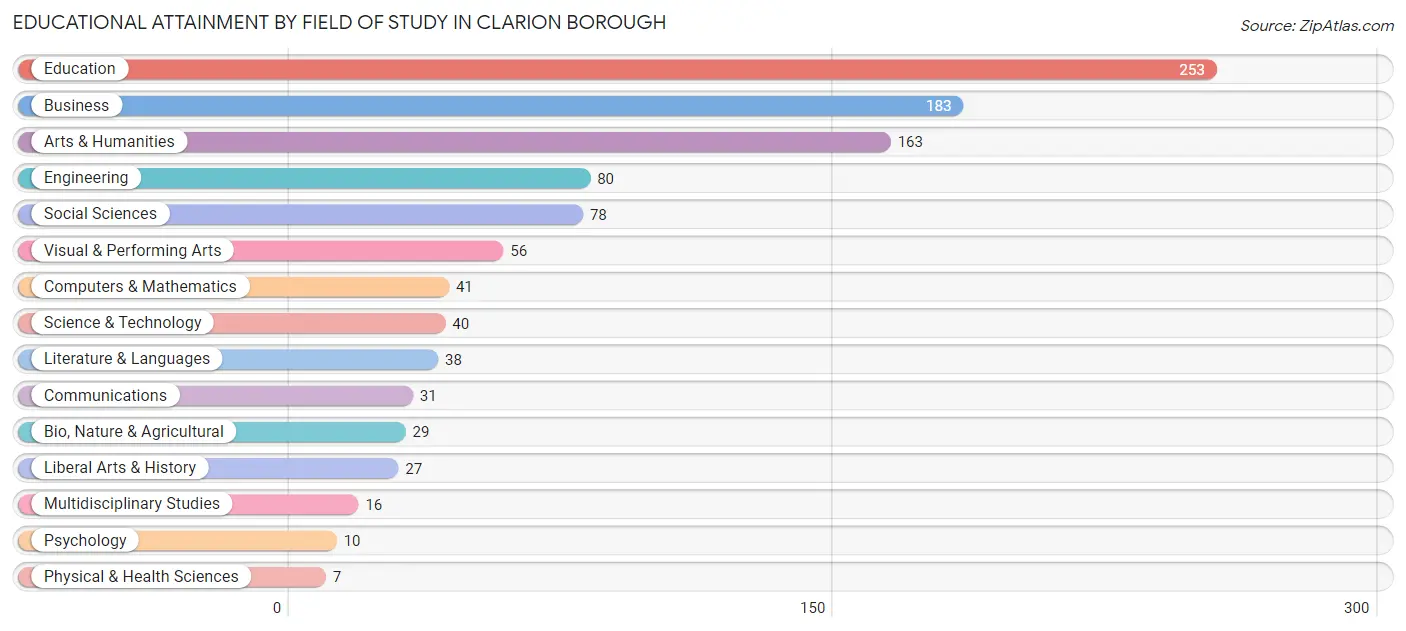
| Field of Study | # Graduates | % Graduates |
| Computers & Mathematics | 41 | 3.9% |
| Bio, Nature & Agricultural | 29 | 2.8% |
| Physical & Health Sciences | 7 | 0.7% |
| Psychology | 10 | 0.9% |
| Social Sciences | 78 | 7.4% |
| Engineering | 80 | 7.6% |
| Multidisciplinary Studies | 16 | 1.5% |
| Science & Technology | 40 | 3.8% |
| Business | 183 | 17.4% |
| Education | 253 | 24.0% |
| Literature & Languages | 38 | 3.6% |
| Liberal Arts & History | 27 | 2.6% |
| Visual & Performing Arts | 56 | 5.3% |
| Communications | 31 | 2.9% |
| Arts & Humanities | 163 | 15.5% |
| Total | 1,052 | 100.0% |
Transportation & Commute in Clarion borough
Vehicle Availability by Sex in Clarion borough
The most prevalent vehicle ownership categories in Clarion borough are males with 2 vehicles (512, accounting for 60.7%) and females with 2 vehicles (501, making up 60.0%).
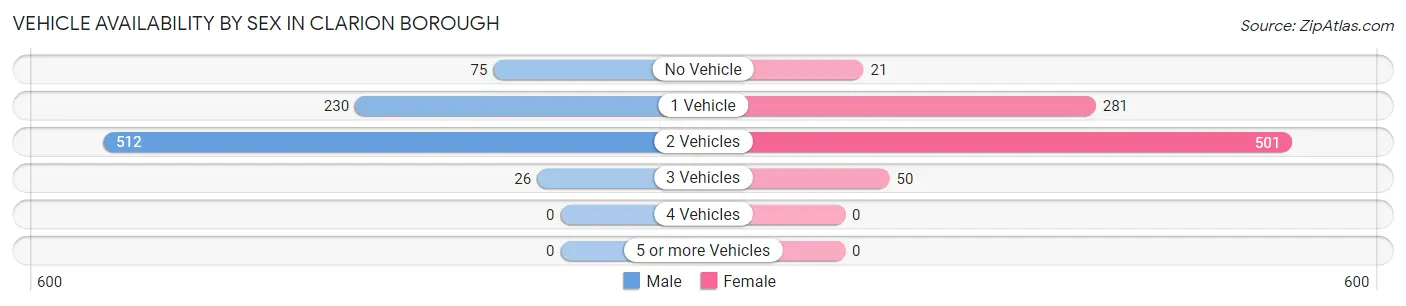
| Vehicles Available | Male | Female |
| No Vehicle | 75 (8.9%) | 21 (2.5%) |
| 1 Vehicle | 230 (27.3%) | 281 (32.9%) |
| 2 Vehicles | 512 (60.7%) | 501 (58.7%) |
| 3 Vehicles | 26 (3.1%) | 50 (5.9%) |
| 4 Vehicles | 0 (0.0%) | 0 (0.0%) |
| 5 or more Vehicles | 0 (0.0%) | 0 (0.0%) |
| Total | 843 (100.0%) | 853 (100.0%) |
Commute Time in Clarion borough
The most frequently occuring commute durations in Clarion borough are 5 to 9 minutes (919 commuters, 49.1%), 10 to 14 minutes (214 commuters, 11.4%), and less than 5 minutes (184 commuters, 9.8%).
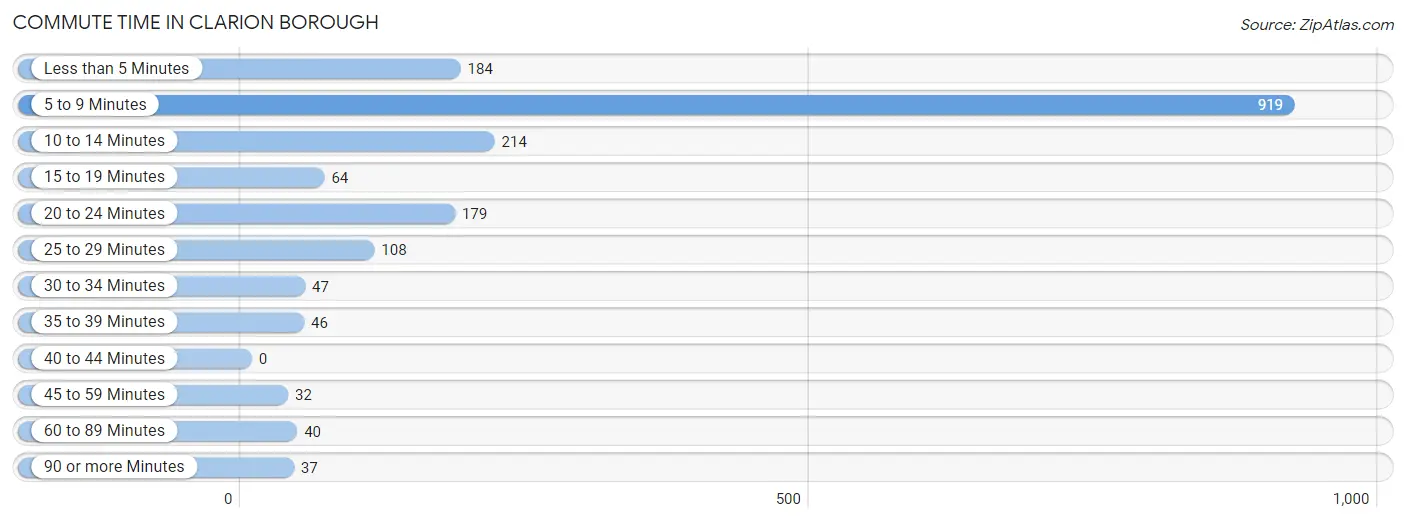
| Commute Time | # Commuters | % Commuters |
| Less than 5 Minutes | 184 | 9.8% |
| 5 to 9 Minutes | 919 | 49.1% |
| 10 to 14 Minutes | 214 | 11.4% |
| 15 to 19 Minutes | 64 | 3.4% |
| 20 to 24 Minutes | 179 | 9.6% |
| 25 to 29 Minutes | 108 | 5.8% |
| 30 to 34 Minutes | 47 | 2.5% |
| 35 to 39 Minutes | 46 | 2.5% |
| 40 to 44 Minutes | 0 | 0.0% |
| 45 to 59 Minutes | 32 | 1.7% |
| 60 to 89 Minutes | 40 | 2.1% |
| 90 or more Minutes | 37 | 2.0% |
Commute Time by Sex in Clarion borough
The most common commute times in Clarion borough are 5 to 9 minutes (447 commuters, 51.6%) for males and 5 to 9 minutes (472 commuters, 47.0%) for females.
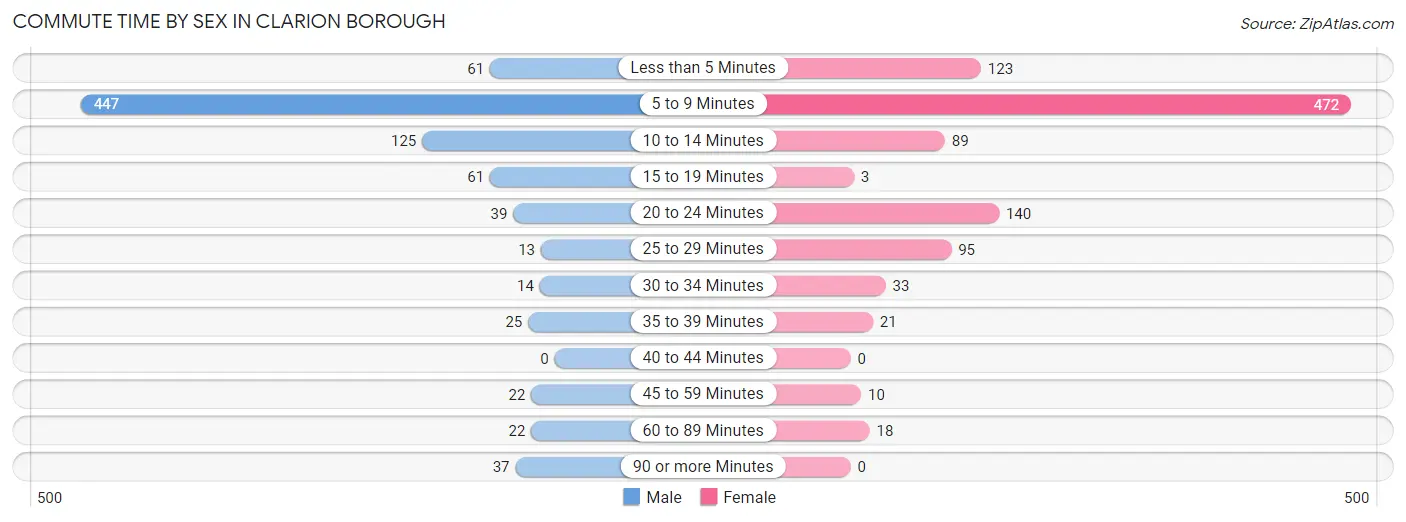
| Commute Time | Male | Female |
| Less than 5 Minutes | 61 (7.0%) | 123 (12.2%) |
| 5 to 9 Minutes | 447 (51.6%) | 472 (47.0%) |
| 10 to 14 Minutes | 125 (14.4%) | 89 (8.9%) |
| 15 to 19 Minutes | 61 (7.0%) | 3 (0.3%) |
| 20 to 24 Minutes | 39 (4.5%) | 140 (13.9%) |
| 25 to 29 Minutes | 13 (1.5%) | 95 (9.5%) |
| 30 to 34 Minutes | 14 (1.6%) | 33 (3.3%) |
| 35 to 39 Minutes | 25 (2.9%) | 21 (2.1%) |
| 40 to 44 Minutes | 0 (0.0%) | 0 (0.0%) |
| 45 to 59 Minutes | 22 (2.5%) | 10 (1.0%) |
| 60 to 89 Minutes | 22 (2.5%) | 18 (1.8%) |
| 90 or more Minutes | 37 (4.3%) | 0 (0.0%) |
Time of Departure to Work by Sex in Clarion borough
The most frequent times of departure to work in Clarion borough are 12:00 PM to 3:59 PM (151, 17.4%) for males and 12:00 PM to 3:59 PM (274, 27.3%) for females.
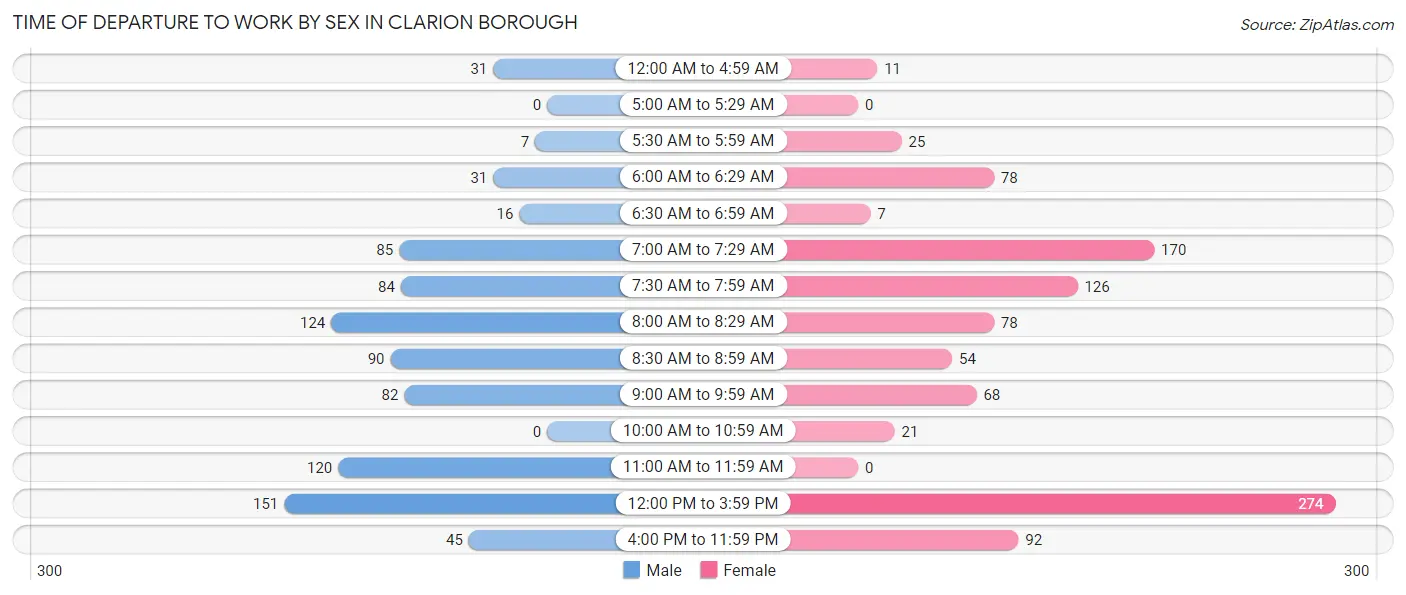
| Time of Departure | Male | Female |
| 12:00 AM to 4:59 AM | 31 (3.6%) | 11 (1.1%) |
| 5:00 AM to 5:29 AM | 0 (0.0%) | 0 (0.0%) |
| 5:30 AM to 5:59 AM | 7 (0.8%) | 25 (2.5%) |
| 6:00 AM to 6:29 AM | 31 (3.6%) | 78 (7.8%) |
| 6:30 AM to 6:59 AM | 16 (1.8%) | 7 (0.7%) |
| 7:00 AM to 7:29 AM | 85 (9.8%) | 170 (16.9%) |
| 7:30 AM to 7:59 AM | 84 (9.7%) | 126 (12.6%) |
| 8:00 AM to 8:29 AM | 124 (14.3%) | 78 (7.8%) |
| 8:30 AM to 8:59 AM | 90 (10.4%) | 54 (5.4%) |
| 9:00 AM to 9:59 AM | 82 (9.5%) | 68 (6.8%) |
| 10:00 AM to 10:59 AM | 0 (0.0%) | 21 (2.1%) |
| 11:00 AM to 11:59 AM | 120 (13.9%) | 0 (0.0%) |
| 12:00 PM to 3:59 PM | 151 (17.4%) | 274 (27.3%) |
| 4:00 PM to 11:59 PM | 45 (5.2%) | 92 (9.2%) |
| Total | 866 (100.0%) | 1,004 (100.0%) |
Housing Occupancy in Clarion borough
Occupancy by Ownership in Clarion borough
Of the total 1,536 dwellings in Clarion borough, owner-occupied units account for 616 (40.1%), while renter-occupied units make up 920 (59.9%).
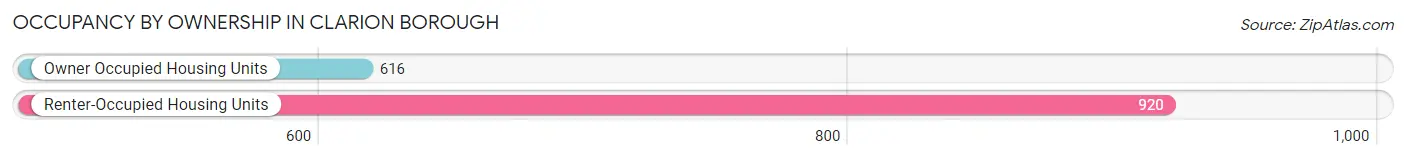
| Occupancy | # Housing Units | % Housing Units |
| Owner Occupied Housing Units | 616 | 40.1% |
| Renter-Occupied Housing Units | 920 | 59.9% |
| Total Occupied Housing Units | 1,536 | 100.0% |
Occupancy by Household Size in Clarion borough
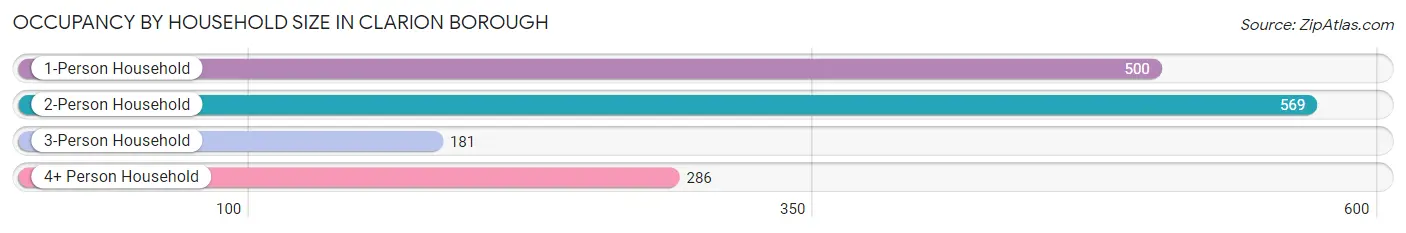
| Household Size | # Housing Units | % Housing Units |
| 1-Person Household | 500 | 32.6% |
| 2-Person Household | 569 | 37.0% |
| 3-Person Household | 181 | 11.8% |
| 4+ Person Household | 286 | 18.6% |
| Total Housing Units | 1,536 | 100.0% |
Occupancy by Ownership by Household Size in Clarion borough
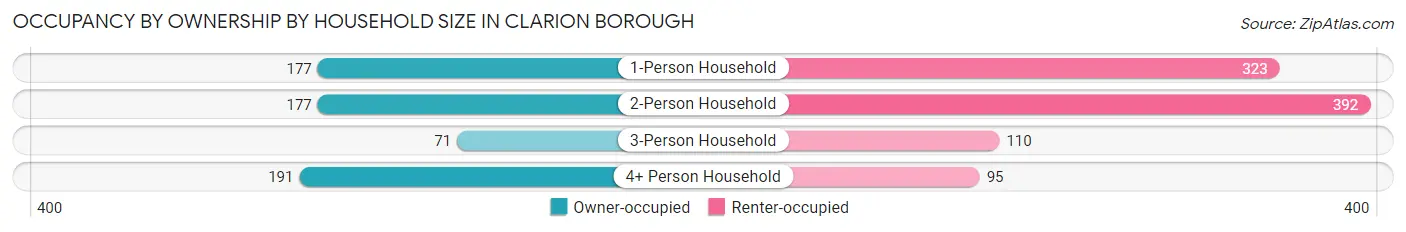
| Household Size | Owner-occupied | Renter-occupied |
| 1-Person Household | 177 (35.4%) | 323 (64.6%) |
| 2-Person Household | 177 (31.1%) | 392 (68.9%) |
| 3-Person Household | 71 (39.2%) | 110 (60.8%) |
| 4+ Person Household | 191 (66.8%) | 95 (33.2%) |
| Total Housing Units | 616 (40.1%) | 920 (59.9%) |
Occupancy by Educational Attainment in Clarion borough
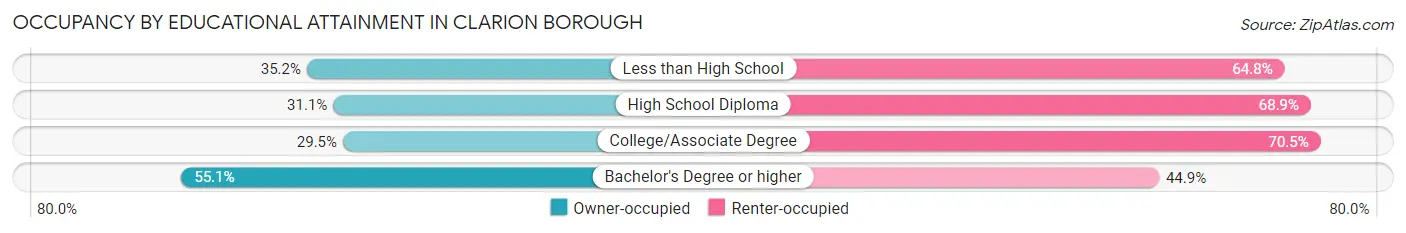
| Household Size | Owner-occupied | Renter-occupied |
| Less than High School | 37 (35.2%) | 68 (64.8%) |
| High School Diploma | 141 (31.1%) | 313 (68.9%) |
| College/Associate Degree | 116 (29.5%) | 277 (70.5%) |
| Bachelor's Degree or higher | 322 (55.1%) | 262 (44.9%) |
Occupancy by Age of Householder in Clarion borough
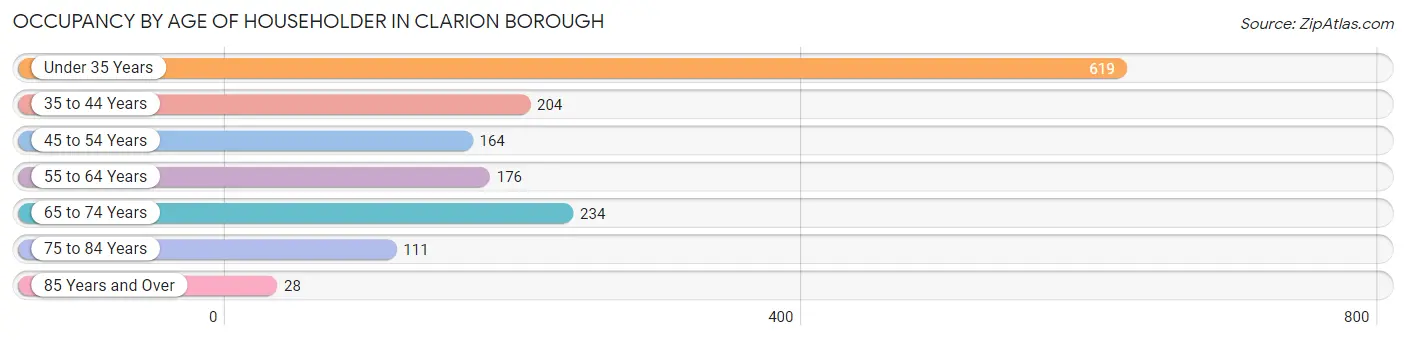
| Age Bracket | # Households | % Households |
| Under 35 Years | 619 | 40.3% |
| 35 to 44 Years | 204 | 13.3% |
| 45 to 54 Years | 164 | 10.7% |
| 55 to 64 Years | 176 | 11.5% |
| 65 to 74 Years | 234 | 15.2% |
| 75 to 84 Years | 111 | 7.2% |
| 85 Years and Over | 28 | 1.8% |
| Total | 1,536 | 100.0% |
Housing Finances in Clarion borough
Median Income by Occupancy in Clarion borough
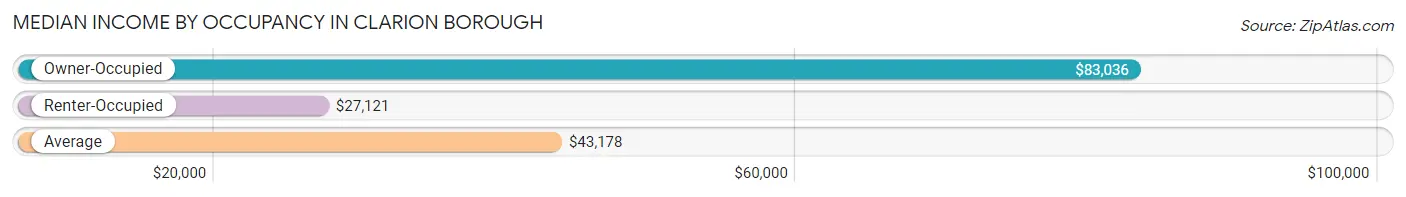
| Occupancy Type | # Households | Median Income |
| Owner-Occupied | 616 (40.1%) | $83,036 |
| Renter-Occupied | 920 (59.9%) | $27,121 |
| Average | 1,536 (100.0%) | $43,178 |
Occupancy by Householder Income Bracket in Clarion borough
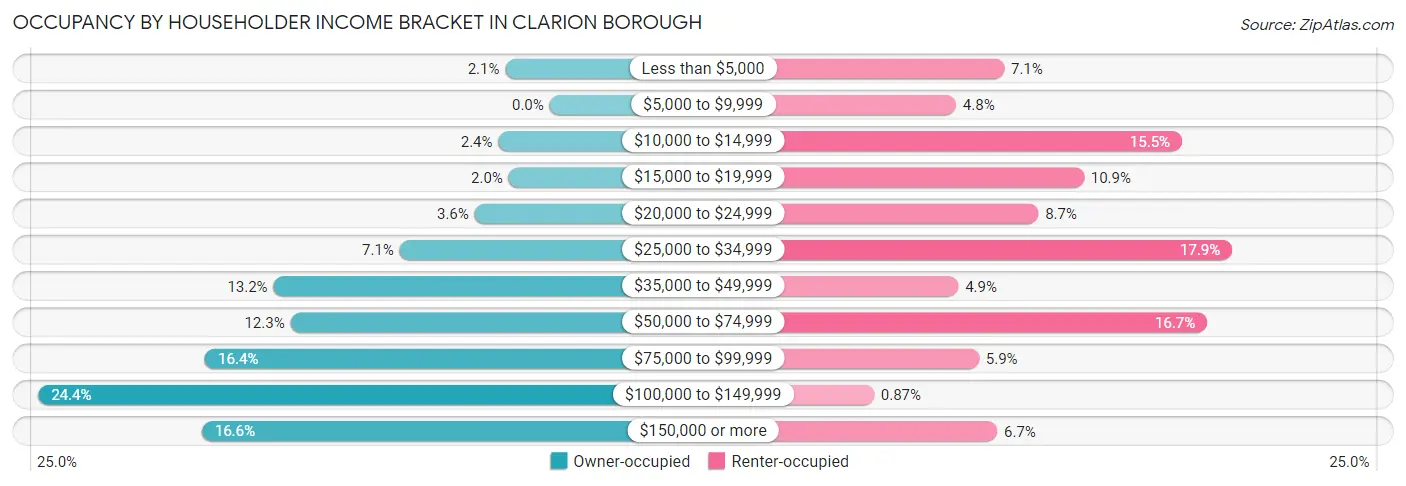
| Income Bracket | Owner-occupied | Renter-occupied |
| Less than $5,000 | 13 (2.1%) | 65 (7.1%) |
| $5,000 to $9,999 | 0 (0.0%) | 44 (4.8%) |
| $10,000 to $14,999 | 15 (2.4%) | 143 (15.5%) |
| $15,000 to $19,999 | 12 (1.9%) | 100 (10.9%) |
| $20,000 to $24,999 | 22 (3.6%) | 80 (8.7%) |
| $25,000 to $34,999 | 44 (7.1%) | 165 (17.9%) |
| $35,000 to $49,999 | 81 (13.2%) | 45 (4.9%) |
| $50,000 to $74,999 | 76 (12.3%) | 154 (16.7%) |
| $75,000 to $99,999 | 101 (16.4%) | 54 (5.9%) |
| $100,000 to $149,999 | 150 (24.3%) | 8 (0.9%) |
| $150,000 or more | 102 (16.6%) | 62 (6.7%) |
| Total | 616 (100.0%) | 920 (100.0%) |
Monthly Housing Cost Tiers in Clarion borough
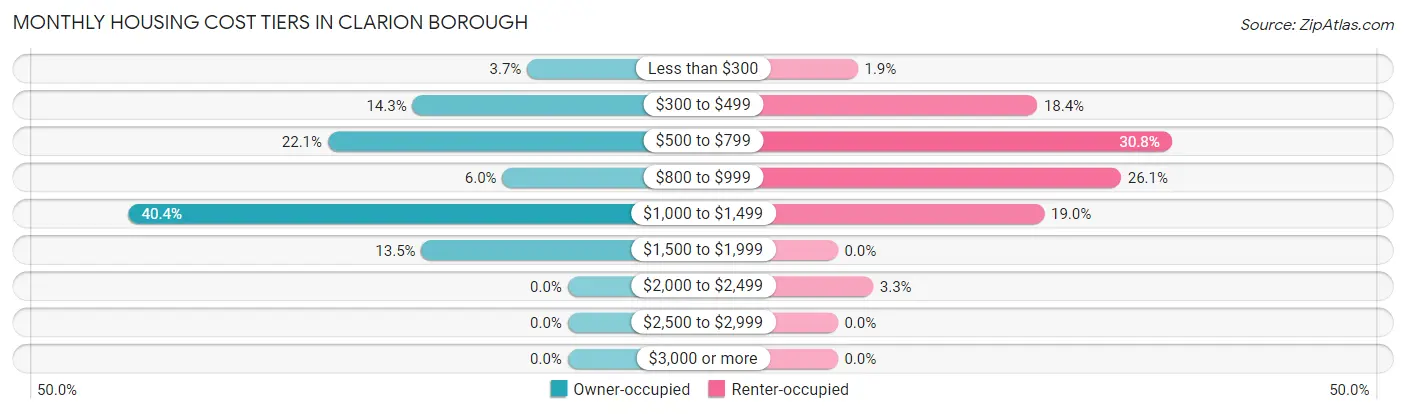
| Monthly Cost | Owner-occupied | Renter-occupied |
| Less than $300 | 23 (3.7%) | 17 (1.8%) |
| $300 to $499 | 88 (14.3%) | 169 (18.4%) |
| $500 to $799 | 136 (22.1%) | 283 (30.8%) |
| $800 to $999 | 37 (6.0%) | 240 (26.1%) |
| $1,000 to $1,499 | 249 (40.4%) | 175 (19.0%) |
| $1,500 to $1,999 | 83 (13.5%) | 0 (0.0%) |
| $2,000 to $2,499 | 0 (0.0%) | 30 (3.3%) |
| $2,500 to $2,999 | 0 (0.0%) | 0 (0.0%) |
| $3,000 or more | 0 (0.0%) | 0 (0.0%) |
| Total | 616 (100.0%) | 920 (100.0%) |
Physical Housing Characteristics in Clarion borough
Housing Structures in Clarion borough
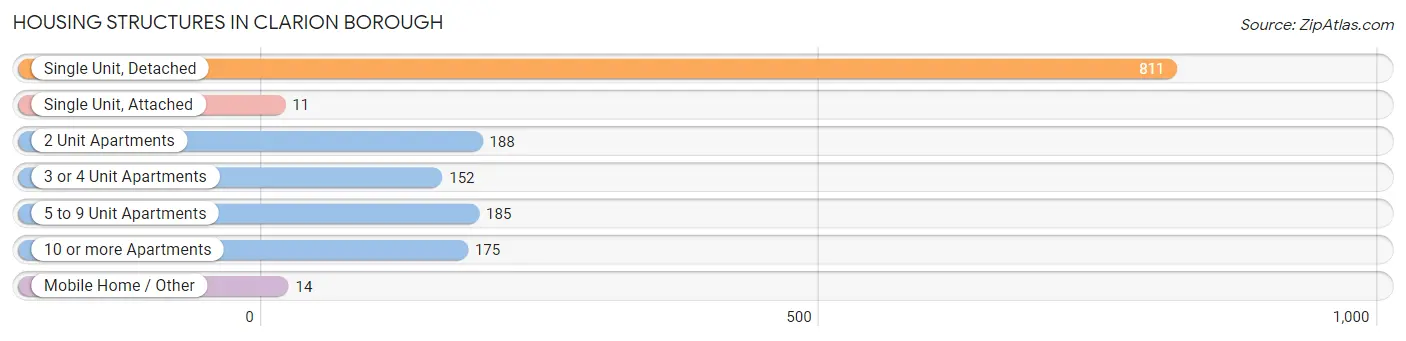
| Structure Type | # Housing Units | % Housing Units |
| Single Unit, Detached | 811 | 52.8% |
| Single Unit, Attached | 11 | 0.7% |
| 2 Unit Apartments | 188 | 12.2% |
| 3 or 4 Unit Apartments | 152 | 9.9% |
| 5 to 9 Unit Apartments | 185 | 12.0% |
| 10 or more Apartments | 175 | 11.4% |
| Mobile Home / Other | 14 | 0.9% |
| Total | 1,536 | 100.0% |
Housing Structures by Occupancy in Clarion borough
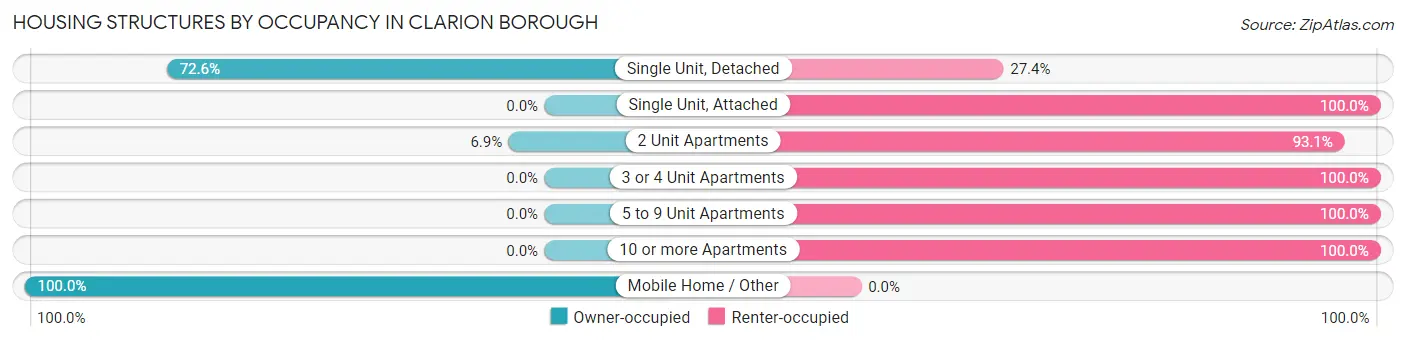
| Structure Type | Owner-occupied | Renter-occupied |
| Single Unit, Detached | 589 (72.6%) | 222 (27.4%) |
| Single Unit, Attached | 0 (0.0%) | 11 (100.0%) |
| 2 Unit Apartments | 13 (6.9%) | 175 (93.1%) |
| 3 or 4 Unit Apartments | 0 (0.0%) | 152 (100.0%) |
| 5 to 9 Unit Apartments | 0 (0.0%) | 185 (100.0%) |
| 10 or more Apartments | 0 (0.0%) | 175 (100.0%) |
| Mobile Home / Other | 14 (100.0%) | 0 (0.0%) |
| Total | 616 (40.1%) | 920 (59.9%) |
Housing Structures by Number of Rooms in Clarion borough
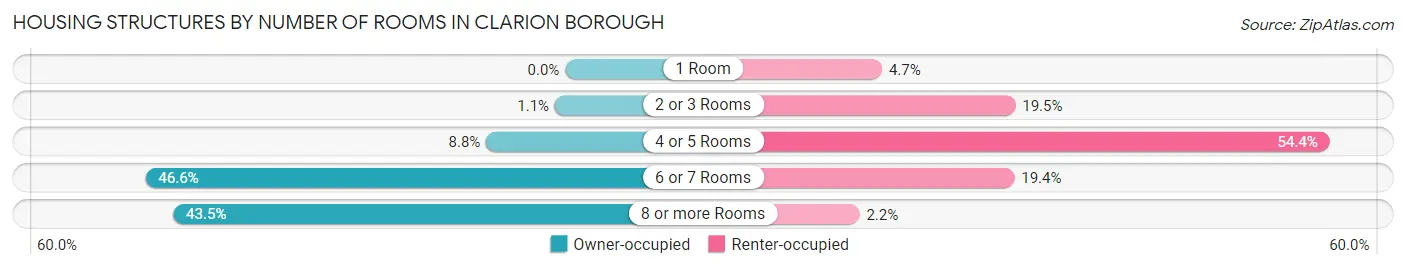
| Number of Rooms | Owner-occupied | Renter-occupied |
| 1 Room | 0 (0.0%) | 43 (4.7%) |
| 2 or 3 Rooms | 7 (1.1%) | 179 (19.5%) |
| 4 or 5 Rooms | 54 (8.8%) | 500 (54.3%) |
| 6 or 7 Rooms | 287 (46.6%) | 178 (19.4%) |
| 8 or more Rooms | 268 (43.5%) | 20 (2.2%) |
| Total | 616 (100.0%) | 920 (100.0%) |
Housing Structure by Heating Type in Clarion borough
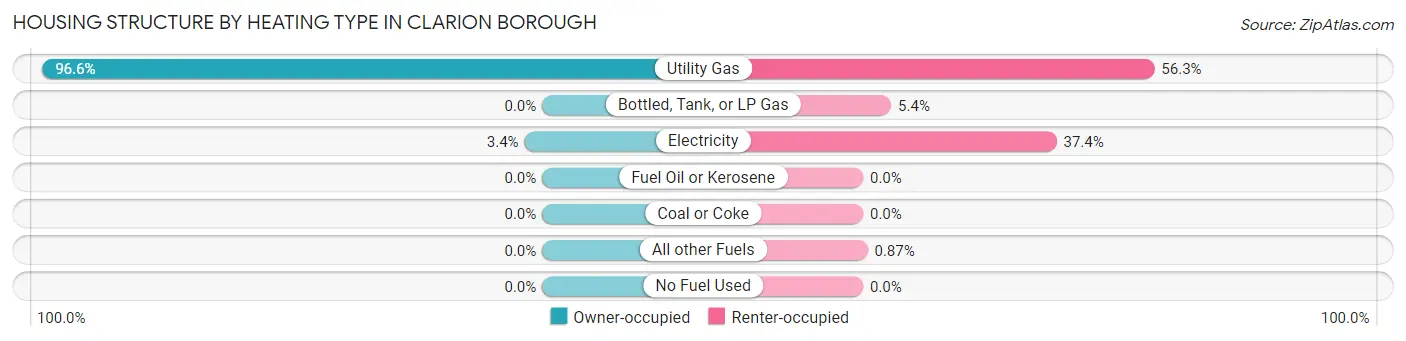
| Heating Type | Owner-occupied | Renter-occupied |
| Utility Gas | 595 (96.6%) | 518 (56.3%) |
| Bottled, Tank, or LP Gas | 0 (0.0%) | 50 (5.4%) |
| Electricity | 21 (3.4%) | 344 (37.4%) |
| Fuel Oil or Kerosene | 0 (0.0%) | 0 (0.0%) |
| Coal or Coke | 0 (0.0%) | 0 (0.0%) |
| All other Fuels | 0 (0.0%) | 8 (0.9%) |
| No Fuel Used | 0 (0.0%) | 0 (0.0%) |
| Total | 616 (100.0%) | 920 (100.0%) |
Household Vehicle Usage in Clarion borough
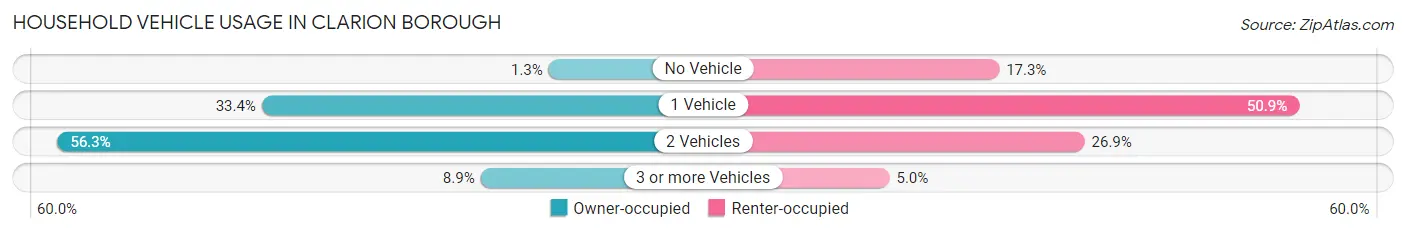
| Vehicles per Household | Owner-occupied | Renter-occupied |
| No Vehicle | 8 (1.3%) | 159 (17.3%) |
| 1 Vehicle | 206 (33.4%) | 468 (50.9%) |
| 2 Vehicles | 347 (56.3%) | 247 (26.9%) |
| 3 or more Vehicles | 55 (8.9%) | 46 (5.0%) |
| Total | 616 (100.0%) | 920 (100.0%) |
Real Estate & Mortgages in Clarion borough
Real Estate and Mortgage Overview in Clarion borough
| Characteristic | Without Mortgage | With Mortgage |
| Housing Units | 225 | 391 |
| Median Property Value | $138,200 | $146,900 |
| Median Household Income | $75,893 | $62 |
| Monthly Housing Costs | $503 | $0 |
| Real Estate Taxes | $2,230 | $0 |
Property Value by Mortgage Status in Clarion borough
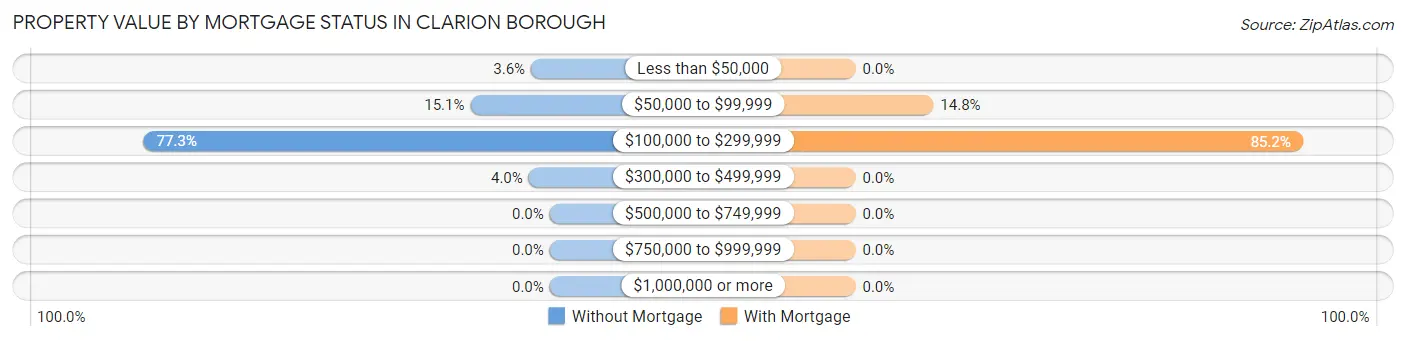
| Property Value | Without Mortgage | With Mortgage |
| Less than $50,000 | 8 (3.6%) | 0 (0.0%) |
| $50,000 to $99,999 | 34 (15.1%) | 58 (14.8%) |
| $100,000 to $299,999 | 174 (77.3%) | 333 (85.2%) |
| $300,000 to $499,999 | 9 (4.0%) | 0 (0.0%) |
| $500,000 to $749,999 | 0 (0.0%) | 0 (0.0%) |
| $750,000 to $999,999 | 0 (0.0%) | 0 (0.0%) |
| $1,000,000 or more | 0 (0.0%) | 0 (0.0%) |
| Total | 225 (100.0%) | 391 (100.0%) |
Household Income by Mortgage Status in Clarion borough
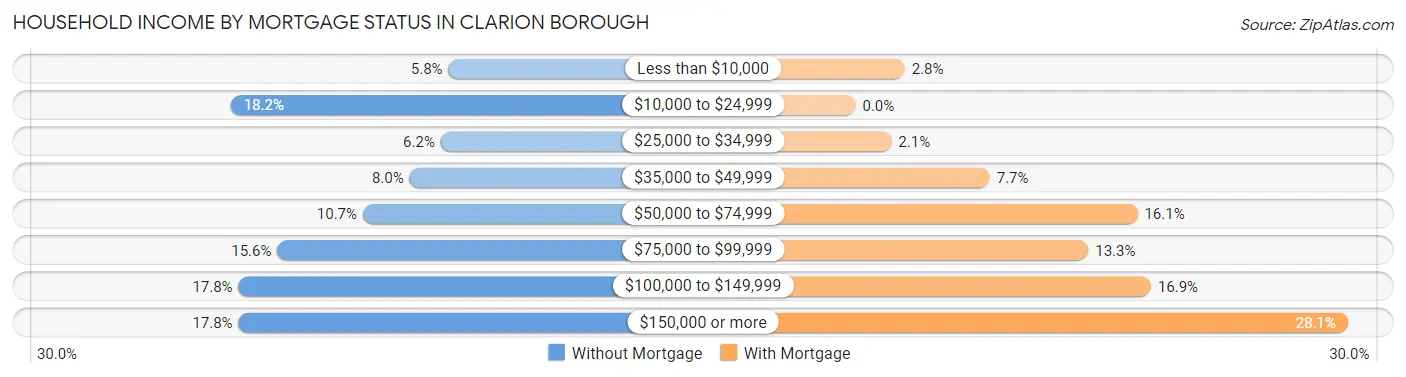
| Household Income | Without Mortgage | With Mortgage |
| Less than $10,000 | 13 (5.8%) | 11 (2.8%) |
| $10,000 to $24,999 | 41 (18.2%) | 0 (0.0%) |
| $25,000 to $34,999 | 14 (6.2%) | 8 (2.1%) |
| $35,000 to $49,999 | 18 (8.0%) | 30 (7.7%) |
| $50,000 to $74,999 | 24 (10.7%) | 63 (16.1%) |
| $75,000 to $99,999 | 35 (15.6%) | 52 (13.3%) |
| $100,000 to $149,999 | 40 (17.8%) | 66 (16.9%) |
| $150,000 or more | 40 (17.8%) | 110 (28.1%) |
| Total | 225 (100.0%) | 391 (100.0%) |
Property Value to Household Income Ratio in Clarion borough
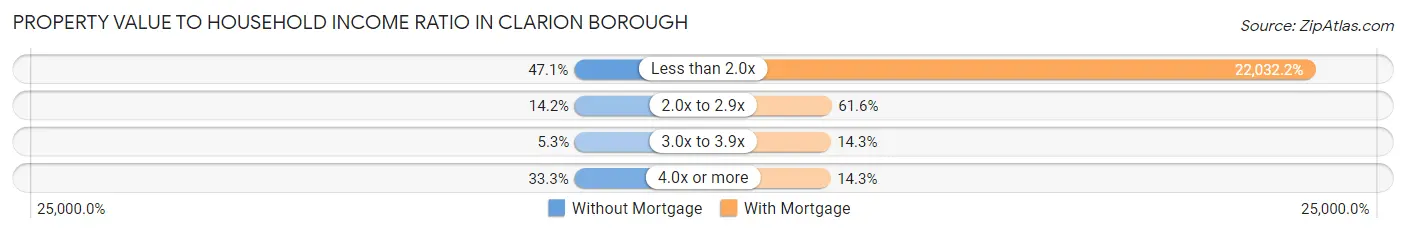
| Value-to-Income Ratio | Without Mortgage | With Mortgage |
| Less than 2.0x | 106 (47.1%) | 86,146 (22,032.2%) |
| 2.0x to 2.9x | 32 (14.2%) | 241 (61.6%) |
| 3.0x to 3.9x | 12 (5.3%) | 56 (14.3%) |
| 4.0x or more | 75 (33.3%) | 56 (14.3%) |
| Total | 225 (100.0%) | 391 (100.0%) |
Real Estate Taxes by Mortgage Status in Clarion borough
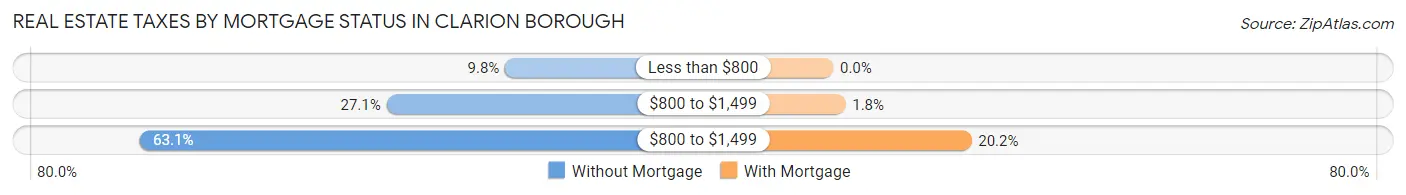
| Property Taxes | Without Mortgage | With Mortgage |
| Less than $800 | 22 (9.8%) | 0 (0.0%) |
| $800 to $1,499 | 61 (27.1%) | 7 (1.8%) |
| $800 to $1,499 | 142 (63.1%) | 79 (20.2%) |
| Total | 225 (100.0%) | 391 (100.0%) |
Health & Disability in Clarion borough
Health Insurance Coverage by Age in Clarion borough
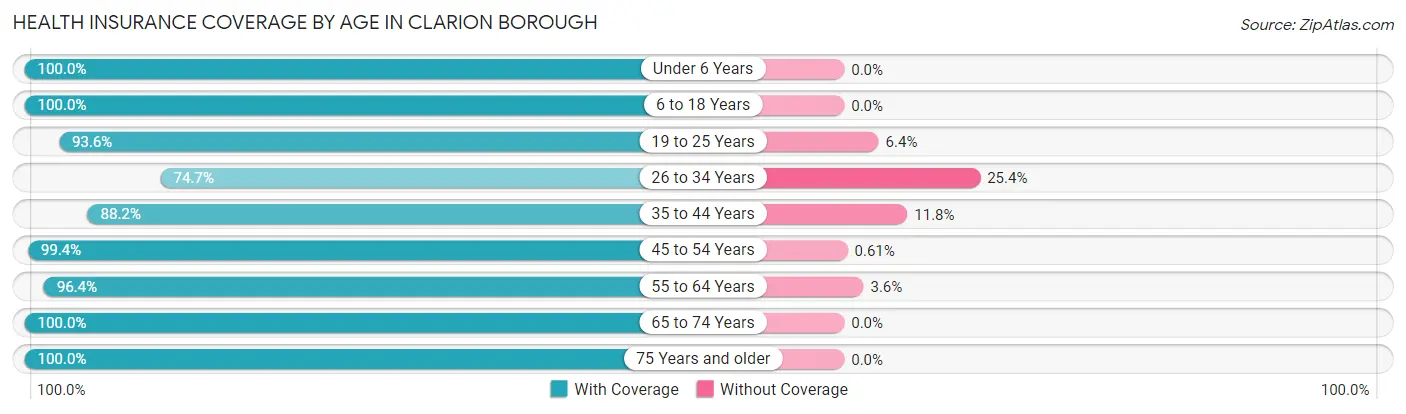
| Age Bracket | With Coverage | Without Coverage |
| Under 6 Years | 239 (100.0%) | 0 (0.0%) |
| 6 to 18 Years | 874 (100.0%) | 0 (0.0%) |
| 19 to 25 Years | 949 (93.6%) | 65 (6.4%) |
| 26 to 34 Years | 483 (74.7%) | 164 (25.4%) |
| 35 to 44 Years | 285 (88.2%) | 38 (11.8%) |
| 45 to 54 Years | 326 (99.4%) | 2 (0.6%) |
| 55 to 64 Years | 242 (96.4%) | 9 (3.6%) |
| 65 to 74 Years | 261 (100.0%) | 0 (0.0%) |
| 75 Years and older | 193 (100.0%) | 0 (0.0%) |
| Total | 3,852 (93.3%) | 278 (6.7%) |
Health Insurance Coverage by Citizenship Status in Clarion borough
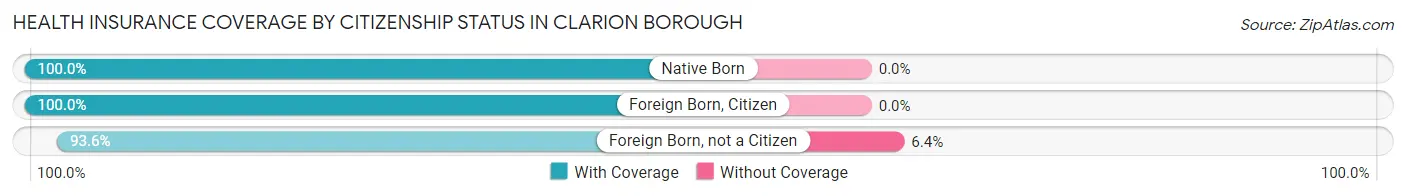
| Citizenship Status | With Coverage | Without Coverage |
| Native Born | 239 (100.0%) | 0 (0.0%) |
| Foreign Born, Citizen | 874 (100.0%) | 0 (0.0%) |
| Foreign Born, not a Citizen | 949 (93.6%) | 65 (6.4%) |
Health Insurance Coverage by Household Income in Clarion borough
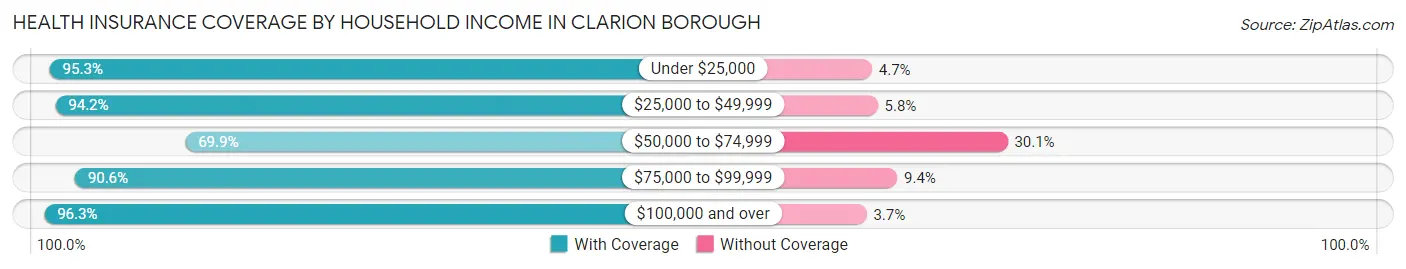
| Household Income | With Coverage | Without Coverage |
| Under $25,000 | 811 (95.3%) | 40 (4.7%) |
| $25,000 to $49,999 | 670 (94.2%) | 41 (5.8%) |
| $50,000 to $74,999 | 274 (69.9%) | 118 (30.1%) |
| $75,000 to $99,999 | 327 (90.6%) | 34 (9.4%) |
| $100,000 and over | 1,126 (96.3%) | 43 (3.7%) |
Public vs Private Health Insurance Coverage by Age in Clarion borough
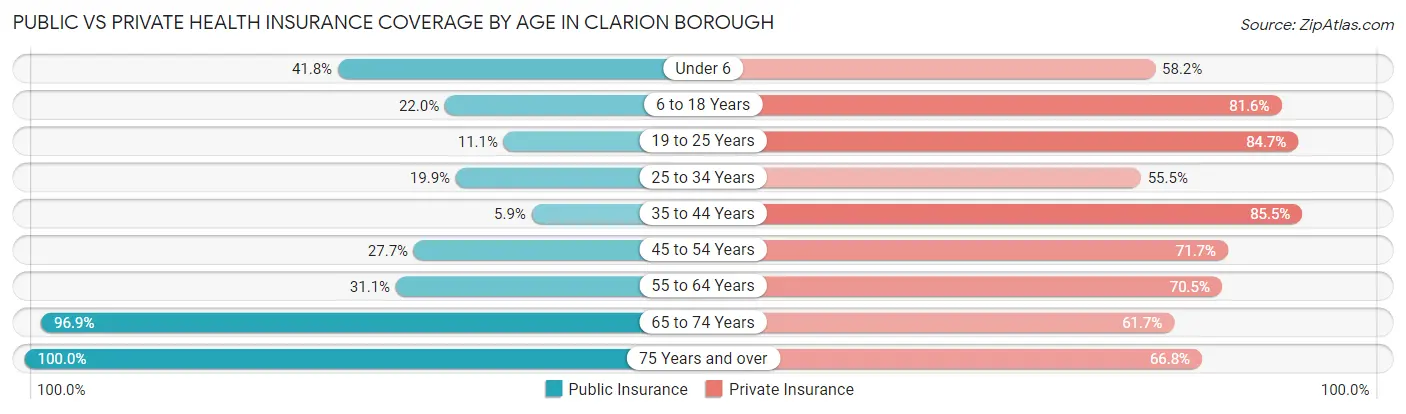
| Age Bracket | Public Insurance | Private Insurance |
| Under 6 | 100 (41.8%) | 139 (58.2%) |
| 6 to 18 Years | 192 (22.0%) | 713 (81.6%) |
| 19 to 25 Years | 112 (11.1%) | 859 (84.7%) |
| 25 to 34 Years | 129 (19.9%) | 359 (55.5%) |
| 35 to 44 Years | 19 (5.9%) | 276 (85.5%) |
| 45 to 54 Years | 91 (27.7%) | 235 (71.7%) |
| 55 to 64 Years | 78 (31.1%) | 177 (70.5%) |
| 65 to 74 Years | 253 (96.9%) | 161 (61.7%) |
| 75 Years and over | 193 (100.0%) | 129 (66.8%) |
| Total | 1,167 (28.3%) | 3,048 (73.8%) |
Disability Status by Sex by Age in Clarion borough
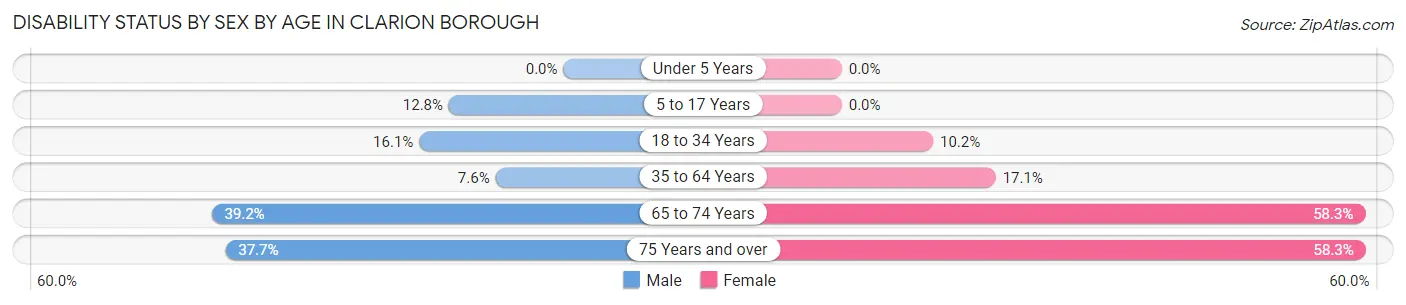
| Age Bracket | Male | Female |
| Under 5 Years | 0 (0.0%) | 0 (0.0%) |
| 5 to 17 Years | 39 (12.8%) | 0 (0.0%) |
| 18 to 34 Years | 115 (16.1%) | 136 (10.2%) |
| 35 to 64 Years | 36 (7.6%) | 73 (17.1%) |
| 65 to 74 Years | 29 (39.2%) | 109 (58.3%) |
| 75 Years and over | 32 (37.7%) | 63 (58.3%) |
Disability Class by Sex by Age in Clarion borough
Disability Class: Hearing Difficulty
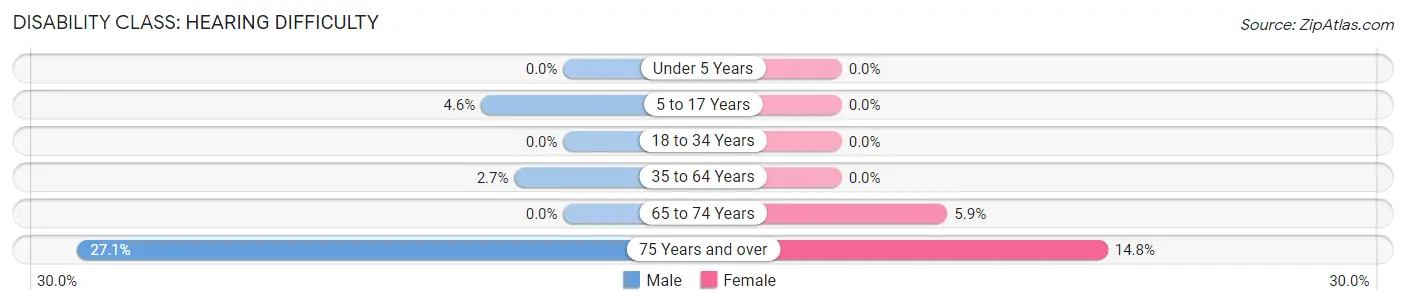
| Age Bracket | Male | Female |
| Under 5 Years | 0 (0.0%) | 0 (0.0%) |
| 5 to 17 Years | 14 (4.6%) | 0 (0.0%) |
| 18 to 34 Years | 0 (0.0%) | 0 (0.0%) |
| 35 to 64 Years | 13 (2.7%) | 0 (0.0%) |
| 65 to 74 Years | 0 (0.0%) | 11 (5.9%) |
| 75 Years and over | 23 (27.1%) | 16 (14.8%) |
Disability Class: Vision Difficulty
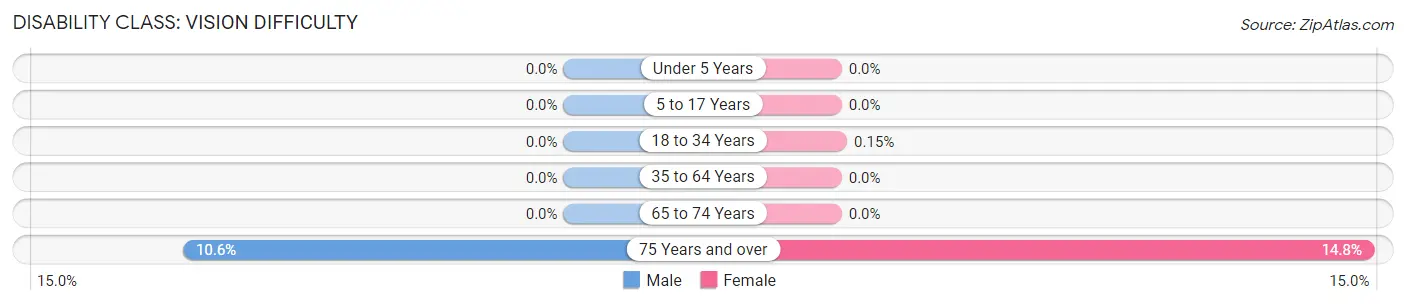
| Age Bracket | Male | Female |
| Under 5 Years | 0 (0.0%) | 0 (0.0%) |
| 5 to 17 Years | 0 (0.0%) | 0 (0.0%) |
| 18 to 34 Years | 0 (0.0%) | 2 (0.2%) |
| 35 to 64 Years | 0 (0.0%) | 0 (0.0%) |
| 65 to 74 Years | 0 (0.0%) | 0 (0.0%) |
| 75 Years and over | 9 (10.6%) | 16 (14.8%) |
Disability Class: Cognitive Difficulty
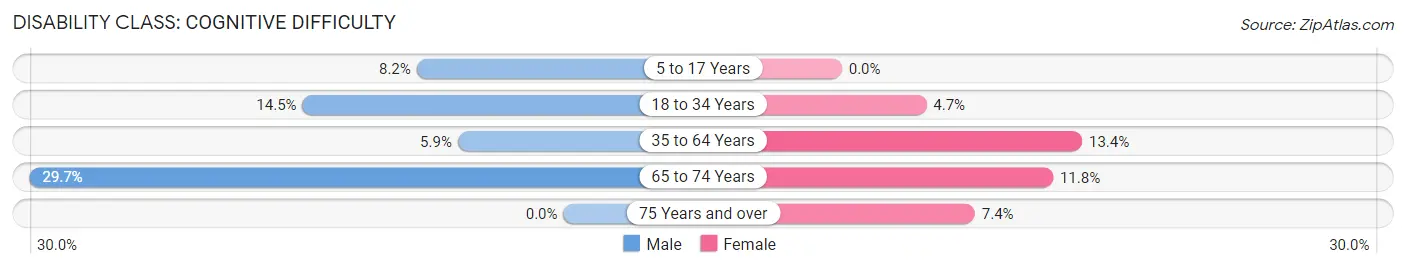
| Age Bracket | Male | Female |
| 5 to 17 Years | 25 (8.2%) | 0 (0.0%) |
| 18 to 34 Years | 104 (14.5%) | 63 (4.7%) |
| 35 to 64 Years | 28 (5.9%) | 57 (13.4%) |
| 65 to 74 Years | 22 (29.7%) | 22 (11.8%) |
| 75 Years and over | 0 (0.0%) | 8 (7.4%) |
Disability Class: Ambulatory Difficulty
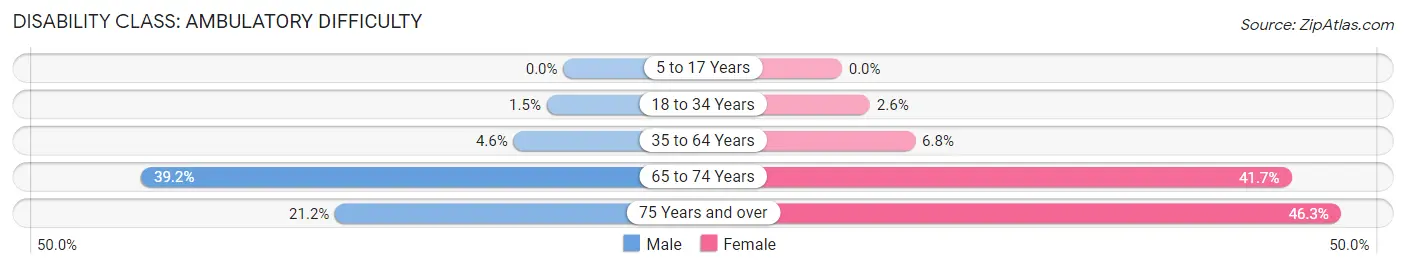
| Age Bracket | Male | Female |
| 5 to 17 Years | 0 (0.0%) | 0 (0.0%) |
| 18 to 34 Years | 11 (1.5%) | 35 (2.6%) |
| 35 to 64 Years | 22 (4.6%) | 29 (6.8%) |
| 65 to 74 Years | 29 (39.2%) | 78 (41.7%) |
| 75 Years and over | 18 (21.2%) | 50 (46.3%) |
Disability Class: Self-Care Difficulty
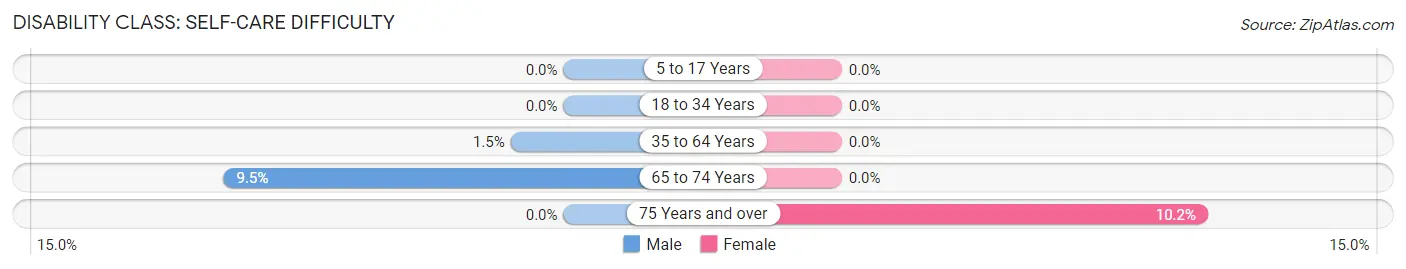
| Age Bracket | Male | Female |
| 5 to 17 Years | 0 (0.0%) | 0 (0.0%) |
| 18 to 34 Years | 0 (0.0%) | 0 (0.0%) |
| 35 to 64 Years | 7 (1.5%) | 0 (0.0%) |
| 65 to 74 Years | 7 (9.5%) | 0 (0.0%) |
| 75 Years and over | 0 (0.0%) | 11 (10.2%) |
Technology Access in Clarion borough
Computing Device Access in Clarion borough
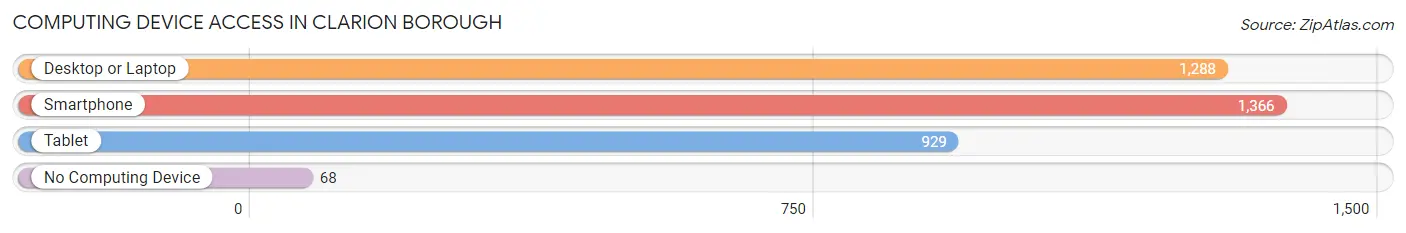
| Device Type | # Households | % Households |
| Desktop or Laptop | 1,288 | 83.9% |
| Smartphone | 1,366 | 88.9% |
| Tablet | 929 | 60.5% |
| No Computing Device | 68 | 4.4% |
| Total | 1,536 | 100.0% |
Internet Access in Clarion borough
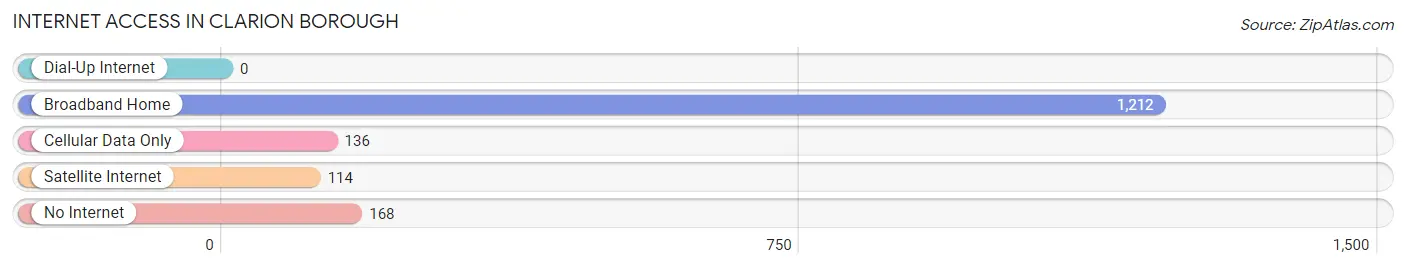
| Internet Type | # Households | % Households |
| Dial-Up Internet | 0 | 0.0% |
| Broadband Home | 1,212 | 78.9% |
| Cellular Data Only | 136 | 8.8% |
| Satellite Internet | 114 | 7.4% |
| No Internet | 168 | 10.9% |
| Total | 1,536 | 100.0% |
Clarion borough Summary
Clarion Borough is a small borough located in Clarion County, Pennsylvania. It is situated in the northwestern part of the state, approximately 70 miles northeast of Pittsburgh. The borough is bordered by the Clarion River to the north and the Clarion-Little Toby Creek to the south. As of the 2010 census, the population of Clarion Borough was 2,004.
History
The area that is now Clarion Borough was first settled in the late 1700s by European settlers. The borough was officially incorporated in 1839 and was named after the Clarion River, which was named by the Native Americans who lived in the area. The river was named for the clarion call of the whippoorwill, a bird native to the area.
In the late 1800s, the borough became a center for the lumber industry. The Clarion River was used to transport logs to the sawmills located in the borough. The lumber industry was a major source of employment for the residents of Clarion Borough.
In the early 1900s, the borough began to develop into a tourist destination. The Clarion River was used for recreational activities such as fishing and boating. The borough also became a popular destination for hunters and campers.
Geography
Clarion Borough is located in the northwestern part of Clarion County, Pennsylvania. It is situated in the Allegheny Plateau region of the state. The borough is bordered by the Clarion River to the north and the Clarion-Little Toby Creek to the south. The borough has a total area of 1.2 square miles, all of which is land.
The borough is located in a hilly region of the state. The highest point in the borough is located at an elevation of 1,890 feet above sea level. The borough is located in a humid continental climate zone, with cold winters and warm summers.
Economy
The economy of Clarion Borough is largely based on tourism and the lumber industry. The borough is home to several sawmills and lumber companies, which provide employment for many of the residents. The borough is also home to several tourist attractions, such as the Clarion River, which is popular for fishing and boating.
The borough is also home to several small businesses, such as restaurants, shops, and other services. The borough is home to Clarion University, which provides employment for many of the residents.
Demographics
As of the 2010 census, the population of Clarion Borough was 2,004. The racial makeup of the borough was 97.3% White, 0.7% African American, 0.2% Native American, 0.4% Asian, and 1.4% from other races. The median household income in the borough was $35,938. The per capita income in the borough was $17,845.
Conclusion
Clarion Borough is a small borough located in Clarion County, Pennsylvania. It is situated in the northwestern part of the state, approximately 70 miles northeast of Pittsburgh. The borough is bordered by the Clarion River to the north and the Clarion-Little Toby Creek to the south. The economy of Clarion Borough is largely based on tourism and the lumber industry. As of the 2010 census, the population of Clarion Borough was 2,004. The racial makeup of the borough was 97.3% White, 0.7% African American, 0.2% Native American, 0.4% Asian, and 1.4% from other races. The median household income in the borough was $35,938. The per capita income in the borough was $17,845.
Common Questions
What is Per Capita Income in Clarion borough?
Per Capita income in Clarion borough is $25,864.
What is the Median Family Income in Clarion borough?
Median Family Income in Clarion borough is $69,412.
What is the Median Household income in Clarion borough?
Median Household Income in Clarion borough is $43,178.
What is Income or Wage Gap in Clarion borough?
Income or Wage Gap in Clarion borough is 55.9%.
Women in Clarion borough earn 44.1 cents for every dollar earned by a man.
What is Inequality or Gini Index in Clarion borough?
Inequality or Gini Index in Clarion borough is 0.49.
What is the Total Population of Clarion borough?
Total Population of Clarion borough is 4,205.
What is the Total Male Population of Clarion borough?
Total Male Population of Clarion borough is 1,796.
What is the Total Female Population of Clarion borough?
Total Female Population of Clarion borough is 2,409.
What is the Ratio of Males per 100 Females in Clarion borough?
There are 74.55 Males per 100 Females in Clarion borough.
What is the Ratio of Females per 100 Males in Clarion borough?
There are 134.13 Females per 100 Males in Clarion borough.
What is the Median Population Age in Clarion borough?
Median Population Age in Clarion borough is 25.0 Years.
What is the Average Family Size in Clarion borough
Average Family Size in Clarion borough is 3.0 People.
What is the Average Household Size in Clarion borough
Average Household Size in Clarion borough is 2.3 People.
How Large is the Labor Force in Clarion borough?
There are 2,380 People in the Labor Forcein in Clarion borough.
What is the Percentage of People in the Labor Force in Clarion borough?
67.7% of People are in the Labor Force in Clarion borough.
What is the Unemployment Rate in Clarion borough?
Unemployment Rate in Clarion borough is 10.2%.