New Paris borough, PA Map & Demographics
New Paris borough Overview
$29,174
PER CAPITA INCOME
$73,750
AVG FAMILY INCOME
$63,250
AVG HOUSEHOLD INCOME
44.1%
WAGE / INCOME GAP [ % ]
55.9¢/ $1
WAGE / INCOME GAP [ $ ]
0.29
INEQUALITY / GINI INDEX
217
TOTAL POPULATION
102
MALE POPULATION
115
FEMALE POPULATION
88.70
MALES / 100 FEMALES
112.75
FEMALES / 100 MALES
40.8
MEDIAN AGE
3.0
AVG FAMILY SIZE
2.3
AVG HOUSEHOLD SIZE
126
LABOR FORCE [ PEOPLE ]
72.0%
PERCENT IN LABOR FORCE
Income in New Paris borough
Income Overview in New Paris borough
Per Capita Income in New Paris borough is $29,174, while median incomes of families and households are $73,750 and $63,250 respectively.
| Characteristic | Number | Measure |
| Per Capita Income | 217 | $29,174 |
| Median Family Income | 58 | $73,750 |
| Mean Family Income | 58 | $73,740 |
| Median Household Income | 93 | $63,250 |
| Mean Household Income | 93 | $65,147 |
| Income Deficit | 58 | $0 |
| Wage / Income Gap (%) | 217 | 44.06% |
| Wage / Income Gap ($) | 217 | 55.94¢ per $1 |
| Gini / Inequality Index | 217 | 0.29 |
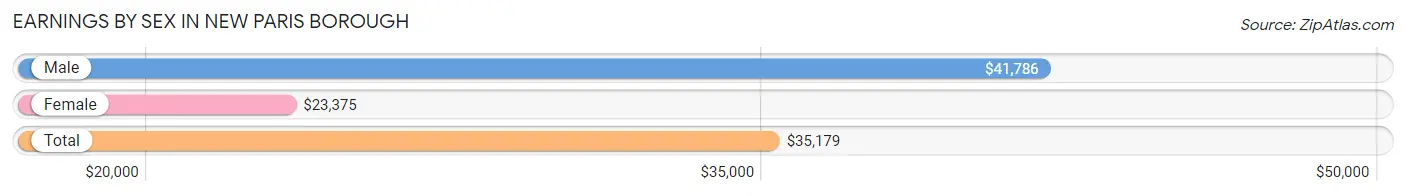
Earnings by Sex in New Paris borough
Average Earnings in New Paris borough are $35,179, $41,786 for men and $23,375 for women, a difference of 44.1%.
| Sex | Number | Average Earnings |
| Male | 74 (54.8%) | $41,786 |
| Female | 61 (45.2%) | $23,375 |
| Total | 135 (100.0%) | $35,179 |
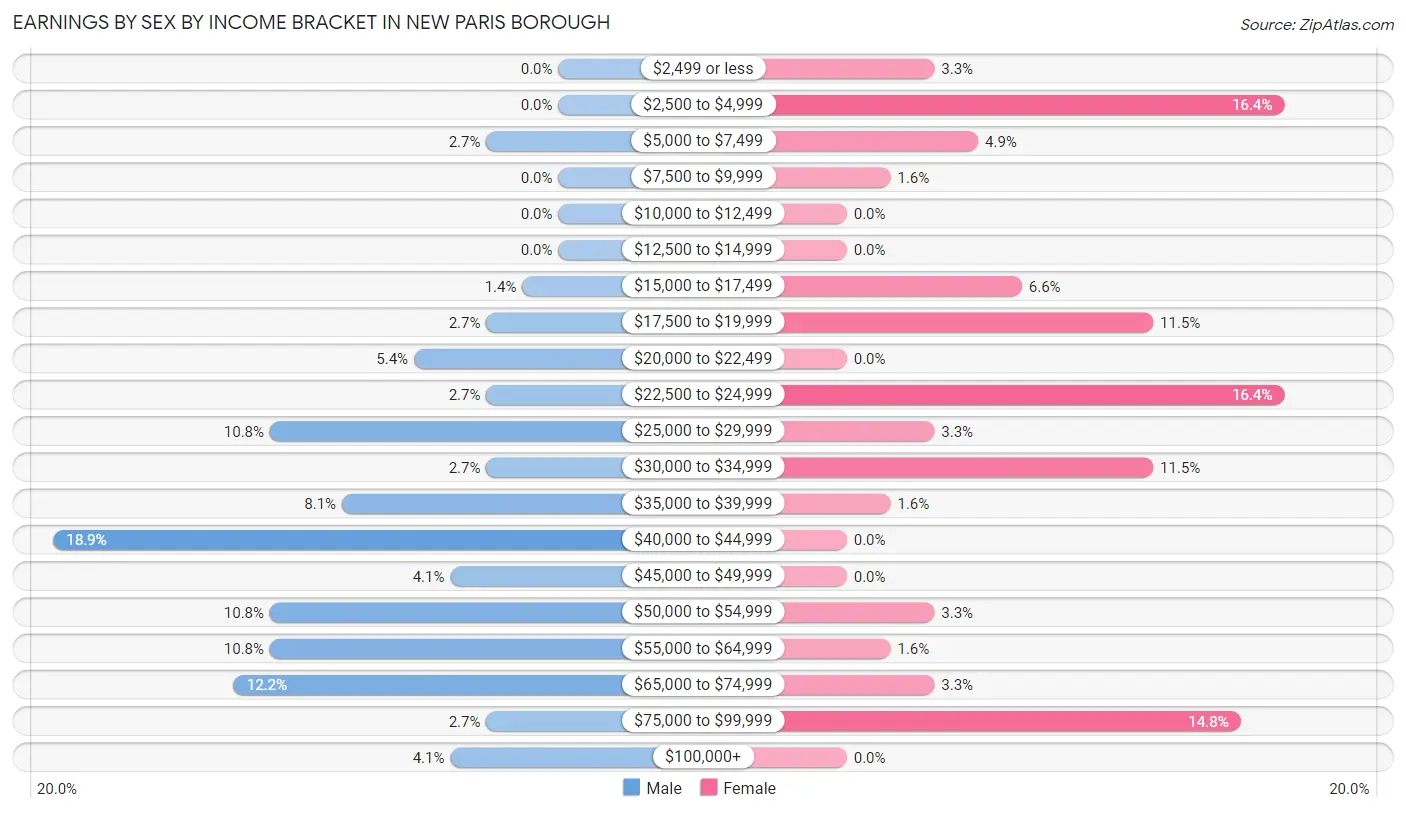
Earnings by Sex by Income Bracket in New Paris borough
The most common earnings brackets in New Paris borough are $40,000 to $44,999 for men (14 | 18.9%) and $2,500 to $4,999 for women (10 | 16.4%).
| Income | Male | Female |
| $2,499 or less | 0 (0.0%) | 2 (3.3%) |
| $2,500 to $4,999 | 0 (0.0%) | 10 (16.4%) |
| $5,000 to $7,499 | 2 (2.7%) | 3 (4.9%) |
| $7,500 to $9,999 | 0 (0.0%) | 1 (1.6%) |
| $10,000 to $12,499 | 0 (0.0%) | 0 (0.0%) |
| $12,500 to $14,999 | 0 (0.0%) | 0 (0.0%) |
| $15,000 to $17,499 | 1 (1.3%) | 4 (6.6%) |
| $17,500 to $19,999 | 2 (2.7%) | 7 (11.5%) |
| $20,000 to $22,499 | 4 (5.4%) | 0 (0.0%) |
| $22,500 to $24,999 | 2 (2.7%) | 10 (16.4%) |
| $25,000 to $29,999 | 8 (10.8%) | 2 (3.3%) |
| $30,000 to $34,999 | 2 (2.7%) | 7 (11.5%) |
| $35,000 to $39,999 | 6 (8.1%) | 1 (1.6%) |
| $40,000 to $44,999 | 14 (18.9%) | 0 (0.0%) |
| $45,000 to $49,999 | 3 (4.1%) | 0 (0.0%) |
| $50,000 to $54,999 | 8 (10.8%) | 2 (3.3%) |
| $55,000 to $64,999 | 8 (10.8%) | 1 (1.6%) |
| $65,000 to $74,999 | 9 (12.2%) | 2 (3.3%) |
| $75,000 to $99,999 | 2 (2.7%) | 9 (14.7%) |
| $100,000+ | 3 (4.1%) | 0 (0.0%) |
| Total | 74 (100.0%) | 61 (100.0%) |
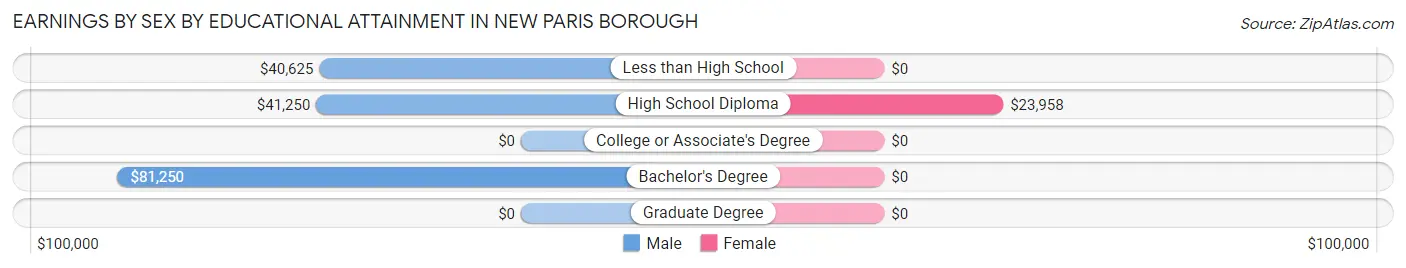
Earnings by Sex by Educational Attainment in New Paris borough
Average earnings in New Paris borough are $41,518 for men and $24,625 for women, a difference of 40.7%. Men with an educational attainment of bachelor's degree enjoy the highest average annual earnings of $81,250, while those with less than high school education earn the least with $40,625. Women with an educational attainment of high school diploma earn the most with the average annual earnings of $23,958, while those with high school diploma education have the smallest earnings of $23,958.
| Educational Attainment | Male Income | Female Income |
| Less than High School | $40,625 | $0 |
| High School Diploma | $41,250 | $23,958 |
| College or Associate's Degree | - | - |
| Bachelor's Degree | $81,250 | $0 |
| Graduate Degree | - | - |
| Total | $41,518 | $24,625 |
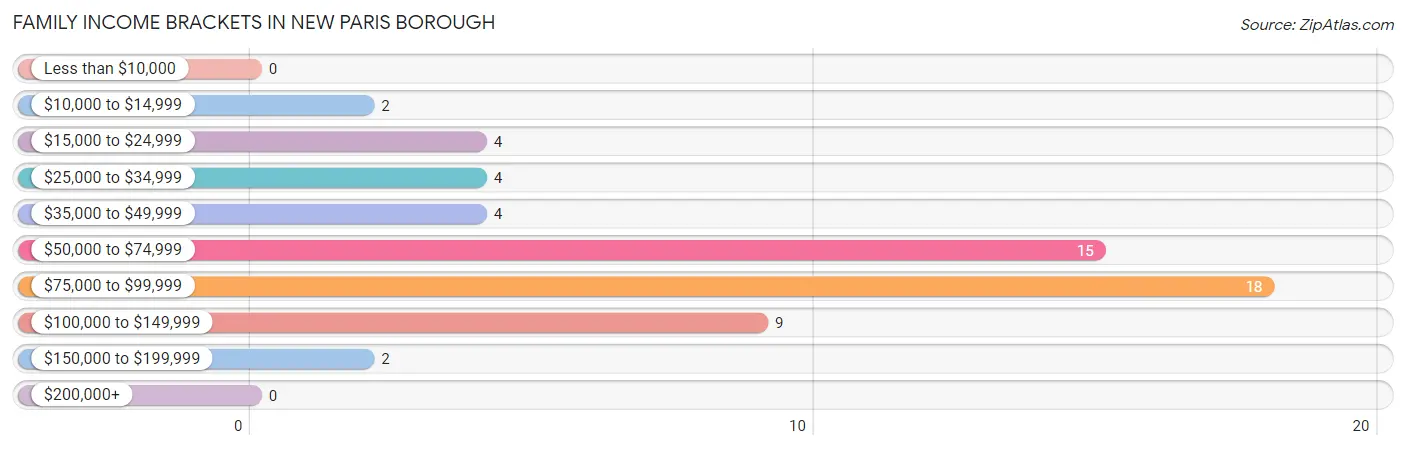
Family Income in New Paris borough
Family Income Brackets in New Paris borough
According to the New Paris borough family income data, there are 18 families falling into the $75,000 to $99,999 income range, which is the most common income bracket and makes up 31.0% of all families.
| Income Bracket | # Families | % Families |
| Less than $10,000 | 0 | 0.0% |
| $10,000 to $14,999 | 2 | 3.4% |
| $15,000 to $24,999 | 4 | 6.9% |
| $25,000 to $34,999 | 4 | 6.9% |
| $35,000 to $49,999 | 4 | 6.9% |
| $50,000 to $74,999 | 15 | 25.9% |
| $75,000 to $99,999 | 18 | 31.0% |
| $100,000 to $149,999 | 9 | 15.5% |
| $150,000 to $199,999 | 2 | 3.4% |
| $200,000+ | 0 | 0.0% |
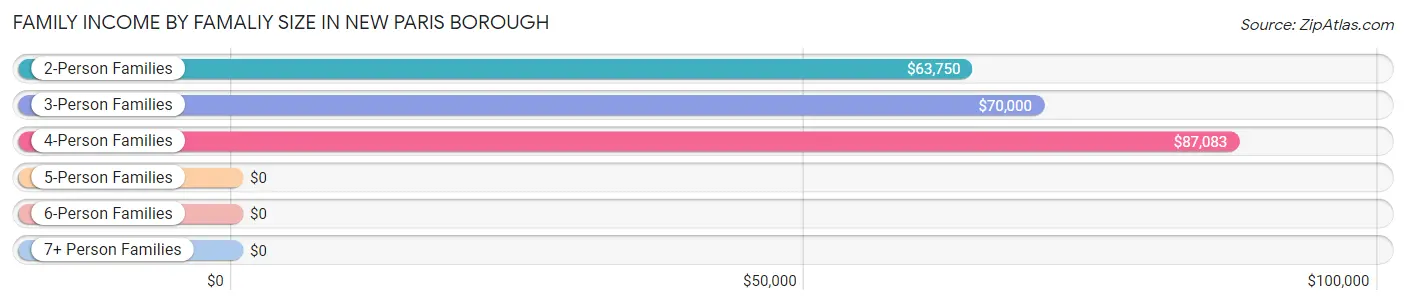
Family Income by Famaliy Size in New Paris borough
4-person families (11 | 19.0%) account for the highest median family income in New Paris borough with $87,083 per family, while 2-person families (22 | 37.9%) have the highest median income of $31,875 per family member.
| Income Bracket | # Families | Median Income |
| 2-Person Families | 22 (37.9%) | $63,750 |
| 3-Person Families | 24 (41.4%) | $70,000 |
| 4-Person Families | 11 (19.0%) | $87,083 |
| 5-Person Families | 0 (0.0%) | $0 |
| 6-Person Families | 1 (1.7%) | $0 |
| 7+ Person Families | 0 (0.0%) | $0 |
| Total | 58 (100.0%) | $73,750 |
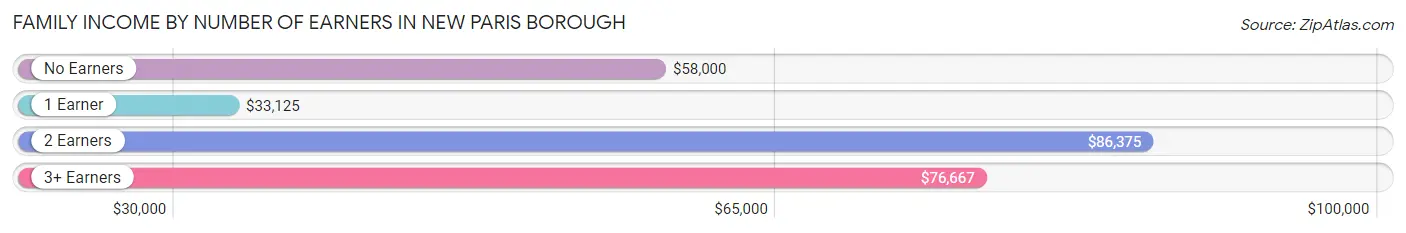
Family Income by Number of Earners in New Paris borough
The median family income in New Paris borough is $73,750, with families comprising 2 earners (29) having the highest median family income of $86,375, while families with 1 earner (13) have the lowest median family income of $33,125, accounting for 50.0% and 22.4% of families, respectively.
| Number of Earners | # Families | Median Income |
| No Earners | 8 (13.8%) | $58,000 |
| 1 Earner | 13 (22.4%) | $33,125 |
| 2 Earners | 29 (50.0%) | $86,375 |
| 3+ Earners | 8 (13.8%) | $76,667 |
| Total | 58 (100.0%) | $73,750 |
Household Income in New Paris borough
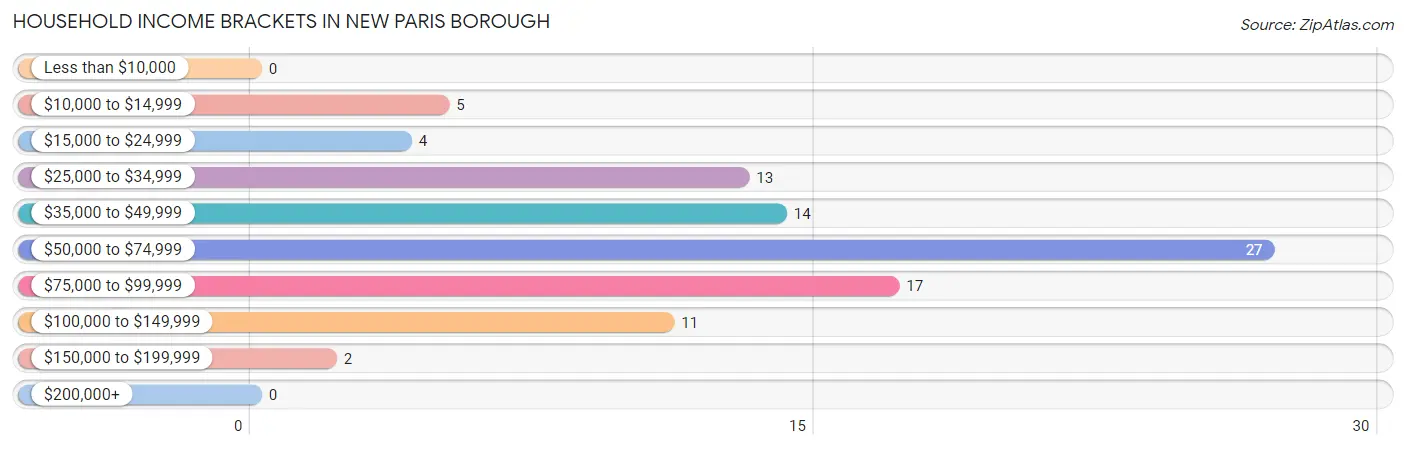
Household Income Brackets in New Paris borough
With 27 households falling in the category, the $50,000 to $74,999 income range is the most frequent in New Paris borough, accounting for 29.0% of all households.
| Income Bracket | # Households | % Households |
| Less than $10,000 | 0 | 0.0% |
| $10,000 to $14,999 | 5 | 5.4% |
| $15,000 to $24,999 | 4 | 4.3% |
| $25,000 to $34,999 | 13 | 14.0% |
| $35,000 to $49,999 | 14 | 15.1% |
| $50,000 to $74,999 | 27 | 29.0% |
| $75,000 to $99,999 | 17 | 18.3% |
| $100,000 to $149,999 | 11 | 11.8% |
| $150,000 to $199,999 | 2 | 2.2% |
| $200,000+ | 0 | 0.0% |
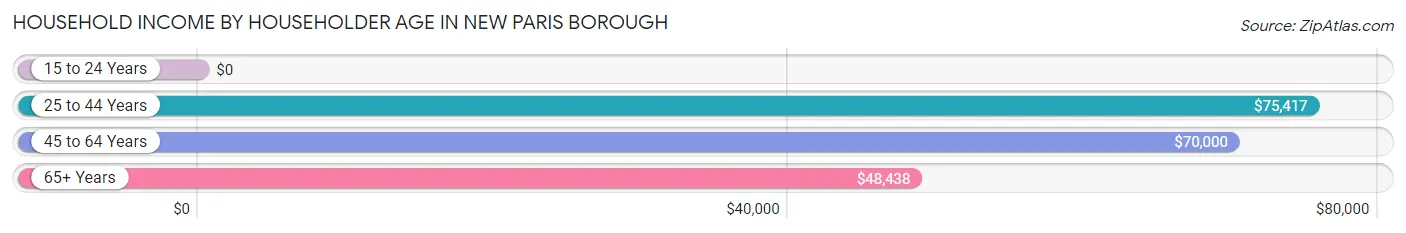
Household Income by Householder Age in New Paris borough
The median household income in New Paris borough is $63,250, with the highest median household income of $75,417 found in the 25 to 44 years age bracket for the primary householder. A total of 24 households (25.8%) fall into this category. Meanwhile, the 15 to 24 years age bracket for the primary householder has the lowest median household income of $0, with 2 households (2.1%) in this group.
| Income Bracket | # Households | Median Income |
| 15 to 24 Years | 2 (2.1%) | $0 |
| 25 to 44 Years | 24 (25.8%) | $75,417 |
| 45 to 64 Years | 42 (45.2%) | $70,000 |
| 65+ Years | 25 (26.9%) | $48,438 |
| Total | 93 (100.0%) | $63,250 |
Poverty in New Paris borough
Income Below Poverty by Sex and Age in New Paris borough
With 3.9% poverty level for males and 18.3% for females among the residents of New Paris borough, 65 to 74 year old males and 6 to 11 year old females are the most vulnerable to poverty, with 2 males (20.0%) and 10 females (52.6%) in their respective age groups living below the poverty level.
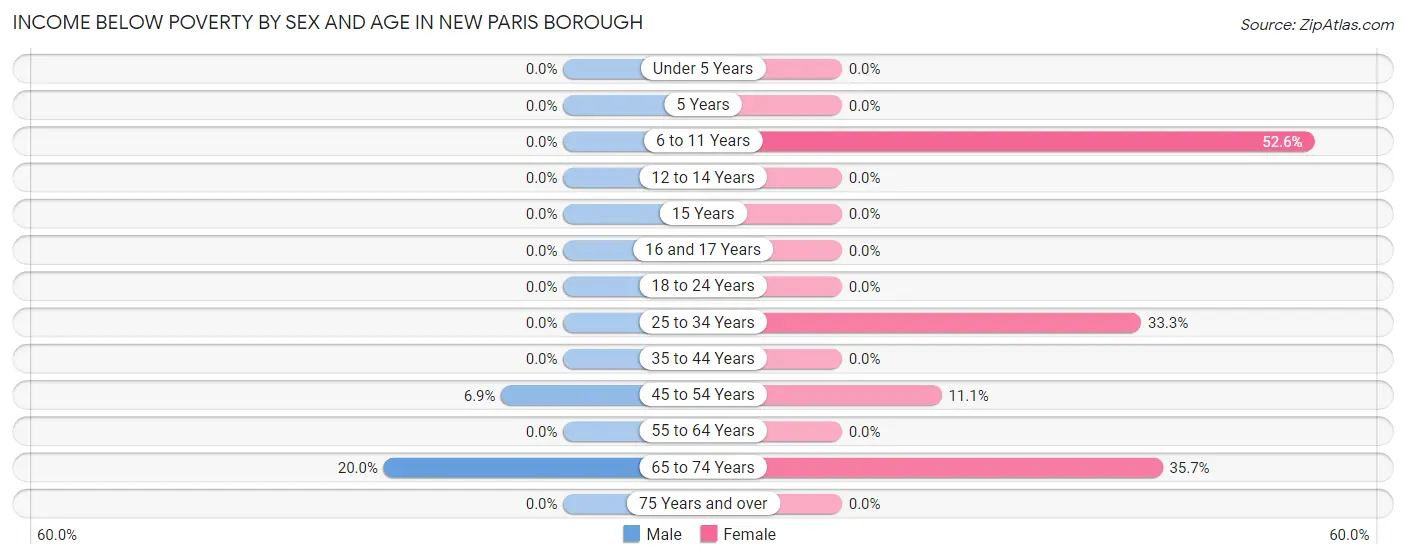
| Age Bracket | Male | Female |
| Under 5 Years | 0 (0.0%) | 0 (0.0%) |
| 5 Years | 0 (0.0%) | 0 (0.0%) |
| 6 to 11 Years | 0 (0.0%) | 10 (52.6%) |
| 12 to 14 Years | 0 (0.0%) | 0 (0.0%) |
| 15 Years | 0 (0.0%) | 0 (0.0%) |
| 16 and 17 Years | 0 (0.0%) | 0 (0.0%) |
| 18 to 24 Years | 0 (0.0%) | 0 (0.0%) |
| 25 to 34 Years | 0 (0.0%) | 4 (33.3%) |
| 35 to 44 Years | 0 (0.0%) | 0 (0.0%) |
| 45 to 54 Years | 2 (6.9%) | 2 (11.1%) |
| 55 to 64 Years | 0 (0.0%) | 0 (0.0%) |
| 65 to 74 Years | 2 (20.0%) | 5 (35.7%) |
| 75 Years and over | 0 (0.0%) | 0 (0.0%) |
| Total | 4 (3.9%) | 21 (18.3%) |
Income Above Poverty by Sex and Age in New Paris borough
According to the poverty statistics in New Paris borough, males aged under 5 years and females aged under 5 years are the age groups that are most secure financially, with 100.0% of males and 100.0% of females in these age groups living above the poverty line.
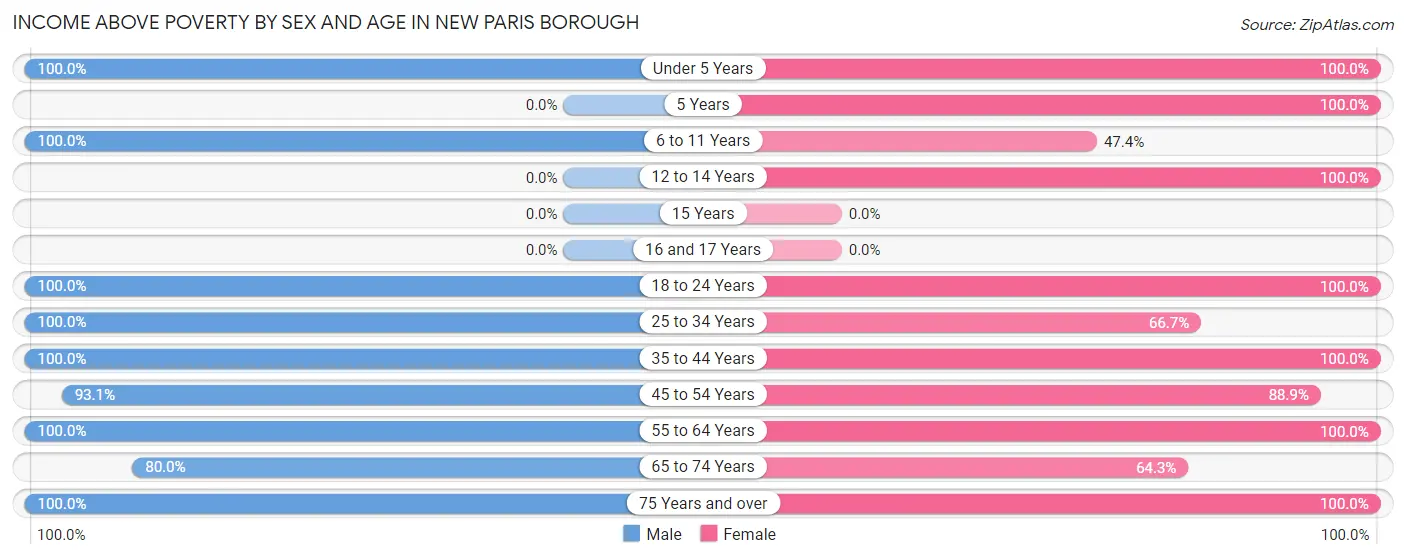
| Age Bracket | Male | Female |
| Under 5 Years | 5 (100.0%) | 4 (100.0%) |
| 5 Years | 0 (0.0%) | 4 (100.0%) |
| 6 to 11 Years | 8 (100.0%) | 9 (47.4%) |
| 12 to 14 Years | 0 (0.0%) | 2 (100.0%) |
| 15 Years | 0 (0.0%) | 0 (0.0%) |
| 16 and 17 Years | 0 (0.0%) | 0 (0.0%) |
| 18 to 24 Years | 11 (100.0%) | 14 (100.0%) |
| 25 to 34 Years | 17 (100.0%) | 8 (66.7%) |
| 35 to 44 Years | 6 (100.0%) | 13 (100.0%) |
| 45 to 54 Years | 27 (93.1%) | 16 (88.9%) |
| 55 to 64 Years | 9 (100.0%) | 7 (100.0%) |
| 65 to 74 Years | 8 (80.0%) | 9 (64.3%) |
| 75 Years and over | 7 (100.0%) | 8 (100.0%) |
| Total | 98 (96.1%) | 94 (81.7%) |
Income Below Poverty Among Married-Couple Families in New Paris borough
The poverty statistics for married-couple families in New Paris borough show that 5.1% or 2 of the total 39 families live below the poverty line. Families with no children have the highest poverty rate of 10.5%, comprising of 2 families. On the other hand, families with 1 or 2 children have the lowest poverty rate of 0.0%, which includes 0 families.
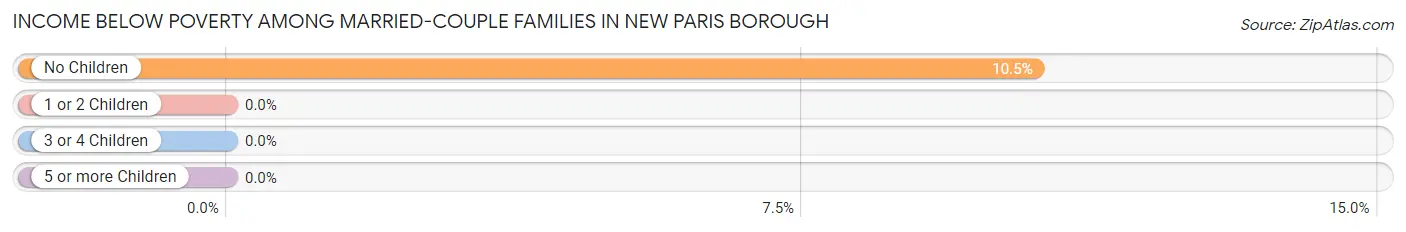
| Children | Above Poverty | Below Poverty |
| No Children | 17 (89.5%) | 2 (10.5%) |
| 1 or 2 Children | 20 (100.0%) | 0 (0.0%) |
| 3 or 4 Children | 0 (0.0%) | 0 (0.0%) |
| 5 or more Children | 0 (0.0%) | 0 (0.0%) |
| Total | 37 (94.9%) | 2 (5.1%) |
Income Below Poverty Among Single-Parent Households in New Paris borough
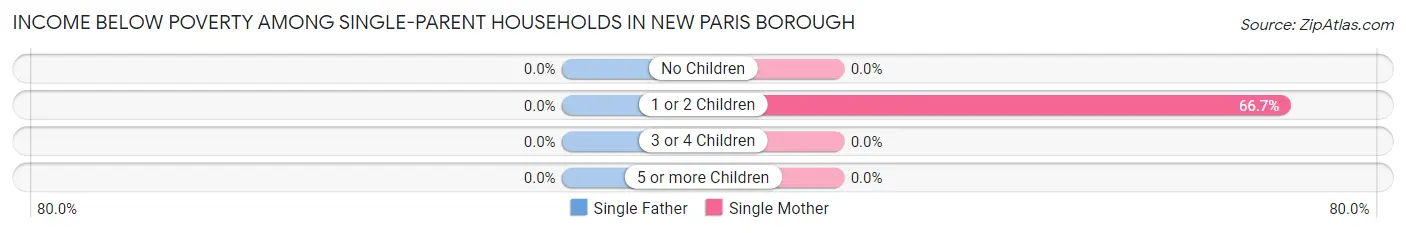
| Children | Single Father | Single Mother |
| No Children | 0 (0.0%) | 0 (0.0%) |
| 1 or 2 Children | 0 (0.0%) | 4 (66.7%) |
| 3 or 4 Children | 0 (0.0%) | 0 (0.0%) |
| 5 or more Children | 0 (0.0%) | 0 (0.0%) |
| Total | 0 (0.0%) | 4 (28.6%) |
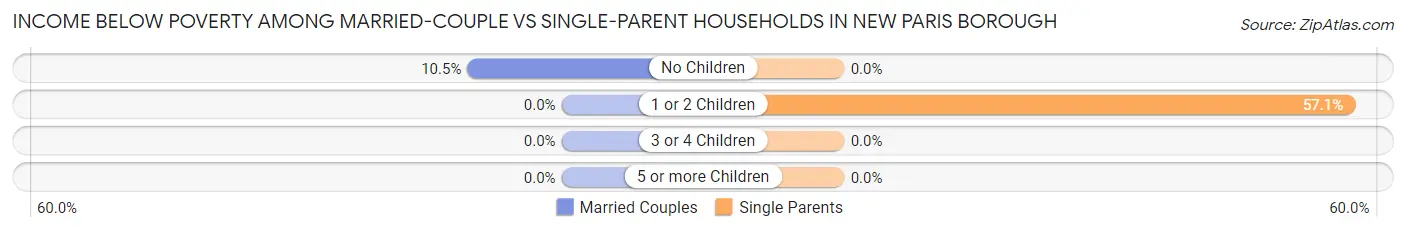
Income Below Poverty Among Married-Couple vs Single-Parent Households in New Paris borough
The poverty data for New Paris borough shows that 2 of the married-couple family households (5.1%) and 4 of the single-parent households (21.0%) are living below the poverty level. Within the married-couple family households, those with no children have the highest poverty rate, with 2 households (10.5%) falling below the poverty line. Among the single-parent households, those with 1 or 2 children have the highest poverty rate, with 4 household (57.1%) living below poverty.
| Children | Married-Couple Families | Single-Parent Households |
| No Children | 2 (10.5%) | 0 (0.0%) |
| 1 or 2 Children | 0 (0.0%) | 4 (57.1%) |
| 3 or 4 Children | 0 (0.0%) | 0 (0.0%) |
| 5 or more Children | 0 (0.0%) | 0 (0.0%) |
| Total | 2 (5.1%) | 4 (21.0%) |
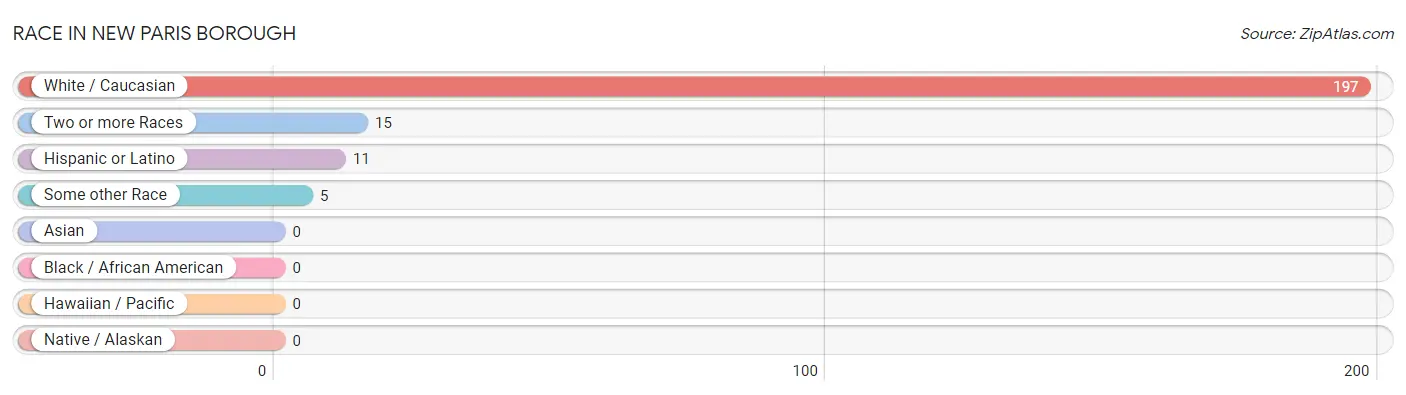
Race in New Paris borough
The most populous races in New Paris borough are White / Caucasian (197 | 90.8%), Two or more Races (15 | 6.9%), and Hispanic or Latino (11 | 5.1%).
| Race | # Population | % Population |
| Asian | 0 | 0.0% |
| Black / African American | 0 | 0.0% |
| Hawaiian / Pacific | 0 | 0.0% |
| Hispanic or Latino | 11 | 5.1% |
| Native / Alaskan | 0 | 0.0% |
| White / Caucasian | 197 | 90.8% |
| Two or more Races | 15 | 6.9% |
| Some other Race | 5 | 2.3% |
| Total | 217 | 100.0% |
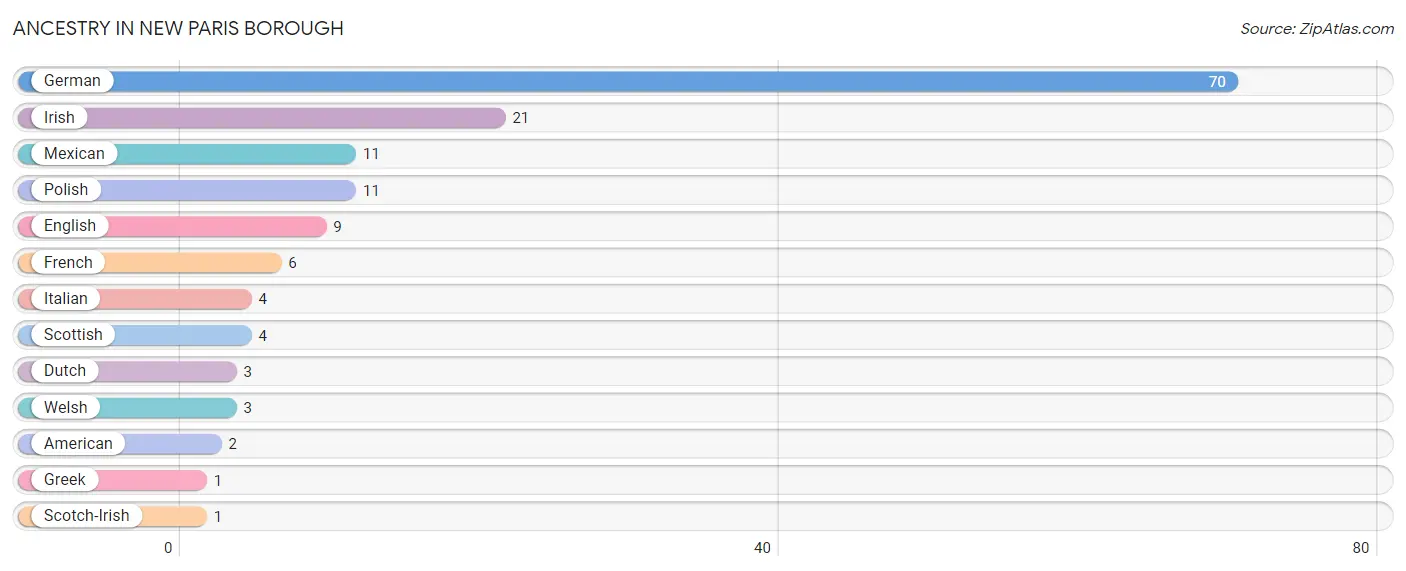
Ancestry in New Paris borough
The most populous ancestries reported in New Paris borough are German (70 | 32.3%), Irish (21 | 9.7%), Mexican (11 | 5.1%), Polish (11 | 5.1%), and English (9 | 4.2%), together accounting for 56.2% of all New Paris borough residents.
| Ancestry | # Population | % Population |
| American | 2 | 0.9% |
| Dutch | 3 | 1.4% |
| English | 9 | 4.2% |
| French | 6 | 2.8% |
| German | 70 | 32.3% |
| Greek | 1 | 0.5% |
| Irish | 21 | 9.7% |
| Italian | 4 | 1.8% |
| Mexican | 11 | 5.1% |
| Polish | 11 | 5.1% |
| Scotch-Irish | 1 | 0.5% |
| Scottish | 4 | 1.8% |
| Welsh | 3 | 1.4% | View All 13 Rows |
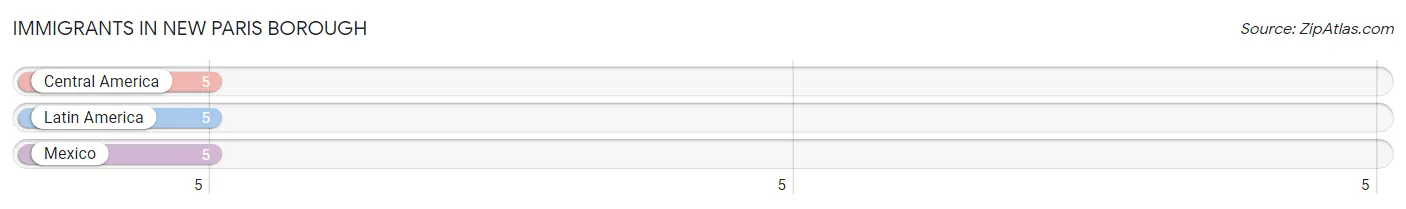
Immigrants in New Paris borough
The most numerous immigrant groups reported in New Paris borough came from Central America (5 | 2.3%), Latin America (5 | 2.3%), and Mexico (5 | 2.3%), together accounting for 6.9% of all New Paris borough residents.
| Immigration Origin | # Population | % Population |
| Central America | 5 | 2.3% |
| Latin America | 5 | 2.3% |
| Mexico | 5 | 2.3% | View All 3 Rows |
Sex and Age in New Paris borough
Sex and Age in New Paris borough
The most populous age groups in New Paris borough are 45 to 49 Years (18 | 17.6%) for men and 5 to 9 Years (19 | 16.5%) for women.
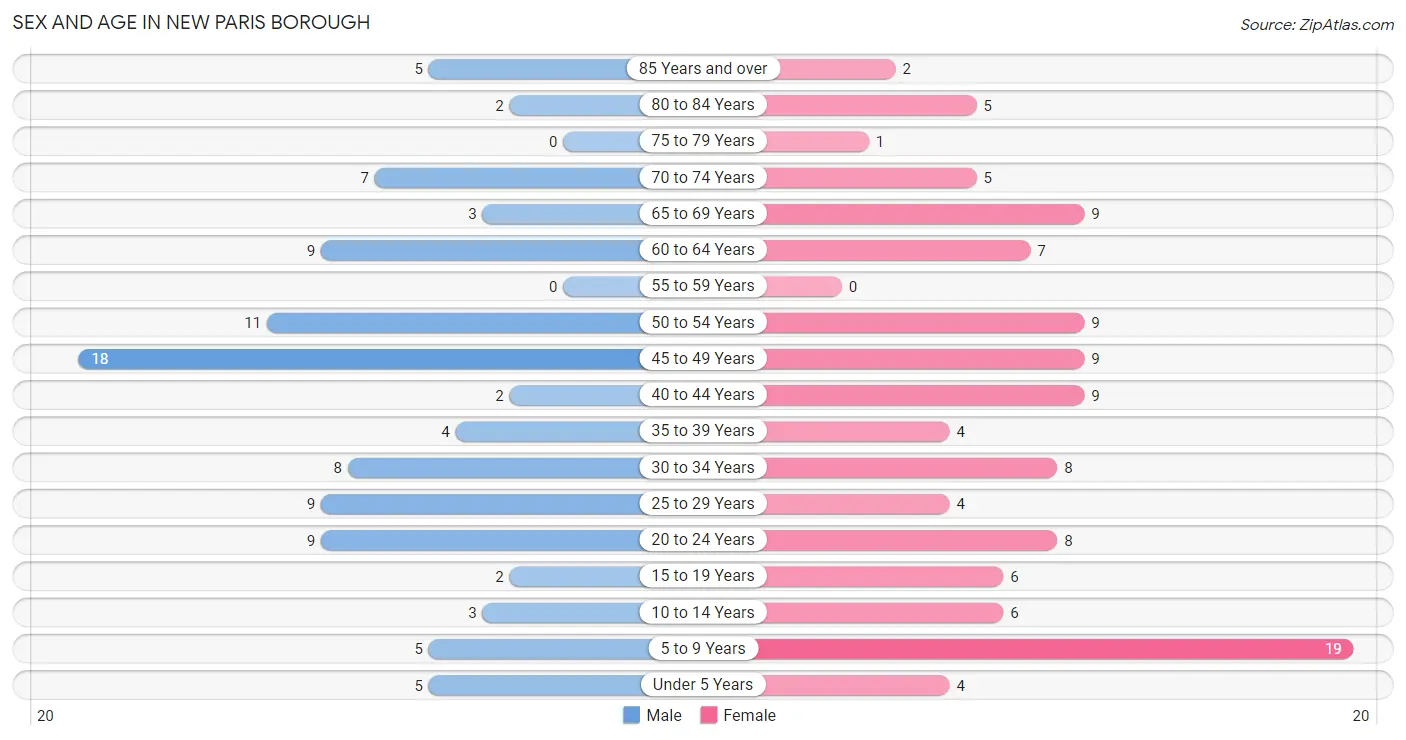
| Age Bracket | Male | Female |
| Under 5 Years | 5 (4.9%) | 4 (3.5%) |
| 5 to 9 Years | 5 (4.9%) | 19 (16.5%) |
| 10 to 14 Years | 3 (2.9%) | 6 (5.2%) |
| 15 to 19 Years | 2 (2.0%) | 6 (5.2%) |
| 20 to 24 Years | 9 (8.8%) | 8 (7.0%) |
| 25 to 29 Years | 9 (8.8%) | 4 (3.5%) |
| 30 to 34 Years | 8 (7.8%) | 8 (7.0%) |
| 35 to 39 Years | 4 (3.9%) | 4 (3.5%) |
| 40 to 44 Years | 2 (2.0%) | 9 (7.8%) |
| 45 to 49 Years | 18 (17.6%) | 9 (7.8%) |
| 50 to 54 Years | 11 (10.8%) | 9 (7.8%) |
| 55 to 59 Years | 0 (0.0%) | 0 (0.0%) |
| 60 to 64 Years | 9 (8.8%) | 7 (6.1%) |
| 65 to 69 Years | 3 (2.9%) | 9 (7.8%) |
| 70 to 74 Years | 7 (6.9%) | 5 (4.3%) |
| 75 to 79 Years | 0 (0.0%) | 1 (0.9%) |
| 80 to 84 Years | 2 (2.0%) | 5 (4.3%) |
| 85 Years and over | 5 (4.9%) | 2 (1.7%) |
| Total | 102 (100.0%) | 115 (100.0%) |
Families and Households in New Paris borough
Median Family Size in New Paris borough
The median family size in New Paris borough is 3.02 persons per family, with married-couple families (39 | 67.2%) accounting for the largest median family size of 3.13 persons per family. On the other hand, single male/father families (5 | 8.6%) represent the smallest median family size with 2.40 persons per family.
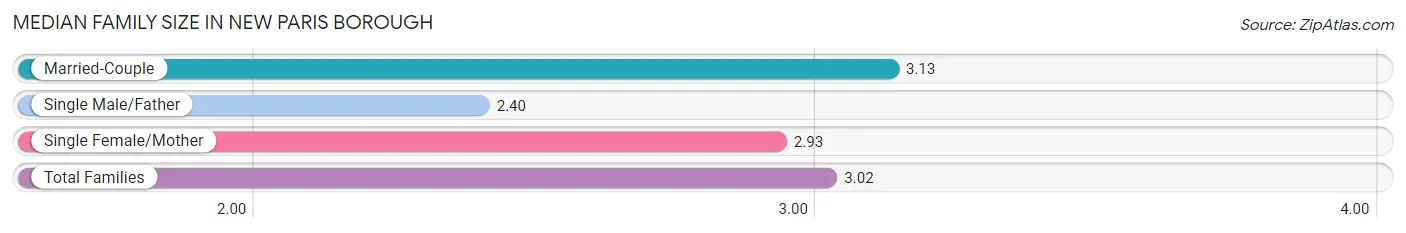
| Family Type | # Families | Family Size |
| Married-Couple | 39 (67.2%) | 3.13 |
| Single Male/Father | 5 (8.6%) | 2.40 |
| Single Female/Mother | 14 (24.1%) | 2.93 |
| Total Families | 58 (100.0%) | 3.02 |
Median Household Size in New Paris borough
The median household size in New Paris borough is 2.33 persons per household, with married-couple households (39 | 41.9%) accounting for the largest median household size of 3.13 persons per household. non-family households (35 | 37.6%) represent the smallest median household size with 1.11 persons per household.
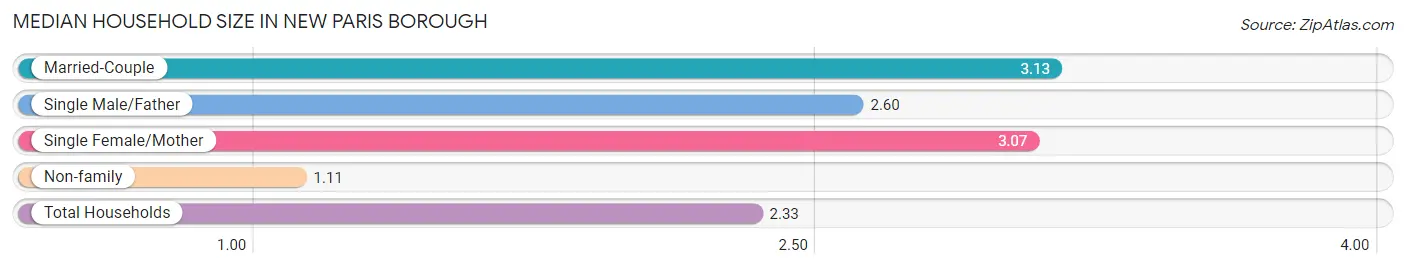
| Household Type | # Households | Household Size |
| Married-Couple | 39 (41.9%) | 3.13 |
| Single Male/Father | 5 (5.4%) | 2.60 |
| Single Female/Mother | 14 (15.0%) | 3.07 |
| Non-family | 35 (37.6%) | 1.11 |
| Total Households | 93 (100.0%) | 2.33 |
Household Size by Marriage Status in New Paris borough
Out of a total of 93 households in New Paris borough, 58 (62.4%) are family households, while 35 (37.6%) are nonfamily households. The most numerous type of family households are 3-person households, comprising 25, and the most common type of nonfamily households are 1-person households, comprising 31.
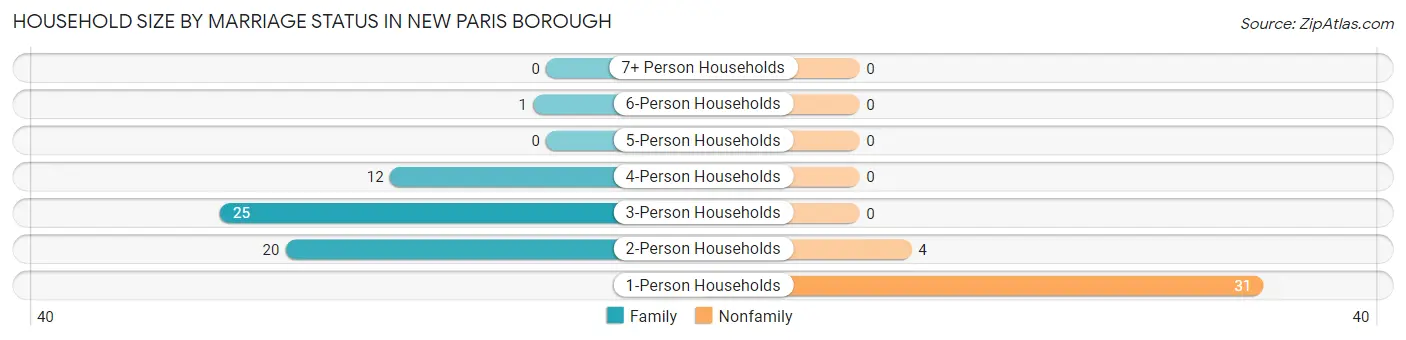
| Household Size | Family Households | Nonfamily Households |
| 1-Person Households | - | 31 (33.3%) |
| 2-Person Households | 20 (21.5%) | 4 (4.3%) |
| 3-Person Households | 25 (26.9%) | 0 (0.0%) |
| 4-Person Households | 12 (12.9%) | 0 (0.0%) |
| 5-Person Households | 0 (0.0%) | 0 (0.0%) |
| 6-Person Households | 1 (1.1%) | 0 (0.0%) |
| 7+ Person Households | 0 (0.0%) | 0 (0.0%) |
| Total | 58 (62.4%) | 35 (37.6%) |
Female Fertility in New Paris borough
Fertility by Age in New Paris borough
Average fertility rate in New Paris borough is 41.0 births per 1,000 women. Women in the age bracket of 20 to 34 years have the highest fertility rate with 100.0 births per 1,000 women. Women in the age bracket of 20 to 34 years acount for 100.0% of all women with births.
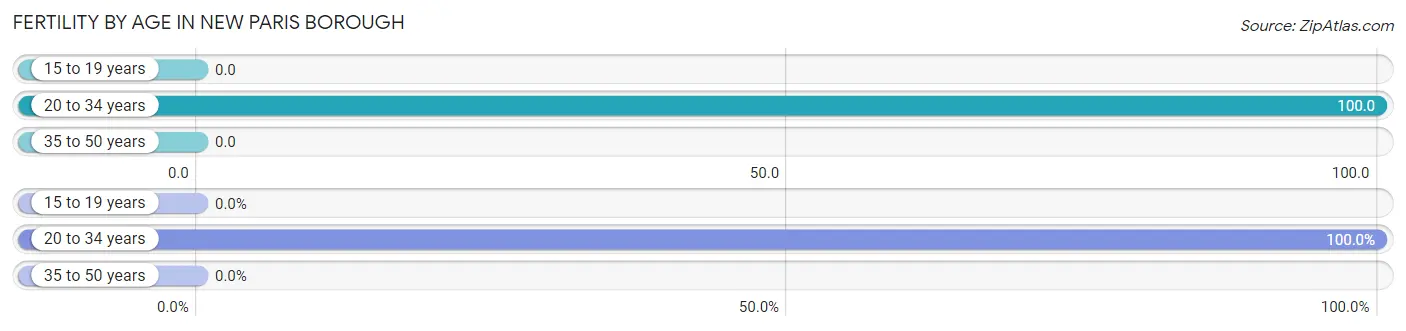
| Age Bracket | Women with Births | Births / 1,000 Women |
| 15 to 19 years | 0 (0.0%) | 0.0 |
| 20 to 34 years | 2 (100.0%) | 100.0 |
| 35 to 50 years | 0 (0.0%) | 0.0 |
| Total | 2 (100.0%) | 41.0 |
Fertility by Age by Marriage Status in New Paris borough
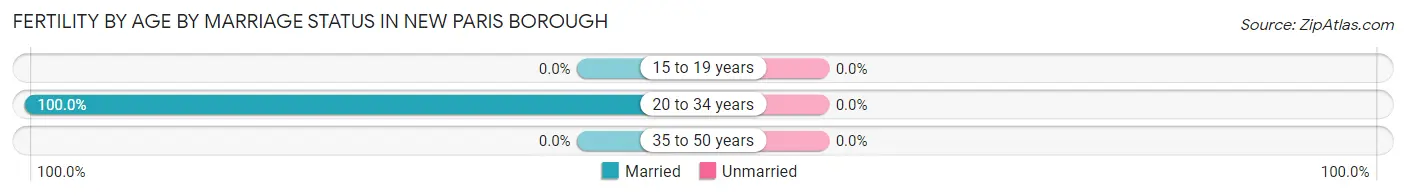
| Age Bracket | Married | Unmarried |
| 15 to 19 years | 0 (0.0%) | 0 (0.0%) |
| 20 to 34 years | 2 (100.0%) | 0 (0.0%) |
| 35 to 50 years | 0 (0.0%) | 0 (0.0%) |
| Total | 2 (100.0%) | 0 (0.0%) |
Fertility by Education in New Paris borough
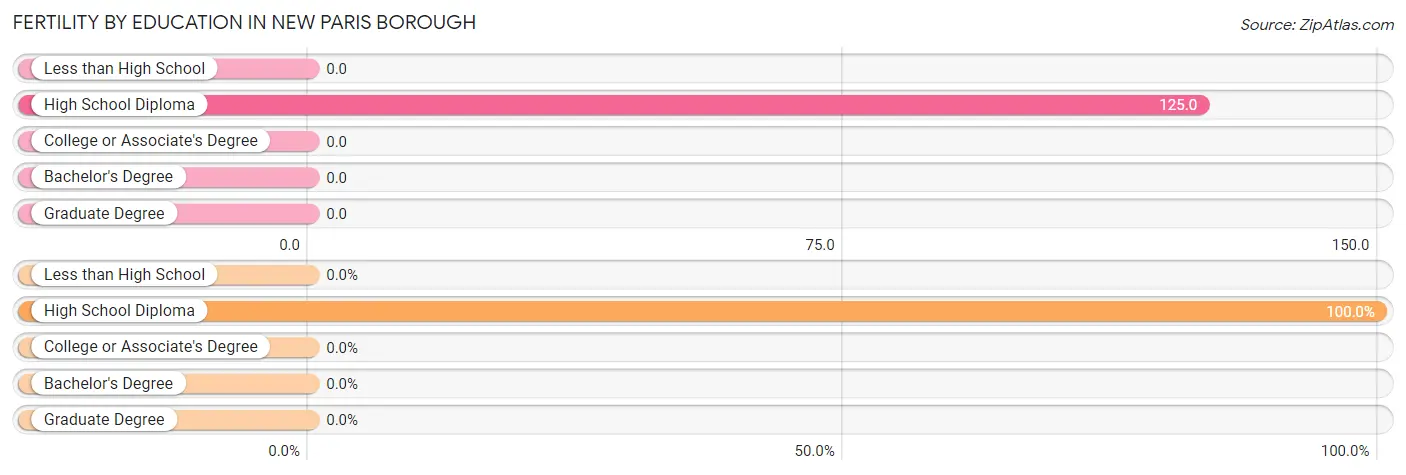
| Educational Attainment | Women with Births | Births / 1,000 Women |
| Less than High School | 0 (0.0%) | 0.0 |
| High School Diploma | 2 (100.0%) | 125.0 |
| College or Associate's Degree | 0 (0.0%) | 0.0 |
| Bachelor's Degree | 0 (0.0%) | 0.0 |
| Graduate Degree | 0 (0.0%) | 0.0 |
| Total | 2 (100.0%) | 41.0 |
Fertility by Education by Marriage Status in New Paris borough
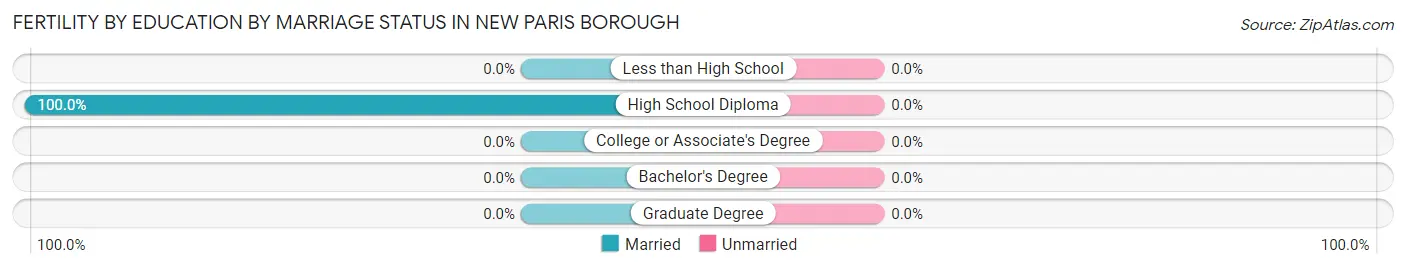
| Educational Attainment | Married | Unmarried |
| Less than High School | 0 (0.0%) | 0 (0.0%) |
| High School Diploma | 2 (100.0%) | 0 (0.0%) |
| College or Associate's Degree | 0 (0.0%) | 0 (0.0%) |
| Bachelor's Degree | 0 (0.0%) | 0 (0.0%) |
| Graduate Degree | 0 (0.0%) | 0 (0.0%) |
| Total | 2 (100.0%) | 0 (0.0%) |
Employment Characteristics in New Paris borough
Employment by Class of Employer in New Paris borough
Among the 126 employed individuals in New Paris borough, private company employees (79 | 62.7%), not-for-profit organizations (25 | 19.8%), and state government employees (9 | 7.1%) make up the most common classes of employment.
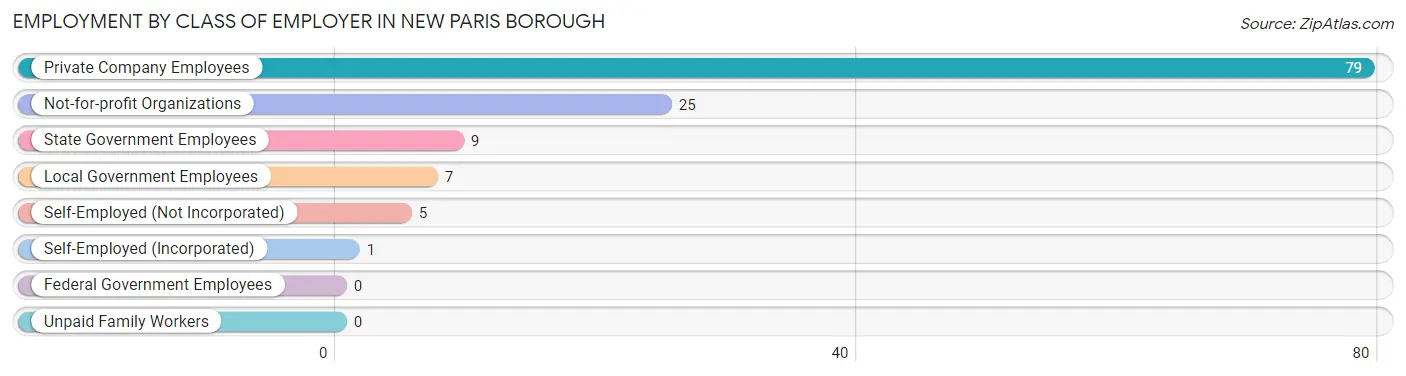
| Employer Class | # Employees | % Employees |
| Private Company Employees | 79 | 62.7% |
| Self-Employed (Incorporated) | 1 | 0.8% |
| Self-Employed (Not Incorporated) | 5 | 4.0% |
| Not-for-profit Organizations | 25 | 19.8% |
| Local Government Employees | 7 | 5.6% |
| State Government Employees | 9 | 7.1% |
| Federal Government Employees | 0 | 0.0% |
| Unpaid Family Workers | 0 | 0.0% |
| Total | 126 | 100.0% |
Employment Status by Age in New Paris borough
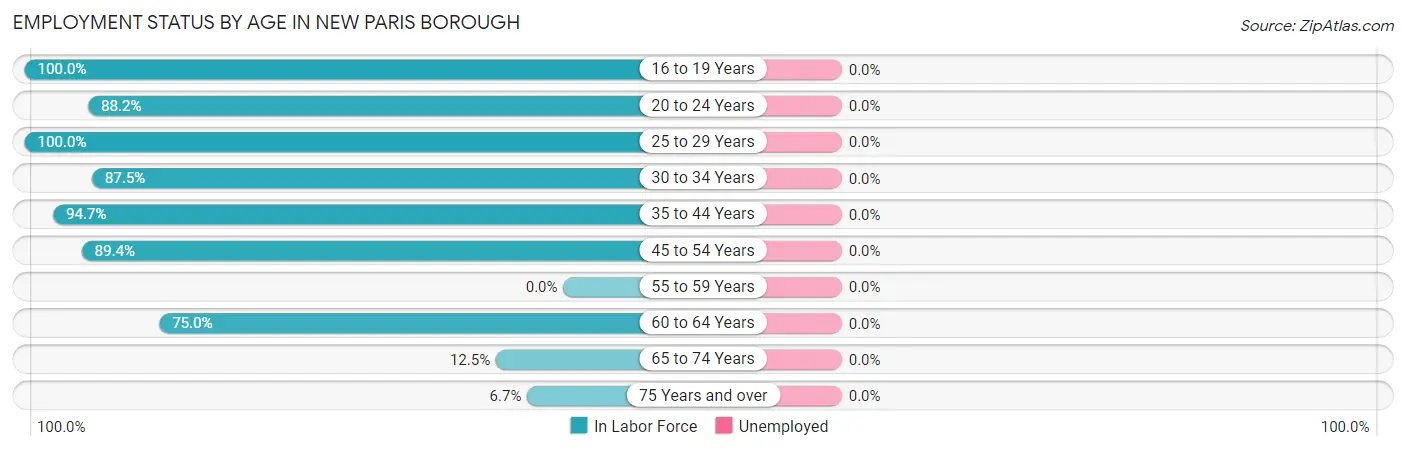
| Age Bracket | In Labor Force | Unemployed |
| 16 to 19 Years | 8 (100.0%) | 0 (0.0%) |
| 20 to 24 Years | 15 (88.2%) | 0 (0.0%) |
| 25 to 29 Years | 13 (100.0%) | 0 (0.0%) |
| 30 to 34 Years | 14 (87.5%) | 0 (0.0%) |
| 35 to 44 Years | 18 (94.7%) | 0 (0.0%) |
| 45 to 54 Years | 42 (89.4%) | 0 (0.0%) |
| 55 to 59 Years | 0 (0.0%) | 0 (0.0%) |
| 60 to 64 Years | 12 (75.0%) | 0 (0.0%) |
| 65 to 74 Years | 3 (12.5%) | 0 (0.0%) |
| 75 Years and over | 1 (6.7%) | 0 (0.0%) |
| Total | 126 (72.0%) | 0 (0.0%) |
Employment Status by Educational Attainment in New Paris borough
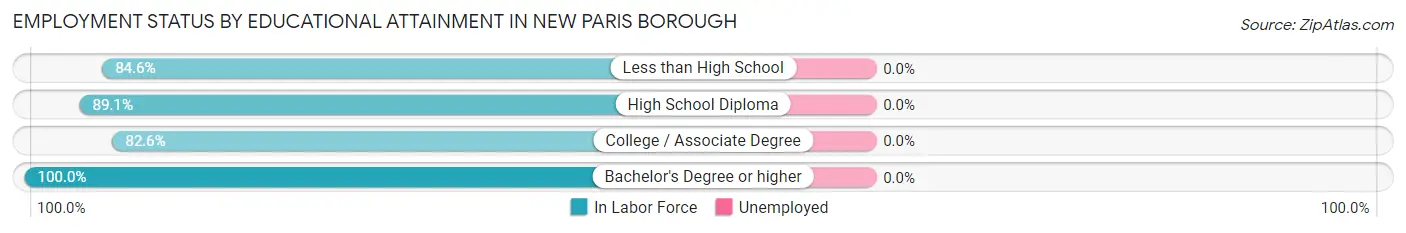
| Educational Attainment | In Labor Force | Unemployed |
| Less than High School | 11 (84.6%) | 0 (0.0%) |
| High School Diploma | 49 (89.1%) | 0 (0.0%) |
| College / Associate Degree | 19 (82.6%) | 0 (0.0%) |
| Bachelor's Degree or higher | 20 (100.0%) | 0 (0.0%) |
| Total | 99 (89.2%) | 0 (0.0%) |
Employment Occupations by Sex in New Paris borough
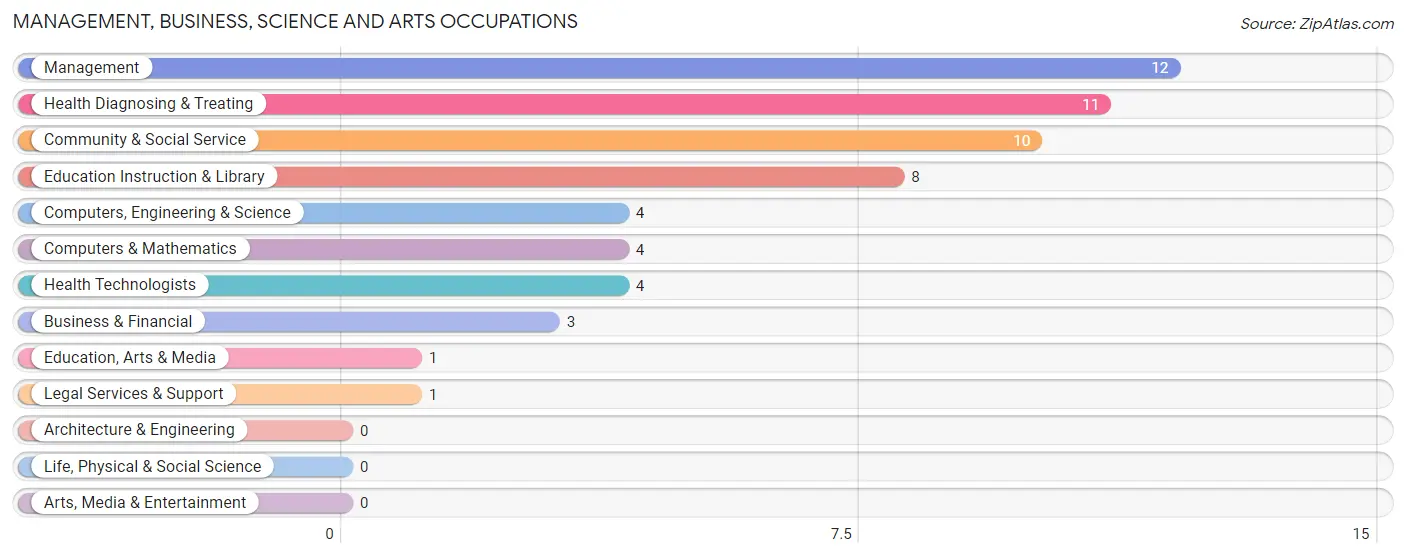
Management, Business, Science and Arts Occupations
The most common Management, Business, Science and Arts occupations in New Paris borough are Management (12 | 9.5%), Health Diagnosing & Treating (11 | 8.7%), Community & Social Service (10 | 7.9%), Education Instruction & Library (8 | 6.4%), and Computers, Engineering & Science (4 | 3.2%).
Management, Business, Science and Arts Occupations by Sex
Within the Management, Business, Science and Arts occupations in New Paris borough, the most male-oriented occupations are Computers, Engineering & Science (75.0%), Computers & Mathematics (75.0%), and Management (66.7%), while the most female-oriented occupations are Business & Financial (100.0%), Education, Arts & Media (100.0%), and Legal Services & Support (100.0%).
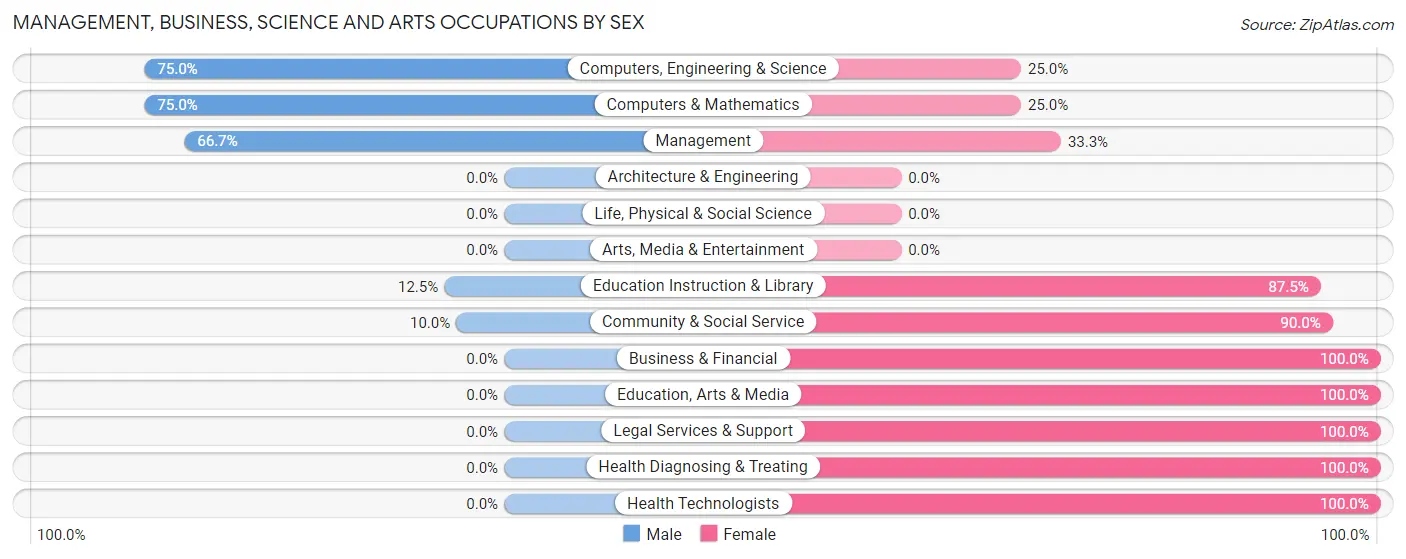
| Occupation | Male | Female |
| Management | 8 (66.7%) | 4 (33.3%) |
| Business & Financial | 0 (0.0%) | 3 (100.0%) |
| Computers, Engineering & Science | 3 (75.0%) | 1 (25.0%) |
| Computers & Mathematics | 3 (75.0%) | 1 (25.0%) |
| Architecture & Engineering | 0 (0.0%) | 0 (0.0%) |
| Life, Physical & Social Science | 0 (0.0%) | 0 (0.0%) |
| Community & Social Service | 1 (10.0%) | 9 (90.0%) |
| Education, Arts & Media | 0 (0.0%) | 1 (100.0%) |
| Legal Services & Support | 0 (0.0%) | 1 (100.0%) |
| Education Instruction & Library | 1 (12.5%) | 7 (87.5%) |
| Arts, Media & Entertainment | 0 (0.0%) | 0 (0.0%) |
| Health Diagnosing & Treating | 0 (0.0%) | 11 (100.0%) |
| Health Technologists | 0 (0.0%) | 4 (100.0%) |
| Total (Category) | 12 (30.0%) | 28 (70.0%) |
| Total (Overall) | 68 (54.0%) | 58 (46.0%) |
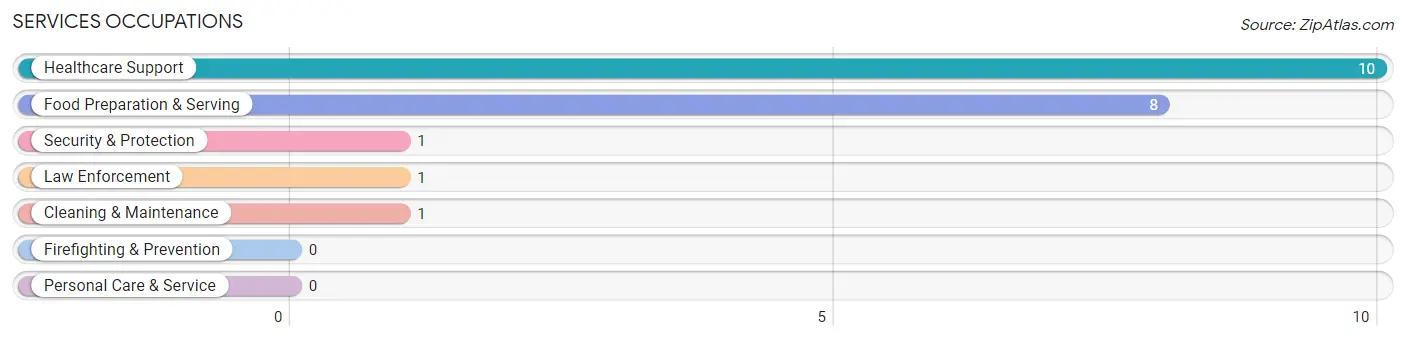
Services Occupations
The most common Services occupations in New Paris borough are Healthcare Support (10 | 7.9%), Food Preparation & Serving (8 | 6.4%), Security & Protection (1 | 0.8%), Law Enforcement (1 | 0.8%), and Cleaning & Maintenance (1 | 0.8%).
Services Occupations by Sex
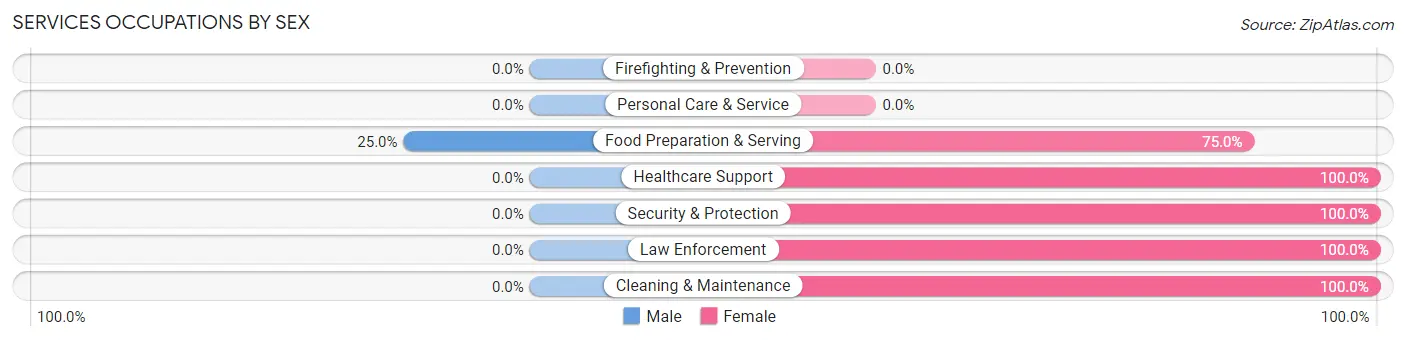
| Occupation | Male | Female |
| Healthcare Support | 0 (0.0%) | 10 (100.0%) |
| Security & Protection | 0 (0.0%) | 1 (100.0%) |
| Firefighting & Prevention | 0 (0.0%) | 0 (0.0%) |
| Law Enforcement | 0 (0.0%) | 1 (100.0%) |
| Food Preparation & Serving | 2 (25.0%) | 6 (75.0%) |
| Cleaning & Maintenance | 0 (0.0%) | 1 (100.0%) |
| Personal Care & Service | 0 (0.0%) | 0 (0.0%) |
| Total (Category) | 2 (10.0%) | 18 (90.0%) |
| Total (Overall) | 68 (54.0%) | 58 (46.0%) |
Sales and Office Occupations
The most common Sales and Office occupations in New Paris borough are Office & Administration (10 | 7.9%), and Sales & Related (3 | 2.4%).

Sales and Office Occupations by Sex

| Occupation | Male | Female |
| Sales & Related | 3 (100.0%) | 0 (0.0%) |
| Office & Administration | 0 (0.0%) | 10 (100.0%) |
| Total (Category) | 3 (23.1%) | 10 (76.9%) |
| Total (Overall) | 68 (54.0%) | 58 (46.0%) |
Natural Resources, Construction and Maintenance Occupations
The most common Natural Resources, Construction and Maintenance occupations in New Paris borough are Construction & Extraction (9 | 7.1%), Farming, Fishing & Forestry (5 | 4.0%), and Installation, Maintenance & Repair (3 | 2.4%).

Natural Resources, Construction and Maintenance Occupations by Sex
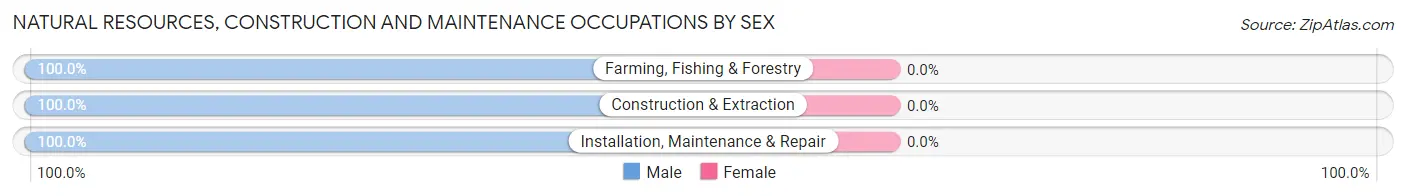
| Occupation | Male | Female |
| Farming, Fishing & Forestry | 5 (100.0%) | 0 (0.0%) |
| Construction & Extraction | 9 (100.0%) | 0 (0.0%) |
| Installation, Maintenance & Repair | 3 (100.0%) | 0 (0.0%) |
| Total (Category) | 17 (100.0%) | 0 (0.0%) |
| Total (Overall) | 68 (54.0%) | 58 (46.0%) |
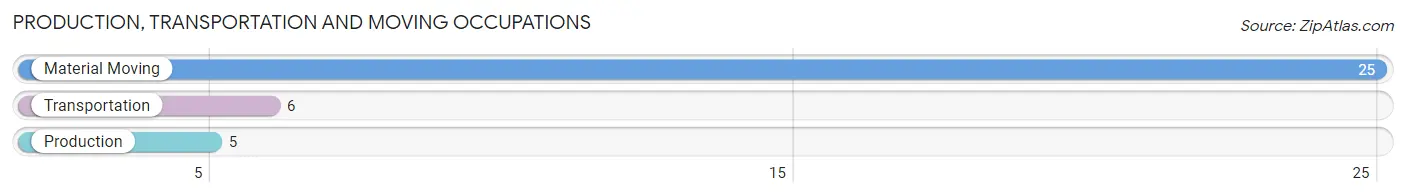
Production, Transportation and Moving Occupations
The most common Production, Transportation and Moving occupations in New Paris borough are Material Moving (25 | 19.8%), Transportation (6 | 4.8%), and Production (5 | 4.0%).
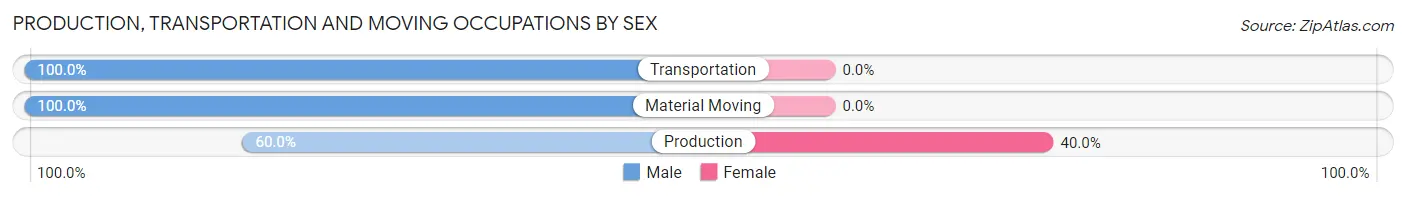
Production, Transportation and Moving Occupations by Sex
| Occupation | Male | Female |
| Production | 3 (60.0%) | 2 (40.0%) |
| Transportation | 6 (100.0%) | 0 (0.0%) |
| Material Moving | 25 (100.0%) | 0 (0.0%) |
| Total (Category) | 34 (94.4%) | 2 (5.6%) |
| Total (Overall) | 68 (54.0%) | 58 (46.0%) |
Employment Industries by Sex in New Paris borough
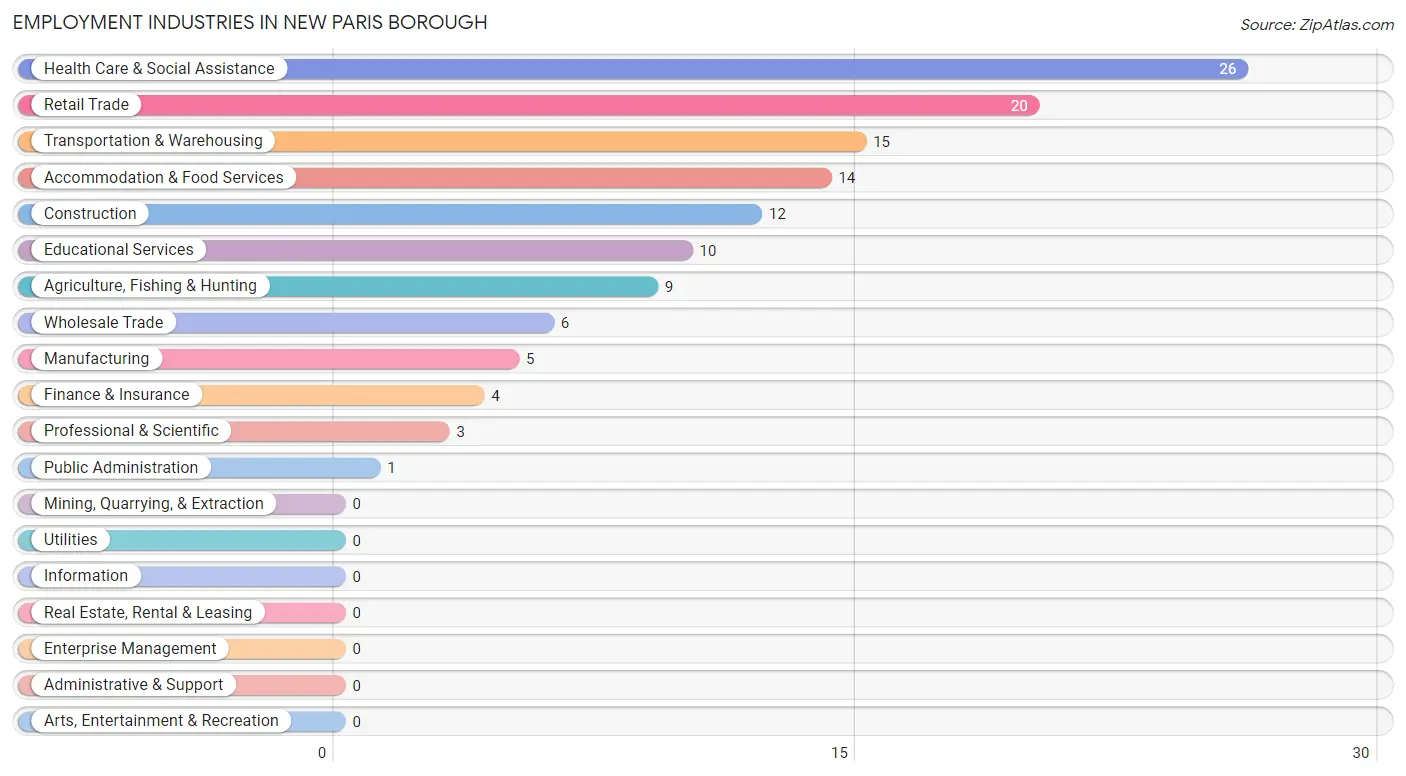
Employment Industries in New Paris borough
The major employment industries in New Paris borough include Health Care & Social Assistance (26 | 20.6%), Retail Trade (20 | 15.9%), Transportation & Warehousing (15 | 11.9%), Accommodation & Food Services (14 | 11.1%), and Construction (12 | 9.5%).
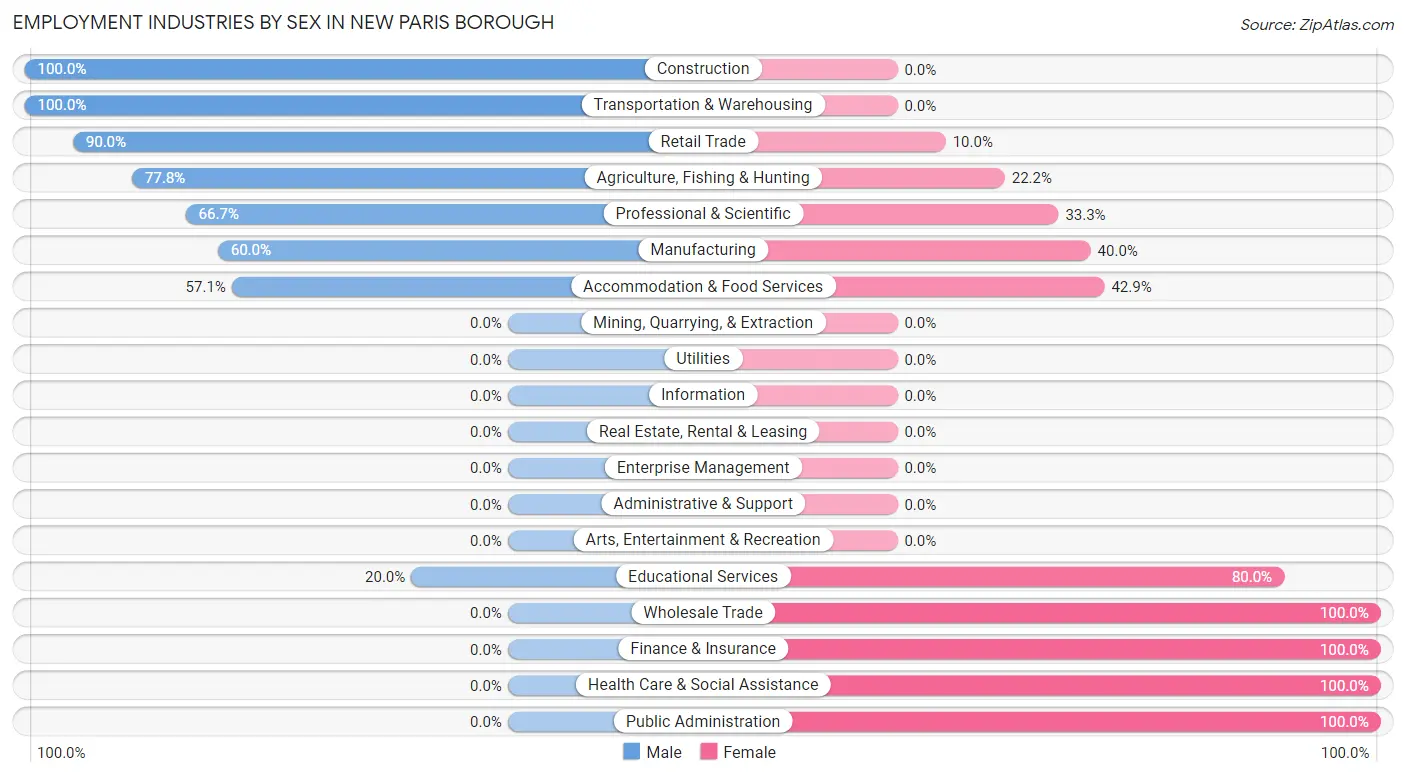
Employment Industries by Sex in New Paris borough
The New Paris borough industries that see more men than women are Construction (100.0%), Transportation & Warehousing (100.0%), and Retail Trade (90.0%), whereas the industries that tend to have a higher number of women are Wholesale Trade (100.0%), Finance & Insurance (100.0%), and Health Care & Social Assistance (100.0%).
| Industry | Male | Female |
| Agriculture, Fishing & Hunting | 7 (77.8%) | 2 (22.2%) |
| Mining, Quarrying, & Extraction | 0 (0.0%) | 0 (0.0%) |
| Construction | 12 (100.0%) | 0 (0.0%) |
| Manufacturing | 3 (60.0%) | 2 (40.0%) |
| Wholesale Trade | 0 (0.0%) | 6 (100.0%) |
| Retail Trade | 18 (90.0%) | 2 (10.0%) |
| Transportation & Warehousing | 15 (100.0%) | 0 (0.0%) |
| Utilities | 0 (0.0%) | 0 (0.0%) |
| Information | 0 (0.0%) | 0 (0.0%) |
| Finance & Insurance | 0 (0.0%) | 4 (100.0%) |
| Real Estate, Rental & Leasing | 0 (0.0%) | 0 (0.0%) |
| Professional & Scientific | 2 (66.7%) | 1 (33.3%) |
| Enterprise Management | 0 (0.0%) | 0 (0.0%) |
| Administrative & Support | 0 (0.0%) | 0 (0.0%) |
| Educational Services | 2 (20.0%) | 8 (80.0%) |
| Health Care & Social Assistance | 0 (0.0%) | 26 (100.0%) |
| Arts, Entertainment & Recreation | 0 (0.0%) | 0 (0.0%) |
| Accommodation & Food Services | 8 (57.1%) | 6 (42.9%) |
| Public Administration | 0 (0.0%) | 1 (100.0%) |
| Total | 68 (54.0%) | 58 (46.0%) |
Education in New Paris borough
School Enrollment in New Paris borough
The most common levels of schooling among the 42 students in New Paris borough are elementary school (16 | 38.1%), middle school (9 | 21.4%), and high school (8 | 19.1%).
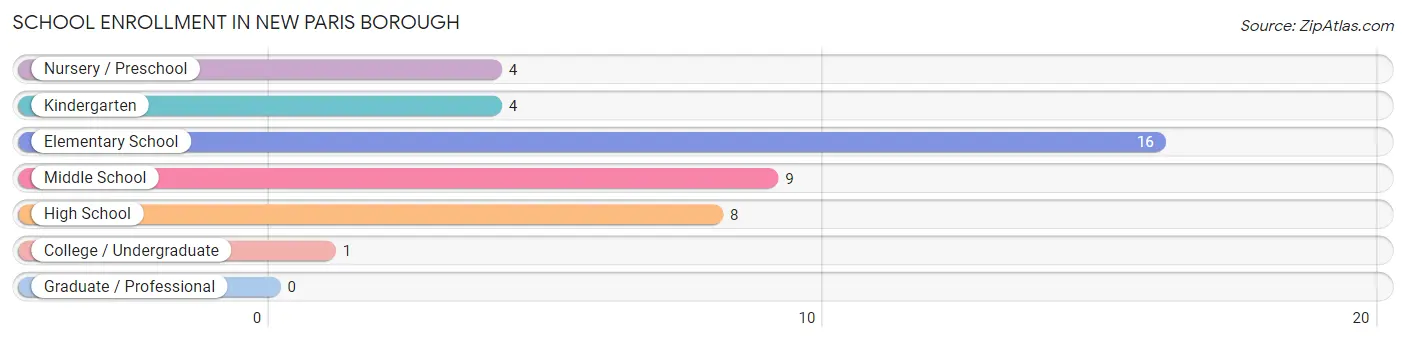
| School Level | # Students | % Students |
| Nursery / Preschool | 4 | 9.5% |
| Kindergarten | 4 | 9.5% |
| Elementary School | 16 | 38.1% |
| Middle School | 9 | 21.4% |
| High School | 8 | 19.1% |
| College / Undergraduate | 1 | 2.4% |
| Graduate / Professional | 0 | 0.0% |
| Total | 42 | 100.0% |
School Enrollment by Age by Funding Source in New Paris borough
Out of a total of 42 students who are enrolled in schools in New Paris borough, 3 (7.1%) attend a private institution, while the remaining 39 (92.9%) are enrolled in public schools. The age group of 5 to 9 year old has the highest likelihood of being enrolled in private schools, with 3 (12.5% in the age bracket) enrolled. Conversely, the age group of 10 to 14 year olds has the lowest likelihood of being enrolled in a private school, with 9 (100.0% in the age bracket) attending a public institution.
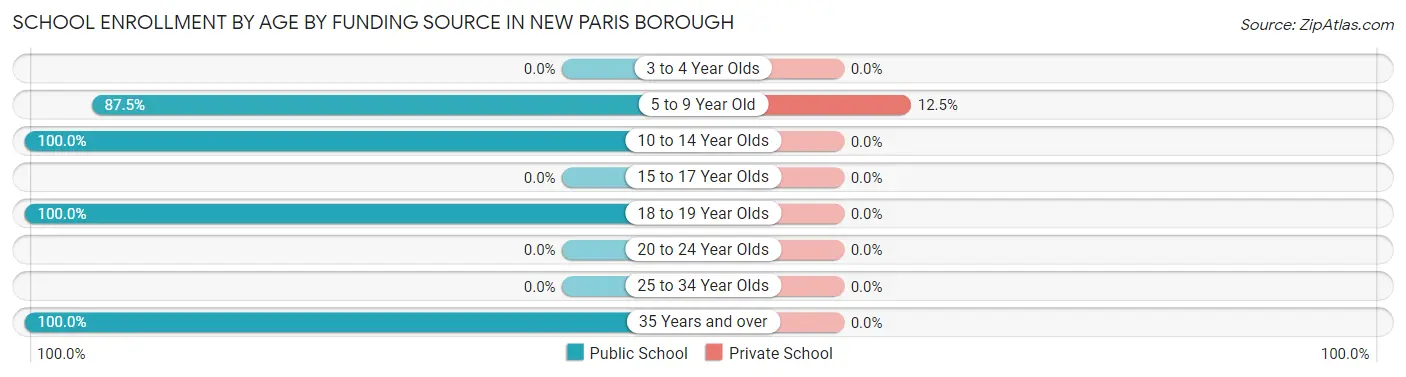
| Age Bracket | Public School | Private School |
| 3 to 4 Year Olds | 0 (0.0%) | 0 (0.0%) |
| 5 to 9 Year Old | 21 (87.5%) | 3 (12.5%) |
| 10 to 14 Year Olds | 9 (100.0%) | 0 (0.0%) |
| 15 to 17 Year Olds | 0 (0.0%) | 0 (0.0%) |
| 18 to 19 Year Olds | 6 (100.0%) | 0 (0.0%) |
| 20 to 24 Year Olds | 0 (0.0%) | 0 (0.0%) |
| 25 to 34 Year Olds | 0 (0.0%) | 0 (0.0%) |
| 35 Years and over | 3 (100.0%) | 0 (0.0%) |
| Total | 39 (92.9%) | 3 (7.1%) |
Educational Attainment by Field of Study in New Paris borough
Education (6 | 25.0%), business (5 | 20.8%), bio, nature & agricultural (4 | 16.7%), computers & mathematics (2 | 8.3%), and physical & health sciences (2 | 8.3%) are the most common fields of study among 24 individuals in New Paris borough who have obtained a bachelor's degree or higher.
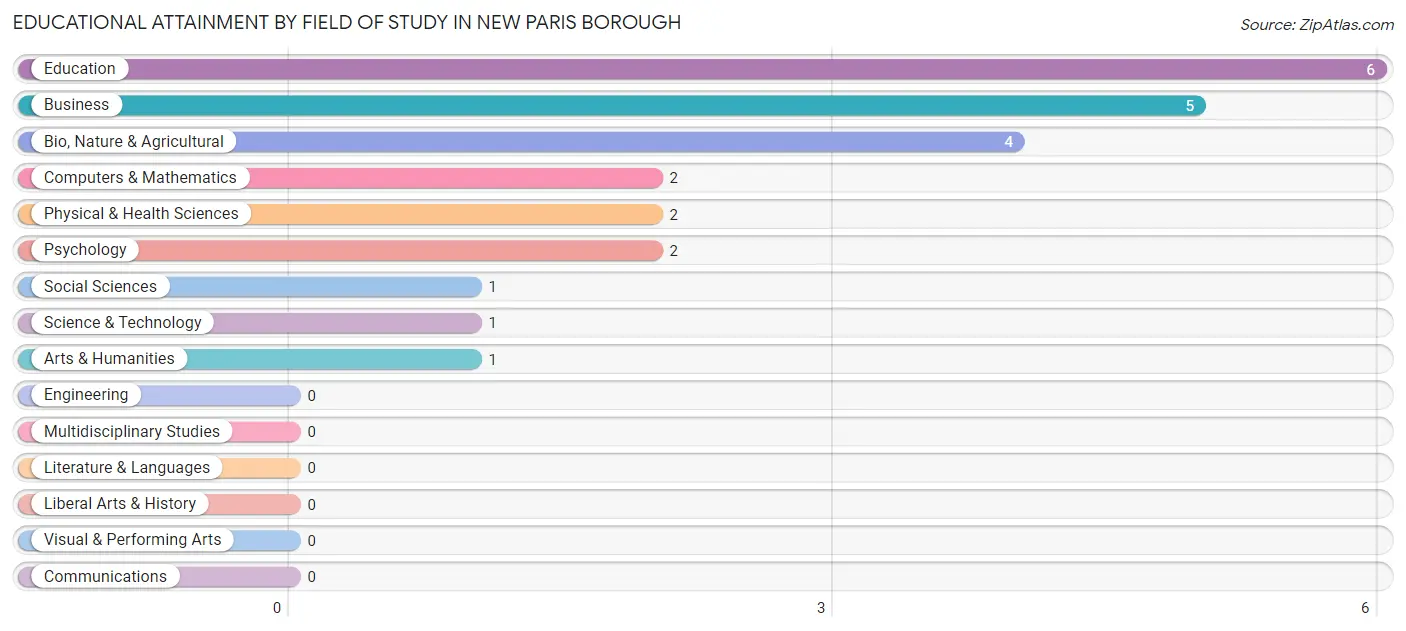
| Field of Study | # Graduates | % Graduates |
| Computers & Mathematics | 2 | 8.3% |
| Bio, Nature & Agricultural | 4 | 16.7% |
| Physical & Health Sciences | 2 | 8.3% |
| Psychology | 2 | 8.3% |
| Social Sciences | 1 | 4.2% |
| Engineering | 0 | 0.0% |
| Multidisciplinary Studies | 0 | 0.0% |
| Science & Technology | 1 | 4.2% |
| Business | 5 | 20.8% |
| Education | 6 | 25.0% |
| Literature & Languages | 0 | 0.0% |
| Liberal Arts & History | 0 | 0.0% |
| Visual & Performing Arts | 0 | 0.0% |
| Communications | 0 | 0.0% |
| Arts & Humanities | 1 | 4.2% |
| Total | 24 | 100.0% |
Transportation & Commute in New Paris borough
Vehicle Availability by Sex in New Paris borough
The most prevalent vehicle ownership categories in New Paris borough are males with 2 vehicles (47, accounting for 69.1%) and females with 2 vehicles (37, making up 81.0%).
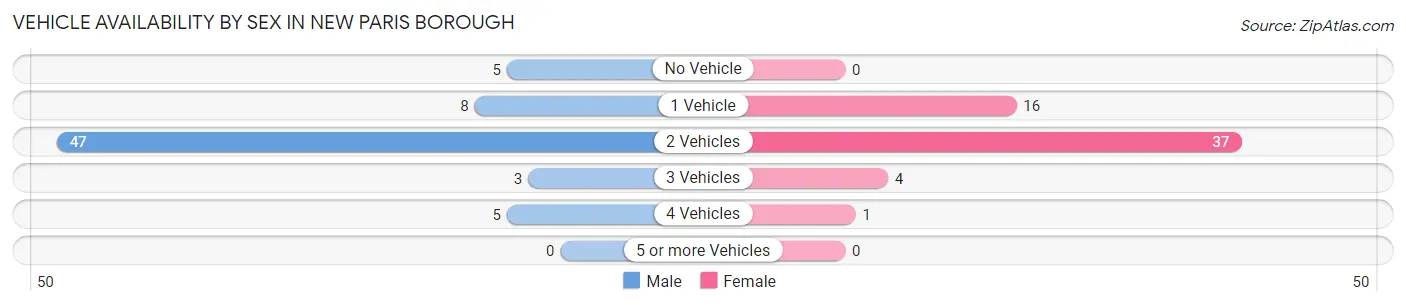
| Vehicles Available | Male | Female |
| No Vehicle | 5 (7.3%) | 0 (0.0%) |
| 1 Vehicle | 8 (11.8%) | 16 (27.6%) |
| 2 Vehicles | 47 (69.1%) | 37 (63.8%) |
| 3 Vehicles | 3 (4.4%) | 4 (6.9%) |
| 4 Vehicles | 5 (7.3%) | 1 (1.7%) |
| 5 or more Vehicles | 0 (0.0%) | 0 (0.0%) |
| Total | 68 (100.0%) | 58 (100.0%) |
Commute Time in New Paris borough
The most frequently occuring commute durations in New Paris borough are 20 to 24 minutes (33 commuters, 28.2%), 15 to 19 minutes (26 commuters, 22.2%), and 5 to 9 minutes (13 commuters, 11.1%).
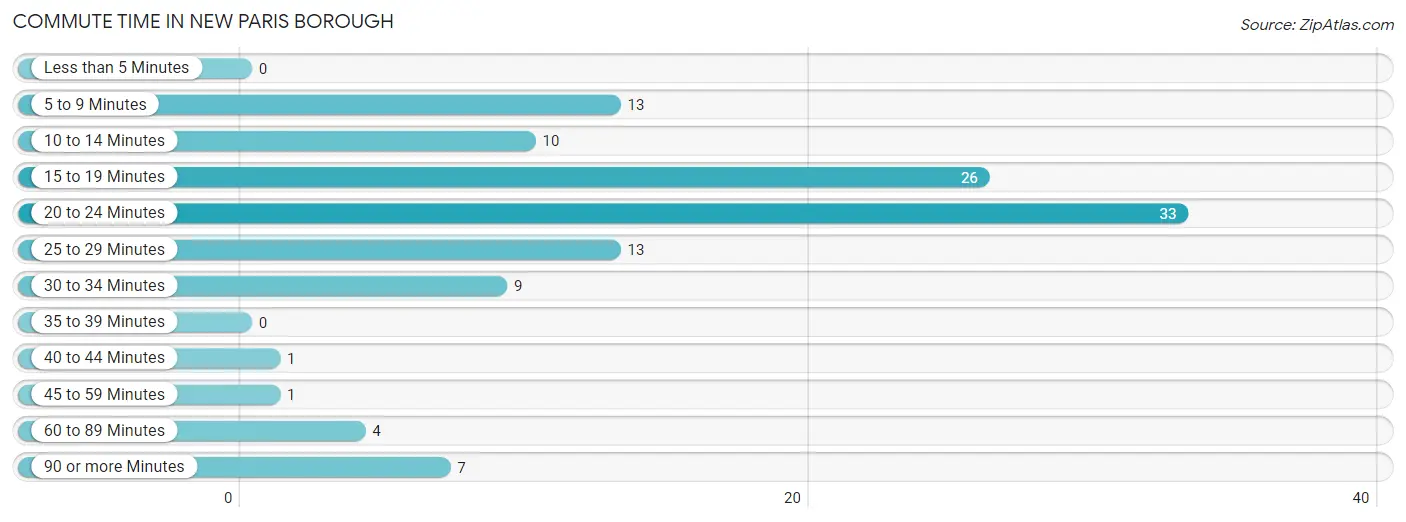
| Commute Time | # Commuters | % Commuters |
| Less than 5 Minutes | 0 | 0.0% |
| 5 to 9 Minutes | 13 | 11.1% |
| 10 to 14 Minutes | 10 | 8.6% |
| 15 to 19 Minutes | 26 | 22.2% |
| 20 to 24 Minutes | 33 | 28.2% |
| 25 to 29 Minutes | 13 | 11.1% |
| 30 to 34 Minutes | 9 | 7.7% |
| 35 to 39 Minutes | 0 | 0.0% |
| 40 to 44 Minutes | 1 | 0.9% |
| 45 to 59 Minutes | 1 | 0.9% |
| 60 to 89 Minutes | 4 | 3.4% |
| 90 or more Minutes | 7 | 6.0% |
Commute Time by Sex in New Paris borough
The most common commute times in New Paris borough are 15 to 19 minutes (18 commuters, 28.1%) for males and 20 to 24 minutes (24 commuters, 45.3%) for females.
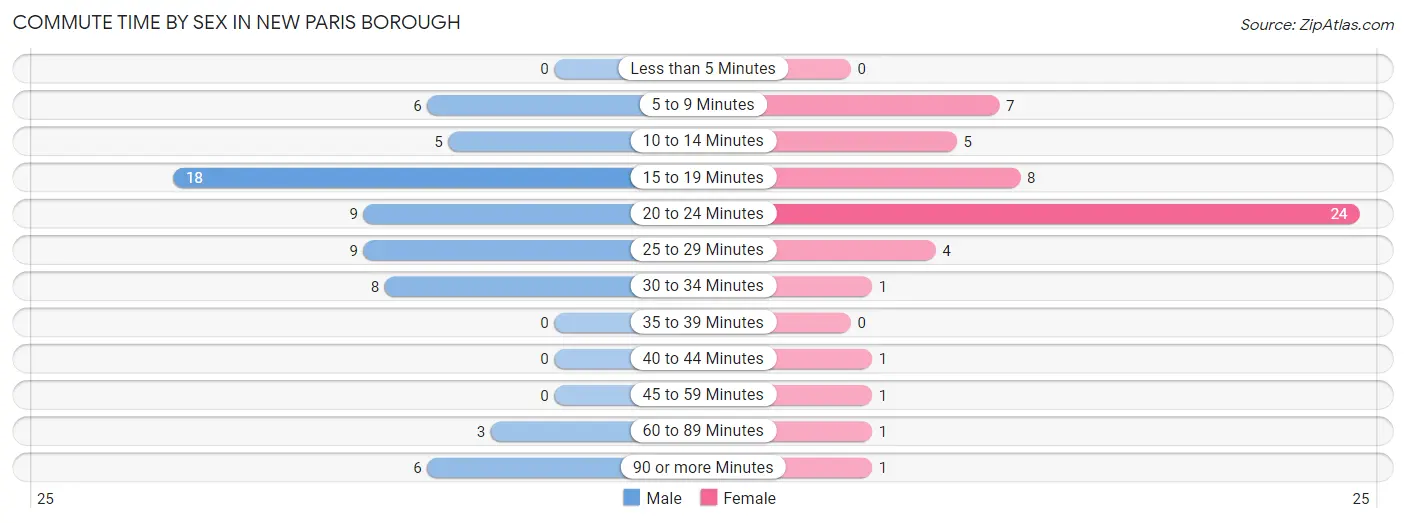
| Commute Time | Male | Female |
| Less than 5 Minutes | 0 (0.0%) | 0 (0.0%) |
| 5 to 9 Minutes | 6 (9.4%) | 7 (13.2%) |
| 10 to 14 Minutes | 5 (7.8%) | 5 (9.4%) |
| 15 to 19 Minutes | 18 (28.1%) | 8 (15.1%) |
| 20 to 24 Minutes | 9 (14.1%) | 24 (45.3%) |
| 25 to 29 Minutes | 9 (14.1%) | 4 (7.5%) |
| 30 to 34 Minutes | 8 (12.5%) | 1 (1.9%) |
| 35 to 39 Minutes | 0 (0.0%) | 0 (0.0%) |
| 40 to 44 Minutes | 0 (0.0%) | 1 (1.9%) |
| 45 to 59 Minutes | 0 (0.0%) | 1 (1.9%) |
| 60 to 89 Minutes | 3 (4.7%) | 1 (1.9%) |
| 90 or more Minutes | 6 (9.4%) | 1 (1.9%) |
Time of Departure to Work by Sex in New Paris borough
The most frequent times of departure to work in New Paris borough are 8:00 AM to 8:29 AM (15, 23.4%) for males and 7:00 AM to 7:29 AM (12, 22.6%) for females.
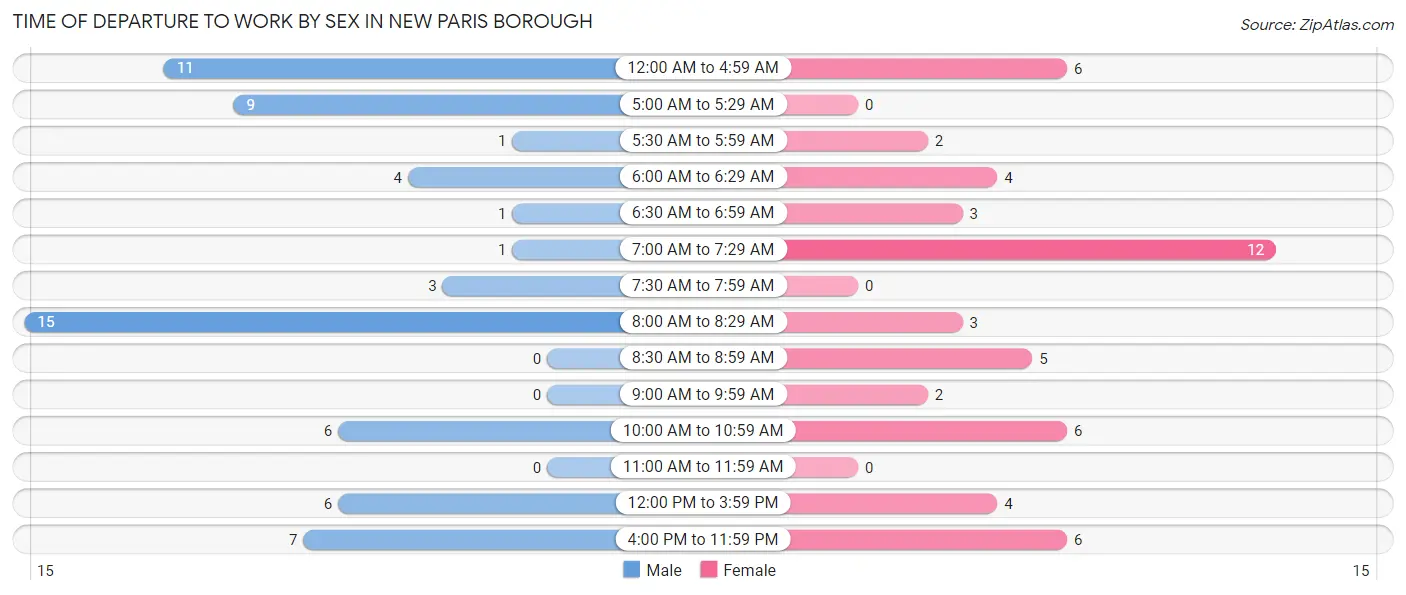
| Time of Departure | Male | Female |
| 12:00 AM to 4:59 AM | 11 (17.2%) | 6 (11.3%) |
| 5:00 AM to 5:29 AM | 9 (14.1%) | 0 (0.0%) |
| 5:30 AM to 5:59 AM | 1 (1.6%) | 2 (3.8%) |
| 6:00 AM to 6:29 AM | 4 (6.2%) | 4 (7.5%) |
| 6:30 AM to 6:59 AM | 1 (1.6%) | 3 (5.7%) |
| 7:00 AM to 7:29 AM | 1 (1.6%) | 12 (22.6%) |
| 7:30 AM to 7:59 AM | 3 (4.7%) | 0 (0.0%) |
| 8:00 AM to 8:29 AM | 15 (23.4%) | 3 (5.7%) |
| 8:30 AM to 8:59 AM | 0 (0.0%) | 5 (9.4%) |
| 9:00 AM to 9:59 AM | 0 (0.0%) | 2 (3.8%) |
| 10:00 AM to 10:59 AM | 6 (9.4%) | 6 (11.3%) |
| 11:00 AM to 11:59 AM | 0 (0.0%) | 0 (0.0%) |
| 12:00 PM to 3:59 PM | 6 (9.4%) | 4 (7.5%) |
| 4:00 PM to 11:59 PM | 7 (10.9%) | 6 (11.3%) |
| Total | 64 (100.0%) | 53 (100.0%) |
Housing Occupancy in New Paris borough
Occupancy by Ownership in New Paris borough
Of the total 93 dwellings in New Paris borough, owner-occupied units account for 63 (67.7%), while renter-occupied units make up 30 (32.3%).
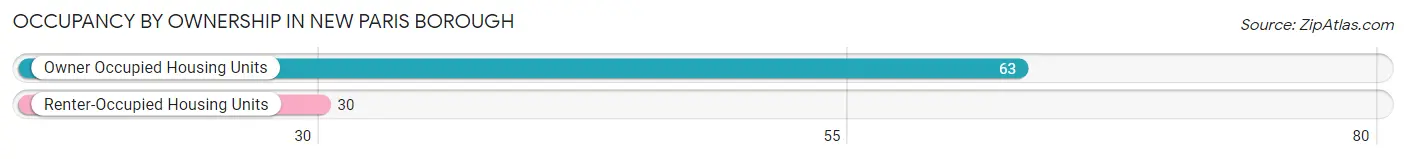
| Occupancy | # Housing Units | % Housing Units |
| Owner Occupied Housing Units | 63 | 67.7% |
| Renter-Occupied Housing Units | 30 | 32.3% |
| Total Occupied Housing Units | 93 | 100.0% |
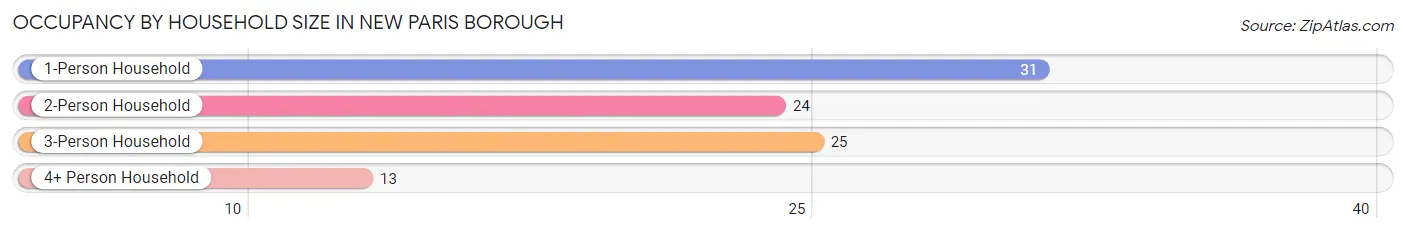
Occupancy by Household Size in New Paris borough
| Household Size | # Housing Units | % Housing Units |
| 1-Person Household | 31 | 33.3% |
| 2-Person Household | 24 | 25.8% |
| 3-Person Household | 25 | 26.9% |
| 4+ Person Household | 13 | 14.0% |
| Total Housing Units | 93 | 100.0% |
Occupancy by Ownership by Household Size in New Paris borough
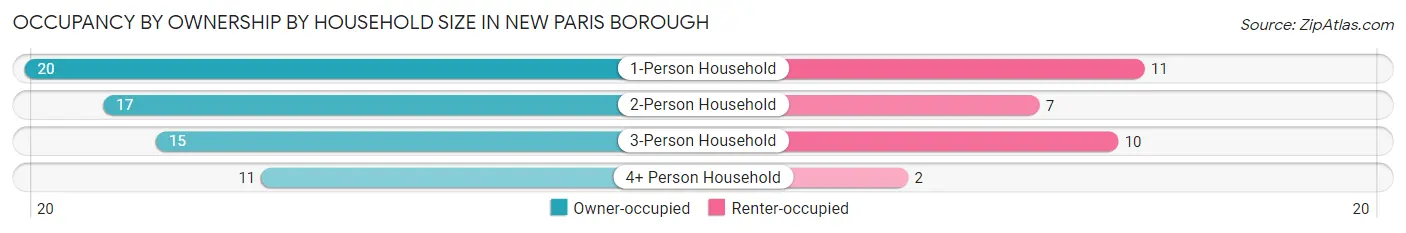
| Household Size | Owner-occupied | Renter-occupied |
| 1-Person Household | 20 (64.5%) | 11 (35.5%) |
| 2-Person Household | 17 (70.8%) | 7 (29.2%) |
| 3-Person Household | 15 (60.0%) | 10 (40.0%) |
| 4+ Person Household | 11 (84.6%) | 2 (15.4%) |
| Total Housing Units | 63 (67.7%) | 30 (32.3%) |
Occupancy by Educational Attainment in New Paris borough
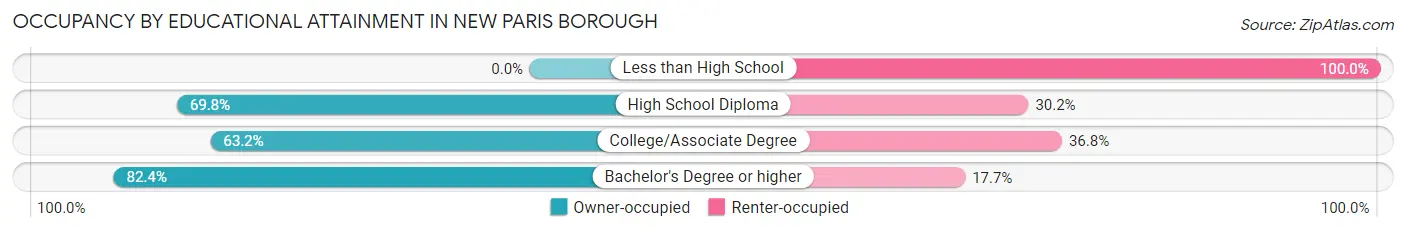
| Household Size | Owner-occupied | Renter-occupied |
| Less than High School | 0 (0.0%) | 4 (100.0%) |
| High School Diploma | 37 (69.8%) | 16 (30.2%) |
| College/Associate Degree | 12 (63.2%) | 7 (36.8%) |
| Bachelor's Degree or higher | 14 (82.4%) | 3 (17.6%) |
Occupancy by Age of Householder in New Paris borough
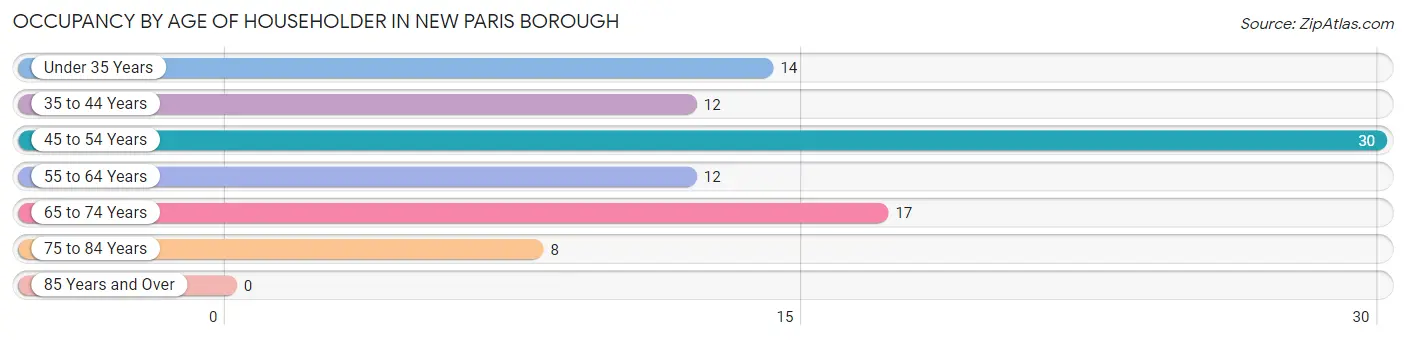
| Age Bracket | # Households | % Households |
| Under 35 Years | 14 | 15.0% |
| 35 to 44 Years | 12 | 12.9% |
| 45 to 54 Years | 30 | 32.3% |
| 55 to 64 Years | 12 | 12.9% |
| 65 to 74 Years | 17 | 18.3% |
| 75 to 84 Years | 8 | 8.6% |
| 85 Years and Over | 0 | 0.0% |
| Total | 93 | 100.0% |
Housing Finances in New Paris borough
Median Income by Occupancy in New Paris borough
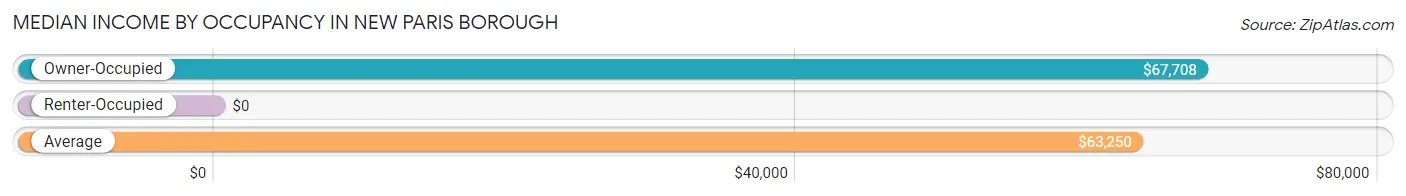
| Occupancy Type | # Households | Median Income |
| Owner-Occupied | 63 (67.7%) | $67,708 |
| Renter-Occupied | 30 (32.3%) | $0 |
| Average | 93 (100.0%) | $63,250 |
Occupancy by Householder Income Bracket in New Paris borough
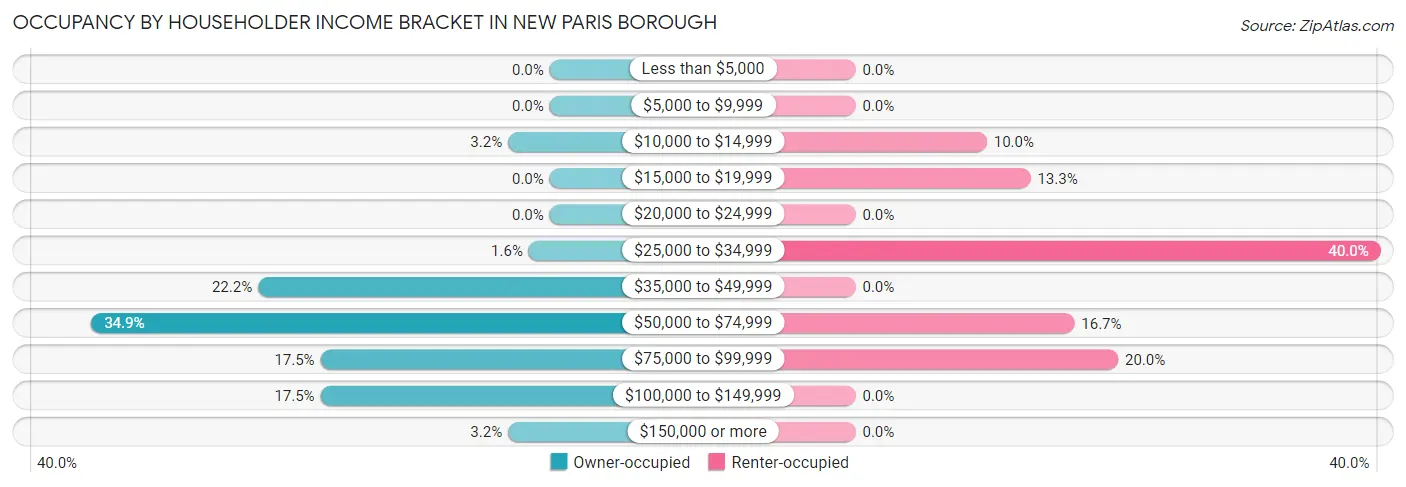
| Income Bracket | Owner-occupied | Renter-occupied |
| Less than $5,000 | 0 (0.0%) | 0 (0.0%) |
| $5,000 to $9,999 | 0 (0.0%) | 0 (0.0%) |
| $10,000 to $14,999 | 2 (3.2%) | 3 (10.0%) |
| $15,000 to $19,999 | 0 (0.0%) | 4 (13.3%) |
| $20,000 to $24,999 | 0 (0.0%) | 0 (0.0%) |
| $25,000 to $34,999 | 1 (1.6%) | 12 (40.0%) |
| $35,000 to $49,999 | 14 (22.2%) | 0 (0.0%) |
| $50,000 to $74,999 | 22 (34.9%) | 5 (16.7%) |
| $75,000 to $99,999 | 11 (17.5%) | 6 (20.0%) |
| $100,000 to $149,999 | 11 (17.5%) | 0 (0.0%) |
| $150,000 or more | 2 (3.2%) | 0 (0.0%) |
| Total | 63 (100.0%) | 30 (100.0%) |
Monthly Housing Cost Tiers in New Paris borough
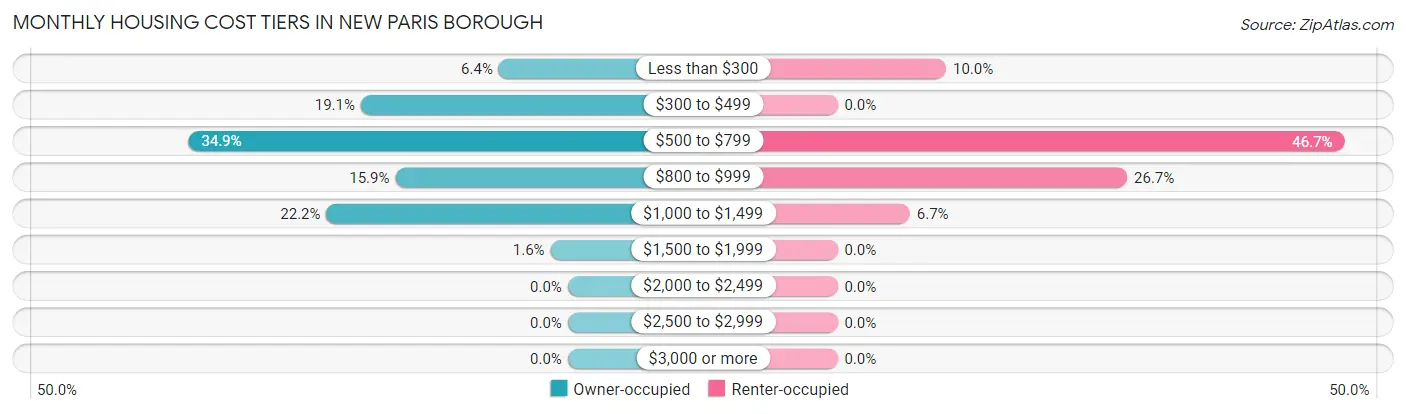
| Monthly Cost | Owner-occupied | Renter-occupied |
| Less than $300 | 4 (6.4%) | 3 (10.0%) |
| $300 to $499 | 12 (19.1%) | 0 (0.0%) |
| $500 to $799 | 22 (34.9%) | 14 (46.7%) |
| $800 to $999 | 10 (15.9%) | 8 (26.7%) |
| $1,000 to $1,499 | 14 (22.2%) | 2 (6.7%) |
| $1,500 to $1,999 | 1 (1.6%) | 0 (0.0%) |
| $2,000 to $2,499 | 0 (0.0%) | 0 (0.0%) |
| $2,500 to $2,999 | 0 (0.0%) | 0 (0.0%) |
| $3,000 or more | 0 (0.0%) | 0 (0.0%) |
| Total | 63 (100.0%) | 30 (100.0%) |
Physical Housing Characteristics in New Paris borough
Housing Structures in New Paris borough
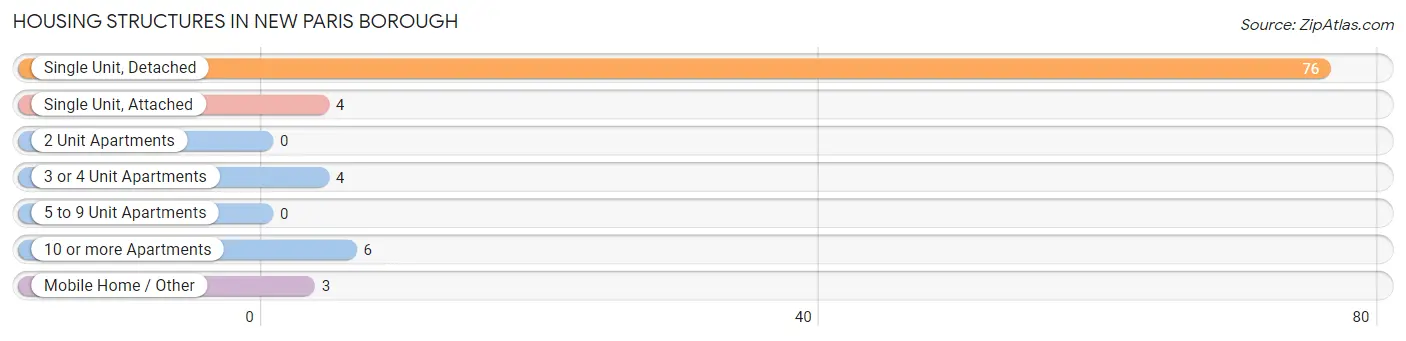
| Structure Type | # Housing Units | % Housing Units |
| Single Unit, Detached | 76 | 81.7% |
| Single Unit, Attached | 4 | 4.3% |
| 2 Unit Apartments | 0 | 0.0% |
| 3 or 4 Unit Apartments | 4 | 4.3% |
| 5 to 9 Unit Apartments | 0 | 0.0% |
| 10 or more Apartments | 6 | 6.5% |
| Mobile Home / Other | 3 | 3.2% |
| Total | 93 | 100.0% |
Housing Structures by Occupancy in New Paris borough
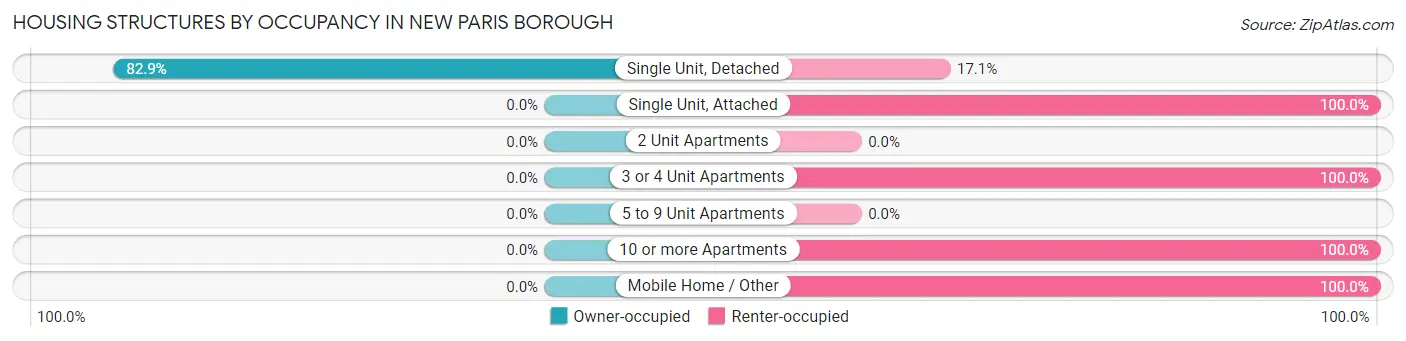
| Structure Type | Owner-occupied | Renter-occupied |
| Single Unit, Detached | 63 (82.9%) | 13 (17.1%) |
| Single Unit, Attached | 0 (0.0%) | 4 (100.0%) |
| 2 Unit Apartments | 0 (0.0%) | 0 (0.0%) |
| 3 or 4 Unit Apartments | 0 (0.0%) | 4 (100.0%) |
| 5 to 9 Unit Apartments | 0 (0.0%) | 0 (0.0%) |
| 10 or more Apartments | 0 (0.0%) | 6 (100.0%) |
| Mobile Home / Other | 0 (0.0%) | 3 (100.0%) |
| Total | 63 (67.7%) | 30 (32.3%) |
Housing Structures by Number of Rooms in New Paris borough
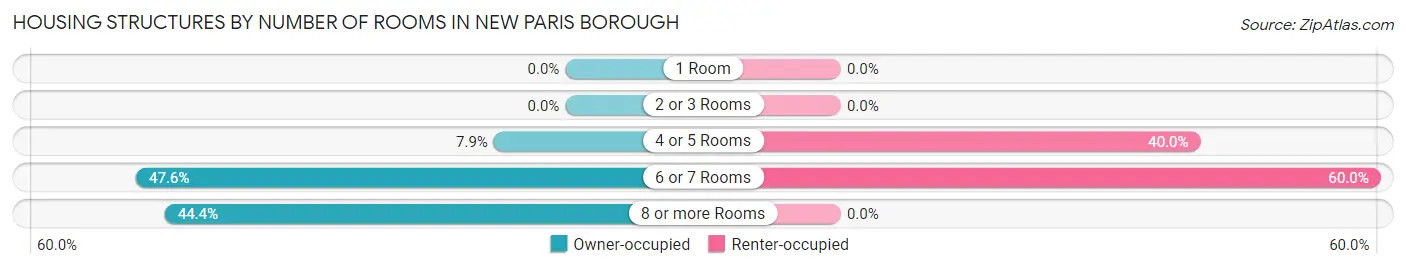
| Number of Rooms | Owner-occupied | Renter-occupied |
| 1 Room | 0 (0.0%) | 0 (0.0%) |
| 2 or 3 Rooms | 0 (0.0%) | 0 (0.0%) |
| 4 or 5 Rooms | 5 (7.9%) | 12 (40.0%) |
| 6 or 7 Rooms | 30 (47.6%) | 18 (60.0%) |
| 8 or more Rooms | 28 (44.4%) | 0 (0.0%) |
| Total | 63 (100.0%) | 30 (100.0%) |
Housing Structure by Heating Type in New Paris borough
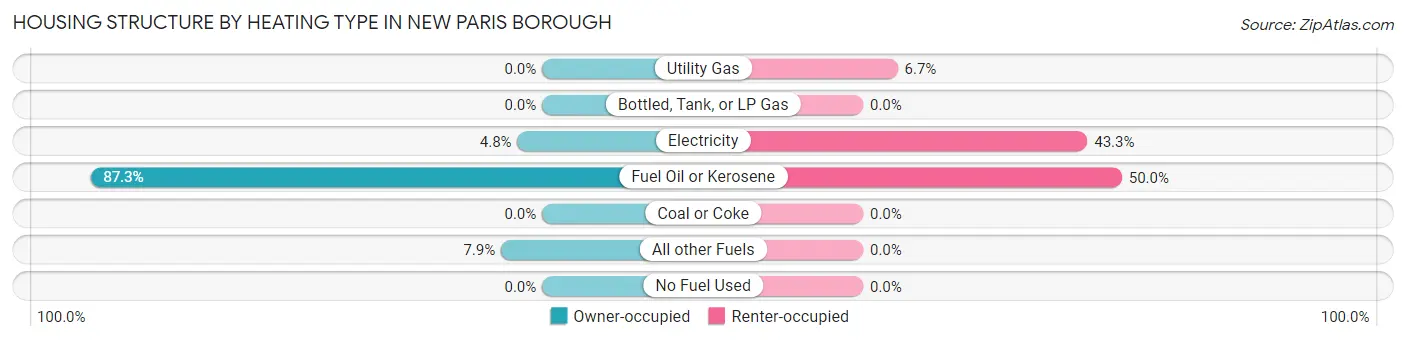
| Heating Type | Owner-occupied | Renter-occupied |
| Utility Gas | 0 (0.0%) | 2 (6.7%) |
| Bottled, Tank, or LP Gas | 0 (0.0%) | 0 (0.0%) |
| Electricity | 3 (4.8%) | 13 (43.3%) |
| Fuel Oil or Kerosene | 55 (87.3%) | 15 (50.0%) |
| Coal or Coke | 0 (0.0%) | 0 (0.0%) |
| All other Fuels | 5 (7.9%) | 0 (0.0%) |
| No Fuel Used | 0 (0.0%) | 0 (0.0%) |
| Total | 63 (100.0%) | 30 (100.0%) |
Household Vehicle Usage in New Paris borough
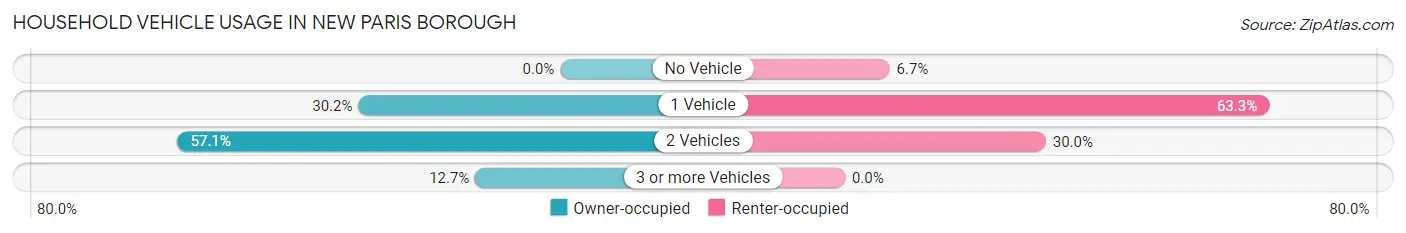
| Vehicles per Household | Owner-occupied | Renter-occupied |
| No Vehicle | 0 (0.0%) | 2 (6.7%) |
| 1 Vehicle | 19 (30.2%) | 19 (63.3%) |
| 2 Vehicles | 36 (57.1%) | 9 (30.0%) |
| 3 or more Vehicles | 8 (12.7%) | 0 (0.0%) |
| Total | 63 (100.0%) | 30 (100.0%) |
Real Estate & Mortgages in New Paris borough
Real Estate and Mortgage Overview in New Paris borough
| Characteristic | Without Mortgage | With Mortgage |
| Housing Units | 31 | 32 |
| Median Property Value | $89,000 | $108,300 |
| Median Household Income | $49,063 | $2 |
| Monthly Housing Costs | $508 | $0 |
| Real Estate Taxes | $1,292 | $0 |
Property Value by Mortgage Status in New Paris borough
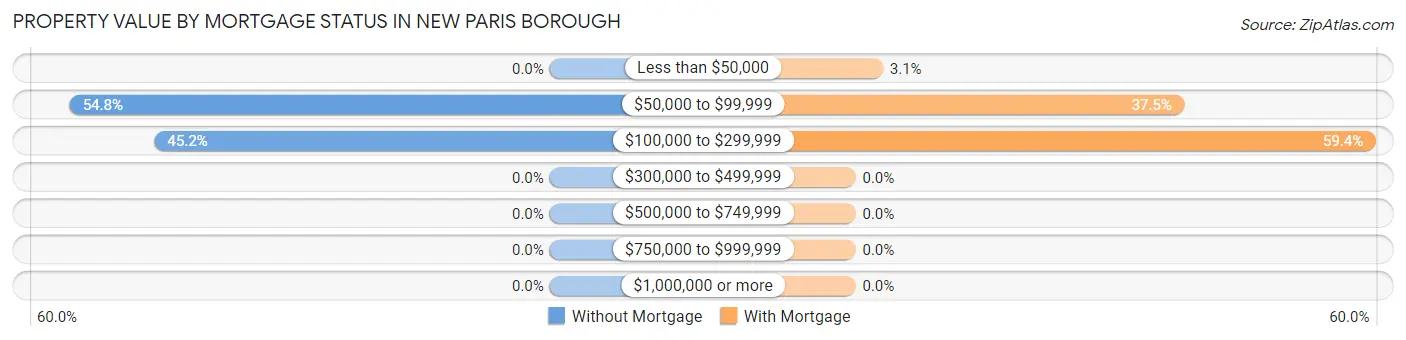
| Property Value | Without Mortgage | With Mortgage |
| Less than $50,000 | 0 (0.0%) | 1 (3.1%) |
| $50,000 to $99,999 | 17 (54.8%) | 12 (37.5%) |
| $100,000 to $299,999 | 14 (45.2%) | 19 (59.4%) |
| $300,000 to $499,999 | 0 (0.0%) | 0 (0.0%) |
| $500,000 to $749,999 | 0 (0.0%) | 0 (0.0%) |
| $750,000 to $999,999 | 0 (0.0%) | 0 (0.0%) |
| $1,000,000 or more | 0 (0.0%) | 0 (0.0%) |
| Total | 31 (100.0%) | 32 (100.0%) |
Household Income by Mortgage Status in New Paris borough
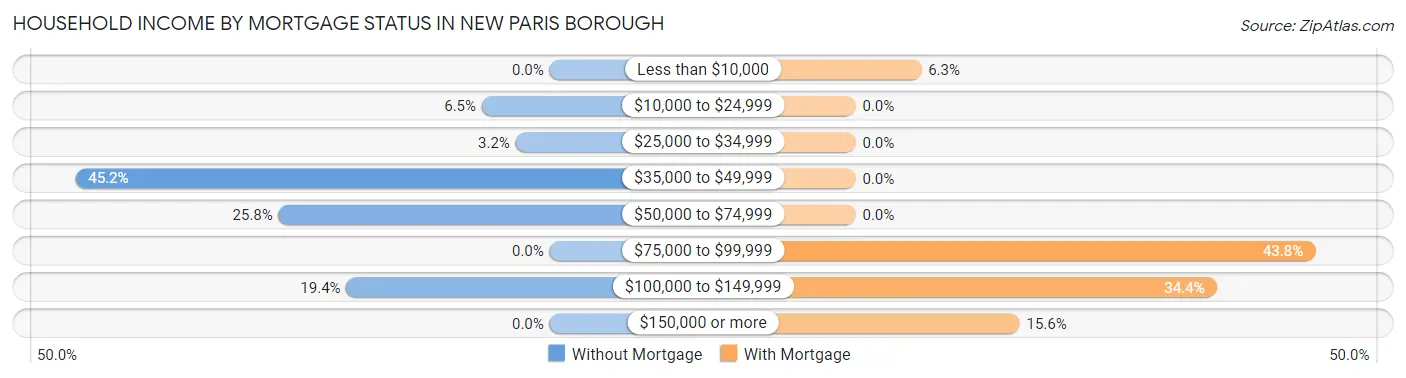
| Household Income | Without Mortgage | With Mortgage |
| Less than $10,000 | 0 (0.0%) | 2 (6.2%) |
| $10,000 to $24,999 | 2 (6.5%) | 0 (0.0%) |
| $25,000 to $34,999 | 1 (3.2%) | 0 (0.0%) |
| $35,000 to $49,999 | 14 (45.2%) | 0 (0.0%) |
| $50,000 to $74,999 | 8 (25.8%) | 0 (0.0%) |
| $75,000 to $99,999 | 0 (0.0%) | 14 (43.8%) |
| $100,000 to $149,999 | 6 (19.4%) | 11 (34.4%) |
| $150,000 or more | 0 (0.0%) | 5 (15.6%) |
| Total | 31 (100.0%) | 32 (100.0%) |
Property Value to Household Income Ratio in New Paris borough
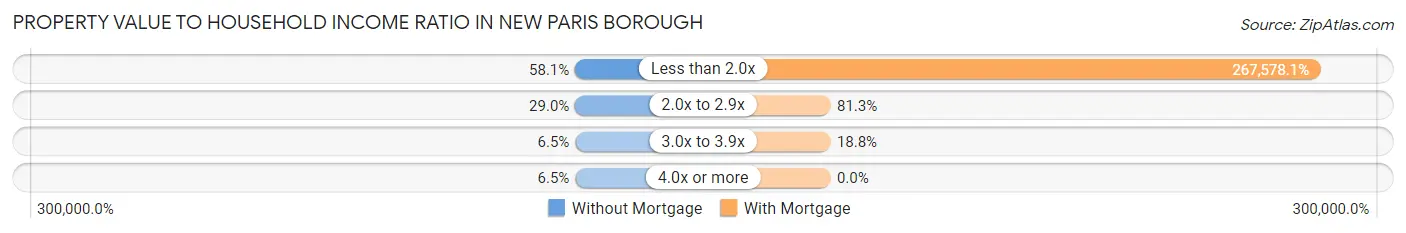
| Value-to-Income Ratio | Without Mortgage | With Mortgage |
| Less than 2.0x | 18 (58.1%) | 85,625 (267,578.1%) |
| 2.0x to 2.9x | 9 (29.0%) | 26 (81.2%) |
| 3.0x to 3.9x | 2 (6.5%) | 6 (18.8%) |
| 4.0x or more | 2 (6.5%) | 0 (0.0%) |
| Total | 31 (100.0%) | 32 (100.0%) |
Real Estate Taxes by Mortgage Status in New Paris borough
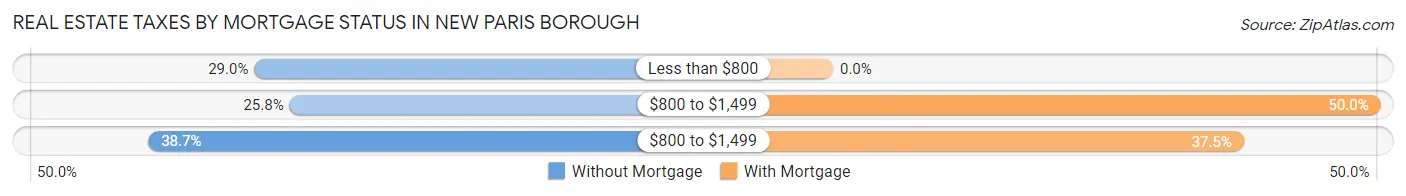
| Property Taxes | Without Mortgage | With Mortgage |
| Less than $800 | 9 (29.0%) | 0 (0.0%) |
| $800 to $1,499 | 8 (25.8%) | 16 (50.0%) |
| $800 to $1,499 | 12 (38.7%) | 12 (37.5%) |
| Total | 31 (100.0%) | 32 (100.0%) |
Health & Disability in New Paris borough
Health Insurance Coverage by Age in New Paris borough
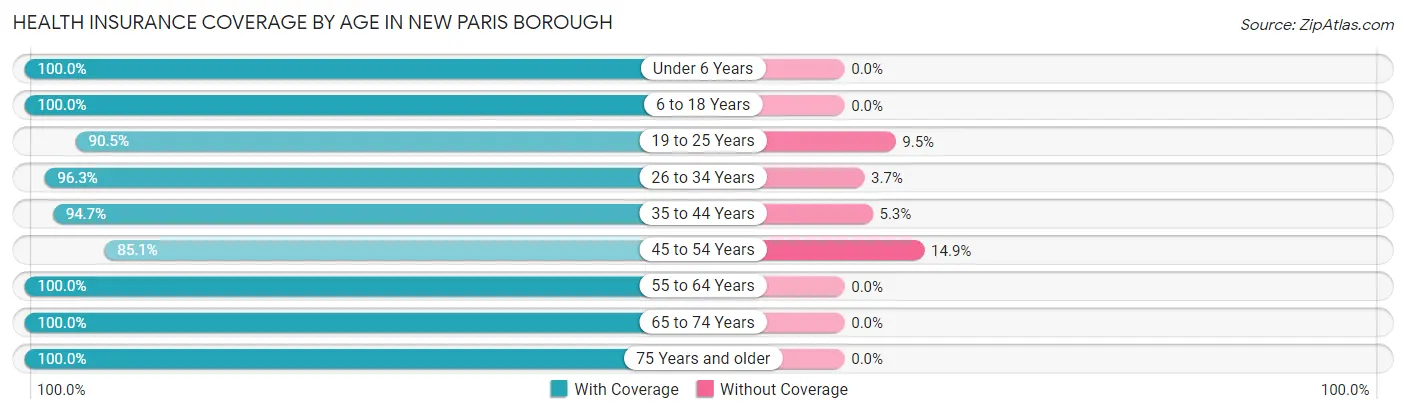
| Age Bracket | With Coverage | Without Coverage |
| Under 6 Years | 13 (100.0%) | 0 (0.0%) |
| 6 to 18 Years | 35 (100.0%) | 0 (0.0%) |
| 19 to 25 Years | 19 (90.5%) | 2 (9.5%) |
| 26 to 34 Years | 26 (96.3%) | 1 (3.7%) |
| 35 to 44 Years | 18 (94.7%) | 1 (5.3%) |
| 45 to 54 Years | 40 (85.1%) | 7 (14.9%) |
| 55 to 64 Years | 16 (100.0%) | 0 (0.0%) |
| 65 to 74 Years | 24 (100.0%) | 0 (0.0%) |
| 75 Years and older | 15 (100.0%) | 0 (0.0%) |
| Total | 206 (94.9%) | 11 (5.1%) |
Health Insurance Coverage by Citizenship Status in New Paris borough
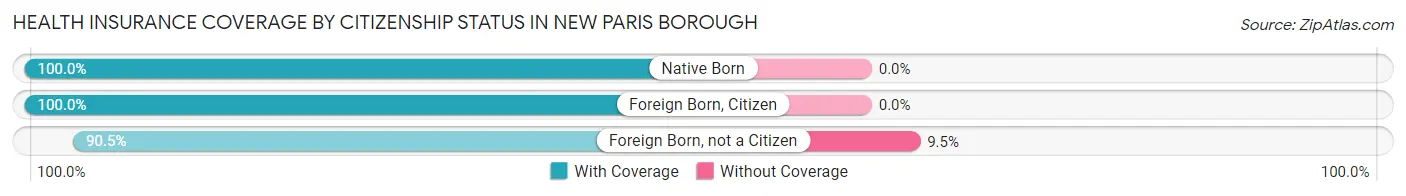
| Citizenship Status | With Coverage | Without Coverage |
| Native Born | 13 (100.0%) | 0 (0.0%) |
| Foreign Born, Citizen | 35 (100.0%) | 0 (0.0%) |
| Foreign Born, not a Citizen | 19 (90.5%) | 2 (9.5%) |
Health Insurance Coverage by Household Income in New Paris borough
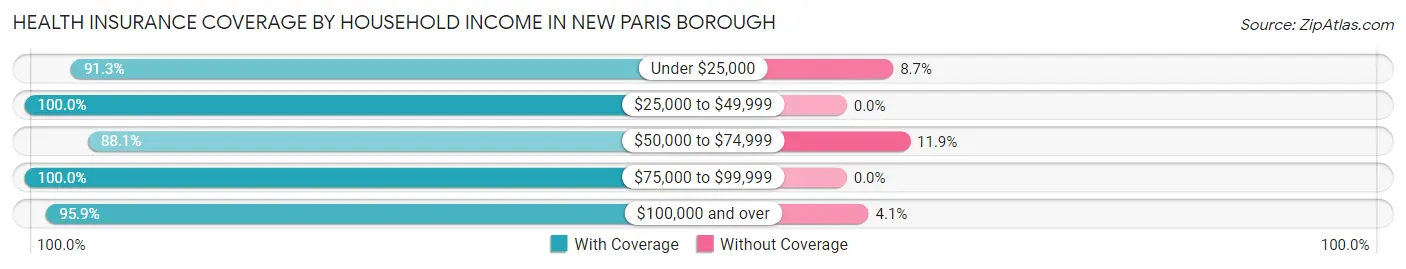
| Household Income | With Coverage | Without Coverage |
| Under $25,000 | 21 (91.3%) | 2 (8.7%) |
| $25,000 to $49,999 | 36 (100.0%) | 0 (0.0%) |
| $50,000 to $74,999 | 52 (88.1%) | 7 (11.9%) |
| $75,000 to $99,999 | 50 (100.0%) | 0 (0.0%) |
| $100,000 and over | 47 (95.9%) | 2 (4.1%) |
Public vs Private Health Insurance Coverage by Age in New Paris borough
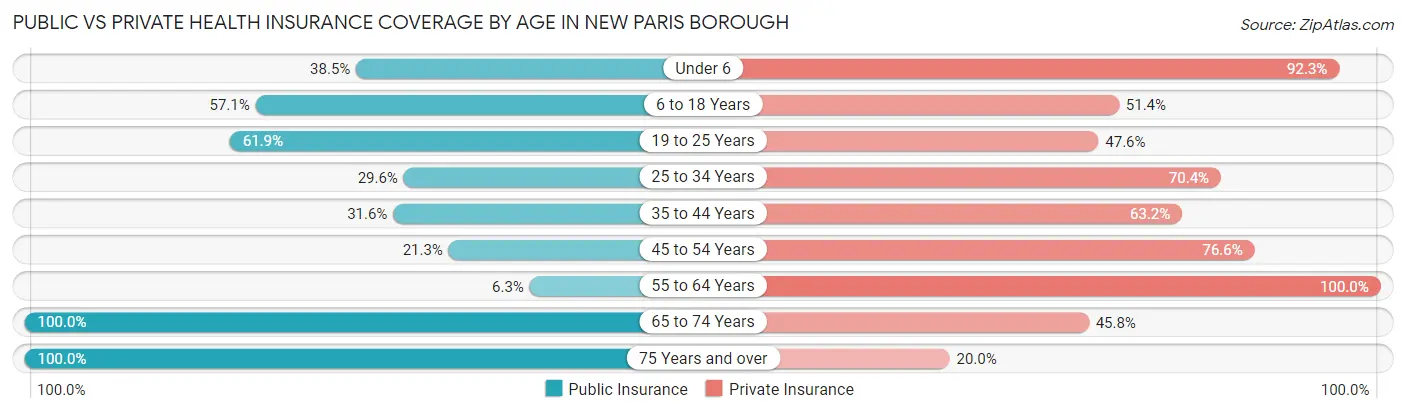
| Age Bracket | Public Insurance | Private Insurance |
| Under 6 | 5 (38.5%) | 12 (92.3%) |
| 6 to 18 Years | 20 (57.1%) | 18 (51.4%) |
| 19 to 25 Years | 13 (61.9%) | 10 (47.6%) |
| 25 to 34 Years | 8 (29.6%) | 19 (70.4%) |
| 35 to 44 Years | 6 (31.6%) | 12 (63.2%) |
| 45 to 54 Years | 10 (21.3%) | 36 (76.6%) |
| 55 to 64 Years | 1 (6.2%) | 16 (100.0%) |
| 65 to 74 Years | 24 (100.0%) | 11 (45.8%) |
| 75 Years and over | 15 (100.0%) | 3 (20.0%) |
| Total | 102 (47.0%) | 137 (63.1%) |
Disability Status by Sex by Age in New Paris borough
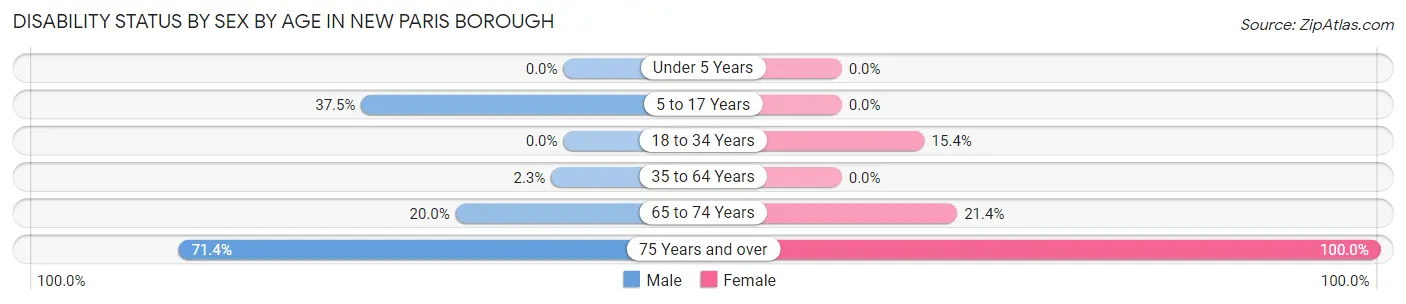
| Age Bracket | Male | Female |
| Under 5 Years | 0 (0.0%) | 0 (0.0%) |
| 5 to 17 Years | 3 (37.5%) | 0 (0.0%) |
| 18 to 34 Years | 0 (0.0%) | 4 (15.4%) |
| 35 to 64 Years | 1 (2.3%) | 0 (0.0%) |
| 65 to 74 Years | 2 (20.0%) | 3 (21.4%) |
| 75 Years and over | 5 (71.4%) | 8 (100.0%) |
Disability Class by Sex by Age in New Paris borough
Disability Class: Hearing Difficulty
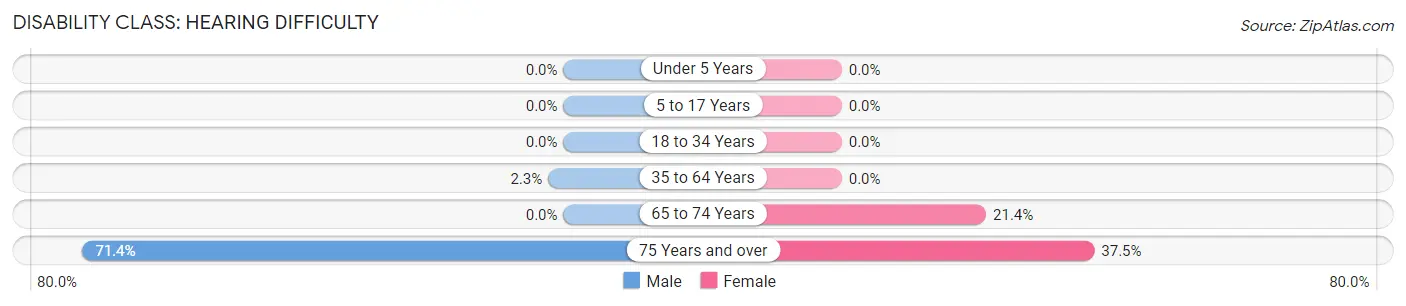
| Age Bracket | Male | Female |
| Under 5 Years | 0 (0.0%) | 0 (0.0%) |
| 5 to 17 Years | 0 (0.0%) | 0 (0.0%) |
| 18 to 34 Years | 0 (0.0%) | 0 (0.0%) |
| 35 to 64 Years | 1 (2.3%) | 0 (0.0%) |
| 65 to 74 Years | 0 (0.0%) | 3 (21.4%) |
| 75 Years and over | 5 (71.4%) | 3 (37.5%) |
Disability Class: Vision Difficulty
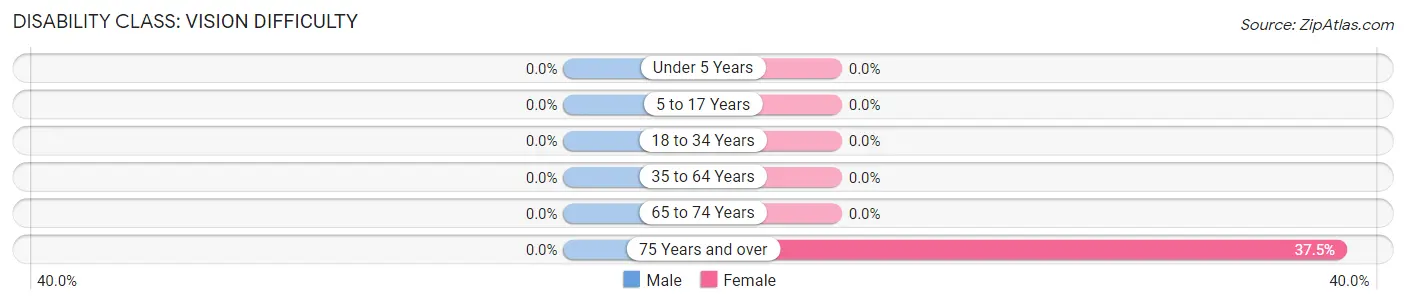
| Age Bracket | Male | Female |
| Under 5 Years | 0 (0.0%) | 0 (0.0%) |
| 5 to 17 Years | 0 (0.0%) | 0 (0.0%) |
| 18 to 34 Years | 0 (0.0%) | 0 (0.0%) |
| 35 to 64 Years | 0 (0.0%) | 0 (0.0%) |
| 65 to 74 Years | 0 (0.0%) | 0 (0.0%) |
| 75 Years and over | 0 (0.0%) | 3 (37.5%) |
Disability Class: Cognitive Difficulty
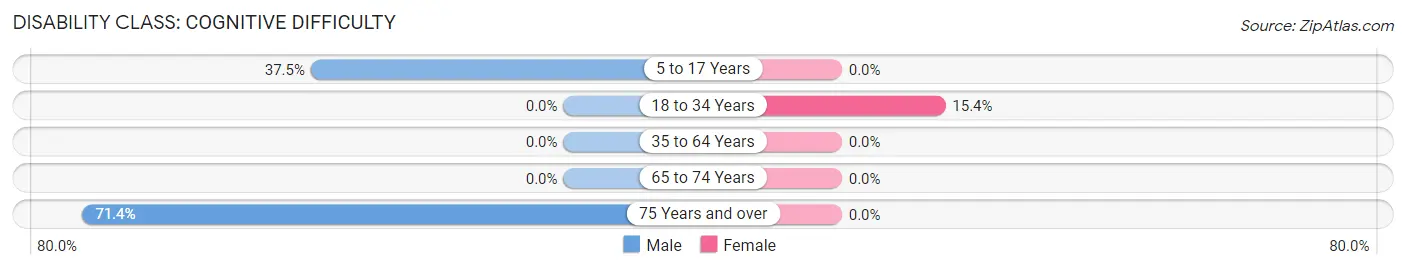
| Age Bracket | Male | Female |
| 5 to 17 Years | 3 (37.5%) | 0 (0.0%) |
| 18 to 34 Years | 0 (0.0%) | 4 (15.4%) |
| 35 to 64 Years | 0 (0.0%) | 0 (0.0%) |
| 65 to 74 Years | 0 (0.0%) | 0 (0.0%) |
| 75 Years and over | 5 (71.4%) | 0 (0.0%) |
Disability Class: Ambulatory Difficulty
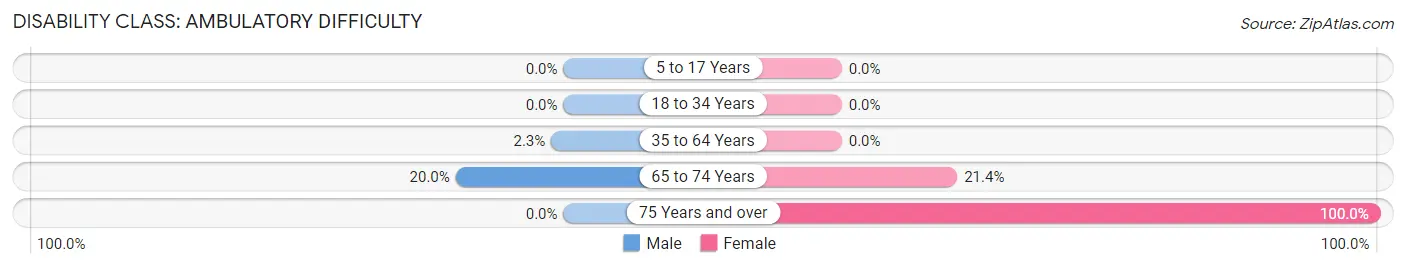
| Age Bracket | Male | Female |
| 5 to 17 Years | 0 (0.0%) | 0 (0.0%) |
| 18 to 34 Years | 0 (0.0%) | 0 (0.0%) |
| 35 to 64 Years | 1 (2.3%) | 0 (0.0%) |
| 65 to 74 Years | 2 (20.0%) | 3 (21.4%) |
| 75 Years and over | 0 (0.0%) | 8 (100.0%) |
Disability Class: Self-Care Difficulty
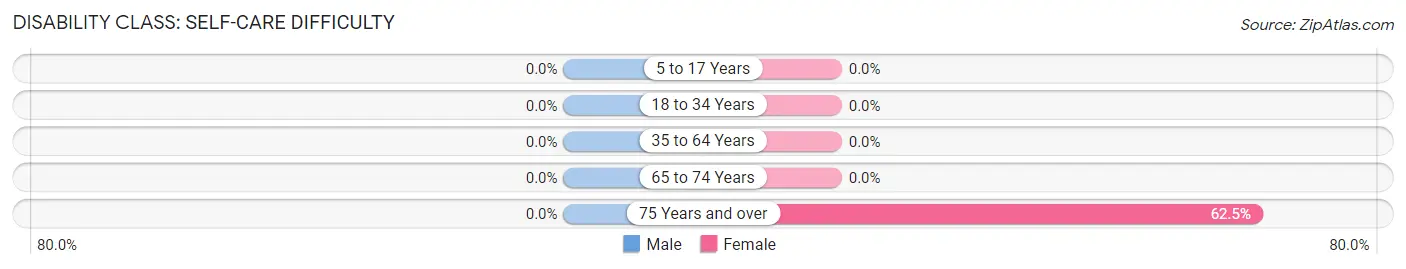
| Age Bracket | Male | Female |
| 5 to 17 Years | 0 (0.0%) | 0 (0.0%) |
| 18 to 34 Years | 0 (0.0%) | 0 (0.0%) |
| 35 to 64 Years | 0 (0.0%) | 0 (0.0%) |
| 65 to 74 Years | 0 (0.0%) | 0 (0.0%) |
| 75 Years and over | 0 (0.0%) | 5 (62.5%) |
Technology Access in New Paris borough
Computing Device Access in New Paris borough
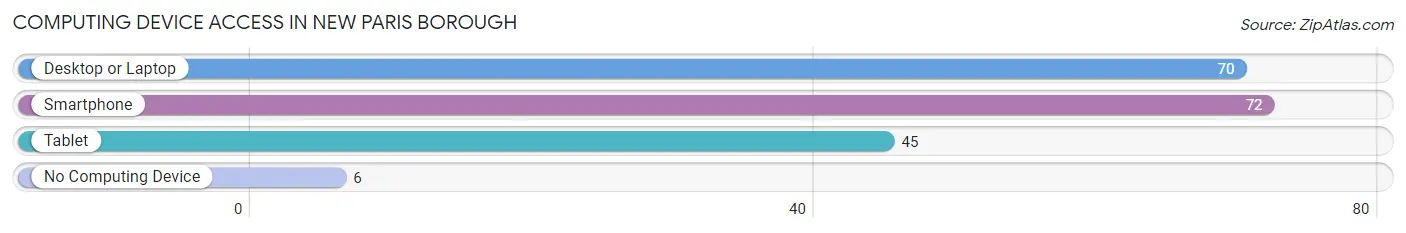
| Device Type | # Households | % Households |
| Desktop or Laptop | 70 | 75.3% |
| Smartphone | 72 | 77.4% |
| Tablet | 45 | 48.4% |
| No Computing Device | 6 | 6.5% |
| Total | 93 | 100.0% |
Internet Access in New Paris borough
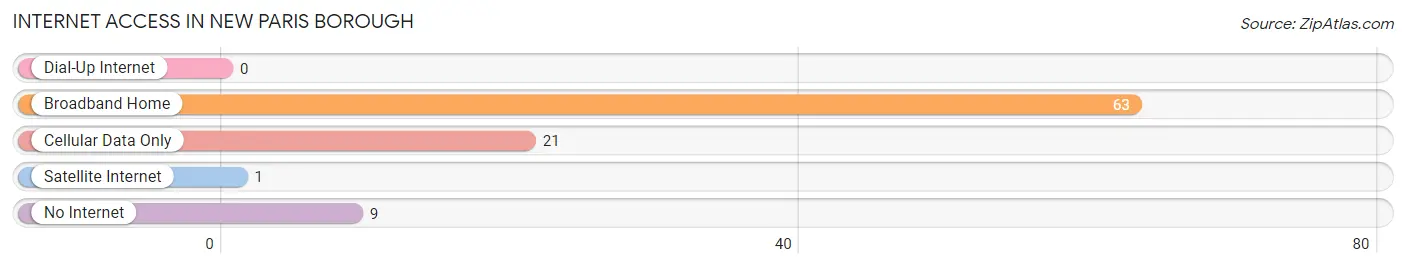
| Internet Type | # Households | % Households |
| Dial-Up Internet | 0 | 0.0% |
| Broadband Home | 63 | 67.7% |
| Cellular Data Only | 21 | 22.6% |
| Satellite Internet | 1 | 1.1% |
| No Internet | 9 | 9.7% |
| Total | 93 | 100.0% |
New Paris borough Summary
New Paris Borough is a small borough located in Bedford County, Pennsylvania. It is situated in the foothills of the Allegheny Mountains and is part of the Bedford Metropolitan Statistical Area. The borough has a population of 1,093 as of the 2010 census.
History
New Paris Borough was founded in 1845 by a group of settlers from New Paris, Ohio. The settlers were attracted to the area by the abundance of natural resources and the potential for economic growth. The borough was officially incorporated in 1851.
The borough was named after the city of New Paris, Ohio, which was founded in 1803. The name was chosen to honor the settlers’ hometown.
The borough was an important stop on the Pennsylvania Railroad, which ran through the area from 1871 to 1971. The railroad provided a vital link between the borough and the rest of the state.
The borough was also home to a number of industries, including a brickyard, a sawmill, and a tannery. These industries provided employment for many of the borough’s residents.
Geography
New Paris Borough is located in Bedford County, Pennsylvania. It is situated in the foothills of the Allegheny Mountains and is part of the Bedford Metropolitan Statistical Area.
The borough is bordered by Snake Spring Township to the north, West Providence Township to the east, and Snake Spring Township to the south. The borough is located approximately 25 miles east of Altoona and 50 miles west of Harrisburg.
The borough has a total area of 0.6 square miles, all of which is land. The borough is located at an elevation of 1,845 feet above sea level.
Economy
The economy of New Paris Borough is largely based on agriculture and tourism. The borough is home to several farms, which produce a variety of crops, including corn, soybeans, and hay.
The borough is also home to several tourist attractions, including the Bedford County Historical Society Museum, the Bedford County Fairgrounds, and the Bedford County Courthouse. These attractions draw visitors from all over the state and beyond.
Demographics
As of the 2010 census, the population of New Paris Borough was 1,093. The racial makeup of the borough was 97.3% White, 0.7% African American, 0.2% Native American, 0.2% Asian, 0.2% from other races, and 1.6% from two or more races. Hispanic or Latino of any race were 0.7% of the population.
The median household income in the borough was $37,500, and the median family income was $45,000. The per capita income was $19,000. About 11.3% of families and 14.2% of the population were below the poverty line, including 18.2% of those under age 18 and 8.3% of those age 65 or over.
Conclusion
New Paris Borough is a small borough located in Bedford County, Pennsylvania. It is situated in the foothills of the Allegheny Mountains and is part of the Bedford Metropolitan Statistical Area. The borough has a population of 1,093 as of the 2010 census. The economy of the borough is largely based on agriculture and tourism. The racial makeup of the borough is 97.3% White, 0.7% African American, 0.2% Native American, 0.2% Asian, 0.2% from other races, and 1.6% from two or more races. The median household income in the borough was $37,500, and the median family income was $45,000.
Common Questions
What is Per Capita Income in New Paris borough?
Per Capita income in New Paris borough is $29,174.
What is the Median Family Income in New Paris borough?
Median Family Income in New Paris borough is $73,750.
What is the Median Household income in New Paris borough?
Median Household Income in New Paris borough is $63,250.
What is Income or Wage Gap in New Paris borough?
Income or Wage Gap in New Paris borough is 44.1%.
Women in New Paris borough earn 55.9 cents for every dollar earned by a man.
What is Inequality or Gini Index in New Paris borough?
Inequality or Gini Index in New Paris borough is 0.29.
What is the Total Population of New Paris borough?
Total Population of New Paris borough is 217.
What is the Total Male Population of New Paris borough?
Total Male Population of New Paris borough is 102.
What is the Total Female Population of New Paris borough?
Total Female Population of New Paris borough is 115.
What is the Ratio of Males per 100 Females in New Paris borough?
There are 88.70 Males per 100 Females in New Paris borough.
What is the Ratio of Females per 100 Males in New Paris borough?
There are 112.75 Females per 100 Males in New Paris borough.
What is the Median Population Age in New Paris borough?
Median Population Age in New Paris borough is 40.8 Years.
What is the Average Family Size in New Paris borough
Average Family Size in New Paris borough is 3.0 People.
What is the Average Household Size in New Paris borough
Average Household Size in New Paris borough is 2.3 People.
How Large is the Labor Force in New Paris borough?
There are 126 People in the Labor Forcein in New Paris borough.
What is the Percentage of People in the Labor Force in New Paris borough?
72.0% of People are in the Labor Force in New Paris borough.