Clark borough, PA Map & Demographics
Clark borough Overview
$45,044
PER CAPITA INCOME
$99,500
AVG FAMILY INCOME
$78,250
AVG HOUSEHOLD INCOME
9.8%
WAGE / INCOME GAP [ % ]
90.2¢/ $1
WAGE / INCOME GAP [ $ ]
0.46
INEQUALITY / GINI INDEX
577
TOTAL POPULATION
258
MALE POPULATION
319
FEMALE POPULATION
80.88
MALES / 100 FEMALES
123.64
FEMALES / 100 MALES
46.3
MEDIAN AGE
3.2
AVG FAMILY SIZE
2.5
AVG HOUSEHOLD SIZE
242
LABOR FORCE [ PEOPLE ]
52.7%
PERCENT IN LABOR FORCE
4.5%
UNEMPLOYMENT RATE
Income in Clark borough
Income Overview in Clark borough
Per Capita Income in Clark borough is $45,044, while median incomes of families and households are $99,500 and $78,250 respectively.
| Characteristic | Number | Measure |
| Per Capita Income | 577 | $45,044 |
| Median Family Income | 150 | $99,500 |
| Mean Family Income | 150 | $130,190 |
| Median Household Income | 227 | $78,250 |
| Mean Household Income | 227 | $113,781 |
| Income Deficit | 150 | $0 |
| Wage / Income Gap (%) | 577 | 9.76% |
| Wage / Income Gap ($) | 577 | 90.24¢ per $1 |
| Gini / Inequality Index | 577 | 0.46 |
Earnings by Sex in Clark borough
Average Earnings in Clark borough are $49,444, $51,250 for men and $46,250 for women, a difference of 9.8%.
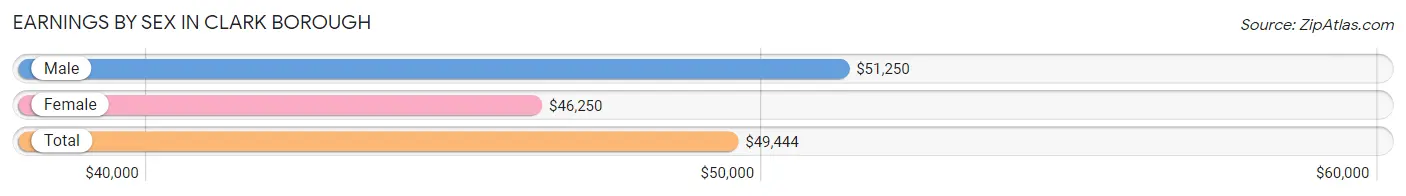
| Sex | Number | Average Earnings |
| Male | 114 (44.5%) | $51,250 |
| Female | 142 (55.5%) | $46,250 |
| Total | 256 (100.0%) | $49,444 |
Earnings by Sex by Income Bracket in Clark borough
The most common earnings brackets in Clark borough are $100,000+ for men (39 | 34.2%) and $100,000+ for women (26 | 18.3%).
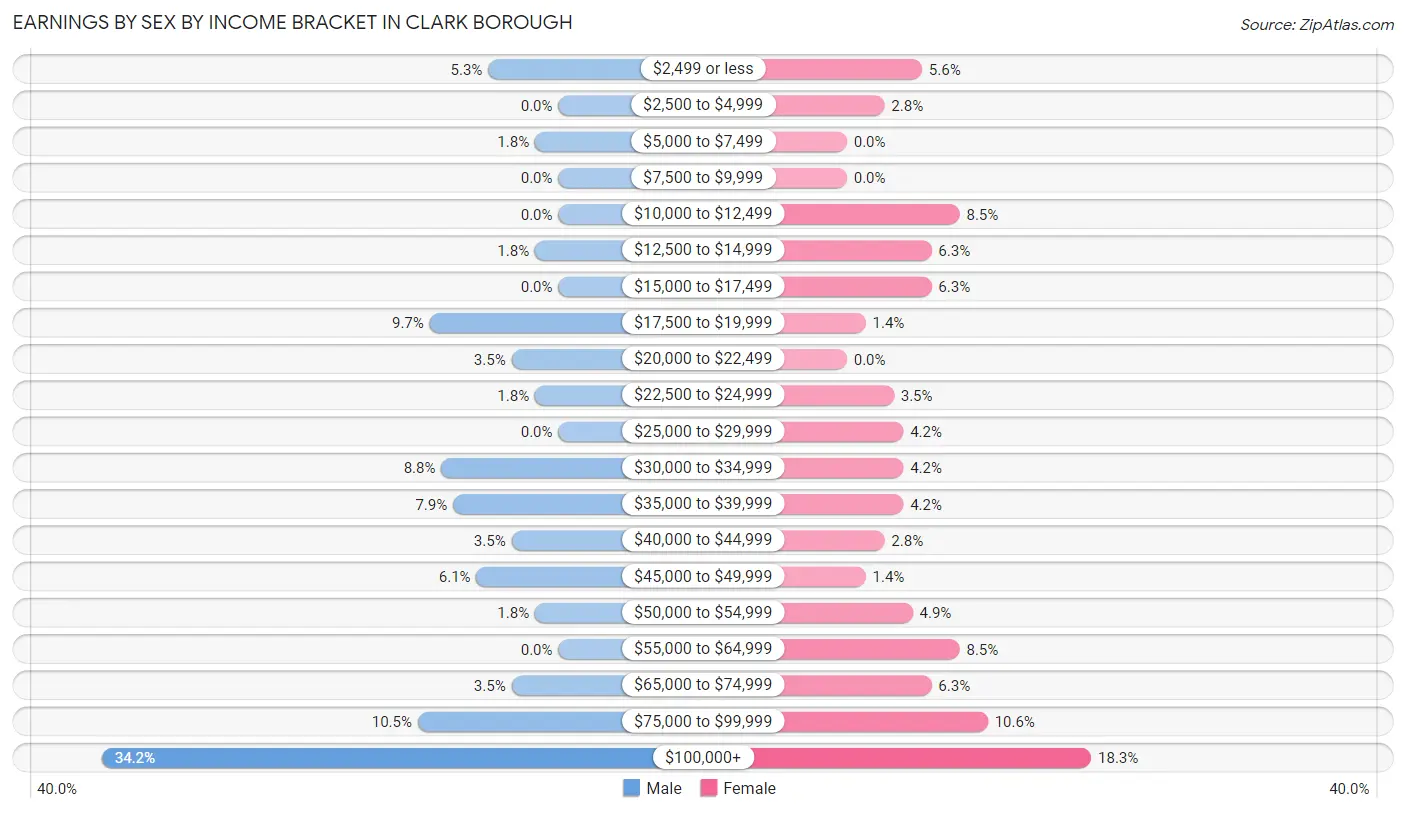
| Income | Male | Female |
| $2,499 or less | 6 (5.3%) | 8 (5.6%) |
| $2,500 to $4,999 | 0 (0.0%) | 4 (2.8%) |
| $5,000 to $7,499 | 2 (1.8%) | 0 (0.0%) |
| $7,500 to $9,999 | 0 (0.0%) | 0 (0.0%) |
| $10,000 to $12,499 | 0 (0.0%) | 12 (8.5%) |
| $12,500 to $14,999 | 2 (1.8%) | 9 (6.3%) |
| $15,000 to $17,499 | 0 (0.0%) | 9 (6.3%) |
| $17,500 to $19,999 | 11 (9.7%) | 2 (1.4%) |
| $20,000 to $22,499 | 4 (3.5%) | 0 (0.0%) |
| $22,500 to $24,999 | 2 (1.8%) | 5 (3.5%) |
| $25,000 to $29,999 | 0 (0.0%) | 6 (4.2%) |
| $30,000 to $34,999 | 10 (8.8%) | 6 (4.2%) |
| $35,000 to $39,999 | 9 (7.9%) | 6 (4.2%) |
| $40,000 to $44,999 | 4 (3.5%) | 4 (2.8%) |
| $45,000 to $49,999 | 7 (6.1%) | 2 (1.4%) |
| $50,000 to $54,999 | 2 (1.8%) | 7 (4.9%) |
| $55,000 to $64,999 | 0 (0.0%) | 12 (8.5%) |
| $65,000 to $74,999 | 4 (3.5%) | 9 (6.3%) |
| $75,000 to $99,999 | 12 (10.5%) | 15 (10.6%) |
| $100,000+ | 39 (34.2%) | 26 (18.3%) |
| Total | 114 (100.0%) | 142 (100.0%) |
Earnings by Sex by Educational Attainment in Clark borough
Average earnings in Clark borough are $71,250 for men and $54,643 for women, a difference of 23.3%. Men with an educational attainment of bachelor's degree enjoy the highest average annual earnings of $110,625, while those with college or associate's degree education earn the least with $36,094. Women with an educational attainment of graduate degree earn the most with the average annual earnings of $113,750, while those with high school diploma education have the smallest earnings of $16,607.
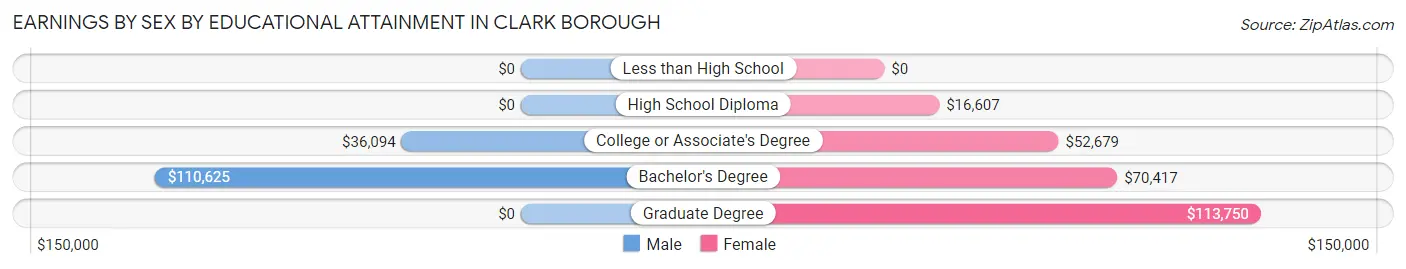
| Educational Attainment | Male Income | Female Income |
| Less than High School | - | - |
| High School Diploma | - | - |
| College or Associate's Degree | $36,094 | $52,679 |
| Bachelor's Degree | $110,625 | $70,417 |
| Graduate Degree | - | - |
| Total | $71,250 | $54,643 |
Family Income in Clark borough
Family Income Brackets in Clark borough
According to the Clark borough family income data, there are 35 families falling into the $100,000 to $149,999 income range, which is the most common income bracket and makes up 23.3% of all families.
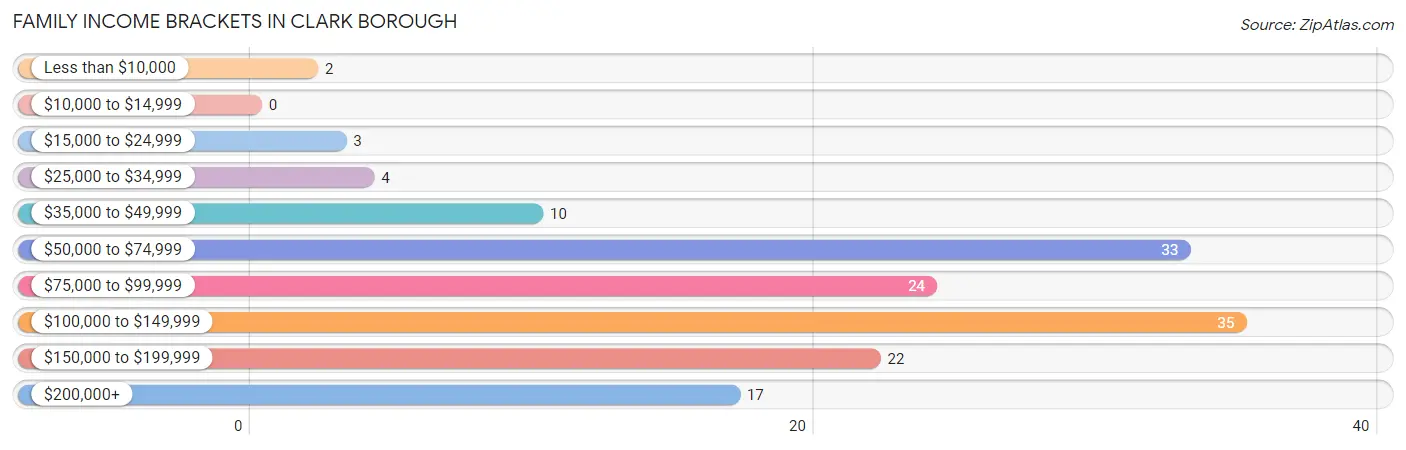
| Income Bracket | # Families | % Families |
| Less than $10,000 | 2 | 1.3% |
| $10,000 to $14,999 | 0 | 0.0% |
| $15,000 to $24,999 | 3 | 2.0% |
| $25,000 to $34,999 | 4 | 2.7% |
| $35,000 to $49,999 | 10 | 6.7% |
| $50,000 to $74,999 | 33 | 22.0% |
| $75,000 to $99,999 | 24 | 16.0% |
| $100,000 to $149,999 | 35 | 23.3% |
| $150,000 to $199,999 | 22 | 14.7% |
| $200,000+ | 17 | 11.3% |
Family Income by Famaliy Size in Clark borough
3-person families (26 | 17.3%) account for the highest median family income in Clark borough with $161,250 per family, while 3-person families (26 | 17.3%) have the highest median income of $53,750 per family member.
| Income Bracket | # Families | Median Income |
| 2-Person Families | 82 (54.7%) | $73,750 |
| 3-Person Families | 26 (17.3%) | $161,250 |
| 4-Person Families | 25 (16.7%) | $139,821 |
| 5-Person Families | 7 (4.7%) | $0 |
| 6-Person Families | 3 (2.0%) | $0 |
| 7+ Person Families | 7 (4.7%) | $0 |
| Total | 150 (100.0%) | $99,500 |
Family Income by Number of Earners in Clark borough
The median family income in Clark borough is $99,500, with families comprising 3+ earners (9) having the highest median family income of $186,250, while families with no earners (36) have the lowest median family income of $56,250, accounting for 6.0% and 24.0% of families, respectively.
| Number of Earners | # Families | Median Income |
| No Earners | 36 (24.0%) | $56,250 |
| 1 Earner | 39 (26.0%) | $85,625 |
| 2 Earners | 66 (44.0%) | $107,917 |
| 3+ Earners | 9 (6.0%) | $186,250 |
| Total | 150 (100.0%) | $99,500 |
Household Income in Clark borough
Household Income Brackets in Clark borough
With 53 households falling in the category, the $50,000 to $74,999 income range is the most frequent in Clark borough, accounting for 23.4% of all households. In contrast, only 1 households (0.4%) fall into the $10,000 to $14,999 income bracket, making it the least populous group.
| Income Bracket | # Households | % Households |
| Less than $10,000 | 8 | 3.5% |
| $10,000 to $14,999 | 1 | 0.4% |
| $15,000 to $24,999 | 3 | 1.3% |
| $25,000 to $34,999 | 27 | 11.9% |
| $35,000 to $49,999 | 18 | 7.9% |
| $50,000 to $74,999 | 53 | 23.3% |
| $75,000 to $99,999 | 22 | 9.7% |
| $100,000 to $149,999 | 41 | 18.1% |
| $150,000 to $199,999 | 34 | 15.0% |
| $200,000+ | 20 | 8.8% |
Household Income by Householder Age in Clark borough
The median household income in Clark borough is $78,250, with the highest median household income of $154,531 found in the 25 to 44 years age bracket for the primary householder. A total of 47 households (20.7%) fall into this category.
| Income Bracket | # Households | Median Income |
| 15 to 24 Years | 0 (0.0%) | $0 |
| 25 to 44 Years | 47 (20.7%) | $154,531 |
| 45 to 64 Years | 90 (39.7%) | $97,500 |
| 65+ Years | 90 (39.7%) | $52,955 |
| Total | 227 (100.0%) | $78,250 |
Poverty in Clark borough
Income Below Poverty by Sex and Age in Clark borough
With 1.9% poverty level for males and 5.4% for females among the residents of Clark borough, 75 year old and over males and 55 to 64 year old females are the most vulnerable to poverty, with 4 males (12.5%) and 11 females (20.4%) in their respective age groups living below the poverty level.
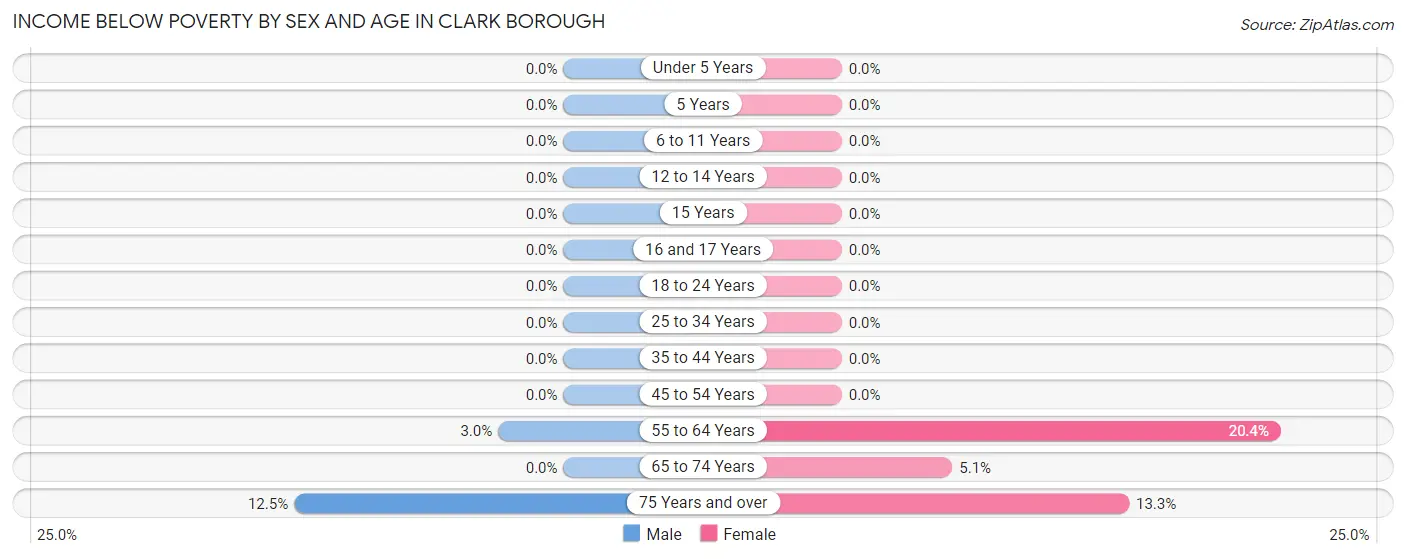
| Age Bracket | Male | Female |
| Under 5 Years | 0 (0.0%) | 0 (0.0%) |
| 5 Years | 0 (0.0%) | 0 (0.0%) |
| 6 to 11 Years | 0 (0.0%) | 0 (0.0%) |
| 12 to 14 Years | 0 (0.0%) | 0 (0.0%) |
| 15 Years | 0 (0.0%) | 0 (0.0%) |
| 16 and 17 Years | 0 (0.0%) | 0 (0.0%) |
| 18 to 24 Years | 0 (0.0%) | 0 (0.0%) |
| 25 to 34 Years | 0 (0.0%) | 0 (0.0%) |
| 35 to 44 Years | 0 (0.0%) | 0 (0.0%) |
| 45 to 54 Years | 0 (0.0%) | 0 (0.0%) |
| 55 to 64 Years | 1 (3.0%) | 11 (20.4%) |
| 65 to 74 Years | 0 (0.0%) | 2 (5.1%) |
| 75 Years and over | 4 (12.5%) | 4 (13.3%) |
| Total | 5 (1.9%) | 17 (5.4%) |
Income Above Poverty by Sex and Age in Clark borough
According to the poverty statistics in Clark borough, males aged under 5 years and females aged under 5 years are the age groups that are most secure financially, with 100.0% of males and 100.0% of females in these age groups living above the poverty line.
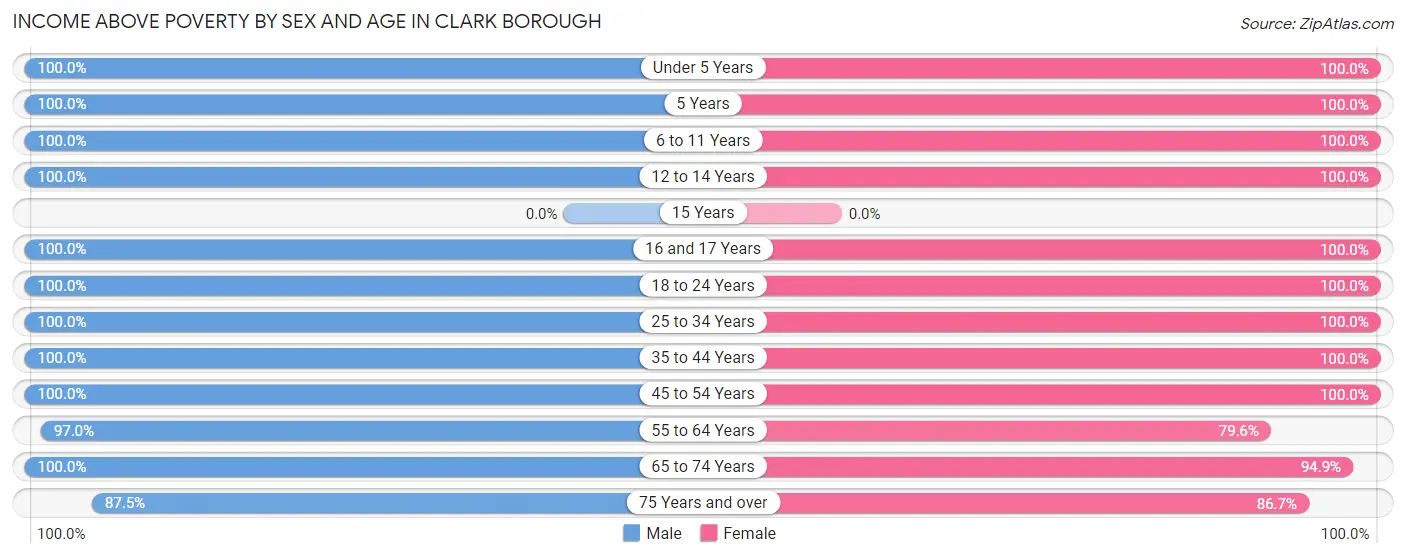
| Age Bracket | Male | Female |
| Under 5 Years | 8 (100.0%) | 13 (100.0%) |
| 5 Years | 7 (100.0%) | 12 (100.0%) |
| 6 to 11 Years | 22 (100.0%) | 33 (100.0%) |
| 12 to 14 Years | 12 (100.0%) | 9 (100.0%) |
| 15 Years | 0 (0.0%) | 0 (0.0%) |
| 16 and 17 Years | 4 (100.0%) | 1 (100.0%) |
| 18 to 24 Years | 4 (100.0%) | 27 (100.0%) |
| 25 to 34 Years | 14 (100.0%) | 30 (100.0%) |
| 35 to 44 Years | 47 (100.0%) | 33 (100.0%) |
| 45 to 54 Years | 23 (100.0%) | 36 (100.0%) |
| 55 to 64 Years | 32 (97.0%) | 43 (79.6%) |
| 65 to 74 Years | 52 (100.0%) | 37 (94.9%) |
| 75 Years and over | 28 (87.5%) | 26 (86.7%) |
| Total | 253 (98.1%) | 300 (94.6%) |
Income Below Poverty Among Married-Couple Families in Clark borough
The poverty statistics for married-couple families in Clark borough show that 3.1% or 4 of the total 130 families live below the poverty line. Families with no children have the highest poverty rate of 4.6%, comprising of 4 families. On the other hand, families with 1 or 2 children have the lowest poverty rate of 0.0%, which includes 0 families.
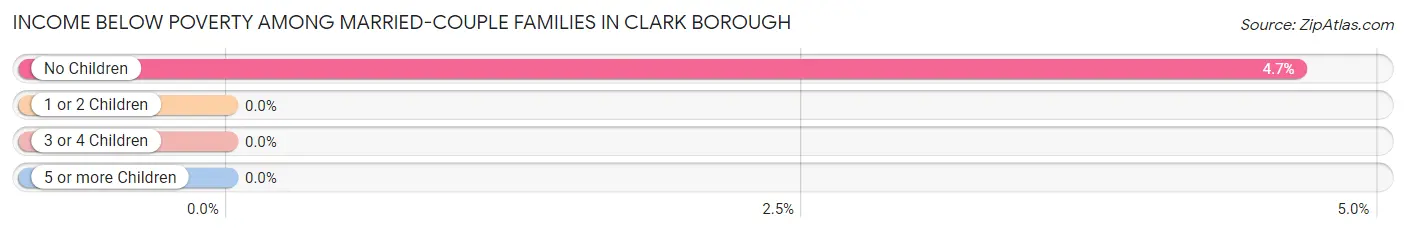
| Children | Above Poverty | Below Poverty |
| No Children | 82 (95.4%) | 4 (4.6%) |
| 1 or 2 Children | 35 (100.0%) | 0 (0.0%) |
| 3 or 4 Children | 2 (100.0%) | 0 (0.0%) |
| 5 or more Children | 7 (100.0%) | 0 (0.0%) |
| Total | 126 (96.9%) | 4 (3.1%) |
Income Below Poverty Among Single-Parent Households in Clark borough
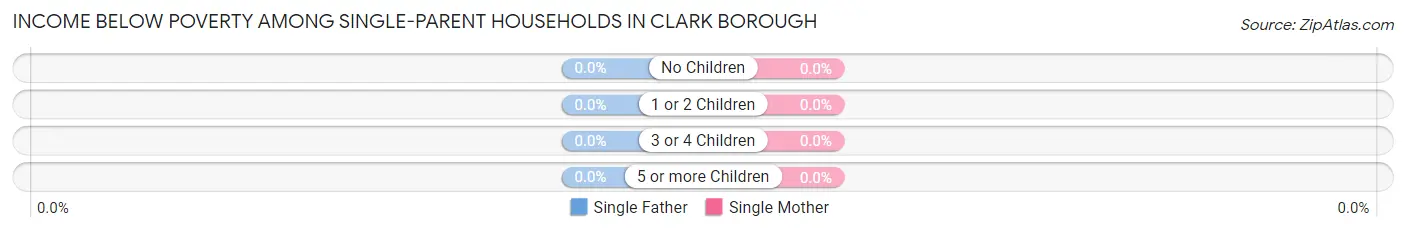
| Children | Single Father | Single Mother |
| No Children | 0 (0.0%) | 0 (0.0%) |
| 1 or 2 Children | 0 (0.0%) | 0 (0.0%) |
| 3 or 4 Children | 0 (0.0%) | 0 (0.0%) |
| 5 or more Children | 0 (0.0%) | 0 (0.0%) |
| Total | 0 (0.0%) | 0 (0.0%) |
Income Below Poverty Among Married-Couple vs Single-Parent Households in Clark borough
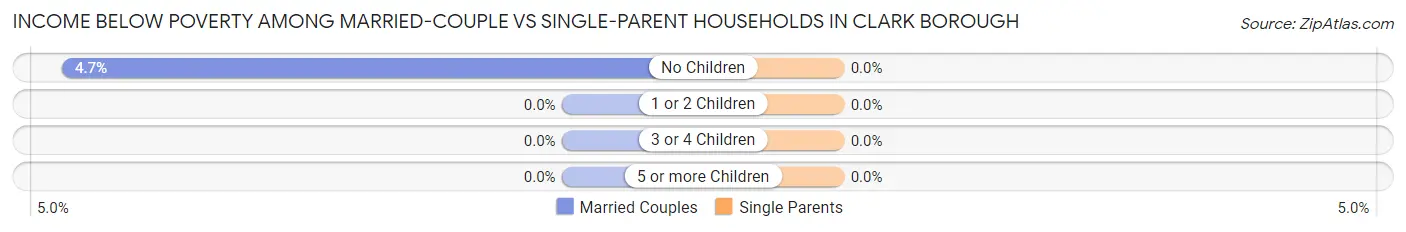
| Children | Married-Couple Families | Single-Parent Households |
| No Children | 4 (4.6%) | 0 (0.0%) |
| 1 or 2 Children | 0 (0.0%) | 0 (0.0%) |
| 3 or 4 Children | 0 (0.0%) | 0 (0.0%) |
| 5 or more Children | 0 (0.0%) | 0 (0.0%) |
| Total | 4 (3.1%) | 0 (0.0%) |
Race in Clark borough
The most populous races in Clark borough are White / Caucasian (573 | 99.3%), Two or more Races (3 | 0.5%), and Black / African American (1 | 0.2%).
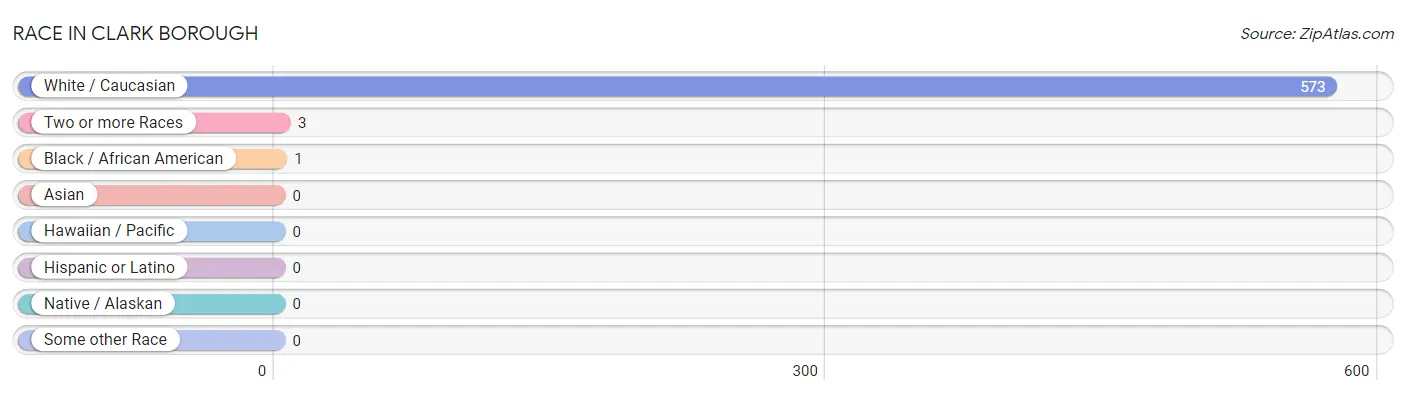
| Race | # Population | % Population |
| Asian | 0 | 0.0% |
| Black / African American | 1 | 0.2% |
| Hawaiian / Pacific | 0 | 0.0% |
| Hispanic or Latino | 0 | 0.0% |
| Native / Alaskan | 0 | 0.0% |
| White / Caucasian | 573 | 99.3% |
| Two or more Races | 3 | 0.5% |
| Some other Race | 0 | 0.0% |
| Total | 577 | 100.0% |
Ancestry in Clark borough
The most populous ancestries reported in Clark borough are German (128 | 22.2%), Italian (96 | 16.6%), American (72 | 12.5%), Irish (58 | 10.1%), and Polish (31 | 5.4%), together accounting for 66.7% of all Clark borough residents.
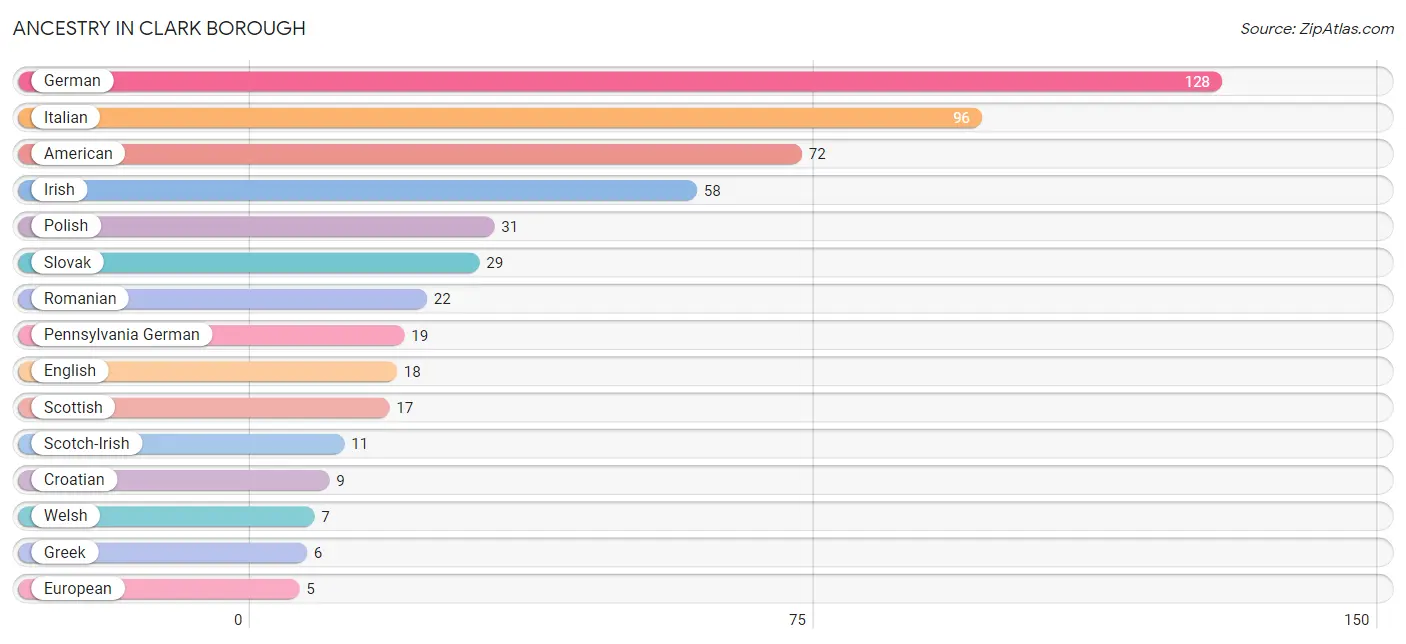
| Ancestry | # Population | % Population |
| American | 72 | 12.5% |
| Arab | 2 | 0.4% |
| Cherokee | 1 | 0.2% |
| Croatian | 9 | 1.6% |
| Eastern European | 1 | 0.2% |
| English | 18 | 3.1% |
| European | 5 | 0.9% |
| French | 5 | 0.9% |
| German | 128 | 22.2% |
| Greek | 6 | 1.0% |
| Hungarian | 4 | 0.7% |
| Irish | 58 | 10.1% |
| Italian | 96 | 16.6% |
| Lebanese | 2 | 0.4% |
| Lithuanian | 5 | 0.9% |
| Norwegian | 2 | 0.4% |
| Pennsylvania German | 19 | 3.3% |
| Polish | 31 | 5.4% |
| Romanian | 22 | 3.8% |
| Russian | 2 | 0.4% |
| Scotch-Irish | 11 | 1.9% |
| Scottish | 17 | 2.9% |
| Serbian | 2 | 0.4% |
| Slovak | 29 | 5.0% |
| Ukrainian | 3 | 0.5% |
| Welsh | 7 | 1.2% | View All 26 Rows |
Immigrants in Clark borough
The most numerous immigrant groups reported in Clark borough came from Eastern Europe (7 | 1.2%), Europe (7 | 1.2%), and Romania (7 | 1.2%), together accounting for 3.6% of all Clark borough residents.
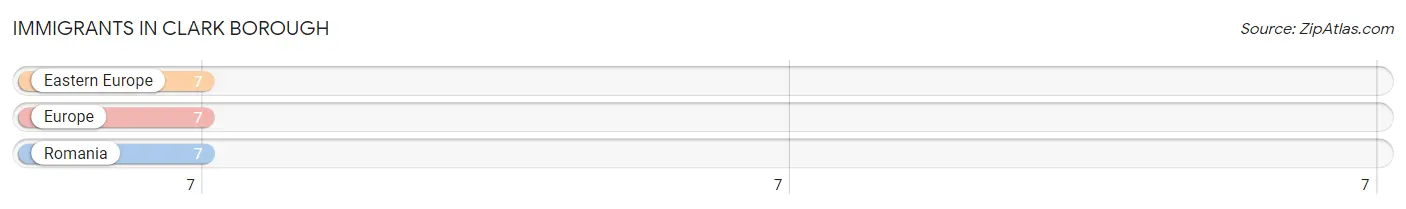
| Immigration Origin | # Population | % Population |
| Eastern Europe | 7 | 1.2% |
| Europe | 7 | 1.2% |
| Romania | 7 | 1.2% | View All 3 Rows |
Sex and Age in Clark borough
Sex and Age in Clark borough
The most populous age groups in Clark borough are 65 to 69 Years (40 | 15.5%) for men and 5 to 9 Years (42 | 13.2%) for women.
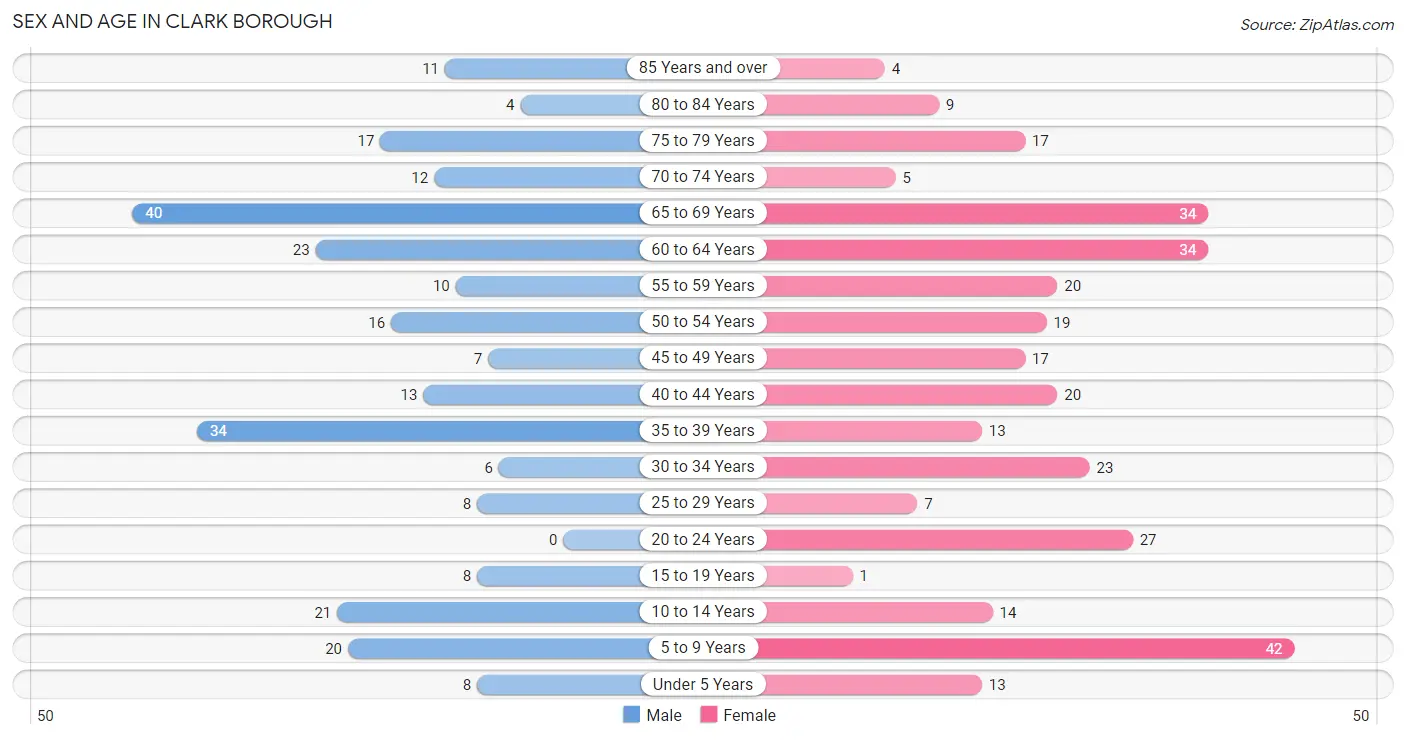
| Age Bracket | Male | Female |
| Under 5 Years | 8 (3.1%) | 13 (4.1%) |
| 5 to 9 Years | 20 (7.7%) | 42 (13.2%) |
| 10 to 14 Years | 21 (8.1%) | 14 (4.4%) |
| 15 to 19 Years | 8 (3.1%) | 1 (0.3%) |
| 20 to 24 Years | 0 (0.0%) | 27 (8.5%) |
| 25 to 29 Years | 8 (3.1%) | 7 (2.2%) |
| 30 to 34 Years | 6 (2.3%) | 23 (7.2%) |
| 35 to 39 Years | 34 (13.2%) | 13 (4.1%) |
| 40 to 44 Years | 13 (5.0%) | 20 (6.3%) |
| 45 to 49 Years | 7 (2.7%) | 17 (5.3%) |
| 50 to 54 Years | 16 (6.2%) | 19 (6.0%) |
| 55 to 59 Years | 10 (3.9%) | 20 (6.3%) |
| 60 to 64 Years | 23 (8.9%) | 34 (10.7%) |
| 65 to 69 Years | 40 (15.5%) | 34 (10.7%) |
| 70 to 74 Years | 12 (4.6%) | 5 (1.6%) |
| 75 to 79 Years | 17 (6.6%) | 17 (5.3%) |
| 80 to 84 Years | 4 (1.5%) | 9 (2.8%) |
| 85 Years and over | 11 (4.3%) | 4 (1.3%) |
| Total | 258 (100.0%) | 319 (100.0%) |
Families and Households in Clark borough
Median Family Size in Clark borough
The median family size in Clark borough is 3.22 persons per family, with single female/mother families (10 | 6.7%) accounting for the largest median family size of 3.7 persons per family. On the other hand, married-couple families (130 | 86.7%) represent the smallest median family size with 3.17 persons per family.
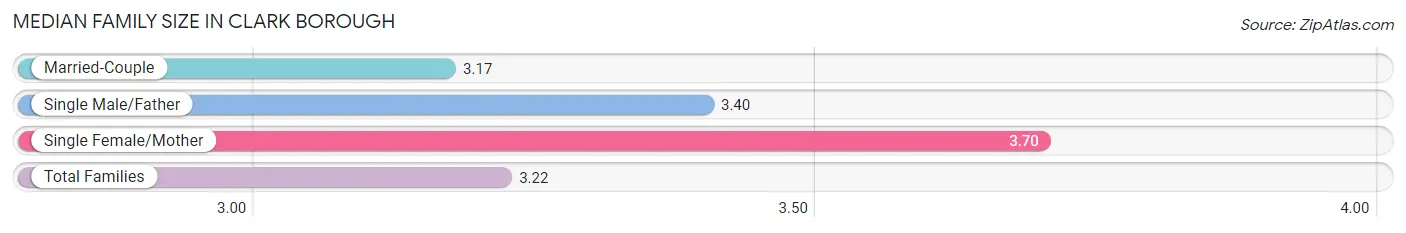
| Family Type | # Families | Family Size |
| Married-Couple | 130 (86.7%) | 3.17 |
| Single Male/Father | 10 (6.7%) | 3.40 |
| Single Female/Mother | 10 (6.7%) | 3.70 |
| Total Families | 150 (100.0%) | 3.22 |
Median Household Size in Clark borough
The median household size in Clark borough is 2.54 persons per household, with single female/mother households (10 | 4.4%) accounting for the largest median household size of 3.7 persons per household. non-family households (77 | 33.9%) represent the smallest median household size with 1.19 persons per household.
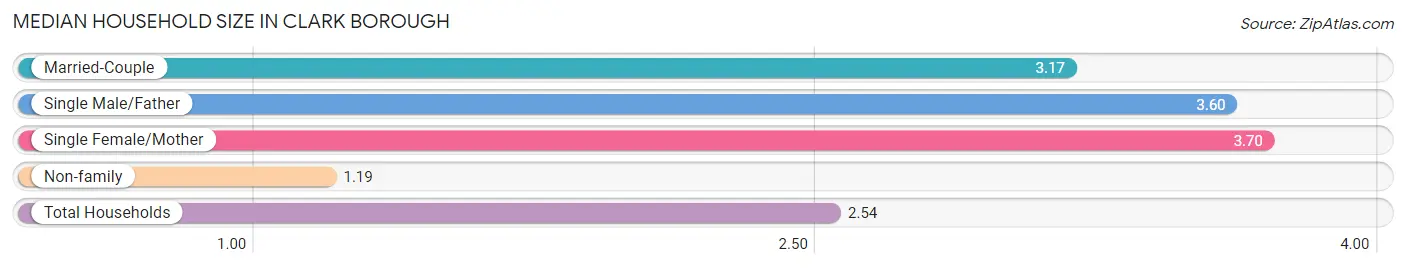
| Household Type | # Households | Household Size |
| Married-Couple | 130 (57.3%) | 3.17 |
| Single Male/Father | 10 (4.4%) | 3.60 |
| Single Female/Mother | 10 (4.4%) | 3.70 |
| Non-family | 77 (33.9%) | 1.19 |
| Total Households | 227 (100.0%) | 2.54 |
Household Size by Marriage Status in Clark borough
Out of a total of 227 households in Clark borough, 150 (66.1%) are family households, while 77 (33.9%) are nonfamily households. The most numerous type of family households are 2-person households, comprising 80, and the most common type of nonfamily households are 1-person households, comprising 66.
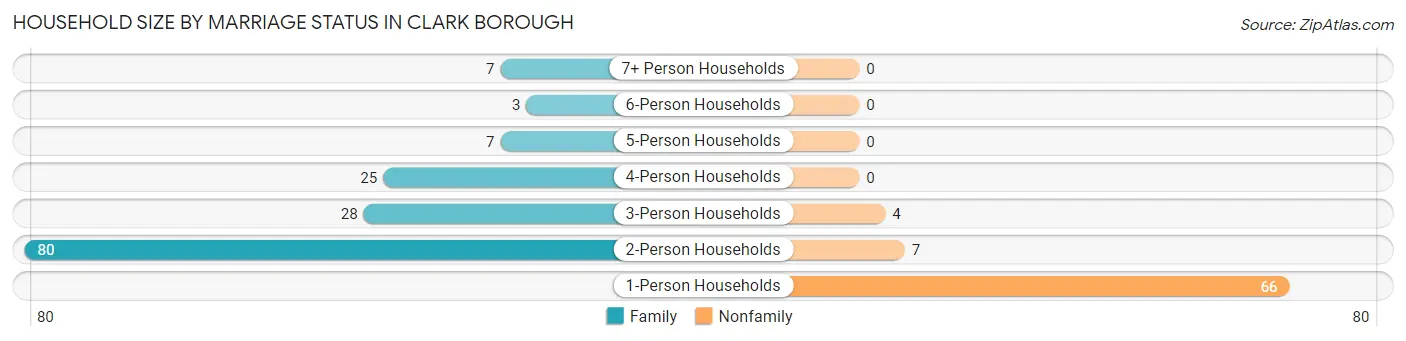
| Household Size | Family Households | Nonfamily Households |
| 1-Person Households | - | 66 (29.1%) |
| 2-Person Households | 80 (35.2%) | 7 (3.1%) |
| 3-Person Households | 28 (12.3%) | 4 (1.8%) |
| 4-Person Households | 25 (11.0%) | 0 (0.0%) |
| 5-Person Households | 7 (3.1%) | 0 (0.0%) |
| 6-Person Households | 3 (1.3%) | 0 (0.0%) |
| 7+ Person Households | 7 (3.1%) | 0 (0.0%) |
| Total | 150 (66.1%) | 77 (33.9%) |
Female Fertility in Clark borough
Fertility by Age in Clark borough
| Age Bracket | Women with Births | Births / 1,000 Women |
| 15 to 19 years | 0 (0.0%) | 0.0 |
| 20 to 34 years | 0 (0.0%) | 0.0 |
| 35 to 50 years | 0 (0.0%) | 0.0 |
| Total | 0 (0.0%) | 0.0 |
Fertility by Age by Marriage Status in Clark borough
| Age Bracket | Married | Unmarried |
| 15 to 19 years | 0 (0.0%) | 0 (0.0%) |
| 20 to 34 years | 0 (0.0%) | 0 (0.0%) |
| 35 to 50 years | 0 (0.0%) | 0 (0.0%) |
| Total | 0 (0.0%) | 0 (0.0%) |
Fertility by Education in Clark borough
| Educational Attainment | Women with Births | Births / 1,000 Women |
| Less than High School | 0 (0.0%) | 0.0 |
| High School Diploma | 0 (0.0%) | 0.0 |
| College or Associate's Degree | 0 (0.0%) | 0.0 |
| Bachelor's Degree | 0 (0.0%) | 0.0 |
| Graduate Degree | 0 (0.0%) | 0.0 |
| Total | 0 (0.0%) | 0.0 |
Fertility by Education by Marriage Status in Clark borough
| Educational Attainment | Married | Unmarried |
| Less than High School | 0 (0.0%) | 0 (0.0%) |
| High School Diploma | 0 (0.0%) | 0 (0.0%) |
| College or Associate's Degree | 0 (0.0%) | 0 (0.0%) |
| Bachelor's Degree | 0 (0.0%) | 0 (0.0%) |
| Graduate Degree | 0 (0.0%) | 0 (0.0%) |
| Total | 0 (0.0%) | 0 (0.0%) |
Employment Characteristics in Clark borough
Employment by Class of Employer in Clark borough
Among the 229 employed individuals in Clark borough, private company employees (161 | 70.3%), local government employees (29 | 12.7%), and not-for-profit organizations (26 | 11.4%) make up the most common classes of employment.
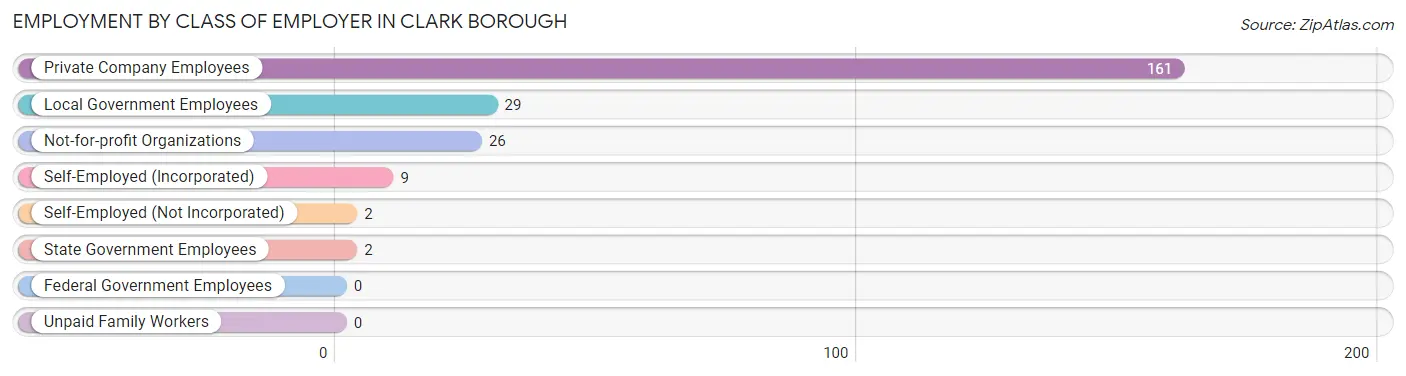
| Employer Class | # Employees | % Employees |
| Private Company Employees | 161 | 70.3% |
| Self-Employed (Incorporated) | 9 | 3.9% |
| Self-Employed (Not Incorporated) | 2 | 0.9% |
| Not-for-profit Organizations | 26 | 11.4% |
| Local Government Employees | 29 | 12.7% |
| State Government Employees | 2 | 0.9% |
| Federal Government Employees | 0 | 0.0% |
| Unpaid Family Workers | 0 | 0.0% |
| Total | 229 | 100.0% |
Employment Status by Age in Clark borough
According to the labor force statistics for Clark borough, out of the total population over 16 years of age (459), 52.7% or 242 individuals are in the labor force, with 4.5% or 11 of them unemployed. The age group with the highest labor force participation rate is 30 to 34 years, with 100.0% or 29 individuals in the labor force. Within the labor force, the 35 to 44 years age range has the highest percentage of unemployed individuals, with 11.9% or 8 of them being unemployed.
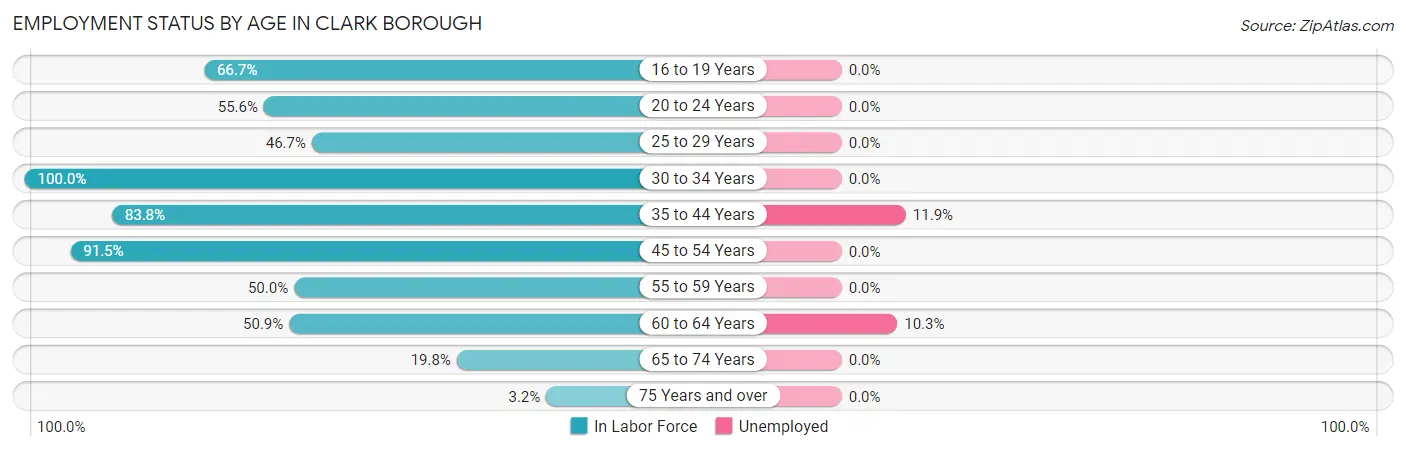
| Age Bracket | In Labor Force | Unemployed |
| 16 to 19 Years | 6 (66.7%) | 0 (0.0%) |
| 20 to 24 Years | 15 (55.6%) | 0 (0.0%) |
| 25 to 29 Years | 7 (46.7%) | 0 (0.0%) |
| 30 to 34 Years | 29 (100.0%) | 0 (0.0%) |
| 35 to 44 Years | 67 (83.8%) | 8 (11.9%) |
| 45 to 54 Years | 54 (91.5%) | 0 (0.0%) |
| 55 to 59 Years | 15 (50.0%) | 0 (0.0%) |
| 60 to 64 Years | 29 (50.9%) | 3 (10.3%) |
| 65 to 74 Years | 18 (19.8%) | 0 (0.0%) |
| 75 Years and over | 2 (3.2%) | 0 (0.0%) |
| Total | 242 (52.7%) | 11 (4.5%) |
Employment Status by Educational Attainment in Clark borough
According to labor force statistics for Clark borough, 74.4% of individuals (201) out of the total population between 25 and 64 years of age (270) are in the labor force, with 5.5% or 11 of them being unemployed. The group with the highest labor force participation rate are those with the educational attainment of less than high school, with 100.0% or 3 individuals in the labor force. Within the labor force, individuals with college / associate degree education have the highest percentage of unemployment, with 23.4% or 11 of them being unemployed.
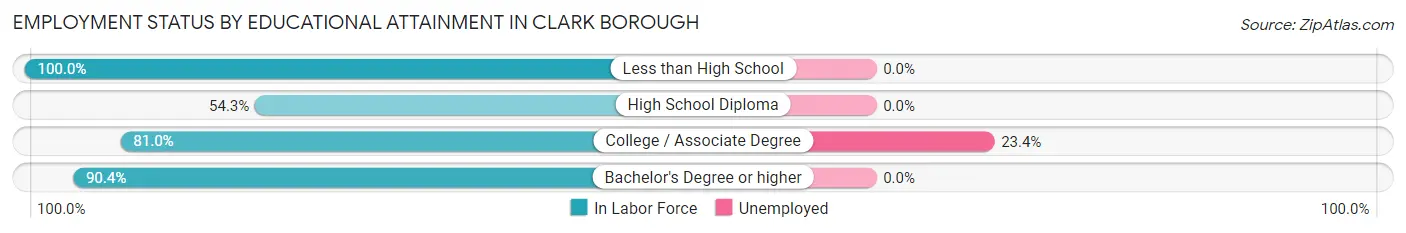
| Educational Attainment | In Labor Force | Unemployed |
| Less than High School | 3 (100.0%) | 0 (0.0%) |
| High School Diploma | 57 (54.3%) | 0 (0.0%) |
| College / Associate Degree | 47 (81.0%) | 14 (23.4%) |
| Bachelor's Degree or higher | 94 (90.4%) | 0 (0.0%) |
| Total | 201 (74.4%) | 15 (5.5%) |
Employment Occupations by Sex in Clark borough
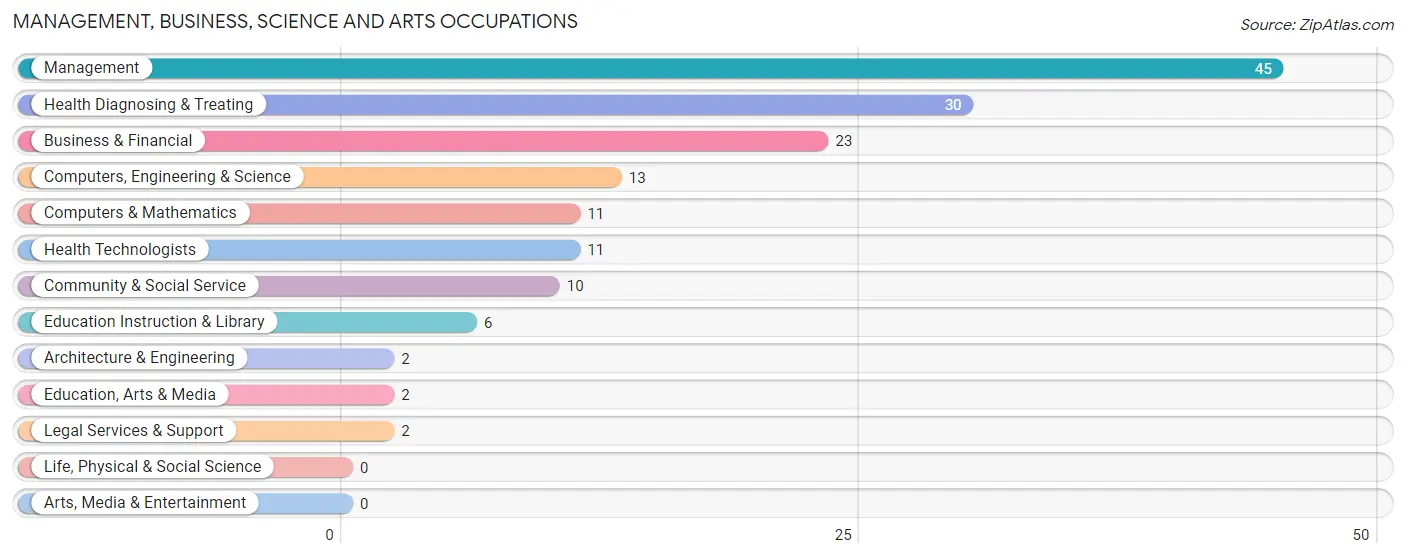
Management, Business, Science and Arts Occupations
The most common Management, Business, Science and Arts occupations in Clark borough are Management (45 | 19.5%), Health Diagnosing & Treating (30 | 13.0%), Business & Financial (23 | 10.0%), Computers, Engineering & Science (13 | 5.6%), and Computers & Mathematics (11 | 4.8%).
Management, Business, Science and Arts Occupations by Sex
Within the Management, Business, Science and Arts occupations in Clark borough, the most male-oriented occupations are Computers & Mathematics (81.8%), Computers, Engineering & Science (69.2%), and Business & Financial (65.2%), while the most female-oriented occupations are Architecture & Engineering (100.0%), Community & Social Service (100.0%), and Education, Arts & Media (100.0%).
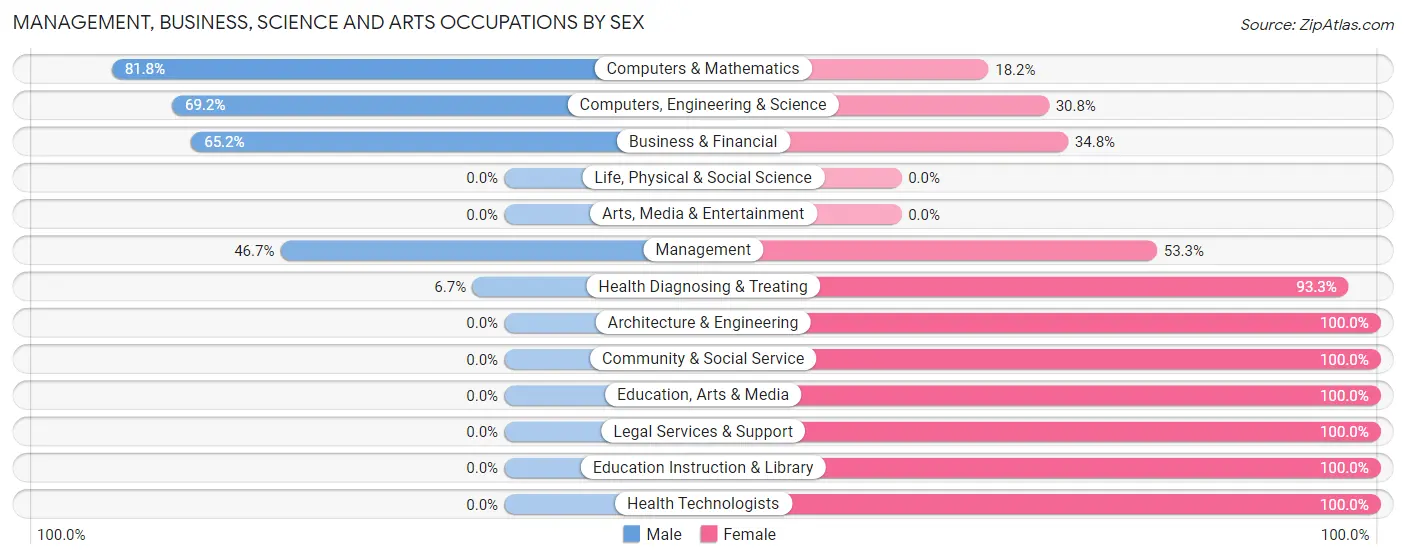
| Occupation | Male | Female |
| Management | 21 (46.7%) | 24 (53.3%) |
| Business & Financial | 15 (65.2%) | 8 (34.8%) |
| Computers, Engineering & Science | 9 (69.2%) | 4 (30.8%) |
| Computers & Mathematics | 9 (81.8%) | 2 (18.2%) |
| Architecture & Engineering | 0 (0.0%) | 2 (100.0%) |
| Life, Physical & Social Science | 0 (0.0%) | 0 (0.0%) |
| Community & Social Service | 0 (0.0%) | 10 (100.0%) |
| Education, Arts & Media | 0 (0.0%) | 2 (100.0%) |
| Legal Services & Support | 0 (0.0%) | 2 (100.0%) |
| Education Instruction & Library | 0 (0.0%) | 6 (100.0%) |
| Arts, Media & Entertainment | 0 (0.0%) | 0 (0.0%) |
| Health Diagnosing & Treating | 2 (6.7%) | 28 (93.3%) |
| Health Technologists | 0 (0.0%) | 11 (100.0%) |
| Total (Category) | 47 (38.8%) | 74 (61.2%) |
| Total (Overall) | 93 (40.3%) | 138 (59.7%) |
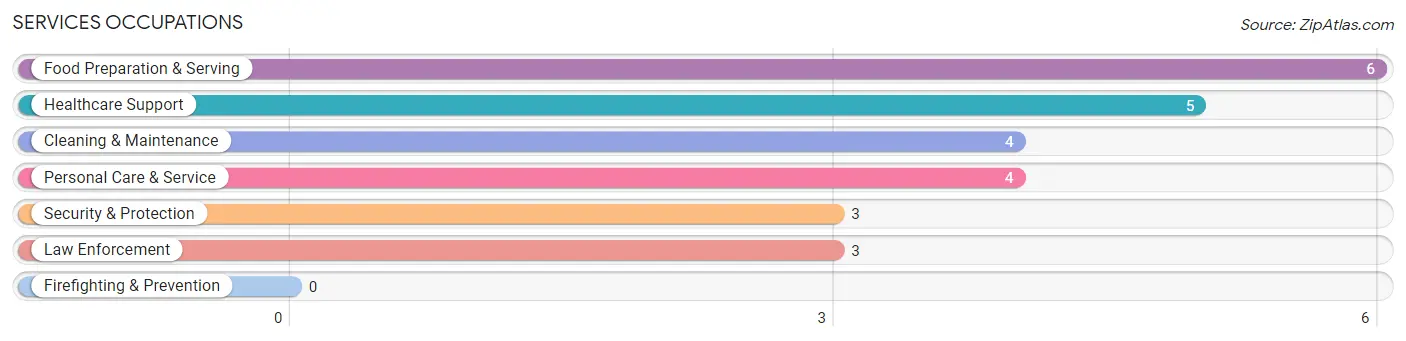
Services Occupations
The most common Services occupations in Clark borough are Food Preparation & Serving (6 | 2.6%), Healthcare Support (5 | 2.2%), Cleaning & Maintenance (4 | 1.7%), Personal Care & Service (4 | 1.7%), and Security & Protection (3 | 1.3%).
Services Occupations by Sex
Within the Services occupations in Clark borough, the most male-oriented occupations are Food Preparation & Serving (100.0%), Cleaning & Maintenance (50.0%), and Security & Protection (33.3%), while the most female-oriented occupations are Healthcare Support (100.0%), Personal Care & Service (100.0%), and Security & Protection (66.7%).
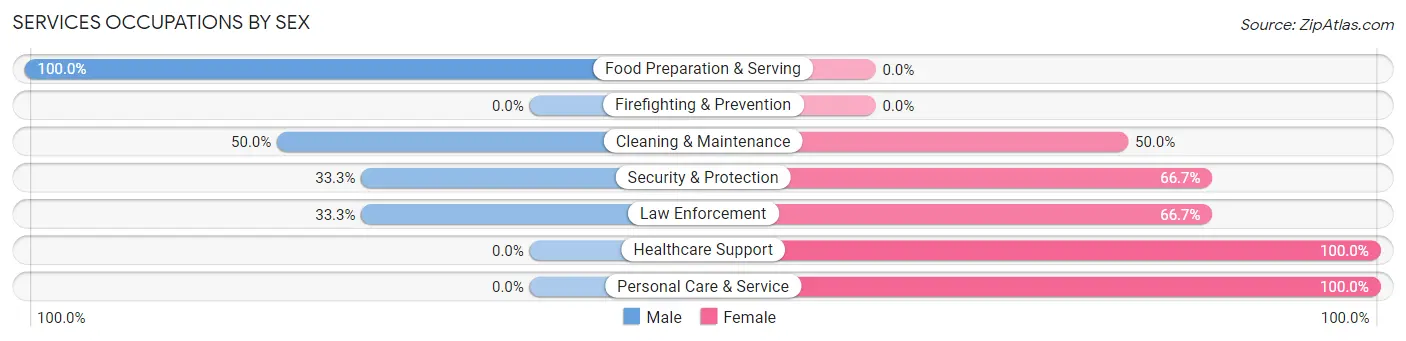
| Occupation | Male | Female |
| Healthcare Support | 0 (0.0%) | 5 (100.0%) |
| Security & Protection | 1 (33.3%) | 2 (66.7%) |
| Firefighting & Prevention | 0 (0.0%) | 0 (0.0%) |
| Law Enforcement | 1 (33.3%) | 2 (66.7%) |
| Food Preparation & Serving | 6 (100.0%) | 0 (0.0%) |
| Cleaning & Maintenance | 2 (50.0%) | 2 (50.0%) |
| Personal Care & Service | 0 (0.0%) | 4 (100.0%) |
| Total (Category) | 9 (40.9%) | 13 (59.1%) |
| Total (Overall) | 93 (40.3%) | 138 (59.7%) |
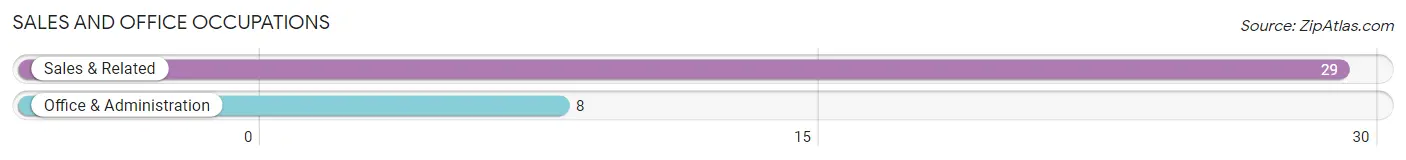
Sales and Office Occupations
The most common Sales and Office occupations in Clark borough are Sales & Related (29 | 12.6%), and Office & Administration (8 | 3.5%).
Sales and Office Occupations by Sex
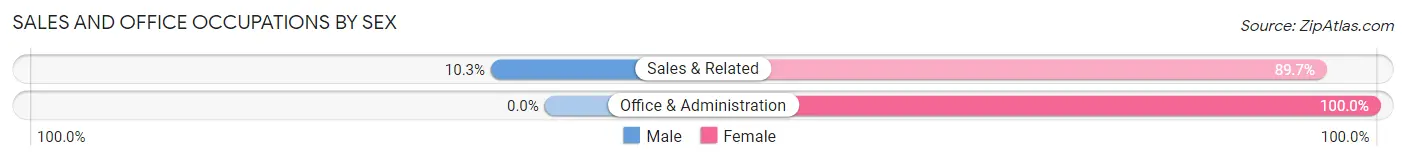
| Occupation | Male | Female |
| Sales & Related | 3 (10.3%) | 26 (89.7%) |
| Office & Administration | 0 (0.0%) | 8 (100.0%) |
| Total (Category) | 3 (8.1%) | 34 (91.9%) |
| Total (Overall) | 93 (40.3%) | 138 (59.7%) |
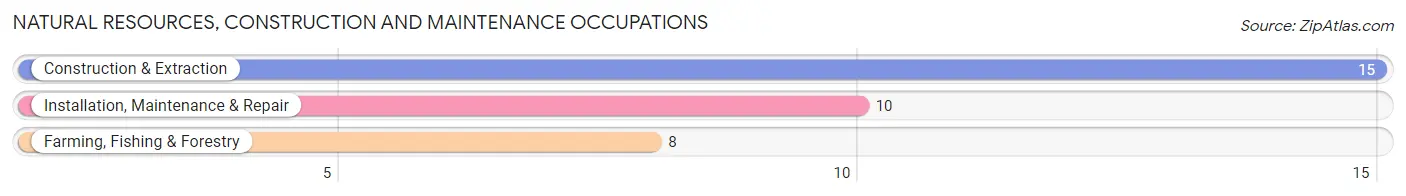
Natural Resources, Construction and Maintenance Occupations
The most common Natural Resources, Construction and Maintenance occupations in Clark borough are Construction & Extraction (15 | 6.5%), Installation, Maintenance & Repair (10 | 4.3%), and Farming, Fishing & Forestry (8 | 3.5%).
Natural Resources, Construction and Maintenance Occupations by Sex
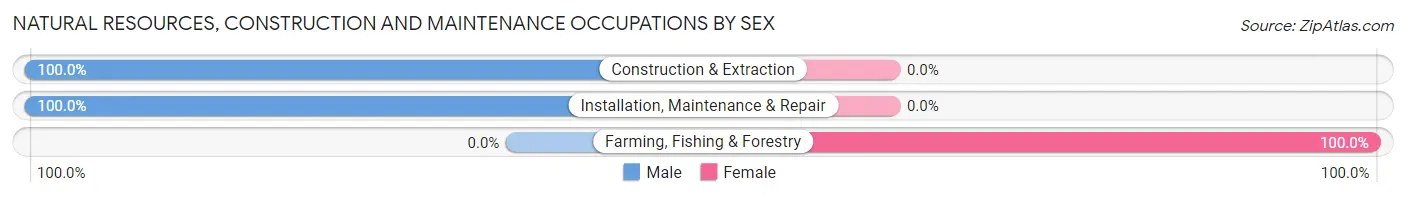
| Occupation | Male | Female |
| Farming, Fishing & Forestry | 0 (0.0%) | 8 (100.0%) |
| Construction & Extraction | 15 (100.0%) | 0 (0.0%) |
| Installation, Maintenance & Repair | 10 (100.0%) | 0 (0.0%) |
| Total (Category) | 25 (75.8%) | 8 (24.2%) |
| Total (Overall) | 93 (40.3%) | 138 (59.7%) |
Production, Transportation and Moving Occupations
The most common Production, Transportation and Moving occupations in Clark borough are Material Moving (9 | 3.9%), Transportation (5 | 2.2%), and Production (4 | 1.7%).
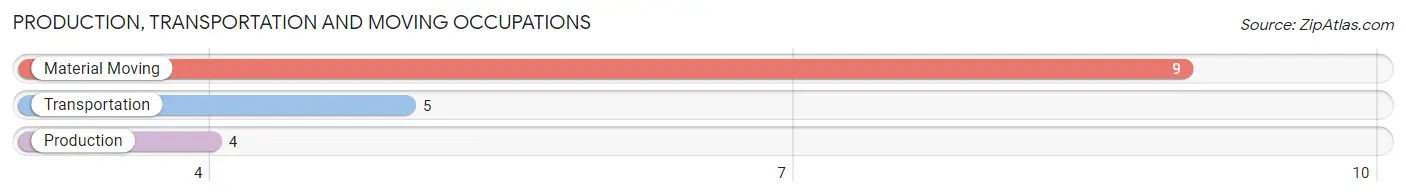
Production, Transportation and Moving Occupations by Sex
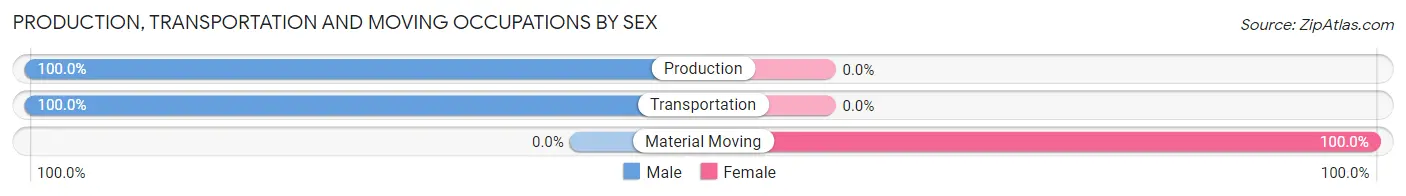
| Occupation | Male | Female |
| Production | 4 (100.0%) | 0 (0.0%) |
| Transportation | 5 (100.0%) | 0 (0.0%) |
| Material Moving | 0 (0.0%) | 9 (100.0%) |
| Total (Category) | 9 (50.0%) | 9 (50.0%) |
| Total (Overall) | 93 (40.3%) | 138 (59.7%) |
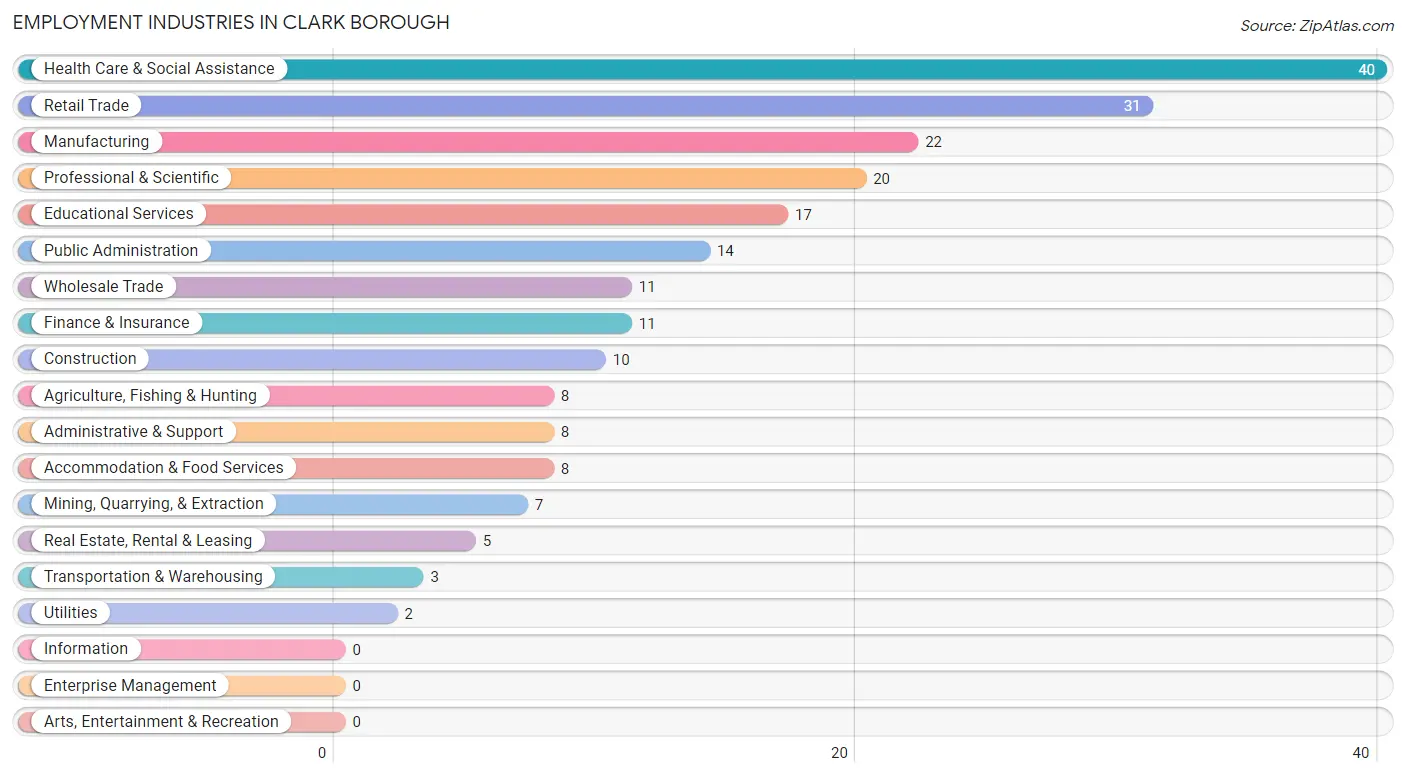
Employment Industries by Sex in Clark borough
Employment Industries in Clark borough
The major employment industries in Clark borough include Health Care & Social Assistance (40 | 17.3%), Retail Trade (31 | 13.4%), Manufacturing (22 | 9.5%), Professional & Scientific (20 | 8.7%), and Educational Services (17 | 7.4%).
Employment Industries by Sex in Clark borough
The Clark borough industries that see more men than women are Mining, Quarrying, & Extraction (100.0%), Construction (100.0%), and Transportation & Warehousing (100.0%), whereas the industries that tend to have a higher number of women are Agriculture, Fishing & Hunting (100.0%), Administrative & Support (100.0%), and Health Care & Social Assistance (87.5%).
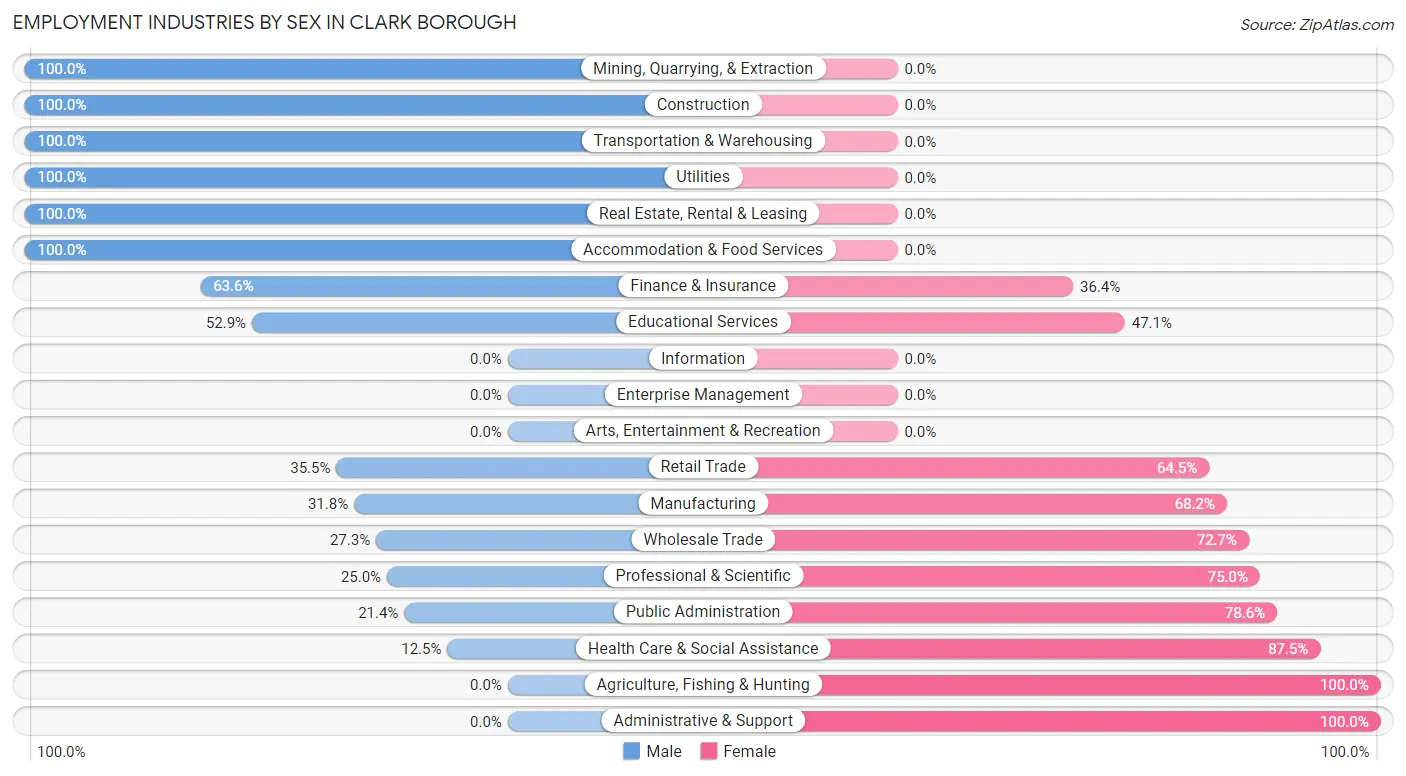
| Industry | Male | Female |
| Agriculture, Fishing & Hunting | 0 (0.0%) | 8 (100.0%) |
| Mining, Quarrying, & Extraction | 7 (100.0%) | 0 (0.0%) |
| Construction | 10 (100.0%) | 0 (0.0%) |
| Manufacturing | 7 (31.8%) | 15 (68.2%) |
| Wholesale Trade | 3 (27.3%) | 8 (72.7%) |
| Retail Trade | 11 (35.5%) | 20 (64.5%) |
| Transportation & Warehousing | 3 (100.0%) | 0 (0.0%) |
| Utilities | 2 (100.0%) | 0 (0.0%) |
| Information | 0 (0.0%) | 0 (0.0%) |
| Finance & Insurance | 7 (63.6%) | 4 (36.4%) |
| Real Estate, Rental & Leasing | 5 (100.0%) | 0 (0.0%) |
| Professional & Scientific | 5 (25.0%) | 15 (75.0%) |
| Enterprise Management | 0 (0.0%) | 0 (0.0%) |
| Administrative & Support | 0 (0.0%) | 8 (100.0%) |
| Educational Services | 9 (52.9%) | 8 (47.1%) |
| Health Care & Social Assistance | 5 (12.5%) | 35 (87.5%) |
| Arts, Entertainment & Recreation | 0 (0.0%) | 0 (0.0%) |
| Accommodation & Food Services | 8 (100.0%) | 0 (0.0%) |
| Public Administration | 3 (21.4%) | 11 (78.6%) |
| Total | 93 (40.3%) | 138 (59.7%) |
Education in Clark borough
School Enrollment in Clark borough
The most common levels of schooling among the 130 students in Clark borough are elementary school (46 | 35.4%), college / undergraduate (24 | 18.5%), and middle school (20 | 15.4%).
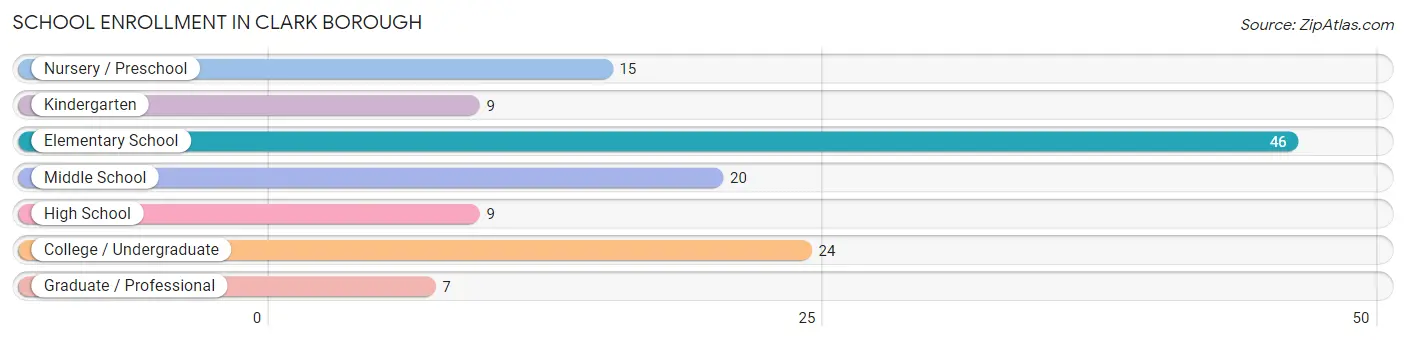
| School Level | # Students | % Students |
| Nursery / Preschool | 15 | 11.5% |
| Kindergarten | 9 | 6.9% |
| Elementary School | 46 | 35.4% |
| Middle School | 20 | 15.4% |
| High School | 9 | 6.9% |
| College / Undergraduate | 24 | 18.5% |
| Graduate / Professional | 7 | 5.4% |
| Total | 130 | 100.0% |
School Enrollment by Age by Funding Source in Clark borough
Out of a total of 130 students who are enrolled in schools in Clark borough, 11 (8.5%) attend a private institution, while the remaining 119 (91.5%) are enrolled in public schools. The age group of 25 to 34 year olds has the highest likelihood of being enrolled in private schools, with 2 (100.0% in the age bracket) enrolled. Conversely, the age group of 3 to 4 year olds has the lowest likelihood of being enrolled in a private school, with 2 (100.0% in the age bracket) attending a public institution.
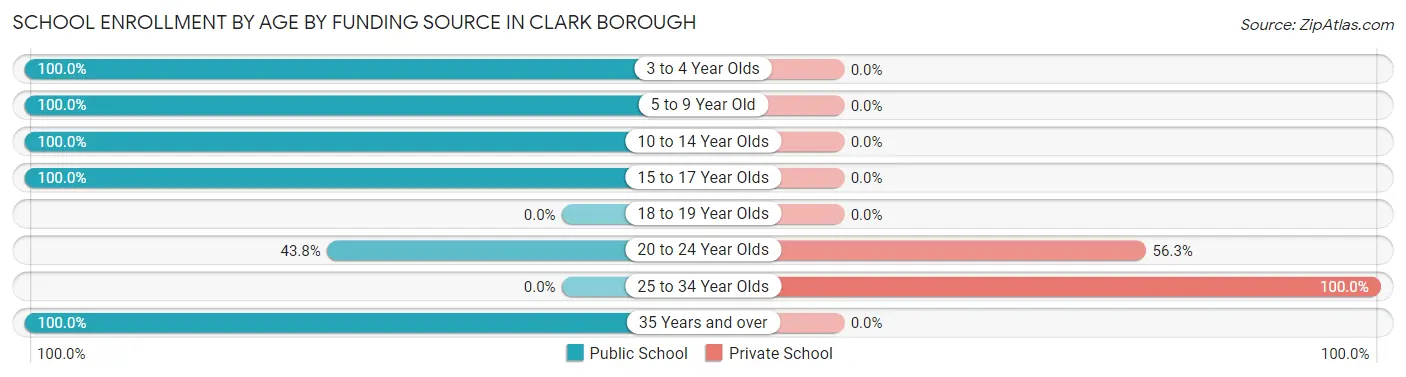
| Age Bracket | Public School | Private School |
| 3 to 4 Year Olds | 2 (100.0%) | 0 (0.0%) |
| 5 to 9 Year Old | 57 (100.0%) | 0 (0.0%) |
| 10 to 14 Year Olds | 35 (100.0%) | 0 (0.0%) |
| 15 to 17 Year Olds | 5 (100.0%) | 0 (0.0%) |
| 18 to 19 Year Olds | 0 (0.0%) | 0 (0.0%) |
| 20 to 24 Year Olds | 7 (43.8%) | 9 (56.2%) |
| 25 to 34 Year Olds | 0 (0.0%) | 2 (100.0%) |
| 35 Years and over | 13 (100.0%) | 0 (0.0%) |
| Total | 119 (91.5%) | 11 (8.5%) |
Educational Attainment by Field of Study in Clark borough
Education (47 | 32.9%), business (25 | 17.5%), science & technology (23 | 16.1%), bio, nature & agricultural (12 | 8.4%), and computers & mathematics (9 | 6.3%) are the most common fields of study among 143 individuals in Clark borough who have obtained a bachelor's degree or higher.
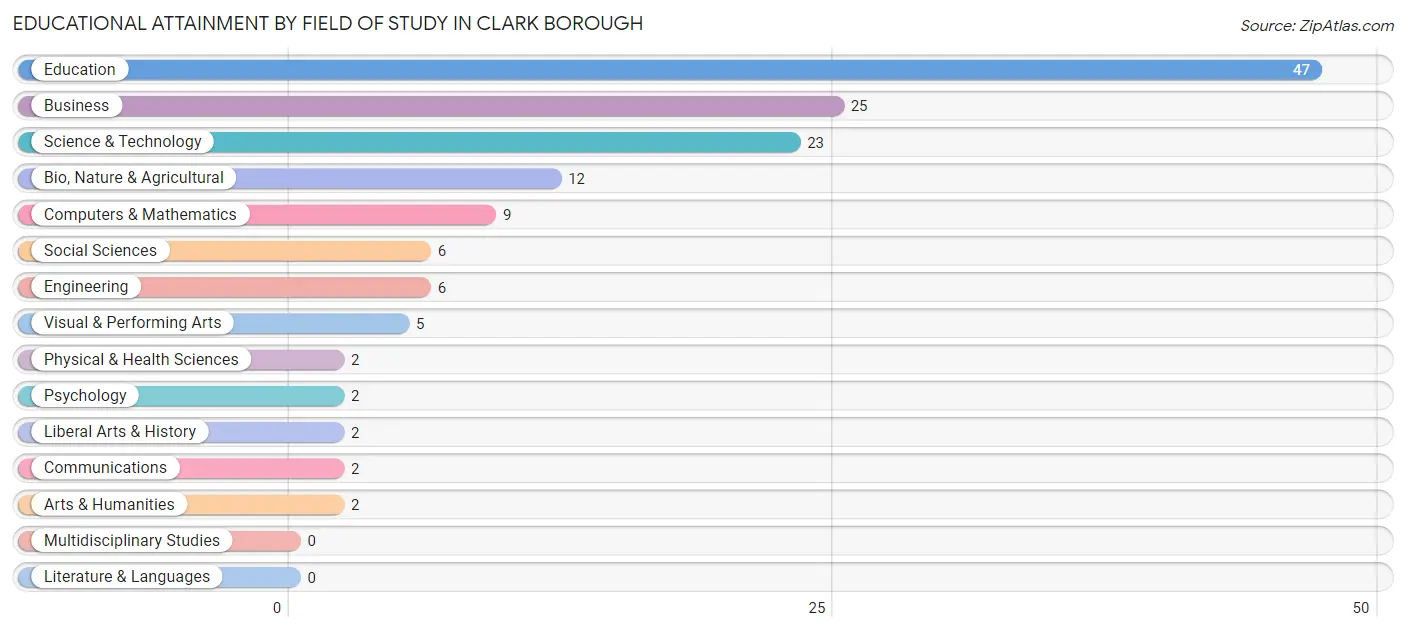
| Field of Study | # Graduates | % Graduates |
| Computers & Mathematics | 9 | 6.3% |
| Bio, Nature & Agricultural | 12 | 8.4% |
| Physical & Health Sciences | 2 | 1.4% |
| Psychology | 2 | 1.4% |
| Social Sciences | 6 | 4.2% |
| Engineering | 6 | 4.2% |
| Multidisciplinary Studies | 0 | 0.0% |
| Science & Technology | 23 | 16.1% |
| Business | 25 | 17.5% |
| Education | 47 | 32.9% |
| Literature & Languages | 0 | 0.0% |
| Liberal Arts & History | 2 | 1.4% |
| Visual & Performing Arts | 5 | 3.5% |
| Communications | 2 | 1.4% |
| Arts & Humanities | 2 | 1.4% |
| Total | 143 | 100.0% |
Transportation & Commute in Clark borough
Vehicle Availability by Sex in Clark borough
The most prevalent vehicle ownership categories in Clark borough are males with 2 vehicles (52, accounting for 55.9%) and females with 2 vehicles (69, making up 38.2%).
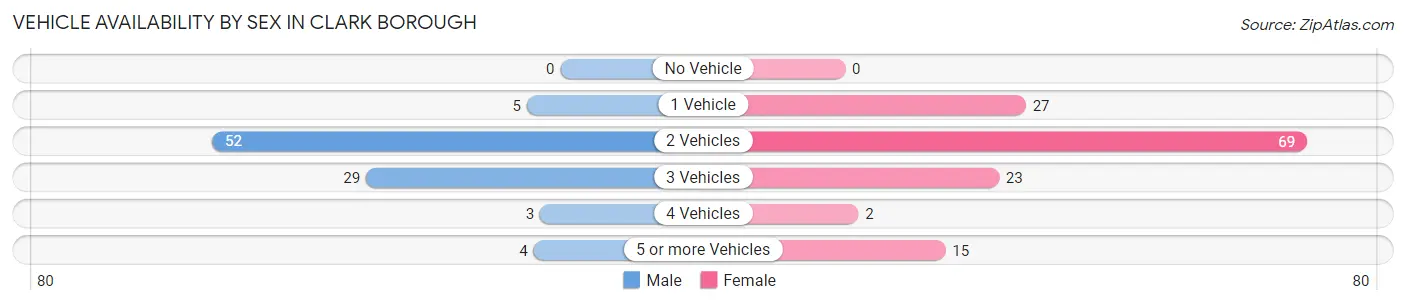
| Vehicles Available | Male | Female |
| No Vehicle | 0 (0.0%) | 0 (0.0%) |
| 1 Vehicle | 5 (5.4%) | 27 (19.9%) |
| 2 Vehicles | 52 (55.9%) | 69 (50.7%) |
| 3 Vehicles | 29 (31.2%) | 23 (16.9%) |
| 4 Vehicles | 3 (3.2%) | 2 (1.5%) |
| 5 or more Vehicles | 4 (4.3%) | 15 (11.0%) |
| Total | 93 (100.0%) | 136 (100.0%) |
Commute Time in Clark borough
The most frequently occuring commute durations in Clark borough are 10 to 14 minutes (55 commuters, 27.5%), 20 to 24 minutes (36 commuters, 18.0%), and 5 to 9 minutes (29 commuters, 14.5%).
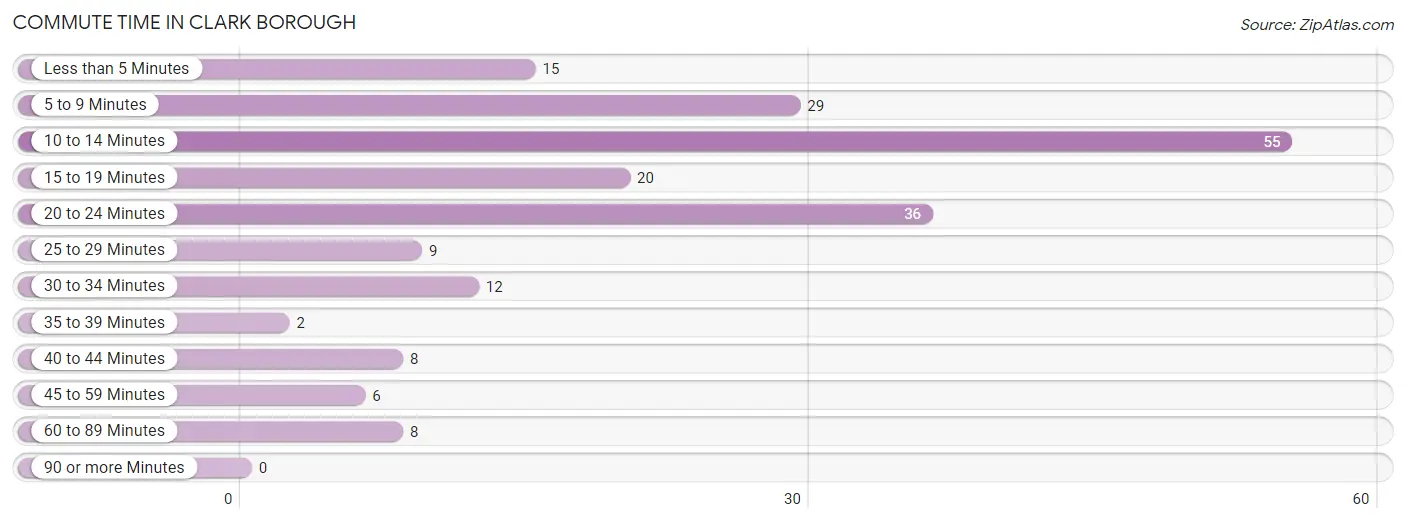
| Commute Time | # Commuters | % Commuters |
| Less than 5 Minutes | 15 | 7.5% |
| 5 to 9 Minutes | 29 | 14.5% |
| 10 to 14 Minutes | 55 | 27.5% |
| 15 to 19 Minutes | 20 | 10.0% |
| 20 to 24 Minutes | 36 | 18.0% |
| 25 to 29 Minutes | 9 | 4.5% |
| 30 to 34 Minutes | 12 | 6.0% |
| 35 to 39 Minutes | 2 | 1.0% |
| 40 to 44 Minutes | 8 | 4.0% |
| 45 to 59 Minutes | 6 | 3.0% |
| 60 to 89 Minutes | 8 | 4.0% |
| 90 or more Minutes | 0 | 0.0% |
Commute Time by Sex in Clark borough
The most common commute times in Clark borough are 10 to 14 minutes (29 commuters, 36.2%) for males and 5 to 9 minutes (29 commuters, 24.2%) for females.
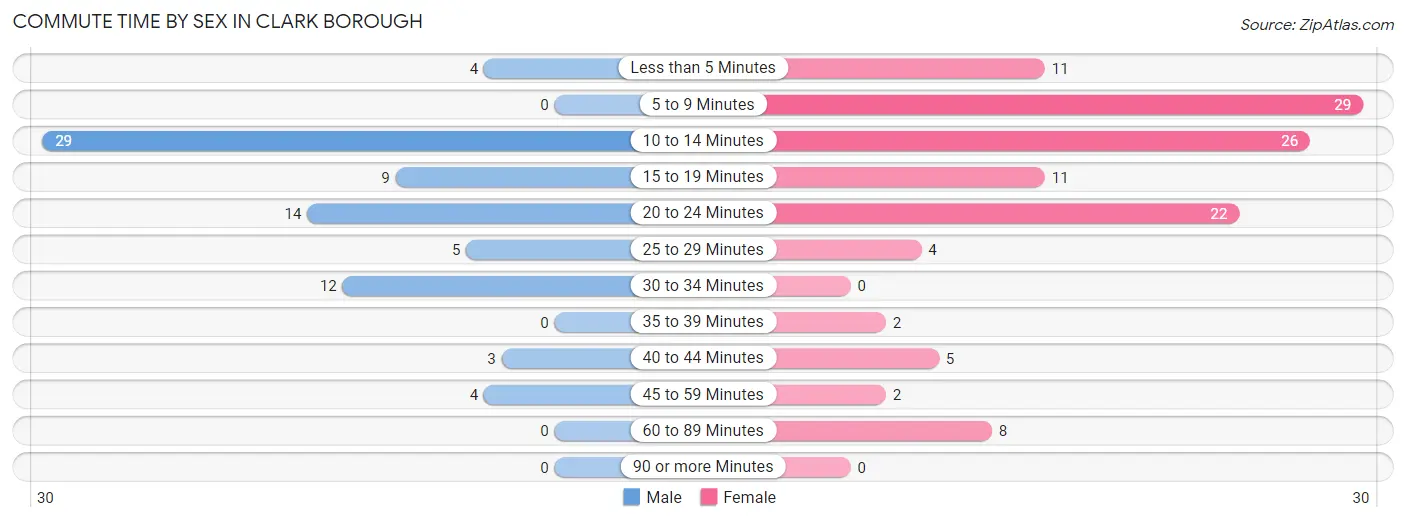
| Commute Time | Male | Female |
| Less than 5 Minutes | 4 (5.0%) | 11 (9.2%) |
| 5 to 9 Minutes | 0 (0.0%) | 29 (24.2%) |
| 10 to 14 Minutes | 29 (36.2%) | 26 (21.7%) |
| 15 to 19 Minutes | 9 (11.3%) | 11 (9.2%) |
| 20 to 24 Minutes | 14 (17.5%) | 22 (18.3%) |
| 25 to 29 Minutes | 5 (6.2%) | 4 (3.3%) |
| 30 to 34 Minutes | 12 (15.0%) | 0 (0.0%) |
| 35 to 39 Minutes | 0 (0.0%) | 2 (1.7%) |
| 40 to 44 Minutes | 3 (3.7%) | 5 (4.2%) |
| 45 to 59 Minutes | 4 (5.0%) | 2 (1.7%) |
| 60 to 89 Minutes | 0 (0.0%) | 8 (6.7%) |
| 90 or more Minutes | 0 (0.0%) | 0 (0.0%) |
Time of Departure to Work by Sex in Clark borough
The most frequent times of departure to work in Clark borough are 7:00 AM to 7:29 AM (21, 26.3%) for males and 8:00 AM to 8:29 AM (38, 31.7%) for females.
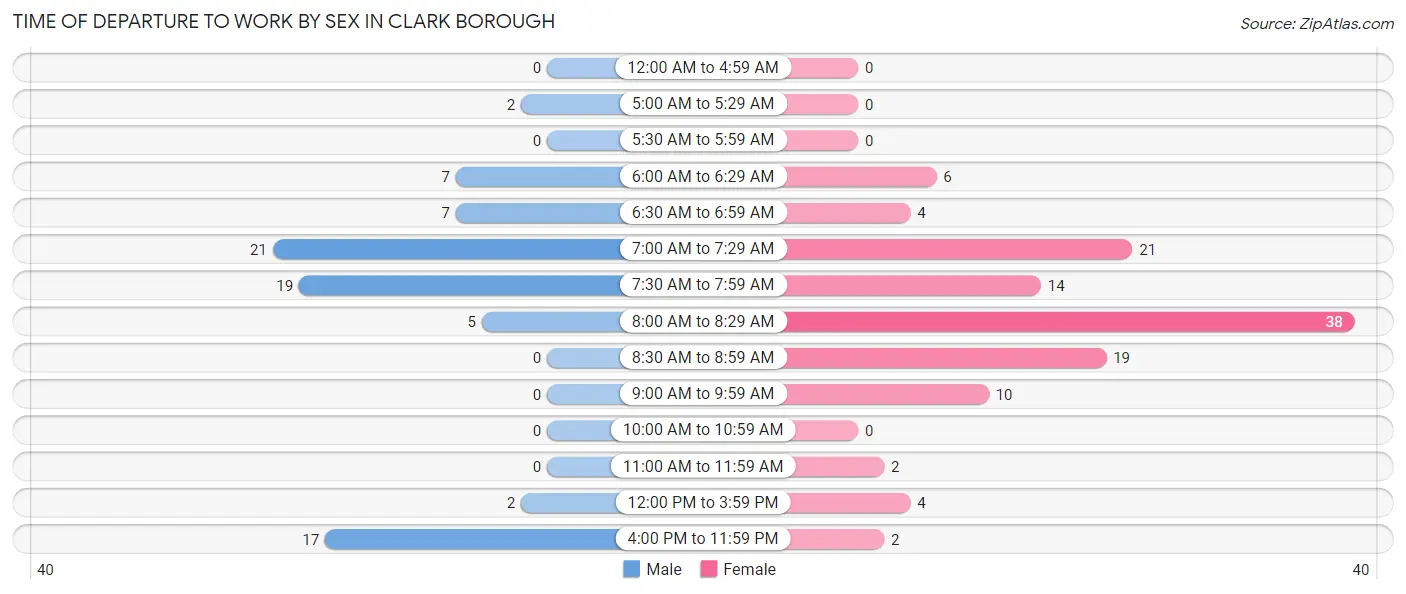
| Time of Departure | Male | Female |
| 12:00 AM to 4:59 AM | 0 (0.0%) | 0 (0.0%) |
| 5:00 AM to 5:29 AM | 2 (2.5%) | 0 (0.0%) |
| 5:30 AM to 5:59 AM | 0 (0.0%) | 0 (0.0%) |
| 6:00 AM to 6:29 AM | 7 (8.7%) | 6 (5.0%) |
| 6:30 AM to 6:59 AM | 7 (8.7%) | 4 (3.3%) |
| 7:00 AM to 7:29 AM | 21 (26.3%) | 21 (17.5%) |
| 7:30 AM to 7:59 AM | 19 (23.7%) | 14 (11.7%) |
| 8:00 AM to 8:29 AM | 5 (6.2%) | 38 (31.7%) |
| 8:30 AM to 8:59 AM | 0 (0.0%) | 19 (15.8%) |
| 9:00 AM to 9:59 AM | 0 (0.0%) | 10 (8.3%) |
| 10:00 AM to 10:59 AM | 0 (0.0%) | 0 (0.0%) |
| 11:00 AM to 11:59 AM | 0 (0.0%) | 2 (1.7%) |
| 12:00 PM to 3:59 PM | 2 (2.5%) | 4 (3.3%) |
| 4:00 PM to 11:59 PM | 17 (21.2%) | 2 (1.7%) |
| Total | 80 (100.0%) | 120 (100.0%) |
Housing Occupancy in Clark borough
Occupancy by Ownership in Clark borough
Of the total 227 dwellings in Clark borough, owner-occupied units account for 203 (89.4%), while renter-occupied units make up 24 (10.6%).
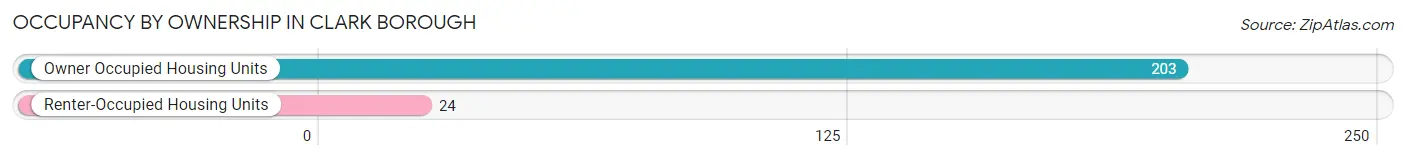
| Occupancy | # Housing Units | % Housing Units |
| Owner Occupied Housing Units | 203 | 89.4% |
| Renter-Occupied Housing Units | 24 | 10.6% |
| Total Occupied Housing Units | 227 | 100.0% |
Occupancy by Household Size in Clark borough
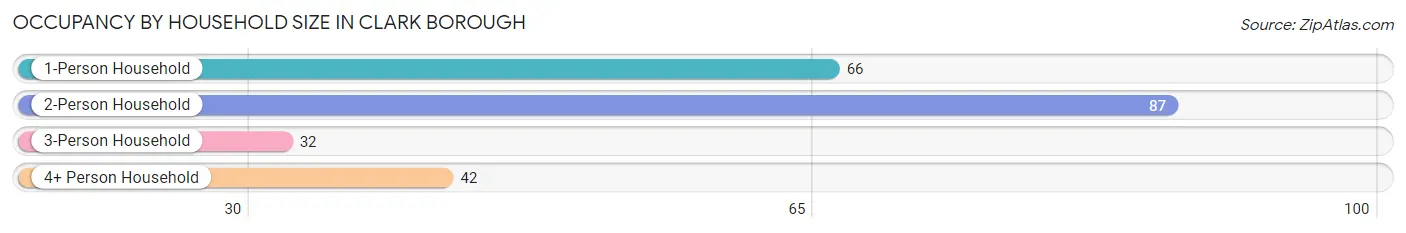
| Household Size | # Housing Units | % Housing Units |
| 1-Person Household | 66 | 29.1% |
| 2-Person Household | 87 | 38.3% |
| 3-Person Household | 32 | 14.1% |
| 4+ Person Household | 42 | 18.5% |
| Total Housing Units | 227 | 100.0% |
Occupancy by Ownership by Household Size in Clark borough
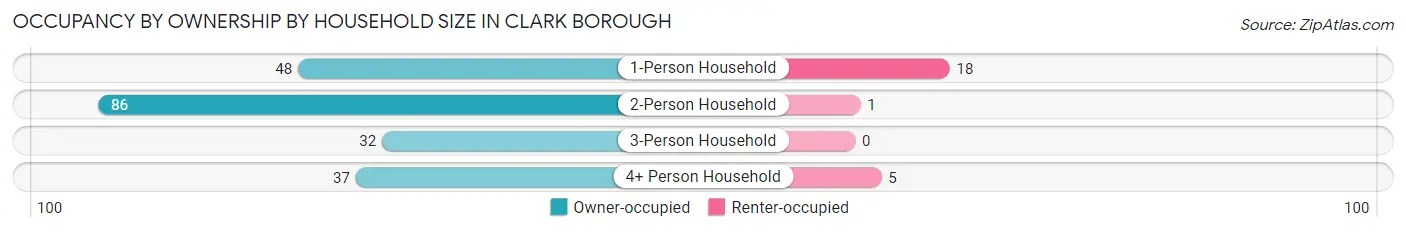
| Household Size | Owner-occupied | Renter-occupied |
| 1-Person Household | 48 (72.7%) | 18 (27.3%) |
| 2-Person Household | 86 (98.9%) | 1 (1.1%) |
| 3-Person Household | 32 (100.0%) | 0 (0.0%) |
| 4+ Person Household | 37 (88.1%) | 5 (11.9%) |
| Total Housing Units | 203 (89.4%) | 24 (10.6%) |
Occupancy by Educational Attainment in Clark borough
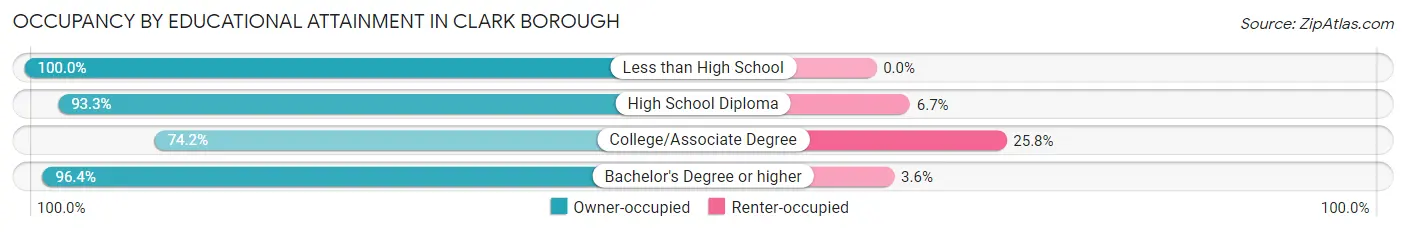
| Household Size | Owner-occupied | Renter-occupied |
| Less than High School | 6 (100.0%) | 0 (0.0%) |
| High School Diploma | 70 (93.3%) | 5 (6.7%) |
| College/Associate Degree | 46 (74.2%) | 16 (25.8%) |
| Bachelor's Degree or higher | 81 (96.4%) | 3 (3.6%) |
Occupancy by Age of Householder in Clark borough
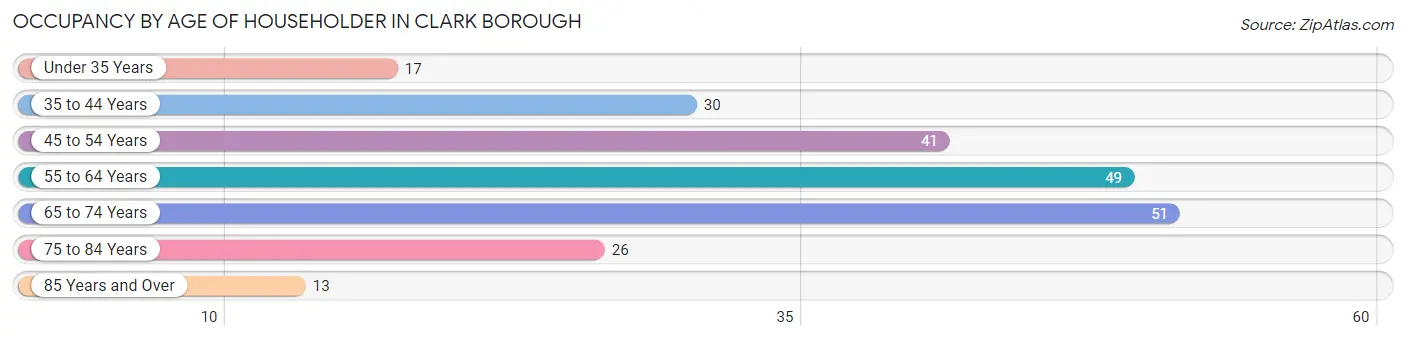
| Age Bracket | # Households | % Households |
| Under 35 Years | 17 | 7.5% |
| 35 to 44 Years | 30 | 13.2% |
| 45 to 54 Years | 41 | 18.1% |
| 55 to 64 Years | 49 | 21.6% |
| 65 to 74 Years | 51 | 22.5% |
| 75 to 84 Years | 26 | 11.5% |
| 85 Years and Over | 13 | 5.7% |
| Total | 227 | 100.0% |
Housing Finances in Clark borough
Median Income by Occupancy in Clark borough
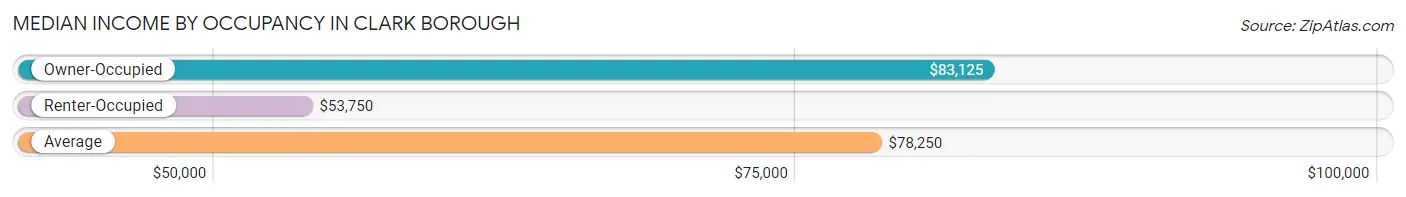
| Occupancy Type | # Households | Median Income |
| Owner-Occupied | 203 (89.4%) | $83,125 |
| Renter-Occupied | 24 (10.6%) | $53,750 |
| Average | 227 (100.0%) | $78,250 |
Occupancy by Householder Income Bracket in Clark borough
| Income Bracket | Owner-occupied | Renter-occupied |
| Less than $5,000 | 8 (3.9%) | 0 (0.0%) |
| $5,000 to $9,999 | 0 (0.0%) | 0 (0.0%) |
| $10,000 to $14,999 | 1 (0.5%) | 0 (0.0%) |
| $15,000 to $19,999 | 3 (1.5%) | 0 (0.0%) |
| $20,000 to $24,999 | 0 (0.0%) | 0 (0.0%) |
| $25,000 to $34,999 | 18 (8.9%) | 9 (37.5%) |
| $35,000 to $49,999 | 18 (8.9%) | 0 (0.0%) |
| $50,000 to $74,999 | 44 (21.7%) | 9 (37.5%) |
| $75,000 to $99,999 | 22 (10.8%) | 0 (0.0%) |
| $100,000 to $149,999 | 40 (19.7%) | 1 (4.2%) |
| $150,000 or more | 49 (24.1%) | 5 (20.8%) |
| Total | 203 (100.0%) | 24 (100.0%) |
Monthly Housing Cost Tiers in Clark borough
| Monthly Cost | Owner-occupied | Renter-occupied |
| Less than $300 | 6 (3.0%) | 0 (0.0%) |
| $300 to $499 | 29 (14.3%) | 0 (0.0%) |
| $500 to $799 | 47 (23.2%) | 6 (25.0%) |
| $800 to $999 | 29 (14.3%) | 0 (0.0%) |
| $1,000 to $1,499 | 43 (21.2%) | 9 (37.5%) |
| $1,500 to $1,999 | 33 (16.3%) | 0 (0.0%) |
| $2,000 to $2,499 | 9 (4.4%) | 0 (0.0%) |
| $2,500 to $2,999 | 4 (2.0%) | 0 (0.0%) |
| $3,000 or more | 3 (1.5%) | 0 (0.0%) |
| Total | 203 (100.0%) | 24 (100.0%) |
Physical Housing Characteristics in Clark borough
Housing Structures in Clark borough
| Structure Type | # Housing Units | % Housing Units |
| Single Unit, Detached | 218 | 96.0% |
| Single Unit, Attached | 0 | 0.0% |
| 2 Unit Apartments | 0 | 0.0% |
| 3 or 4 Unit Apartments | 0 | 0.0% |
| 5 to 9 Unit Apartments | 6 | 2.6% |
| 10 or more Apartments | 0 | 0.0% |
| Mobile Home / Other | 3 | 1.3% |
| Total | 227 | 100.0% |
Housing Structures by Occupancy in Clark borough
| Structure Type | Owner-occupied | Renter-occupied |
| Single Unit, Detached | 200 (91.7%) | 18 (8.3%) |
| Single Unit, Attached | 0 (0.0%) | 0 (0.0%) |
| 2 Unit Apartments | 0 (0.0%) | 0 (0.0%) |
| 3 or 4 Unit Apartments | 0 (0.0%) | 0 (0.0%) |
| 5 to 9 Unit Apartments | 0 (0.0%) | 6 (100.0%) |
| 10 or more Apartments | 0 (0.0%) | 0 (0.0%) |
| Mobile Home / Other | 3 (100.0%) | 0 (0.0%) |
| Total | 203 (89.4%) | 24 (10.6%) |
Housing Structures by Number of Rooms in Clark borough
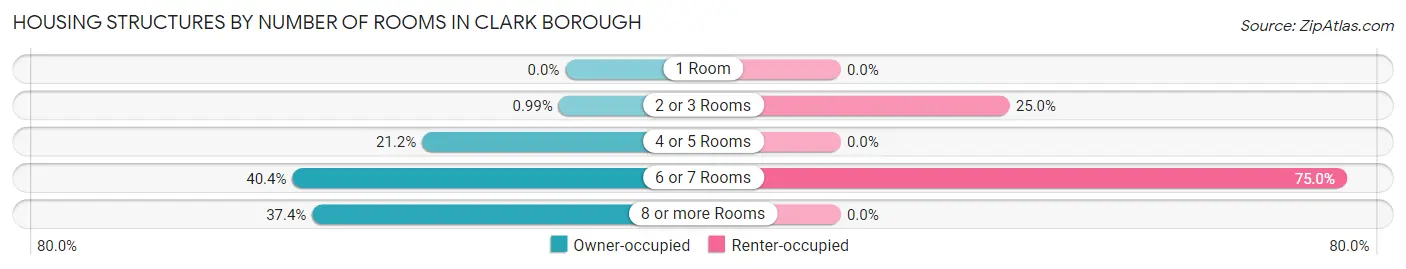
| Number of Rooms | Owner-occupied | Renter-occupied |
| 1 Room | 0 (0.0%) | 0 (0.0%) |
| 2 or 3 Rooms | 2 (1.0%) | 6 (25.0%) |
| 4 or 5 Rooms | 43 (21.2%) | 0 (0.0%) |
| 6 or 7 Rooms | 82 (40.4%) | 18 (75.0%) |
| 8 or more Rooms | 76 (37.4%) | 0 (0.0%) |
| Total | 203 (100.0%) | 24 (100.0%) |
Housing Structure by Heating Type in Clark borough
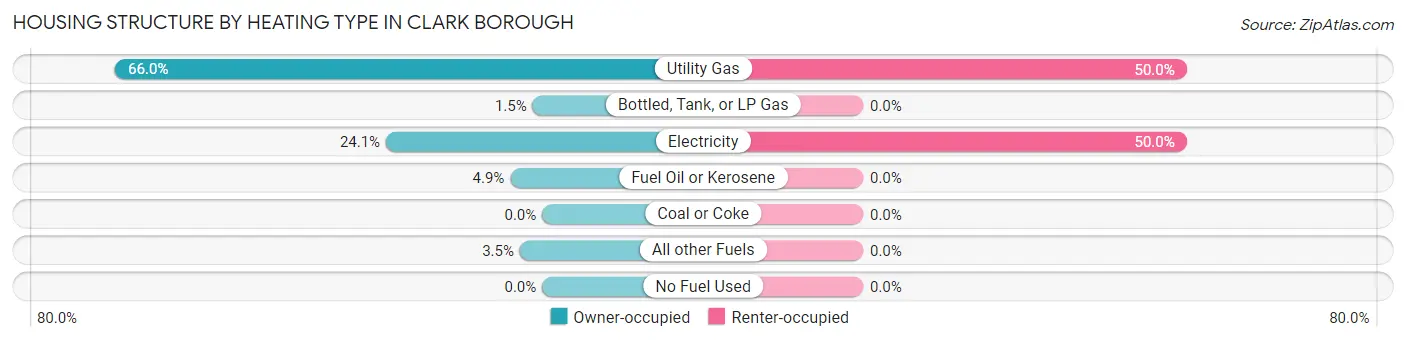
| Heating Type | Owner-occupied | Renter-occupied |
| Utility Gas | 134 (66.0%) | 12 (50.0%) |
| Bottled, Tank, or LP Gas | 3 (1.5%) | 0 (0.0%) |
| Electricity | 49 (24.1%) | 12 (50.0%) |
| Fuel Oil or Kerosene | 10 (4.9%) | 0 (0.0%) |
| Coal or Coke | 0 (0.0%) | 0 (0.0%) |
| All other Fuels | 7 (3.5%) | 0 (0.0%) |
| No Fuel Used | 0 (0.0%) | 0 (0.0%) |
| Total | 203 (100.0%) | 24 (100.0%) |
Household Vehicle Usage in Clark borough
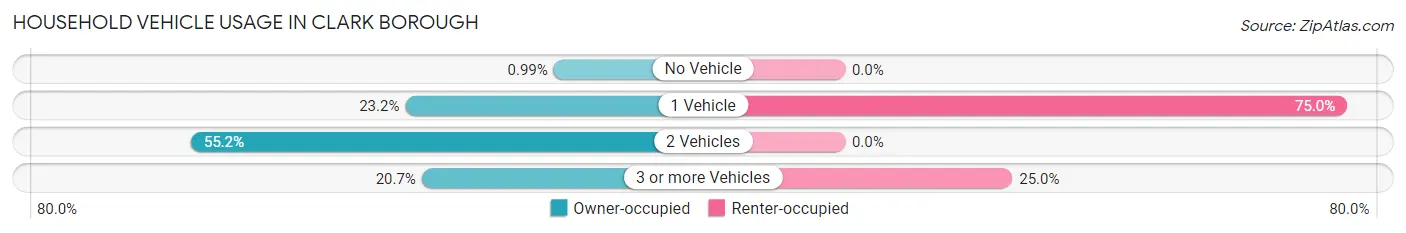
| Vehicles per Household | Owner-occupied | Renter-occupied |
| No Vehicle | 2 (1.0%) | 0 (0.0%) |
| 1 Vehicle | 47 (23.2%) | 18 (75.0%) |
| 2 Vehicles | 112 (55.2%) | 0 (0.0%) |
| 3 or more Vehicles | 42 (20.7%) | 6 (25.0%) |
| Total | 203 (100.0%) | 24 (100.0%) |
Real Estate & Mortgages in Clark borough
Real Estate and Mortgage Overview in Clark borough
| Characteristic | Without Mortgage | With Mortgage |
| Housing Units | 93 | 110 |
| Median Property Value | $196,900 | $226,900 |
| Median Household Income | $67,813 | $45 |
| Monthly Housing Costs | $572 | $3 |
| Real Estate Taxes | $2,690 | $0 |
Property Value by Mortgage Status in Clark borough
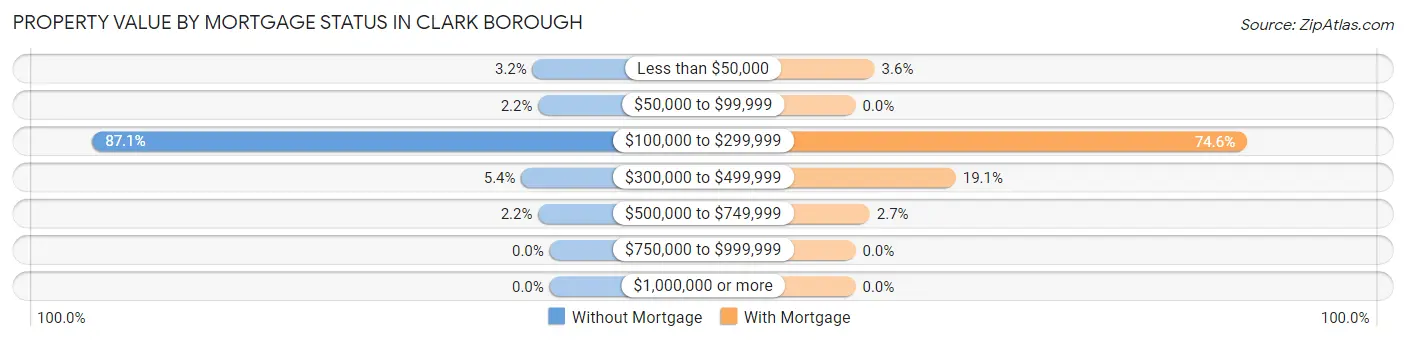
| Property Value | Without Mortgage | With Mortgage |
| Less than $50,000 | 3 (3.2%) | 4 (3.6%) |
| $50,000 to $99,999 | 2 (2.1%) | 0 (0.0%) |
| $100,000 to $299,999 | 81 (87.1%) | 82 (74.6%) |
| $300,000 to $499,999 | 5 (5.4%) | 21 (19.1%) |
| $500,000 to $749,999 | 2 (2.1%) | 3 (2.7%) |
| $750,000 to $999,999 | 0 (0.0%) | 0 (0.0%) |
| $1,000,000 or more | 0 (0.0%) | 0 (0.0%) |
| Total | 93 (100.0%) | 110 (100.0%) |
Household Income by Mortgage Status in Clark borough
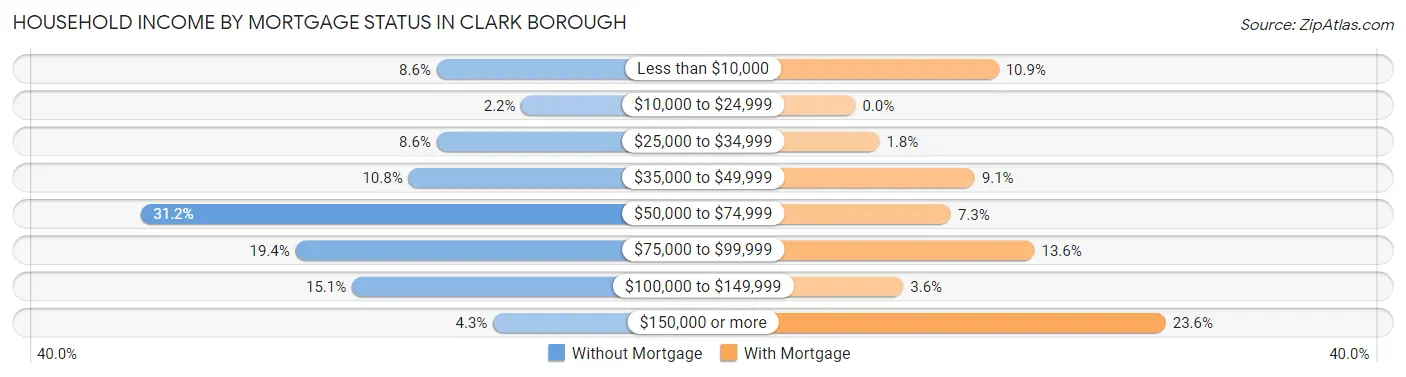
| Household Income | Without Mortgage | With Mortgage |
| Less than $10,000 | 8 (8.6%) | 12 (10.9%) |
| $10,000 to $24,999 | 2 (2.1%) | 0 (0.0%) |
| $25,000 to $34,999 | 8 (8.6%) | 2 (1.8%) |
| $35,000 to $49,999 | 10 (10.7%) | 10 (9.1%) |
| $50,000 to $74,999 | 29 (31.2%) | 8 (7.3%) |
| $75,000 to $99,999 | 18 (19.4%) | 15 (13.6%) |
| $100,000 to $149,999 | 14 (15.0%) | 4 (3.6%) |
| $150,000 or more | 4 (4.3%) | 26 (23.6%) |
| Total | 93 (100.0%) | 110 (100.0%) |
Property Value to Household Income Ratio in Clark borough
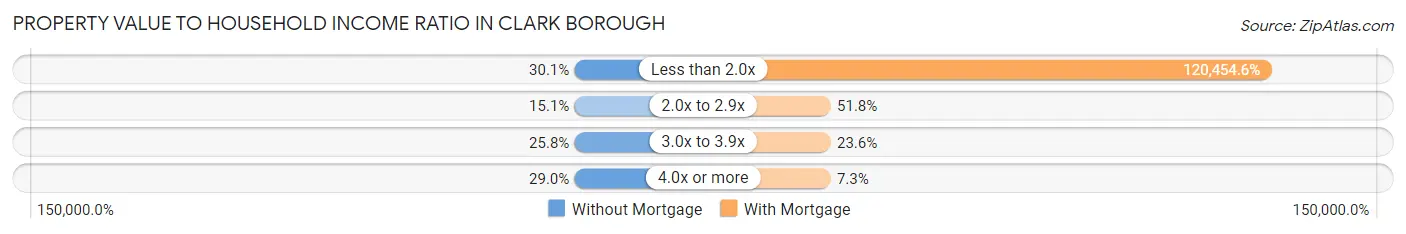
| Value-to-Income Ratio | Without Mortgage | With Mortgage |
| Less than 2.0x | 28 (30.1%) | 132,500 (120,454.5%) |
| 2.0x to 2.9x | 14 (15.0%) | 57 (51.8%) |
| 3.0x to 3.9x | 24 (25.8%) | 26 (23.6%) |
| 4.0x or more | 27 (29.0%) | 8 (7.3%) |
| Total | 93 (100.0%) | 110 (100.0%) |
Real Estate Taxes by Mortgage Status in Clark borough
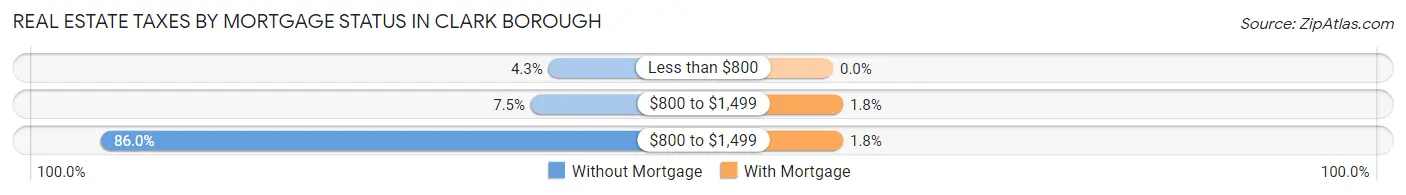
| Property Taxes | Without Mortgage | With Mortgage |
| Less than $800 | 4 (4.3%) | 0 (0.0%) |
| $800 to $1,499 | 7 (7.5%) | 2 (1.8%) |
| $800 to $1,499 | 80 (86.0%) | 2 (1.8%) |
| Total | 93 (100.0%) | 110 (100.0%) |
Health & Disability in Clark borough
Health Insurance Coverage by Age in Clark borough
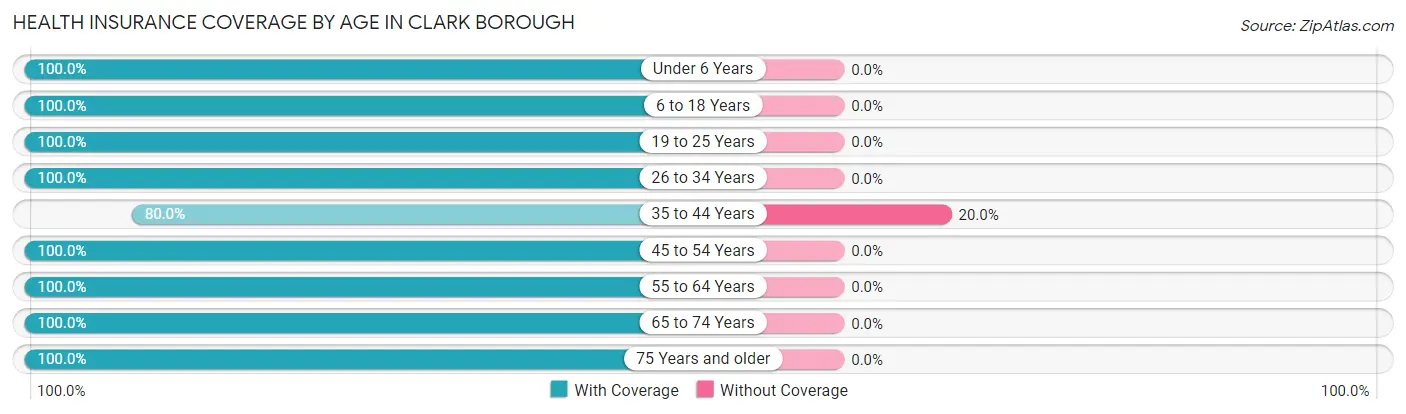
| Age Bracket | With Coverage | Without Coverage |
| Under 6 Years | 40 (100.0%) | 0 (0.0%) |
| 6 to 18 Years | 83 (100.0%) | 0 (0.0%) |
| 19 to 25 Years | 34 (100.0%) | 0 (0.0%) |
| 26 to 34 Years | 41 (100.0%) | 0 (0.0%) |
| 35 to 44 Years | 64 (80.0%) | 16 (20.0%) |
| 45 to 54 Years | 59 (100.0%) | 0 (0.0%) |
| 55 to 64 Years | 87 (100.0%) | 0 (0.0%) |
| 65 to 74 Years | 91 (100.0%) | 0 (0.0%) |
| 75 Years and older | 62 (100.0%) | 0 (0.0%) |
| Total | 561 (97.2%) | 16 (2.8%) |
Health Insurance Coverage by Citizenship Status in Clark borough
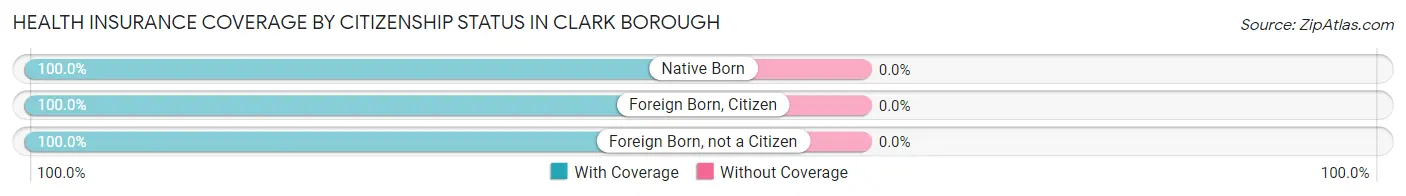
| Citizenship Status | With Coverage | Without Coverage |
| Native Born | 40 (100.0%) | 0 (0.0%) |
| Foreign Born, Citizen | 83 (100.0%) | 0 (0.0%) |
| Foreign Born, not a Citizen | 34 (100.0%) | 0 (0.0%) |
Health Insurance Coverage by Household Income in Clark borough
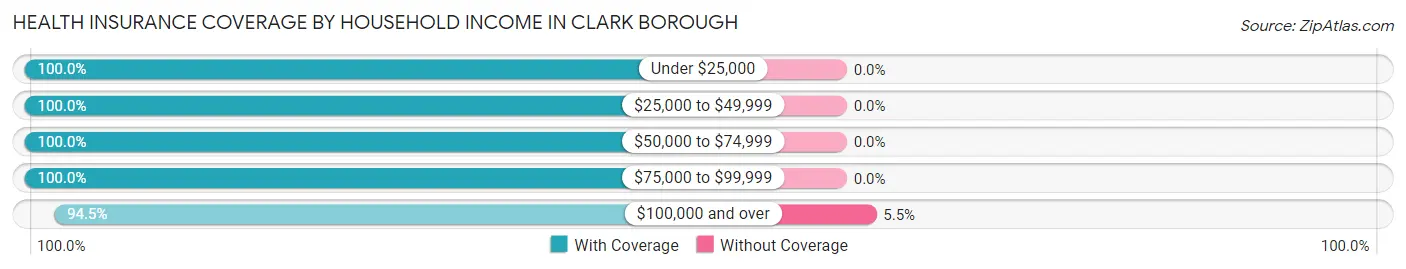
| Household Income | With Coverage | Without Coverage |
| Under $25,000 | 17 (100.0%) | 0 (0.0%) |
| $25,000 to $49,999 | 61 (100.0%) | 0 (0.0%) |
| $50,000 to $74,999 | 162 (100.0%) | 0 (0.0%) |
| $75,000 to $99,999 | 48 (100.0%) | 0 (0.0%) |
| $100,000 and over | 273 (94.5%) | 16 (5.5%) |
Public vs Private Health Insurance Coverage by Age in Clark borough
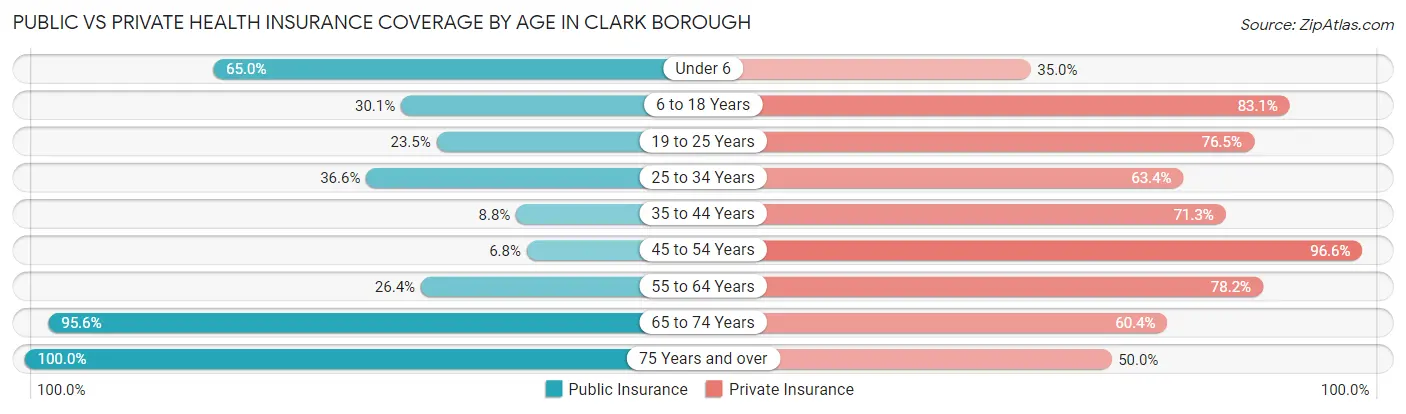
| Age Bracket | Public Insurance | Private Insurance |
| Under 6 | 26 (65.0%) | 14 (35.0%) |
| 6 to 18 Years | 25 (30.1%) | 69 (83.1%) |
| 19 to 25 Years | 8 (23.5%) | 26 (76.5%) |
| 25 to 34 Years | 15 (36.6%) | 26 (63.4%) |
| 35 to 44 Years | 7 (8.7%) | 57 (71.3%) |
| 45 to 54 Years | 4 (6.8%) | 57 (96.6%) |
| 55 to 64 Years | 23 (26.4%) | 68 (78.2%) |
| 65 to 74 Years | 87 (95.6%) | 55 (60.4%) |
| 75 Years and over | 62 (100.0%) | 31 (50.0%) |
| Total | 257 (44.5%) | 403 (69.8%) |
Disability Status by Sex by Age in Clark borough
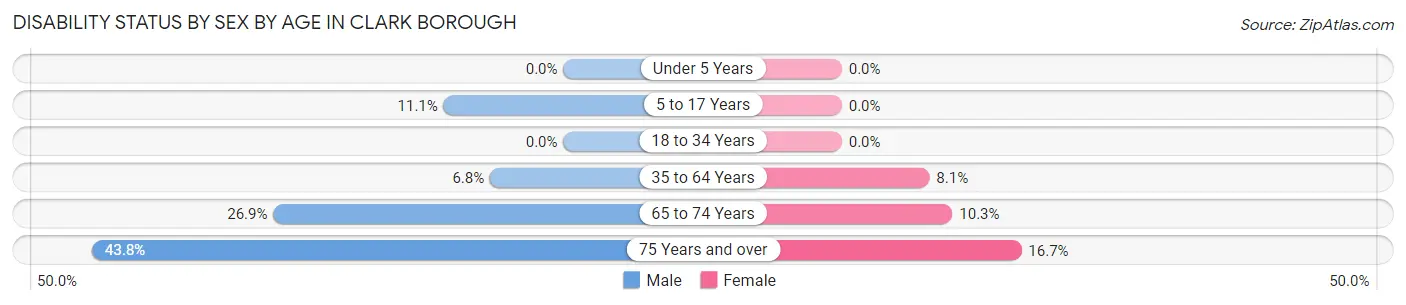
| Age Bracket | Male | Female |
| Under 5 Years | 0 (0.0%) | 0 (0.0%) |
| 5 to 17 Years | 5 (11.1%) | 0 (0.0%) |
| 18 to 34 Years | 0 (0.0%) | 0 (0.0%) |
| 35 to 64 Years | 7 (6.8%) | 10 (8.1%) |
| 65 to 74 Years | 14 (26.9%) | 4 (10.3%) |
| 75 Years and over | 14 (43.8%) | 5 (16.7%) |
Disability Class by Sex by Age in Clark borough
Disability Class: Hearing Difficulty
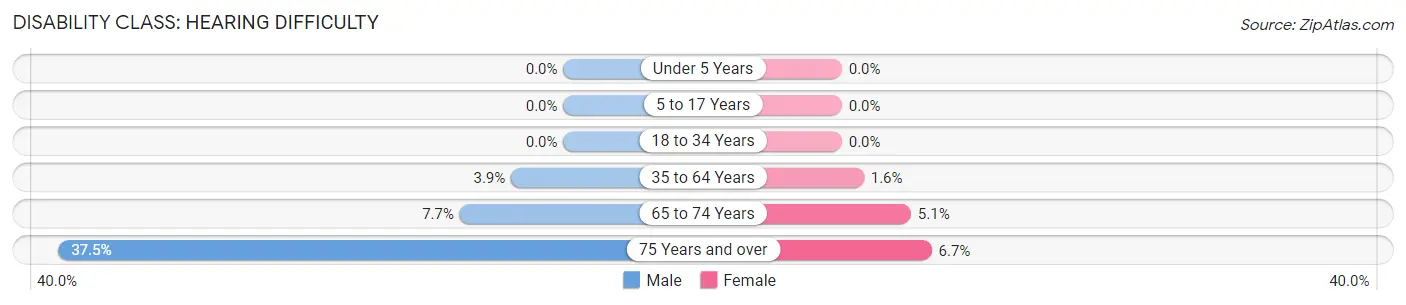
| Age Bracket | Male | Female |
| Under 5 Years | 0 (0.0%) | 0 (0.0%) |
| 5 to 17 Years | 0 (0.0%) | 0 (0.0%) |
| 18 to 34 Years | 0 (0.0%) | 0 (0.0%) |
| 35 to 64 Years | 4 (3.9%) | 2 (1.6%) |
| 65 to 74 Years | 4 (7.7%) | 2 (5.1%) |
| 75 Years and over | 12 (37.5%) | 2 (6.7%) |
Disability Class: Vision Difficulty
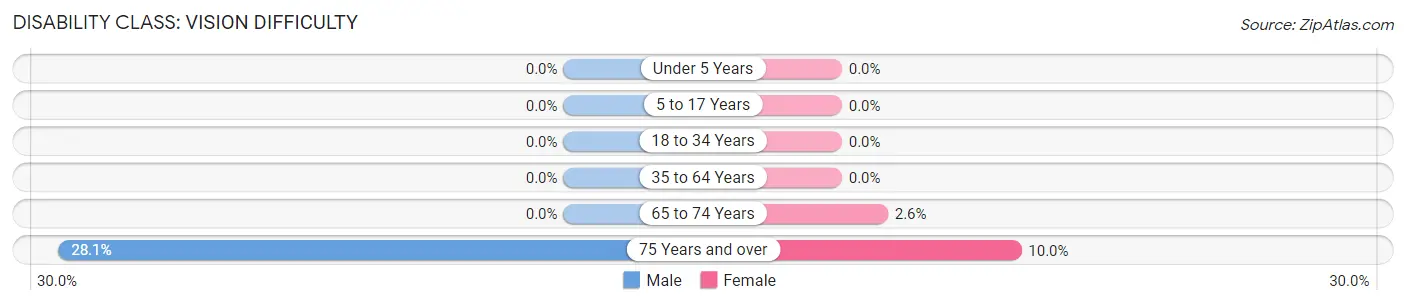
| Age Bracket | Male | Female |
| Under 5 Years | 0 (0.0%) | 0 (0.0%) |
| 5 to 17 Years | 0 (0.0%) | 0 (0.0%) |
| 18 to 34 Years | 0 (0.0%) | 0 (0.0%) |
| 35 to 64 Years | 0 (0.0%) | 0 (0.0%) |
| 65 to 74 Years | 0 (0.0%) | 1 (2.6%) |
| 75 Years and over | 9 (28.1%) | 3 (10.0%) |
Disability Class: Cognitive Difficulty
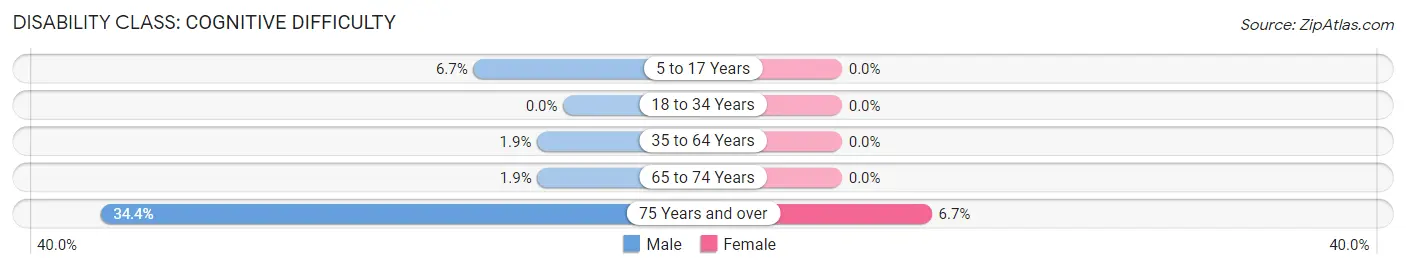
| Age Bracket | Male | Female |
| 5 to 17 Years | 3 (6.7%) | 0 (0.0%) |
| 18 to 34 Years | 0 (0.0%) | 0 (0.0%) |
| 35 to 64 Years | 2 (1.9%) | 0 (0.0%) |
| 65 to 74 Years | 1 (1.9%) | 0 (0.0%) |
| 75 Years and over | 11 (34.4%) | 2 (6.7%) |
Disability Class: Ambulatory Difficulty
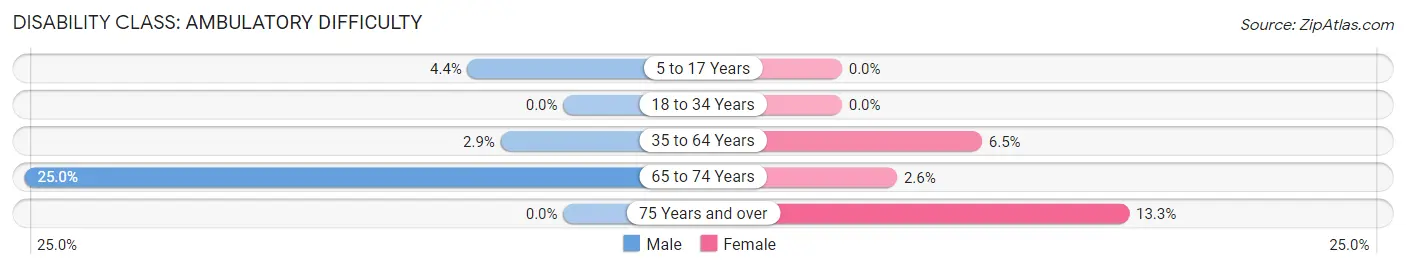
| Age Bracket | Male | Female |
| 5 to 17 Years | 2 (4.4%) | 0 (0.0%) |
| 18 to 34 Years | 0 (0.0%) | 0 (0.0%) |
| 35 to 64 Years | 3 (2.9%) | 8 (6.5%) |
| 65 to 74 Years | 13 (25.0%) | 1 (2.6%) |
| 75 Years and over | 0 (0.0%) | 4 (13.3%) |
Disability Class: Self-Care Difficulty
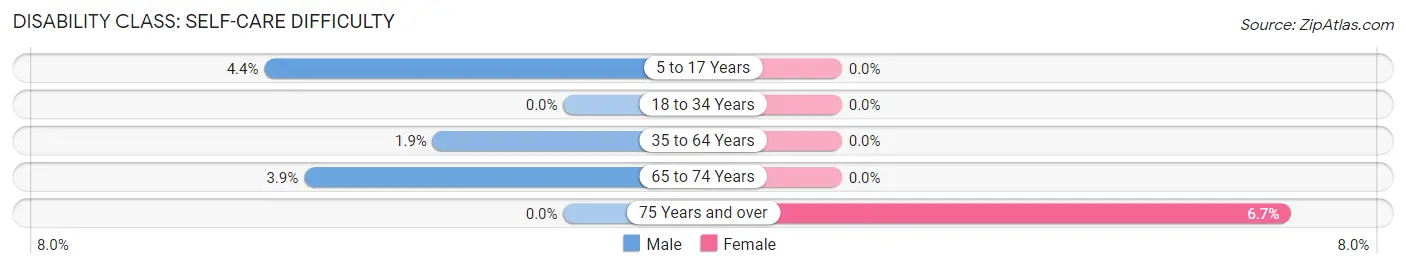
| Age Bracket | Male | Female |
| 5 to 17 Years | 2 (4.4%) | 0 (0.0%) |
| 18 to 34 Years | 0 (0.0%) | 0 (0.0%) |
| 35 to 64 Years | 2 (1.9%) | 0 (0.0%) |
| 65 to 74 Years | 2 (3.8%) | 0 (0.0%) |
| 75 Years and over | 0 (0.0%) | 2 (6.7%) |
Technology Access in Clark borough
Computing Device Access in Clark borough
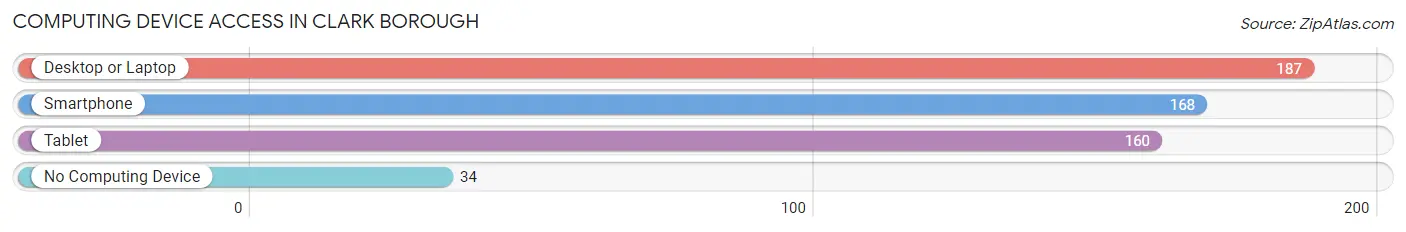
| Device Type | # Households | % Households |
| Desktop or Laptop | 187 | 82.4% |
| Smartphone | 168 | 74.0% |
| Tablet | 160 | 70.5% |
| No Computing Device | 34 | 15.0% |
| Total | 227 | 100.0% |
Internet Access in Clark borough
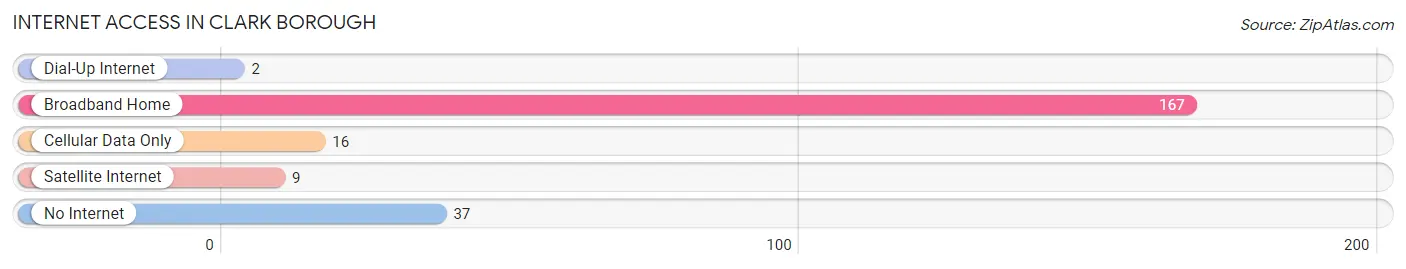
| Internet Type | # Households | % Households |
| Dial-Up Internet | 2 | 0.9% |
| Broadband Home | 167 | 73.6% |
| Cellular Data Only | 16 | 7.0% |
| Satellite Internet | 9 | 4.0% |
| No Internet | 37 | 16.3% |
| Total | 227 | 100.0% |
Clark borough Summary
History
The borough of Clark is located in Allegheny County, Pennsylvania, and is a suburb of Pittsburgh. The area was first settled in the late 1700s by a group of German immigrants, and the town was officially incorporated in 1868. The town was named after the Clark family, who were among the first settlers in the area.
The town of Clark was originally a farming community, and the main crops grown were wheat, corn, and oats. The town also had a few small businesses, such as a blacksmith shop, a general store, and a sawmill.
In the late 1800s, the town began to grow and develop. The railroad was extended to Clark in 1883, and this allowed for the transportation of goods and people to and from the town. This led to the growth of the town, as more people moved to the area to take advantage of the new transportation options.
The town continued to grow and develop throughout the 20th century. In the 1950s, the town was annexed by the city of Pittsburgh, and this allowed for further growth and development. The town also saw an influx of new residents, as many people moved to the area to take advantage of the city’s amenities.
Today, Clark is a thriving suburb of Pittsburgh. The town has a population of approximately 4,000 people, and it is home to a variety of businesses, including restaurants, shops, and other services. The town also has a number of parks and recreational areas, as well as a public library.
Geography
Clark is located in Allegheny County, Pennsylvania, and is a suburb of Pittsburgh. The town is situated on the Allegheny River, and it is bordered by the towns of Ross Township, McCandless Township, and Shaler Township. The town covers an area of approximately 1.5 square miles, and it has a population of approximately 4,000 people.
The town of Clark is located in a hilly region, and the terrain is mostly wooded. The town is located in a temperate climate, and the average temperature in the summer is around 75 degrees Fahrenheit, while the average temperature in the winter is around 35 degrees Fahrenheit.
Economy
The economy of Clark is largely based on the service industry. The town is home to a variety of restaurants, shops, and other services. The town also has a number of manufacturing businesses, such as a steel mill and a paper mill.
The town also has a number of educational institutions, including a public school system and a community college. The town is also home to a number of parks and recreational areas, as well as a public library.
Demographics
The population of Clark is approximately 4,000 people, and the town is predominantly white. The town also has a small African American population, as well as a small Hispanic population. The median household income in the town is approximately $50,000, and the median home value is approximately $150,000. The town also has a low unemployment rate, and the majority of the population is employed in the service industry.
Common Questions
What is Per Capita Income in Clark borough?
Per Capita income in Clark borough is $45,044.
What is the Median Family Income in Clark borough?
Median Family Income in Clark borough is $99,500.
What is the Median Household income in Clark borough?
Median Household Income in Clark borough is $78,250.
What is Income or Wage Gap in Clark borough?
Income or Wage Gap in Clark borough is 9.8%.
Women in Clark borough earn 90.2 cents for every dollar earned by a man.
What is Inequality or Gini Index in Clark borough?
Inequality or Gini Index in Clark borough is 0.46.
What is the Total Population of Clark borough?
Total Population of Clark borough is 577.
What is the Total Male Population of Clark borough?
Total Male Population of Clark borough is 258.
What is the Total Female Population of Clark borough?
Total Female Population of Clark borough is 319.
What is the Ratio of Males per 100 Females in Clark borough?
There are 80.88 Males per 100 Females in Clark borough.
What is the Ratio of Females per 100 Males in Clark borough?
There are 123.64 Females per 100 Males in Clark borough.
What is the Median Population Age in Clark borough?
Median Population Age in Clark borough is 46.3 Years.
What is the Average Family Size in Clark borough
Average Family Size in Clark borough is 3.2 People.
What is the Average Household Size in Clark borough
Average Household Size in Clark borough is 2.5 People.
How Large is the Labor Force in Clark borough?
There are 242 People in the Labor Forcein in Clark borough.
What is the Percentage of People in the Labor Force in Clark borough?
52.7% of People are in the Labor Force in Clark borough.
What is the Unemployment Rate in Clark borough?
Unemployment Rate in Clark borough is 4.5%.