Zip Codes with the Highest Percentage of Population Employed in Farming, Fishing & Forestry in Chambersburg, PA
RELATED REPORTS & OPTIONS
Farming, Fishing & Forestry
Chambersburg
Compare Zip Codes
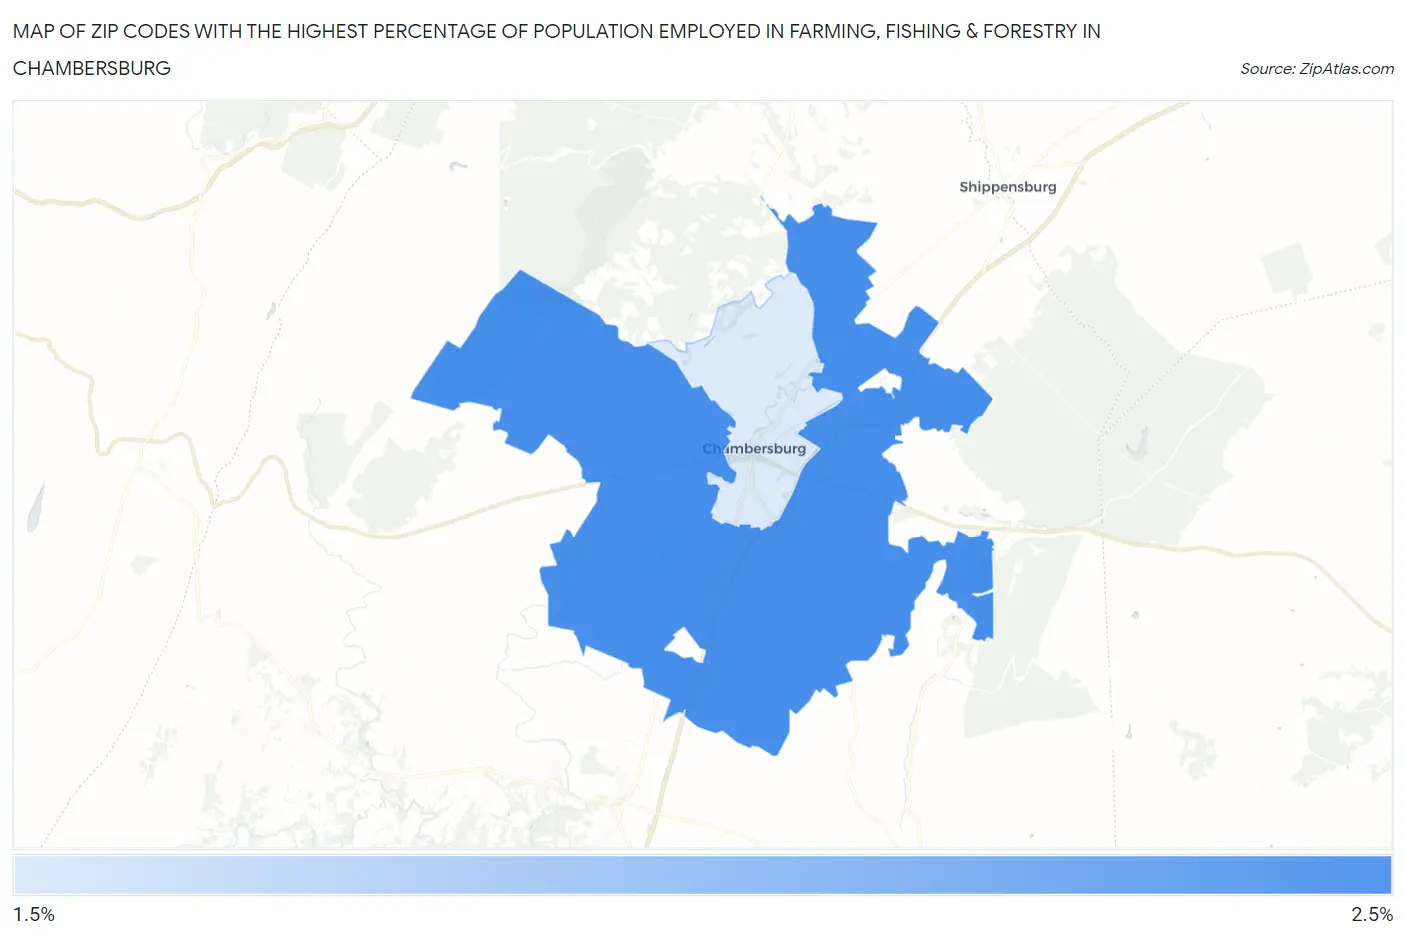
Map of Zip Codes with the Highest Percentage of Population Employed in Farming, Fishing & Forestry in Chambersburg
1.5%
2.1%
Zip Codes with the Highest Percentage of Population Employed in Farming, Fishing & Forestry in Chambersburg, PA
| Zip Code | % Employed | vs State | vs National | |
| 1. | 17202 | 2.1% | 0.41%(+1.73)#175 | 0.61%(+1.53)#6,261 |
| 2. | 17201 | 1.5% | 0.41%(+1.13)#242 | 0.61%(+0.927)#7,797 |
1
Common Questions
What are the Top Zip Codes with the Highest Percentage of Population Employed in Farming, Fishing & Forestry in Chambersburg, PA?
Top Zip Codes with the Highest Percentage of Population Employed in Farming, Fishing & Forestry in Chambersburg, PA are:
What zip code has the Highest Percentage of Population Employed in Farming, Fishing & Forestry in Chambersburg, PA?
17202 has the Highest Percentage of Population Employed in Farming, Fishing & Forestry in Chambersburg, PA with 2.1%.
What is the Percentage of Population Employed in Farming, Fishing & Forestry in Pennsylvania?
Percentage of Population Employed in Farming, Fishing & Forestry in Pennsylvania is 0.41%.
What is the Percentage of Population Employed in Farming, Fishing & Forestry in the United States?
Percentage of Population Employed in Farming, Fishing & Forestry in the United States is 0.61%.