Huntingdon borough, PA Map & Demographics
Huntingdon borough Overview
$30,794
PER CAPITA INCOME
$75,604
AVG FAMILY INCOME
$59,364
AVG HOUSEHOLD INCOME
41.2%
WAGE / INCOME GAP [ % ]
58.8¢/ $1
WAGE / INCOME GAP [ $ ]
0.48
INEQUALITY / GINI INDEX
6,904
TOTAL POPULATION
3,146
MALE POPULATION
3,758
FEMALE POPULATION
83.71
MALES / 100 FEMALES
119.45
FEMALES / 100 MALES
34.5
MEDIAN AGE
3.0
AVG FAMILY SIZE
2.3
AVG HOUSEHOLD SIZE
3,297
LABOR FORCE [ PEOPLE ]
54.6%
PERCENT IN LABOR FORCE
3.9%
UNEMPLOYMENT RATE
Income in Huntingdon borough
Income Overview in Huntingdon borough
Per Capita Income in Huntingdon borough is $30,794, while median incomes of families and households are $75,604 and $59,364 respectively.
| Characteristic | Number | Measure |
| Per Capita Income | 6,904 | $30,794 |
| Median Family Income | 1,416 | $75,604 |
| Mean Family Income | 1,416 | $86,626 |
| Median Household Income | 2,369 | $59,364 |
| Mean Household Income | 2,369 | $83,751 |
| Income Deficit | 1,416 | $0 |
| Wage / Income Gap (%) | 6,904 | 41.15% |
| Wage / Income Gap ($) | 6,904 | 58.85¢ per $1 |
| Gini / Inequality Index | 6,904 | 0.48 |
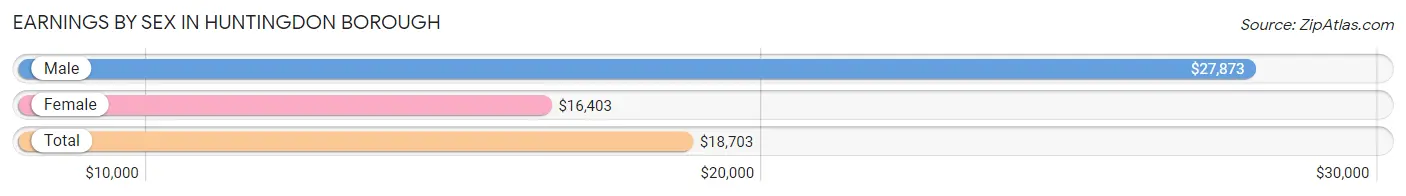
Earnings by Sex in Huntingdon borough
Average Earnings in Huntingdon borough are $18,703, $27,873 for men and $16,403 for women, a difference of 41.1%.
| Sex | Number | Average Earnings |
| Male | 2,049 (49.1%) | $27,873 |
| Female | 2,124 (50.9%) | $16,403 |
| Total | 4,173 (100.0%) | $18,703 |
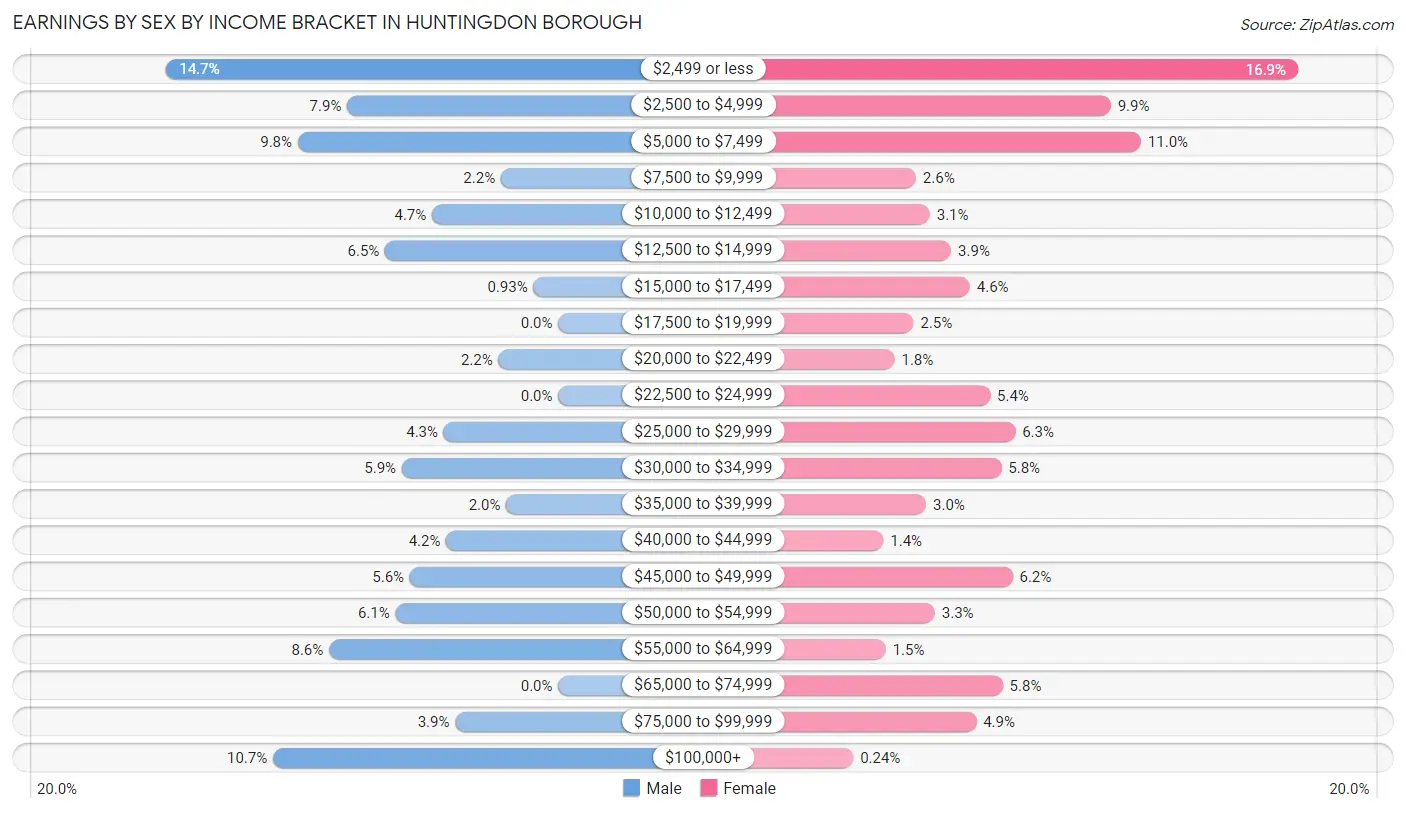
Earnings by Sex by Income Bracket in Huntingdon borough
The most common earnings brackets in Huntingdon borough are $2,499 or less for men (301 | 14.7%) and $2,499 or less for women (359 | 16.9%).
| Income | Male | Female |
| $2,499 or less | 301 (14.7%) | 359 (16.9%) |
| $2,500 to $4,999 | 162 (7.9%) | 210 (9.9%) |
| $5,000 to $7,499 | 200 (9.8%) | 234 (11.0%) |
| $7,500 to $9,999 | 44 (2.1%) | 55 (2.6%) |
| $10,000 to $12,499 | 97 (4.7%) | 66 (3.1%) |
| $12,500 to $14,999 | 133 (6.5%) | 83 (3.9%) |
| $15,000 to $17,499 | 19 (0.9%) | 98 (4.6%) |
| $17,500 to $19,999 | 0 (0.0%) | 53 (2.5%) |
| $20,000 to $22,499 | 46 (2.2%) | 38 (1.8%) |
| $22,500 to $24,999 | 0 (0.0%) | 114 (5.4%) |
| $25,000 to $29,999 | 88 (4.3%) | 134 (6.3%) |
| $30,000 to $34,999 | 120 (5.9%) | 123 (5.8%) |
| $35,000 to $39,999 | 40 (1.9%) | 63 (3.0%) |
| $40,000 to $44,999 | 86 (4.2%) | 29 (1.4%) |
| $45,000 to $49,999 | 114 (5.6%) | 132 (6.2%) |
| $50,000 to $54,999 | 125 (6.1%) | 70 (3.3%) |
| $55,000 to $64,999 | 176 (8.6%) | 31 (1.5%) |
| $65,000 to $74,999 | 0 (0.0%) | 124 (5.8%) |
| $75,000 to $99,999 | 79 (3.9%) | 103 (4.9%) |
| $100,000+ | 219 (10.7%) | 5 (0.2%) |
| Total | 2,049 (100.0%) | 2,124 (100.0%) |
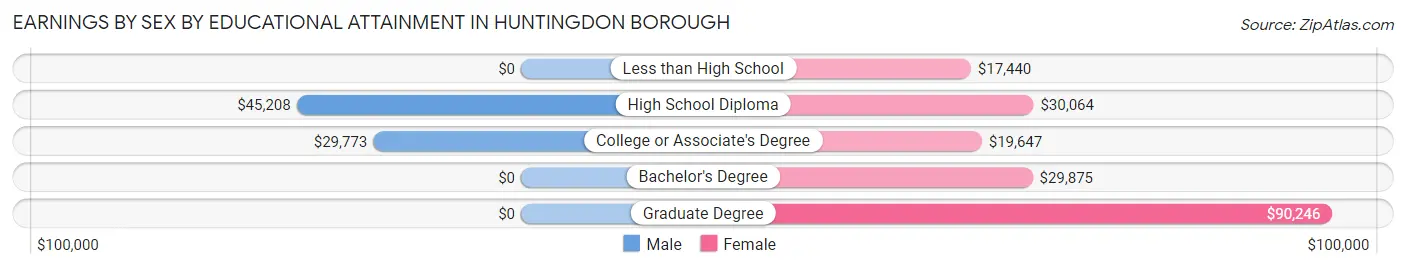
Earnings by Sex by Educational Attainment in Huntingdon borough
Average earnings in Huntingdon borough are $45,012 for men and $28,669 for women, a difference of 36.3%. Men with an educational attainment of high school diploma enjoy the highest average annual earnings of $45,208, while those with college or associate's degree education earn the least with $29,773. Women with an educational attainment of graduate degree earn the most with the average annual earnings of $90,246, while those with less than high school education have the smallest earnings of $17,440.
| Educational Attainment | Male Income | Female Income |
| Less than High School | - | - |
| High School Diploma | $45,208 | $30,064 |
| College or Associate's Degree | $29,773 | $19,647 |
| Bachelor's Degree | - | - |
| Graduate Degree | - | - |
| Total | $45,012 | $28,669 |
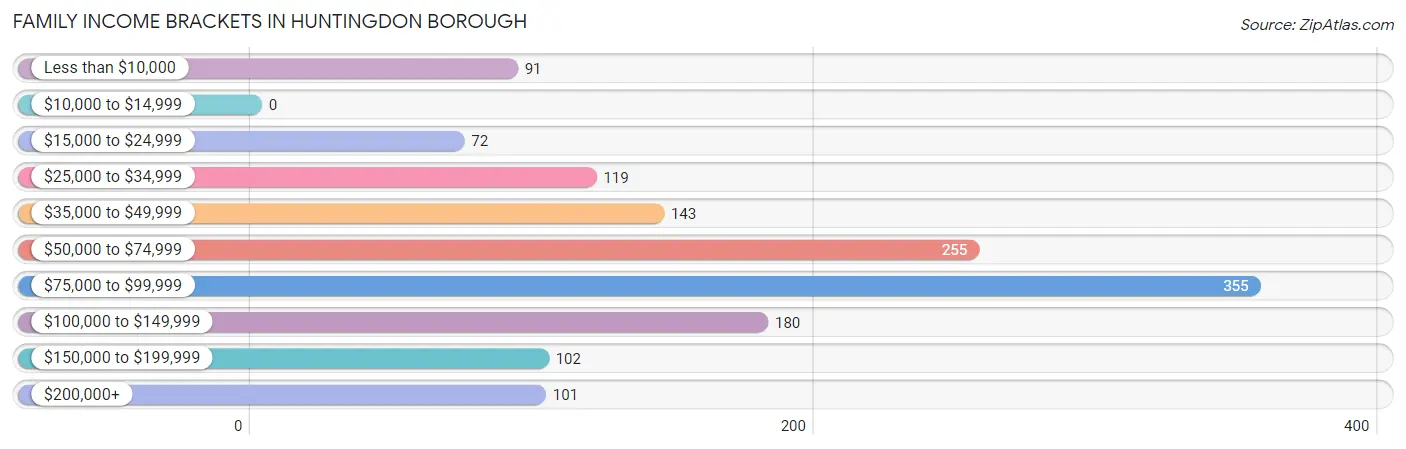
Family Income in Huntingdon borough
Family Income Brackets in Huntingdon borough
According to the Huntingdon borough family income data, there are 355 families falling into the $75,000 to $99,999 income range, which is the most common income bracket and makes up 25.1% of all families.
| Income Bracket | # Families | % Families |
| Less than $10,000 | 91 | 6.4% |
| $10,000 to $14,999 | 0 | 0.0% |
| $15,000 to $24,999 | 72 | 5.1% |
| $25,000 to $34,999 | 119 | 8.4% |
| $35,000 to $49,999 | 143 | 10.1% |
| $50,000 to $74,999 | 255 | 18.0% |
| $75,000 to $99,999 | 355 | 25.1% |
| $100,000 to $149,999 | 180 | 12.7% |
| $150,000 to $199,999 | 102 | 7.2% |
| $200,000+ | 101 | 7.1% |
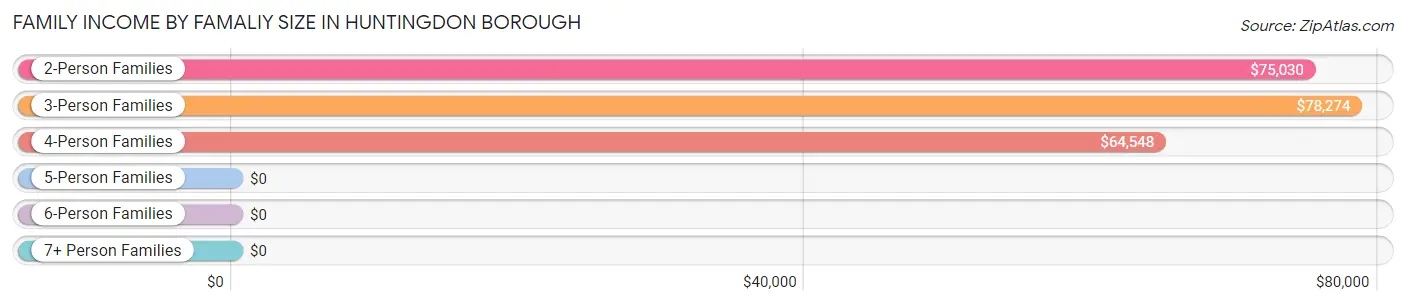
Family Income by Famaliy Size in Huntingdon borough
3-person families (281 | 19.8%) account for the highest median family income in Huntingdon borough with $78,274 per family, while 2-person families (756 | 53.4%) have the highest median income of $37,515 per family member.
| Income Bracket | # Families | Median Income |
| 2-Person Families | 756 (53.4%) | $75,030 |
| 3-Person Families | 281 (19.8%) | $78,274 |
| 4-Person Families | 277 (19.6%) | $64,548 |
| 5-Person Families | 49 (3.5%) | $0 |
| 6-Person Families | 38 (2.7%) | $0 |
| 7+ Person Families | 15 (1.1%) | $0 |
| Total | 1,416 (100.0%) | $75,604 |
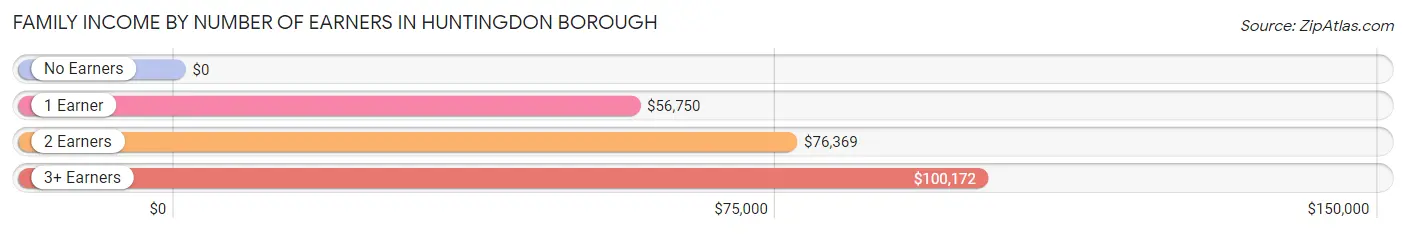
Family Income by Number of Earners in Huntingdon borough
| Number of Earners | # Families | Median Income |
| No Earners | 159 (11.2%) | $0 |
| 1 Earner | 485 (34.3%) | $56,750 |
| 2 Earners | 610 (43.1%) | $76,369 |
| 3+ Earners | 162 (11.4%) | $100,172 |
| Total | 1,416 (100.0%) | $75,604 |
Household Income in Huntingdon borough
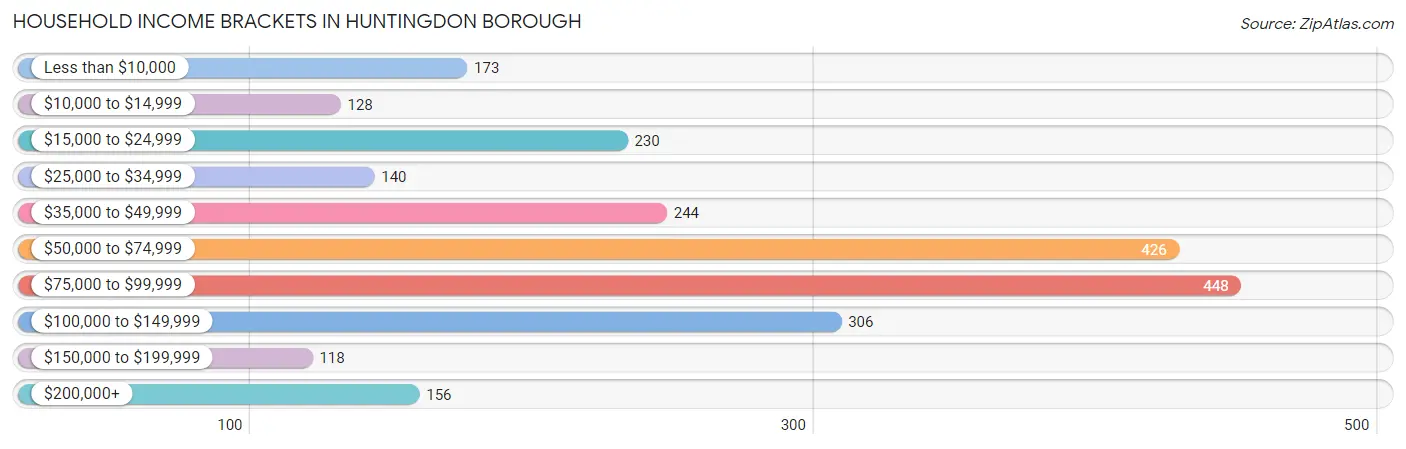
Household Income Brackets in Huntingdon borough
With 448 households falling in the category, the $75,000 to $99,999 income range is the most frequent in Huntingdon borough, accounting for 18.9% of all households. In contrast, only 118 households (5.0%) fall into the $150,000 to $199,999 income bracket, making it the least populous group.
| Income Bracket | # Households | % Households |
| Less than $10,000 | 173 | 7.3% |
| $10,000 to $14,999 | 128 | 5.4% |
| $15,000 to $24,999 | 230 | 9.7% |
| $25,000 to $34,999 | 140 | 5.9% |
| $35,000 to $49,999 | 244 | 10.3% |
| $50,000 to $74,999 | 426 | 18.0% |
| $75,000 to $99,999 | 448 | 18.9% |
| $100,000 to $149,999 | 306 | 12.9% |
| $150,000 to $199,999 | 118 | 5.0% |
| $200,000+ | 156 | 6.6% |
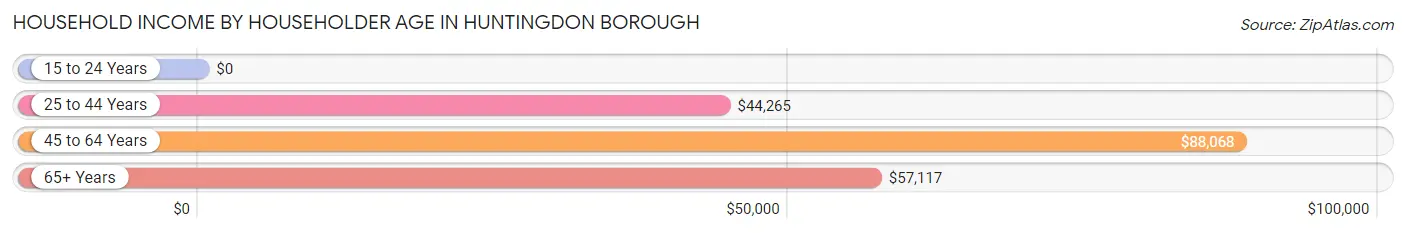
Household Income by Householder Age in Huntingdon borough
The median household income in Huntingdon borough is $59,364, with the highest median household income of $88,068 found in the 45 to 64 years age bracket for the primary householder. A total of 892 households (37.7%) fall into this category. Meanwhile, the 15 to 24 years age bracket for the primary householder has the lowest median household income of $0, with 74 households (3.1%) in this group.
| Income Bracket | # Households | Median Income |
| 15 to 24 Years | 74 (3.1%) | $0 |
| 25 to 44 Years | 648 (27.4%) | $44,265 |
| 45 to 64 Years | 892 (37.7%) | $88,068 |
| 65+ Years | 755 (31.9%) | $57,117 |
| Total | 2,369 (100.0%) | $59,364 |
Poverty in Huntingdon borough
Income Below Poverty by Sex and Age in Huntingdon borough
With 9.4% poverty level for males and 16.5% for females among the residents of Huntingdon borough, 6 to 11 year old males and 12 to 14 year old females are the most vulnerable to poverty, with 78 males (67.8%) and 61 females (77.2%) in their respective age groups living below the poverty level.
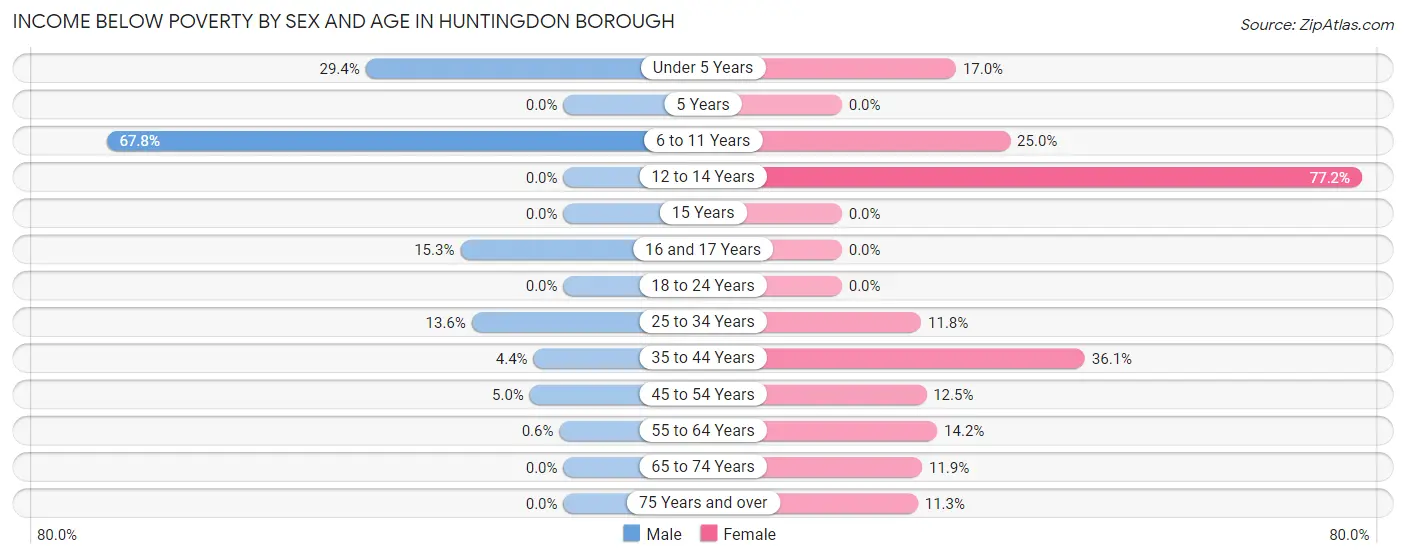
| Age Bracket | Male | Female |
| Under 5 Years | 37 (29.4%) | 30 (17.0%) |
| 5 Years | 0 (0.0%) | 0 (0.0%) |
| 6 to 11 Years | 78 (67.8%) | 51 (25.0%) |
| 12 to 14 Years | 0 (0.0%) | 61 (77.2%) |
| 15 Years | 0 (0.0%) | 0 (0.0%) |
| 16 and 17 Years | 15 (15.3%) | 0 (0.0%) |
| 18 to 24 Years | 0 (0.0%) | 0 (0.0%) |
| 25 to 34 Years | 70 (13.6%) | 41 (11.8%) |
| 35 to 44 Years | 13 (4.4%) | 113 (36.1%) |
| 45 to 54 Years | 19 (5.0%) | 42 (12.5%) |
| 55 to 64 Years | 2 (0.6%) | 67 (14.2%) |
| 65 to 74 Years | 0 (0.0%) | 57 (11.9%) |
| 75 Years and over | 0 (0.0%) | 21 (11.3%) |
| Total | 234 (9.4%) | 483 (16.5%) |
Income Above Poverty by Sex and Age in Huntingdon borough
According to the poverty statistics in Huntingdon borough, males aged 5 years and females aged 5 years are the age groups that are most secure financially, with 100.0% of males and 100.0% of females in these age groups living above the poverty line.
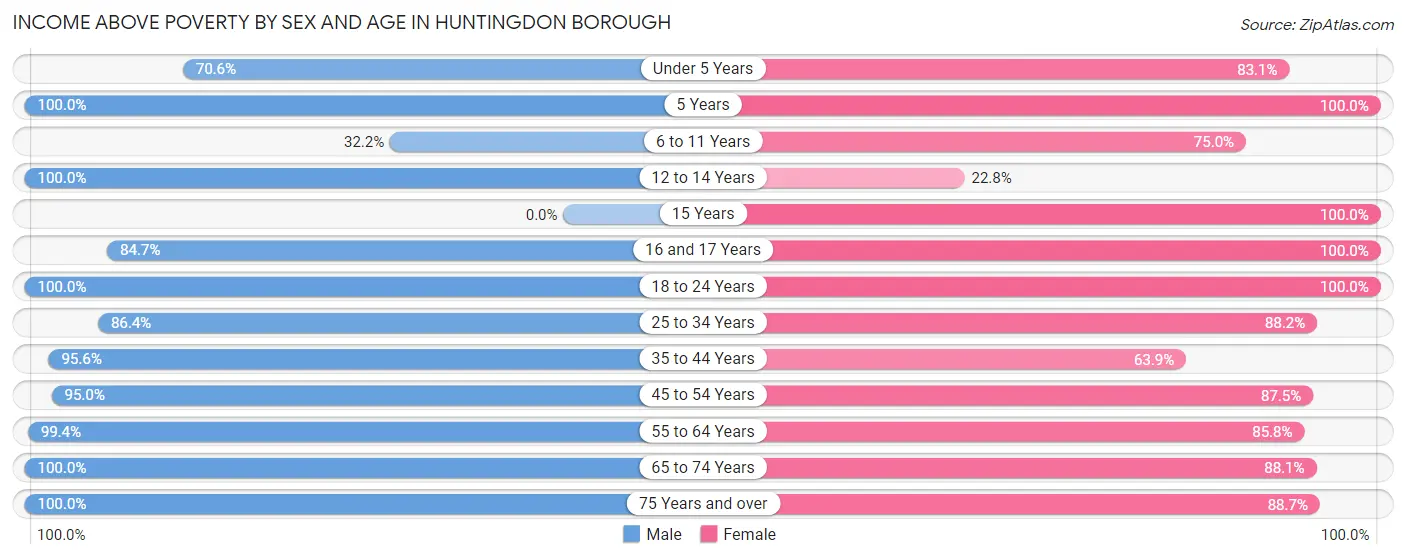
| Age Bracket | Male | Female |
| Under 5 Years | 89 (70.6%) | 147 (83.1%) |
| 5 Years | 17 (100.0%) | 67 (100.0%) |
| 6 to 11 Years | 37 (32.2%) | 153 (75.0%) |
| 12 to 14 Years | 61 (100.0%) | 18 (22.8%) |
| 15 Years | 0 (0.0%) | 19 (100.0%) |
| 16 and 17 Years | 83 (84.7%) | 42 (100.0%) |
| 18 to 24 Years | 137 (100.0%) | 209 (100.0%) |
| 25 to 34 Years | 444 (86.4%) | 307 (88.2%) |
| 35 to 44 Years | 280 (95.6%) | 200 (63.9%) |
| 45 to 54 Years | 361 (95.0%) | 293 (87.5%) |
| 55 to 64 Years | 334 (99.4%) | 406 (85.8%) |
| 65 to 74 Years | 274 (100.0%) | 421 (88.1%) |
| 75 Years and over | 150 (100.0%) | 165 (88.7%) |
| Total | 2,267 (90.6%) | 2,447 (83.5%) |
Income Below Poverty Among Married-Couple Families in Huntingdon borough
The poverty statistics for married-couple families in Huntingdon borough show that 2.6% or 24 of the total 932 families live below the poverty line. Families with 3 or 4 children have the highest poverty rate of 31.7%, comprising of 13 families. On the other hand, families with no children have the lowest poverty rate of 0.0%, which includes 0 families.
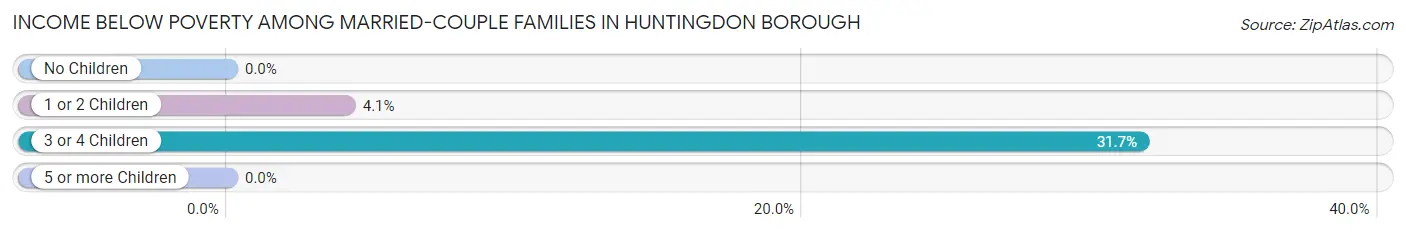
| Children | Above Poverty | Below Poverty |
| No Children | 623 (100.0%) | 0 (0.0%) |
| 1 or 2 Children | 257 (95.9%) | 11 (4.1%) |
| 3 or 4 Children | 28 (68.3%) | 13 (31.7%) |
| 5 or more Children | 0 (0.0%) | 0 (0.0%) |
| Total | 908 (97.4%) | 24 (2.6%) |
Income Below Poverty Among Single-Parent Households in Huntingdon borough
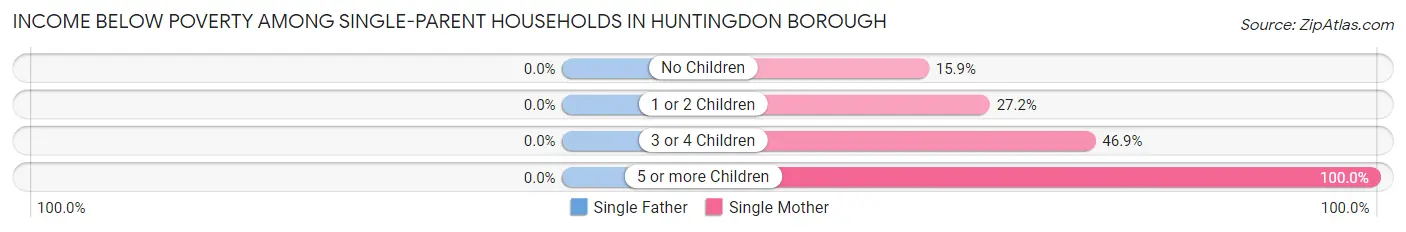
| Children | Single Father | Single Mother |
| No Children | 0 (0.0%) | 26 (15.9%) |
| 1 or 2 Children | 0 (0.0%) | 68 (27.2%) |
| 3 or 4 Children | 0 (0.0%) | 15 (46.9%) |
| 5 or more Children | 0 (0.0%) | 12 (100.0%) |
| Total | 0 (0.0%) | 121 (26.4%) |
Income Below Poverty Among Married-Couple vs Single-Parent Households in Huntingdon borough
The poverty data for Huntingdon borough shows that 24 of the married-couple family households (2.6%) and 121 of the single-parent households (25.0%) are living below the poverty level. Within the married-couple family households, those with 3 or 4 children have the highest poverty rate, with 13 households (31.7%) falling below the poverty line. Among the single-parent households, those with 5 or more children have the highest poverty rate, with 12 household (100.0%) living below poverty.
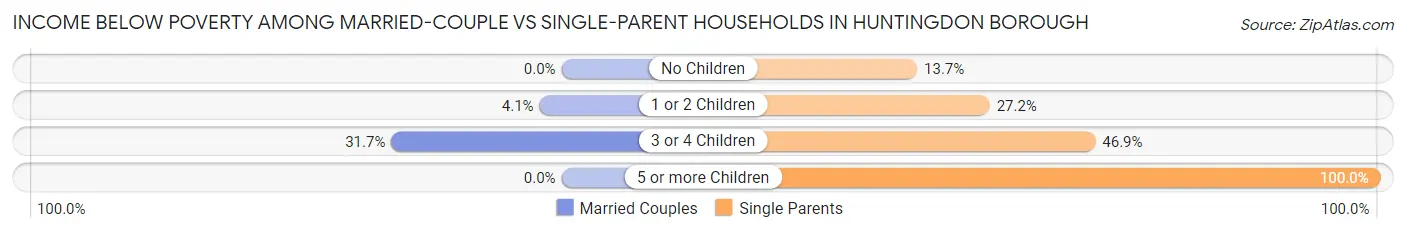
| Children | Married-Couple Families | Single-Parent Households |
| No Children | 0 (0.0%) | 26 (13.7%) |
| 1 or 2 Children | 11 (4.1%) | 68 (27.2%) |
| 3 or 4 Children | 13 (31.7%) | 15 (46.9%) |
| 5 or more Children | 0 (0.0%) | 12 (100.0%) |
| Total | 24 (2.6%) | 121 (25.0%) |
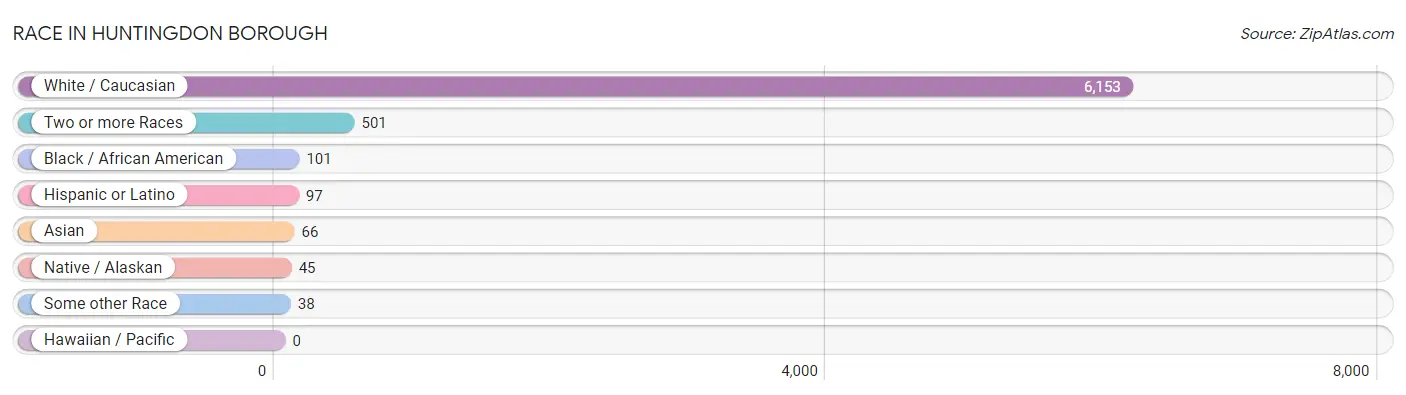
Race in Huntingdon borough
The most populous races in Huntingdon borough are White / Caucasian (6,153 | 89.1%), Two or more Races (501 | 7.3%), and Black / African American (101 | 1.5%).
| Race | # Population | % Population |
| Asian | 66 | 1.0% |
| Black / African American | 101 | 1.5% |
| Hawaiian / Pacific | 0 | 0.0% |
| Hispanic or Latino | 97 | 1.4% |
| Native / Alaskan | 45 | 0.6% |
| White / Caucasian | 6,153 | 89.1% |
| Two or more Races | 501 | 7.3% |
| Some other Race | 38 | 0.5% |
| Total | 6,904 | 100.0% |
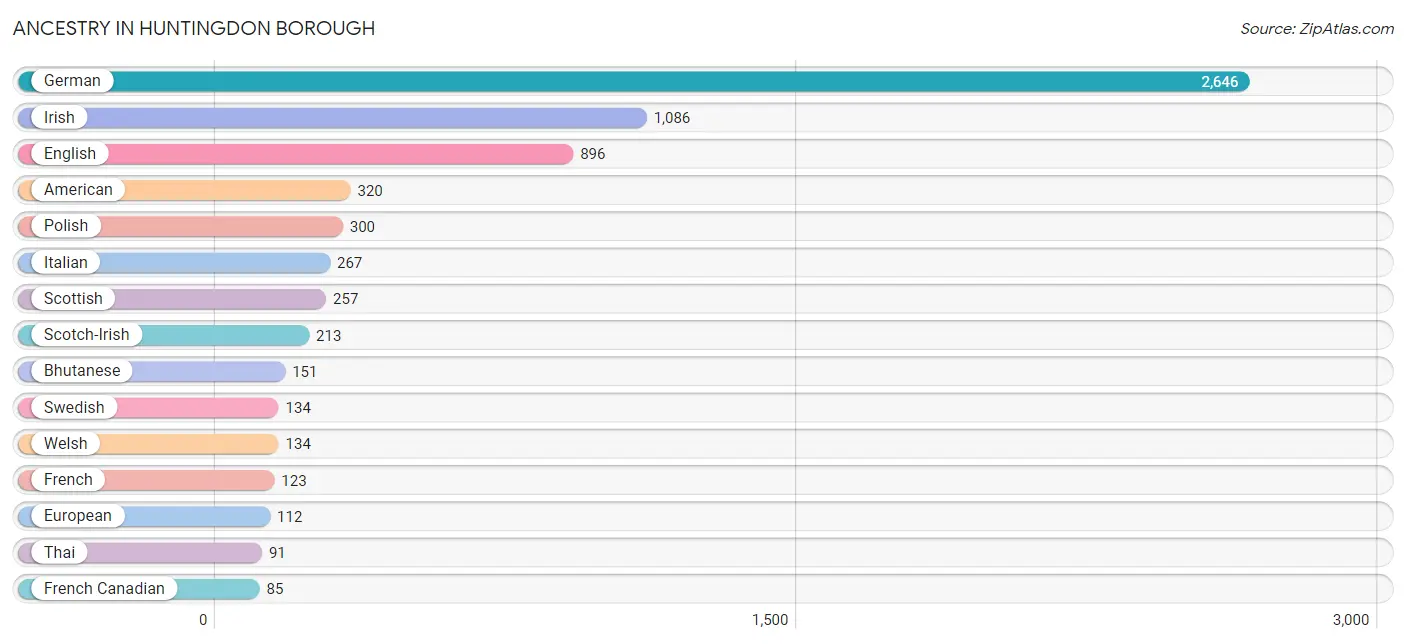
Ancestry in Huntingdon borough
The most populous ancestries reported in Huntingdon borough are German (2,646 | 38.3%), Irish (1,086 | 15.7%), English (896 | 13.0%), American (320 | 4.6%), and Polish (300 | 4.3%), together accounting for 76.0% of all Huntingdon borough residents.
| Ancestry | # Population | % Population |
| African | 10 | 0.1% |
| American | 320 | 4.6% |
| Bhutanese | 151 | 2.2% |
| Blackfeet | 4 | 0.1% |
| British | 55 | 0.8% |
| Central American | 24 | 0.4% |
| Cherokee | 5 | 0.1% |
| Cuban | 6 | 0.1% |
| Czech | 36 | 0.5% |
| Danish | 10 | 0.1% |
| Dutch | 68 | 1.0% |
| Eastern European | 31 | 0.4% |
| English | 896 | 13.0% |
| European | 112 | 1.6% |
| French | 123 | 1.8% |
| French Canadian | 85 | 1.2% |
| German | 2,646 | 38.3% |
| Greek | 6 | 0.1% |
| Guatemalan | 24 | 0.4% |
| Hungarian | 7 | 0.1% |
| Indian (Asian) | 21 | 0.3% |
| Irish | 1,086 | 15.7% |
| Italian | 267 | 3.9% |
| Norwegian | 42 | 0.6% |
| Pennsylvania German | 16 | 0.2% |
| Polish | 300 | 4.3% |
| Portuguese | 15 | 0.2% |
| Puerto Rican | 28 | 0.4% |
| Scandinavian | 14 | 0.2% |
| Scotch-Irish | 213 | 3.1% |
| Scottish | 257 | 3.7% |
| Serbian | 23 | 0.3% |
| Sioux | 6 | 0.1% |
| Slovak | 30 | 0.4% |
| Slovene | 10 | 0.1% |
| Sri Lankan | 30 | 0.4% |
| Subsaharan African | 10 | 0.1% |
| Swedish | 134 | 1.9% |
| Thai | 91 | 1.3% |
| Ukrainian | 8 | 0.1% |
| Welsh | 134 | 1.9% | View All 41 Rows |
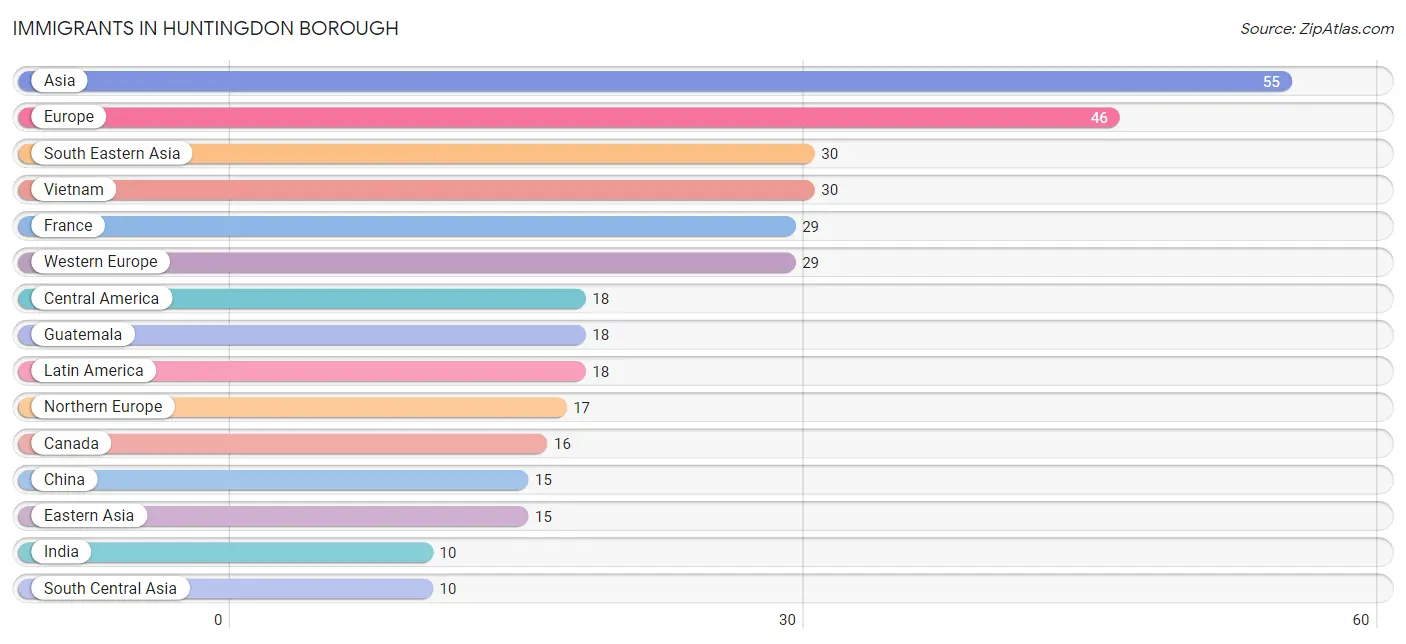
Immigrants in Huntingdon borough
The most numerous immigrant groups reported in Huntingdon borough came from Asia (55 | 0.8%), Europe (46 | 0.7%), South Eastern Asia (30 | 0.4%), Vietnam (30 | 0.4%), and France (29 | 0.4%), together accounting for 2.8% of all Huntingdon borough residents.
| Immigration Origin | # Population | % Population |
| Asia | 55 | 0.8% |
| Canada | 16 | 0.2% |
| Central America | 18 | 0.3% |
| China | 15 | 0.2% |
| Eastern Asia | 15 | 0.2% |
| Europe | 46 | 0.7% |
| France | 29 | 0.4% |
| Guatemala | 18 | 0.3% |
| India | 10 | 0.1% |
| Latin America | 18 | 0.3% |
| Northern Europe | 17 | 0.3% |
| South Central Asia | 10 | 0.1% |
| South Eastern Asia | 30 | 0.4% |
| Vietnam | 30 | 0.4% |
| Western Europe | 29 | 0.4% | View All 15 Rows |
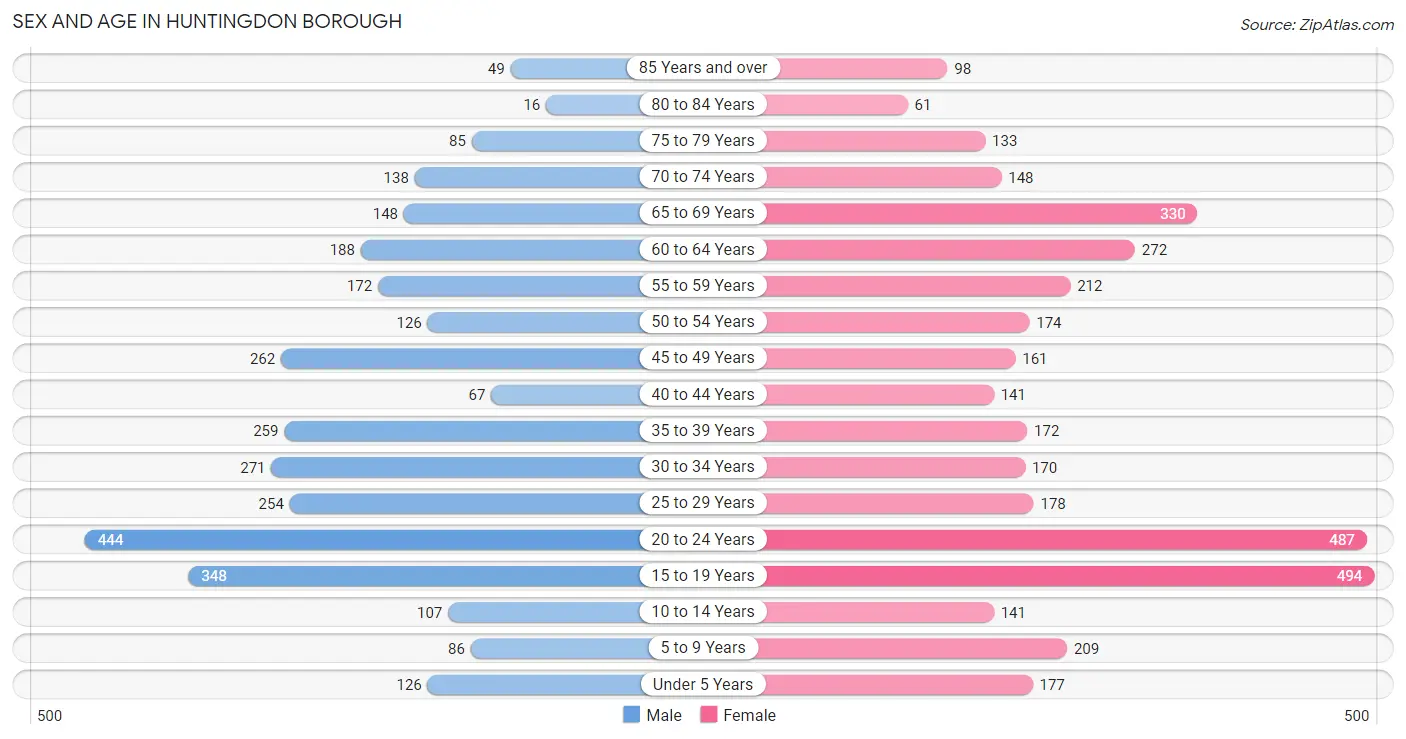
Sex and Age in Huntingdon borough
Sex and Age in Huntingdon borough
The most populous age groups in Huntingdon borough are 20 to 24 Years (444 | 14.1%) for men and 15 to 19 Years (494 | 13.2%) for women.
| Age Bracket | Male | Female |
| Under 5 Years | 126 (4.0%) | 177 (4.7%) |
| 5 to 9 Years | 86 (2.7%) | 209 (5.6%) |
| 10 to 14 Years | 107 (3.4%) | 141 (3.7%) |
| 15 to 19 Years | 348 (11.1%) | 494 (13.2%) |
| 20 to 24 Years | 444 (14.1%) | 487 (13.0%) |
| 25 to 29 Years | 254 (8.1%) | 178 (4.7%) |
| 30 to 34 Years | 271 (8.6%) | 170 (4.5%) |
| 35 to 39 Years | 259 (8.2%) | 172 (4.6%) |
| 40 to 44 Years | 67 (2.1%) | 141 (3.7%) |
| 45 to 49 Years | 262 (8.3%) | 161 (4.3%) |
| 50 to 54 Years | 126 (4.0%) | 174 (4.6%) |
| 55 to 59 Years | 172 (5.5%) | 212 (5.6%) |
| 60 to 64 Years | 188 (6.0%) | 272 (7.2%) |
| 65 to 69 Years | 148 (4.7%) | 330 (8.8%) |
| 70 to 74 Years | 138 (4.4%) | 148 (3.9%) |
| 75 to 79 Years | 85 (2.7%) | 133 (3.5%) |
| 80 to 84 Years | 16 (0.5%) | 61 (1.6%) |
| 85 Years and over | 49 (1.6%) | 98 (2.6%) |
| Total | 3,146 (100.0%) | 3,758 (100.0%) |
Families and Households in Huntingdon borough
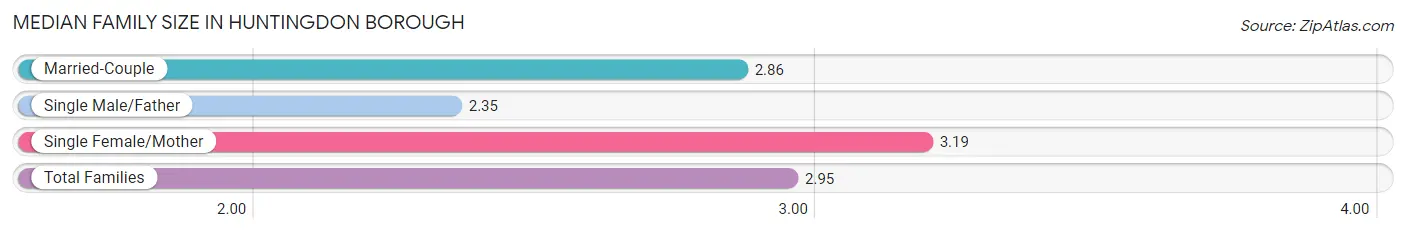
Median Family Size in Huntingdon borough
The median family size in Huntingdon borough is 2.95 persons per family, with single female/mother families (458 | 32.3%) accounting for the largest median family size of 3.19 persons per family. On the other hand, single male/father families (26 | 1.8%) represent the smallest median family size with 2.35 persons per family.
| Family Type | # Families | Family Size |
| Married-Couple | 932 (65.8%) | 2.86 |
| Single Male/Father | 26 (1.8%) | 2.35 |
| Single Female/Mother | 458 (32.3%) | 3.19 |
| Total Families | 1,416 (100.0%) | 2.95 |
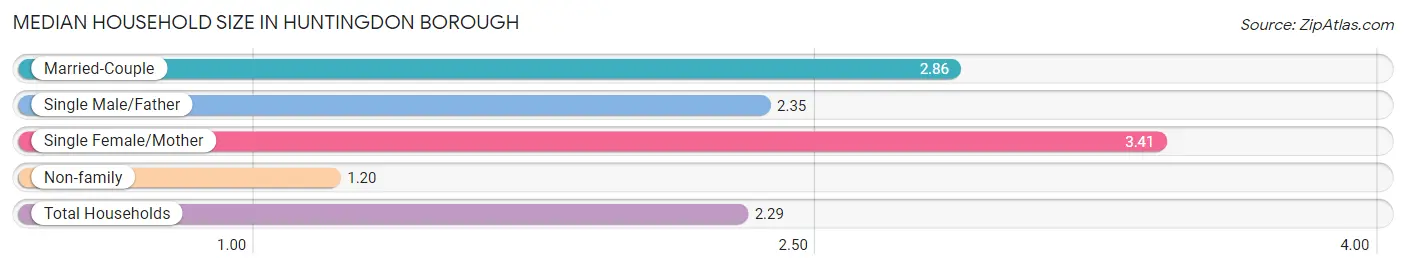
Median Household Size in Huntingdon borough
The median household size in Huntingdon borough is 2.29 persons per household, with single female/mother households (458 | 19.3%) accounting for the largest median household size of 3.41 persons per household. non-family households (953 | 40.2%) represent the smallest median household size with 1.20 persons per household.
| Household Type | # Households | Household Size |
| Married-Couple | 932 (39.3%) | 2.86 |
| Single Male/Father | 26 (1.1%) | 2.35 |
| Single Female/Mother | 458 (19.3%) | 3.41 |
| Non-family | 953 (40.2%) | 1.20 |
| Total Households | 2,369 (100.0%) | 2.29 |
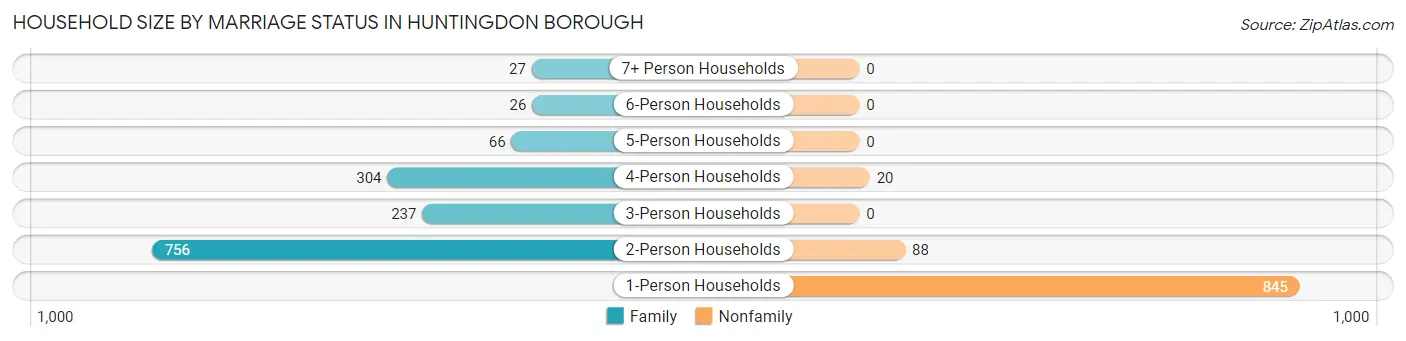
Household Size by Marriage Status in Huntingdon borough
Out of a total of 2,369 households in Huntingdon borough, 1,416 (59.8%) are family households, while 953 (40.2%) are nonfamily households. The most numerous type of family households are 2-person households, comprising 756, and the most common type of nonfamily households are 1-person households, comprising 845.
| Household Size | Family Households | Nonfamily Households |
| 1-Person Households | - | 845 (35.7%) |
| 2-Person Households | 756 (31.9%) | 88 (3.7%) |
| 3-Person Households | 237 (10.0%) | 0 (0.0%) |
| 4-Person Households | 304 (12.8%) | 20 (0.8%) |
| 5-Person Households | 66 (2.8%) | 0 (0.0%) |
| 6-Person Households | 26 (1.1%) | 0 (0.0%) |
| 7+ Person Households | 27 (1.1%) | 0 (0.0%) |
| Total | 1,416 (59.8%) | 953 (40.2%) |
Female Fertility in Huntingdon borough
Fertility by Age in Huntingdon borough
Average fertility rate in Huntingdon borough is 41.0 births per 1,000 women. Women in the age bracket of 35 to 50 years have the highest fertility rate with 53.0 births per 1,000 women. Women in the age bracket of 35 to 50 years acount for 37.7% of all women with births.
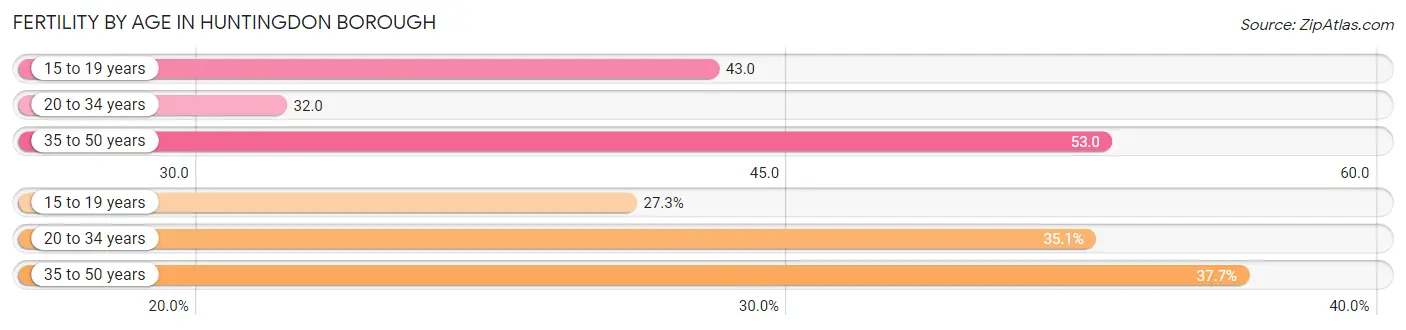
| Age Bracket | Women with Births | Births / 1,000 Women |
| 15 to 19 years | 21 (27.3%) | 43.0 |
| 20 to 34 years | 27 (35.1%) | 32.0 |
| 35 to 50 years | 29 (37.7%) | 53.0 |
| Total | 77 (100.0%) | 41.0 |
Fertility by Age by Marriage Status in Huntingdon borough
57.1% of women with births (77) in Huntingdon borough are married. The highest percentage of unmarried women with births falls into 15 to 19 years age bracket with 100.0% of them unmarried at the time of birth, while the lowest percentage of unmarried women with births belong to 35 to 50 years age bracket with 0.0% of them unmarried.
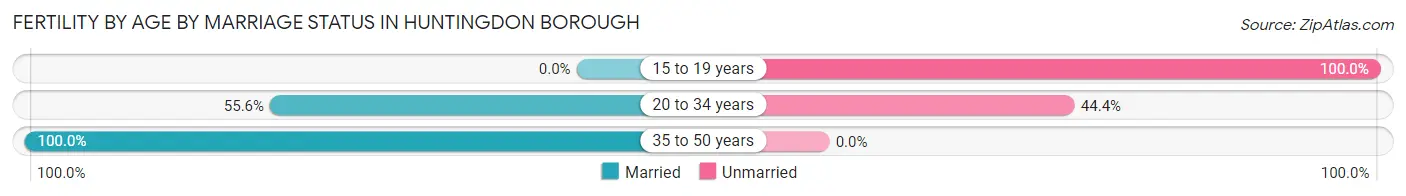
| Age Bracket | Married | Unmarried |
| 15 to 19 years | 0 (0.0%) | 21 (100.0%) |
| 20 to 34 years | 15 (55.6%) | 12 (44.4%) |
| 35 to 50 years | 29 (100.0%) | 0 (0.0%) |
| Total | 44 (57.1%) | 33 (42.9%) |
Fertility by Education in Huntingdon borough
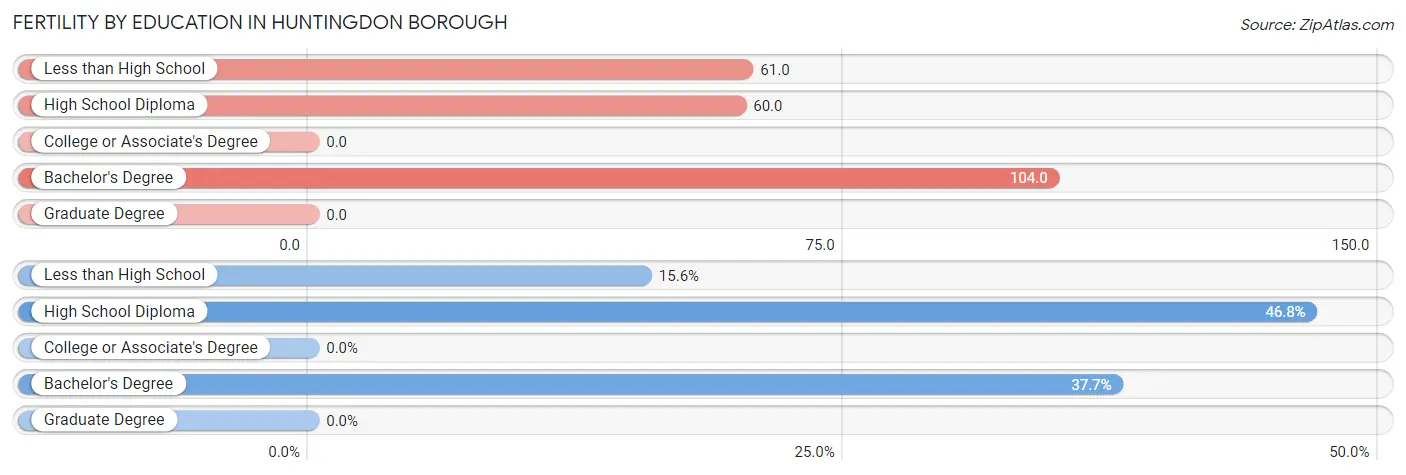
| Educational Attainment | Women with Births | Births / 1,000 Women |
| Less than High School | 12 (15.6%) | 61.0 |
| High School Diploma | 36 (46.8%) | 60.0 |
| College or Associate's Degree | 0 (0.0%) | 0.0 |
| Bachelor's Degree | 29 (37.7%) | 104.0 |
| Graduate Degree | 0 (0.0%) | 0.0 |
| Total | 77 (100.0%) | 41.0 |
Fertility by Education by Marriage Status in Huntingdon borough
42.9% of women with births in Huntingdon borough are unmarried. Women with the educational attainment of bachelor's degree are most likely to be married with 100.0% of them married at childbirth, while women with the educational attainment of less than high school are least likely to be married with 100.0% of them unmarried at childbirth.
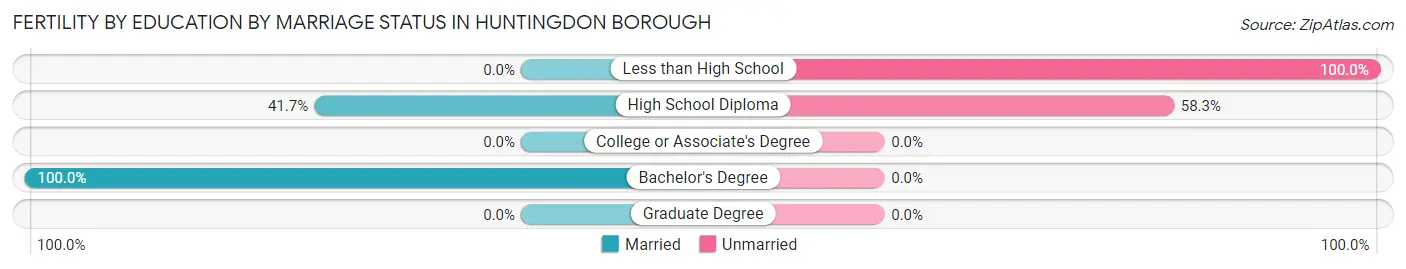
| Educational Attainment | Married | Unmarried |
| Less than High School | 0 (0.0%) | 12 (100.0%) |
| High School Diploma | 15 (41.7%) | 21 (58.3%) |
| College or Associate's Degree | 0 (0.0%) | 0 (0.0%) |
| Bachelor's Degree | 29 (100.0%) | 0 (0.0%) |
| Graduate Degree | 0 (0.0%) | 0 (0.0%) |
| Total | 44 (57.1%) | 33 (42.9%) |
Employment Characteristics in Huntingdon borough
Employment by Class of Employer in Huntingdon borough
Among the 3,114 employed individuals in Huntingdon borough, private company employees (1,844 | 59.2%), not-for-profit organizations (552 | 17.7%), and state government employees (394 | 12.7%) make up the most common classes of employment.
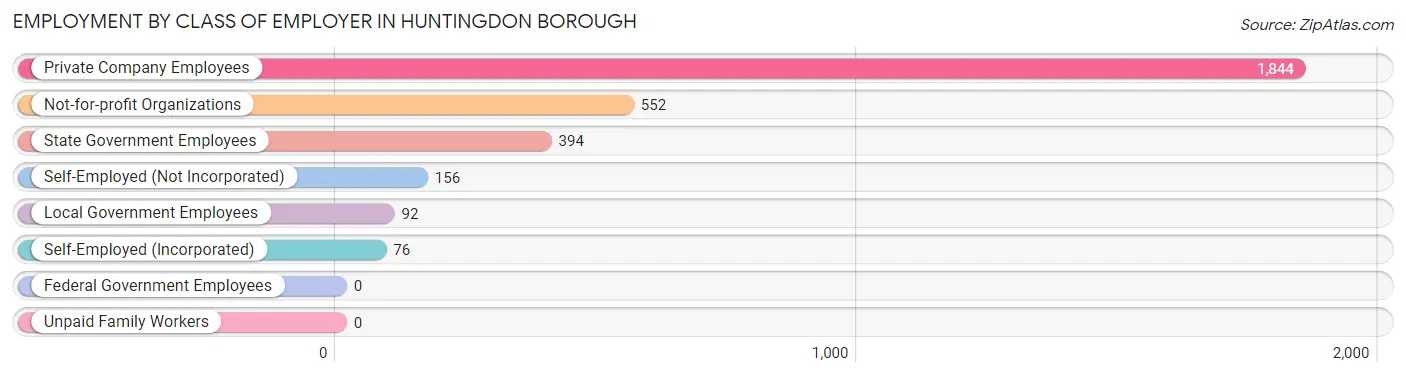
| Employer Class | # Employees | % Employees |
| Private Company Employees | 1,844 | 59.2% |
| Self-Employed (Incorporated) | 76 | 2.4% |
| Self-Employed (Not Incorporated) | 156 | 5.0% |
| Not-for-profit Organizations | 552 | 17.7% |
| Local Government Employees | 92 | 2.9% |
| State Government Employees | 394 | 12.7% |
| Federal Government Employees | 0 | 0.0% |
| Unpaid Family Workers | 0 | 0.0% |
| Total | 3,114 | 100.0% |
Employment Status by Age in Huntingdon borough
According to the labor force statistics for Huntingdon borough, out of the total population over 16 years of age (6,039), 54.6% or 3,297 individuals are in the labor force, with 3.9% or 129 of them unemployed. The age group with the highest labor force participation rate is 30 to 34 years, with 84.1% or 371 individuals in the labor force. Within the labor force, the 25 to 29 years age range has the highest percentage of unemployed individuals, with 15.1% or 52 of them being unemployed.
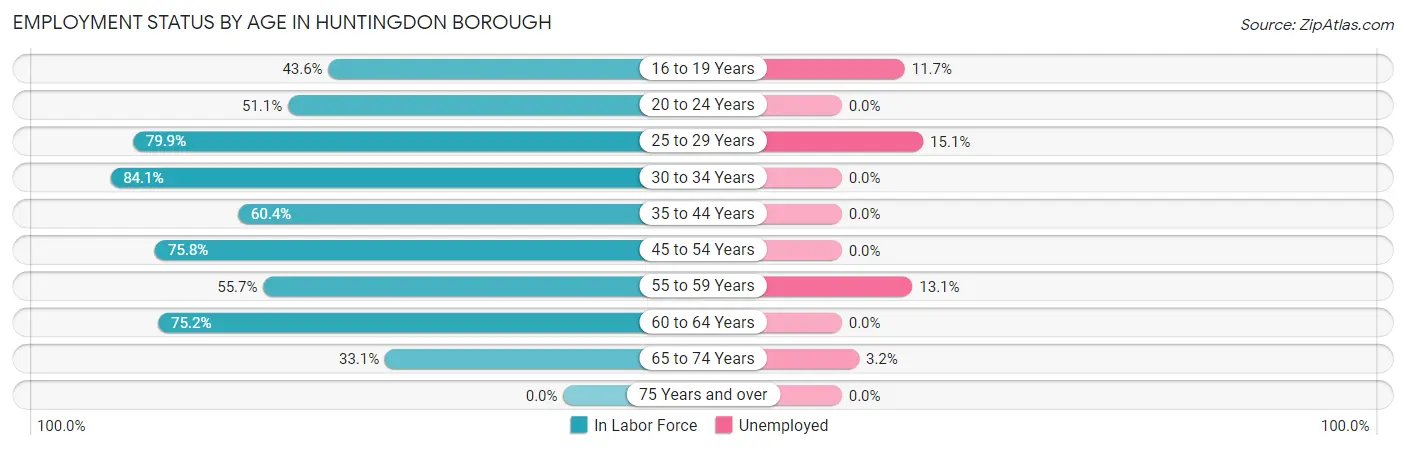
| Age Bracket | In Labor Force | Unemployed |
| 16 to 19 Years | 359 (43.6%) | 42 (11.7%) |
| 20 to 24 Years | 476 (51.1%) | 0 (0.0%) |
| 25 to 29 Years | 345 (79.9%) | 52 (15.1%) |
| 30 to 34 Years | 371 (84.1%) | 0 (0.0%) |
| 35 to 44 Years | 386 (60.4%) | 0 (0.0%) |
| 45 to 54 Years | 548 (75.8%) | 0 (0.0%) |
| 55 to 59 Years | 214 (55.7%) | 28 (13.1%) |
| 60 to 64 Years | 346 (75.2%) | 0 (0.0%) |
| 65 to 74 Years | 253 (33.1%) | 8 (3.2%) |
| 75 Years and over | 0 (0.0%) | 0 (0.0%) |
| Total | 3,297 (54.6%) | 129 (3.9%) |
Employment Status by Educational Attainment in Huntingdon borough
According to labor force statistics for Huntingdon borough, 71.8% of individuals (2,211) out of the total population between 25 and 64 years of age (3,079) are in the labor force, with 3.6% or 80 of them being unemployed. The group with the highest labor force participation rate are those with the educational attainment of bachelor's degree or higher, with 82.7% or 710 individuals in the labor force. Within the labor force, individuals with high school diploma education have the highest percentage of unemployment, with 8.6% or 80 of them being unemployed.
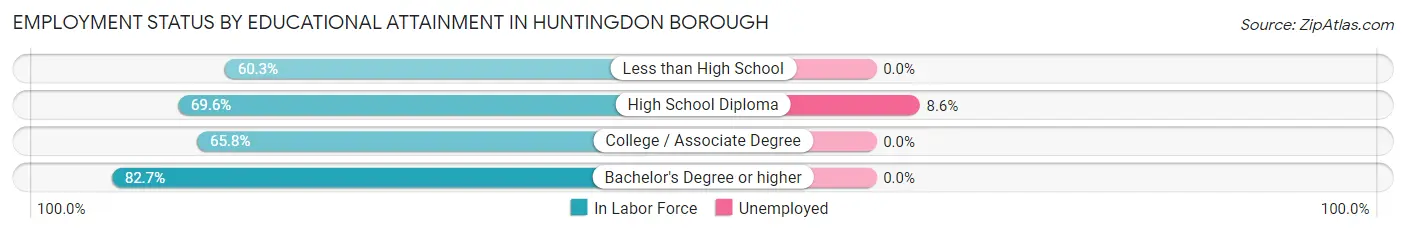
| Educational Attainment | In Labor Force | Unemployed |
| Less than High School | 120 (60.3%) | 0 (0.0%) |
| High School Diploma | 926 (69.6%) | 114 (8.6%) |
| College / Associate Degree | 454 (65.8%) | 0 (0.0%) |
| Bachelor's Degree or higher | 710 (82.7%) | 0 (0.0%) |
| Total | 2,211 (71.8%) | 111 (3.6%) |
Employment Occupations by Sex in Huntingdon borough
Management, Business, Science and Arts Occupations
The most common Management, Business, Science and Arts occupations in Huntingdon borough are Community & Social Service (445 | 14.1%), Education Instruction & Library (349 | 11.0%), Management (235 | 7.4%), Business & Financial (205 | 6.5%), and Health Diagnosing & Treating (157 | 5.0%).
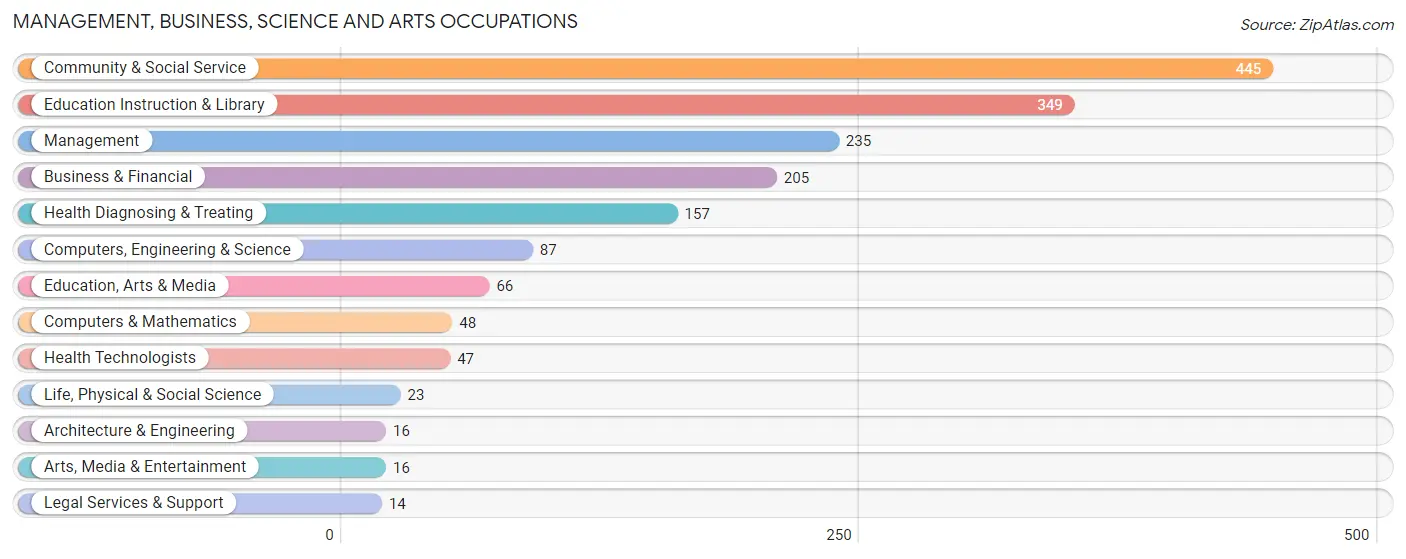
Management, Business, Science and Arts Occupations by Sex
Within the Management, Business, Science and Arts occupations in Huntingdon borough, the most male-oriented occupations are Architecture & Engineering (100.0%), Life, Physical & Social Science (100.0%), and Education, Arts & Media (89.4%), while the most female-oriented occupations are Legal Services & Support (100.0%), Arts, Media & Entertainment (100.0%), and Health Technologists (100.0%).
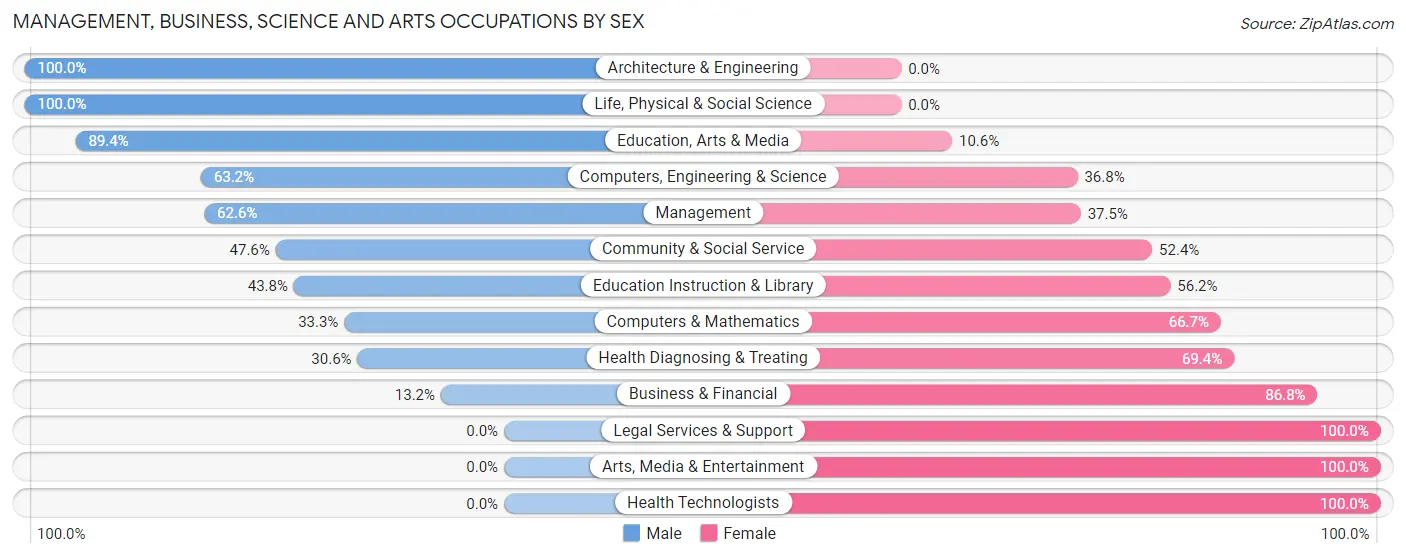
| Occupation | Male | Female |
| Management | 147 (62.5%) | 88 (37.4%) |
| Business & Financial | 27 (13.2%) | 178 (86.8%) |
| Computers, Engineering & Science | 55 (63.2%) | 32 (36.8%) |
| Computers & Mathematics | 16 (33.3%) | 32 (66.7%) |
| Architecture & Engineering | 16 (100.0%) | 0 (0.0%) |
| Life, Physical & Social Science | 23 (100.0%) | 0 (0.0%) |
| Community & Social Service | 212 (47.6%) | 233 (52.4%) |
| Education, Arts & Media | 59 (89.4%) | 7 (10.6%) |
| Legal Services & Support | 0 (0.0%) | 14 (100.0%) |
| Education Instruction & Library | 153 (43.8%) | 196 (56.2%) |
| Arts, Media & Entertainment | 0 (0.0%) | 16 (100.0%) |
| Health Diagnosing & Treating | 48 (30.6%) | 109 (69.4%) |
| Health Technologists | 0 (0.0%) | 47 (100.0%) |
| Total (Category) | 489 (43.3%) | 640 (56.7%) |
| Total (Overall) | 1,568 (49.5%) | 1,600 (50.5%) |
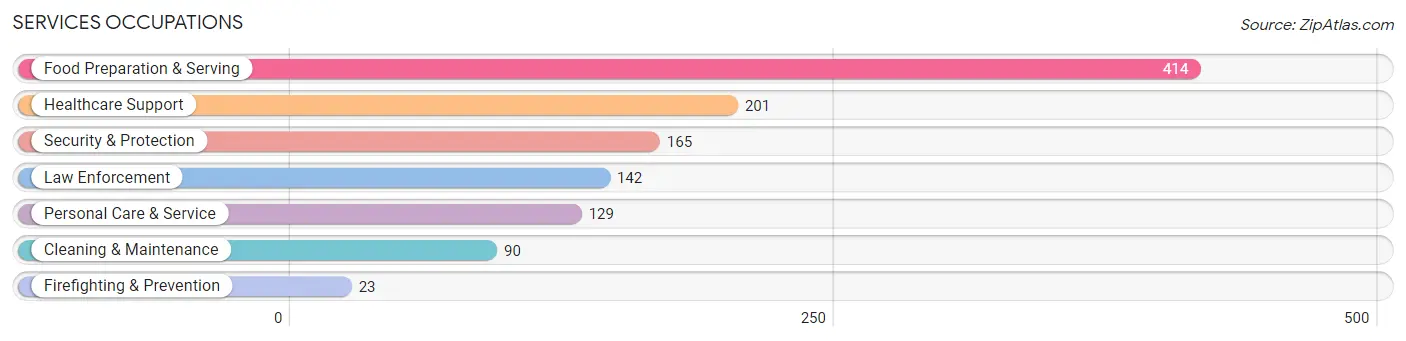
Services Occupations
The most common Services occupations in Huntingdon borough are Food Preparation & Serving (414 | 13.1%), Healthcare Support (201 | 6.3%), Security & Protection (165 | 5.2%), Law Enforcement (142 | 4.5%), and Personal Care & Service (129 | 4.1%).
Services Occupations by Sex
Within the Services occupations in Huntingdon borough, the most male-oriented occupations are Law Enforcement (78.2%), Security & Protection (74.6%), and Personal Care & Service (55.8%), while the most female-oriented occupations are Cleaning & Maintenance (80.0%), Healthcare Support (73.6%), and Food Preparation & Serving (70.3%).
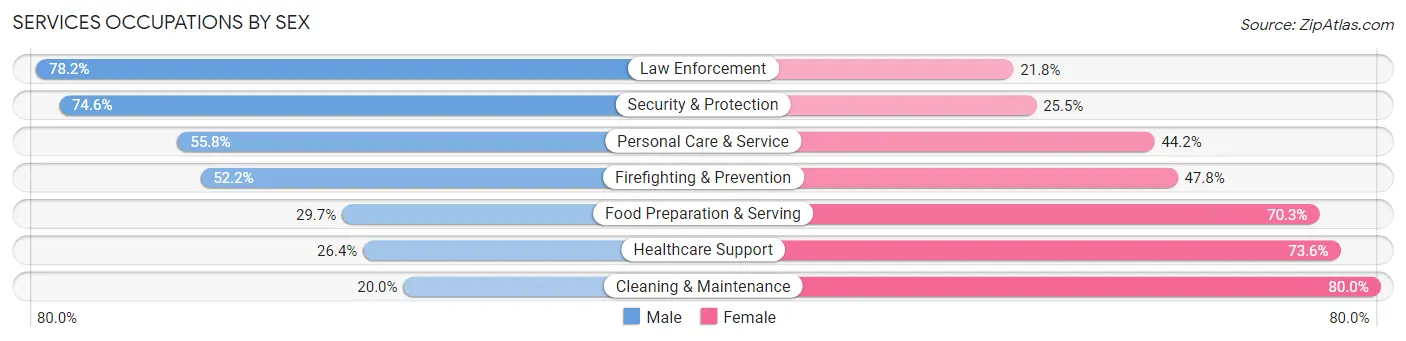
| Occupation | Male | Female |
| Healthcare Support | 53 (26.4%) | 148 (73.6%) |
| Security & Protection | 123 (74.6%) | 42 (25.5%) |
| Firefighting & Prevention | 12 (52.2%) | 11 (47.8%) |
| Law Enforcement | 111 (78.2%) | 31 (21.8%) |
| Food Preparation & Serving | 123 (29.7%) | 291 (70.3%) |
| Cleaning & Maintenance | 18 (20.0%) | 72 (80.0%) |
| Personal Care & Service | 72 (55.8%) | 57 (44.2%) |
| Total (Category) | 389 (38.9%) | 610 (61.1%) |
| Total (Overall) | 1,568 (49.5%) | 1,600 (50.5%) |
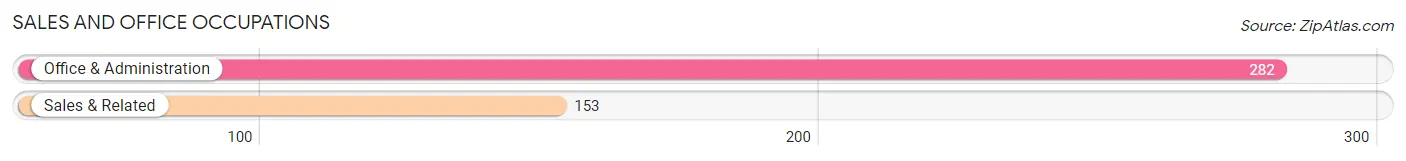
Sales and Office Occupations
The most common Sales and Office occupations in Huntingdon borough are Office & Administration (282 | 8.9%), and Sales & Related (153 | 4.8%).
Sales and Office Occupations by Sex
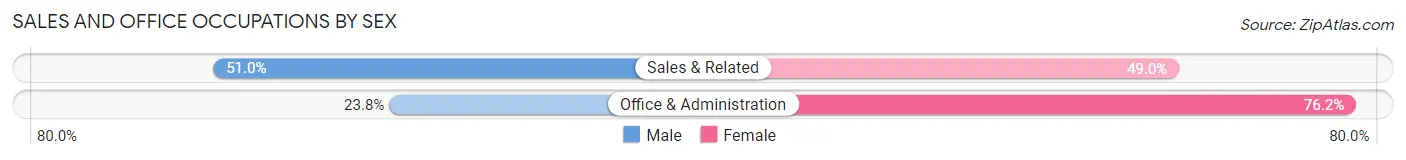
| Occupation | Male | Female |
| Sales & Related | 78 (51.0%) | 75 (49.0%) |
| Office & Administration | 67 (23.8%) | 215 (76.2%) |
| Total (Category) | 145 (33.3%) | 290 (66.7%) |
| Total (Overall) | 1,568 (49.5%) | 1,600 (50.5%) |
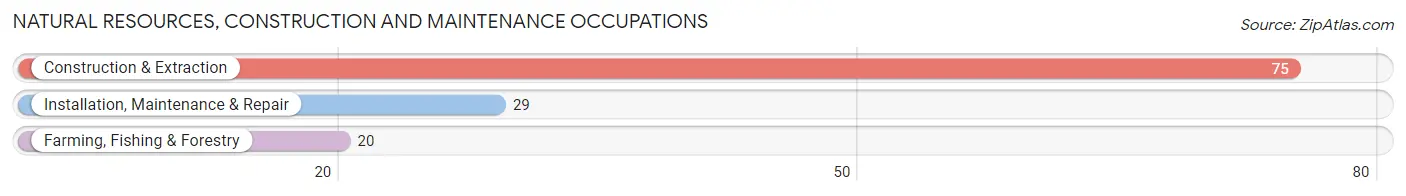
Natural Resources, Construction and Maintenance Occupations
The most common Natural Resources, Construction and Maintenance occupations in Huntingdon borough are Construction & Extraction (75 | 2.4%), Installation, Maintenance & Repair (29 | 0.9%), and Farming, Fishing & Forestry (20 | 0.6%).
Natural Resources, Construction and Maintenance Occupations by Sex
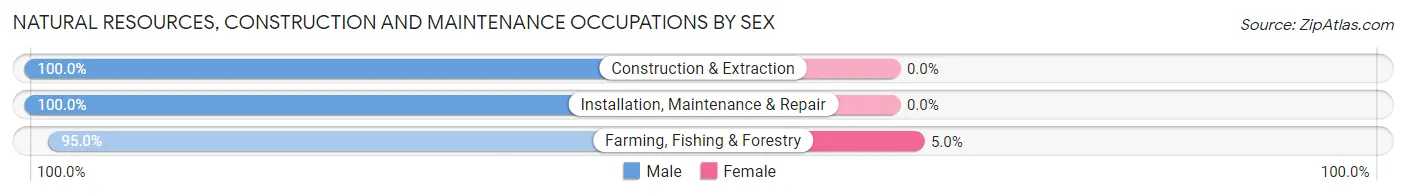
| Occupation | Male | Female |
| Farming, Fishing & Forestry | 19 (95.0%) | 1 (5.0%) |
| Construction & Extraction | 75 (100.0%) | 0 (0.0%) |
| Installation, Maintenance & Repair | 29 (100.0%) | 0 (0.0%) |
| Total (Category) | 123 (99.2%) | 1 (0.8%) |
| Total (Overall) | 1,568 (49.5%) | 1,600 (50.5%) |
Production, Transportation and Moving Occupations
The most common Production, Transportation and Moving occupations in Huntingdon borough are Material Moving (299 | 9.4%), Transportation (100 | 3.2%), and Production (82 | 2.6%).
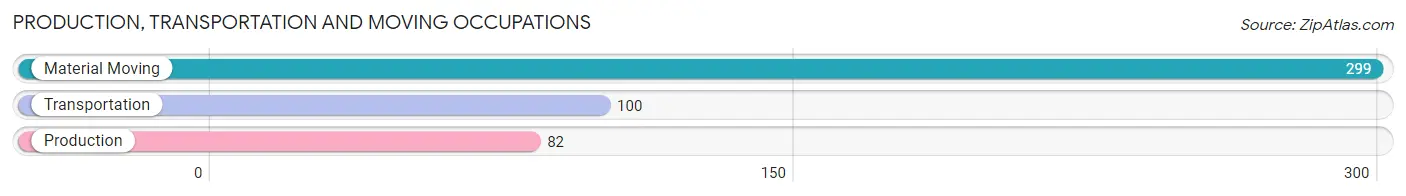
Production, Transportation and Moving Occupations by Sex
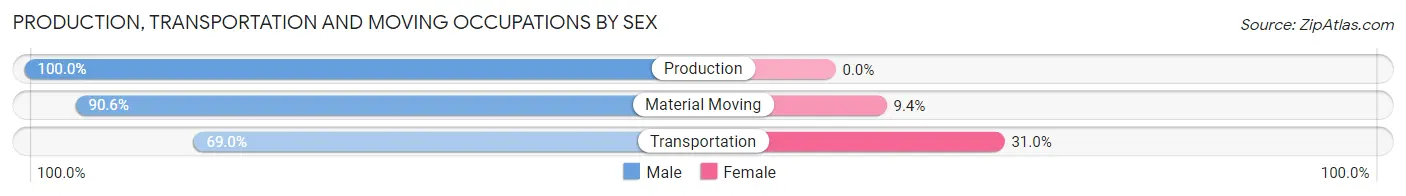
| Occupation | Male | Female |
| Production | 82 (100.0%) | 0 (0.0%) |
| Transportation | 69 (69.0%) | 31 (31.0%) |
| Material Moving | 271 (90.6%) | 28 (9.4%) |
| Total (Category) | 422 (87.7%) | 59 (12.3%) |
| Total (Overall) | 1,568 (49.5%) | 1,600 (50.5%) |
Employment Industries by Sex in Huntingdon borough
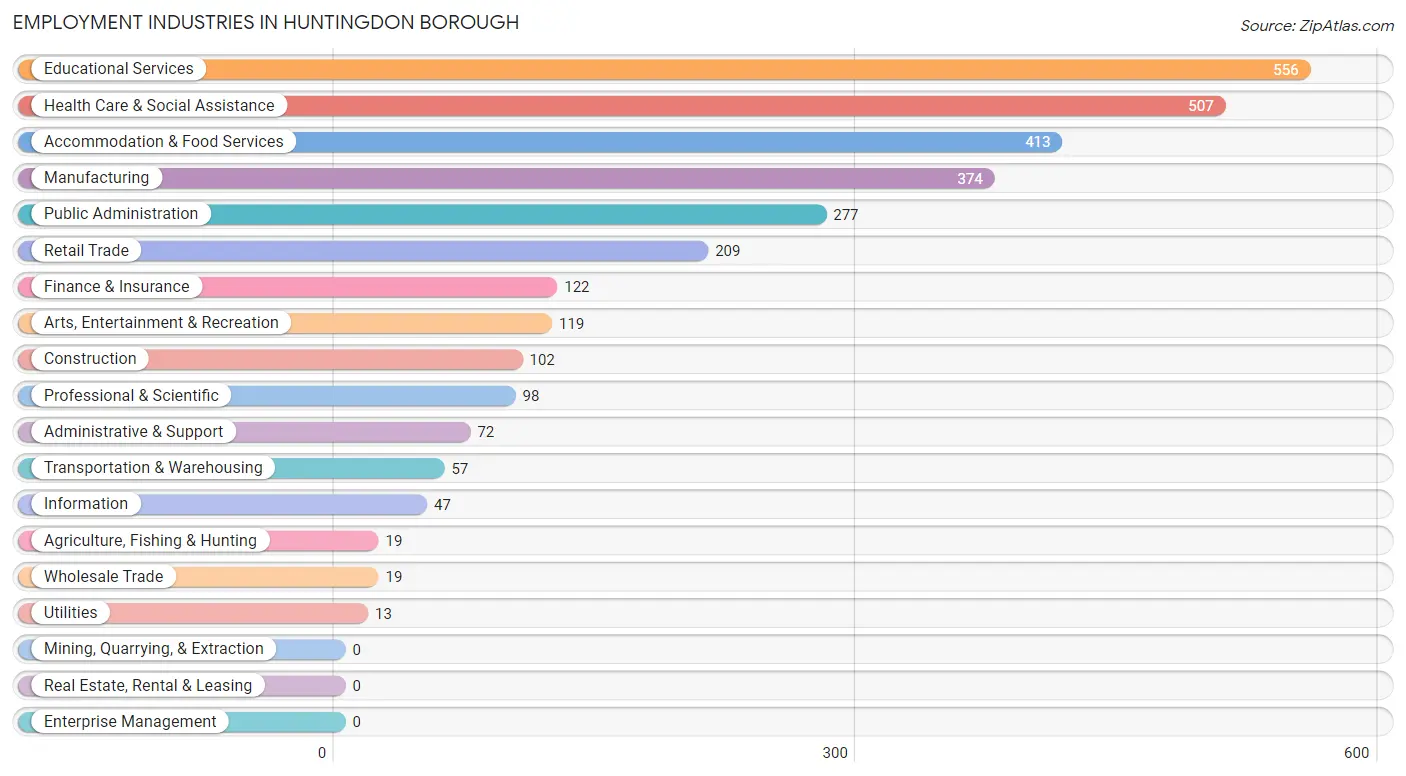
Employment Industries in Huntingdon borough
The major employment industries in Huntingdon borough include Educational Services (556 | 17.5%), Health Care & Social Assistance (507 | 16.0%), Accommodation & Food Services (413 | 13.0%), Manufacturing (374 | 11.8%), and Public Administration (277 | 8.7%).
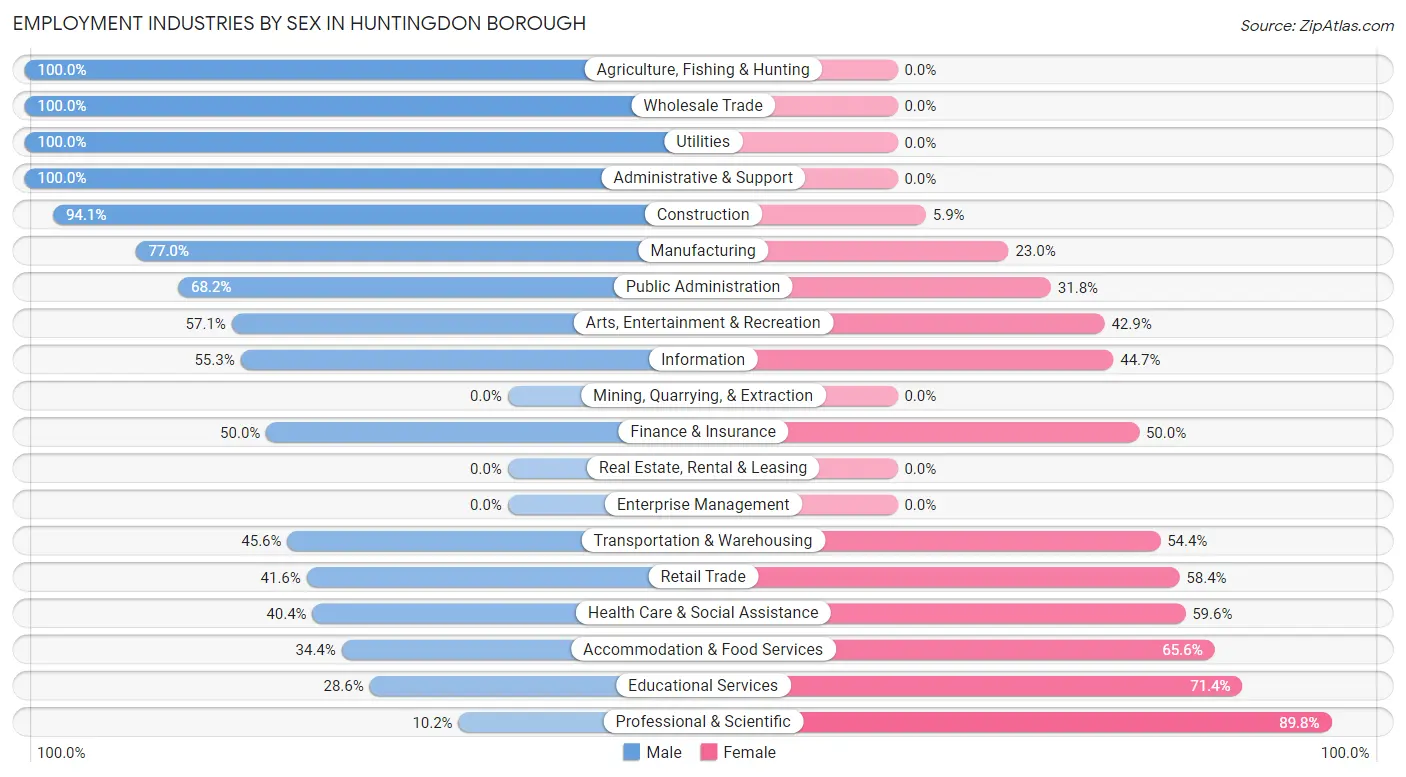
Employment Industries by Sex in Huntingdon borough
The Huntingdon borough industries that see more men than women are Agriculture, Fishing & Hunting (100.0%), Wholesale Trade (100.0%), and Utilities (100.0%), whereas the industries that tend to have a higher number of women are Professional & Scientific (89.8%), Educational Services (71.4%), and Accommodation & Food Services (65.6%).
| Industry | Male | Female |
| Agriculture, Fishing & Hunting | 19 (100.0%) | 0 (0.0%) |
| Mining, Quarrying, & Extraction | 0 (0.0%) | 0 (0.0%) |
| Construction | 96 (94.1%) | 6 (5.9%) |
| Manufacturing | 288 (77.0%) | 86 (23.0%) |
| Wholesale Trade | 19 (100.0%) | 0 (0.0%) |
| Retail Trade | 87 (41.6%) | 122 (58.4%) |
| Transportation & Warehousing | 26 (45.6%) | 31 (54.4%) |
| Utilities | 13 (100.0%) | 0 (0.0%) |
| Information | 26 (55.3%) | 21 (44.7%) |
| Finance & Insurance | 61 (50.0%) | 61 (50.0%) |
| Real Estate, Rental & Leasing | 0 (0.0%) | 0 (0.0%) |
| Professional & Scientific | 10 (10.2%) | 88 (89.8%) |
| Enterprise Management | 0 (0.0%) | 0 (0.0%) |
| Administrative & Support | 72 (100.0%) | 0 (0.0%) |
| Educational Services | 159 (28.6%) | 397 (71.4%) |
| Health Care & Social Assistance | 205 (40.4%) | 302 (59.6%) |
| Arts, Entertainment & Recreation | 68 (57.1%) | 51 (42.9%) |
| Accommodation & Food Services | 142 (34.4%) | 271 (65.6%) |
| Public Administration | 189 (68.2%) | 88 (31.8%) |
| Total | 1,568 (49.5%) | 1,600 (50.5%) |
Education in Huntingdon borough
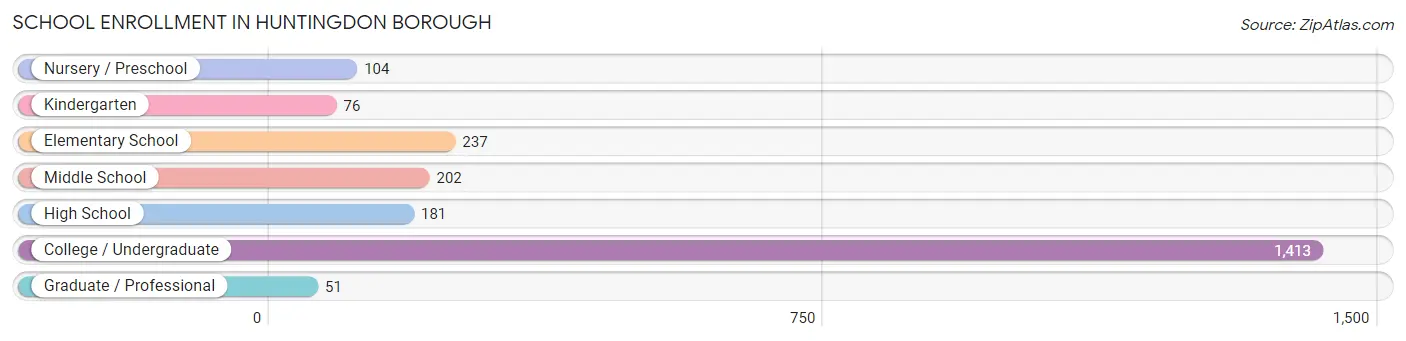
School Enrollment in Huntingdon borough
The most common levels of schooling among the 2,264 students in Huntingdon borough are college / undergraduate (1,413 | 62.4%), elementary school (237 | 10.5%), and middle school (202 | 8.9%).
| School Level | # Students | % Students |
| Nursery / Preschool | 104 | 4.6% |
| Kindergarten | 76 | 3.4% |
| Elementary School | 237 | 10.5% |
| Middle School | 202 | 8.9% |
| High School | 181 | 8.0% |
| College / Undergraduate | 1,413 | 62.4% |
| Graduate / Professional | 51 | 2.2% |
| Total | 2,264 | 100.0% |
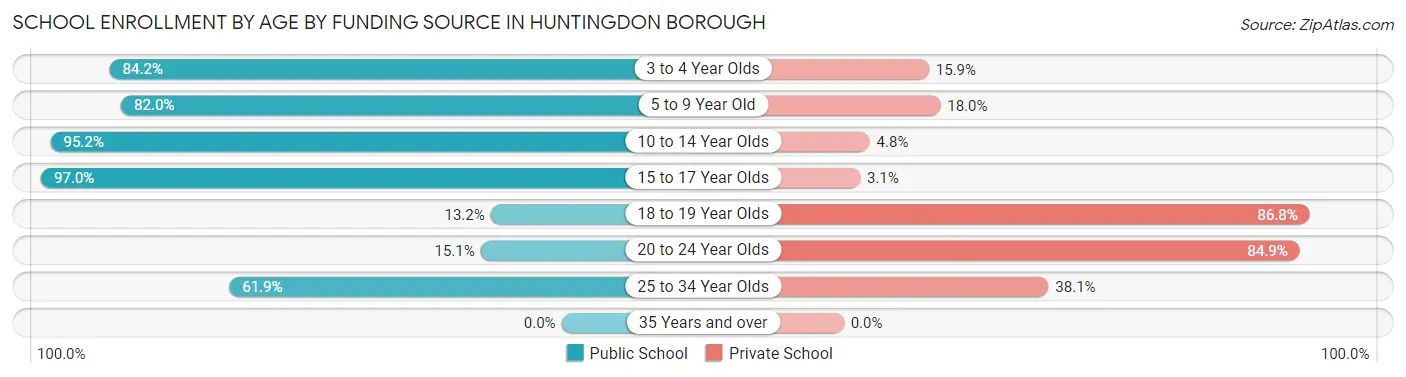
School Enrollment by Age by Funding Source in Huntingdon borough
Out of a total of 2,264 students who are enrolled in schools in Huntingdon borough, 1,306 (57.7%) attend a private institution, while the remaining 958 (42.3%) are enrolled in public schools. The age group of 18 to 19 year olds has the highest likelihood of being enrolled in private schools, with 545 (86.8% in the age bracket) enrolled. Conversely, the age group of 15 to 17 year olds has the lowest likelihood of being enrolled in a private school, with 159 (97.0% in the age bracket) attending a public institution.
| Age Bracket | Public School | Private School |
| 3 to 4 Year Olds | 69 (84.2%) | 13 (15.9%) |
| 5 to 9 Year Old | 237 (82.0%) | 52 (18.0%) |
| 10 to 14 Year Olds | 236 (95.2%) | 12 (4.8%) |
| 15 to 17 Year Olds | 159 (97.0%) | 5 (3.0%) |
| 18 to 19 Year Olds | 83 (13.2%) | 545 (86.8%) |
| 20 to 24 Year Olds | 114 (15.1%) | 642 (84.9%) |
| 25 to 34 Year Olds | 60 (61.9%) | 37 (38.1%) |
| 35 Years and over | 0 (0.0%) | 0 (0.0%) |
| Total | 958 (42.3%) | 1,306 (57.7%) |
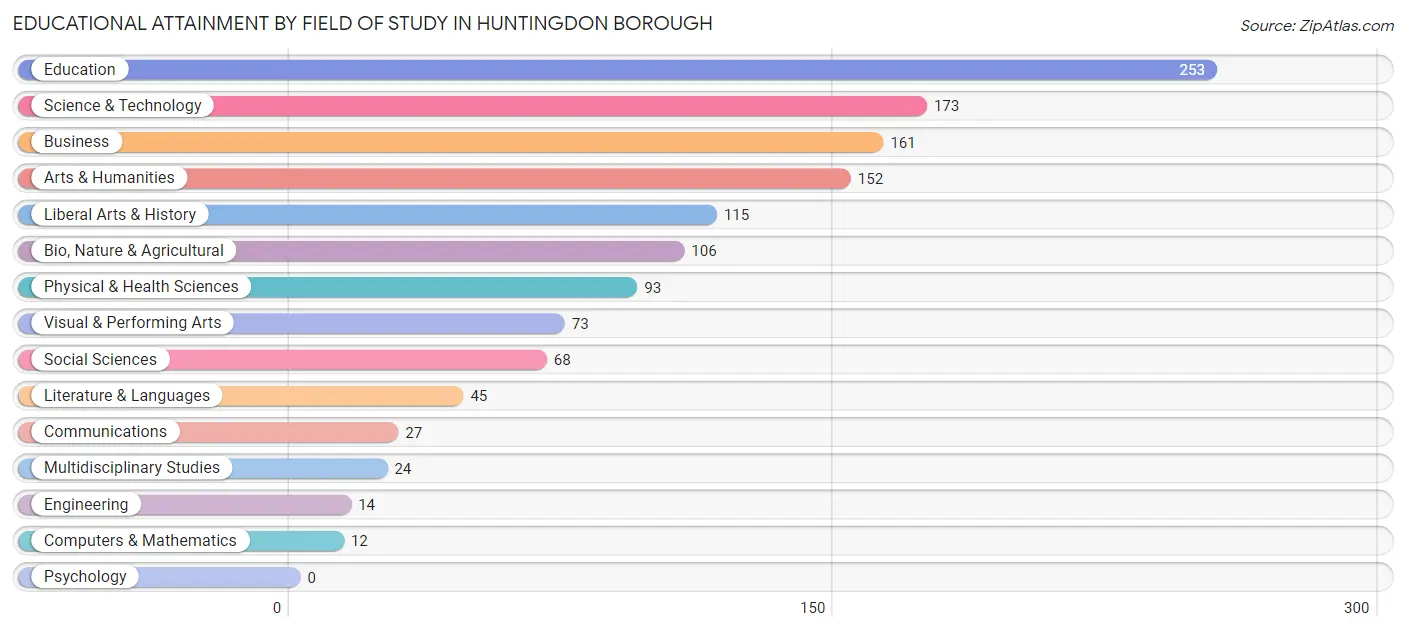
Educational Attainment by Field of Study in Huntingdon borough
Education (253 | 19.2%), science & technology (173 | 13.2%), business (161 | 12.2%), arts & humanities (152 | 11.6%), and liberal arts & history (115 | 8.7%) are the most common fields of study among 1,316 individuals in Huntingdon borough who have obtained a bachelor's degree or higher.
| Field of Study | # Graduates | % Graduates |
| Computers & Mathematics | 12 | 0.9% |
| Bio, Nature & Agricultural | 106 | 8.1% |
| Physical & Health Sciences | 93 | 7.1% |
| Psychology | 0 | 0.0% |
| Social Sciences | 68 | 5.2% |
| Engineering | 14 | 1.1% |
| Multidisciplinary Studies | 24 | 1.8% |
| Science & Technology | 173 | 13.2% |
| Business | 161 | 12.2% |
| Education | 253 | 19.2% |
| Literature & Languages | 45 | 3.4% |
| Liberal Arts & History | 115 | 8.7% |
| Visual & Performing Arts | 73 | 5.6% |
| Communications | 27 | 2.1% |
| Arts & Humanities | 152 | 11.6% |
| Total | 1,316 | 100.0% |
Transportation & Commute in Huntingdon borough
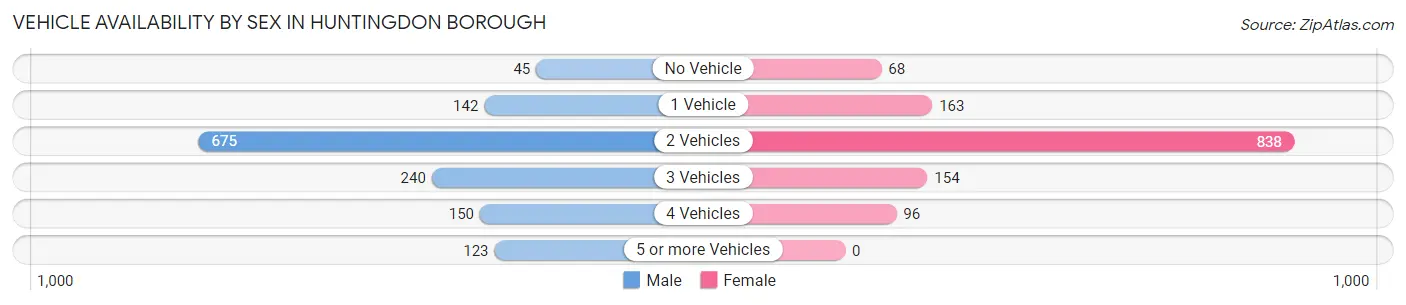
Vehicle Availability by Sex in Huntingdon borough
The most prevalent vehicle ownership categories in Huntingdon borough are males with 2 vehicles (675, accounting for 49.1%) and females with 2 vehicles (838, making up 51.2%).
| Vehicles Available | Male | Female |
| No Vehicle | 45 (3.3%) | 68 (5.2%) |
| 1 Vehicle | 142 (10.3%) | 163 (12.4%) |
| 2 Vehicles | 675 (49.1%) | 838 (63.5%) |
| 3 Vehicles | 240 (17.4%) | 154 (11.7%) |
| 4 Vehicles | 150 (10.9%) | 96 (7.3%) |
| 5 or more Vehicles | 123 (8.9%) | 0 (0.0%) |
| Total | 1,375 (100.0%) | 1,319 (100.0%) |
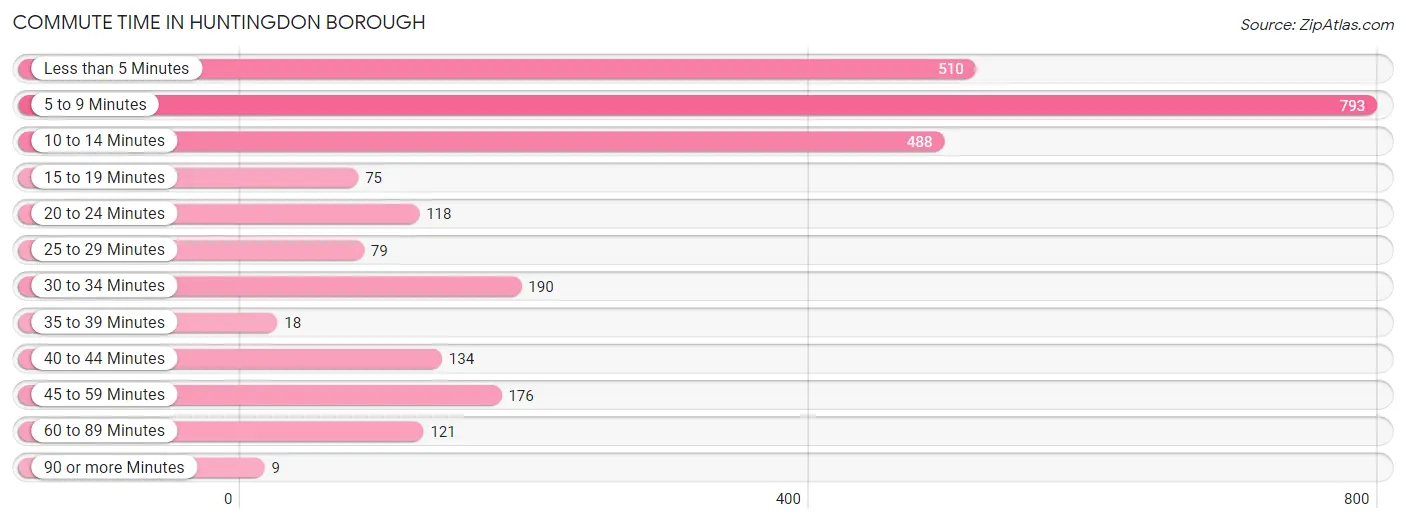
Commute Time in Huntingdon borough
The most frequently occuring commute durations in Huntingdon borough are 5 to 9 minutes (793 commuters, 29.2%), less than 5 minutes (510 commuters, 18.8%), and 10 to 14 minutes (488 commuters, 18.0%).
| Commute Time | # Commuters | % Commuters |
| Less than 5 Minutes | 510 | 18.8% |
| 5 to 9 Minutes | 793 | 29.2% |
| 10 to 14 Minutes | 488 | 18.0% |
| 15 to 19 Minutes | 75 | 2.8% |
| 20 to 24 Minutes | 118 | 4.3% |
| 25 to 29 Minutes | 79 | 2.9% |
| 30 to 34 Minutes | 190 | 7.0% |
| 35 to 39 Minutes | 18 | 0.7% |
| 40 to 44 Minutes | 134 | 4.9% |
| 45 to 59 Minutes | 176 | 6.5% |
| 60 to 89 Minutes | 121 | 4.5% |
| 90 or more Minutes | 9 | 0.3% |
Commute Time by Sex in Huntingdon borough
The most common commute times in Huntingdon borough are 5 to 9 minutes (410 commuters, 29.1%) for males and 5 to 9 minutes (383 commuters, 29.4%) for females.
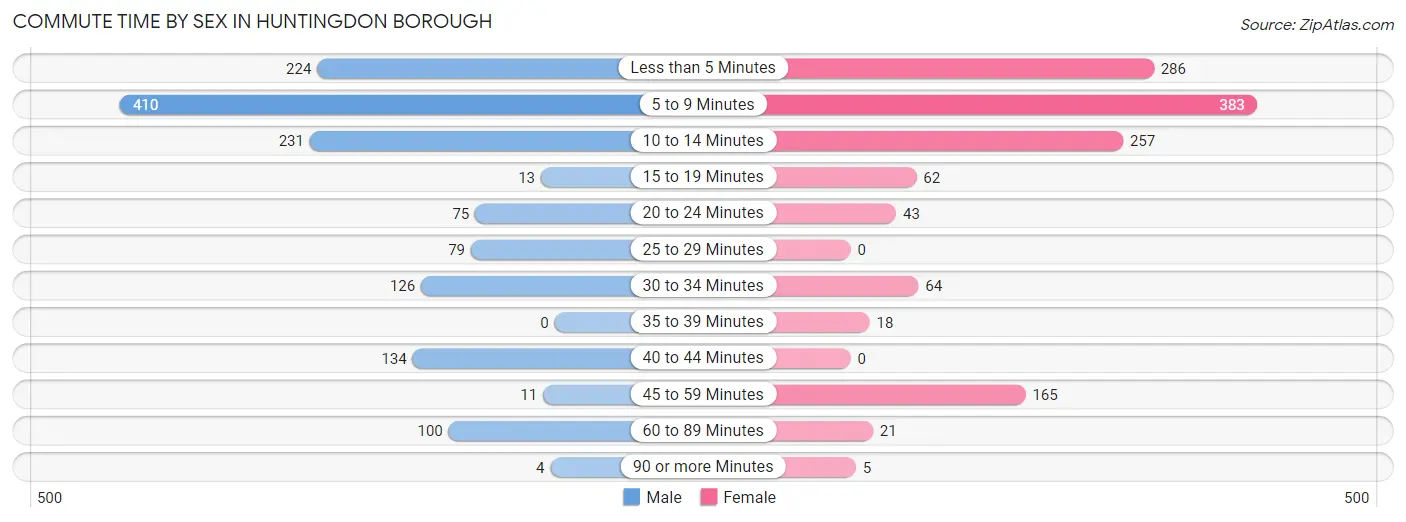
| Commute Time | Male | Female |
| Less than 5 Minutes | 224 (15.9%) | 286 (21.9%) |
| 5 to 9 Minutes | 410 (29.1%) | 383 (29.4%) |
| 10 to 14 Minutes | 231 (16.4%) | 257 (19.7%) |
| 15 to 19 Minutes | 13 (0.9%) | 62 (4.8%) |
| 20 to 24 Minutes | 75 (5.3%) | 43 (3.3%) |
| 25 to 29 Minutes | 79 (5.6%) | 0 (0.0%) |
| 30 to 34 Minutes | 126 (9.0%) | 64 (4.9%) |
| 35 to 39 Minutes | 0 (0.0%) | 18 (1.4%) |
| 40 to 44 Minutes | 134 (9.5%) | 0 (0.0%) |
| 45 to 59 Minutes | 11 (0.8%) | 165 (12.7%) |
| 60 to 89 Minutes | 100 (7.1%) | 21 (1.6%) |
| 90 or more Minutes | 4 (0.3%) | 5 (0.4%) |
Time of Departure to Work by Sex in Huntingdon borough
The most frequent times of departure to work in Huntingdon borough are 5:00 AM to 5:29 AM (259, 18.4%) for males and 7:00 AM to 7:29 AM (304, 23.3%) for females.
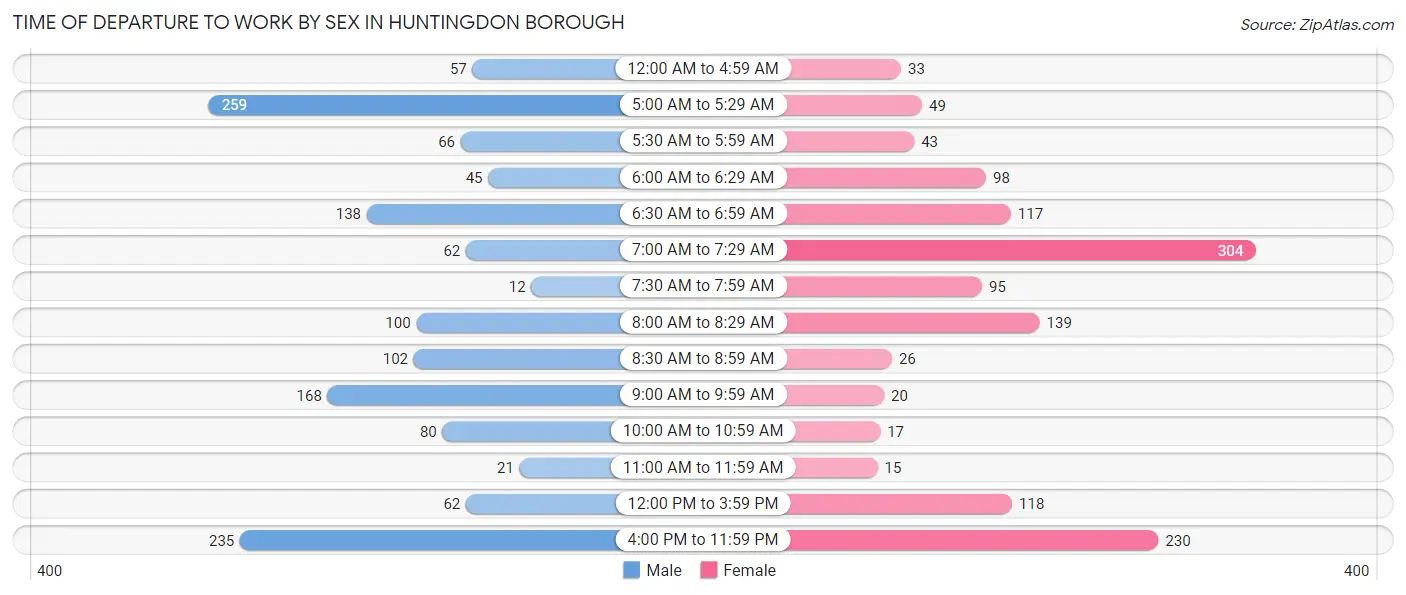
| Time of Departure | Male | Female |
| 12:00 AM to 4:59 AM | 57 (4.1%) | 33 (2.5%) |
| 5:00 AM to 5:29 AM | 259 (18.4%) | 49 (3.8%) |
| 5:30 AM to 5:59 AM | 66 (4.7%) | 43 (3.3%) |
| 6:00 AM to 6:29 AM | 45 (3.2%) | 98 (7.5%) |
| 6:30 AM to 6:59 AM | 138 (9.8%) | 117 (9.0%) |
| 7:00 AM to 7:29 AM | 62 (4.4%) | 304 (23.3%) |
| 7:30 AM to 7:59 AM | 12 (0.9%) | 95 (7.3%) |
| 8:00 AM to 8:29 AM | 100 (7.1%) | 139 (10.7%) |
| 8:30 AM to 8:59 AM | 102 (7.2%) | 26 (2.0%) |
| 9:00 AM to 9:59 AM | 168 (11.9%) | 20 (1.5%) |
| 10:00 AM to 10:59 AM | 80 (5.7%) | 17 (1.3%) |
| 11:00 AM to 11:59 AM | 21 (1.5%) | 15 (1.1%) |
| 12:00 PM to 3:59 PM | 62 (4.4%) | 118 (9.0%) |
| 4:00 PM to 11:59 PM | 235 (16.7%) | 230 (17.6%) |
| Total | 1,407 (100.0%) | 1,304 (100.0%) |
Housing Occupancy in Huntingdon borough
Occupancy by Ownership in Huntingdon borough
Of the total 2,369 dwellings in Huntingdon borough, owner-occupied units account for 1,357 (57.3%), while renter-occupied units make up 1,012 (42.7%).
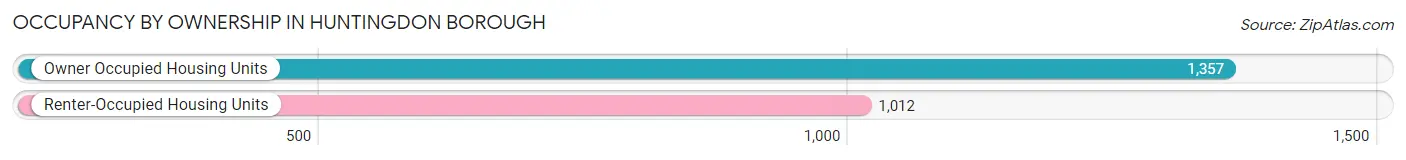
| Occupancy | # Housing Units | % Housing Units |
| Owner Occupied Housing Units | 1,357 | 57.3% |
| Renter-Occupied Housing Units | 1,012 | 42.7% |
| Total Occupied Housing Units | 2,369 | 100.0% |
Occupancy by Household Size in Huntingdon borough
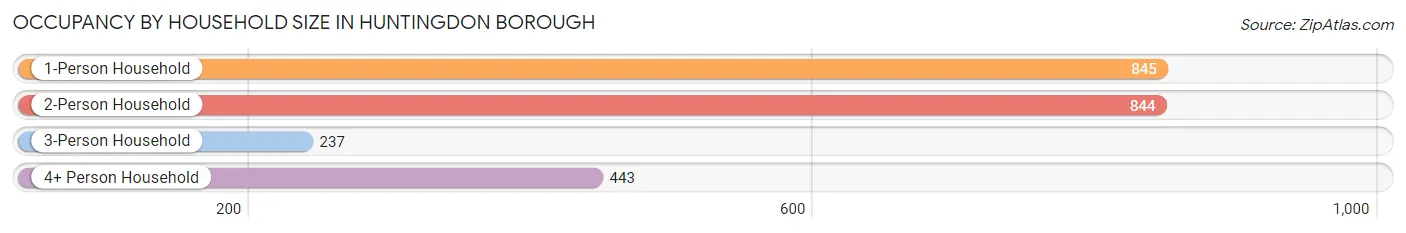
| Household Size | # Housing Units | % Housing Units |
| 1-Person Household | 845 | 35.7% |
| 2-Person Household | 844 | 35.6% |
| 3-Person Household | 237 | 10.0% |
| 4+ Person Household | 443 | 18.7% |
| Total Housing Units | 2,369 | 100.0% |
Occupancy by Ownership by Household Size in Huntingdon borough
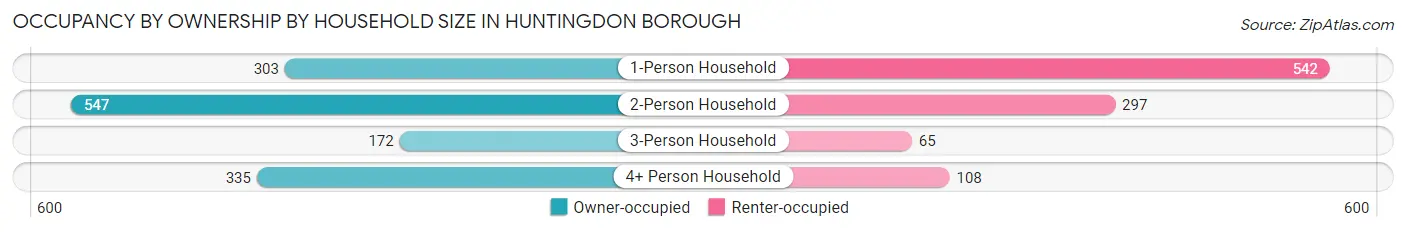
| Household Size | Owner-occupied | Renter-occupied |
| 1-Person Household | 303 (35.9%) | 542 (64.1%) |
| 2-Person Household | 547 (64.8%) | 297 (35.2%) |
| 3-Person Household | 172 (72.6%) | 65 (27.4%) |
| 4+ Person Household | 335 (75.6%) | 108 (24.4%) |
| Total Housing Units | 1,357 (57.3%) | 1,012 (42.7%) |
Occupancy by Educational Attainment in Huntingdon borough
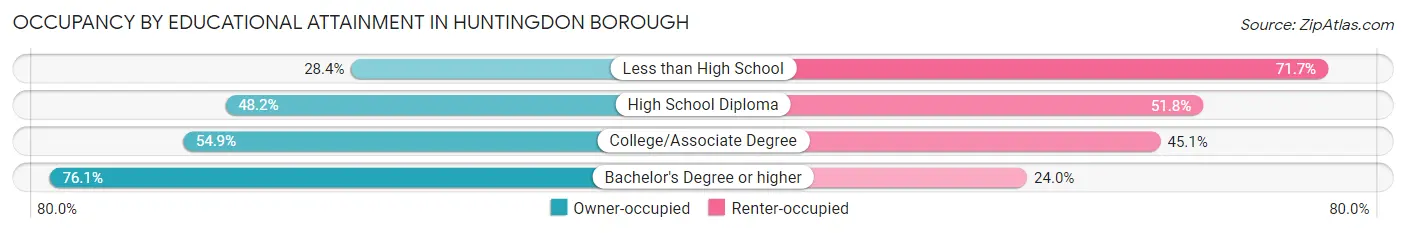
| Household Size | Owner-occupied | Renter-occupied |
| Less than High School | 36 (28.3%) | 91 (71.7%) |
| High School Diploma | 473 (48.2%) | 509 (51.8%) |
| College/Associate Degree | 286 (54.9%) | 235 (45.1%) |
| Bachelor's Degree or higher | 562 (76.0%) | 177 (23.9%) |
Occupancy by Age of Householder in Huntingdon borough
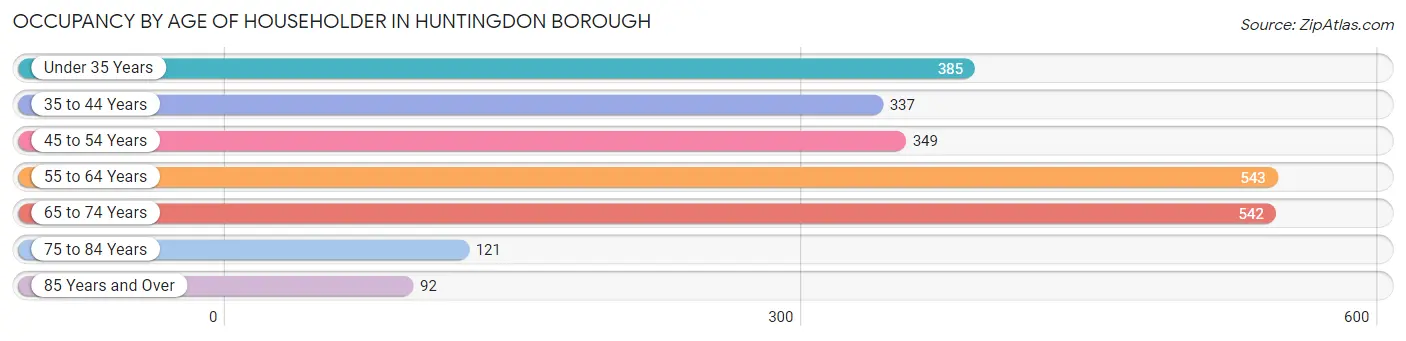
| Age Bracket | # Households | % Households |
| Under 35 Years | 385 | 16.3% |
| 35 to 44 Years | 337 | 14.2% |
| 45 to 54 Years | 349 | 14.7% |
| 55 to 64 Years | 543 | 22.9% |
| 65 to 74 Years | 542 | 22.9% |
| 75 to 84 Years | 121 | 5.1% |
| 85 Years and Over | 92 | 3.9% |
| Total | 2,369 | 100.0% |
Housing Finances in Huntingdon borough
Median Income by Occupancy in Huntingdon borough
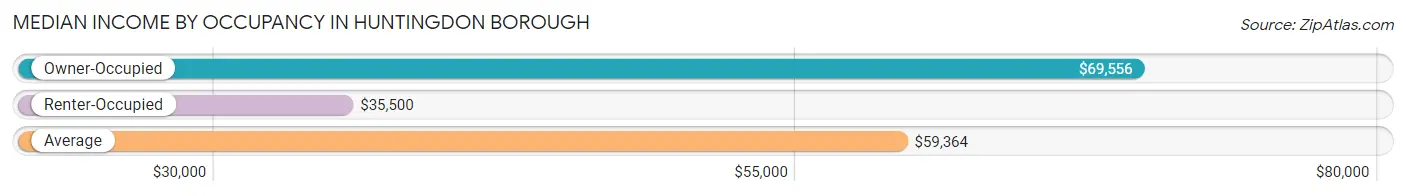
| Occupancy Type | # Households | Median Income |
| Owner-Occupied | 1,357 (57.3%) | $69,556 |
| Renter-Occupied | 1,012 (42.7%) | $35,500 |
| Average | 2,369 (100.0%) | $59,364 |
Occupancy by Householder Income Bracket in Huntingdon borough
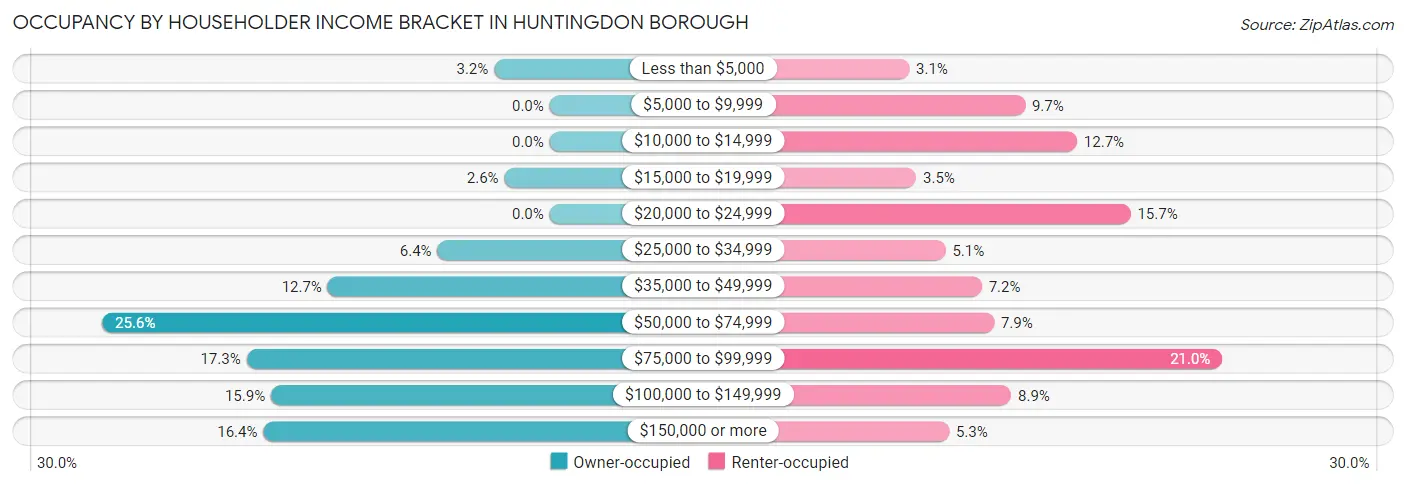
| Income Bracket | Owner-occupied | Renter-occupied |
| Less than $5,000 | 43 (3.2%) | 31 (3.1%) |
| $5,000 to $9,999 | 0 (0.0%) | 98 (9.7%) |
| $10,000 to $14,999 | 0 (0.0%) | 128 (12.7%) |
| $15,000 to $19,999 | 35 (2.6%) | 35 (3.5%) |
| $20,000 to $24,999 | 0 (0.0%) | 159 (15.7%) |
| $25,000 to $34,999 | 87 (6.4%) | 52 (5.1%) |
| $35,000 to $49,999 | 172 (12.7%) | 73 (7.2%) |
| $50,000 to $74,999 | 347 (25.6%) | 80 (7.9%) |
| $75,000 to $99,999 | 235 (17.3%) | 212 (20.9%) |
| $100,000 to $149,999 | 216 (15.9%) | 90 (8.9%) |
| $150,000 or more | 222 (16.4%) | 54 (5.3%) |
| Total | 1,357 (100.0%) | 1,012 (100.0%) |
Monthly Housing Cost Tiers in Huntingdon borough
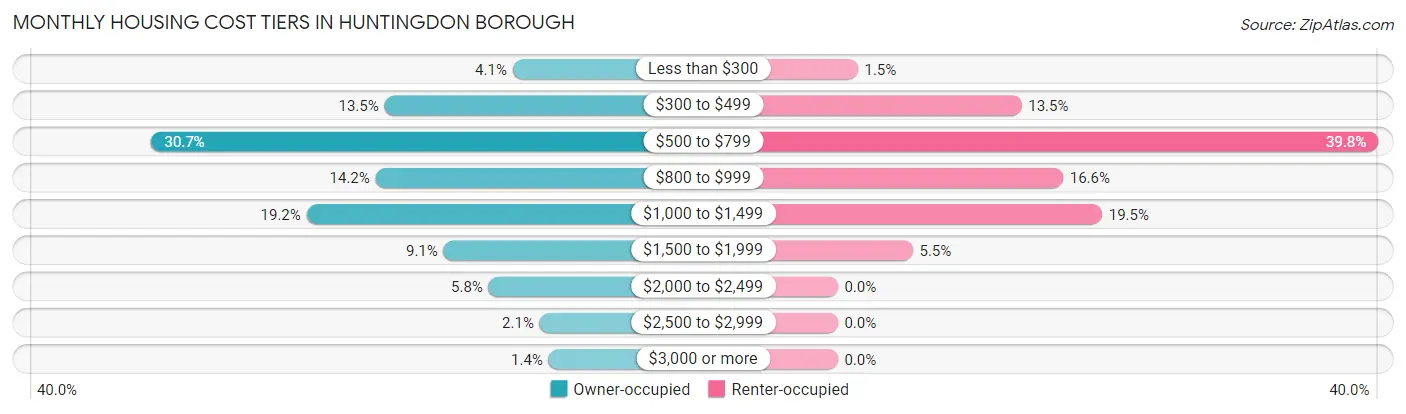
| Monthly Cost | Owner-occupied | Renter-occupied |
| Less than $300 | 55 (4.1%) | 15 (1.5%) |
| $300 to $499 | 183 (13.5%) | 137 (13.5%) |
| $500 to $799 | 416 (30.7%) | 403 (39.8%) |
| $800 to $999 | 192 (14.1%) | 168 (16.6%) |
| $1,000 to $1,499 | 261 (19.2%) | 197 (19.5%) |
| $1,500 to $1,999 | 124 (9.1%) | 56 (5.5%) |
| $2,000 to $2,499 | 79 (5.8%) | 0 (0.0%) |
| $2,500 to $2,999 | 28 (2.1%) | 0 (0.0%) |
| $3,000 or more | 19 (1.4%) | 0 (0.0%) |
| Total | 1,357 (100.0%) | 1,012 (100.0%) |
Physical Housing Characteristics in Huntingdon borough
Housing Structures in Huntingdon borough
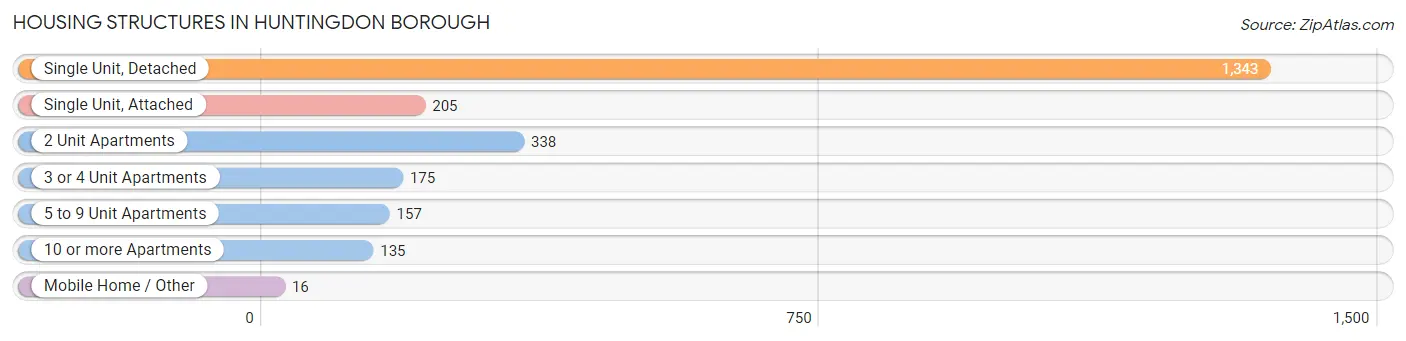
| Structure Type | # Housing Units | % Housing Units |
| Single Unit, Detached | 1,343 | 56.7% |
| Single Unit, Attached | 205 | 8.6% |
| 2 Unit Apartments | 338 | 14.3% |
| 3 or 4 Unit Apartments | 175 | 7.4% |
| 5 to 9 Unit Apartments | 157 | 6.6% |
| 10 or more Apartments | 135 | 5.7% |
| Mobile Home / Other | 16 | 0.7% |
| Total | 2,369 | 100.0% |
Housing Structures by Occupancy in Huntingdon borough
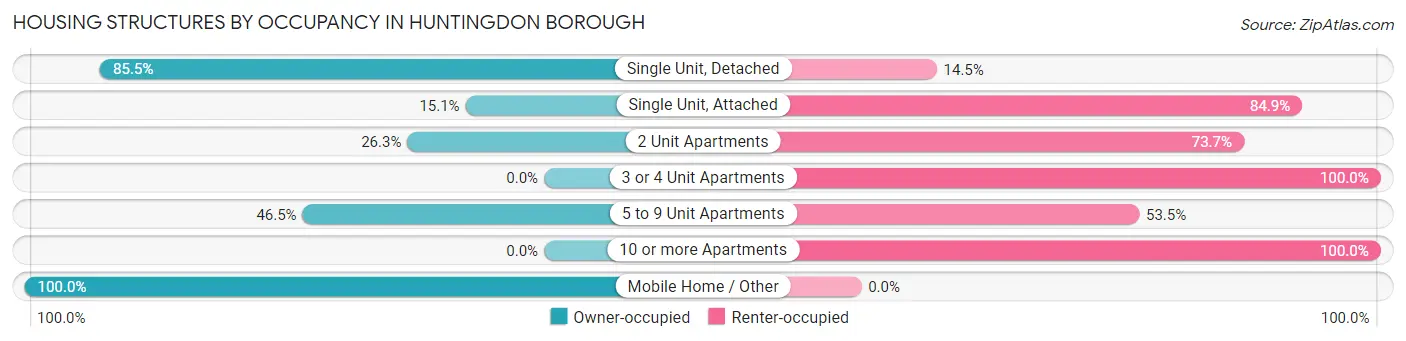
| Structure Type | Owner-occupied | Renter-occupied |
| Single Unit, Detached | 1,148 (85.5%) | 195 (14.5%) |
| Single Unit, Attached | 31 (15.1%) | 174 (84.9%) |
| 2 Unit Apartments | 89 (26.3%) | 249 (73.7%) |
| 3 or 4 Unit Apartments | 0 (0.0%) | 175 (100.0%) |
| 5 to 9 Unit Apartments | 73 (46.5%) | 84 (53.5%) |
| 10 or more Apartments | 0 (0.0%) | 135 (100.0%) |
| Mobile Home / Other | 16 (100.0%) | 0 (0.0%) |
| Total | 1,357 (57.3%) | 1,012 (42.7%) |
Housing Structures by Number of Rooms in Huntingdon borough
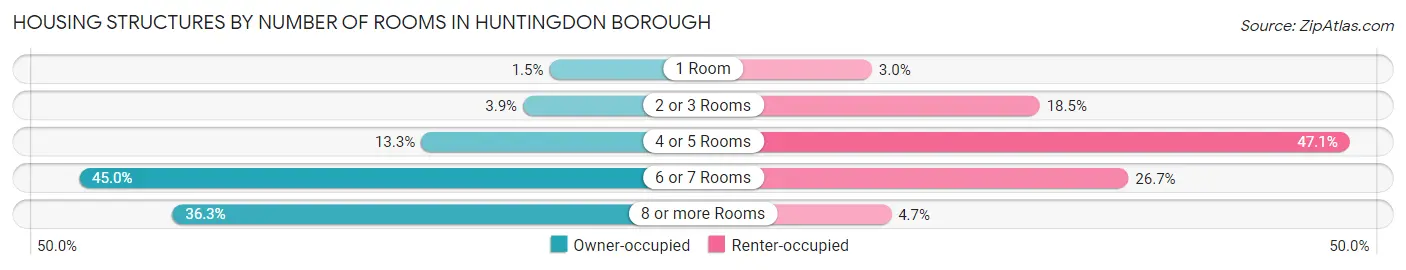
| Number of Rooms | Owner-occupied | Renter-occupied |
| 1 Room | 20 (1.5%) | 30 (3.0%) |
| 2 or 3 Rooms | 53 (3.9%) | 187 (18.5%) |
| 4 or 5 Rooms | 181 (13.3%) | 477 (47.1%) |
| 6 or 7 Rooms | 610 (45.0%) | 270 (26.7%) |
| 8 or more Rooms | 493 (36.3%) | 48 (4.7%) |
| Total | 1,357 (100.0%) | 1,012 (100.0%) |
Housing Structure by Heating Type in Huntingdon borough
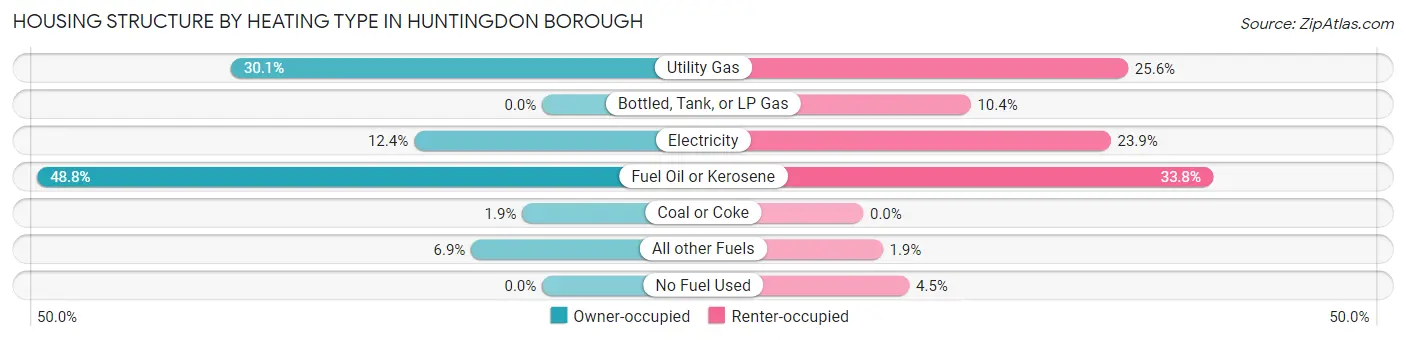
| Heating Type | Owner-occupied | Renter-occupied |
| Utility Gas | 408 (30.1%) | 259 (25.6%) |
| Bottled, Tank, or LP Gas | 0 (0.0%) | 105 (10.4%) |
| Electricity | 168 (12.4%) | 242 (23.9%) |
| Fuel Oil or Kerosene | 662 (48.8%) | 342 (33.8%) |
| Coal or Coke | 26 (1.9%) | 0 (0.0%) |
| All other Fuels | 93 (6.9%) | 19 (1.9%) |
| No Fuel Used | 0 (0.0%) | 45 (4.4%) |
| Total | 1,357 (100.0%) | 1,012 (100.0%) |
Household Vehicle Usage in Huntingdon borough
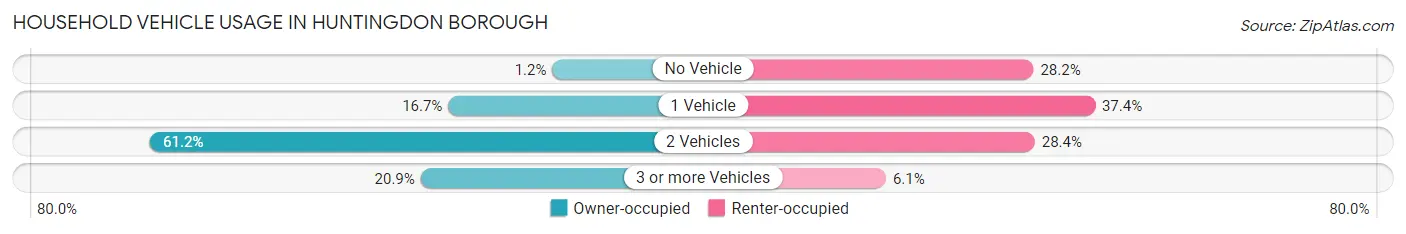
| Vehicles per Household | Owner-occupied | Renter-occupied |
| No Vehicle | 16 (1.2%) | 285 (28.2%) |
| 1 Vehicle | 227 (16.7%) | 378 (37.3%) |
| 2 Vehicles | 831 (61.2%) | 287 (28.4%) |
| 3 or more Vehicles | 283 (20.8%) | 62 (6.1%) |
| Total | 1,357 (100.0%) | 1,012 (100.0%) |
Real Estate & Mortgages in Huntingdon borough
Real Estate and Mortgage Overview in Huntingdon borough
| Characteristic | Without Mortgage | With Mortgage |
| Housing Units | 633 | 724 |
| Median Property Value | $203,300 | $187,500 |
| Median Household Income | $68,589 | $143 |
| Monthly Housing Costs | $587 | $19 |
| Real Estate Taxes | $2,043 | $0 |
Property Value by Mortgage Status in Huntingdon borough
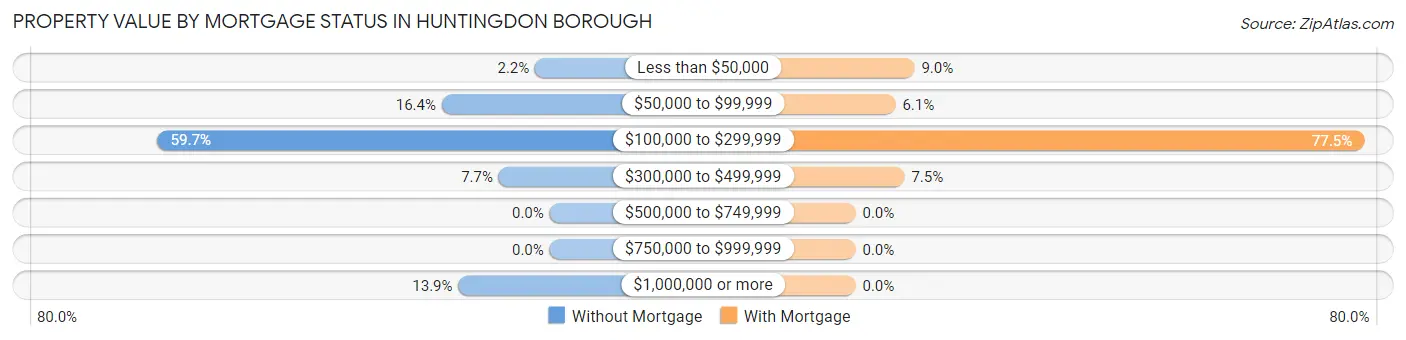
| Property Value | Without Mortgage | With Mortgage |
| Less than $50,000 | 14 (2.2%) | 65 (9.0%) |
| $50,000 to $99,999 | 104 (16.4%) | 44 (6.1%) |
| $100,000 to $299,999 | 378 (59.7%) | 561 (77.5%) |
| $300,000 to $499,999 | 49 (7.7%) | 54 (7.5%) |
| $500,000 to $749,999 | 0 (0.0%) | 0 (0.0%) |
| $750,000 to $999,999 | 0 (0.0%) | 0 (0.0%) |
| $1,000,000 or more | 88 (13.9%) | 0 (0.0%) |
| Total | 633 (100.0%) | 724 (100.0%) |
Household Income by Mortgage Status in Huntingdon borough
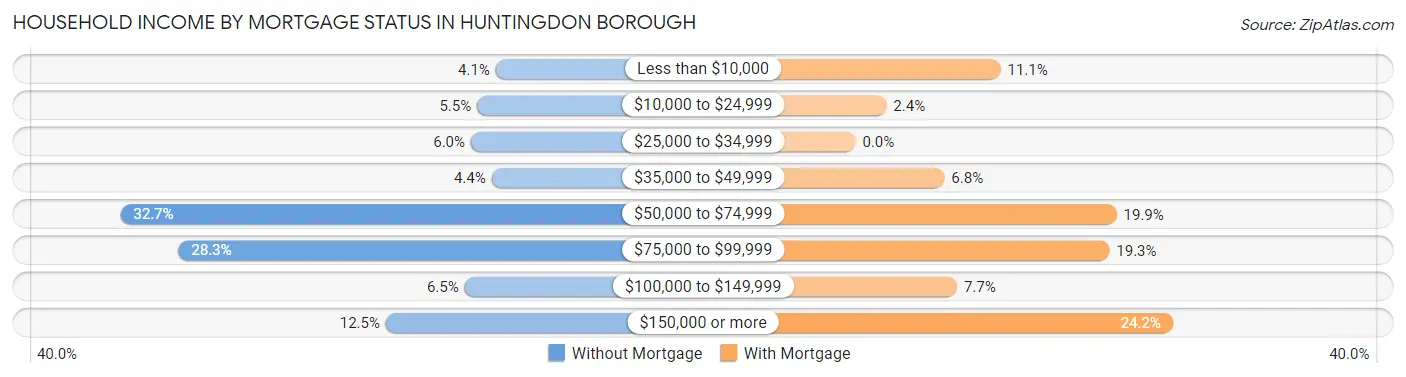
| Household Income | Without Mortgage | With Mortgage |
| Less than $10,000 | 26 (4.1%) | 80 (11.1%) |
| $10,000 to $24,999 | 35 (5.5%) | 17 (2.4%) |
| $25,000 to $34,999 | 38 (6.0%) | 0 (0.0%) |
| $35,000 to $49,999 | 28 (4.4%) | 49 (6.8%) |
| $50,000 to $74,999 | 207 (32.7%) | 144 (19.9%) |
| $75,000 to $99,999 | 179 (28.3%) | 140 (19.3%) |
| $100,000 to $149,999 | 41 (6.5%) | 56 (7.7%) |
| $150,000 or more | 79 (12.5%) | 175 (24.2%) |
| Total | 633 (100.0%) | 724 (100.0%) |
Property Value to Household Income Ratio in Huntingdon borough
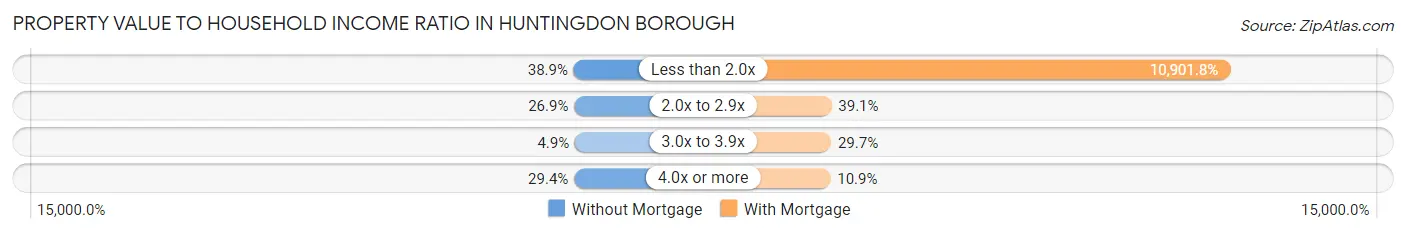
| Value-to-Income Ratio | Without Mortgage | With Mortgage |
| Less than 2.0x | 246 (38.9%) | 78,929 (10,901.8%) |
| 2.0x to 2.9x | 170 (26.9%) | 283 (39.1%) |
| 3.0x to 3.9x | 31 (4.9%) | 215 (29.7%) |
| 4.0x or more | 186 (29.4%) | 79 (10.9%) |
| Total | 633 (100.0%) | 724 (100.0%) |
Real Estate Taxes by Mortgage Status in Huntingdon borough
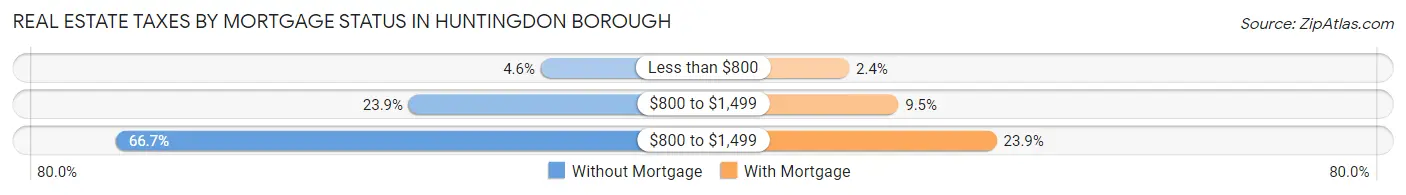
| Property Taxes | Without Mortgage | With Mortgage |
| Less than $800 | 29 (4.6%) | 17 (2.4%) |
| $800 to $1,499 | 151 (23.8%) | 69 (9.5%) |
| $800 to $1,499 | 422 (66.7%) | 173 (23.9%) |
| Total | 633 (100.0%) | 724 (100.0%) |
Health & Disability in Huntingdon borough
Health Insurance Coverage by Age in Huntingdon borough
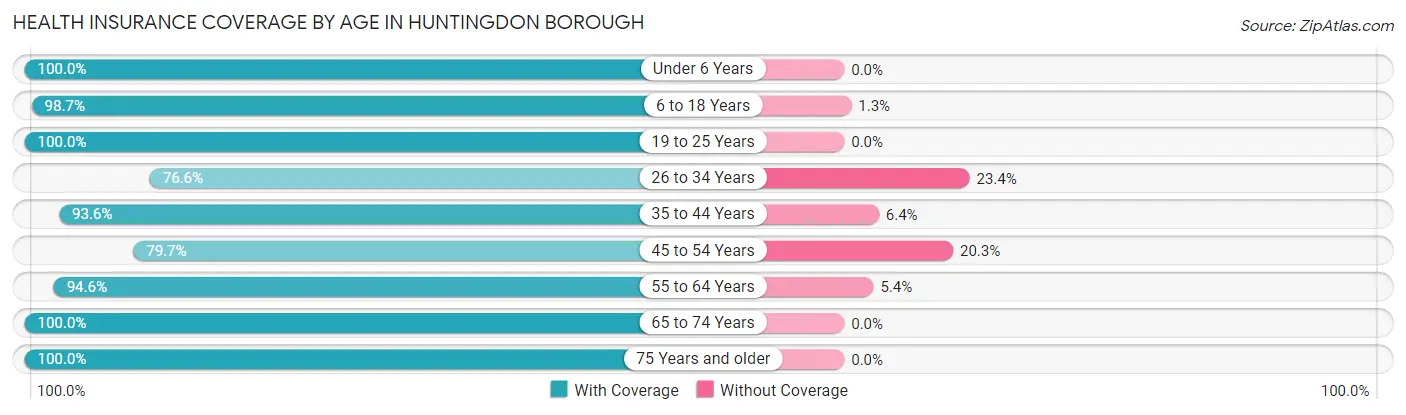
| Age Bracket | With Coverage | Without Coverage |
| Under 6 Years | 387 (100.0%) | 0 (0.0%) |
| 6 to 18 Years | 904 (98.7%) | 12 (1.3%) |
| 19 to 25 Years | 1,440 (100.0%) | 0 (0.0%) |
| 26 to 34 Years | 574 (76.6%) | 175 (23.4%) |
| 35 to 44 Years | 567 (93.6%) | 39 (6.4%) |
| 45 to 54 Years | 570 (79.7%) | 145 (20.3%) |
| 55 to 64 Years | 765 (94.6%) | 44 (5.4%) |
| 65 to 74 Years | 752 (100.0%) | 0 (0.0%) |
| 75 Years and older | 336 (100.0%) | 0 (0.0%) |
| Total | 6,295 (93.8%) | 415 (6.2%) |
Health Insurance Coverage by Citizenship Status in Huntingdon borough
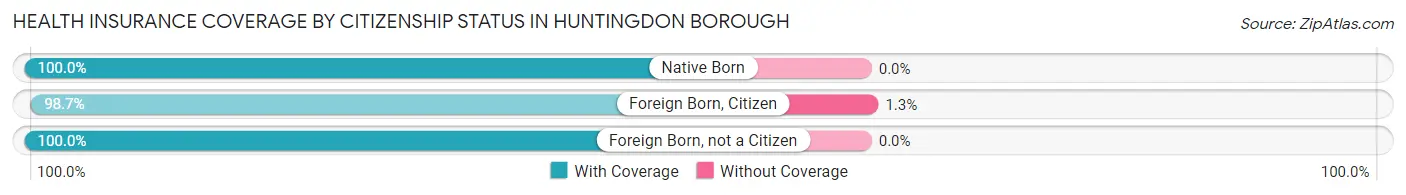
| Citizenship Status | With Coverage | Without Coverage |
| Native Born | 387 (100.0%) | 0 (0.0%) |
| Foreign Born, Citizen | 904 (98.7%) | 12 (1.3%) |
| Foreign Born, not a Citizen | 1,440 (100.0%) | 0 (0.0%) |
Health Insurance Coverage by Household Income in Huntingdon borough
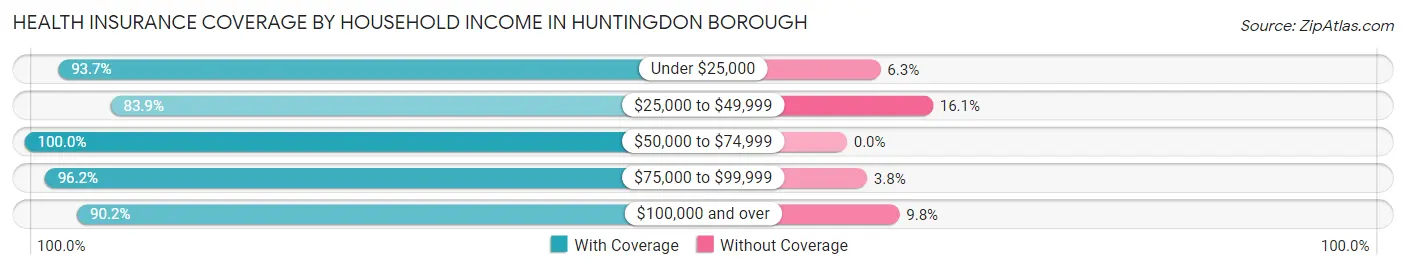
| Household Income | With Coverage | Without Coverage |
| Under $25,000 | 773 (93.7%) | 52 (6.3%) |
| $25,000 to $49,999 | 802 (83.9%) | 154 (16.1%) |
| $50,000 to $74,999 | 939 (100.0%) | 0 (0.0%) |
| $75,000 to $99,999 | 1,124 (96.2%) | 44 (3.8%) |
| $100,000 and over | 1,384 (90.2%) | 151 (9.8%) |
Public vs Private Health Insurance Coverage by Age in Huntingdon borough
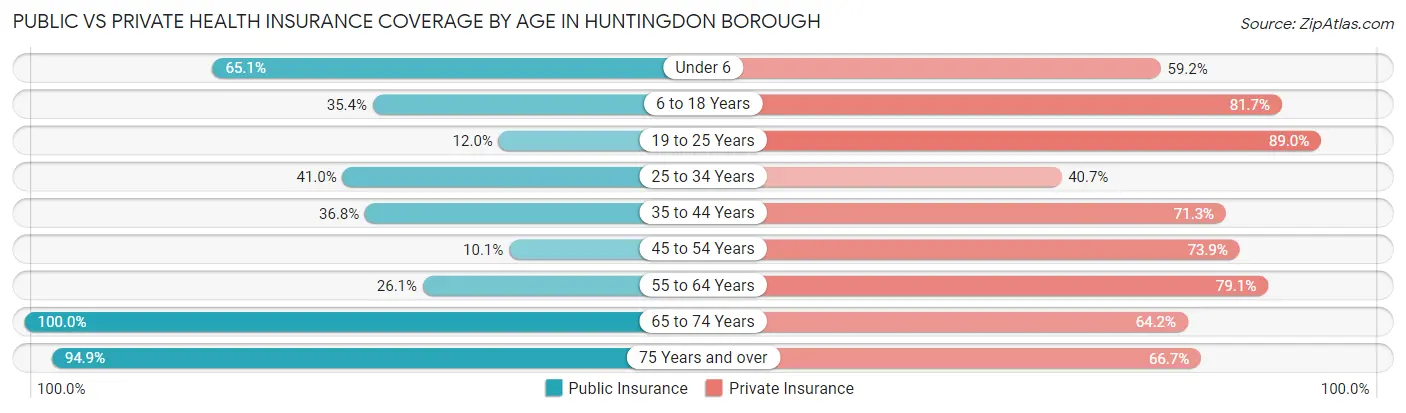
| Age Bracket | Public Insurance | Private Insurance |
| Under 6 | 252 (65.1%) | 229 (59.2%) |
| 6 to 18 Years | 324 (35.4%) | 748 (81.7%) |
| 19 to 25 Years | 173 (12.0%) | 1,281 (89.0%) |
| 25 to 34 Years | 307 (41.0%) | 305 (40.7%) |
| 35 to 44 Years | 223 (36.8%) | 432 (71.3%) |
| 45 to 54 Years | 72 (10.1%) | 528 (73.9%) |
| 55 to 64 Years | 211 (26.1%) | 640 (79.1%) |
| 65 to 74 Years | 752 (100.0%) | 483 (64.2%) |
| 75 Years and over | 319 (94.9%) | 224 (66.7%) |
| Total | 2,633 (39.2%) | 4,870 (72.6%) |
Disability Status by Sex by Age in Huntingdon borough
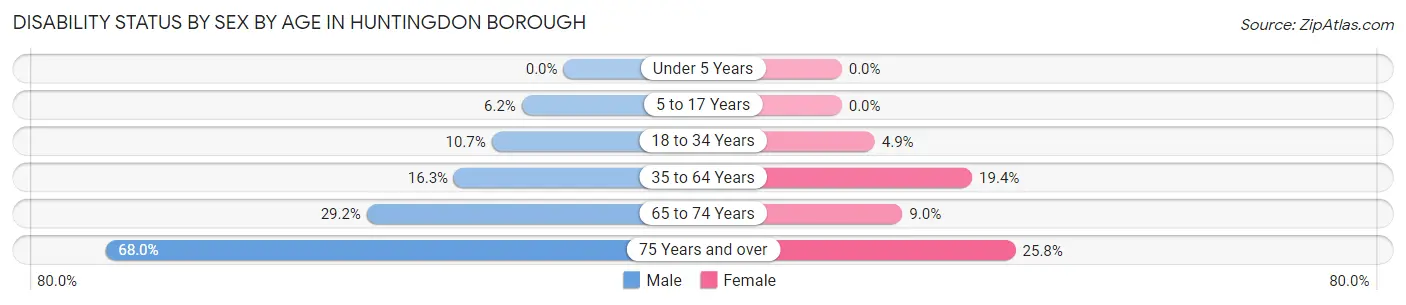
| Age Bracket | Male | Female |
| Under 5 Years | 0 (0.0%) | 0 (0.0%) |
| 5 to 17 Years | 18 (6.2%) | 0 (0.0%) |
| 18 to 34 Years | 130 (10.7%) | 62 (4.9%) |
| 35 to 64 Years | 164 (16.3%) | 217 (19.4%) |
| 65 to 74 Years | 80 (29.2%) | 43 (9.0%) |
| 75 Years and over | 102 (68.0%) | 48 (25.8%) |
Disability Class by Sex by Age in Huntingdon borough
Disability Class: Hearing Difficulty
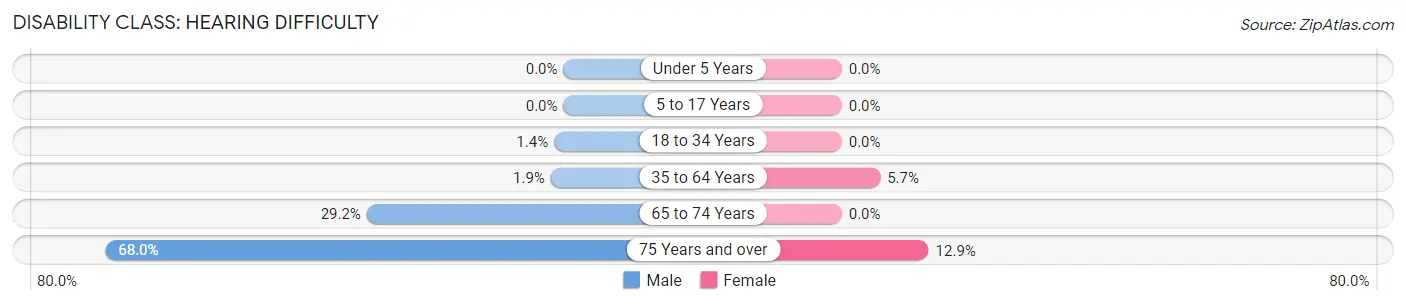
| Age Bracket | Male | Female |
| Under 5 Years | 0 (0.0%) | 0 (0.0%) |
| 5 to 17 Years | 0 (0.0%) | 0 (0.0%) |
| 18 to 34 Years | 17 (1.4%) | 0 (0.0%) |
| 35 to 64 Years | 19 (1.9%) | 64 (5.7%) |
| 65 to 74 Years | 80 (29.2%) | 0 (0.0%) |
| 75 Years and over | 102 (68.0%) | 24 (12.9%) |
Disability Class: Vision Difficulty
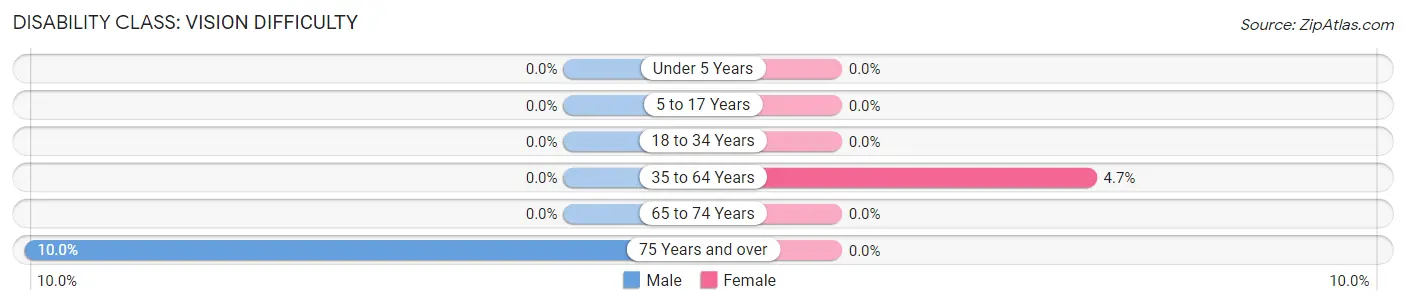
| Age Bracket | Male | Female |
| Under 5 Years | 0 (0.0%) | 0 (0.0%) |
| 5 to 17 Years | 0 (0.0%) | 0 (0.0%) |
| 18 to 34 Years | 0 (0.0%) | 0 (0.0%) |
| 35 to 64 Years | 0 (0.0%) | 53 (4.7%) |
| 65 to 74 Years | 0 (0.0%) | 0 (0.0%) |
| 75 Years and over | 15 (10.0%) | 0 (0.0%) |
Disability Class: Cognitive Difficulty
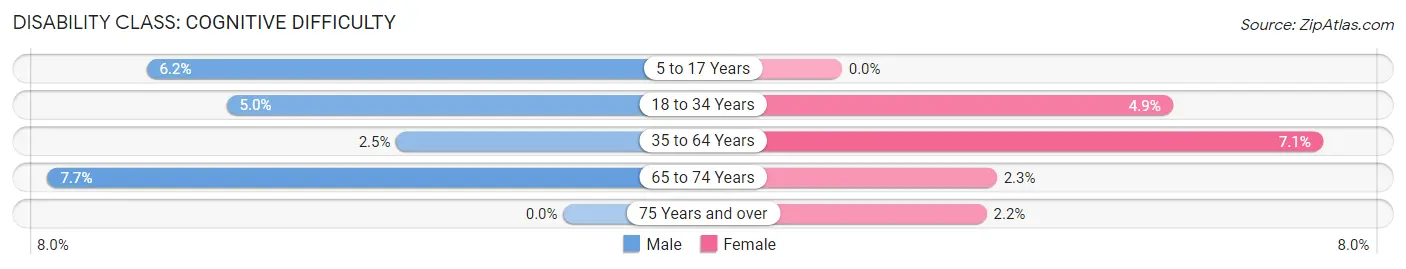
| Age Bracket | Male | Female |
| 5 to 17 Years | 18 (6.2%) | 0 (0.0%) |
| 18 to 34 Years | 61 (5.0%) | 62 (4.9%) |
| 35 to 64 Years | 25 (2.5%) | 80 (7.1%) |
| 65 to 74 Years | 21 (7.7%) | 11 (2.3%) |
| 75 Years and over | 0 (0.0%) | 4 (2.1%) |
Disability Class: Ambulatory Difficulty
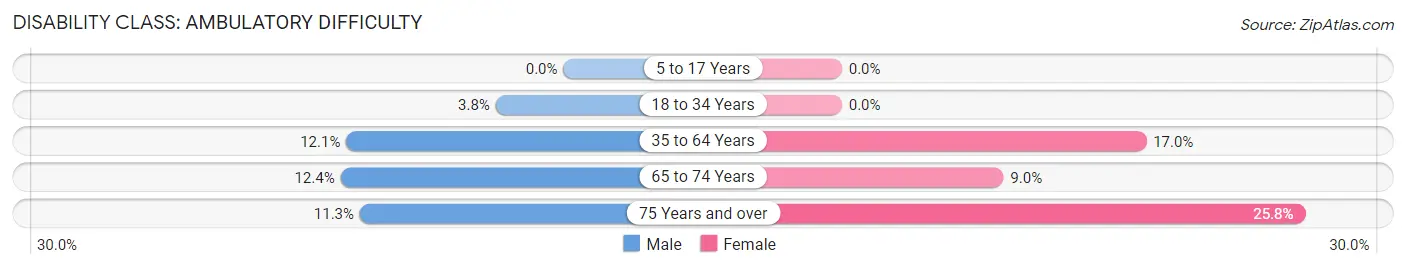
| Age Bracket | Male | Female |
| 5 to 17 Years | 0 (0.0%) | 0 (0.0%) |
| 18 to 34 Years | 46 (3.8%) | 0 (0.0%) |
| 35 to 64 Years | 122 (12.1%) | 190 (17.0%) |
| 65 to 74 Years | 34 (12.4%) | 43 (9.0%) |
| 75 Years and over | 17 (11.3%) | 48 (25.8%) |
Disability Class: Self-Care Difficulty
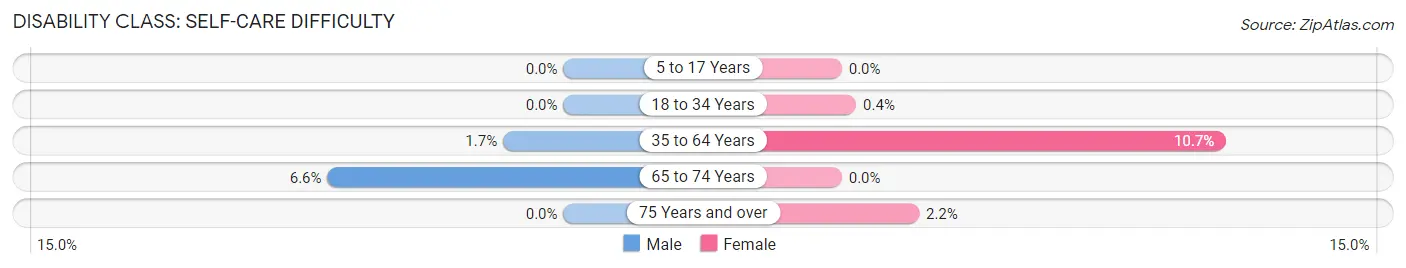
| Age Bracket | Male | Female |
| 5 to 17 Years | 0 (0.0%) | 0 (0.0%) |
| 18 to 34 Years | 0 (0.0%) | 5 (0.4%) |
| 35 to 64 Years | 17 (1.7%) | 120 (10.7%) |
| 65 to 74 Years | 18 (6.6%) | 0 (0.0%) |
| 75 Years and over | 0 (0.0%) | 4 (2.1%) |
Technology Access in Huntingdon borough
Computing Device Access in Huntingdon borough
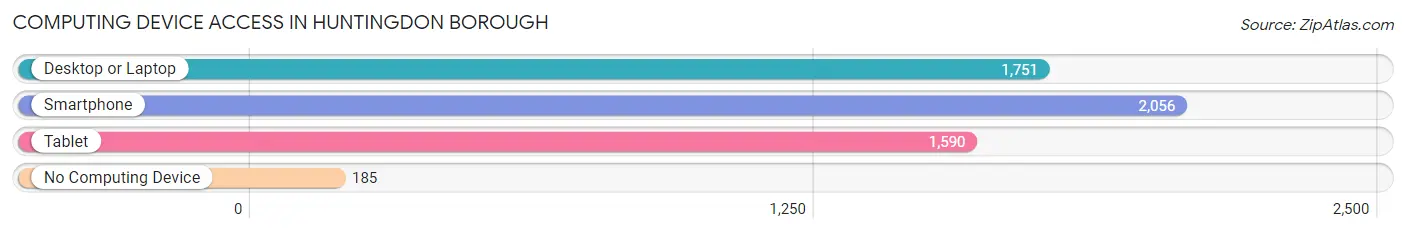
| Device Type | # Households | % Households |
| Desktop or Laptop | 1,751 | 73.9% |
| Smartphone | 2,056 | 86.8% |
| Tablet | 1,590 | 67.1% |
| No Computing Device | 185 | 7.8% |
| Total | 2,369 | 100.0% |
Internet Access in Huntingdon borough
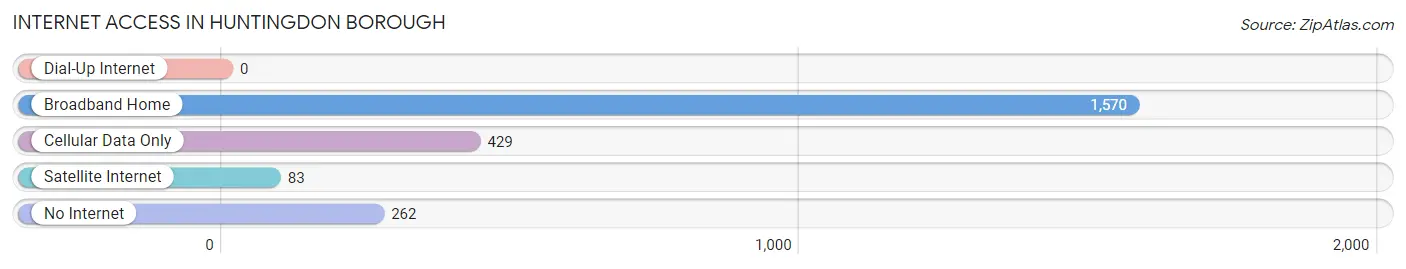
| Internet Type | # Households | % Households |
| Dial-Up Internet | 0 | 0.0% |
| Broadband Home | 1,570 | 66.3% |
| Cellular Data Only | 429 | 18.1% |
| Satellite Internet | 83 | 3.5% |
| No Internet | 262 | 11.1% |
| Total | 2,369 | 100.0% |
Huntingdon borough Summary
Huntingdon Borough is a borough located in Huntingdon County, Pennsylvania. It is the county seat of Huntingdon County and is located along the Juniata River. The population of Huntingdon Borough was 5,097 at the 2010 census.
History
Huntingdon Borough was founded in 1767 by William Smith, a prominent landowner and surveyor. Smith named the borough after his friend, Selina Hastings, Countess of Huntingdon. The borough was incorporated in 1815 and was the county seat of Huntingdon County.
The borough was an important stop on the Pennsylvania Canal, which ran through the borough from 1834 to 1871. The canal was used to transport goods and passengers between Philadelphia and Pittsburgh.
The borough was also an important stop on the Pennsylvania Railroad, which ran through the borough from 1849 to 1971. The railroad was used to transport goods and passengers between Philadelphia and Pittsburgh.
The borough was also an important stop on the Pennsylvania Turnpike, which ran through the borough from 1940 to 1968. The turnpike was used to transport goods and passengers between Philadelphia and Pittsburgh.
Geography
Huntingdon Borough is located at 40°31'17" North, 78°0'17" West (40.5214, -78.0047). It is situated along the Juniata River in Huntingdon County.
The borough has a total area of 1 2 square miles all of which is land
Demographics
As of the 2010 census, there were 5,097 people, 2,093 households, and 1,232 families residing in the borough. The population density was 4,248.3 people per square mile. There were 2,309 housing units at an average density of 1,924.2 per square mile.
The racial makeup of the borough was 97.2% White, 0.7% African American, 0.2% Native American, 0.5% Asian, 0.1% Pacific Islander, 0.4% from other races, and 0.9% from two or more races. Hispanic or Latino of any race were 1.2% of the population.
There were 2,093 households, out of which 28.2% had children under the age of 18 living with them, 41.2% were married couples living together, 14.2% had a female householder with no husband present, and 39.7% were non-families. 33.7% of all households were made up of individuals, and 15.2% had someone living alone who was 65 years of age or older. The average household size was 2.30 and the average family size was 2.93.
The median age in the borough was 39.2 years. 22.2% of residents were under the age of 18; 8.2% were between the ages of 18 and 24; 25.2% were from 25 to 44; 25.2% were from 45 to 64; and 19.2% were 65 years of age or older. The gender makeup of the borough was 47.2% male and 52.8% female.
Economy
Huntingdon Borough is home to several businesses, including a variety of retail stores, restaurants, and professional services. The borough is also home to several manufacturing companies, including a paper mill, a printing company, and a metal fabrication company.
The borough is also home to Juniata College, a private liberal arts college. The college has an enrollment of approximately 1,400 students and offers a variety of undergraduate and graduate degree programs.
The borough is also home to the Huntingdon County Courthouse, which is the seat of government for Huntingdon County. The courthouse is home to the county's court system, as well as the county's administrative offices.
The borough is also home to the Huntingdon County Historical Society, which is dedicated to preserving the history of Huntingdon County. The society operates a museum and library, as well as a variety of educational programs.
Common Questions
What is Per Capita Income in Huntingdon borough?
Per Capita income in Huntingdon borough is $30,794.
What is the Median Family Income in Huntingdon borough?
Median Family Income in Huntingdon borough is $75,604.
What is the Median Household income in Huntingdon borough?
Median Household Income in Huntingdon borough is $59,364.
What is Income or Wage Gap in Huntingdon borough?
Income or Wage Gap in Huntingdon borough is 41.2%.
Women in Huntingdon borough earn 58.8 cents for every dollar earned by a man.
What is Inequality or Gini Index in Huntingdon borough?
Inequality or Gini Index in Huntingdon borough is 0.48.
What is the Total Population of Huntingdon borough?
Total Population of Huntingdon borough is 6,904.
What is the Total Male Population of Huntingdon borough?
Total Male Population of Huntingdon borough is 3,146.
What is the Total Female Population of Huntingdon borough?
Total Female Population of Huntingdon borough is 3,758.
What is the Ratio of Males per 100 Females in Huntingdon borough?
There are 83.71 Males per 100 Females in Huntingdon borough.
What is the Ratio of Females per 100 Males in Huntingdon borough?
There are 119.45 Females per 100 Males in Huntingdon borough.
What is the Median Population Age in Huntingdon borough?
Median Population Age in Huntingdon borough is 34.5 Years.
What is the Average Family Size in Huntingdon borough
Average Family Size in Huntingdon borough is 3.0 People.
What is the Average Household Size in Huntingdon borough
Average Household Size in Huntingdon borough is 2.3 People.
How Large is the Labor Force in Huntingdon borough?
There are 3,297 People in the Labor Forcein in Huntingdon borough.
What is the Percentage of People in the Labor Force in Huntingdon borough?
54.6% of People are in the Labor Force in Huntingdon borough.
What is the Unemployment Rate in Huntingdon borough?
Unemployment Rate in Huntingdon borough is 3.9%.