Perkasie borough, PA Map & Demographics
Perkasie borough Overview
$46,725
PER CAPITA INCOME
$121,335
AVG FAMILY INCOME
$95,319
AVG HOUSEHOLD INCOME
47.5%
WAGE / INCOME GAP [ % ]
52.5¢/ $1
WAGE / INCOME GAP [ $ ]
0.42
INEQUALITY / GINI INDEX
9,130
TOTAL POPULATION
4,508
MALE POPULATION
4,622
FEMALE POPULATION
97.53
MALES / 100 FEMALES
102.53
FEMALES / 100 MALES
37.1
MEDIAN AGE
3.1
AVG FAMILY SIZE
2.6
AVG HOUSEHOLD SIZE
5,812
LABOR FORCE [ PEOPLE ]
76.8%
PERCENT IN LABOR FORCE
3.8%
UNEMPLOYMENT RATE
Income in Perkasie borough
Income Overview in Perkasie borough
Per Capita Income in Perkasie borough is $46,725, while median incomes of families and households are $121,335 and $95,319 respectively.
| Characteristic | Number | Measure |
| Per Capita Income | 9,130 | $46,725 |
| Median Family Income | 2,409 | $121,335 |
| Mean Family Income | 2,409 | $143,143 |
| Median Household Income | 3,495 | $95,319 |
| Mean Household Income | 3,495 | $120,750 |
| Income Deficit | 2,409 | $0 |
| Wage / Income Gap (%) | 9,130 | 47.50% |
| Wage / Income Gap ($) | 9,130 | 52.50¢ per $1 |
| Gini / Inequality Index | 9,130 | 0.42 |
Earnings by Sex in Perkasie borough
Average Earnings in Perkasie borough are $47,136, $63,594 for men and $33,384 for women, a difference of 47.5%.
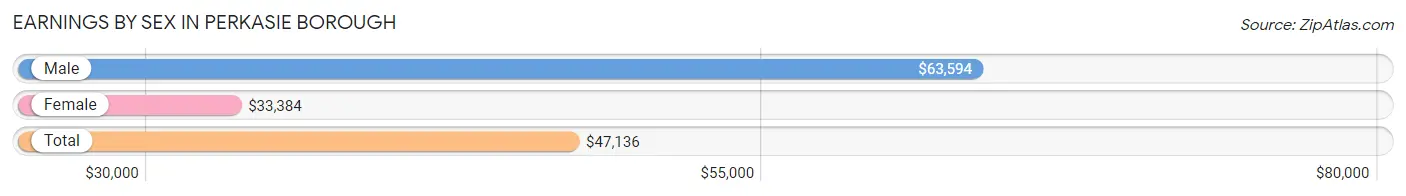
| Sex | Number | Average Earnings |
| Male | 2,981 (49.8%) | $63,594 |
| Female | 3,009 (50.2%) | $33,384 |
| Total | 5,990 (100.0%) | $47,136 |
Earnings by Sex by Income Bracket in Perkasie borough
The most common earnings brackets in Perkasie borough are $100,000+ for men (683 | 22.9%) and $100,000+ for women (398 | 13.2%).
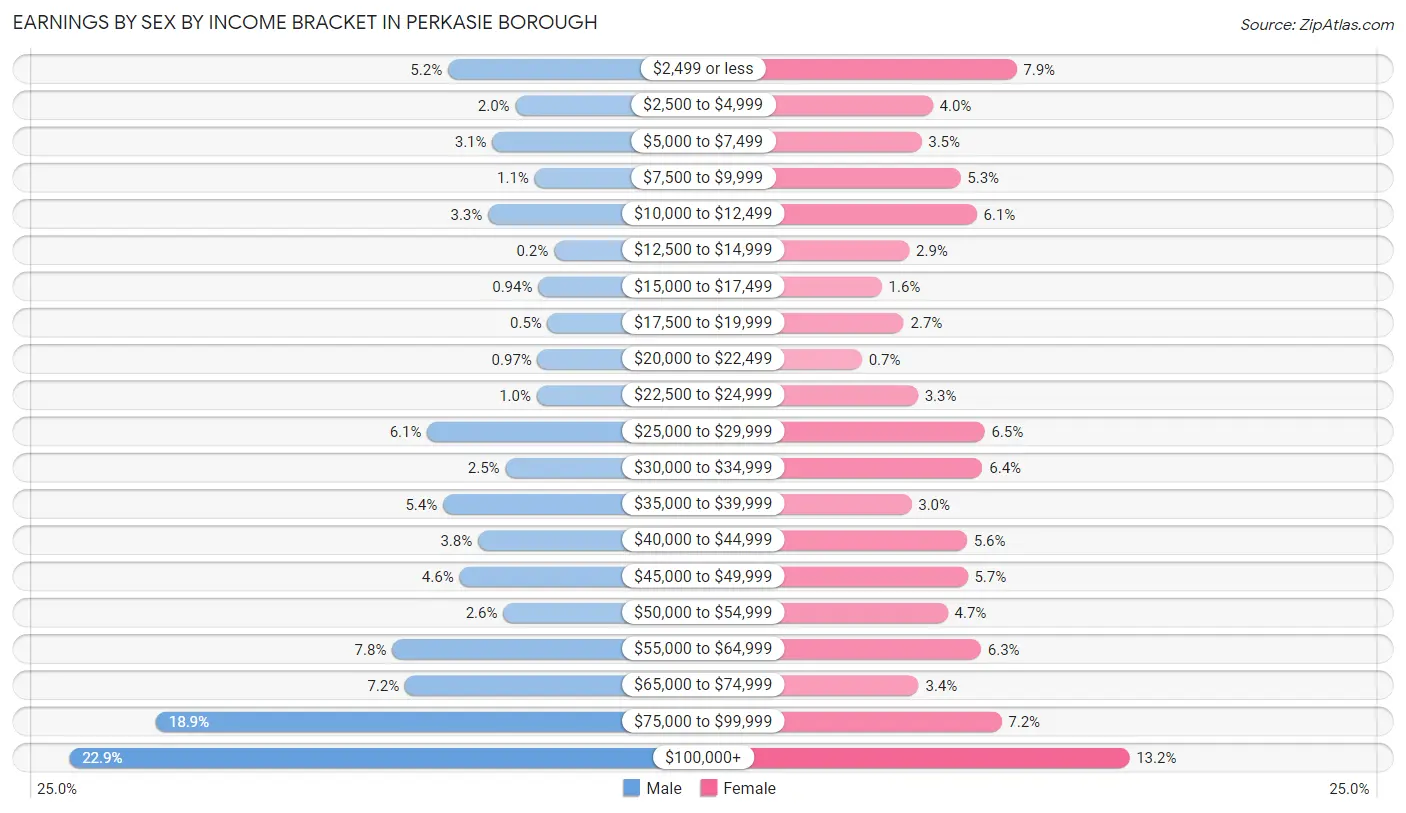
| Income | Male | Female |
| $2,499 or less | 154 (5.2%) | 239 (7.9%) |
| $2,500 to $4,999 | 60 (2.0%) | 121 (4.0%) |
| $5,000 to $7,499 | 92 (3.1%) | 105 (3.5%) |
| $7,500 to $9,999 | 33 (1.1%) | 160 (5.3%) |
| $10,000 to $12,499 | 98 (3.3%) | 183 (6.1%) |
| $12,500 to $14,999 | 6 (0.2%) | 88 (2.9%) |
| $15,000 to $17,499 | 28 (0.9%) | 49 (1.6%) |
| $17,500 to $19,999 | 15 (0.5%) | 80 (2.7%) |
| $20,000 to $22,499 | 29 (1.0%) | 21 (0.7%) |
| $22,500 to $24,999 | 30 (1.0%) | 100 (3.3%) |
| $25,000 to $29,999 | 183 (6.1%) | 194 (6.5%) |
| $30,000 to $34,999 | 74 (2.5%) | 191 (6.4%) |
| $35,000 to $39,999 | 161 (5.4%) | 91 (3.0%) |
| $40,000 to $44,999 | 112 (3.8%) | 169 (5.6%) |
| $45,000 to $49,999 | 138 (4.6%) | 170 (5.7%) |
| $50,000 to $54,999 | 77 (2.6%) | 142 (4.7%) |
| $55,000 to $64,999 | 232 (7.8%) | 189 (6.3%) |
| $65,000 to $74,999 | 214 (7.2%) | 101 (3.4%) |
| $75,000 to $99,999 | 562 (18.9%) | 218 (7.2%) |
| $100,000+ | 683 (22.9%) | 398 (13.2%) |
| Total | 2,981 (100.0%) | 3,009 (100.0%) |
Earnings by Sex by Educational Attainment in Perkasie borough
Average earnings in Perkasie borough are $73,899 for men and $45,188 for women, a difference of 38.9%. Men with an educational attainment of graduate degree enjoy the highest average annual earnings of $133,750, while those with less than high school education earn the least with $49,167. Women with an educational attainment of graduate degree earn the most with the average annual earnings of $81,563, while those with high school diploma education have the smallest earnings of $32,927.
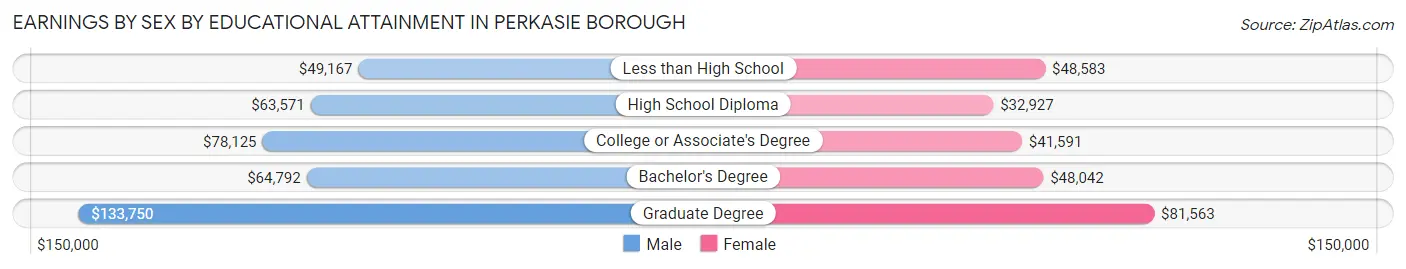
| Educational Attainment | Male Income | Female Income |
| Less than High School | $49,167 | $48,583 |
| High School Diploma | $63,571 | $32,927 |
| College or Associate's Degree | $78,125 | $41,591 |
| Bachelor's Degree | $64,792 | $48,042 |
| Graduate Degree | $133,750 | $81,563 |
| Total | $73,899 | $45,188 |
Family Income in Perkasie borough
Family Income Brackets in Perkasie borough
According to the Perkasie borough family income data, there are 554 families falling into the $200,000+ income range, which is the most common income bracket and makes up 23.0% of all families. Conversely, the $10,000 to $14,999 income bracket is the least frequent group with only 14 families (0.6%) belonging to this category.
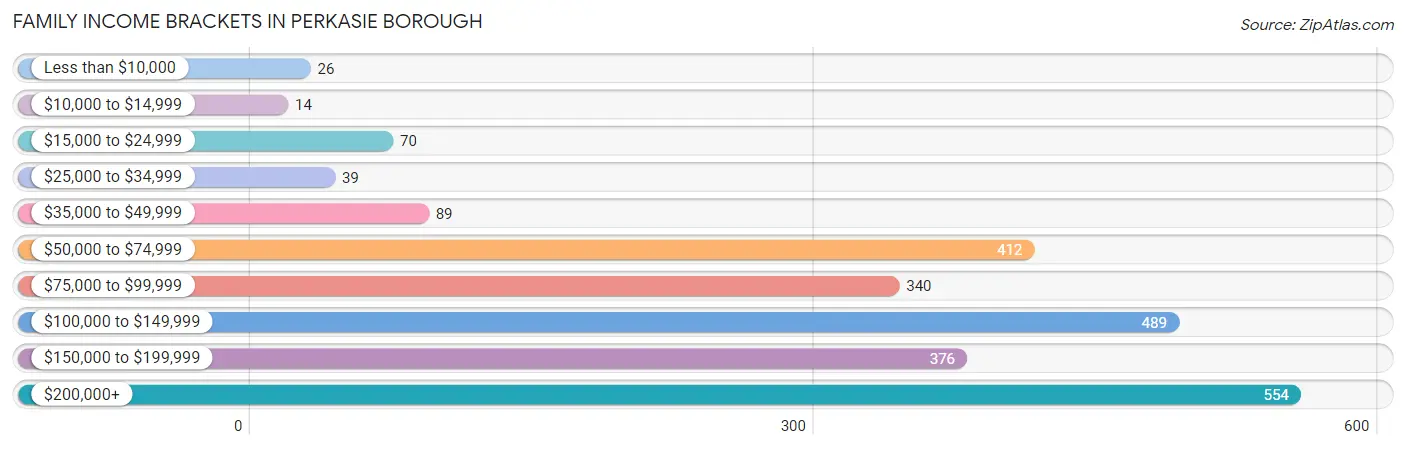
| Income Bracket | # Families | % Families |
| Less than $10,000 | 26 | 1.1% |
| $10,000 to $14,999 | 14 | 0.6% |
| $15,000 to $24,999 | 70 | 2.9% |
| $25,000 to $34,999 | 39 | 1.6% |
| $35,000 to $49,999 | 89 | 3.7% |
| $50,000 to $74,999 | 412 | 17.1% |
| $75,000 to $99,999 | 340 | 14.1% |
| $100,000 to $149,999 | 489 | 20.3% |
| $150,000 to $199,999 | 376 | 15.6% |
| $200,000+ | 554 | 23.0% |
Family Income by Famaliy Size in Perkasie borough
6-person families (77 | 3.2%) account for the highest median family income in Perkasie borough with $250,001 per family, while 2-person families (1,107 | 46.0%) have the highest median income of $49,836 per family member.
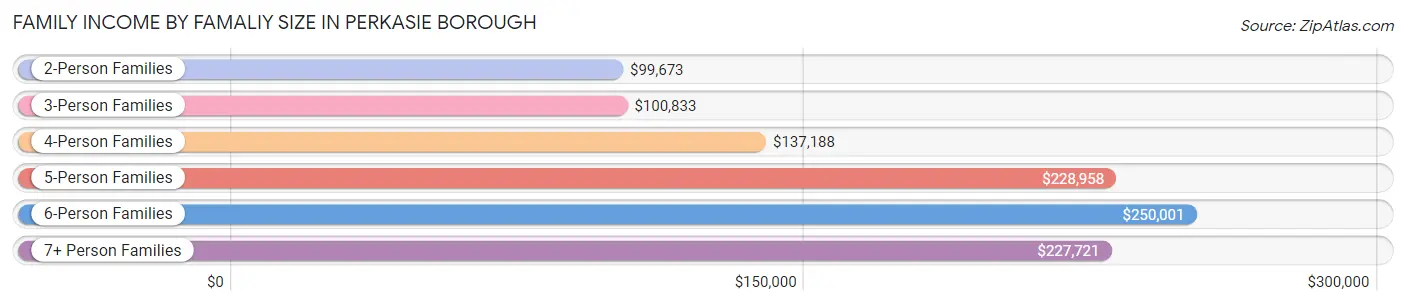
| Income Bracket | # Families | Median Income |
| 2-Person Families | 1,107 (46.0%) | $99,673 |
| 3-Person Families | 552 (22.9%) | $100,833 |
| 4-Person Families | 486 (20.2%) | $137,188 |
| 5-Person Families | 130 (5.4%) | $228,958 |
| 6-Person Families | 77 (3.2%) | $250,001 |
| 7+ Person Families | 57 (2.4%) | $227,721 |
| Total | 2,409 (100.0%) | $121,335 |
Family Income by Number of Earners in Perkasie borough
The median family income in Perkasie borough is $121,335, with families comprising 3+ earners (449) having the highest median family income of $208,375, while families with no earners (234) have the lowest median family income of $47,188, accounting for 18.6% and 9.7% of families, respectively.
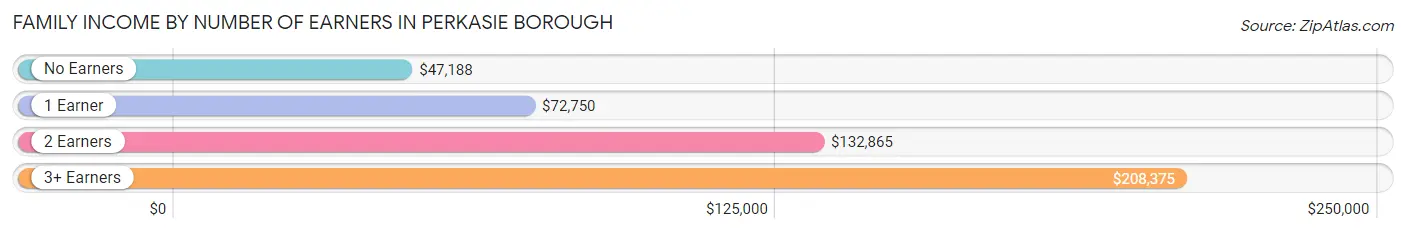
| Number of Earners | # Families | Median Income |
| No Earners | 234 (9.7%) | $47,188 |
| 1 Earner | 494 (20.5%) | $72,750 |
| 2 Earners | 1,232 (51.1%) | $132,865 |
| 3+ Earners | 449 (18.6%) | $208,375 |
| Total | 2,409 (100.0%) | $121,335 |
Household Income in Perkasie borough
Household Income Brackets in Perkasie borough
With 598 households falling in the category, the $100,000 to $149,999 income range is the most frequent in Perkasie borough, accounting for 17.1% of all households. In contrast, only 77 households (2.2%) fall into the $10,000 to $14,999 income bracket, making it the least populous group.
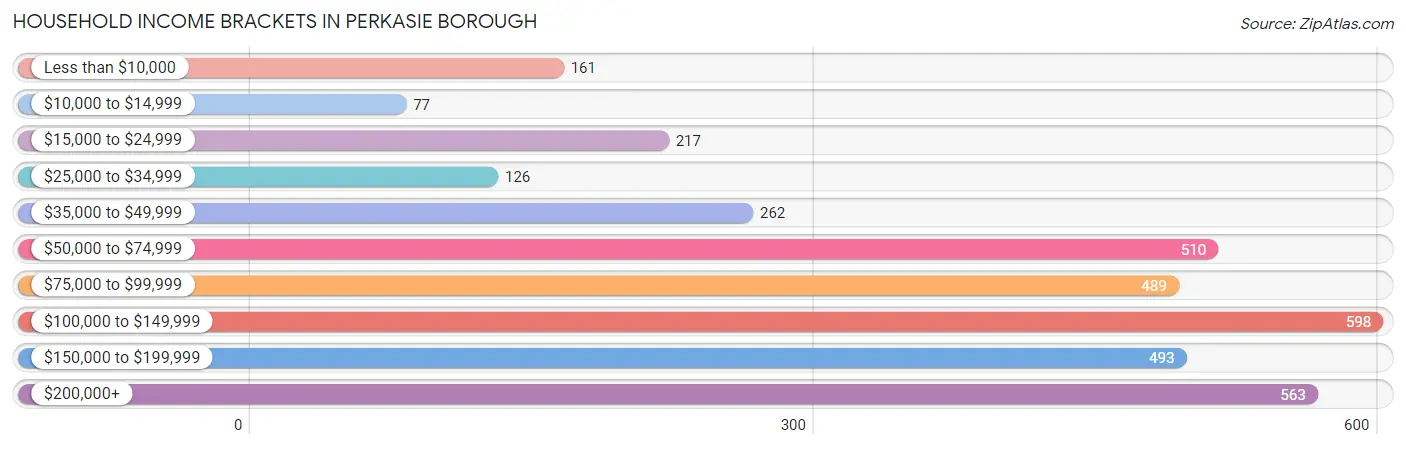
| Income Bracket | # Households | % Households |
| Less than $10,000 | 161 | 4.6% |
| $10,000 to $14,999 | 77 | 2.2% |
| $15,000 to $24,999 | 217 | 6.2% |
| $25,000 to $34,999 | 126 | 3.6% |
| $35,000 to $49,999 | 262 | 7.5% |
| $50,000 to $74,999 | 510 | 14.6% |
| $75,000 to $99,999 | 489 | 14.0% |
| $100,000 to $149,999 | 598 | 17.1% |
| $150,000 to $199,999 | 493 | 14.1% |
| $200,000+ | 563 | 16.1% |
Household Income by Householder Age in Perkasie borough
The median household income in Perkasie borough is $95,319, with the highest median household income of $123,832 found in the 45 to 64 years age bracket for the primary householder. A total of 1,441 households (41.2%) fall into this category. Meanwhile, the 15 to 24 years age bracket for the primary householder has the lowest median household income of $0, with 230 households (6.6%) in this group.
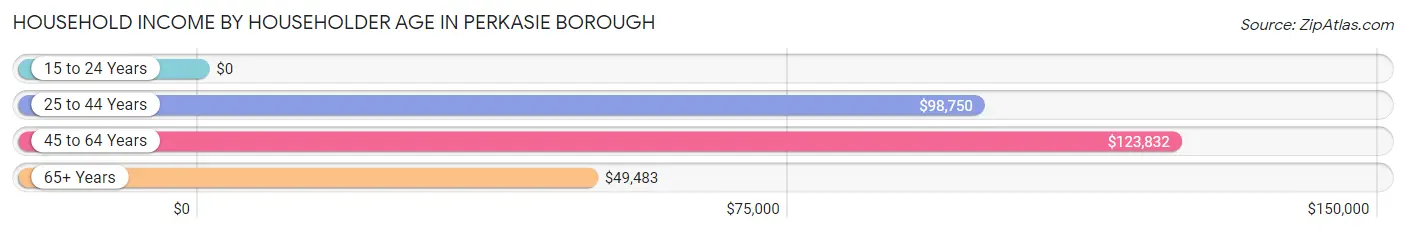
| Income Bracket | # Households | Median Income |
| 15 to 24 Years | 230 (6.6%) | $0 |
| 25 to 44 Years | 1,000 (28.6%) | $98,750 |
| 45 to 64 Years | 1,441 (41.2%) | $123,832 |
| 65+ Years | 824 (23.6%) | $49,483 |
| Total | 3,495 (100.0%) | $95,319 |
Poverty in Perkasie borough
Income Below Poverty by Sex and Age in Perkasie borough
With 4.5% poverty level for males and 10.4% for females among the residents of Perkasie borough, under 5 year old males and 18 to 24 year old females are the most vulnerable to poverty, with 57 males (21.2%) and 170 females (28.2%) in their respective age groups living below the poverty level.
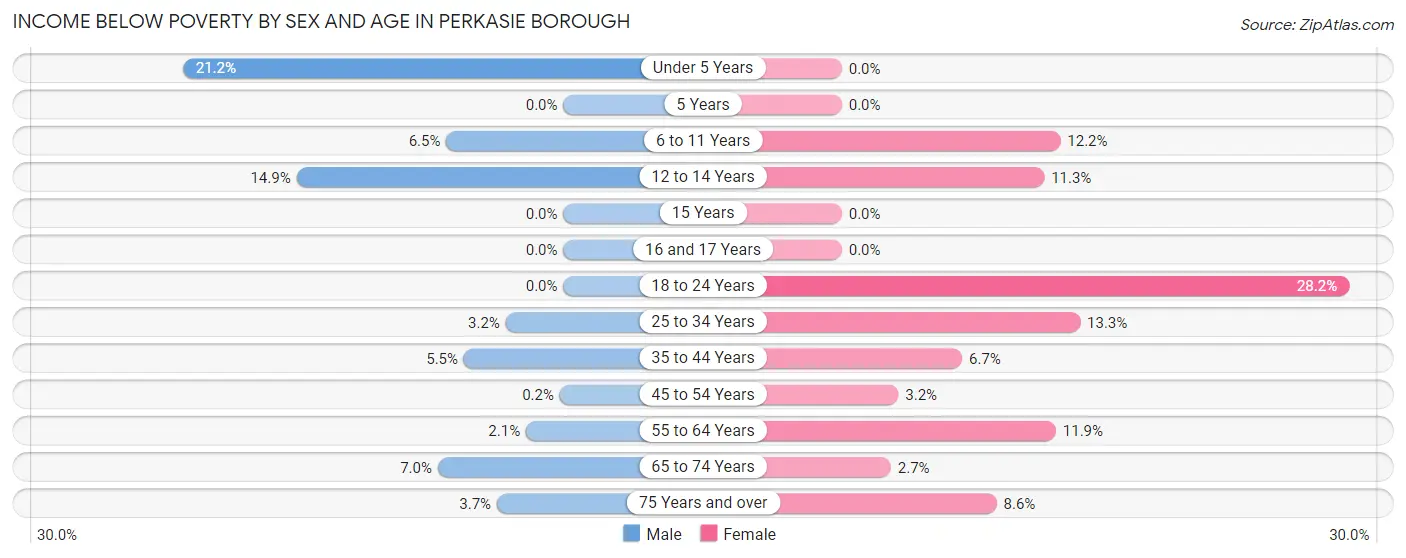
| Age Bracket | Male | Female |
| Under 5 Years | 57 (21.2%) | 0 (0.0%) |
| 5 Years | 0 (0.0%) | 0 (0.0%) |
| 6 to 11 Years | 23 (6.5%) | 37 (12.2%) |
| 12 to 14 Years | 26 (14.9%) | 16 (11.3%) |
| 15 Years | 0 (0.0%) | 0 (0.0%) |
| 16 and 17 Years | 0 (0.0%) | 0 (0.0%) |
| 18 to 24 Years | 0 (0.0%) | 170 (28.2%) |
| 25 to 34 Years | 22 (3.2%) | 84 (13.3%) |
| 35 to 44 Years | 25 (5.5%) | 39 (6.7%) |
| 45 to 54 Years | 1 (0.2%) | 23 (3.2%) |
| 55 to 64 Years | 16 (2.1%) | 72 (11.9%) |
| 65 to 74 Years | 26 (7.0%) | 11 (2.7%) |
| 75 Years and over | 7 (3.7%) | 28 (8.6%) |
| Total | 203 (4.5%) | 480 (10.4%) |
Income Above Poverty by Sex and Age in Perkasie borough
According to the poverty statistics in Perkasie borough, males aged 5 years and females aged under 5 years are the age groups that are most secure financially, with 100.0% of males and 100.0% of females in these age groups living above the poverty line.
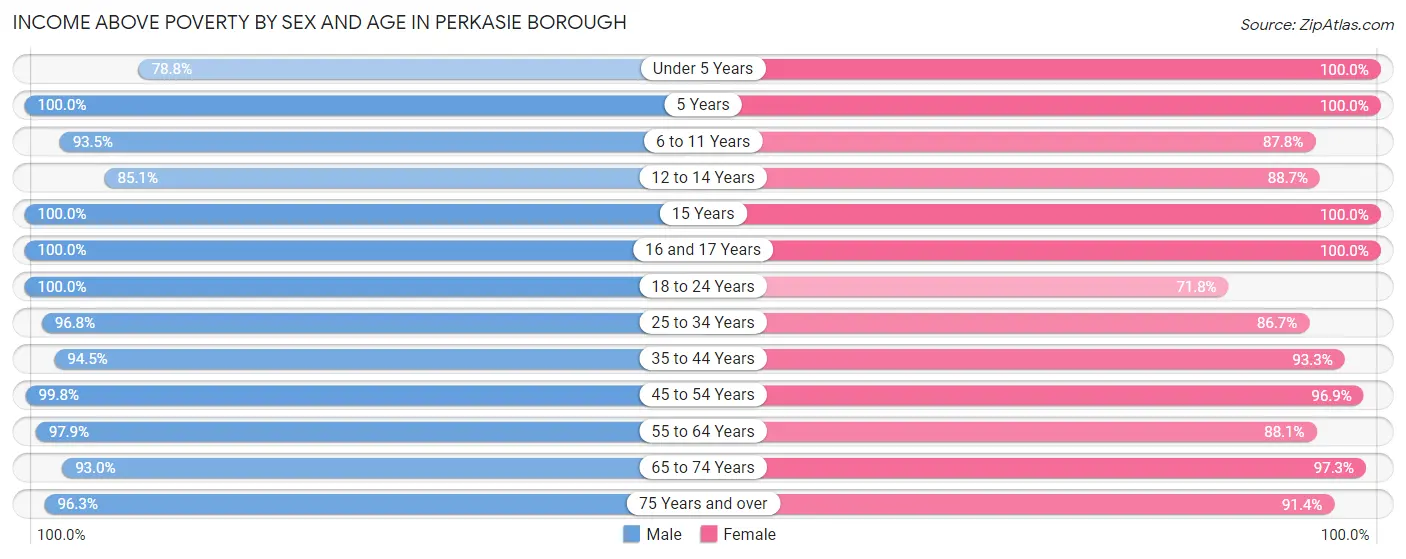
| Age Bracket | Male | Female |
| Under 5 Years | 212 (78.8%) | 109 (100.0%) |
| 5 Years | 35 (100.0%) | 22 (100.0%) |
| 6 to 11 Years | 330 (93.5%) | 267 (87.8%) |
| 12 to 14 Years | 149 (85.1%) | 126 (88.7%) |
| 15 Years | 47 (100.0%) | 69 (100.0%) |
| 16 and 17 Years | 103 (100.0%) | 90 (100.0%) |
| 18 to 24 Years | 523 (100.0%) | 432 (71.8%) |
| 25 to 34 Years | 663 (96.8%) | 549 (86.7%) |
| 35 to 44 Years | 426 (94.5%) | 543 (93.3%) |
| 45 to 54 Years | 507 (99.8%) | 707 (96.9%) |
| 55 to 64 Years | 752 (97.9%) | 532 (88.1%) |
| 65 to 74 Years | 346 (93.0%) | 392 (97.3%) |
| 75 Years and over | 182 (96.3%) | 297 (91.4%) |
| Total | 4,275 (95.5%) | 4,135 (89.6%) |
Income Below Poverty Among Married-Couple Families in Perkasie borough
The poverty statistics for married-couple families in Perkasie borough show that 2.9% or 55 of the total 1,875 families live below the poverty line. Families with 5 or more children have the highest poverty rate of 100.0%, comprising of 7 families. On the other hand, families with 3 or 4 children have the lowest poverty rate of 0.0%, which includes 0 families.
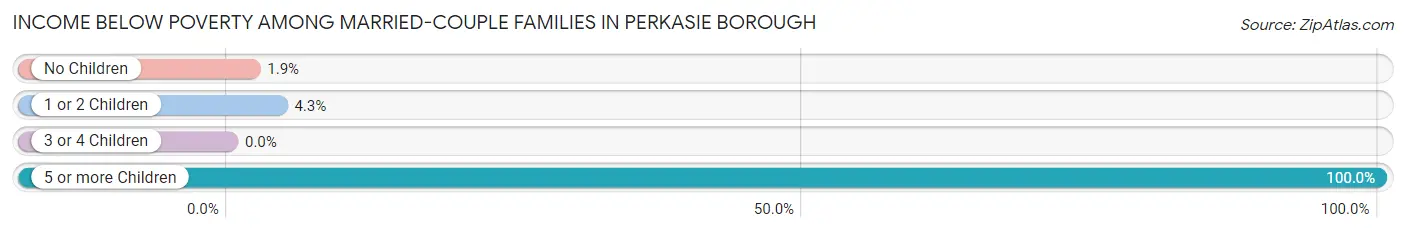
| Children | Above Poverty | Below Poverty |
| No Children | 1,164 (98.1%) | 23 (1.9%) |
| 1 or 2 Children | 557 (95.7%) | 25 (4.3%) |
| 3 or 4 Children | 99 (100.0%) | 0 (0.0%) |
| 5 or more Children | 0 (0.0%) | 7 (100.0%) |
| Total | 1,820 (97.1%) | 55 (2.9%) |
Income Below Poverty Among Single-Parent Households in Perkasie borough
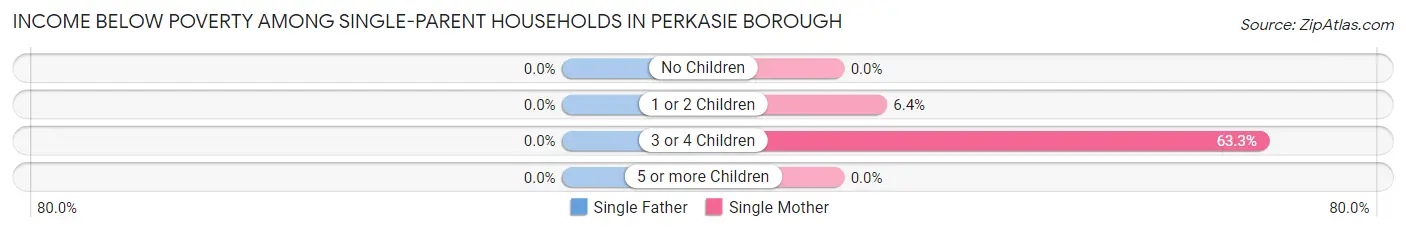
| Children | Single Father | Single Mother |
| No Children | 0 (0.0%) | 0 (0.0%) |
| 1 or 2 Children | 0 (0.0%) | 11 (6.4%) |
| 3 or 4 Children | 0 (0.0%) | 19 (63.3%) |
| 5 or more Children | 0 (0.0%) | 0 (0.0%) |
| Total | 0 (0.0%) | 30 (7.9%) |
Income Below Poverty Among Married-Couple vs Single-Parent Households in Perkasie borough
The poverty data for Perkasie borough shows that 55 of the married-couple family households (2.9%) and 30 of the single-parent households (5.6%) are living below the poverty level. Within the married-couple family households, those with 5 or more children have the highest poverty rate, with 7 households (100.0%) falling below the poverty line. Among the single-parent households, those with 3 or 4 children have the highest poverty rate, with 19 household (63.3%) living below poverty.
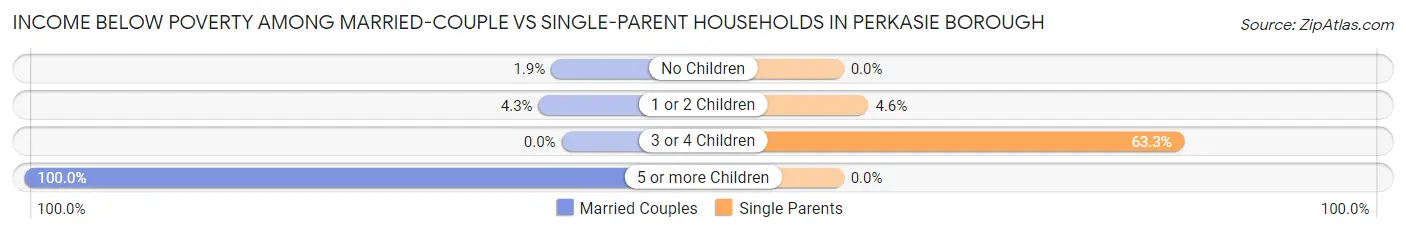
| Children | Married-Couple Families | Single-Parent Households |
| No Children | 23 (1.9%) | 0 (0.0%) |
| 1 or 2 Children | 25 (4.3%) | 11 (4.6%) |
| 3 or 4 Children | 0 (0.0%) | 19 (63.3%) |
| 5 or more Children | 7 (100.0%) | 0 (0.0%) |
| Total | 55 (2.9%) | 30 (5.6%) |
Race in Perkasie borough
The most populous races in Perkasie borough are White / Caucasian (8,449 | 92.5%), Hispanic or Latino (454 | 5.0%), and Two or more Races (307 | 3.4%).
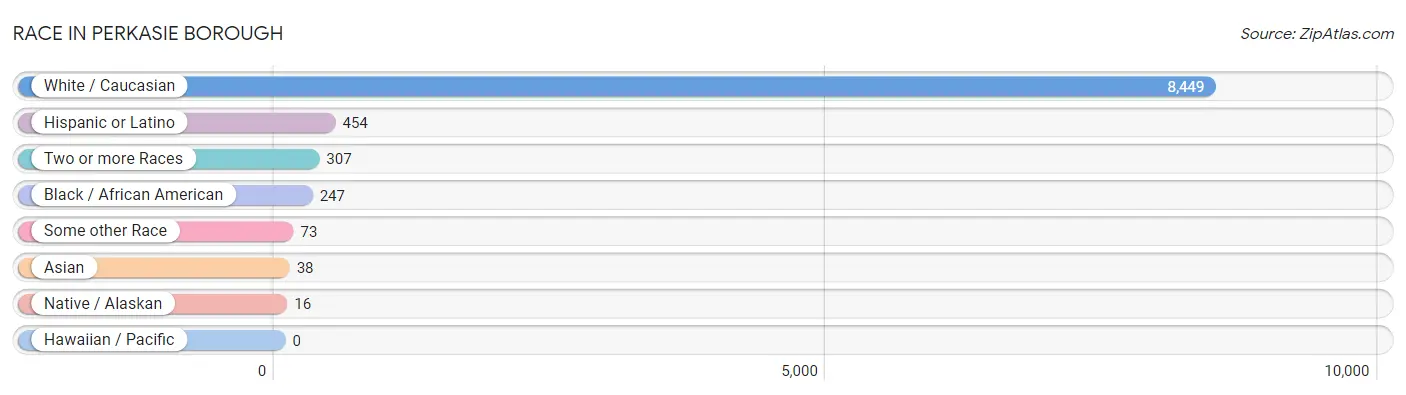
| Race | # Population | % Population |
| Asian | 38 | 0.4% |
| Black / African American | 247 | 2.7% |
| Hawaiian / Pacific | 0 | 0.0% |
| Hispanic or Latino | 454 | 5.0% |
| Native / Alaskan | 16 | 0.2% |
| White / Caucasian | 8,449 | 92.5% |
| Two or more Races | 307 | 3.4% |
| Some other Race | 73 | 0.8% |
| Total | 9,130 | 100.0% |
Ancestry in Perkasie borough
The most populous ancestries reported in Perkasie borough are German (3,267 | 35.8%), Irish (2,200 | 24.1%), Italian (1,291 | 14.1%), English (1,188 | 13.0%), and Polish (632 | 6.9%), together accounting for 94.0% of all Perkasie borough residents.
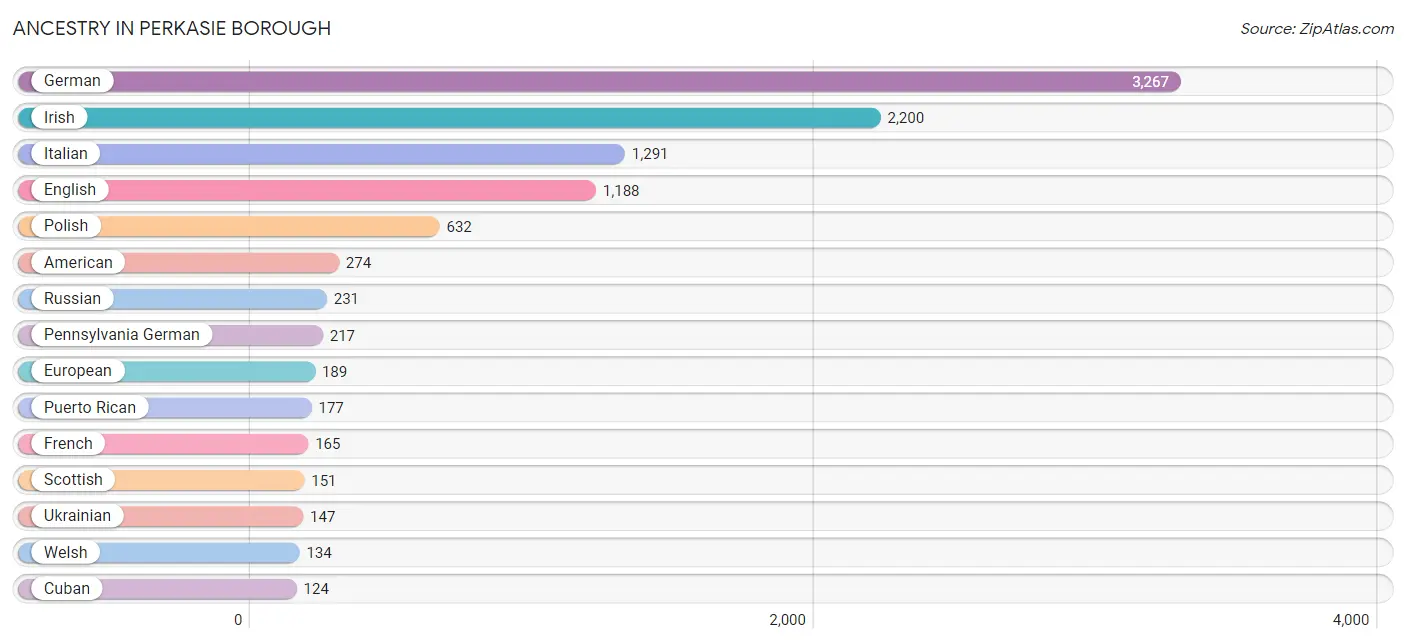
| Ancestry | # Population | % Population |
| American | 274 | 3.0% |
| Arab | 20 | 0.2% |
| Armenian | 66 | 0.7% |
| Austrian | 41 | 0.4% |
| Bhutanese | 11 | 0.1% |
| Blackfeet | 4 | 0.0% |
| British | 39 | 0.4% |
| Burmese | 10 | 0.1% |
| Central American | 48 | 0.5% |
| Cherokee | 20 | 0.2% |
| Croatian | 17 | 0.2% |
| Cuban | 124 | 1.4% |
| Czechoslovakian | 8 | 0.1% |
| Dutch | 68 | 0.7% |
| Eastern European | 10 | 0.1% |
| English | 1,188 | 13.0% |
| European | 189 | 2.1% |
| French | 165 | 1.8% |
| French Canadian | 83 | 0.9% |
| German | 3,267 | 35.8% |
| Greek | 64 | 0.7% |
| Guatemalan | 17 | 0.2% |
| Hungarian | 100 | 1.1% |
| Indian (Asian) | 17 | 0.2% |
| Irish | 2,200 | 24.1% |
| Iroquois | 16 | 0.2% |
| Italian | 1,291 | 14.1% |
| Korean | 25 | 0.3% |
| Lebanese | 20 | 0.2% |
| Lithuanian | 23 | 0.3% |
| Mexican | 42 | 0.5% |
| Northern European | 9 | 0.1% |
| Norwegian | 35 | 0.4% |
| Pennsylvania German | 217 | 2.4% |
| Polish | 632 | 6.9% |
| Portuguese | 47 | 0.5% |
| Puerto Rican | 177 | 1.9% |
| Russian | 231 | 2.5% |
| Salvadoran | 31 | 0.3% |
| Scandinavian | 12 | 0.1% |
| Scotch-Irish | 58 | 0.6% |
| Scottish | 151 | 1.7% |
| Sioux | 7 | 0.1% |
| Slavic | 5 | 0.1% |
| Slovak | 47 | 0.5% |
| Spanish | 14 | 0.2% |
| Swedish | 114 | 1.3% |
| Swiss | 92 | 1.0% |
| Ukrainian | 147 | 1.6% |
| Welsh | 134 | 1.5% | View All 50 Rows |
Immigrants in Perkasie borough
The most numerous immigrant groups reported in Perkasie borough came from Latin America (170 | 1.9%), Caribbean (124 | 1.4%), Cuba (124 | 1.4%), Europe (59 | 0.6%), and Asia (47 | 0.5%), together accounting for 5.7% of all Perkasie borough residents.
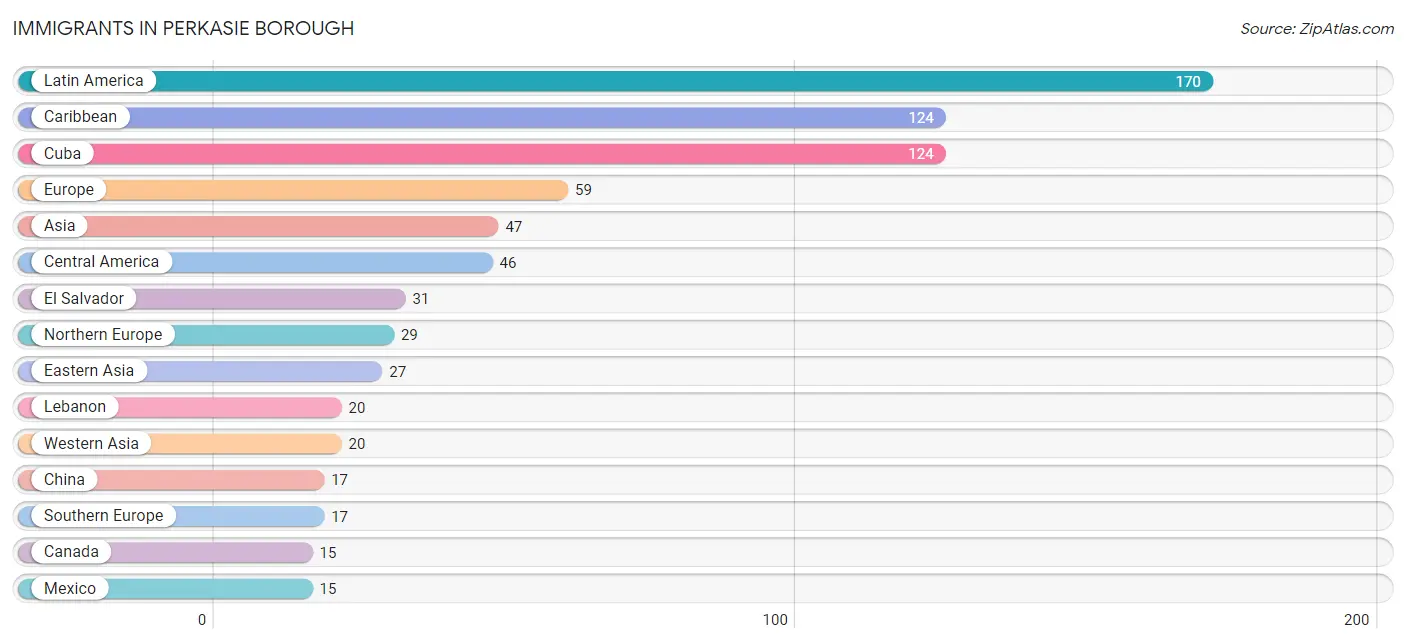
| Immigration Origin | # Population | % Population |
| Asia | 47 | 0.5% |
| Canada | 15 | 0.2% |
| Caribbean | 124 | 1.4% |
| Central America | 46 | 0.5% |
| China | 17 | 0.2% |
| Cuba | 124 | 1.4% |
| Eastern Asia | 27 | 0.3% |
| Eastern Europe | 13 | 0.1% |
| El Salvador | 31 | 0.3% |
| England | 9 | 0.1% |
| Europe | 59 | 0.6% |
| Italy | 5 | 0.1% |
| Korea | 10 | 0.1% |
| Latin America | 170 | 1.9% |
| Lebanon | 20 | 0.2% |
| Mexico | 15 | 0.2% |
| Northern Europe | 29 | 0.3% |
| Portugal | 12 | 0.1% |
| Russia | 13 | 0.1% |
| Scotland | 11 | 0.1% |
| Southern Europe | 17 | 0.2% |
| Western Asia | 20 | 0.2% | View All 22 Rows |
Sex and Age in Perkasie borough
Sex and Age in Perkasie borough
The most populous age groups in Perkasie borough are 55 to 59 Years (547 | 12.1%) for men and 50 to 54 Years (508 | 11.0%) for women.
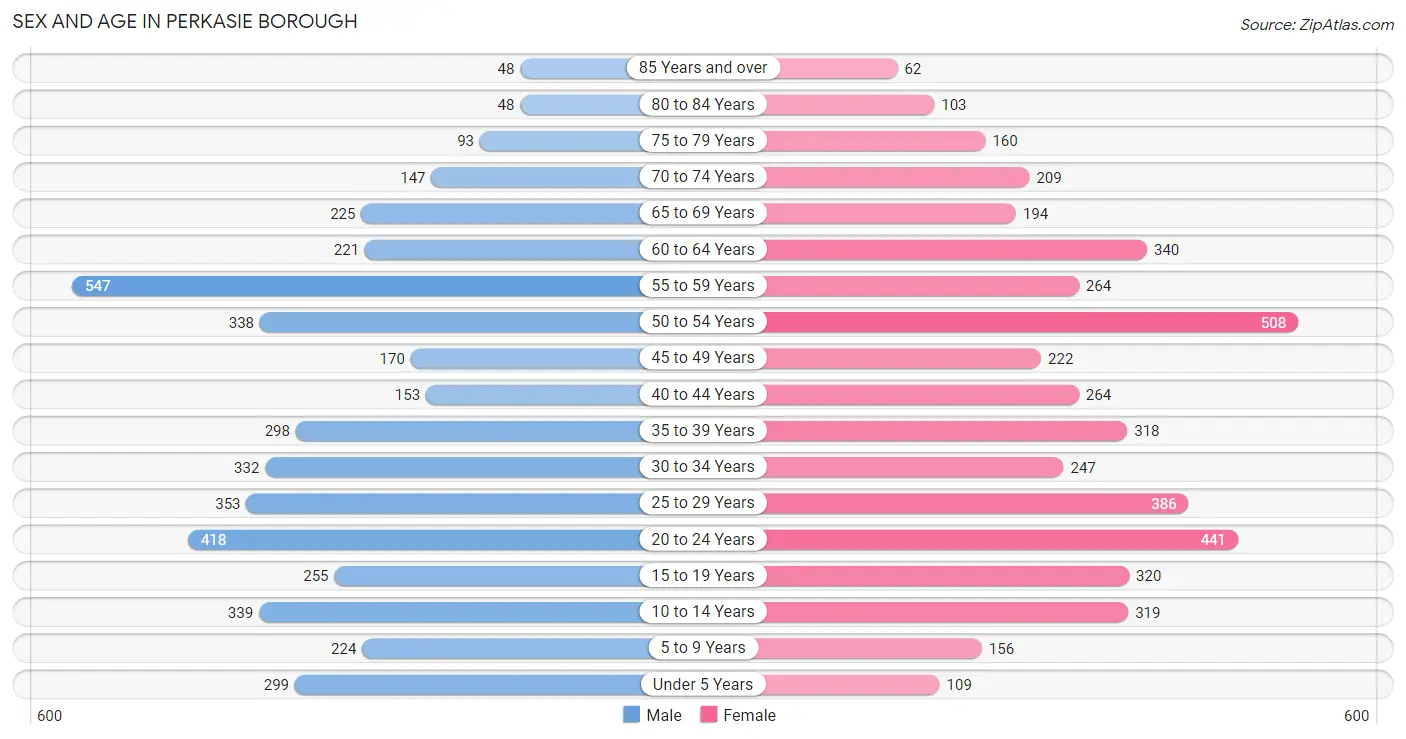
| Age Bracket | Male | Female |
| Under 5 Years | 299 (6.6%) | 109 (2.4%) |
| 5 to 9 Years | 224 (5.0%) | 156 (3.4%) |
| 10 to 14 Years | 339 (7.5%) | 319 (6.9%) |
| 15 to 19 Years | 255 (5.7%) | 320 (6.9%) |
| 20 to 24 Years | 418 (9.3%) | 441 (9.5%) |
| 25 to 29 Years | 353 (7.8%) | 386 (8.4%) |
| 30 to 34 Years | 332 (7.4%) | 247 (5.3%) |
| 35 to 39 Years | 298 (6.6%) | 318 (6.9%) |
| 40 to 44 Years | 153 (3.4%) | 264 (5.7%) |
| 45 to 49 Years | 170 (3.8%) | 222 (4.8%) |
| 50 to 54 Years | 338 (7.5%) | 508 (11.0%) |
| 55 to 59 Years | 547 (12.1%) | 264 (5.7%) |
| 60 to 64 Years | 221 (4.9%) | 340 (7.4%) |
| 65 to 69 Years | 225 (5.0%) | 194 (4.2%) |
| 70 to 74 Years | 147 (3.3%) | 209 (4.5%) |
| 75 to 79 Years | 93 (2.1%) | 160 (3.5%) |
| 80 to 84 Years | 48 (1.1%) | 103 (2.2%) |
| 85 Years and over | 48 (1.1%) | 62 (1.3%) |
| Total | 4,508 (100.0%) | 4,622 (100.0%) |
Families and Households in Perkasie borough
Median Family Size in Perkasie borough
The median family size in Perkasie borough is 3.13 persons per family, with single female/mother families (382 | 15.9%) accounting for the largest median family size of 3.19 persons per family. On the other hand, single male/father families (152 | 6.3%) represent the smallest median family size with 2.61 persons per family.
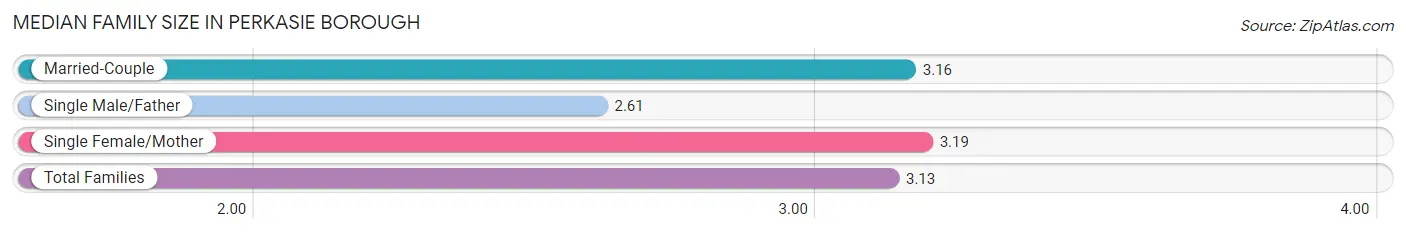
| Family Type | # Families | Family Size |
| Married-Couple | 1,875 (77.8%) | 3.16 |
| Single Male/Father | 152 (6.3%) | 2.61 |
| Single Female/Mother | 382 (15.9%) | 3.19 |
| Total Families | 2,409 (100.0%) | 3.13 |
Median Household Size in Perkasie borough
The median household size in Perkasie borough is 2.61 persons per household, with single female/mother households (382 | 10.9%) accounting for the largest median household size of 3.25 persons per household. non-family households (1,086 | 31.1%) represent the smallest median household size with 1.35 persons per household.
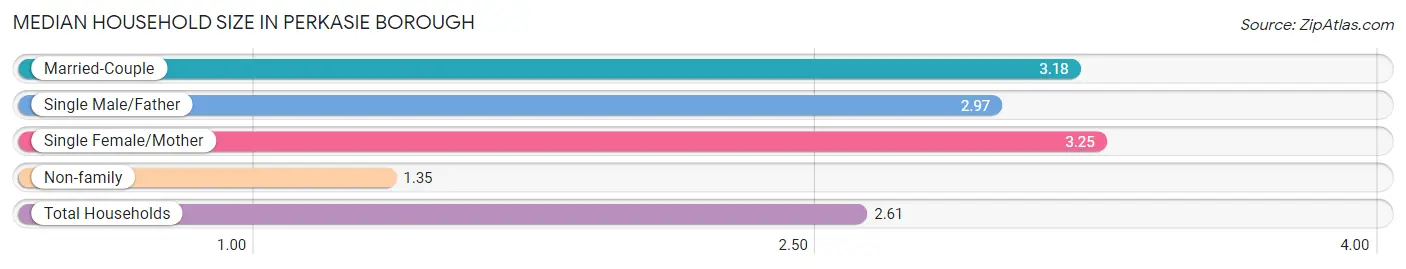
| Household Type | # Households | Household Size |
| Married-Couple | 1,875 (53.6%) | 3.18 |
| Single Male/Father | 152 (4.3%) | 2.97 |
| Single Female/Mother | 382 (10.9%) | 3.25 |
| Non-family | 1,086 (31.1%) | 1.35 |
| Total Households | 3,495 (100.0%) | 2.61 |
Household Size by Marriage Status in Perkasie borough
Out of a total of 3,495 households in Perkasie borough, 2,409 (68.9%) are family households, while 1,086 (31.1%) are nonfamily households. The most numerous type of family households are 2-person households, comprising 1,047, and the most common type of nonfamily households are 1-person households, comprising 791.
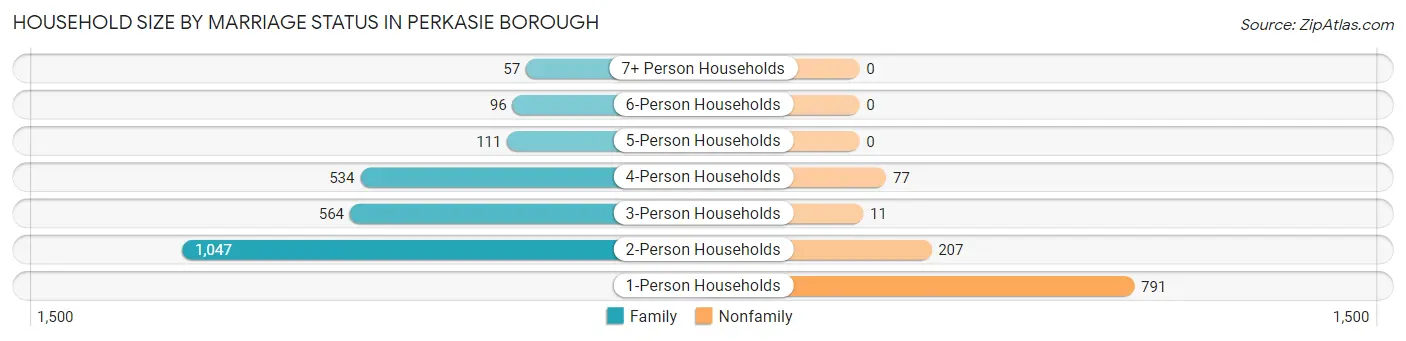
| Household Size | Family Households | Nonfamily Households |
| 1-Person Households | - | 791 (22.6%) |
| 2-Person Households | 1,047 (30.0%) | 207 (5.9%) |
| 3-Person Households | 564 (16.1%) | 11 (0.3%) |
| 4-Person Households | 534 (15.3%) | 77 (2.2%) |
| 5-Person Households | 111 (3.2%) | 0 (0.0%) |
| 6-Person Households | 96 (2.8%) | 0 (0.0%) |
| 7+ Person Households | 57 (1.6%) | 0 (0.0%) |
| Total | 2,409 (68.9%) | 1,086 (31.1%) |
Female Fertility in Perkasie borough
Fertility by Age in Perkasie borough
Average fertility rate in Perkasie borough is 65.0 births per 1,000 women. Women in the age bracket of 20 to 34 years have the highest fertility rate with 134.0 births per 1,000 women. Women in the age bracket of 20 to 34 years acount for 100.0% of all women with births.
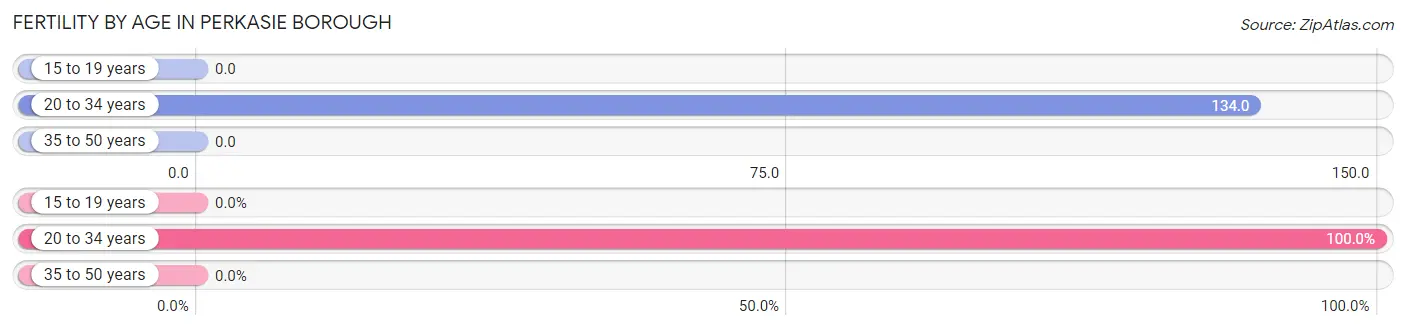
| Age Bracket | Women with Births | Births / 1,000 Women |
| 15 to 19 years | 0 (0.0%) | 0.0 |
| 20 to 34 years | 144 (100.0%) | 134.0 |
| 35 to 50 years | 0 (0.0%) | 0.0 |
| Total | 144 (100.0%) | 65.0 |
Fertility by Age by Marriage Status in Perkasie borough
87.5% of women with births (144) in Perkasie borough are married. The highest percentage of unmarried women with births falls into 20 to 34 years age bracket with 12.5% of them unmarried at the time of birth, while the lowest percentage of unmarried women with births belong to 20 to 34 years age bracket with 12.5% of them unmarried.
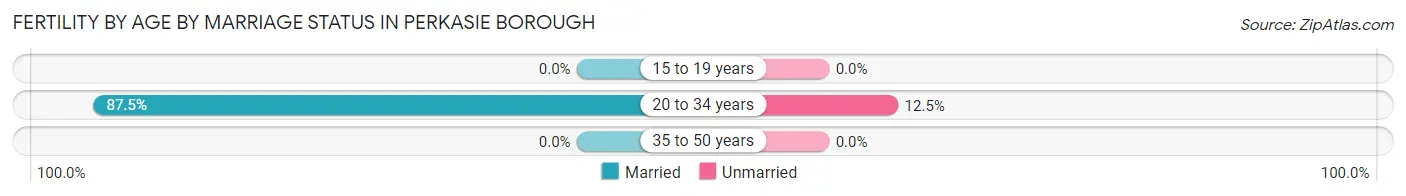
| Age Bracket | Married | Unmarried |
| 15 to 19 years | 0 (0.0%) | 0 (0.0%) |
| 20 to 34 years | 126 (87.5%) | 18 (12.5%) |
| 35 to 50 years | 0 (0.0%) | 0 (0.0%) |
| Total | 126 (87.5%) | 18 (12.5%) |
Fertility by Education in Perkasie borough
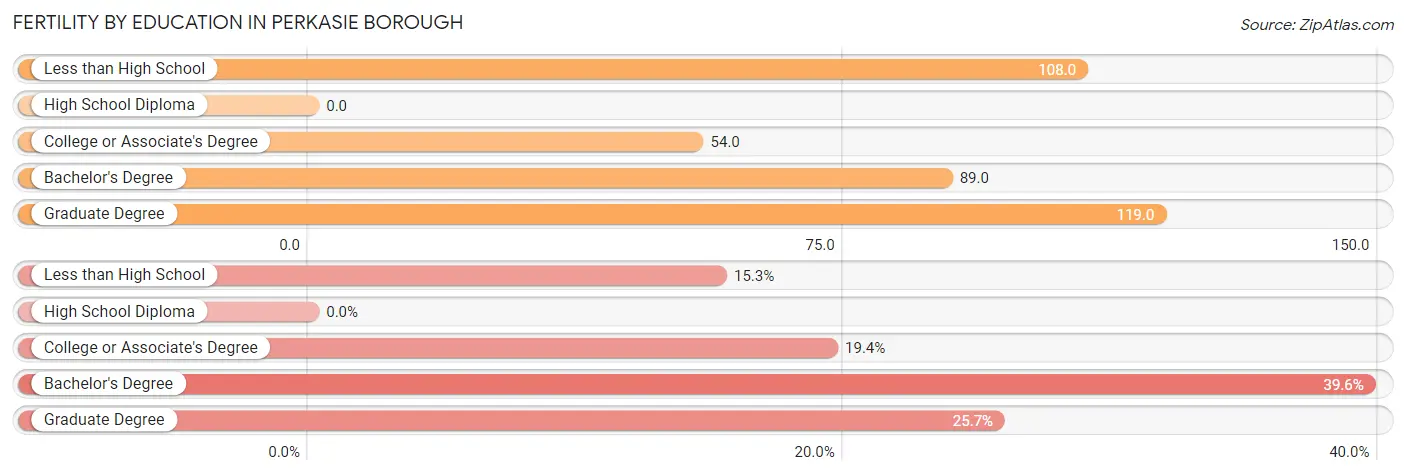
| Educational Attainment | Women with Births | Births / 1,000 Women |
| Less than High School | 22 (15.3%) | 108.0 |
| High School Diploma | 0 (0.0%) | 0.0 |
| College or Associate's Degree | 28 (19.4%) | 54.0 |
| Bachelor's Degree | 57 (39.6%) | 89.0 |
| Graduate Degree | 37 (25.7%) | 119.0 |
| Total | 144 (100.0%) | 65.0 |
Fertility by Education by Marriage Status in Perkasie borough
12.5% of women with births in Perkasie borough are unmarried. Women with the educational attainment of college or associate's degree are most likely to be married with 100.0% of them married at childbirth, while women with the educational attainment of less than high school are least likely to be married with 36.4% of them unmarried at childbirth.
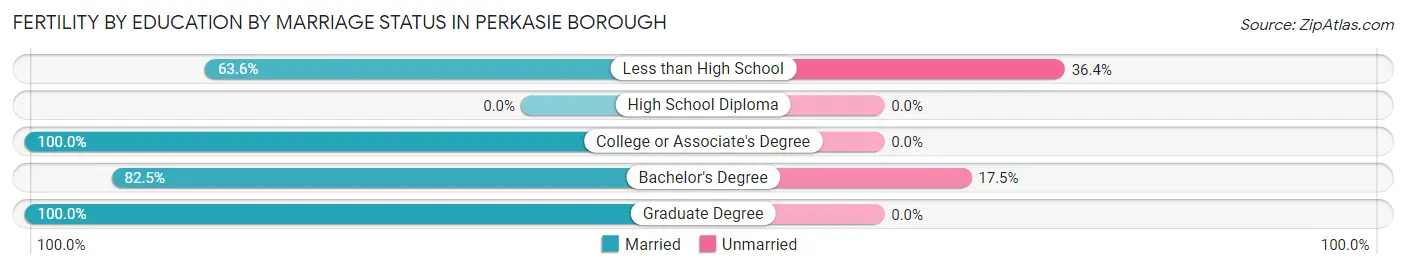
| Educational Attainment | Married | Unmarried |
| Less than High School | 14 (63.6%) | 8 (36.4%) |
| High School Diploma | 0 (0.0%) | 0 (0.0%) |
| College or Associate's Degree | 28 (100.0%) | 0 (0.0%) |
| Bachelor's Degree | 47 (82.5%) | 10 (17.5%) |
| Graduate Degree | 37 (100.0%) | 0 (0.0%) |
| Total | 126 (87.5%) | 18 (12.5%) |
Employment Characteristics in Perkasie borough
Employment by Class of Employer in Perkasie borough
Among the 5,530 employed individuals in Perkasie borough, private company employees (3,777 | 68.3%), not-for-profit organizations (821 | 14.8%), and local government employees (388 | 7.0%) make up the most common classes of employment.
| Employer Class | # Employees | % Employees |
| Private Company Employees | 3,777 | 68.3% |
| Self-Employed (Incorporated) | 129 | 2.3% |
| Self-Employed (Not Incorporated) | 256 | 4.6% |
| Not-for-profit Organizations | 821 | 14.8% |
| Local Government Employees | 388 | 7.0% |
| State Government Employees | 136 | 2.5% |
| Federal Government Employees | 23 | 0.4% |
| Unpaid Family Workers | 0 | 0.0% |
| Total | 5,530 | 100.0% |
Employment Status by Age in Perkasie borough
According to the labor force statistics for Perkasie borough, out of the total population over 16 years of age (7,568), 76.8% or 5,812 individuals are in the labor force, with 3.8% or 221 of them unemployed. The age group with the highest labor force participation rate is 30 to 34 years, with 94.3% or 546 individuals in the labor force. Within the labor force, the 20 to 24 years age range has the highest percentage of unemployed individuals, with 18.7% or 146 of them being unemployed.
| Age Bracket | In Labor Force | Unemployed |
| 16 to 19 Years | 339 (73.9%) | 8 (2.4%) |
| 20 to 24 Years | 782 (91.0%) | 146 (18.7%) |
| 25 to 29 Years | 691 (93.5%) | 33 (4.8%) |
| 30 to 34 Years | 546 (94.3%) | 0 (0.0%) |
| 35 to 44 Years | 928 (89.8%) | 5 (0.5%) |
| 45 to 54 Years | 1,153 (93.1%) | 14 (1.2%) |
| 55 to 59 Years | 683 (84.2%) | 7 (1.0%) |
| 60 to 64 Years | 443 (79.0%) | 0 (0.0%) |
| 65 to 74 Years | 219 (28.3%) | 9 (4.1%) |
| 75 Years and over | 32 (6.2%) | 0 (0.0%) |
| Total | 5,812 (76.8%) | 221 (3.8%) |
Employment Status by Educational Attainment in Perkasie borough
According to labor force statistics for Perkasie borough, 89.6% of individuals (4,445) out of the total population between 25 and 64 years of age (4,961) are in the labor force, with 1.3% or 58 of them being unemployed. The group with the highest labor force participation rate are those with the educational attainment of bachelor's degree or higher, with 94.8% or 2,114 individuals in the labor force. Within the labor force, individuals with college / associate degree education have the highest percentage of unemployment, with 2.2% or 19 of them being unemployed.
| Educational Attainment | In Labor Force | Unemployed |
| Less than High School | 132 (74.6%) | 0 (0.0%) |
| High School Diploma | 1,353 (89.4%) | 32 (2.1%) |
| College / Associate Degree | 846 (81.3%) | 23 (2.2%) |
| Bachelor's Degree or higher | 2,114 (94.8%) | 13 (0.6%) |
| Total | 4,445 (89.6%) | 64 (1.3%) |
Employment Occupations by Sex in Perkasie borough
Management, Business, Science and Arts Occupations
The most common Management, Business, Science and Arts occupations in Perkasie borough are Community & Social Service (841 | 15.0%), Management (580 | 10.4%), Education Instruction & Library (508 | 9.1%), Business & Financial (338 | 6.0%), and Health Diagnosing & Treating (277 | 5.0%).
Management, Business, Science and Arts Occupations by Sex
Within the Management, Business, Science and Arts occupations in Perkasie borough, the most male-oriented occupations are Architecture & Engineering (82.1%), Business & Financial (63.0%), and Computers, Engineering & Science (61.5%), while the most female-oriented occupations are Education Instruction & Library (83.1%), Legal Services & Support (82.7%), and Community & Social Service (75.0%).
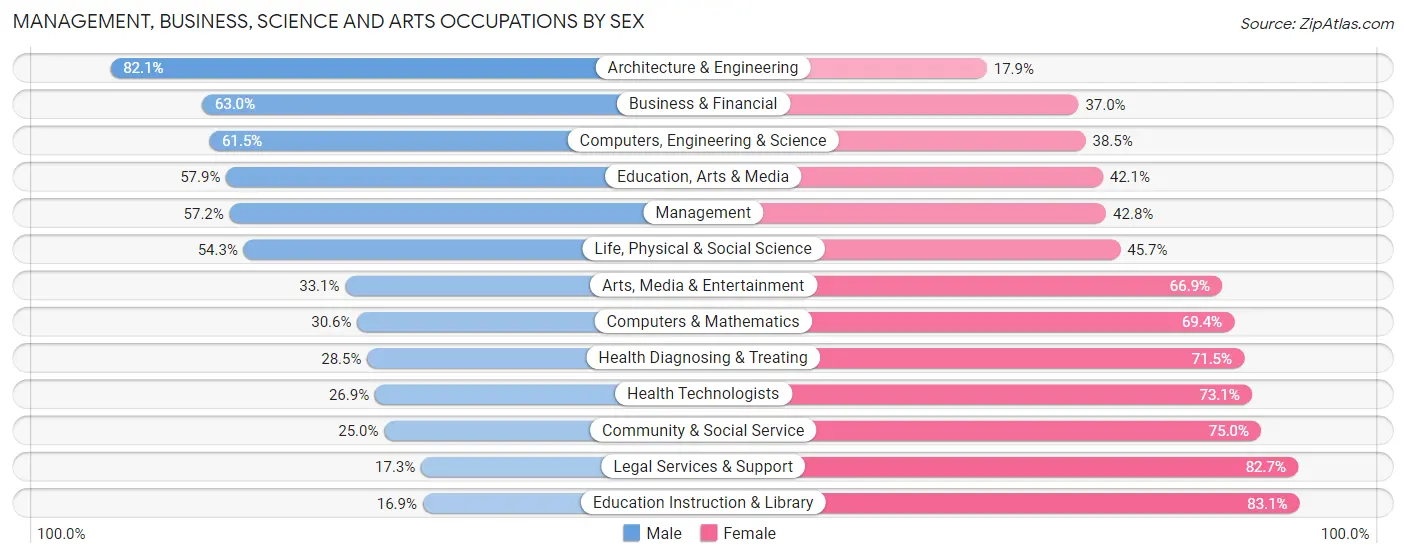
| Occupation | Male | Female |
| Management | 332 (57.2%) | 248 (42.8%) |
| Business & Financial | 213 (63.0%) | 125 (37.0%) |
| Computers, Engineering & Science | 160 (61.5%) | 100 (38.5%) |
| Computers & Mathematics | 26 (30.6%) | 59 (69.4%) |
| Architecture & Engineering | 115 (82.1%) | 25 (17.9%) |
| Life, Physical & Social Science | 19 (54.3%) | 16 (45.7%) |
| Community & Social Service | 210 (25.0%) | 631 (75.0%) |
| Education, Arts & Media | 62 (57.9%) | 45 (42.1%) |
| Legal Services & Support | 14 (17.3%) | 67 (82.7%) |
| Education Instruction & Library | 86 (16.9%) | 422 (83.1%) |
| Arts, Media & Entertainment | 48 (33.1%) | 97 (66.9%) |
| Health Diagnosing & Treating | 79 (28.5%) | 198 (71.5%) |
| Health Technologists | 67 (26.9%) | 182 (73.1%) |
| Total (Category) | 994 (43.3%) | 1,302 (56.7%) |
| Total (Overall) | 2,814 (50.3%) | 2,779 (49.7%) |
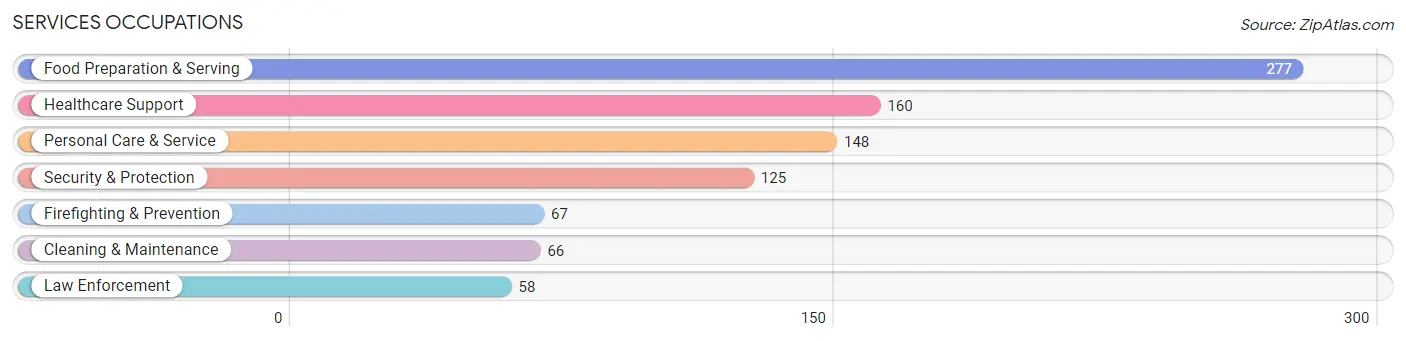
Services Occupations
The most common Services occupations in Perkasie borough are Food Preparation & Serving (277 | 5.0%), Healthcare Support (160 | 2.9%), Personal Care & Service (148 | 2.6%), Security & Protection (125 | 2.2%), and Firefighting & Prevention (67 | 1.2%).
Services Occupations by Sex
Within the Services occupations in Perkasie borough, the most male-oriented occupations are Firefighting & Prevention (88.1%), Cleaning & Maintenance (86.4%), and Security & Protection (84.8%), while the most female-oriented occupations are Personal Care & Service (81.1%), Healthcare Support (76.2%), and Food Preparation & Serving (54.5%).
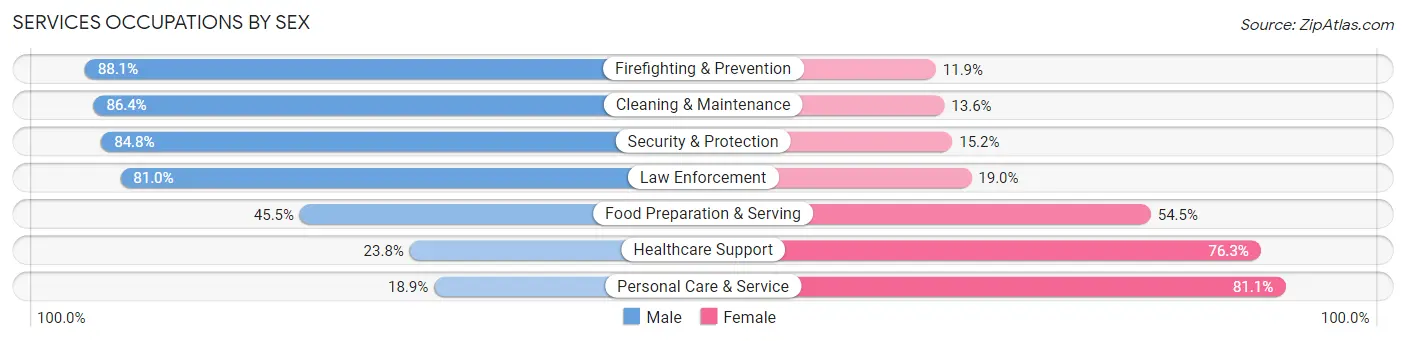
| Occupation | Male | Female |
| Healthcare Support | 38 (23.7%) | 122 (76.2%) |
| Security & Protection | 106 (84.8%) | 19 (15.2%) |
| Firefighting & Prevention | 59 (88.1%) | 8 (11.9%) |
| Law Enforcement | 47 (81.0%) | 11 (19.0%) |
| Food Preparation & Serving | 126 (45.5%) | 151 (54.5%) |
| Cleaning & Maintenance | 57 (86.4%) | 9 (13.6%) |
| Personal Care & Service | 28 (18.9%) | 120 (81.1%) |
| Total (Category) | 355 (45.8%) | 421 (54.2%) |
| Total (Overall) | 2,814 (50.3%) | 2,779 (49.7%) |
Sales and Office Occupations
The most common Sales and Office occupations in Perkasie borough are Sales & Related (601 | 10.7%), and Office & Administration (492 | 8.8%).

Sales and Office Occupations by Sex

| Occupation | Male | Female |
| Sales & Related | 282 (46.9%) | 319 (53.1%) |
| Office & Administration | 45 (9.1%) | 447 (90.8%) |
| Total (Category) | 327 (29.9%) | 766 (70.1%) |
| Total (Overall) | 2,814 (50.3%) | 2,779 (49.7%) |
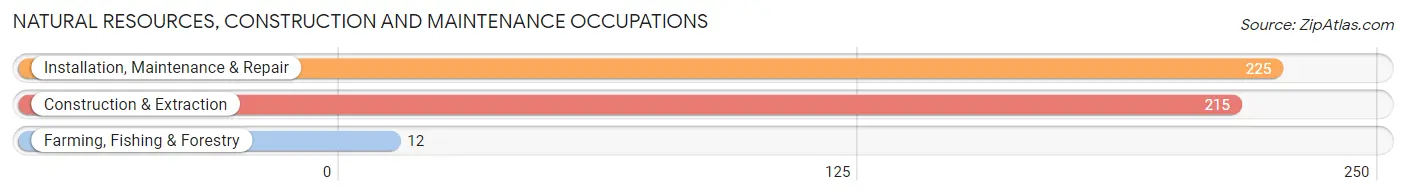
Natural Resources, Construction and Maintenance Occupations
The most common Natural Resources, Construction and Maintenance occupations in Perkasie borough are Installation, Maintenance & Repair (225 | 4.0%), Construction & Extraction (215 | 3.8%), and Farming, Fishing & Forestry (12 | 0.2%).
Natural Resources, Construction and Maintenance Occupations by Sex
| Occupation | Male | Female |
| Farming, Fishing & Forestry | 6 (50.0%) | 6 (50.0%) |
| Construction & Extraction | 199 (92.6%) | 16 (7.4%) |
| Installation, Maintenance & Repair | 225 (100.0%) | 0 (0.0%) |
| Total (Category) | 430 (95.1%) | 22 (4.9%) |
| Total (Overall) | 2,814 (50.3%) | 2,779 (49.7%) |
Production, Transportation and Moving Occupations
The most common Production, Transportation and Moving occupations in Perkasie borough are Production (386 | 6.9%), Material Moving (332 | 5.9%), and Transportation (258 | 4.6%).
Production, Transportation and Moving Occupations by Sex
| Occupation | Male | Female |
| Production | 217 (56.2%) | 169 (43.8%) |
| Transportation | 237 (91.9%) | 21 (8.1%) |
| Material Moving | 254 (76.5%) | 78 (23.5%) |
| Total (Category) | 708 (72.5%) | 268 (27.5%) |
| Total (Overall) | 2,814 (50.3%) | 2,779 (49.7%) |
Employment Industries by Sex in Perkasie borough
Employment Industries in Perkasie borough
The major employment industries in Perkasie borough include Health Care & Social Assistance (905 | 16.2%), Manufacturing (817 | 14.6%), Retail Trade (740 | 13.2%), Educational Services (620 | 11.1%), and Finance & Insurance (392 | 7.0%).
Employment Industries by Sex in Perkasie borough
The Perkasie borough industries that see more men than women are Utilities (100.0%), Information (100.0%), and Enterprise Management (100.0%), whereas the industries that tend to have a higher number of women are Educational Services (84.5%), Health Care & Social Assistance (74.7%), and Arts, Entertainment & Recreation (71.4%).
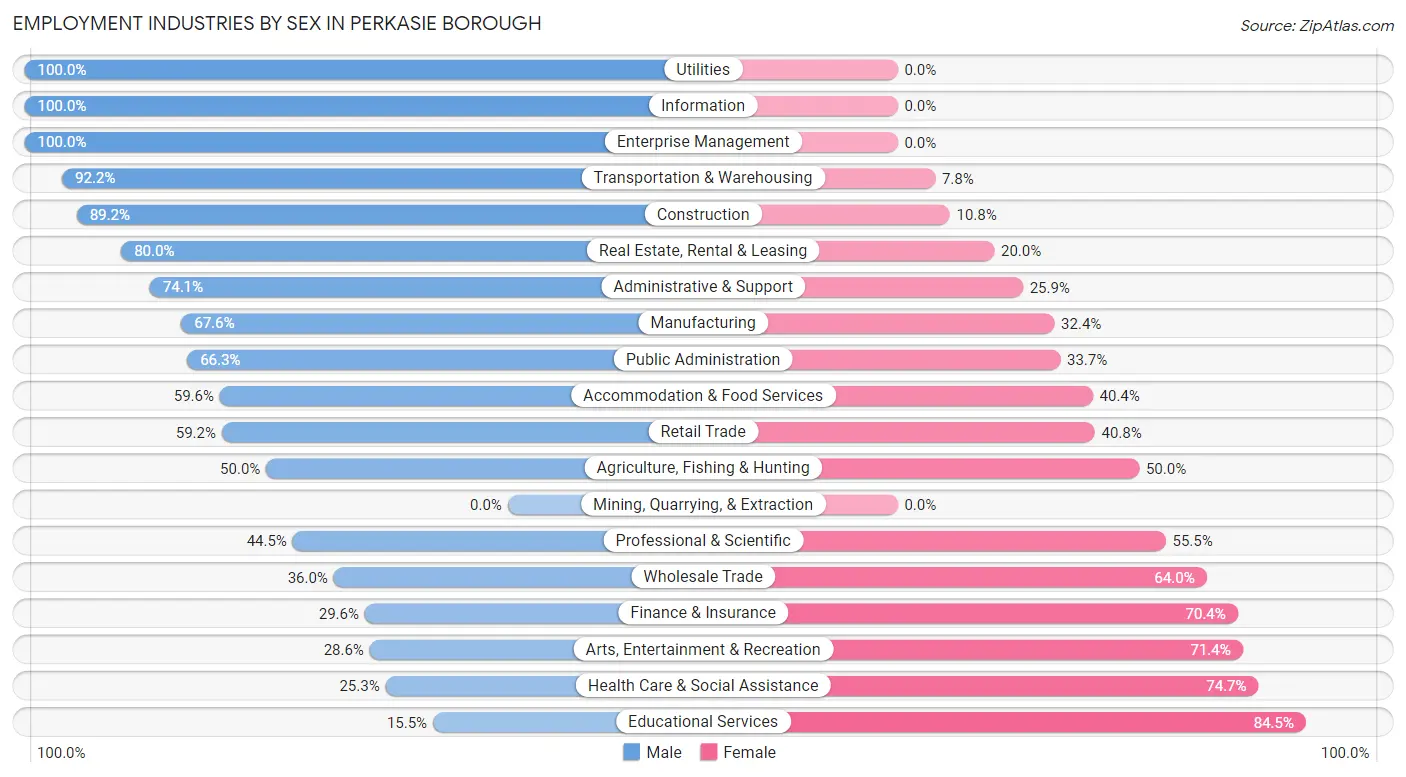
| Industry | Male | Female |
| Agriculture, Fishing & Hunting | 6 (50.0%) | 6 (50.0%) |
| Mining, Quarrying, & Extraction | 0 (0.0%) | 0 (0.0%) |
| Construction | 339 (89.2%) | 41 (10.8%) |
| Manufacturing | 552 (67.6%) | 265 (32.4%) |
| Wholesale Trade | 67 (36.0%) | 119 (64.0%) |
| Retail Trade | 438 (59.2%) | 302 (40.8%) |
| Transportation & Warehousing | 95 (92.2%) | 8 (7.8%) |
| Utilities | 11 (100.0%) | 0 (0.0%) |
| Information | 50 (100.0%) | 0 (0.0%) |
| Finance & Insurance | 116 (29.6%) | 276 (70.4%) |
| Real Estate, Rental & Leasing | 72 (80.0%) | 18 (20.0%) |
| Professional & Scientific | 150 (44.5%) | 187 (55.5%) |
| Enterprise Management | 59 (100.0%) | 0 (0.0%) |
| Administrative & Support | 80 (74.1%) | 28 (25.9%) |
| Educational Services | 96 (15.5%) | 524 (84.5%) |
| Health Care & Social Assistance | 229 (25.3%) | 676 (74.7%) |
| Arts, Entertainment & Recreation | 38 (28.6%) | 95 (71.4%) |
| Accommodation & Food Services | 149 (59.6%) | 101 (40.4%) |
| Public Administration | 67 (66.3%) | 34 (33.7%) |
| Total | 2,814 (50.3%) | 2,779 (49.7%) |
Education in Perkasie borough
School Enrollment in Perkasie borough
The most common levels of schooling among the 2,039 students in Perkasie borough are middle school (486 | 23.8%), college / undergraduate (384 | 18.8%), and high school (377 | 18.5%).
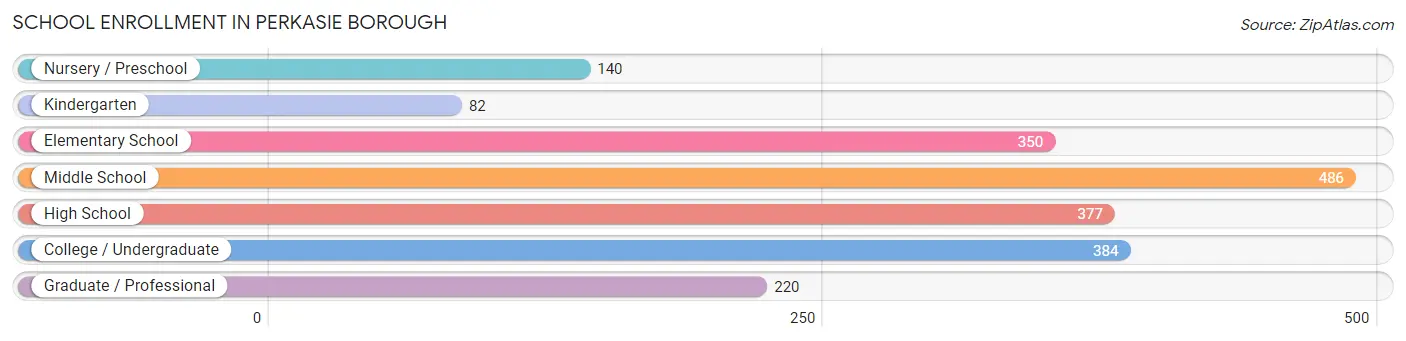
| School Level | # Students | % Students |
| Nursery / Preschool | 140 | 6.9% |
| Kindergarten | 82 | 4.0% |
| Elementary School | 350 | 17.2% |
| Middle School | 486 | 23.8% |
| High School | 377 | 18.5% |
| College / Undergraduate | 384 | 18.8% |
| Graduate / Professional | 220 | 10.8% |
| Total | 2,039 | 100.0% |
School Enrollment by Age by Funding Source in Perkasie borough
Out of a total of 2,039 students who are enrolled in schools in Perkasie borough, 440 (21.6%) attend a private institution, while the remaining 1,599 (78.4%) are enrolled in public schools. The age group of 18 to 19 year olds has the highest likelihood of being enrolled in private schools, with 97 (64.7% in the age bracket) enrolled. Conversely, the age group of 3 to 4 year olds has the lowest likelihood of being enrolled in a private school, with 127 (100.0% in the age bracket) attending a public institution.
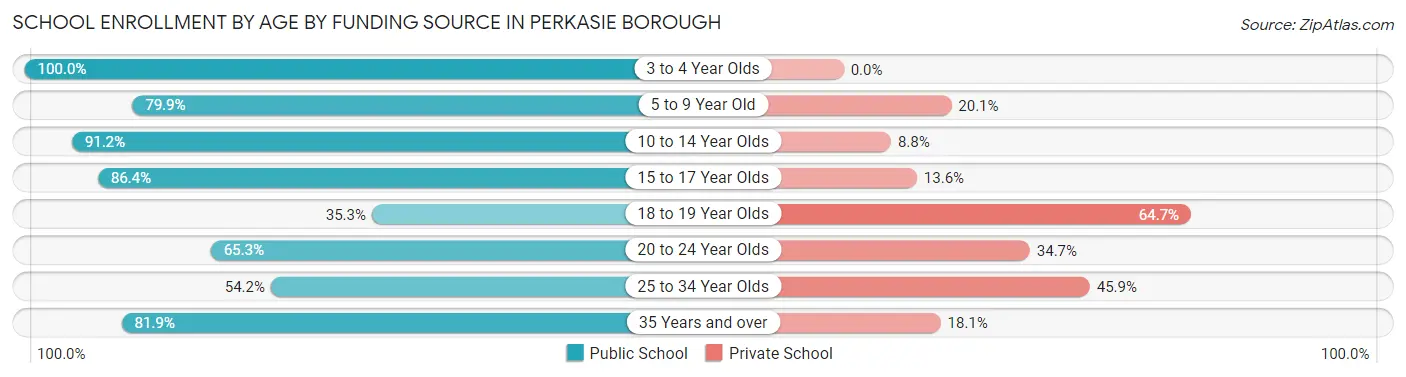
| Age Bracket | Public School | Private School |
| 3 to 4 Year Olds | 127 (100.0%) | 0 (0.0%) |
| 5 to 9 Year Old | 275 (79.9%) | 69 (20.1%) |
| 10 to 14 Year Olds | 600 (91.2%) | 58 (8.8%) |
| 15 to 17 Year Olds | 247 (86.4%) | 39 (13.6%) |
| 18 to 19 Year Olds | 53 (35.3%) | 97 (64.7%) |
| 20 to 24 Year Olds | 113 (65.3%) | 60 (34.7%) |
| 25 to 34 Year Olds | 124 (54.1%) | 105 (45.9%) |
| 35 Years and over | 59 (81.9%) | 13 (18.1%) |
| Total | 1,599 (78.4%) | 440 (21.6%) |
Educational Attainment by Field of Study in Perkasie borough
Education (545 | 19.2%), business (433 | 15.3%), arts & humanities (275 | 9.7%), communications (203 | 7.2%), and engineering (194 | 6.9%) are the most common fields of study among 2,832 individuals in Perkasie borough who have obtained a bachelor's degree or higher.
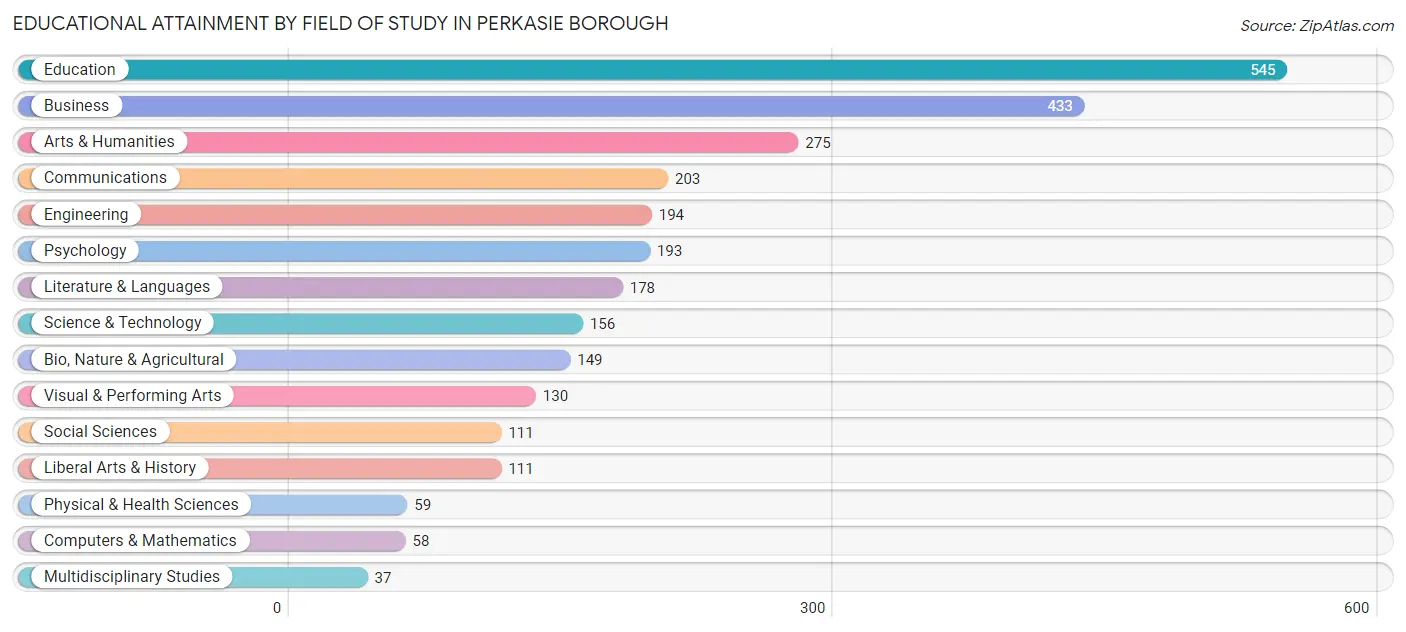
| Field of Study | # Graduates | % Graduates |
| Computers & Mathematics | 58 | 2.1% |
| Bio, Nature & Agricultural | 149 | 5.3% |
| Physical & Health Sciences | 59 | 2.1% |
| Psychology | 193 | 6.8% |
| Social Sciences | 111 | 3.9% |
| Engineering | 194 | 6.9% |
| Multidisciplinary Studies | 37 | 1.3% |
| Science & Technology | 156 | 5.5% |
| Business | 433 | 15.3% |
| Education | 545 | 19.2% |
| Literature & Languages | 178 | 6.3% |
| Liberal Arts & History | 111 | 3.9% |
| Visual & Performing Arts | 130 | 4.6% |
| Communications | 203 | 7.2% |
| Arts & Humanities | 275 | 9.7% |
| Total | 2,832 | 100.0% |
Transportation & Commute in Perkasie borough
Vehicle Availability by Sex in Perkasie borough
The most prevalent vehicle ownership categories in Perkasie borough are males with 2 vehicles (1,263, accounting for 45.5%) and females with 2 vehicles (1,093, making up 45.8%).
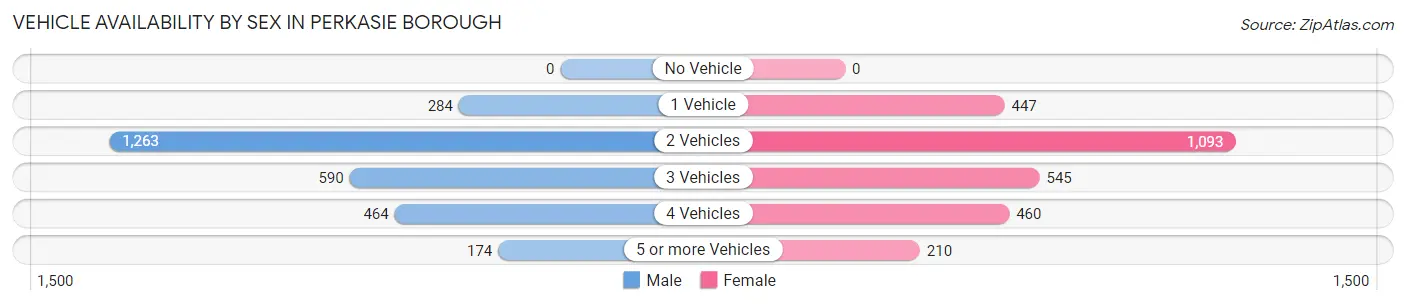
| Vehicles Available | Male | Female |
| No Vehicle | 0 (0.0%) | 0 (0.0%) |
| 1 Vehicle | 284 (10.2%) | 447 (16.2%) |
| 2 Vehicles | 1,263 (45.5%) | 1,093 (39.7%) |
| 3 Vehicles | 590 (21.3%) | 545 (19.8%) |
| 4 Vehicles | 464 (16.7%) | 460 (16.7%) |
| 5 or more Vehicles | 174 (6.3%) | 210 (7.6%) |
| Total | 2,775 (100.0%) | 2,755 (100.0%) |
Commute Time in Perkasie borough
The most frequently occuring commute durations in Perkasie borough are 20 to 24 minutes (717 commuters, 14.6%), 15 to 19 minutes (640 commuters, 13.0%), and 30 to 34 minutes (574 commuters, 11.7%).
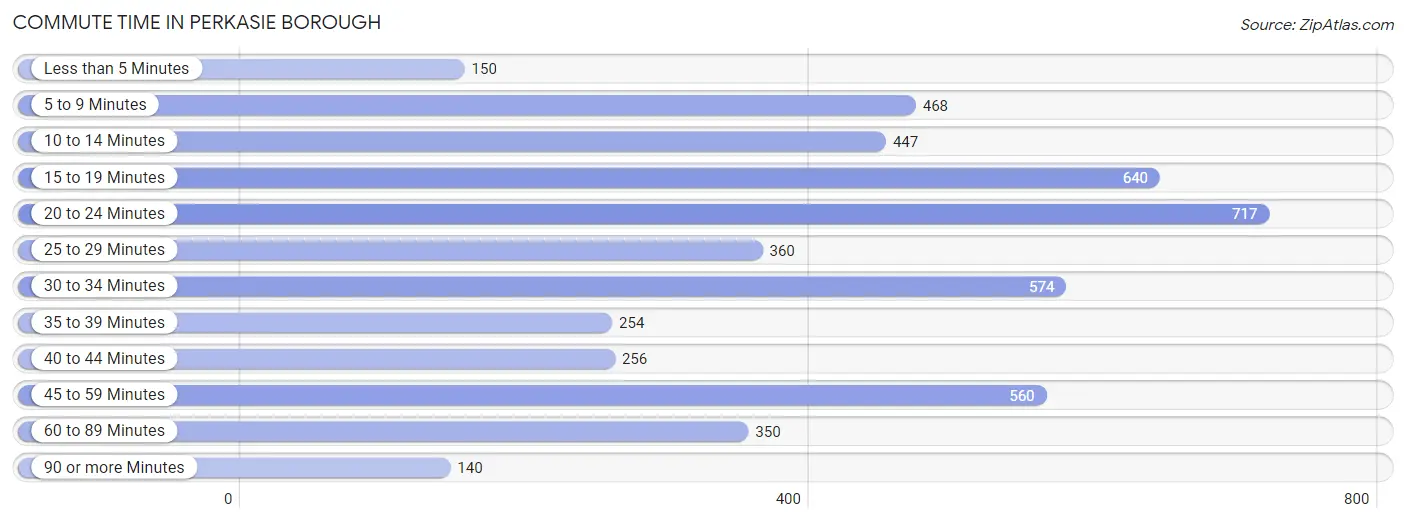
| Commute Time | # Commuters | % Commuters |
| Less than 5 Minutes | 150 | 3.0% |
| 5 to 9 Minutes | 468 | 9.5% |
| 10 to 14 Minutes | 447 | 9.1% |
| 15 to 19 Minutes | 640 | 13.0% |
| 20 to 24 Minutes | 717 | 14.6% |
| 25 to 29 Minutes | 360 | 7.3% |
| 30 to 34 Minutes | 574 | 11.7% |
| 35 to 39 Minutes | 254 | 5.2% |
| 40 to 44 Minutes | 256 | 5.2% |
| 45 to 59 Minutes | 560 | 11.4% |
| 60 to 89 Minutes | 350 | 7.1% |
| 90 or more Minutes | 140 | 2.9% |
Commute Time by Sex in Perkasie borough
The most common commute times in Perkasie borough are 30 to 34 minutes (392 commuters, 15.9%) for males and 20 to 24 minutes (443 commuters, 18.1%) for females.
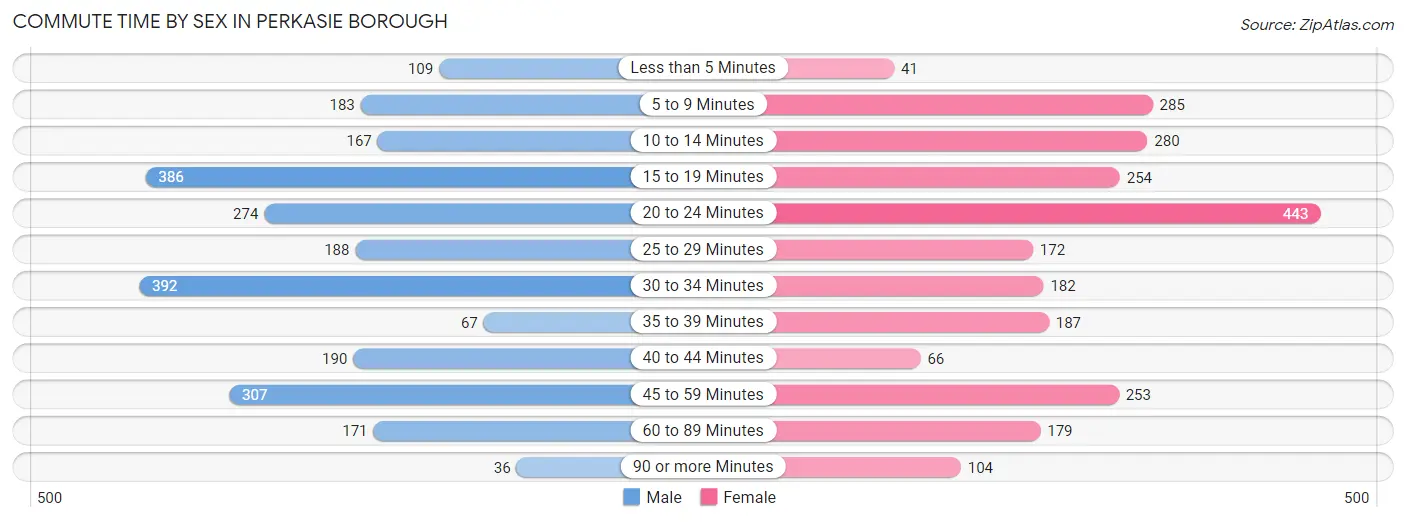
| Commute Time | Male | Female |
| Less than 5 Minutes | 109 (4.4%) | 41 (1.7%) |
| 5 to 9 Minutes | 183 (7.4%) | 285 (11.7%) |
| 10 to 14 Minutes | 167 (6.8%) | 280 (11.5%) |
| 15 to 19 Minutes | 386 (15.6%) | 254 (10.4%) |
| 20 to 24 Minutes | 274 (11.1%) | 443 (18.1%) |
| 25 to 29 Minutes | 188 (7.6%) | 172 (7.0%) |
| 30 to 34 Minutes | 392 (15.9%) | 182 (7.4%) |
| 35 to 39 Minutes | 67 (2.7%) | 187 (7.6%) |
| 40 to 44 Minutes | 190 (7.7%) | 66 (2.7%) |
| 45 to 59 Minutes | 307 (12.4%) | 253 (10.3%) |
| 60 to 89 Minutes | 171 (6.9%) | 179 (7.3%) |
| 90 or more Minutes | 36 (1.5%) | 104 (4.3%) |
Time of Departure to Work by Sex in Perkasie borough
The most frequent times of departure to work in Perkasie borough are 7:00 AM to 7:29 AM (363, 14.7%) for males and 7:30 AM to 7:59 AM (512, 20.9%) for females.
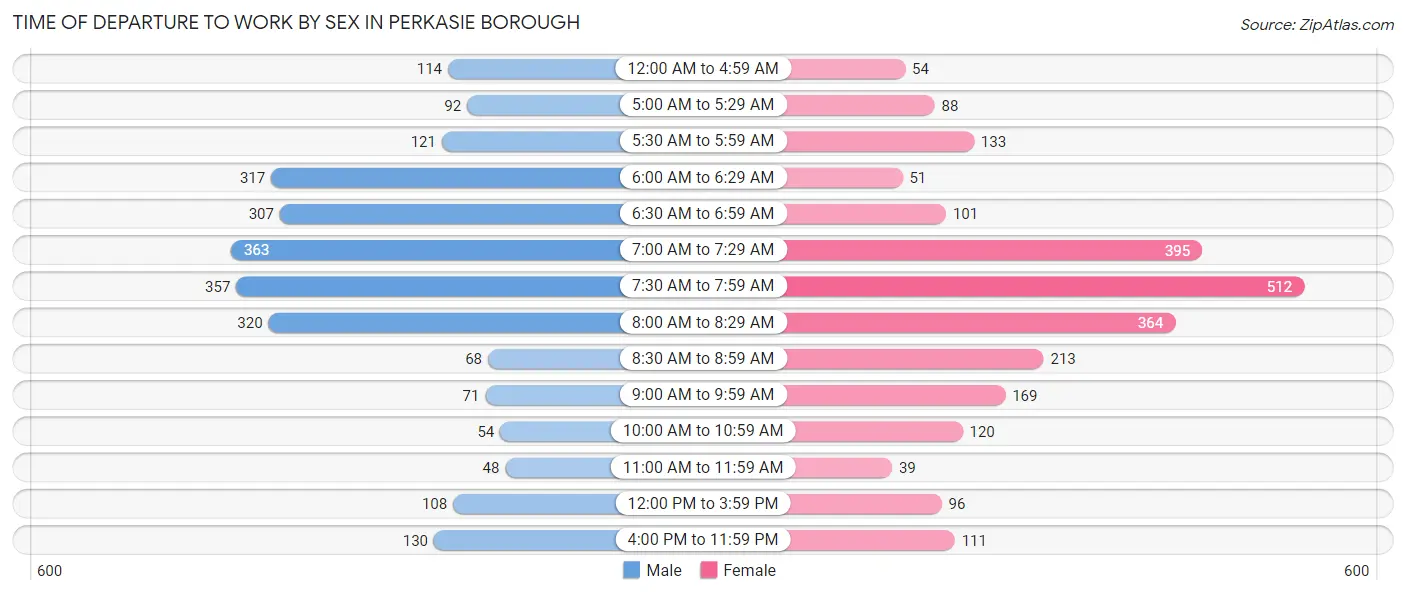
| Time of Departure | Male | Female |
| 12:00 AM to 4:59 AM | 114 (4.6%) | 54 (2.2%) |
| 5:00 AM to 5:29 AM | 92 (3.7%) | 88 (3.6%) |
| 5:30 AM to 5:59 AM | 121 (4.9%) | 133 (5.4%) |
| 6:00 AM to 6:29 AM | 317 (12.8%) | 51 (2.1%) |
| 6:30 AM to 6:59 AM | 307 (12.4%) | 101 (4.1%) |
| 7:00 AM to 7:29 AM | 363 (14.7%) | 395 (16.2%) |
| 7:30 AM to 7:59 AM | 357 (14.4%) | 512 (20.9%) |
| 8:00 AM to 8:29 AM | 320 (13.0%) | 364 (14.9%) |
| 8:30 AM to 8:59 AM | 68 (2.8%) | 213 (8.7%) |
| 9:00 AM to 9:59 AM | 71 (2.9%) | 169 (6.9%) |
| 10:00 AM to 10:59 AM | 54 (2.2%) | 120 (4.9%) |
| 11:00 AM to 11:59 AM | 48 (1.9%) | 39 (1.6%) |
| 12:00 PM to 3:59 PM | 108 (4.4%) | 96 (3.9%) |
| 4:00 PM to 11:59 PM | 130 (5.3%) | 111 (4.5%) |
| Total | 2,470 (100.0%) | 2,446 (100.0%) |
Housing Occupancy in Perkasie borough
Occupancy by Ownership in Perkasie borough
Of the total 3,495 dwellings in Perkasie borough, owner-occupied units account for 2,432 (69.6%), while renter-occupied units make up 1,063 (30.4%).
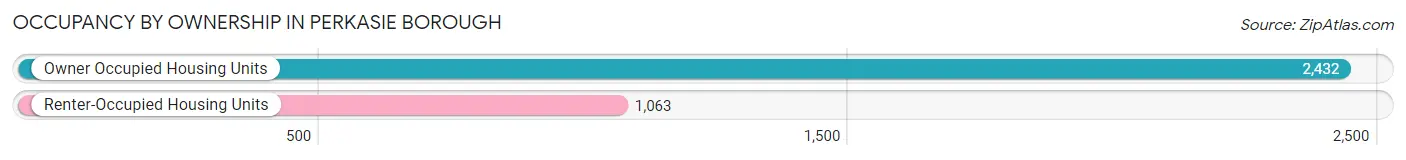
| Occupancy | # Housing Units | % Housing Units |
| Owner Occupied Housing Units | 2,432 | 69.6% |
| Renter-Occupied Housing Units | 1,063 | 30.4% |
| Total Occupied Housing Units | 3,495 | 100.0% |
Occupancy by Household Size in Perkasie borough
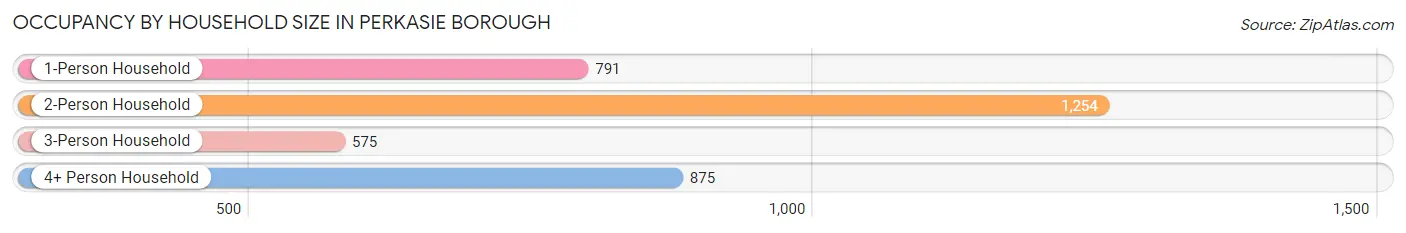
| Household Size | # Housing Units | % Housing Units |
| 1-Person Household | 791 | 22.6% |
| 2-Person Household | 1,254 | 35.9% |
| 3-Person Household | 575 | 16.5% |
| 4+ Person Household | 875 | 25.0% |
| Total Housing Units | 3,495 | 100.0% |
Occupancy by Ownership by Household Size in Perkasie borough
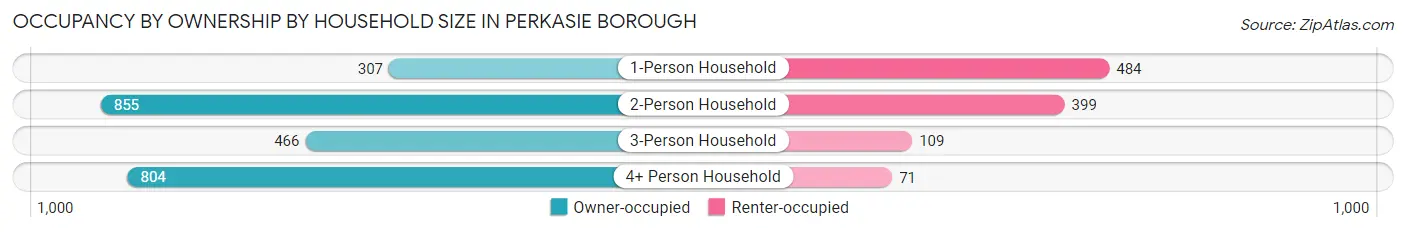
| Household Size | Owner-occupied | Renter-occupied |
| 1-Person Household | 307 (38.8%) | 484 (61.2%) |
| 2-Person Household | 855 (68.2%) | 399 (31.8%) |
| 3-Person Household | 466 (81.0%) | 109 (19.0%) |
| 4+ Person Household | 804 (91.9%) | 71 (8.1%) |
| Total Housing Units | 2,432 (69.6%) | 1,063 (30.4%) |
Occupancy by Educational Attainment in Perkasie borough
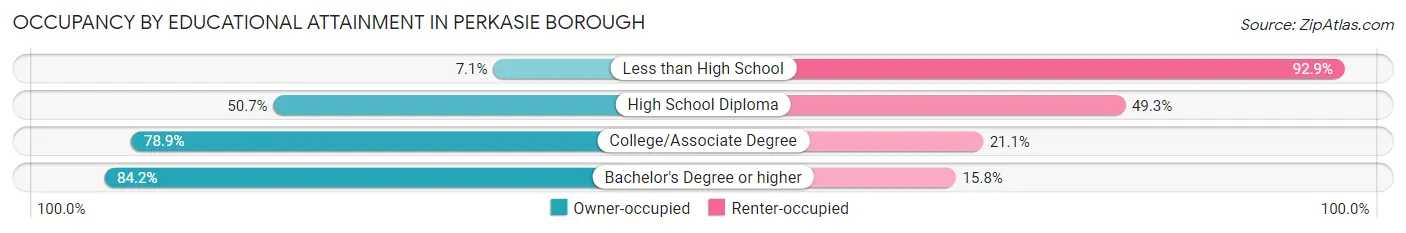
| Household Size | Owner-occupied | Renter-occupied |
| Less than High School | 8 (7.1%) | 105 (92.9%) |
| High School Diploma | 569 (50.7%) | 554 (49.3%) |
| College/Associate Degree | 706 (78.9%) | 189 (21.1%) |
| Bachelor's Degree or higher | 1,149 (84.2%) | 215 (15.8%) |
Occupancy by Age of Householder in Perkasie borough
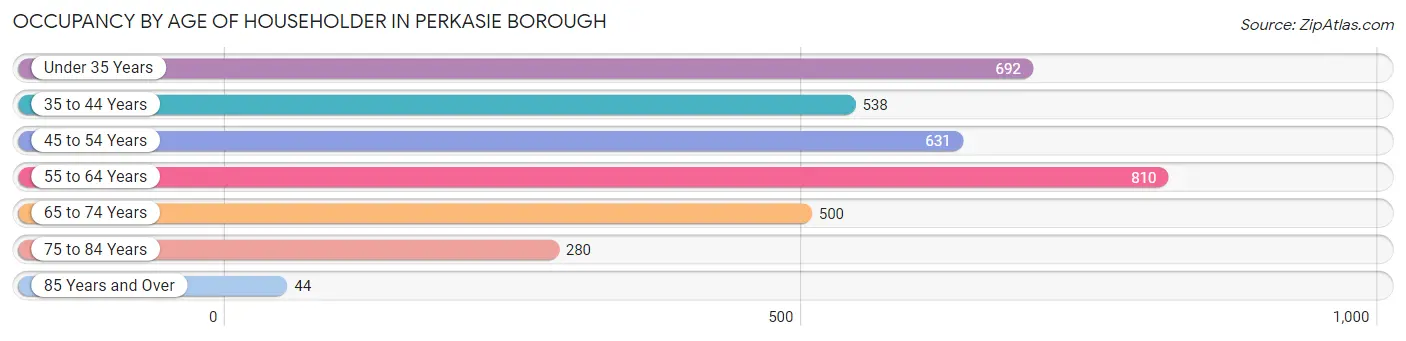
| Age Bracket | # Households | % Households |
| Under 35 Years | 692 | 19.8% |
| 35 to 44 Years | 538 | 15.4% |
| 45 to 54 Years | 631 | 18.0% |
| 55 to 64 Years | 810 | 23.2% |
| 65 to 74 Years | 500 | 14.3% |
| 75 to 84 Years | 280 | 8.0% |
| 85 Years and Over | 44 | 1.3% |
| Total | 3,495 | 100.0% |
Housing Finances in Perkasie borough
Median Income by Occupancy in Perkasie borough
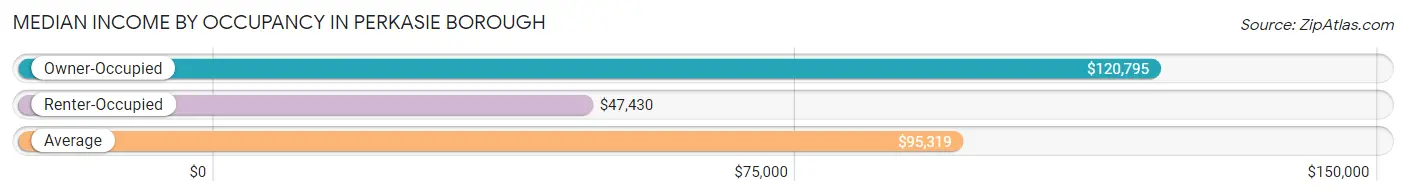
| Occupancy Type | # Households | Median Income |
| Owner-Occupied | 2,432 (69.6%) | $120,795 |
| Renter-Occupied | 1,063 (30.4%) | $47,430 |
| Average | 3,495 (100.0%) | $95,319 |
Occupancy by Householder Income Bracket in Perkasie borough
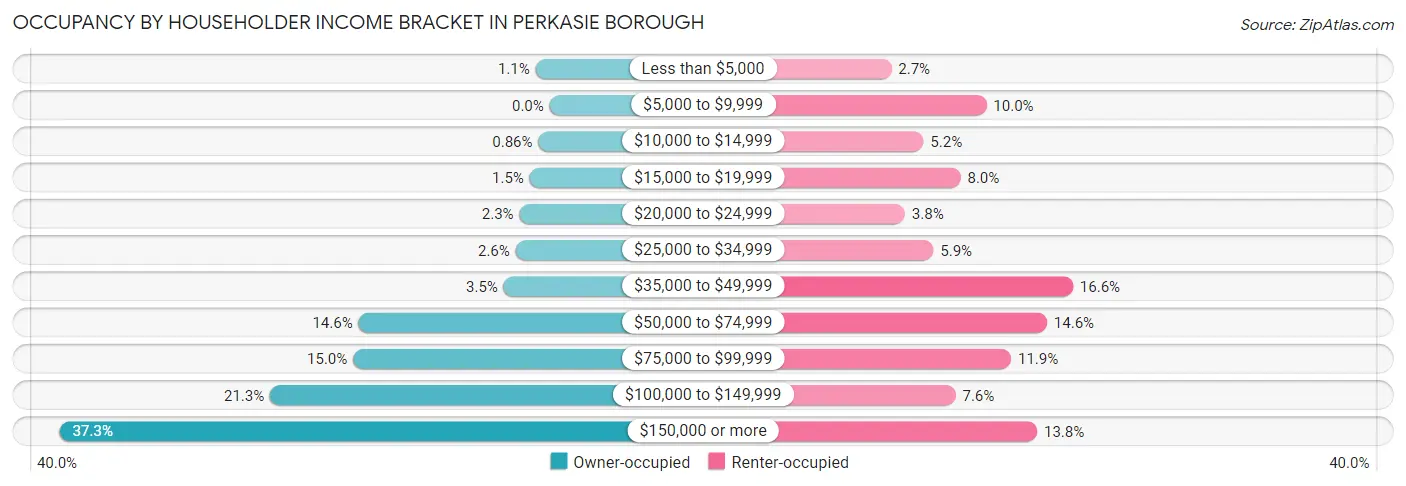
| Income Bracket | Owner-occupied | Renter-occupied |
| Less than $5,000 | 26 (1.1%) | 29 (2.7%) |
| $5,000 to $9,999 | 0 (0.0%) | 106 (10.0%) |
| $10,000 to $14,999 | 21 (0.9%) | 55 (5.2%) |
| $15,000 to $19,999 | 37 (1.5%) | 85 (8.0%) |
| $20,000 to $24,999 | 56 (2.3%) | 40 (3.8%) |
| $25,000 to $34,999 | 63 (2.6%) | 63 (5.9%) |
| $35,000 to $49,999 | 85 (3.5%) | 176 (16.6%) |
| $50,000 to $74,999 | 354 (14.6%) | 155 (14.6%) |
| $75,000 to $99,999 | 364 (15.0%) | 126 (11.8%) |
| $100,000 to $149,999 | 518 (21.3%) | 81 (7.6%) |
| $150,000 or more | 908 (37.3%) | 147 (13.8%) |
| Total | 2,432 (100.0%) | 1,063 (100.0%) |
Monthly Housing Cost Tiers in Perkasie borough
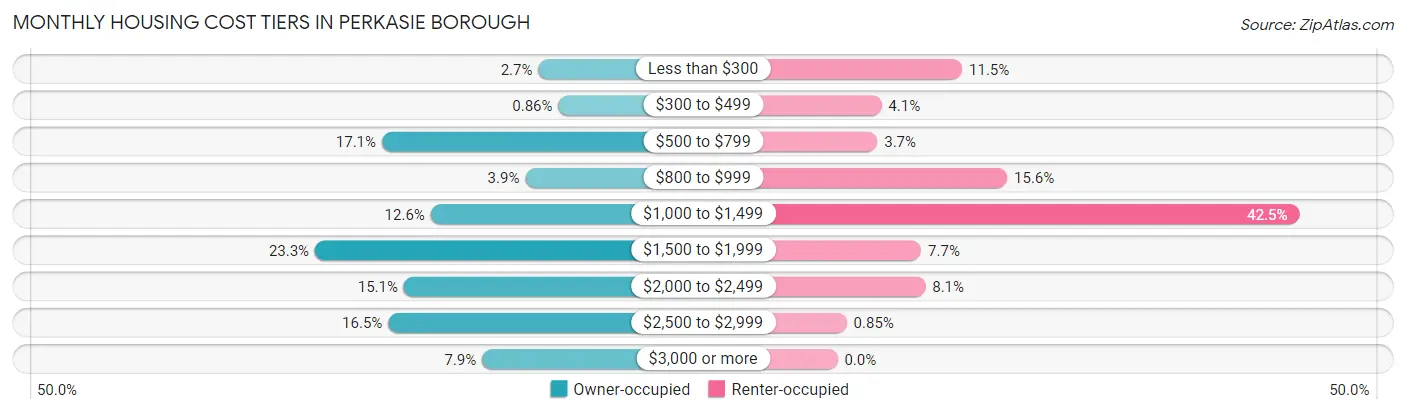
| Monthly Cost | Owner-occupied | Renter-occupied |
| Less than $300 | 66 (2.7%) | 122 (11.5%) |
| $300 to $499 | 21 (0.9%) | 43 (4.1%) |
| $500 to $799 | 416 (17.1%) | 39 (3.7%) |
| $800 to $999 | 95 (3.9%) | 166 (15.6%) |
| $1,000 to $1,499 | 307 (12.6%) | 452 (42.5%) |
| $1,500 to $1,999 | 566 (23.3%) | 82 (7.7%) |
| $2,000 to $2,499 | 367 (15.1%) | 86 (8.1%) |
| $2,500 to $2,999 | 402 (16.5%) | 9 (0.9%) |
| $3,000 or more | 192 (7.9%) | 0 (0.0%) |
| Total | 2,432 (100.0%) | 1,063 (100.0%) |
Physical Housing Characteristics in Perkasie borough
Housing Structures in Perkasie borough
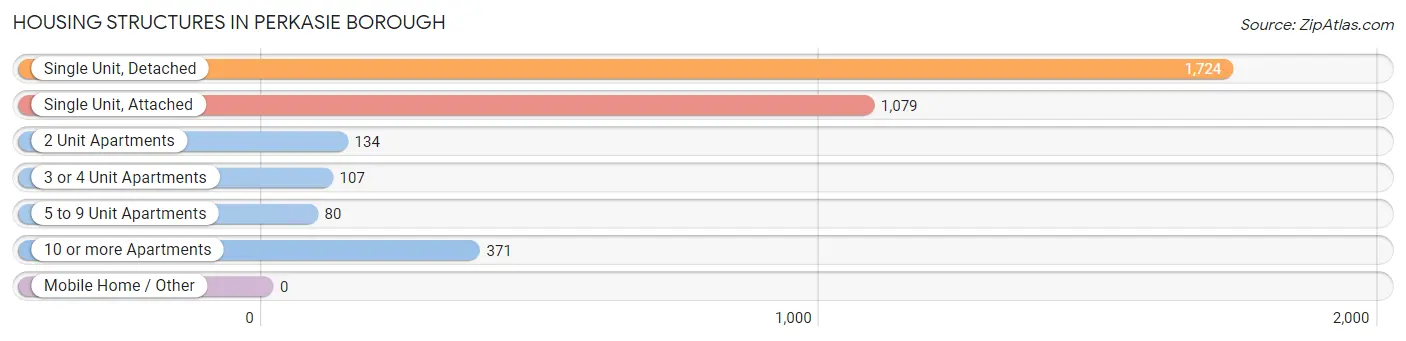
| Structure Type | # Housing Units | % Housing Units |
| Single Unit, Detached | 1,724 | 49.3% |
| Single Unit, Attached | 1,079 | 30.9% |
| 2 Unit Apartments | 134 | 3.8% |
| 3 or 4 Unit Apartments | 107 | 3.1% |
| 5 to 9 Unit Apartments | 80 | 2.3% |
| 10 or more Apartments | 371 | 10.6% |
| Mobile Home / Other | 0 | 0.0% |
| Total | 3,495 | 100.0% |
Housing Structures by Occupancy in Perkasie borough
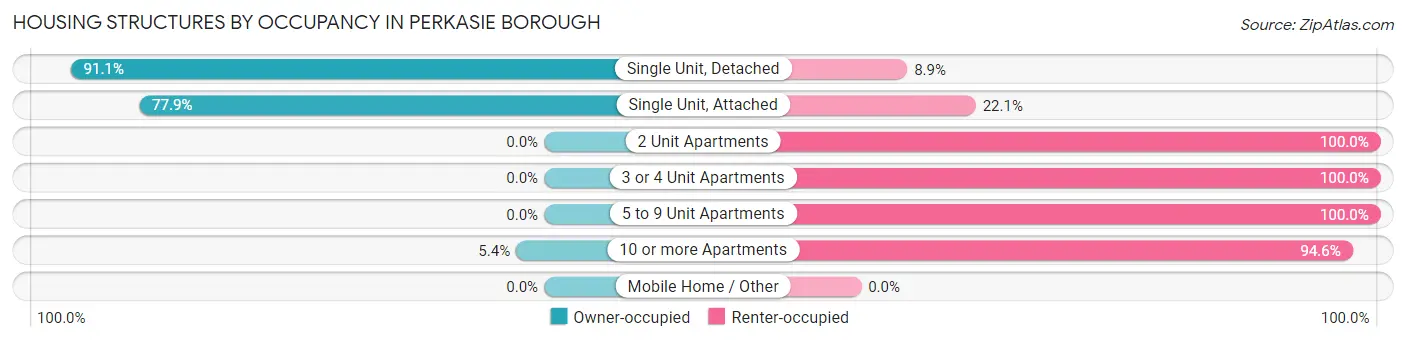
| Structure Type | Owner-occupied | Renter-occupied |
| Single Unit, Detached | 1,571 (91.1%) | 153 (8.9%) |
| Single Unit, Attached | 841 (77.9%) | 238 (22.1%) |
| 2 Unit Apartments | 0 (0.0%) | 134 (100.0%) |
| 3 or 4 Unit Apartments | 0 (0.0%) | 107 (100.0%) |
| 5 to 9 Unit Apartments | 0 (0.0%) | 80 (100.0%) |
| 10 or more Apartments | 20 (5.4%) | 351 (94.6%) |
| Mobile Home / Other | 0 (0.0%) | 0 (0.0%) |
| Total | 2,432 (69.6%) | 1,063 (30.4%) |
Housing Structures by Number of Rooms in Perkasie borough
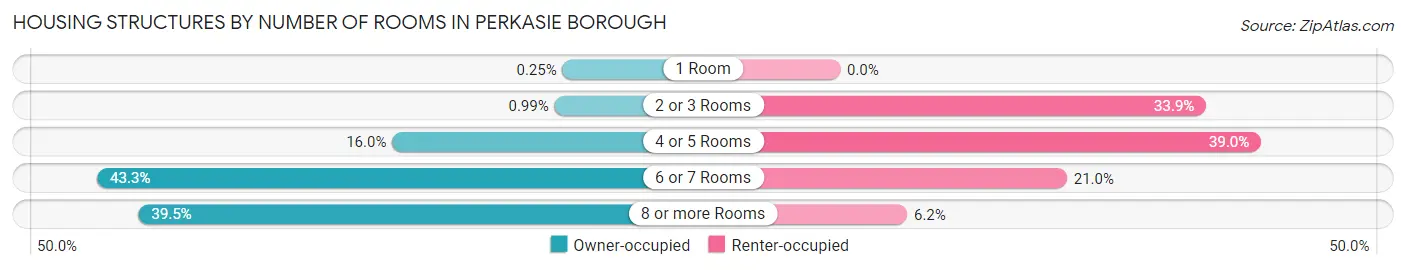
| Number of Rooms | Owner-occupied | Renter-occupied |
| 1 Room | 6 (0.3%) | 0 (0.0%) |
| 2 or 3 Rooms | 24 (1.0%) | 360 (33.9%) |
| 4 or 5 Rooms | 389 (16.0%) | 414 (39.0%) |
| 6 or 7 Rooms | 1,053 (43.3%) | 223 (21.0%) |
| 8 or more Rooms | 960 (39.5%) | 66 (6.2%) |
| Total | 2,432 (100.0%) | 1,063 (100.0%) |
Housing Structure by Heating Type in Perkasie borough
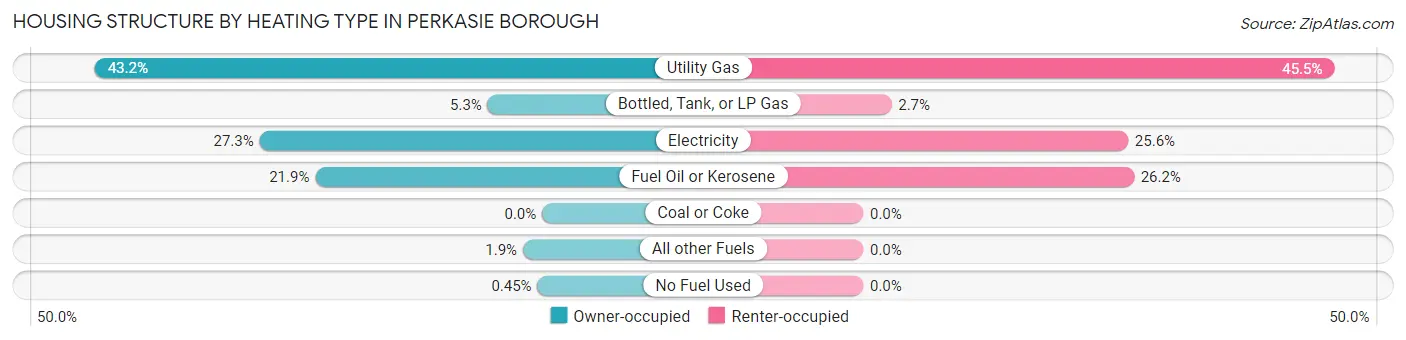
| Heating Type | Owner-occupied | Renter-occupied |
| Utility Gas | 1,051 (43.2%) | 484 (45.5%) |
| Bottled, Tank, or LP Gas | 128 (5.3%) | 29 (2.7%) |
| Electricity | 664 (27.3%) | 272 (25.6%) |
| Fuel Oil or Kerosene | 533 (21.9%) | 278 (26.2%) |
| Coal or Coke | 0 (0.0%) | 0 (0.0%) |
| All other Fuels | 45 (1.8%) | 0 (0.0%) |
| No Fuel Used | 11 (0.4%) | 0 (0.0%) |
| Total | 2,432 (100.0%) | 1,063 (100.0%) |
Household Vehicle Usage in Perkasie borough
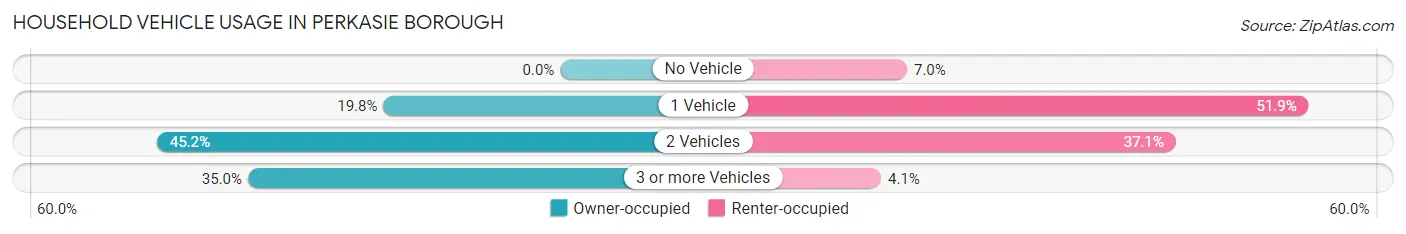
| Vehicles per Household | Owner-occupied | Renter-occupied |
| No Vehicle | 0 (0.0%) | 74 (7.0%) |
| 1 Vehicle | 482 (19.8%) | 552 (51.9%) |
| 2 Vehicles | 1,099 (45.2%) | 394 (37.1%) |
| 3 or more Vehicles | 851 (35.0%) | 43 (4.1%) |
| Total | 2,432 (100.0%) | 1,063 (100.0%) |
Real Estate & Mortgages in Perkasie borough
Real Estate and Mortgage Overview in Perkasie borough
| Characteristic | Without Mortgage | With Mortgage |
| Housing Units | 586 | 1,846 |
| Median Property Value | $299,000 | $313,400 |
| Median Household Income | $90,000 | $761 |
| Monthly Housing Costs | $691 | $192 |
| Real Estate Taxes | $3,642 | $62 |
Property Value by Mortgage Status in Perkasie borough
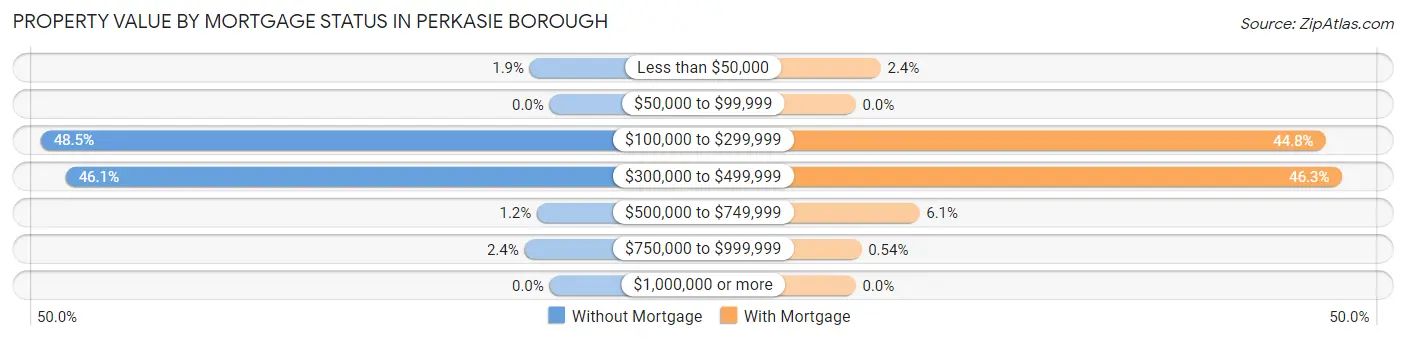
| Property Value | Without Mortgage | With Mortgage |
| Less than $50,000 | 11 (1.9%) | 44 (2.4%) |
| $50,000 to $99,999 | 0 (0.0%) | 0 (0.0%) |
| $100,000 to $299,999 | 284 (48.5%) | 826 (44.8%) |
| $300,000 to $499,999 | 270 (46.1%) | 854 (46.3%) |
| $500,000 to $749,999 | 7 (1.2%) | 112 (6.1%) |
| $750,000 to $999,999 | 14 (2.4%) | 10 (0.5%) |
| $1,000,000 or more | 0 (0.0%) | 0 (0.0%) |
| Total | 586 (100.0%) | 1,846 (100.0%) |
Household Income by Mortgage Status in Perkasie borough
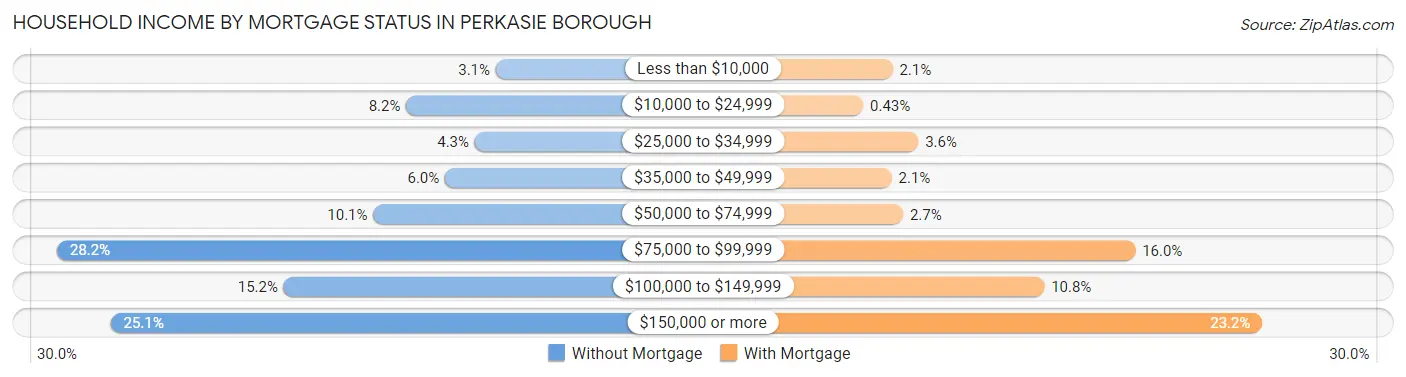
| Household Income | Without Mortgage | With Mortgage |
| Less than $10,000 | 18 (3.1%) | 39 (2.1%) |
| $10,000 to $24,999 | 48 (8.2%) | 8 (0.4%) |
| $25,000 to $34,999 | 25 (4.3%) | 66 (3.6%) |
| $35,000 to $49,999 | 35 (6.0%) | 38 (2.1%) |
| $50,000 to $74,999 | 59 (10.1%) | 50 (2.7%) |
| $75,000 to $99,999 | 165 (28.2%) | 295 (16.0%) |
| $100,000 to $149,999 | 89 (15.2%) | 199 (10.8%) |
| $150,000 or more | 147 (25.1%) | 429 (23.2%) |
| Total | 586 (100.0%) | 1,846 (100.0%) |
Property Value to Household Income Ratio in Perkasie borough
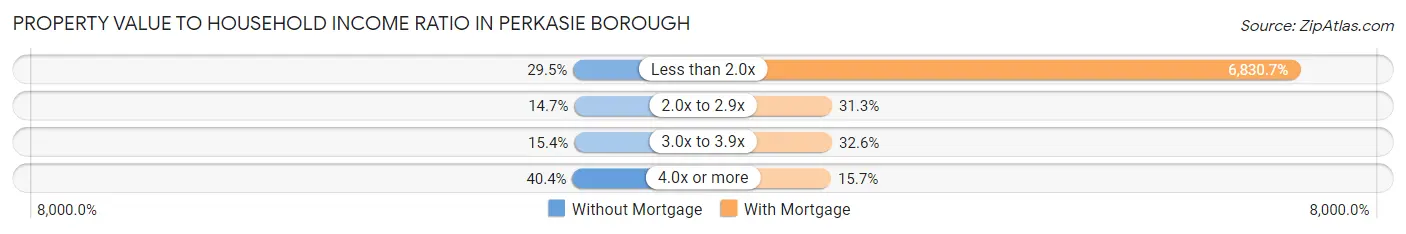
| Value-to-Income Ratio | Without Mortgage | With Mortgage |
| Less than 2.0x | 173 (29.5%) | 126,094 (6,830.7%) |
| 2.0x to 2.9x | 86 (14.7%) | 578 (31.3%) |
| 3.0x to 3.9x | 90 (15.4%) | 601 (32.6%) |
| 4.0x or more | 237 (40.4%) | 289 (15.7%) |
| Total | 586 (100.0%) | 1,846 (100.0%) |
Real Estate Taxes by Mortgage Status in Perkasie borough
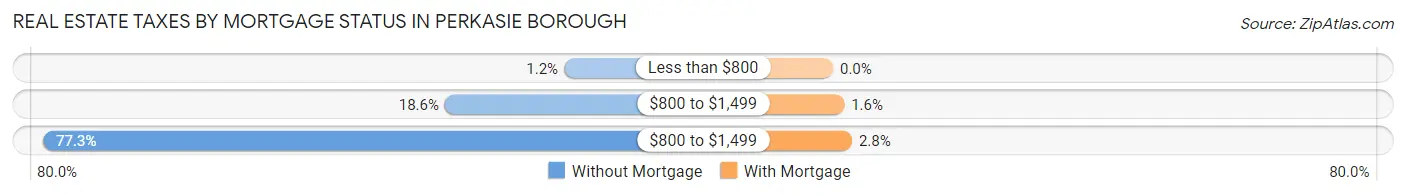
| Property Taxes | Without Mortgage | With Mortgage |
| Less than $800 | 7 (1.2%) | 0 (0.0%) |
| $800 to $1,499 | 109 (18.6%) | 30 (1.6%) |
| $800 to $1,499 | 453 (77.3%) | 51 (2.8%) |
| Total | 586 (100.0%) | 1,846 (100.0%) |
Health & Disability in Perkasie borough
Health Insurance Coverage by Age in Perkasie borough
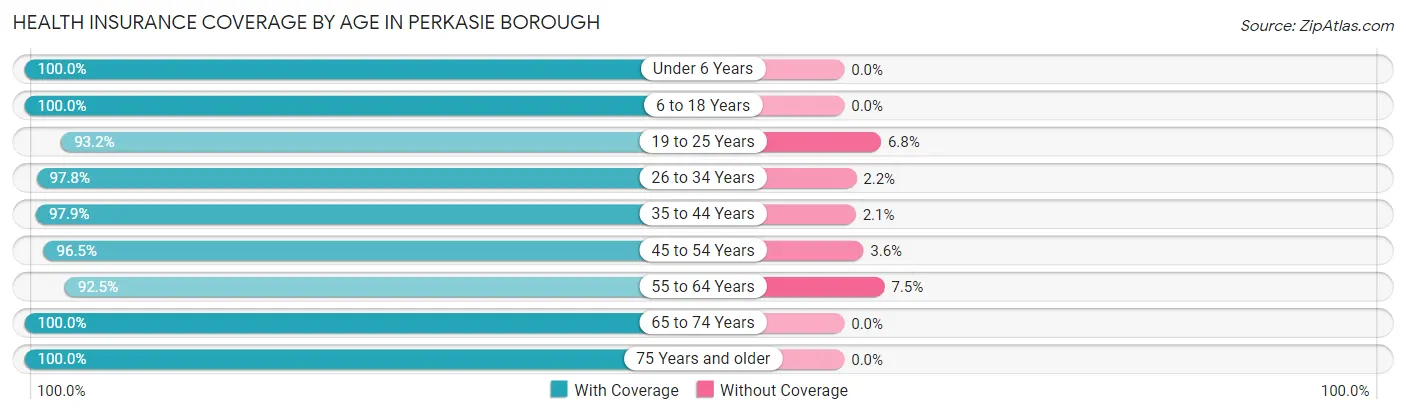
| Age Bracket | With Coverage | Without Coverage |
| Under 6 Years | 465 (100.0%) | 0 (0.0%) |
| 6 to 18 Years | 1,357 (100.0%) | 0 (0.0%) |
| 19 to 25 Years | 1,130 (93.2%) | 83 (6.8%) |
| 26 to 34 Years | 1,137 (97.8%) | 26 (2.2%) |
| 35 to 44 Years | 1,011 (97.9%) | 22 (2.1%) |
| 45 to 54 Years | 1,194 (96.5%) | 44 (3.5%) |
| 55 to 64 Years | 1,269 (92.5%) | 103 (7.5%) |
| 65 to 74 Years | 775 (100.0%) | 0 (0.0%) |
| 75 Years and older | 514 (100.0%) | 0 (0.0%) |
| Total | 8,852 (97.0%) | 278 (3.0%) |
Health Insurance Coverage by Citizenship Status in Perkasie borough
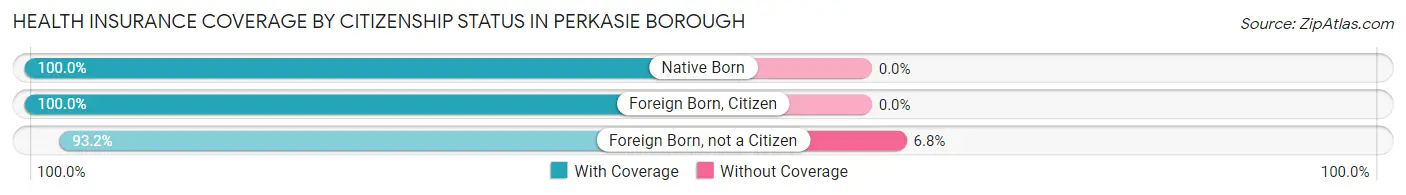
| Citizenship Status | With Coverage | Without Coverage |
| Native Born | 465 (100.0%) | 0 (0.0%) |
| Foreign Born, Citizen | 1,357 (100.0%) | 0 (0.0%) |
| Foreign Born, not a Citizen | 1,130 (93.2%) | 83 (6.8%) |
Health Insurance Coverage by Household Income in Perkasie borough
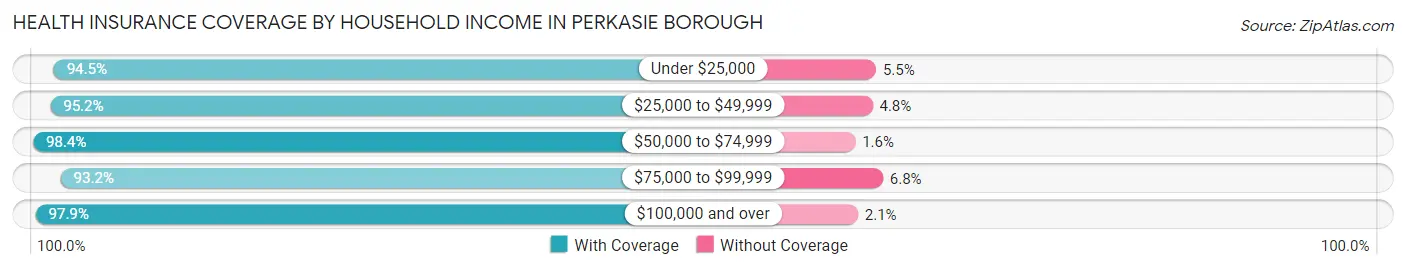
| Household Income | With Coverage | Without Coverage |
| Under $25,000 | 588 (94.5%) | 34 (5.5%) |
| $25,000 to $49,999 | 652 (95.2%) | 33 (4.8%) |
| $50,000 to $74,999 | 1,248 (98.4%) | 20 (1.6%) |
| $75,000 to $99,999 | 1,104 (93.2%) | 80 (6.8%) |
| $100,000 and over | 5,257 (97.9%) | 111 (2.1%) |
Public vs Private Health Insurance Coverage by Age in Perkasie borough
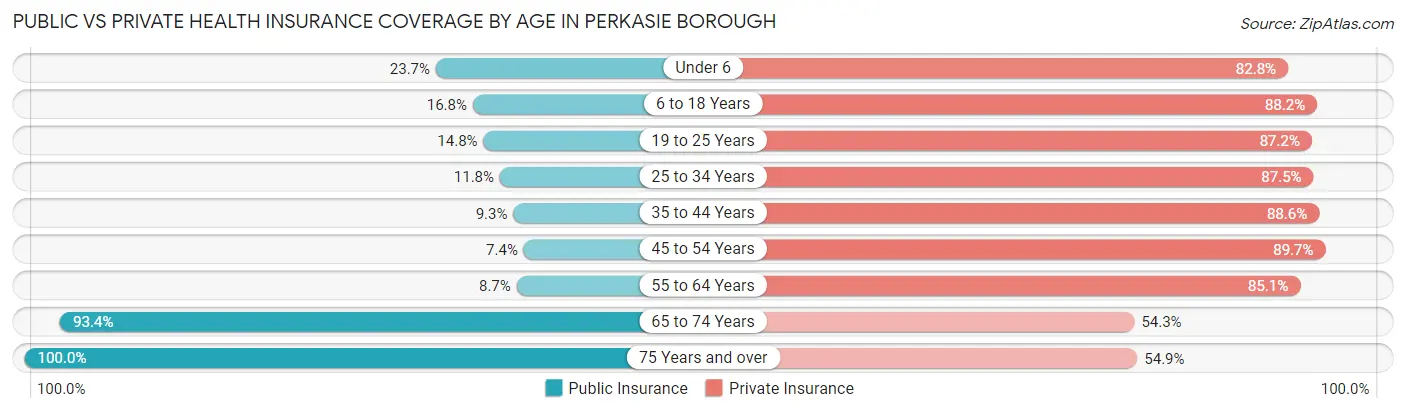
| Age Bracket | Public Insurance | Private Insurance |
| Under 6 | 110 (23.7%) | 385 (82.8%) |
| 6 to 18 Years | 228 (16.8%) | 1,197 (88.2%) |
| 19 to 25 Years | 180 (14.8%) | 1,058 (87.2%) |
| 25 to 34 Years | 137 (11.8%) | 1,018 (87.5%) |
| 35 to 44 Years | 96 (9.3%) | 915 (88.6%) |
| 45 to 54 Years | 91 (7.3%) | 1,111 (89.7%) |
| 55 to 64 Years | 119 (8.7%) | 1,167 (85.1%) |
| 65 to 74 Years | 724 (93.4%) | 421 (54.3%) |
| 75 Years and over | 514 (100.0%) | 282 (54.9%) |
| Total | 2,199 (24.1%) | 7,554 (82.7%) |
Disability Status by Sex by Age in Perkasie borough
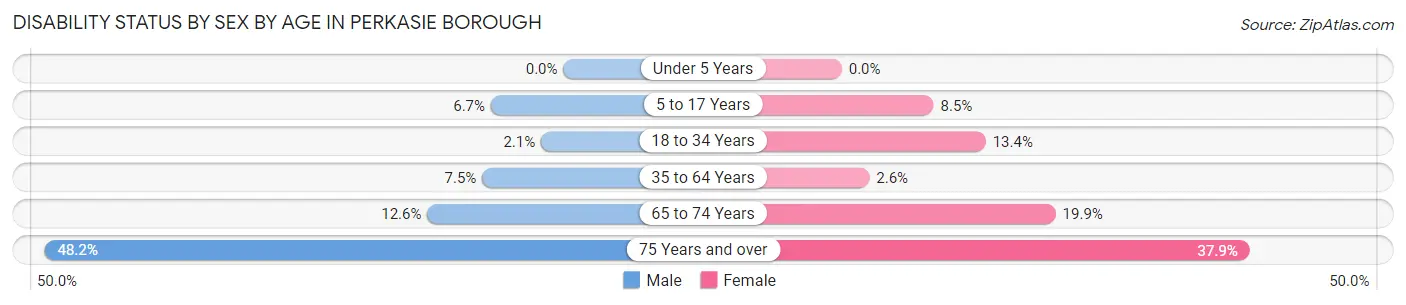
| Age Bracket | Male | Female |
| Under 5 Years | 0 (0.0%) | 0 (0.0%) |
| 5 to 17 Years | 48 (6.7%) | 54 (8.5%) |
| 18 to 34 Years | 25 (2.1%) | 165 (13.4%) |
| 35 to 64 Years | 130 (7.5%) | 49 (2.6%) |
| 65 to 74 Years | 47 (12.6%) | 80 (19.9%) |
| 75 Years and over | 91 (48.1%) | 123 (37.9%) |
Disability Class by Sex by Age in Perkasie borough
Disability Class: Hearing Difficulty
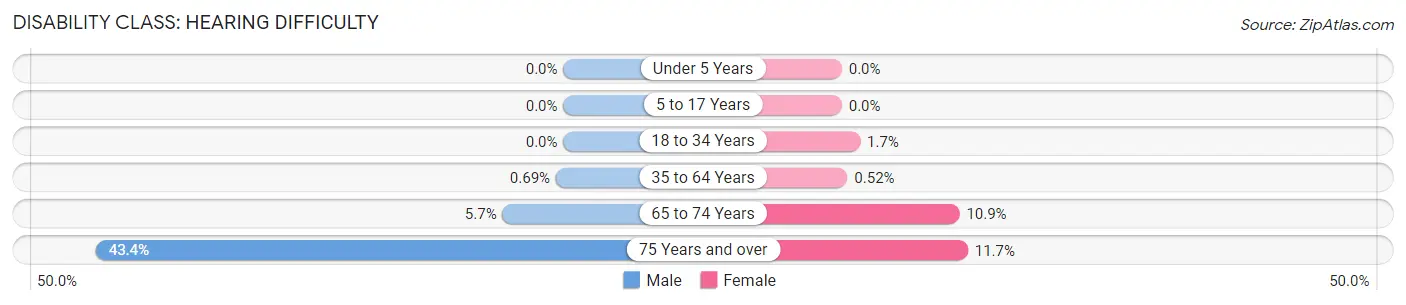
| Age Bracket | Male | Female |
| Under 5 Years | 0 (0.0%) | 0 (0.0%) |
| 5 to 17 Years | 0 (0.0%) | 0 (0.0%) |
| 18 to 34 Years | 0 (0.0%) | 21 (1.7%) |
| 35 to 64 Years | 12 (0.7%) | 10 (0.5%) |
| 65 to 74 Years | 21 (5.7%) | 44 (10.9%) |
| 75 Years and over | 82 (43.4%) | 38 (11.7%) |
Disability Class: Vision Difficulty
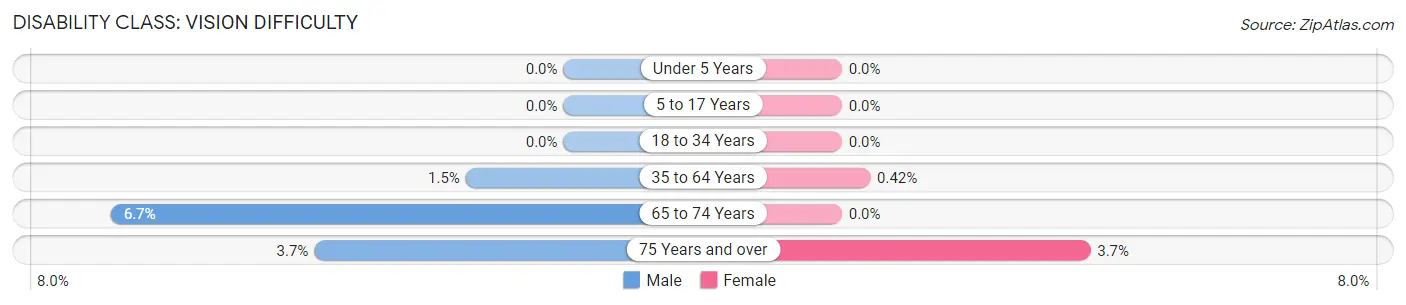
| Age Bracket | Male | Female |
| Under 5 Years | 0 (0.0%) | 0 (0.0%) |
| 5 to 17 Years | 0 (0.0%) | 0 (0.0%) |
| 18 to 34 Years | 0 (0.0%) | 0 (0.0%) |
| 35 to 64 Years | 25 (1.5%) | 8 (0.4%) |
| 65 to 74 Years | 25 (6.7%) | 0 (0.0%) |
| 75 Years and over | 7 (3.7%) | 12 (3.7%) |
Disability Class: Cognitive Difficulty
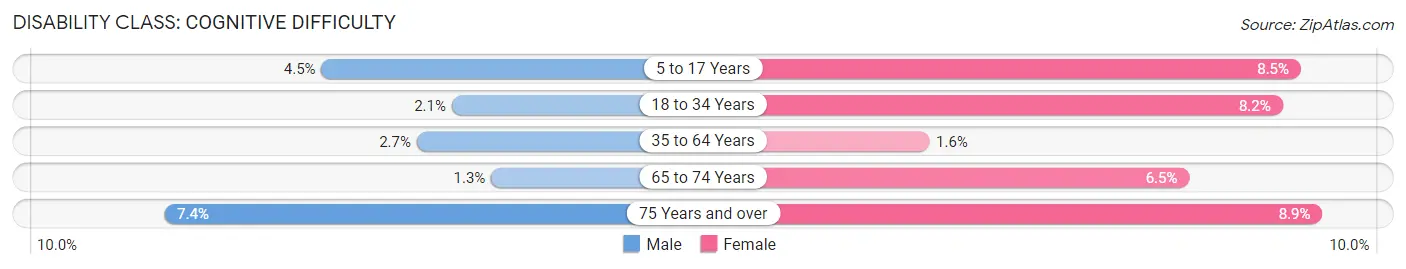
| Age Bracket | Male | Female |
| 5 to 17 Years | 32 (4.5%) | 54 (8.5%) |
| 18 to 34 Years | 25 (2.1%) | 101 (8.2%) |
| 35 to 64 Years | 47 (2.7%) | 31 (1.6%) |
| 65 to 74 Years | 5 (1.3%) | 26 (6.5%) |
| 75 Years and over | 14 (7.4%) | 29 (8.9%) |
Disability Class: Ambulatory Difficulty
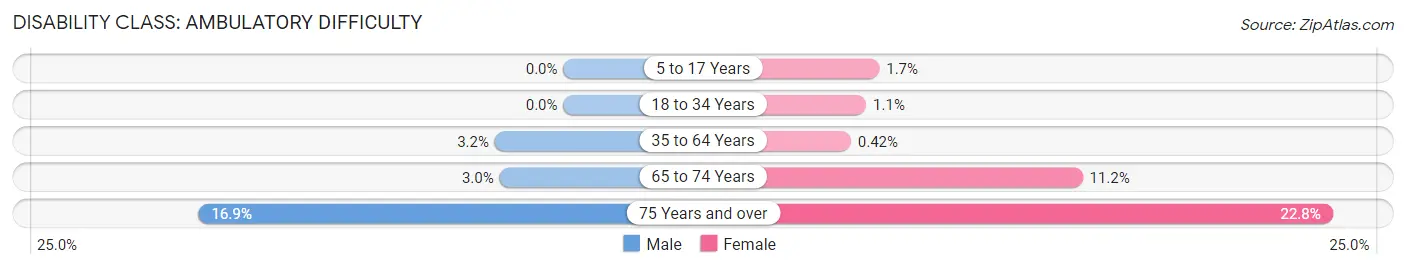
| Age Bracket | Male | Female |
| 5 to 17 Years | 0 (0.0%) | 11 (1.7%) |
| 18 to 34 Years | 0 (0.0%) | 14 (1.1%) |
| 35 to 64 Years | 55 (3.2%) | 8 (0.4%) |
| 65 to 74 Years | 11 (3.0%) | 45 (11.2%) |
| 75 Years and over | 32 (16.9%) | 74 (22.8%) |
Disability Class: Self-Care Difficulty
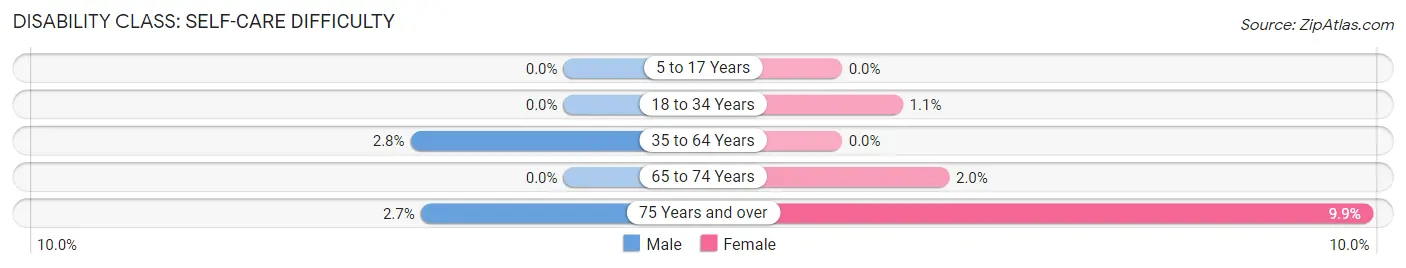
| Age Bracket | Male | Female |
| 5 to 17 Years | 0 (0.0%) | 0 (0.0%) |
| 18 to 34 Years | 0 (0.0%) | 14 (1.1%) |
| 35 to 64 Years | 49 (2.8%) | 0 (0.0%) |
| 65 to 74 Years | 0 (0.0%) | 8 (2.0%) |
| 75 Years and over | 5 (2.6%) | 32 (9.9%) |
Technology Access in Perkasie borough
Computing Device Access in Perkasie borough
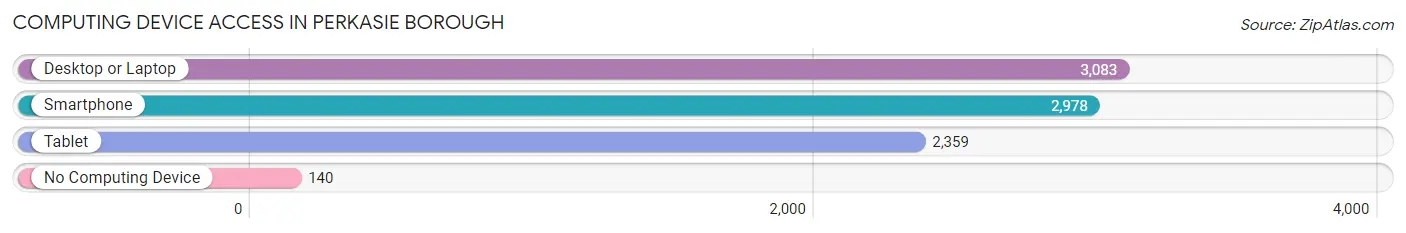
| Device Type | # Households | % Households |
| Desktop or Laptop | 3,083 | 88.2% |
| Smartphone | 2,978 | 85.2% |
| Tablet | 2,359 | 67.5% |
| No Computing Device | 140 | 4.0% |
| Total | 3,495 | 100.0% |
Internet Access in Perkasie borough
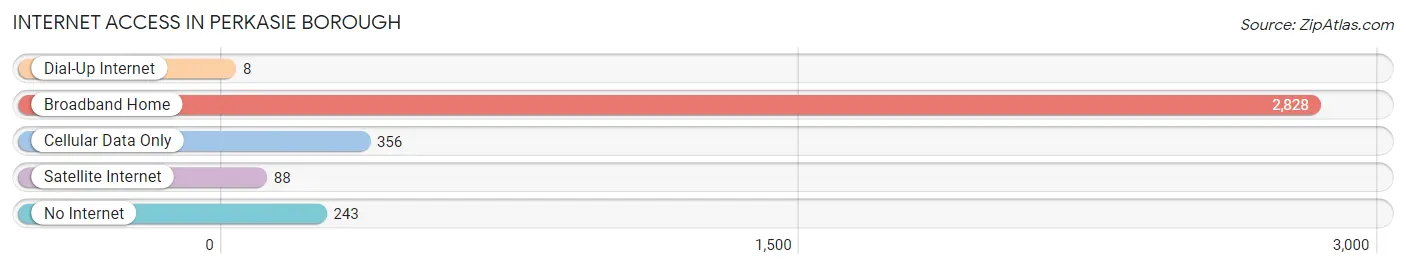
| Internet Type | # Households | % Households |
| Dial-Up Internet | 8 | 0.2% |
| Broadband Home | 2,828 | 80.9% |
| Cellular Data Only | 356 | 10.2% |
| Satellite Internet | 88 | 2.5% |
| No Internet | 243 | 7.0% |
| Total | 3,495 | 100.0% |
Perkasie borough Summary
Perkasie Borough is a small borough located in Bucks County, Pennsylvania. It is situated in the southeastern corner of the county, approximately 25 miles north of Philadelphia. The borough is bordered by Bedminster Township to the north, Sellersville Borough to the east, East Rockhill Township to the south, and Hilltown Township to the west. The population of Perkasie Borough was 8,511 at the 2010 census.
History
Perkasie Borough was founded in 1871 by a group of settlers from Philadelphia. The name of the borough is derived from the Lenape Indian word “perkase,” which means “where the hickory nuts were found.” The borough was incorporated in 1876 and was originally part of Hilltown Township.
The borough was a rural farming community until the late 19th century, when the railroad arrived. The railroad brought industry and commerce to the area, and the borough began to grow. The first post office was established in 1877, and the first school was built in 1881.
In the early 20th century, Perkasie Borough became a popular summer resort destination. The borough was home to several resorts, including the Perkasie Hotel, the Perkasie Park Hotel, and the Perkasie Inn. The resorts attracted visitors from Philadelphia and other nearby cities.
Geography
Perkasie Borough is located at 40°22'45" North, 75°17'45" West (40.379167, -75.295833). According to the United States Census Bureau, the borough has a total area of 1.2 square miles, all of it land.
The borough is located in the Delaware Valley, and is part of the Great Valley region of Pennsylvania. The borough is situated in a hilly area, with elevations ranging from 200 to 500 feet above sea level. The borough is drained by the Perkiomen Creek, which flows through the center of the borough.
Economy
The economy of Perkasie Borough is largely based on manufacturing and retail. The borough is home to several manufacturing companies, including Perkasie Manufacturing Company, which produces industrial machinery, and Perkasie Tool and Die, which produces precision tools and dies.
The borough is also home to several retail stores, including a Walmart Supercenter, a Giant Food Store, and several smaller stores. The borough is also home to several restaurants, including the Perkasie Diner, the Perkasie Pizza House, and the Perkasie Pub.
Demographics
As of the 2010 census, there were 8,511 people, 3,521 households, and 2,323 families residing in the borough. The population density was 7,072.2 people per square mile. The racial makeup of the borough was 94.2% White, 1.7% African American, 0.2% Native American, 1.3% Asian, 0.7% from other races, and 1.9% from two or more races. Hispanic or Latino of any race were 3.2% of the population.
There were 3,521 households, out of which 28.7% had children under the age of 18 living with them, 51.2% were married couples living together, 10.2% had a female householder with no husband present, and 34.2% were non-families. 29.2% of all households were made up of individuals, and 13.2% had someone living alone who was 65 years of age or older. The average household size was 2.41 and the average family size was 2.99.
In the borough, the population was spread out, with 22.7% under the age of 18, 6.7% from 18 to 24, 28.3% from 25 to 44, 24.7% from 45 to 64, and 17.6% who were 65 years of age or older. The median age was 40 years. For every 100 females, there were 91.2 males. For every 100 females age 18 and over, there were 88.2 males.
The median income for a household in the borough was $50,945, and the median income for a family was $62,917. Males had a median income of $45,917 versus $32,917 for females. The per capita income for the borough was $25,945. About 4.2% of families and 5.7% of the population were below the poverty line, including 6.7% of those under age 18 and 6.2% of those age 65 or over.
Common Questions
What is Per Capita Income in Perkasie borough?
Per Capita income in Perkasie borough is $46,725.
What is the Median Family Income in Perkasie borough?
Median Family Income in Perkasie borough is $121,335.
What is the Median Household income in Perkasie borough?
Median Household Income in Perkasie borough is $95,319.
What is Income or Wage Gap in Perkasie borough?
Income or Wage Gap in Perkasie borough is 47.5%.
Women in Perkasie borough earn 52.5 cents for every dollar earned by a man.
What is Inequality or Gini Index in Perkasie borough?
Inequality or Gini Index in Perkasie borough is 0.42.
What is the Total Population of Perkasie borough?
Total Population of Perkasie borough is 9,130.
What is the Total Male Population of Perkasie borough?
Total Male Population of Perkasie borough is 4,508.
What is the Total Female Population of Perkasie borough?
Total Female Population of Perkasie borough is 4,622.
What is the Ratio of Males per 100 Females in Perkasie borough?
There are 97.53 Males per 100 Females in Perkasie borough.
What is the Ratio of Females per 100 Males in Perkasie borough?
There are 102.53 Females per 100 Males in Perkasie borough.
What is the Median Population Age in Perkasie borough?
Median Population Age in Perkasie borough is 37.1 Years.
What is the Average Family Size in Perkasie borough
Average Family Size in Perkasie borough is 3.1 People.
What is the Average Household Size in Perkasie borough
Average Household Size in Perkasie borough is 2.6 People.
How Large is the Labor Force in Perkasie borough?
There are 5,812 People in the Labor Forcein in Perkasie borough.
What is the Percentage of People in the Labor Force in Perkasie borough?
76.8% of People are in the Labor Force in Perkasie borough.
What is the Unemployment Rate in Perkasie borough?
Unemployment Rate in Perkasie borough is 3.8%.