St Lawrence borough, PA Map & Demographics
St Lawrence borough Overview
$34,363
PER CAPITA INCOME
$89,250
AVG FAMILY INCOME
$78,953
AVG HOUSEHOLD INCOME
35.1%
WAGE / INCOME GAP [ % ]
64.9¢/ $1
WAGE / INCOME GAP [ $ ]
0.37
INEQUALITY / GINI INDEX
1,780
TOTAL POPULATION
772
MALE POPULATION
1,008
FEMALE POPULATION
76.59
MALES / 100 FEMALES
130.57
FEMALES / 100 MALES
38.2
MEDIAN AGE
3.2
AVG FAMILY SIZE
2.5
AVG HOUSEHOLD SIZE
919
LABOR FORCE [ PEOPLE ]
66.2%
PERCENT IN LABOR FORCE
4.7%
UNEMPLOYMENT RATE
Income in St Lawrence borough
Income Overview in St Lawrence borough
Per Capita Income in St Lawrence borough is $34,363, while median incomes of families and households are $89,250 and $78,953 respectively.
| Characteristic | Number | Measure |
| Per Capita Income | 1,780 | $34,363 |
| Median Family Income | 445 | $89,250 |
| Mean Family Income | 445 | $92,970 |
| Median Household Income | 718 | $78,953 |
| Mean Household Income | 718 | $84,709 |
| Income Deficit | 445 | $0 |
| Wage / Income Gap (%) | 1,780 | 35.08% |
| Wage / Income Gap ($) | 1,780 | 64.92¢ per $1 |
| Gini / Inequality Index | 1,780 | 0.37 |
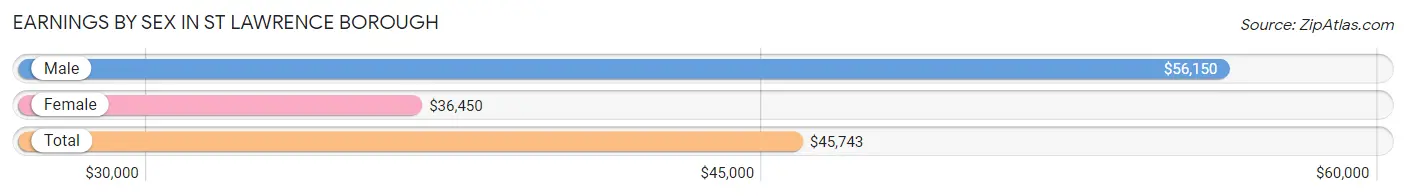
Earnings by Sex in St Lawrence borough
Average Earnings in St Lawrence borough are $45,743, $56,150 for men and $36,450 for women, a difference of 35.1%.
| Sex | Number | Average Earnings |
| Male | 469 (47.7%) | $56,150 |
| Female | 515 (52.3%) | $36,450 |
| Total | 984 (100.0%) | $45,743 |
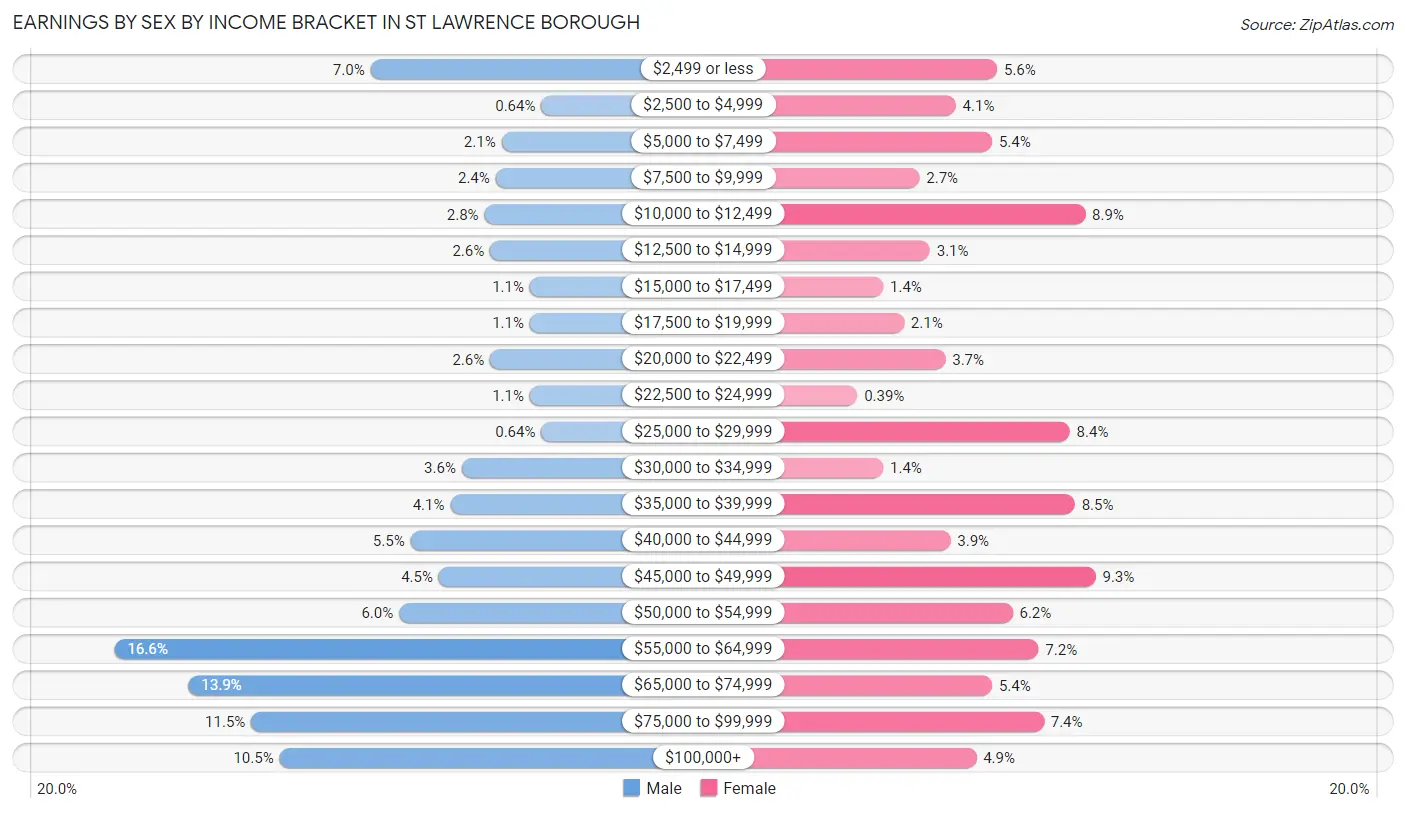
Earnings by Sex by Income Bracket in St Lawrence borough
The most common earnings brackets in St Lawrence borough are $55,000 to $64,999 for men (78 | 16.6%) and $45,000 to $49,999 for women (48 | 9.3%).
| Income | Male | Female |
| $2,499 or less | 33 (7.0%) | 29 (5.6%) |
| $2,500 to $4,999 | 3 (0.6%) | 21 (4.1%) |
| $5,000 to $7,499 | 10 (2.1%) | 28 (5.4%) |
| $7,500 to $9,999 | 11 (2.4%) | 14 (2.7%) |
| $10,000 to $12,499 | 13 (2.8%) | 46 (8.9%) |
| $12,500 to $14,999 | 12 (2.6%) | 16 (3.1%) |
| $15,000 to $17,499 | 5 (1.1%) | 7 (1.4%) |
| $17,500 to $19,999 | 5 (1.1%) | 11 (2.1%) |
| $20,000 to $22,499 | 12 (2.6%) | 19 (3.7%) |
| $22,500 to $24,999 | 5 (1.1%) | 2 (0.4%) |
| $25,000 to $29,999 | 3 (0.6%) | 43 (8.4%) |
| $30,000 to $34,999 | 17 (3.6%) | 7 (1.4%) |
| $35,000 to $39,999 | 19 (4.1%) | 44 (8.5%) |
| $40,000 to $44,999 | 26 (5.5%) | 20 (3.9%) |
| $45,000 to $49,999 | 21 (4.5%) | 48 (9.3%) |
| $50,000 to $54,999 | 28 (6.0%) | 32 (6.2%) |
| $55,000 to $64,999 | 78 (16.6%) | 37 (7.2%) |
| $65,000 to $74,999 | 65 (13.9%) | 28 (5.4%) |
| $75,000 to $99,999 | 54 (11.5%) | 38 (7.4%) |
| $100,000+ | 49 (10.4%) | 25 (4.9%) |
| Total | 469 (100.0%) | 515 (100.0%) |
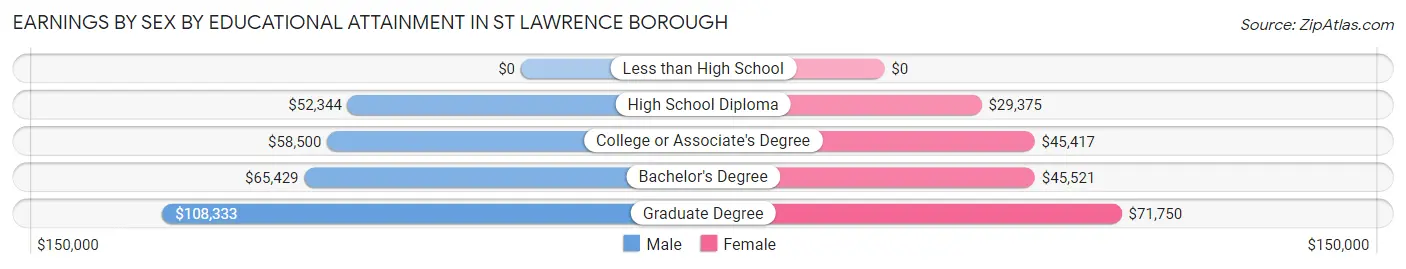
Earnings by Sex by Educational Attainment in St Lawrence borough
Average earnings in St Lawrence borough are $58,281 for men and $40,096 for women, a difference of 31.2%. Men with an educational attainment of graduate degree enjoy the highest average annual earnings of $108,333, while those with high school diploma education earn the least with $52,344. Women with an educational attainment of graduate degree earn the most with the average annual earnings of $71,750, while those with high school diploma education have the smallest earnings of $29,375.
| Educational Attainment | Male Income | Female Income |
| Less than High School | - | - |
| High School Diploma | $52,344 | $29,375 |
| College or Associate's Degree | $58,500 | $45,417 |
| Bachelor's Degree | $65,429 | $45,521 |
| Graduate Degree | $108,333 | $71,750 |
| Total | $58,281 | $40,096 |
Family Income in St Lawrence borough
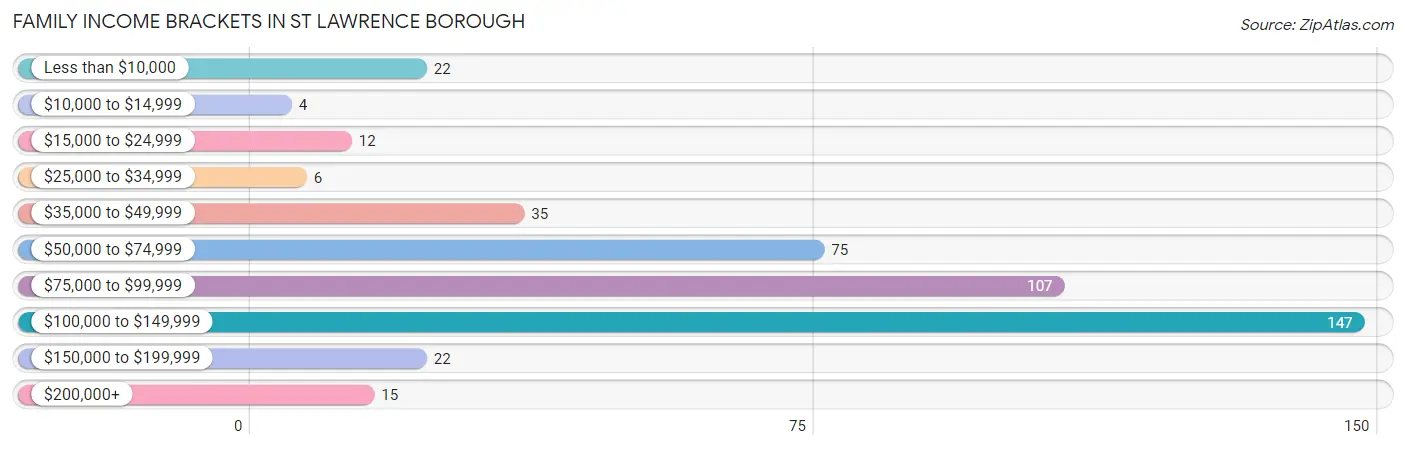
Family Income Brackets in St Lawrence borough
According to the St Lawrence borough family income data, there are 147 families falling into the $100,000 to $149,999 income range, which is the most common income bracket and makes up 33.0% of all families. Conversely, the $10,000 to $14,999 income bracket is the least frequent group with only 4 families (0.9%) belonging to this category.
| Income Bracket | # Families | % Families |
| Less than $10,000 | 22 | 4.9% |
| $10,000 to $14,999 | 4 | 0.9% |
| $15,000 to $24,999 | 12 | 2.7% |
| $25,000 to $34,999 | 6 | 1.3% |
| $35,000 to $49,999 | 35 | 7.9% |
| $50,000 to $74,999 | 75 | 16.9% |
| $75,000 to $99,999 | 107 | 24.0% |
| $100,000 to $149,999 | 147 | 33.0% |
| $150,000 to $199,999 | 22 | 4.9% |
| $200,000+ | 15 | 3.4% |
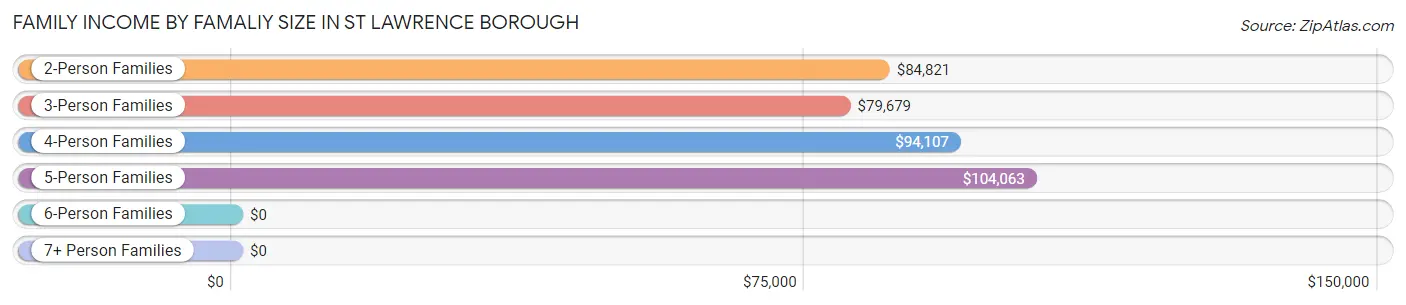
Family Income by Famaliy Size in St Lawrence borough
5-person families (41 | 9.2%) account for the highest median family income in St Lawrence borough with $104,063 per family, while 2-person families (175 | 39.3%) have the highest median income of $42,410 per family member.
| Income Bracket | # Families | Median Income |
| 2-Person Families | 175 (39.3%) | $84,821 |
| 3-Person Families | 127 (28.5%) | $79,679 |
| 4-Person Families | 82 (18.4%) | $94,107 |
| 5-Person Families | 41 (9.2%) | $104,063 |
| 6-Person Families | 15 (3.4%) | $0 |
| 7+ Person Families | 5 (1.1%) | $0 |
| Total | 445 (100.0%) | $89,250 |
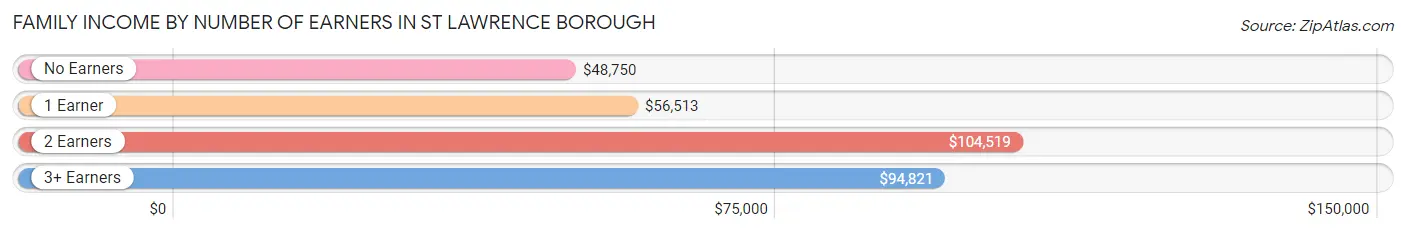
Family Income by Number of Earners in St Lawrence borough
The median family income in St Lawrence borough is $89,250, with families comprising 2 earners (231) having the highest median family income of $104,519, while families with no earners (55) have the lowest median family income of $48,750, accounting for 51.9% and 12.4% of families, respectively.
| Number of Earners | # Families | Median Income |
| No Earners | 55 (12.4%) | $48,750 |
| 1 Earner | 95 (21.3%) | $56,513 |
| 2 Earners | 231 (51.9%) | $104,519 |
| 3+ Earners | 64 (14.4%) | $94,821 |
| Total | 445 (100.0%) | $89,250 |
Household Income in St Lawrence borough
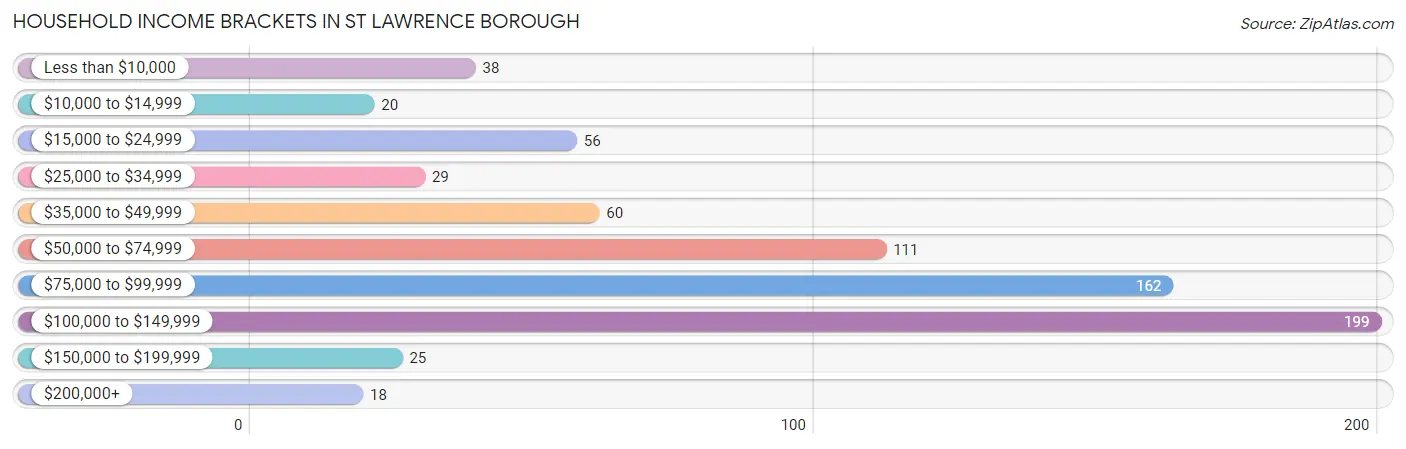
Household Income Brackets in St Lawrence borough
With 199 households falling in the category, the $100,000 to $149,999 income range is the most frequent in St Lawrence borough, accounting for 27.7% of all households. In contrast, only 18 households (2.5%) fall into the $200,000+ income bracket, making it the least populous group.
| Income Bracket | # Households | % Households |
| Less than $10,000 | 38 | 5.3% |
| $10,000 to $14,999 | 20 | 2.8% |
| $15,000 to $24,999 | 56 | 7.8% |
| $25,000 to $34,999 | 29 | 4.0% |
| $35,000 to $49,999 | 60 | 8.4% |
| $50,000 to $74,999 | 111 | 15.5% |
| $75,000 to $99,999 | 162 | 22.6% |
| $100,000 to $149,999 | 199 | 27.7% |
| $150,000 to $199,999 | 25 | 3.5% |
| $200,000+ | 18 | 2.5% |
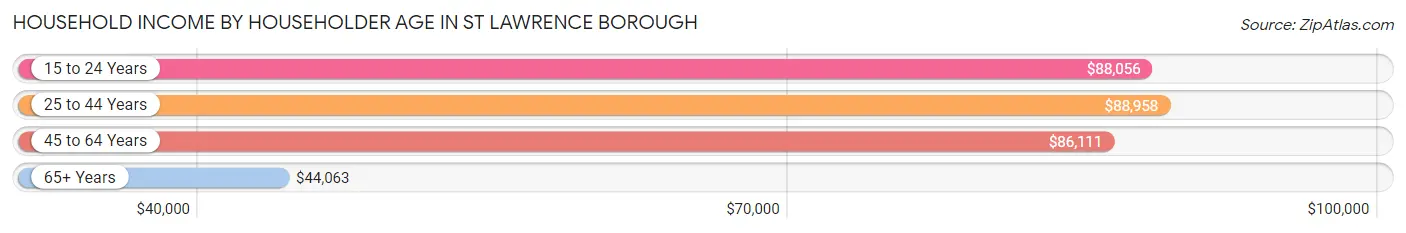
Household Income by Householder Age in St Lawrence borough
The median household income in St Lawrence borough is $78,953, with the highest median household income of $88,958 found in the 25 to 44 years age bracket for the primary householder. A total of 259 households (36.1%) fall into this category. Meanwhile, the 65+ years age bracket for the primary householder has the lowest median household income of $44,063, with 199 households (27.7%) in this group.
| Income Bracket | # Households | Median Income |
| 15 to 24 Years | 14 (1.9%) | $88,056 |
| 25 to 44 Years | 259 (36.1%) | $88,958 |
| 45 to 64 Years | 246 (34.3%) | $86,111 |
| 65+ Years | 199 (27.7%) | $44,063 |
| Total | 718 (100.0%) | $78,953 |
Poverty in St Lawrence borough
Income Below Poverty by Sex and Age in St Lawrence borough
With 9.8% poverty level for males and 13.5% for females among the residents of St Lawrence borough, 12 to 14 year old males and 12 to 14 year old females are the most vulnerable to poverty, with 29 males (49.1%) and 16 females (66.7%) in their respective age groups living below the poverty level.
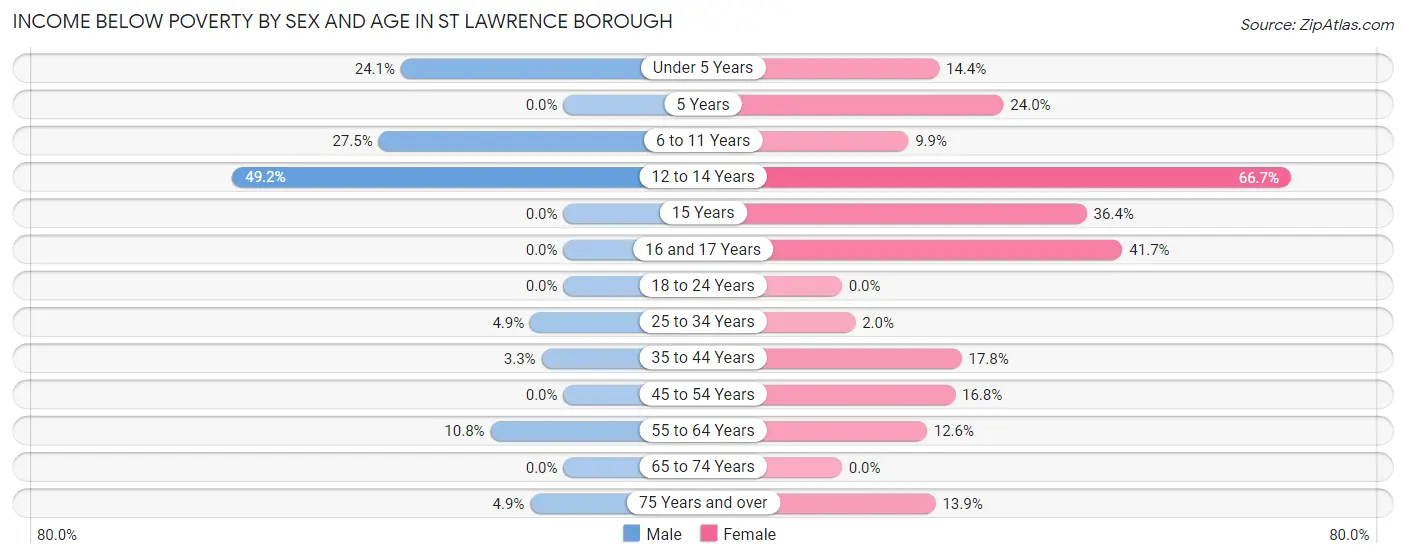
| Age Bracket | Male | Female |
| Under 5 Years | 7 (24.1%) | 13 (14.4%) |
| 5 Years | 0 (0.0%) | 6 (24.0%) |
| 6 to 11 Years | 14 (27.5%) | 7 (9.9%) |
| 12 to 14 Years | 29 (49.1%) | 16 (66.7%) |
| 15 Years | 0 (0.0%) | 4 (36.4%) |
| 16 and 17 Years | 0 (0.0%) | 15 (41.7%) |
| 18 to 24 Years | 0 (0.0%) | 0 (0.0%) |
| 25 to 34 Years | 4 (4.9%) | 3 (2.0%) |
| 35 to 44 Years | 5 (3.3%) | 24 (17.8%) |
| 45 to 54 Years | 0 (0.0%) | 19 (16.8%) |
| 55 to 64 Years | 13 (10.8%) | 13 (12.6%) |
| 65 to 74 Years | 0 (0.0%) | 0 (0.0%) |
| 75 Years and over | 3 (4.9%) | 16 (13.9%) |
| Total | 75 (9.8%) | 136 (13.5%) |
Income Above Poverty by Sex and Age in St Lawrence borough
According to the poverty statistics in St Lawrence borough, males aged 5 years and females aged 18 to 24 years are the age groups that are most secure financially, with 100.0% of males and 100.0% of females in these age groups living above the poverty line.
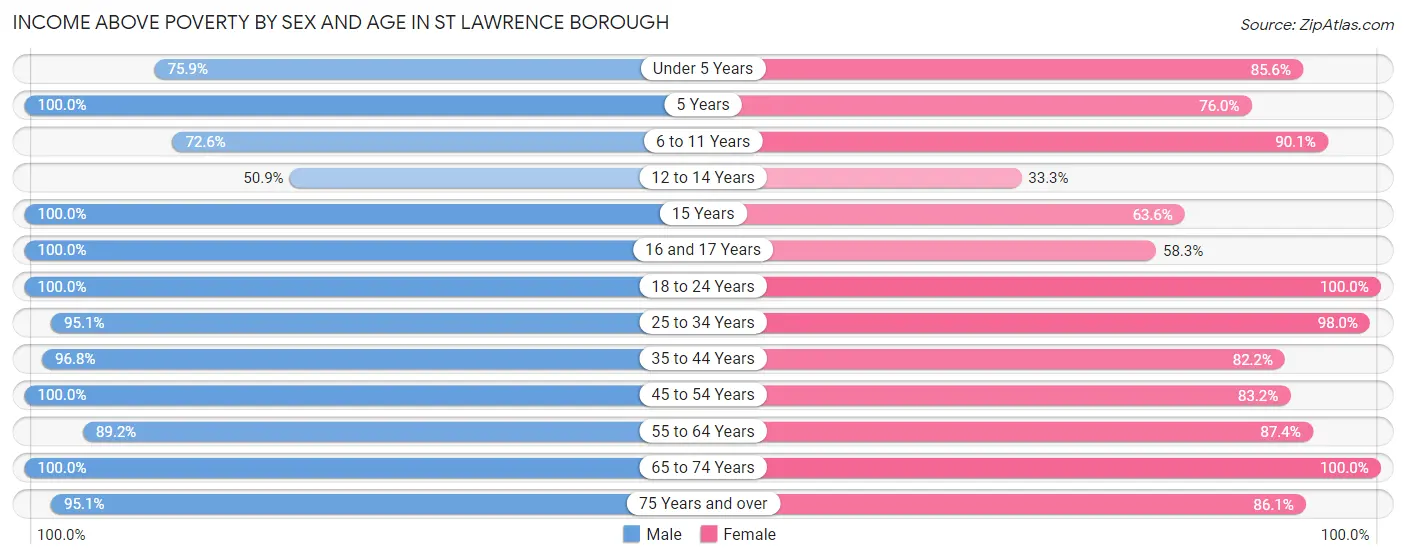
| Age Bracket | Male | Female |
| Under 5 Years | 22 (75.9%) | 77 (85.6%) |
| 5 Years | 11 (100.0%) | 19 (76.0%) |
| 6 to 11 Years | 37 (72.6%) | 64 (90.1%) |
| 12 to 14 Years | 30 (50.8%) | 8 (33.3%) |
| 15 Years | 14 (100.0%) | 7 (63.6%) |
| 16 and 17 Years | 21 (100.0%) | 21 (58.3%) |
| 18 to 24 Years | 26 (100.0%) | 68 (100.0%) |
| 25 to 34 Years | 77 (95.1%) | 148 (98.0%) |
| 35 to 44 Years | 149 (96.8%) | 111 (82.2%) |
| 45 to 54 Years | 88 (100.0%) | 94 (83.2%) |
| 55 to 64 Years | 107 (89.2%) | 90 (87.4%) |
| 65 to 74 Years | 50 (100.0%) | 66 (100.0%) |
| 75 Years and over | 58 (95.1%) | 99 (86.1%) |
| Total | 690 (90.2%) | 872 (86.5%) |
Income Below Poverty Among Married-Couple Families in St Lawrence borough
The poverty statistics for married-couple families in St Lawrence borough show that 2.4% or 8 of the total 338 families live below the poverty line. Families with 3 or 4 children have the highest poverty rate of 9.4%, comprising of 3 families. On the other hand, families with 1 or 2 children have the lowest poverty rate of 0.0%, which includes 0 families.
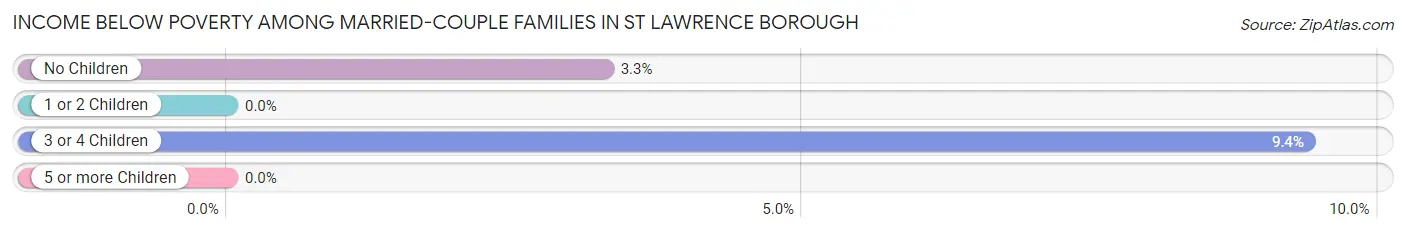
| Children | Above Poverty | Below Poverty |
| No Children | 148 (96.7%) | 5 (3.3%) |
| 1 or 2 Children | 153 (100.0%) | 0 (0.0%) |
| 3 or 4 Children | 29 (90.6%) | 3 (9.4%) |
| 5 or more Children | 0 (0.0%) | 0 (0.0%) |
| Total | 330 (97.6%) | 8 (2.4%) |
Income Below Poverty Among Single-Parent Households in St Lawrence borough
According to the poverty data in St Lawrence borough, 10.5% or 4 single-father households and 39.1% or 27 single-mother households are living below the poverty line. Among single-father households, those with 3 or 4 children have the highest poverty rate, with 4 households (100.0%) experiencing poverty. Likewise, among single-mother households, those with 3 or 4 children have the highest poverty rate, with 8 households (100.0%) falling below the poverty line.
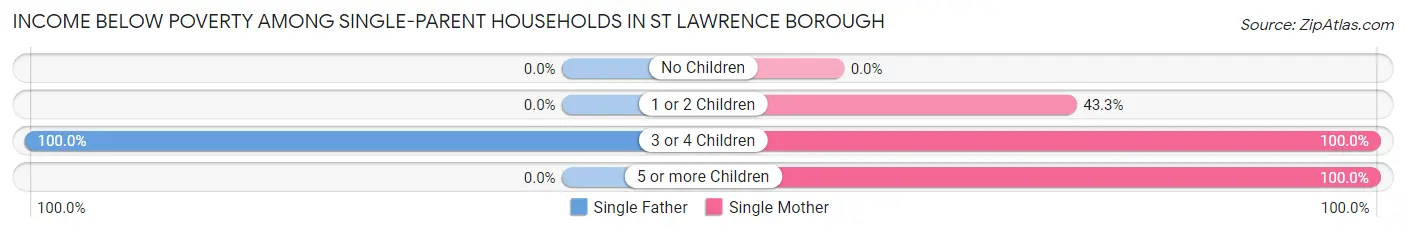
| Children | Single Father | Single Mother |
| No Children | 0 (0.0%) | 0 (0.0%) |
| 1 or 2 Children | 0 (0.0%) | 13 (43.3%) |
| 3 or 4 Children | 4 (100.0%) | 8 (100.0%) |
| 5 or more Children | 0 (0.0%) | 6 (100.0%) |
| Total | 4 (10.5%) | 27 (39.1%) |
Income Below Poverty Among Married-Couple vs Single-Parent Households in St Lawrence borough
The poverty data for St Lawrence borough shows that 8 of the married-couple family households (2.4%) and 31 of the single-parent households (29.0%) are living below the poverty level. Within the married-couple family households, those with 3 or 4 children have the highest poverty rate, with 3 households (9.4%) falling below the poverty line. Among the single-parent households, those with 3 or 4 children have the highest poverty rate, with 12 household (100.0%) living below poverty.
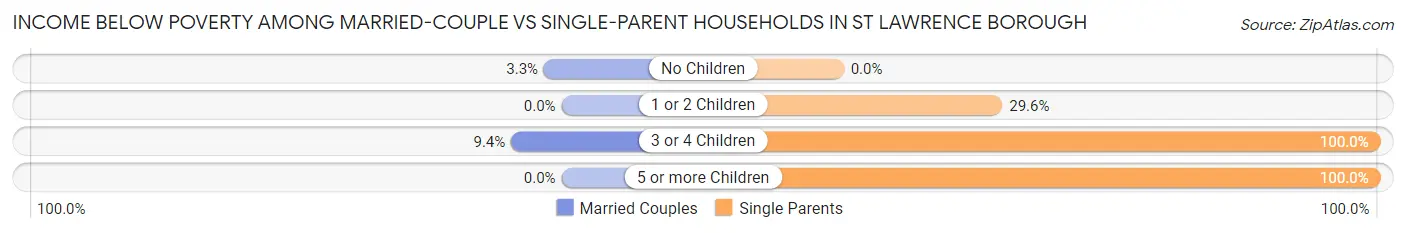
| Children | Married-Couple Families | Single-Parent Households |
| No Children | 5 (3.3%) | 0 (0.0%) |
| 1 or 2 Children | 0 (0.0%) | 13 (29.5%) |
| 3 or 4 Children | 3 (9.4%) | 12 (100.0%) |
| 5 or more Children | 0 (0.0%) | 6 (100.0%) |
| Total | 8 (2.4%) | 31 (29.0%) |
Race in St Lawrence borough
The most populous races in St Lawrence borough are White / Caucasian (1,569 | 88.1%), Hispanic or Latino (139 | 7.8%), and Two or more Races (119 | 6.7%).
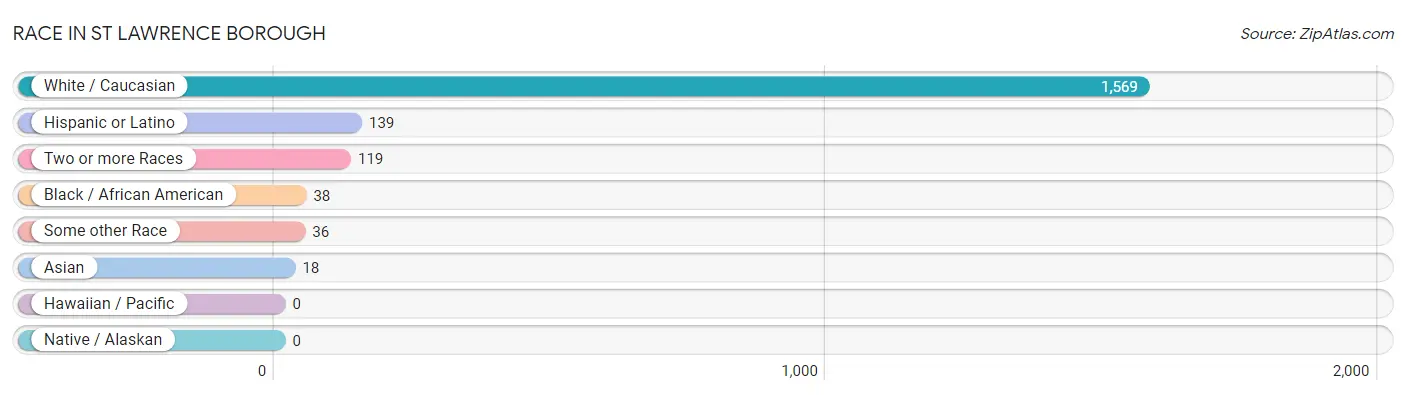
| Race | # Population | % Population |
| Asian | 18 | 1.0% |
| Black / African American | 38 | 2.1% |
| Hawaiian / Pacific | 0 | 0.0% |
| Hispanic or Latino | 139 | 7.8% |
| Native / Alaskan | 0 | 0.0% |
| White / Caucasian | 1,569 | 88.1% |
| Two or more Races | 119 | 6.7% |
| Some other Race | 36 | 2.0% |
| Total | 1,780 | 100.0% |
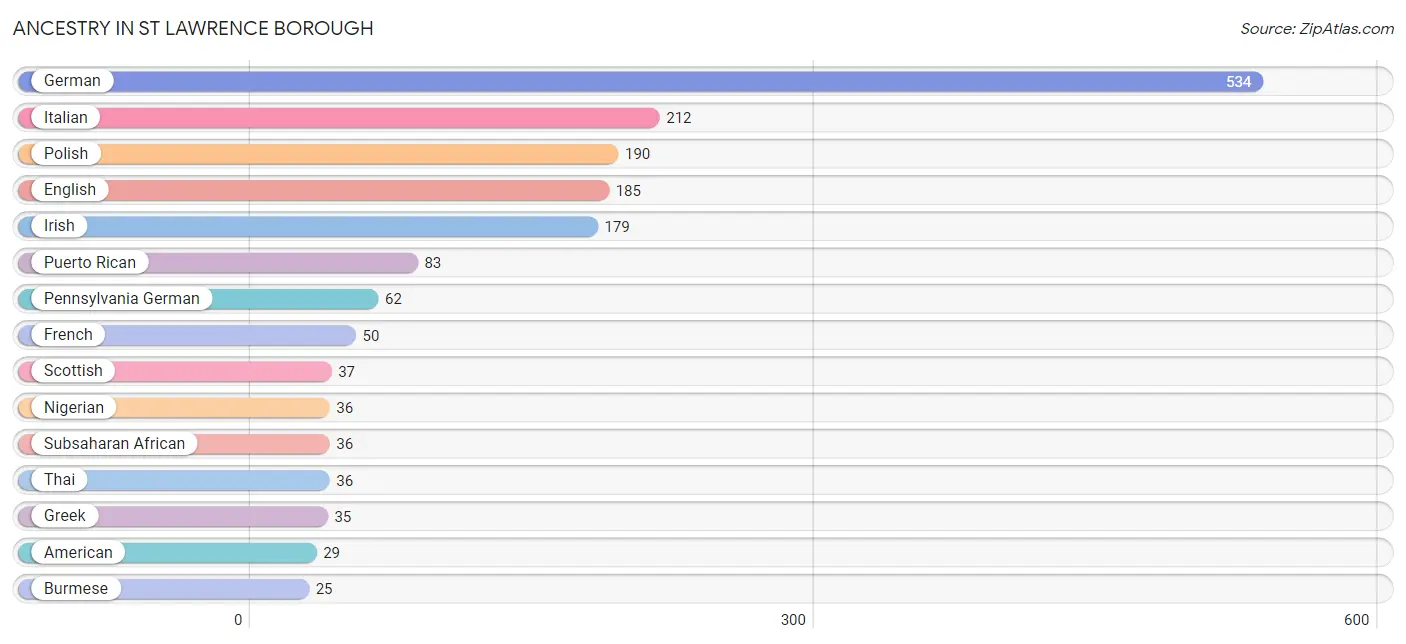
Ancestry in St Lawrence borough
The most populous ancestries reported in St Lawrence borough are German (534 | 30.0%), Italian (212 | 11.9%), Polish (190 | 10.7%), English (185 | 10.4%), and Irish (179 | 10.1%), together accounting for 73.0% of all St Lawrence borough residents.
| Ancestry | # Population | % Population |
| American | 29 | 1.6% |
| Austrian | 4 | 0.2% |
| Burmese | 25 | 1.4% |
| Central American | 9 | 0.5% |
| Colombian | 10 | 0.6% |
| Cuban | 7 | 0.4% |
| Czech | 2 | 0.1% |
| Dominican | 18 | 1.0% |
| Dutch | 22 | 1.2% |
| Eastern European | 8 | 0.4% |
| English | 185 | 10.4% |
| European | 4 | 0.2% |
| Finnish | 2 | 0.1% |
| French | 50 | 2.8% |
| German | 534 | 30.0% |
| Greek | 35 | 2.0% |
| Haitian | 3 | 0.2% |
| Hungarian | 2 | 0.1% |
| Irish | 179 | 10.1% |
| Italian | 212 | 11.9% |
| Jamaican | 25 | 1.4% |
| Korean | 1 | 0.1% |
| Lithuanian | 5 | 0.3% |
| Malaysian | 9 | 0.5% |
| Mexican | 8 | 0.4% |
| Nigerian | 36 | 2.0% |
| Pakistani | 9 | 0.5% |
| Pennsylvania German | 62 | 3.5% |
| Polish | 190 | 10.7% |
| Puerto Rican | 83 | 4.7% |
| Romanian | 3 | 0.2% |
| Russian | 21 | 1.2% |
| Salvadoran | 9 | 0.5% |
| Scotch-Irish | 4 | 0.2% |
| Scottish | 37 | 2.1% |
| Slavic | 3 | 0.2% |
| Slovak | 12 | 0.7% |
| South American | 10 | 0.6% |
| Subsaharan African | 36 | 2.0% |
| Swedish | 5 | 0.3% |
| Thai | 36 | 2.0% |
| Welsh | 17 | 1.0% | View All 42 Rows |
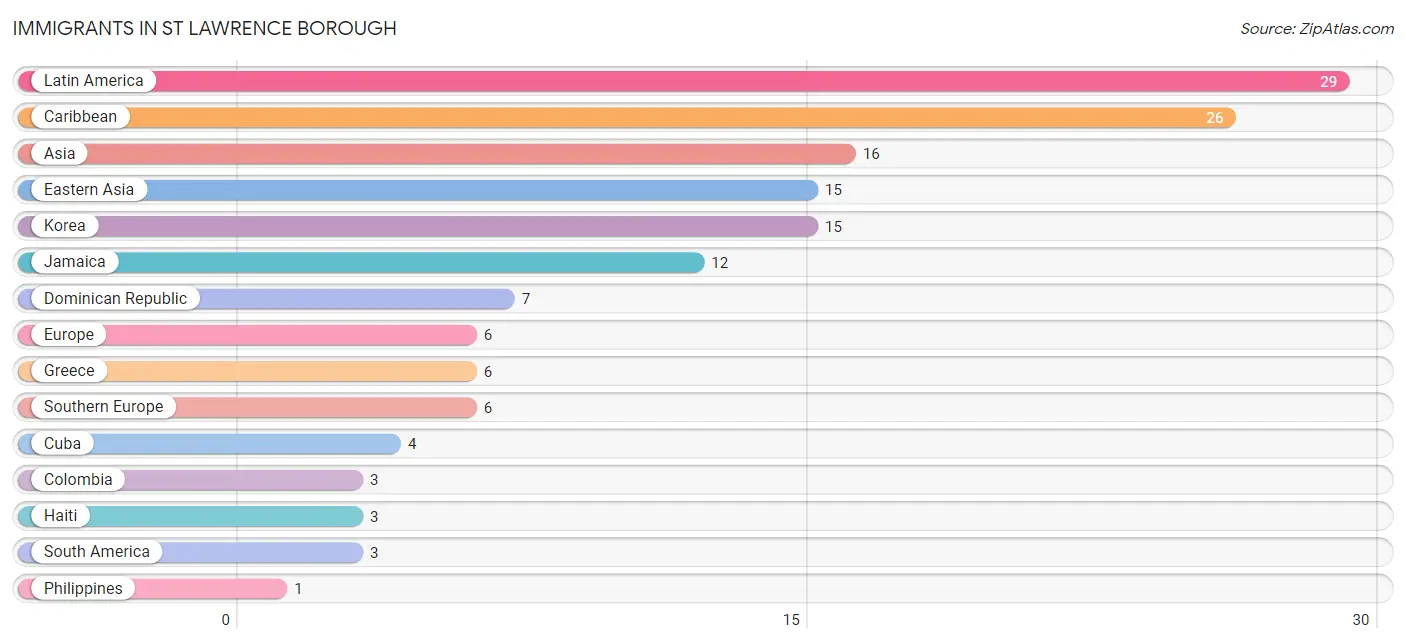
Immigrants in St Lawrence borough
The most numerous immigrant groups reported in St Lawrence borough came from Latin America (29 | 1.6%), Caribbean (26 | 1.5%), Asia (16 | 0.9%), Eastern Asia (15 | 0.8%), and Korea (15 | 0.8%), together accounting for 5.7% of all St Lawrence borough residents.
| Immigration Origin | # Population | % Population |
| Asia | 16 | 0.9% |
| Caribbean | 26 | 1.5% |
| Colombia | 3 | 0.2% |
| Cuba | 4 | 0.2% |
| Dominican Republic | 7 | 0.4% |
| Eastern Asia | 15 | 0.8% |
| Europe | 6 | 0.3% |
| Greece | 6 | 0.3% |
| Haiti | 3 | 0.2% |
| Jamaica | 12 | 0.7% |
| Korea | 15 | 0.8% |
| Latin America | 29 | 1.6% |
| Philippines | 1 | 0.1% |
| South America | 3 | 0.2% |
| South Eastern Asia | 1 | 0.1% |
| Southern Europe | 6 | 0.3% | View All 16 Rows |
Sex and Age in St Lawrence borough
Sex and Age in St Lawrence borough
The most populous age groups in St Lawrence borough are 35 to 39 Years (91 | 11.8%) for men and 30 to 34 Years (104 | 10.3%) for women.
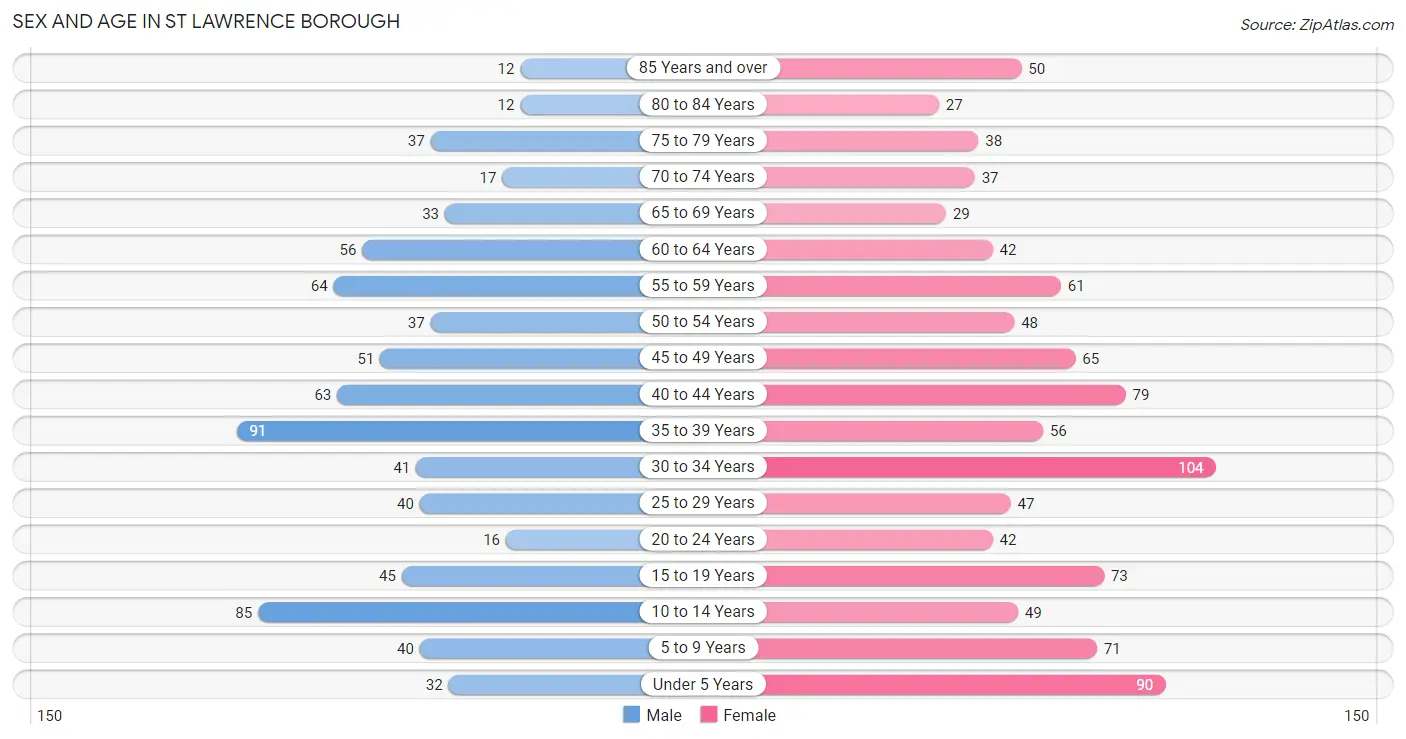
| Age Bracket | Male | Female |
| Under 5 Years | 32 (4.2%) | 90 (8.9%) |
| 5 to 9 Years | 40 (5.2%) | 71 (7.0%) |
| 10 to 14 Years | 85 (11.0%) | 49 (4.9%) |
| 15 to 19 Years | 45 (5.8%) | 73 (7.2%) |
| 20 to 24 Years | 16 (2.1%) | 42 (4.2%) |
| 25 to 29 Years | 40 (5.2%) | 47 (4.7%) |
| 30 to 34 Years | 41 (5.3%) | 104 (10.3%) |
| 35 to 39 Years | 91 (11.8%) | 56 (5.6%) |
| 40 to 44 Years | 63 (8.2%) | 79 (7.8%) |
| 45 to 49 Years | 51 (6.6%) | 65 (6.5%) |
| 50 to 54 Years | 37 (4.8%) | 48 (4.8%) |
| 55 to 59 Years | 64 (8.3%) | 61 (6.0%) |
| 60 to 64 Years | 56 (7.2%) | 42 (4.2%) |
| 65 to 69 Years | 33 (4.3%) | 29 (2.9%) |
| 70 to 74 Years | 17 (2.2%) | 37 (3.7%) |
| 75 to 79 Years | 37 (4.8%) | 38 (3.8%) |
| 80 to 84 Years | 12 (1.5%) | 27 (2.7%) |
| 85 Years and over | 12 (1.5%) | 50 (5.0%) |
| Total | 772 (100.0%) | 1,008 (100.0%) |
Families and Households in St Lawrence borough
Median Family Size in St Lawrence borough
The median family size in St Lawrence borough is 3.19 persons per family, with married-couple families (338 | 76.0%) accounting for the largest median family size of 3.29 persons per family. On the other hand, single male/father families (38 | 8.5%) represent the smallest median family size with 2.53 persons per family.
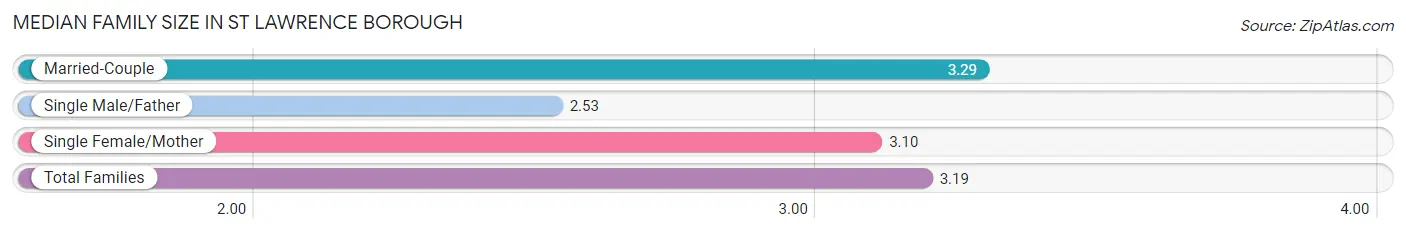
| Family Type | # Families | Family Size |
| Married-Couple | 338 (76.0%) | 3.29 |
| Single Male/Father | 38 (8.5%) | 2.53 |
| Single Female/Mother | 69 (15.5%) | 3.10 |
| Total Families | 445 (100.0%) | 3.19 |
Median Household Size in St Lawrence borough
The median household size in St Lawrence borough is 2.48 persons per household, with single female/mother households (69 | 9.6%) accounting for the largest median household size of 3.38 persons per household. non-family households (273 | 38.0%) represent the smallest median household size with 1.21 persons per household.
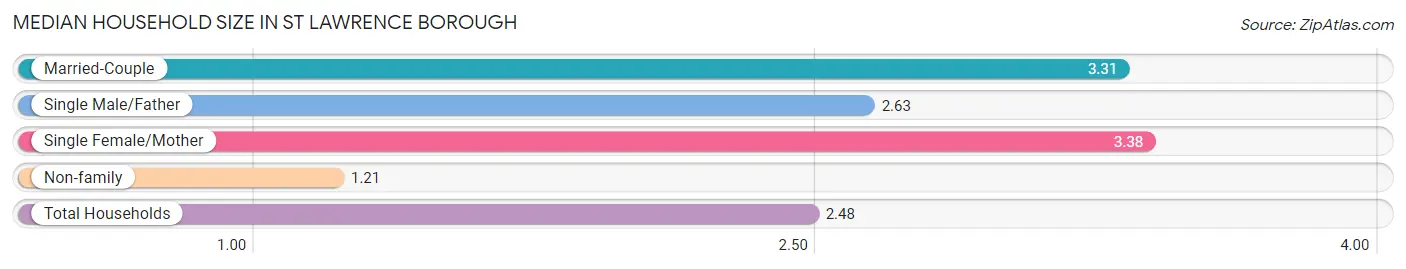
| Household Type | # Households | Household Size |
| Married-Couple | 338 (47.1%) | 3.31 |
| Single Male/Father | 38 (5.3%) | 2.63 |
| Single Female/Mother | 69 (9.6%) | 3.38 |
| Non-family | 273 (38.0%) | 1.21 |
| Total Households | 718 (100.0%) | 2.48 |
Household Size by Marriage Status in St Lawrence borough
Out of a total of 718 households in St Lawrence borough, 445 (62.0%) are family households, while 273 (38.0%) are nonfamily households. The most numerous type of family households are 2-person households, comprising 175, and the most common type of nonfamily households are 1-person households, comprising 215.
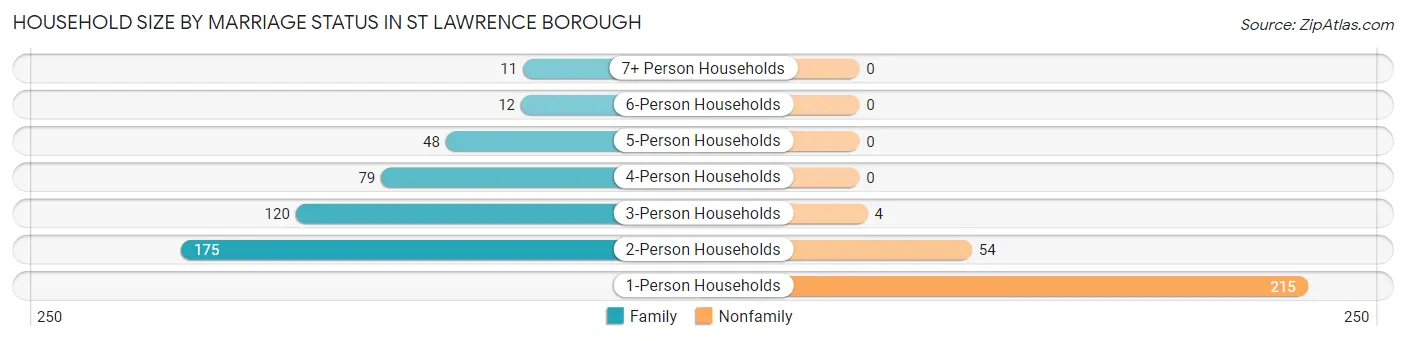
| Household Size | Family Households | Nonfamily Households |
| 1-Person Households | - | 215 (29.9%) |
| 2-Person Households | 175 (24.4%) | 54 (7.5%) |
| 3-Person Households | 120 (16.7%) | 4 (0.6%) |
| 4-Person Households | 79 (11.0%) | 0 (0.0%) |
| 5-Person Households | 48 (6.7%) | 0 (0.0%) |
| 6-Person Households | 12 (1.7%) | 0 (0.0%) |
| 7+ Person Households | 11 (1.5%) | 0 (0.0%) |
| Total | 445 (62.0%) | 273 (38.0%) |
Female Fertility in St Lawrence borough
Fertility by Age in St Lawrence borough
Average fertility rate in St Lawrence borough is 31.0 births per 1,000 women. Women in the age bracket of 35 to 50 years have the highest fertility rate with 56.0 births per 1,000 women. Women in the age bracket of 35 to 50 years acount for 80.0% of all women with births.
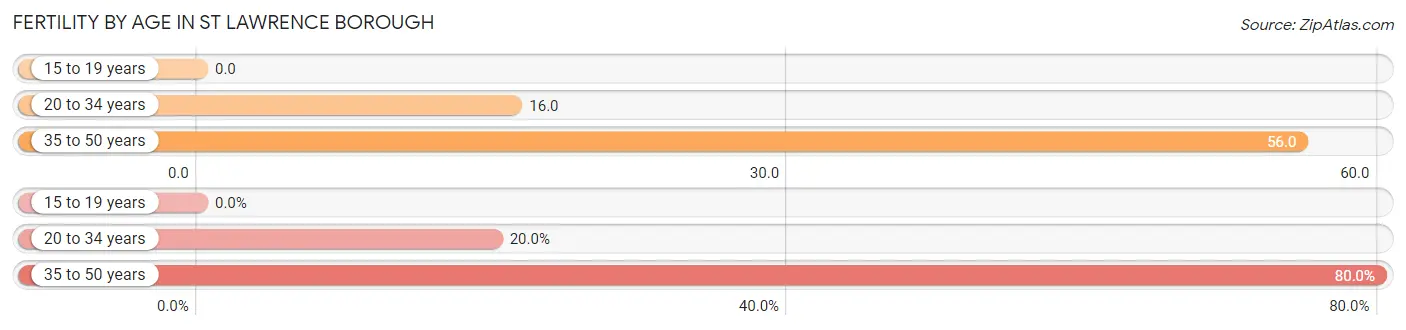
| Age Bracket | Women with Births | Births / 1,000 Women |
| 15 to 19 years | 0 (0.0%) | 0.0 |
| 20 to 34 years | 3 (20.0%) | 16.0 |
| 35 to 50 years | 12 (80.0%) | 56.0 |
| Total | 15 (100.0%) | 31.0 |
Fertility by Age by Marriage Status in St Lawrence borough
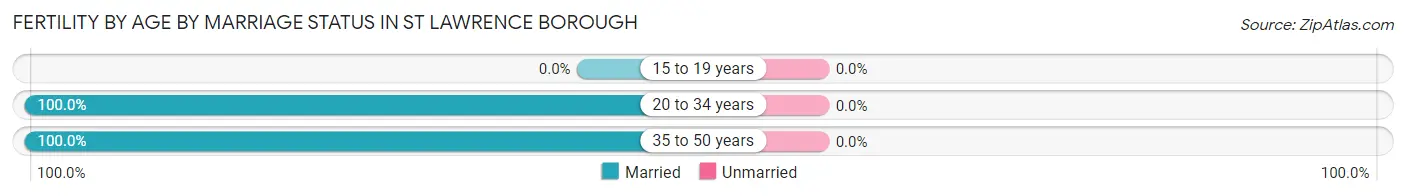
| Age Bracket | Married | Unmarried |
| 15 to 19 years | 0 (0.0%) | 0 (0.0%) |
| 20 to 34 years | 3 (100.0%) | 0 (0.0%) |
| 35 to 50 years | 12 (100.0%) | 0 (0.0%) |
| Total | 15 (100.0%) | 0 (0.0%) |
Fertility by Education in St Lawrence borough
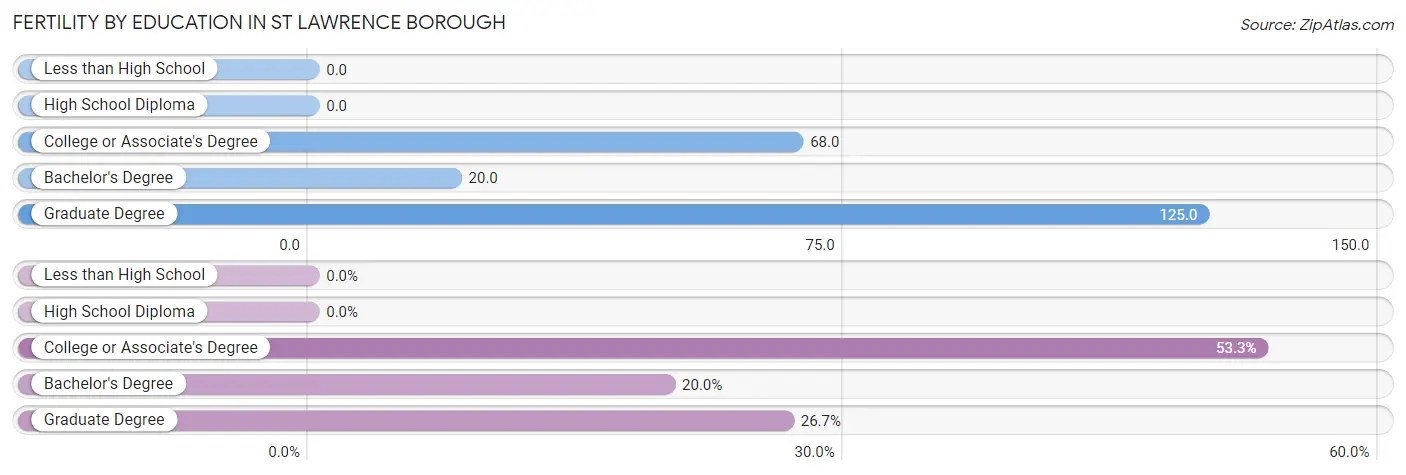
| Educational Attainment | Women with Births | Births / 1,000 Women |
| Less than High School | 0 (0.0%) | 0.0 |
| High School Diploma | 0 (0.0%) | 0.0 |
| College or Associate's Degree | 8 (53.3%) | 68.0 |
| Bachelor's Degree | 3 (20.0%) | 20.0 |
| Graduate Degree | 4 (26.7%) | 125.0 |
| Total | 15 (100.0%) | 31.0 |
Fertility by Education by Marriage Status in St Lawrence borough
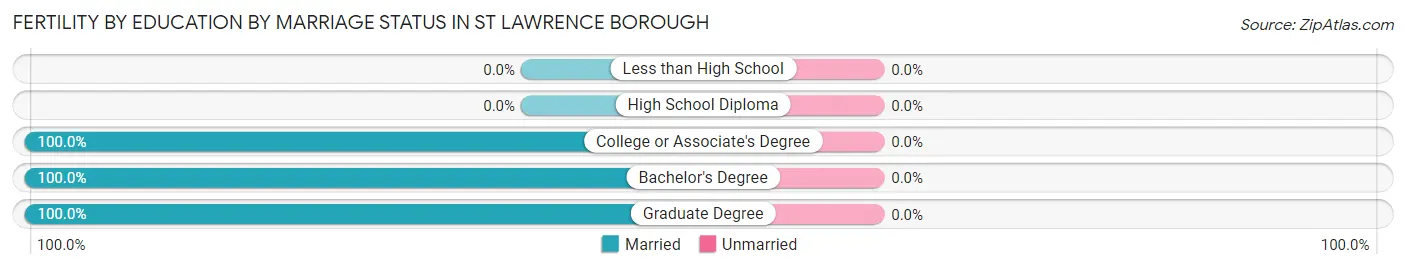
| Educational Attainment | Married | Unmarried |
| Less than High School | 0 (0.0%) | 0 (0.0%) |
| High School Diploma | 0 (0.0%) | 0 (0.0%) |
| College or Associate's Degree | 8 (100.0%) | 0 (0.0%) |
| Bachelor's Degree | 3 (100.0%) | 0 (0.0%) |
| Graduate Degree | 4 (100.0%) | 0 (0.0%) |
| Total | 15 (100.0%) | 0 (0.0%) |
Employment Characteristics in St Lawrence borough
Employment by Class of Employer in St Lawrence borough
Among the 869 employed individuals in St Lawrence borough, private company employees (589 | 67.8%), local government employees (91 | 10.5%), and not-for-profit organizations (73 | 8.4%) make up the most common classes of employment.
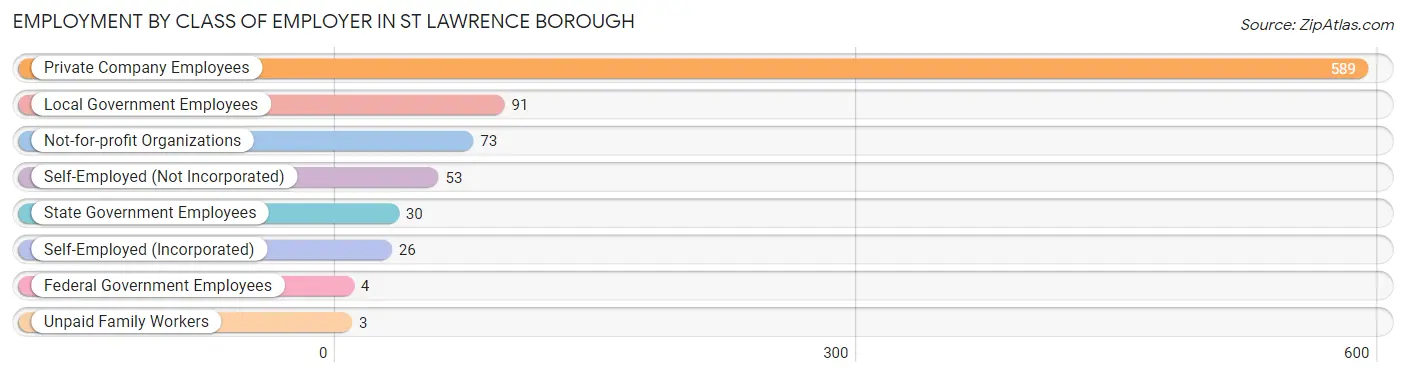
| Employer Class | # Employees | % Employees |
| Private Company Employees | 589 | 67.8% |
| Self-Employed (Incorporated) | 26 | 3.0% |
| Self-Employed (Not Incorporated) | 53 | 6.1% |
| Not-for-profit Organizations | 73 | 8.4% |
| Local Government Employees | 91 | 10.5% |
| State Government Employees | 30 | 3.5% |
| Federal Government Employees | 4 | 0.5% |
| Unpaid Family Workers | 3 | 0.4% |
| Total | 869 | 100.0% |
Employment Status by Age in St Lawrence borough
According to the labor force statistics for St Lawrence borough, out of the total population over 16 years of age (1,388), 66.2% or 919 individuals are in the labor force, with 4.7% or 43 of them unemployed. The age group with the highest labor force participation rate is 35 to 44 years, with 90.0% or 260 individuals in the labor force. Within the labor force, the 60 to 64 years age range has the highest percentage of unemployed individuals, with 12.3% or 9 of them being unemployed.
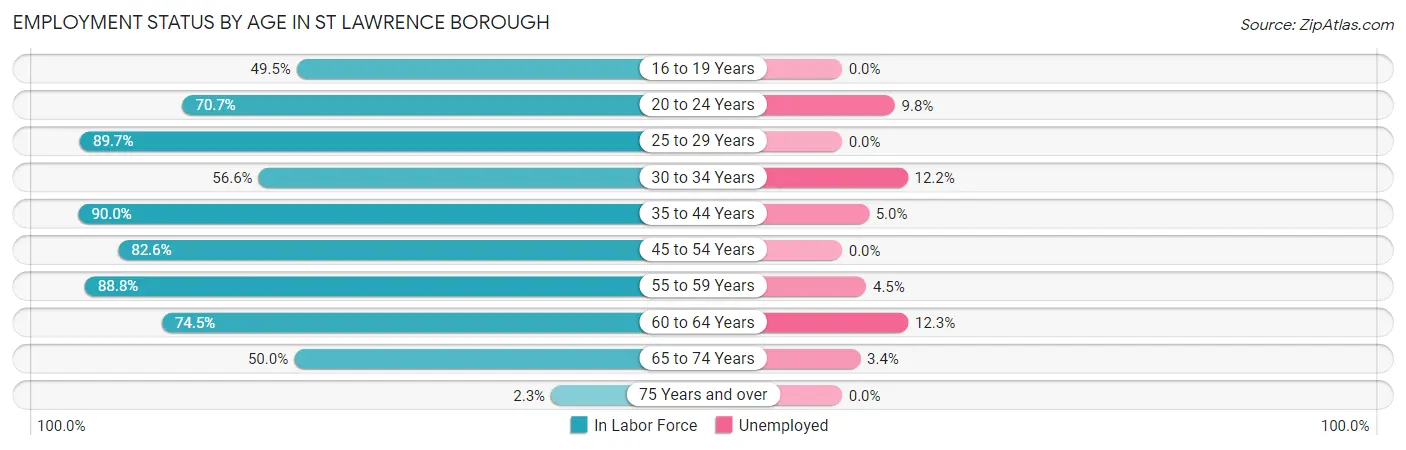
| Age Bracket | In Labor Force | Unemployed |
| 16 to 19 Years | 46 (49.5%) | 0 (0.0%) |
| 20 to 24 Years | 41 (70.7%) | 4 (9.8%) |
| 25 to 29 Years | 78 (89.7%) | 0 (0.0%) |
| 30 to 34 Years | 82 (56.6%) | 10 (12.2%) |
| 35 to 44 Years | 260 (90.0%) | 13 (5.0%) |
| 45 to 54 Years | 166 (82.6%) | 0 (0.0%) |
| 55 to 59 Years | 111 (88.8%) | 5 (4.5%) |
| 60 to 64 Years | 73 (74.5%) | 9 (12.3%) |
| 65 to 74 Years | 58 (50.0%) | 2 (3.4%) |
| 75 Years and over | 4 (2.3%) | 0 (0.0%) |
| Total | 919 (66.2%) | 43 (4.7%) |
Employment Status by Educational Attainment in St Lawrence borough
According to labor force statistics for St Lawrence borough, 81.5% of individuals (770) out of the total population between 25 and 64 years of age (945) are in the labor force, with 4.8% or 37 of them being unemployed. The group with the highest labor force participation rate are those with the educational attainment of college / associate degree, with 87.6% or 234 individuals in the labor force. Within the labor force, individuals with high school diploma education have the highest percentage of unemployment, with 7.7% or 17 of them being unemployed.
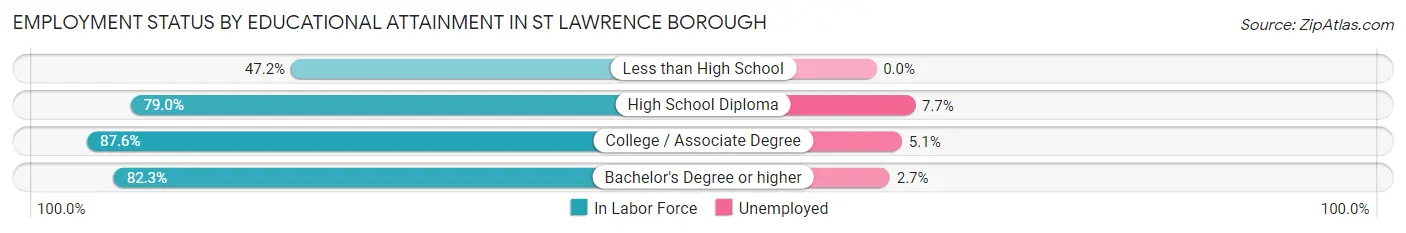
| Educational Attainment | In Labor Force | Unemployed |
| Less than High School | 17 (47.2%) | 0 (0.0%) |
| High School Diploma | 222 (79.0%) | 22 (7.7%) |
| College / Associate Degree | 234 (87.6%) | 14 (5.1%) |
| Bachelor's Degree or higher | 297 (82.3%) | 10 (2.7%) |
| Total | 770 (81.5%) | 45 (4.8%) |
Employment Occupations by Sex in St Lawrence borough
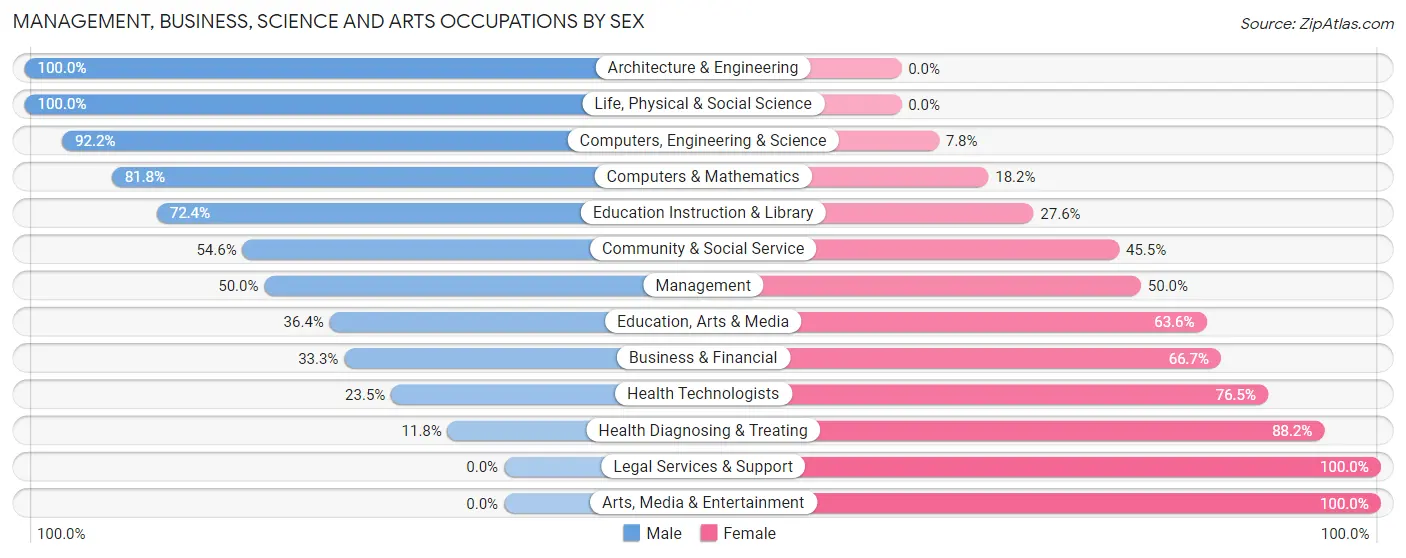
Management, Business, Science and Arts Occupations
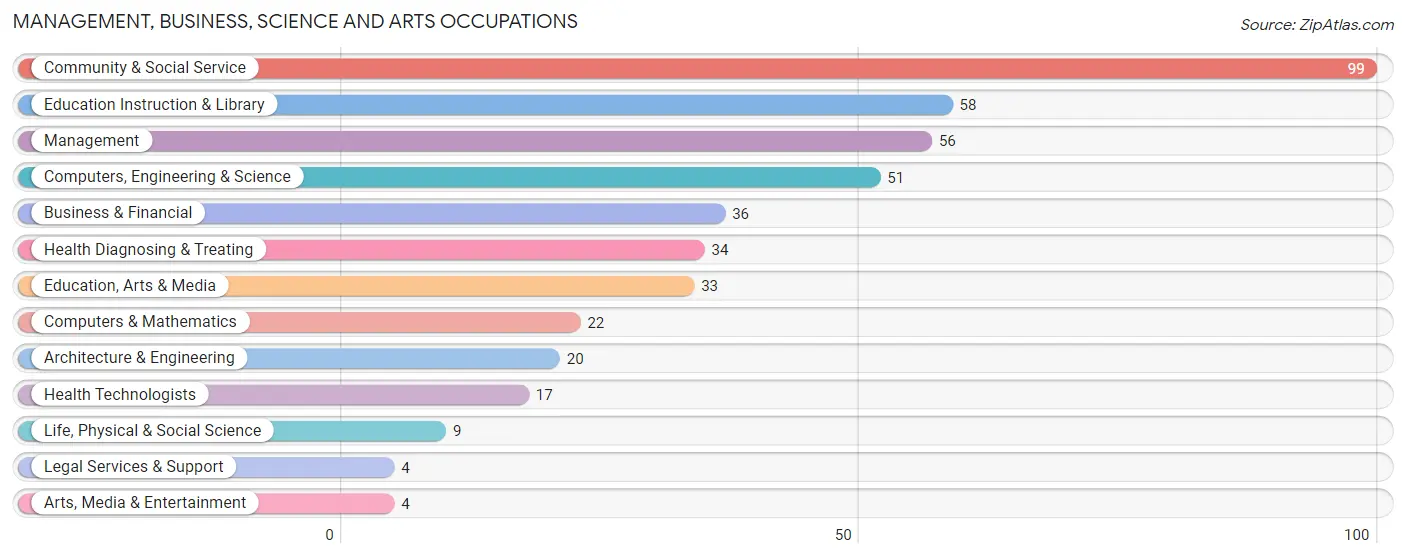
The most common Management, Business, Science and Arts occupations in St Lawrence borough are Community & Social Service (99 | 11.3%), Education Instruction & Library (58 | 6.6%), Management (56 | 6.4%), Computers, Engineering & Science (51 | 5.8%), and Business & Financial (36 | 4.1%).
Management, Business, Science and Arts Occupations by Sex
Within the Management, Business, Science and Arts occupations in St Lawrence borough, the most male-oriented occupations are Architecture & Engineering (100.0%), Life, Physical & Social Science (100.0%), and Computers, Engineering & Science (92.2%), while the most female-oriented occupations are Legal Services & Support (100.0%), Arts, Media & Entertainment (100.0%), and Health Diagnosing & Treating (88.2%).
| Occupation | Male | Female |
| Management | 28 (50.0%) | 28 (50.0%) |
| Business & Financial | 12 (33.3%) | 24 (66.7%) |
| Computers, Engineering & Science | 47 (92.2%) | 4 (7.8%) |
| Computers & Mathematics | 18 (81.8%) | 4 (18.2%) |
| Architecture & Engineering | 20 (100.0%) | 0 (0.0%) |
| Life, Physical & Social Science | 9 (100.0%) | 0 (0.0%) |
| Community & Social Service | 54 (54.5%) | 45 (45.5%) |
| Education, Arts & Media | 12 (36.4%) | 21 (63.6%) |
| Legal Services & Support | 0 (0.0%) | 4 (100.0%) |
| Education Instruction & Library | 42 (72.4%) | 16 (27.6%) |
| Arts, Media & Entertainment | 0 (0.0%) | 4 (100.0%) |
| Health Diagnosing & Treating | 4 (11.8%) | 30 (88.2%) |
| Health Technologists | 4 (23.5%) | 13 (76.5%) |
| Total (Category) | 145 (52.5%) | 131 (47.5%) |
| Total (Overall) | 433 (49.4%) | 443 (50.6%) |
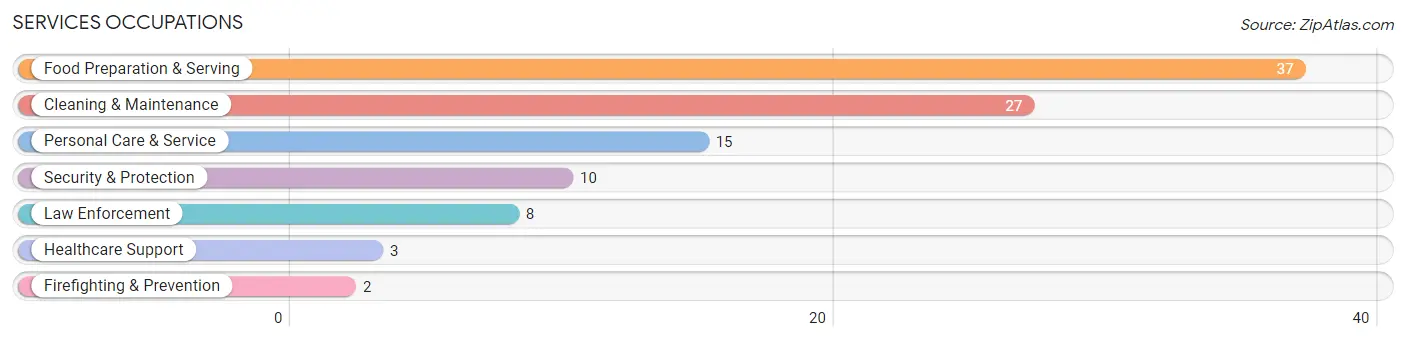
Services Occupations
The most common Services occupations in St Lawrence borough are Food Preparation & Serving (37 | 4.2%), Cleaning & Maintenance (27 | 3.1%), Personal Care & Service (15 | 1.7%), Security & Protection (10 | 1.1%), and Law Enforcement (8 | 0.9%).
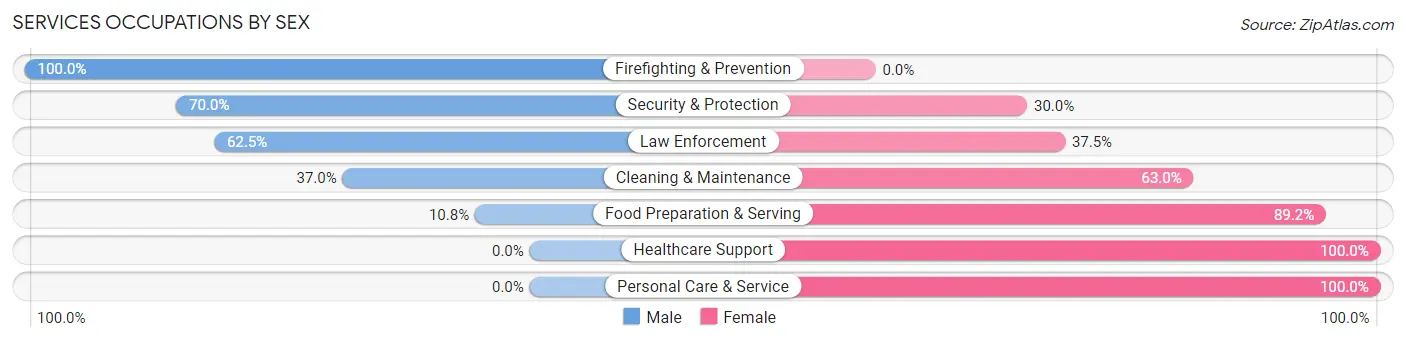
Services Occupations by Sex
Within the Services occupations in St Lawrence borough, the most male-oriented occupations are Firefighting & Prevention (100.0%), Security & Protection (70.0%), and Law Enforcement (62.5%), while the most female-oriented occupations are Healthcare Support (100.0%), Personal Care & Service (100.0%), and Food Preparation & Serving (89.2%).
| Occupation | Male | Female |
| Healthcare Support | 0 (0.0%) | 3 (100.0%) |
| Security & Protection | 7 (70.0%) | 3 (30.0%) |
| Firefighting & Prevention | 2 (100.0%) | 0 (0.0%) |
| Law Enforcement | 5 (62.5%) | 3 (37.5%) |
| Food Preparation & Serving | 4 (10.8%) | 33 (89.2%) |
| Cleaning & Maintenance | 10 (37.0%) | 17 (63.0%) |
| Personal Care & Service | 0 (0.0%) | 15 (100.0%) |
| Total (Category) | 21 (22.8%) | 71 (77.2%) |
| Total (Overall) | 433 (49.4%) | 443 (50.6%) |
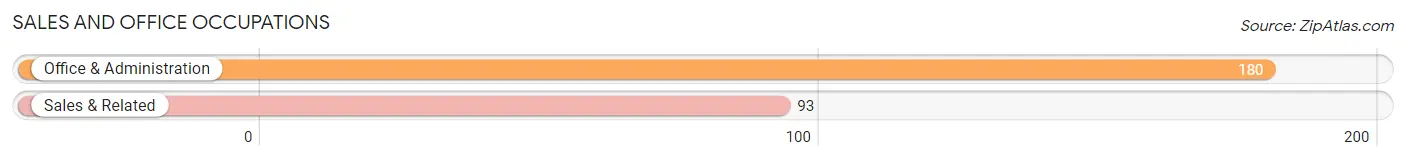
Sales and Office Occupations
The most common Sales and Office occupations in St Lawrence borough are Office & Administration (180 | 20.5%), and Sales & Related (93 | 10.6%).
Sales and Office Occupations by Sex
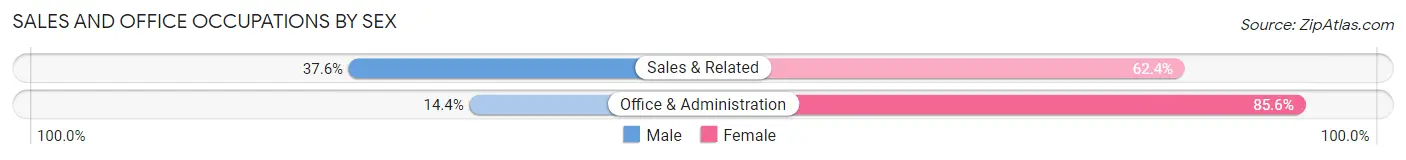
| Occupation | Male | Female |
| Sales & Related | 35 (37.6%) | 58 (62.4%) |
| Office & Administration | 26 (14.4%) | 154 (85.6%) |
| Total (Category) | 61 (22.3%) | 212 (77.7%) |
| Total (Overall) | 433 (49.4%) | 443 (50.6%) |
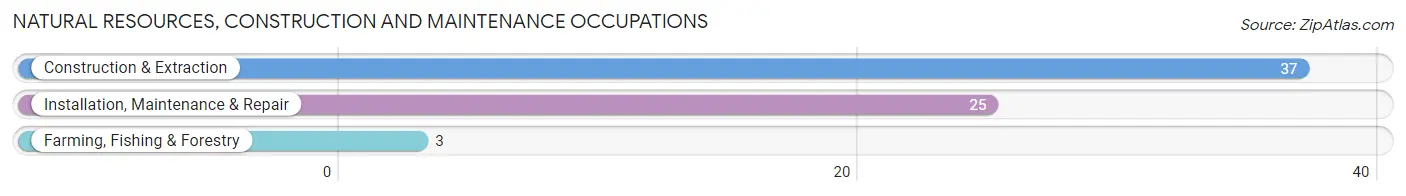
Natural Resources, Construction and Maintenance Occupations
The most common Natural Resources, Construction and Maintenance occupations in St Lawrence borough are Construction & Extraction (37 | 4.2%), Installation, Maintenance & Repair (25 | 2.9%), and Farming, Fishing & Forestry (3 | 0.3%).
Natural Resources, Construction and Maintenance Occupations by Sex
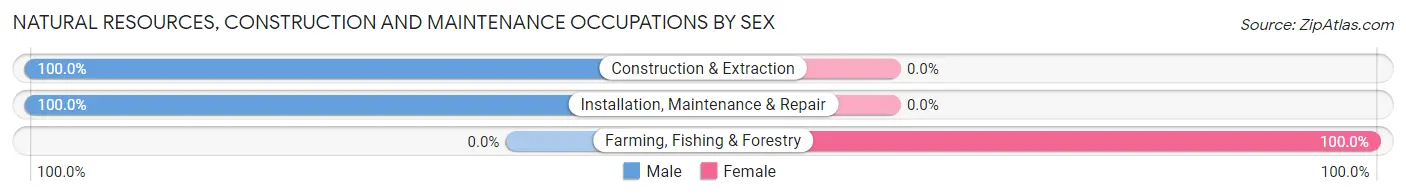
| Occupation | Male | Female |
| Farming, Fishing & Forestry | 0 (0.0%) | 3 (100.0%) |
| Construction & Extraction | 37 (100.0%) | 0 (0.0%) |
| Installation, Maintenance & Repair | 25 (100.0%) | 0 (0.0%) |
| Total (Category) | 62 (95.4%) | 3 (4.6%) |
| Total (Overall) | 433 (49.4%) | 443 (50.6%) |
Production, Transportation and Moving Occupations
The most common Production, Transportation and Moving occupations in St Lawrence borough are Production (89 | 10.2%), Material Moving (47 | 5.4%), and Transportation (34 | 3.9%).
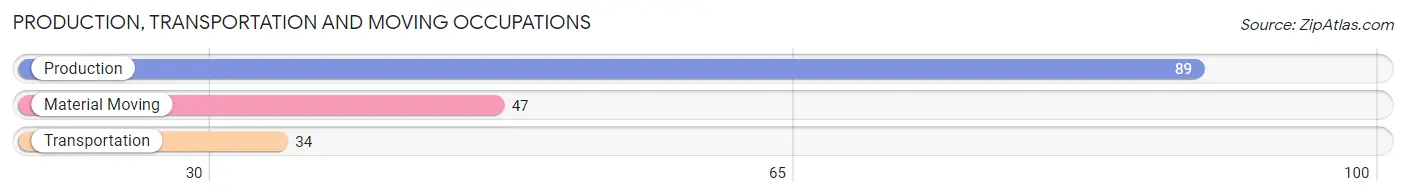
Production, Transportation and Moving Occupations by Sex
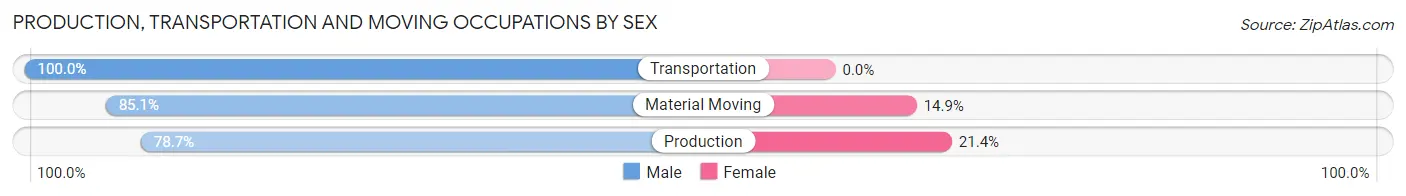
| Occupation | Male | Female |
| Production | 70 (78.6%) | 19 (21.3%) |
| Transportation | 34 (100.0%) | 0 (0.0%) |
| Material Moving | 40 (85.1%) | 7 (14.9%) |
| Total (Category) | 144 (84.7%) | 26 (15.3%) |
| Total (Overall) | 433 (49.4%) | 443 (50.6%) |
Employment Industries by Sex in St Lawrence borough
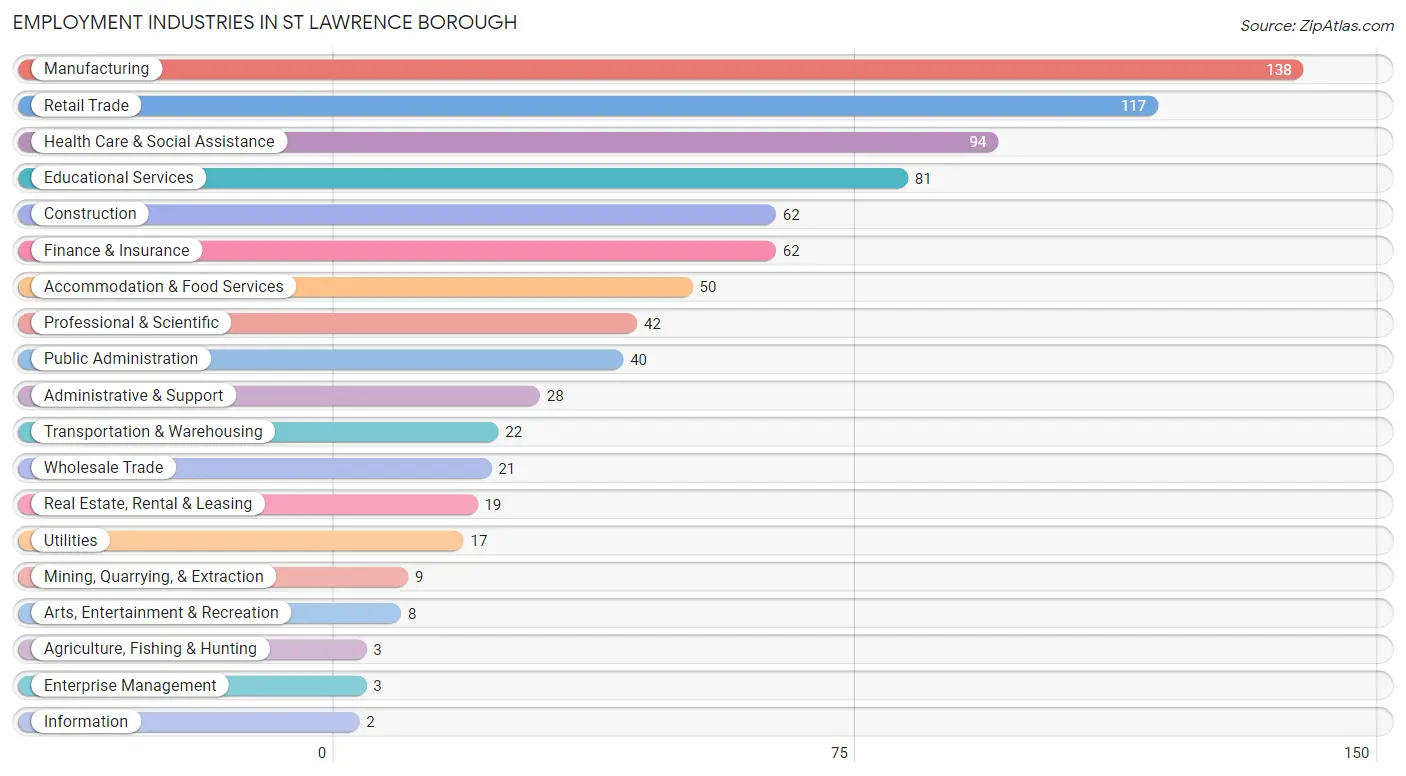
Employment Industries in St Lawrence borough
The major employment industries in St Lawrence borough include Manufacturing (138 | 15.8%), Retail Trade (117 | 13.4%), Health Care & Social Assistance (94 | 10.7%), Educational Services (81 | 9.2%), and Construction (62 | 7.1%).
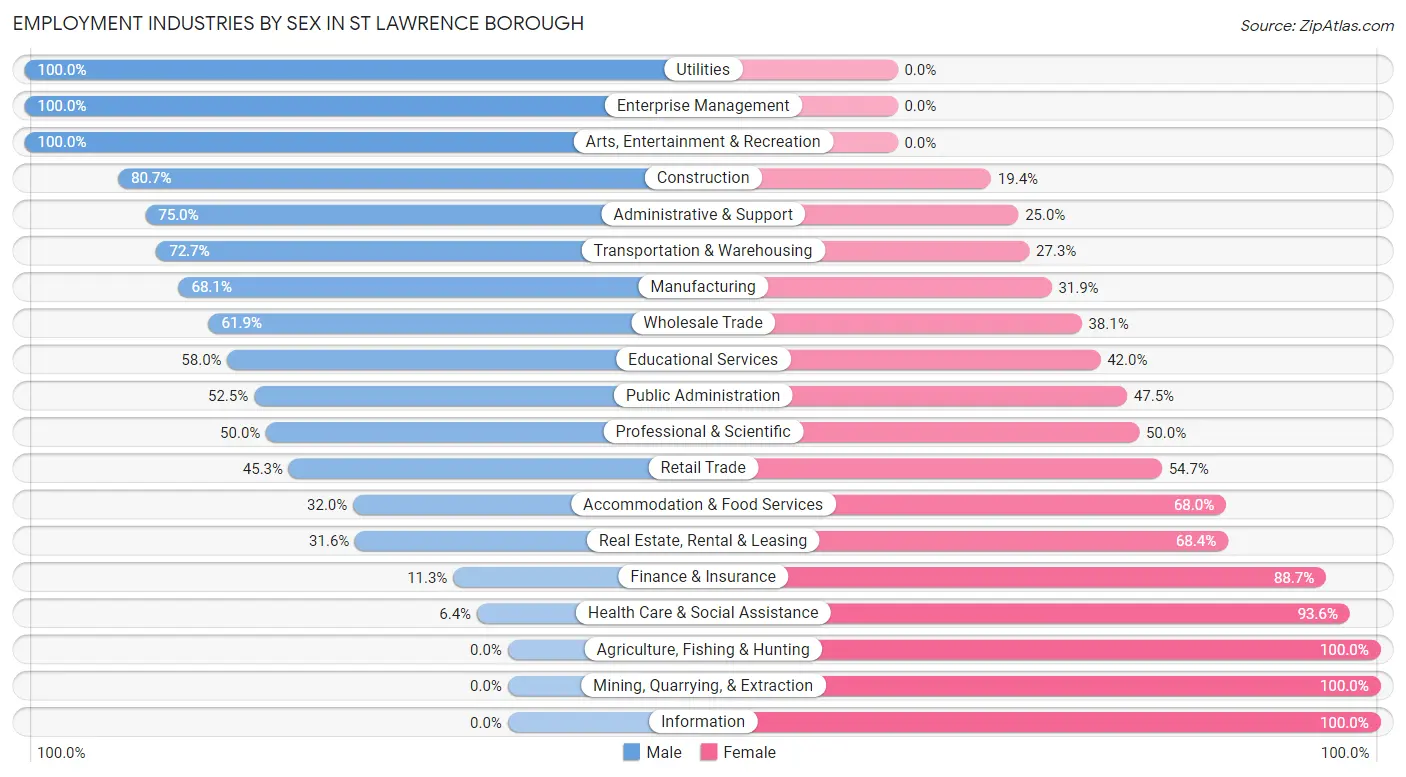
Employment Industries by Sex in St Lawrence borough
The St Lawrence borough industries that see more men than women are Utilities (100.0%), Enterprise Management (100.0%), and Arts, Entertainment & Recreation (100.0%), whereas the industries that tend to have a higher number of women are Agriculture, Fishing & Hunting (100.0%), Mining, Quarrying, & Extraction (100.0%), and Information (100.0%).
| Industry | Male | Female |
| Agriculture, Fishing & Hunting | 0 (0.0%) | 3 (100.0%) |
| Mining, Quarrying, & Extraction | 0 (0.0%) | 9 (100.0%) |
| Construction | 50 (80.6%) | 12 (19.4%) |
| Manufacturing | 94 (68.1%) | 44 (31.9%) |
| Wholesale Trade | 13 (61.9%) | 8 (38.1%) |
| Retail Trade | 53 (45.3%) | 64 (54.7%) |
| Transportation & Warehousing | 16 (72.7%) | 6 (27.3%) |
| Utilities | 17 (100.0%) | 0 (0.0%) |
| Information | 0 (0.0%) | 2 (100.0%) |
| Finance & Insurance | 7 (11.3%) | 55 (88.7%) |
| Real Estate, Rental & Leasing | 6 (31.6%) | 13 (68.4%) |
| Professional & Scientific | 21 (50.0%) | 21 (50.0%) |
| Enterprise Management | 3 (100.0%) | 0 (0.0%) |
| Administrative & Support | 21 (75.0%) | 7 (25.0%) |
| Educational Services | 47 (58.0%) | 34 (42.0%) |
| Health Care & Social Assistance | 6 (6.4%) | 88 (93.6%) |
| Arts, Entertainment & Recreation | 8 (100.0%) | 0 (0.0%) |
| Accommodation & Food Services | 16 (32.0%) | 34 (68.0%) |
| Public Administration | 21 (52.5%) | 19 (47.5%) |
| Total | 433 (49.4%) | 443 (50.6%) |
Education in St Lawrence borough
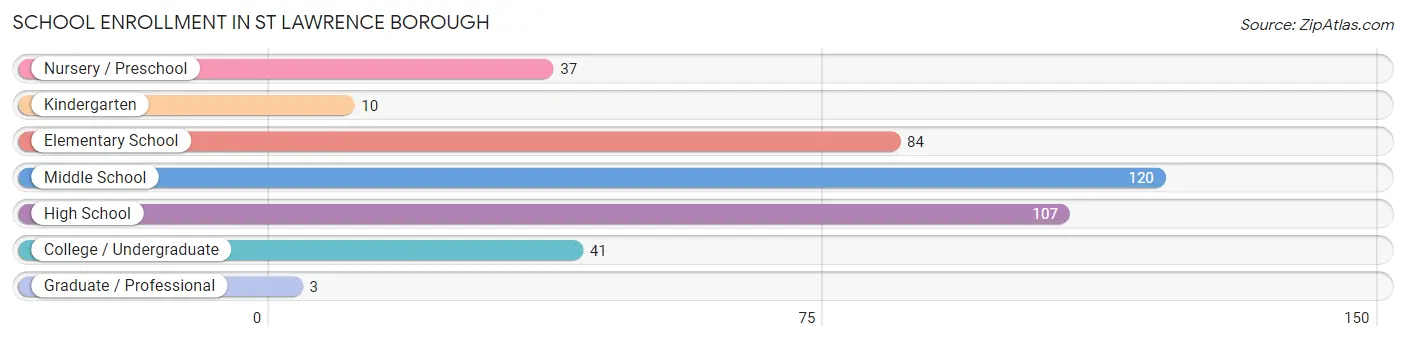
School Enrollment in St Lawrence borough
The most common levels of schooling among the 402 students in St Lawrence borough are middle school (120 | 29.8%), high school (107 | 26.6%), and elementary school (84 | 20.9%).
| School Level | # Students | % Students |
| Nursery / Preschool | 37 | 9.2% |
| Kindergarten | 10 | 2.5% |
| Elementary School | 84 | 20.9% |
| Middle School | 120 | 29.8% |
| High School | 107 | 26.6% |
| College / Undergraduate | 41 | 10.2% |
| Graduate / Professional | 3 | 0.7% |
| Total | 402 | 100.0% |
School Enrollment by Age by Funding Source in St Lawrence borough
Out of a total of 402 students who are enrolled in schools in St Lawrence borough, 51 (12.7%) attend a private institution, while the remaining 351 (87.3%) are enrolled in public schools. The age group of 3 to 4 year olds has the highest likelihood of being enrolled in private schools, with 9 (50.0% in the age bracket) enrolled. Conversely, the age group of 15 to 17 year olds has the lowest likelihood of being enrolled in a private school, with 82 (100.0% in the age bracket) attending a public institution.
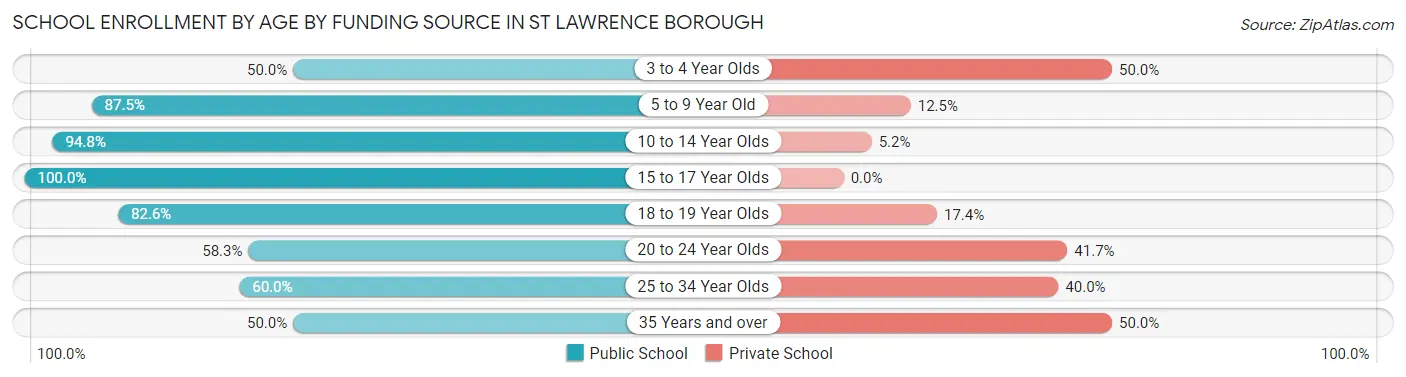
| Age Bracket | Public School | Private School |
| 3 to 4 Year Olds | 9 (50.0%) | 9 (50.0%) |
| 5 to 9 Year Old | 91 (87.5%) | 13 (12.5%) |
| 10 to 14 Year Olds | 127 (94.8%) | 7 (5.2%) |
| 15 to 17 Year Olds | 82 (100.0%) | 0 (0.0%) |
| 18 to 19 Year Olds | 19 (82.6%) | 4 (17.4%) |
| 20 to 24 Year Olds | 7 (58.3%) | 5 (41.7%) |
| 25 to 34 Year Olds | 9 (60.0%) | 6 (40.0%) |
| 35 Years and over | 7 (50.0%) | 7 (50.0%) |
| Total | 351 (87.3%) | 51 (12.7%) |
Educational Attainment by Field of Study in St Lawrence borough
Education (133 | 29.5%), business (82 | 18.2%), arts & humanities (38 | 8.4%), liberal arts & history (32 | 7.1%), and visual & performing arts (28 | 6.2%) are the most common fields of study among 451 individuals in St Lawrence borough who have obtained a bachelor's degree or higher.
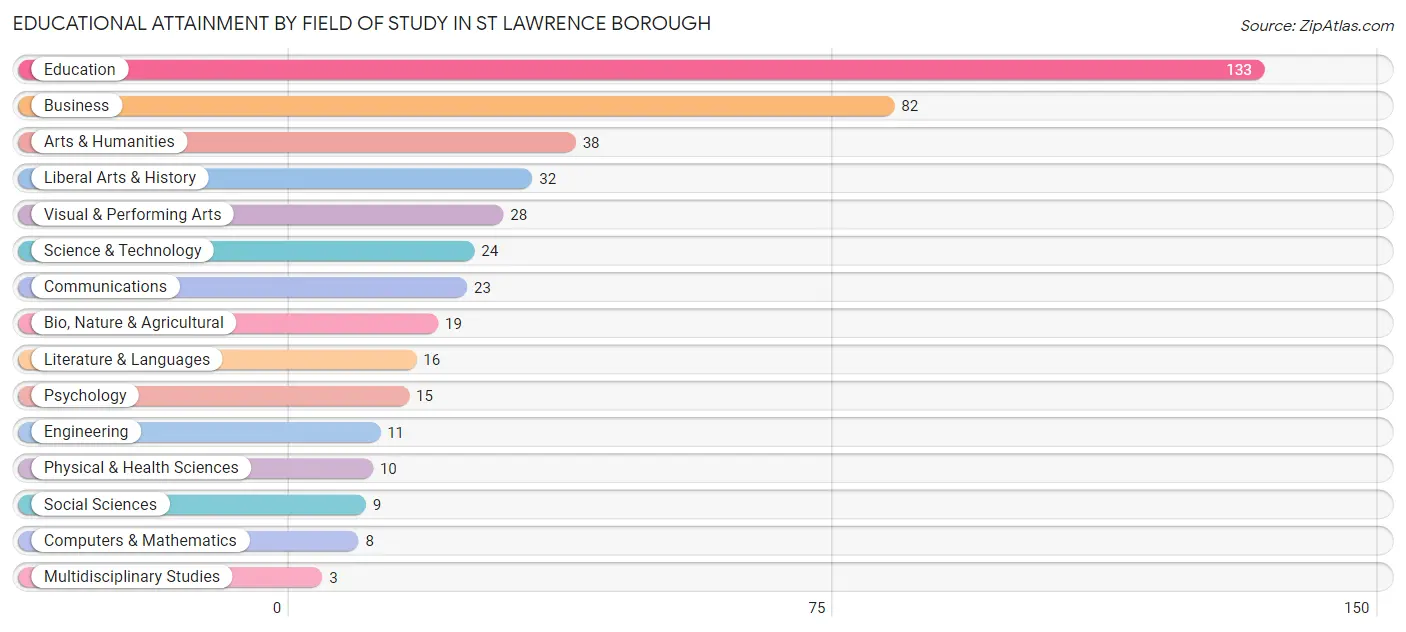
| Field of Study | # Graduates | % Graduates |
| Computers & Mathematics | 8 | 1.8% |
| Bio, Nature & Agricultural | 19 | 4.2% |
| Physical & Health Sciences | 10 | 2.2% |
| Psychology | 15 | 3.3% |
| Social Sciences | 9 | 2.0% |
| Engineering | 11 | 2.4% |
| Multidisciplinary Studies | 3 | 0.7% |
| Science & Technology | 24 | 5.3% |
| Business | 82 | 18.2% |
| Education | 133 | 29.5% |
| Literature & Languages | 16 | 3.5% |
| Liberal Arts & History | 32 | 7.1% |
| Visual & Performing Arts | 28 | 6.2% |
| Communications | 23 | 5.1% |
| Arts & Humanities | 38 | 8.4% |
| Total | 451 | 100.0% |
Transportation & Commute in St Lawrence borough
Vehicle Availability by Sex in St Lawrence borough
The most prevalent vehicle ownership categories in St Lawrence borough are males with 2 vehicles (200, accounting for 46.5%) and females with 2 vehicles (175, making up 45.6%).
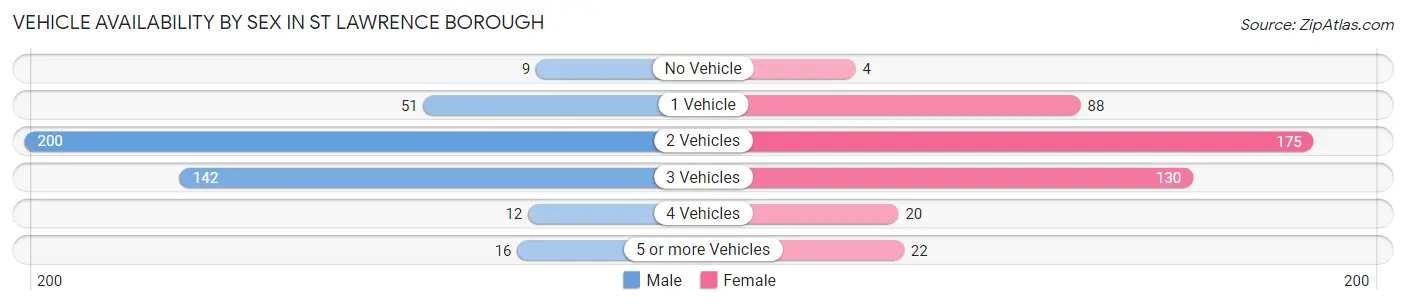
| Vehicles Available | Male | Female |
| No Vehicle | 9 (2.1%) | 4 (0.9%) |
| 1 Vehicle | 51 (11.9%) | 88 (20.1%) |
| 2 Vehicles | 200 (46.5%) | 175 (39.9%) |
| 3 Vehicles | 142 (33.0%) | 130 (29.6%) |
| 4 Vehicles | 12 (2.8%) | 20 (4.6%) |
| 5 or more Vehicles | 16 (3.7%) | 22 (5.0%) |
| Total | 430 (100.0%) | 439 (100.0%) |
Commute Time in St Lawrence borough
The most frequently occuring commute durations in St Lawrence borough are 20 to 24 minutes (122 commuters, 16.0%), 25 to 29 minutes (109 commuters, 14.3%), and 30 to 34 minutes (102 commuters, 13.4%).
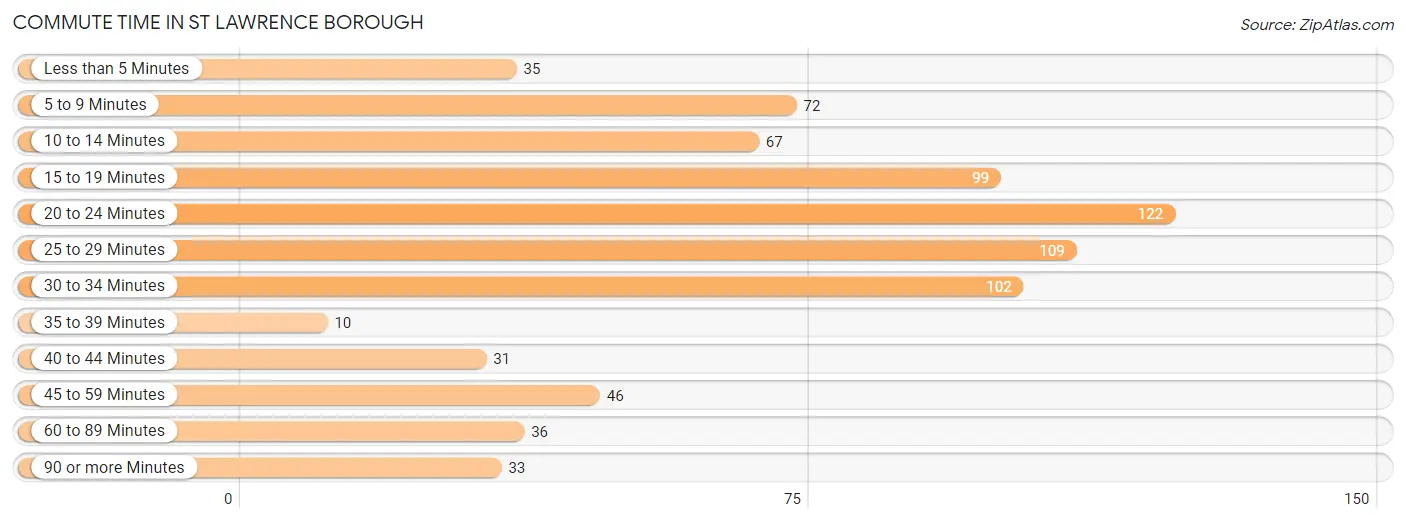
| Commute Time | # Commuters | % Commuters |
| Less than 5 Minutes | 35 | 4.6% |
| 5 to 9 Minutes | 72 | 9.5% |
| 10 to 14 Minutes | 67 | 8.8% |
| 15 to 19 Minutes | 99 | 13.0% |
| 20 to 24 Minutes | 122 | 16.0% |
| 25 to 29 Minutes | 109 | 14.3% |
| 30 to 34 Minutes | 102 | 13.4% |
| 35 to 39 Minutes | 10 | 1.3% |
| 40 to 44 Minutes | 31 | 4.1% |
| 45 to 59 Minutes | 46 | 6.0% |
| 60 to 89 Minutes | 36 | 4.7% |
| 90 or more Minutes | 33 | 4.3% |
Commute Time by Sex in St Lawrence borough
The most common commute times in St Lawrence borough are 30 to 34 minutes (63 commuters, 16.8%) for males and 25 to 29 minutes (77 commuters, 19.9%) for females.
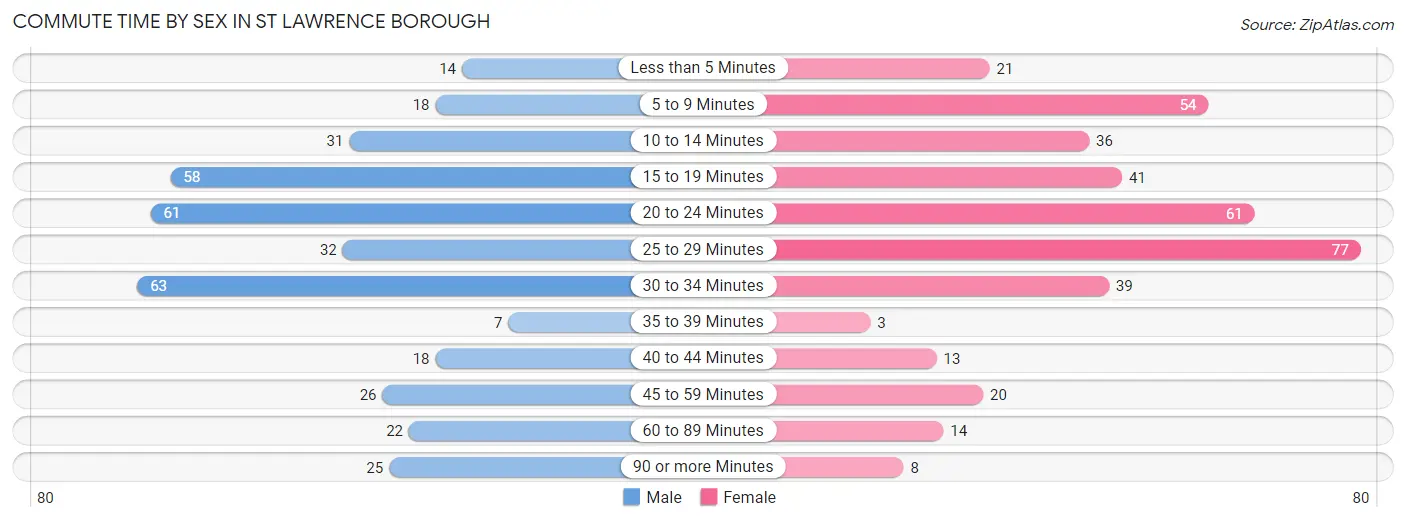
| Commute Time | Male | Female |
| Less than 5 Minutes | 14 (3.7%) | 21 (5.4%) |
| 5 to 9 Minutes | 18 (4.8%) | 54 (14.0%) |
| 10 to 14 Minutes | 31 (8.3%) | 36 (9.3%) |
| 15 to 19 Minutes | 58 (15.5%) | 41 (10.6%) |
| 20 to 24 Minutes | 61 (16.3%) | 61 (15.8%) |
| 25 to 29 Minutes | 32 (8.5%) | 77 (19.9%) |
| 30 to 34 Minutes | 63 (16.8%) | 39 (10.1%) |
| 35 to 39 Minutes | 7 (1.9%) | 3 (0.8%) |
| 40 to 44 Minutes | 18 (4.8%) | 13 (3.4%) |
| 45 to 59 Minutes | 26 (6.9%) | 20 (5.2%) |
| 60 to 89 Minutes | 22 (5.9%) | 14 (3.6%) |
| 90 or more Minutes | 25 (6.7%) | 8 (2.1%) |
Time of Departure to Work by Sex in St Lawrence borough
The most frequent times of departure to work in St Lawrence borough are 7:30 AM to 7:59 AM (57, 15.2%) for males and 7:30 AM to 7:59 AM (89, 23.0%) for females.
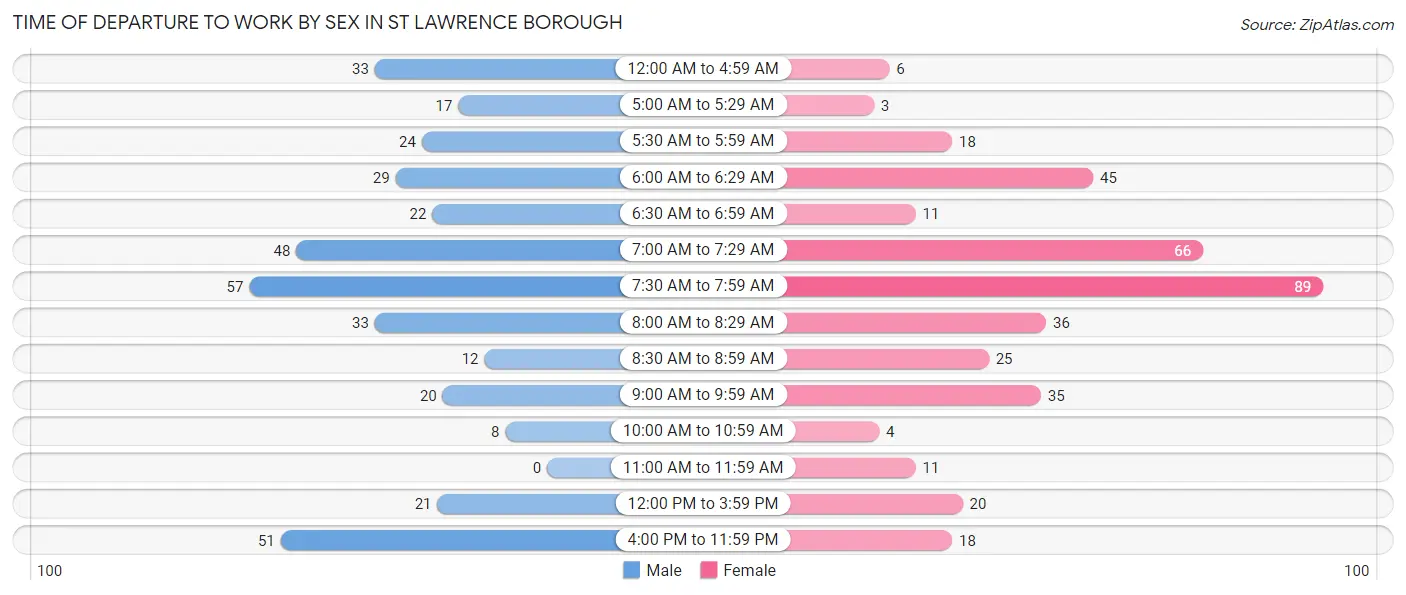
| Time of Departure | Male | Female |
| 12:00 AM to 4:59 AM | 33 (8.8%) | 6 (1.5%) |
| 5:00 AM to 5:29 AM | 17 (4.5%) | 3 (0.8%) |
| 5:30 AM to 5:59 AM | 24 (6.4%) | 18 (4.6%) |
| 6:00 AM to 6:29 AM | 29 (7.7%) | 45 (11.6%) |
| 6:30 AM to 6:59 AM | 22 (5.9%) | 11 (2.8%) |
| 7:00 AM to 7:29 AM | 48 (12.8%) | 66 (17.1%) |
| 7:30 AM to 7:59 AM | 57 (15.2%) | 89 (23.0%) |
| 8:00 AM to 8:29 AM | 33 (8.8%) | 36 (9.3%) |
| 8:30 AM to 8:59 AM | 12 (3.2%) | 25 (6.5%) |
| 9:00 AM to 9:59 AM | 20 (5.3%) | 35 (9.0%) |
| 10:00 AM to 10:59 AM | 8 (2.1%) | 4 (1.0%) |
| 11:00 AM to 11:59 AM | 0 (0.0%) | 11 (2.8%) |
| 12:00 PM to 3:59 PM | 21 (5.6%) | 20 (5.2%) |
| 4:00 PM to 11:59 PM | 51 (13.6%) | 18 (4.6%) |
| Total | 375 (100.0%) | 387 (100.0%) |
Housing Occupancy in St Lawrence borough
Occupancy by Ownership in St Lawrence borough
Of the total 718 dwellings in St Lawrence borough, owner-occupied units account for 501 (69.8%), while renter-occupied units make up 217 (30.2%).
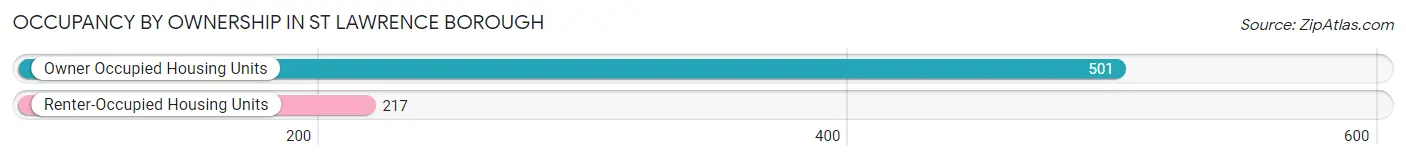
| Occupancy | # Housing Units | % Housing Units |
| Owner Occupied Housing Units | 501 | 69.8% |
| Renter-Occupied Housing Units | 217 | 30.2% |
| Total Occupied Housing Units | 718 | 100.0% |
Occupancy by Household Size in St Lawrence borough
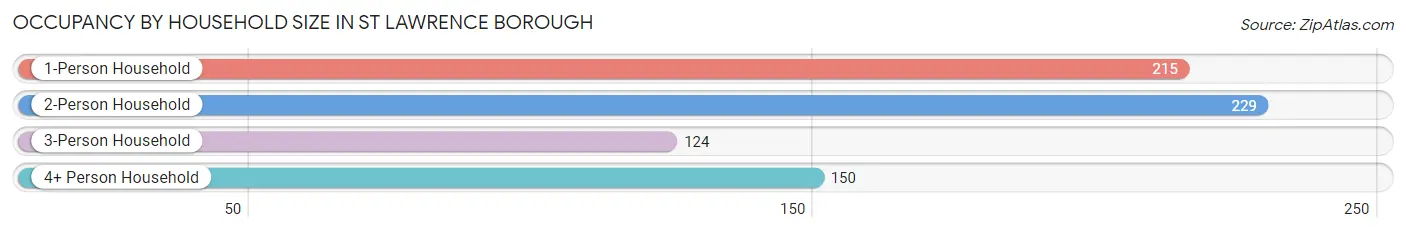
| Household Size | # Housing Units | % Housing Units |
| 1-Person Household | 215 | 29.9% |
| 2-Person Household | 229 | 31.9% |
| 3-Person Household | 124 | 17.3% |
| 4+ Person Household | 150 | 20.9% |
| Total Housing Units | 718 | 100.0% |
Occupancy by Ownership by Household Size in St Lawrence borough
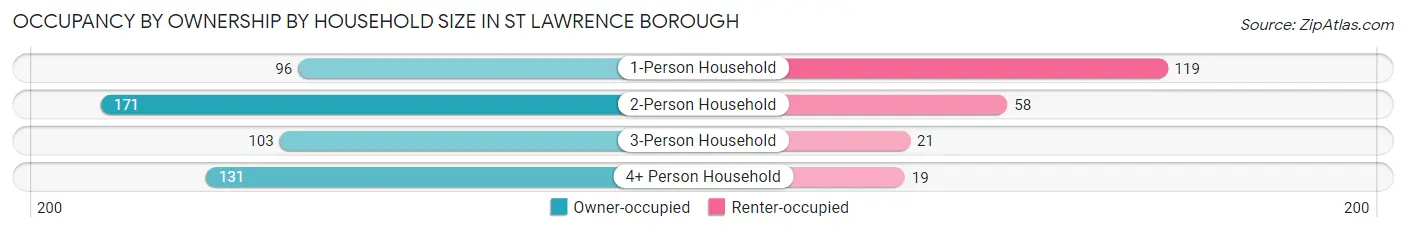
| Household Size | Owner-occupied | Renter-occupied |
| 1-Person Household | 96 (44.7%) | 119 (55.3%) |
| 2-Person Household | 171 (74.7%) | 58 (25.3%) |
| 3-Person Household | 103 (83.1%) | 21 (16.9%) |
| 4+ Person Household | 131 (87.3%) | 19 (12.7%) |
| Total Housing Units | 501 (69.8%) | 217 (30.2%) |
Occupancy by Educational Attainment in St Lawrence borough
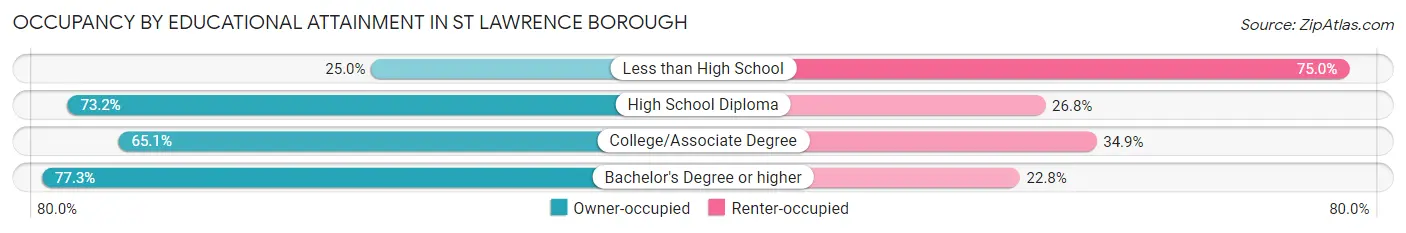
| Household Size | Owner-occupied | Renter-occupied |
| Less than High School | 11 (25.0%) | 33 (75.0%) |
| High School Diploma | 183 (73.2%) | 67 (26.8%) |
| College/Associate Degree | 110 (65.1%) | 59 (34.9%) |
| Bachelor's Degree or higher | 197 (77.2%) | 58 (22.8%) |
Occupancy by Age of Householder in St Lawrence borough
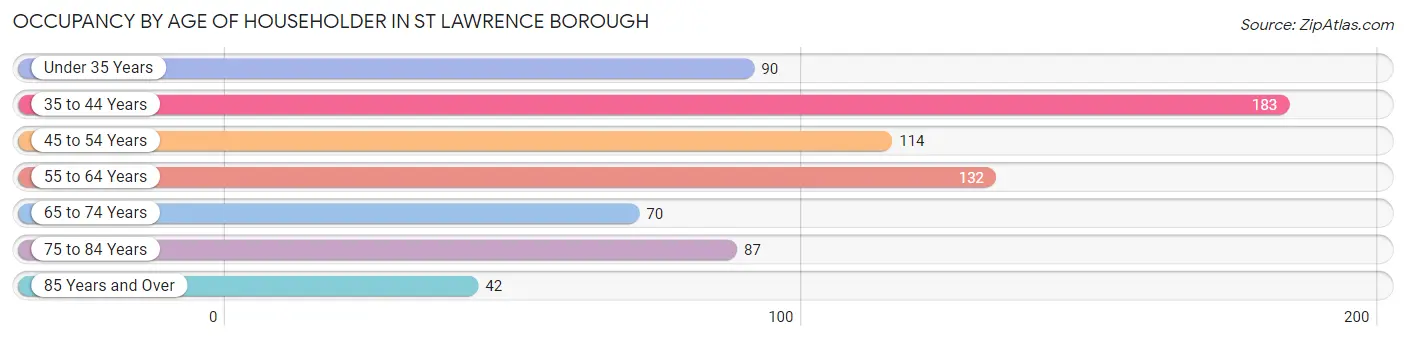
| Age Bracket | # Households | % Households |
| Under 35 Years | 90 | 12.5% |
| 35 to 44 Years | 183 | 25.5% |
| 45 to 54 Years | 114 | 15.9% |
| 55 to 64 Years | 132 | 18.4% |
| 65 to 74 Years | 70 | 9.8% |
| 75 to 84 Years | 87 | 12.1% |
| 85 Years and Over | 42 | 5.9% |
| Total | 718 | 100.0% |
Housing Finances in St Lawrence borough
Median Income by Occupancy in St Lawrence borough
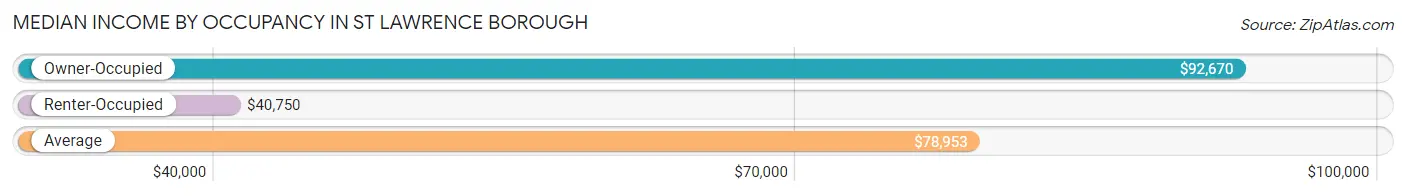
| Occupancy Type | # Households | Median Income |
| Owner-Occupied | 501 (69.8%) | $92,670 |
| Renter-Occupied | 217 (30.2%) | $40,750 |
| Average | 718 (100.0%) | $78,953 |
Occupancy by Householder Income Bracket in St Lawrence borough
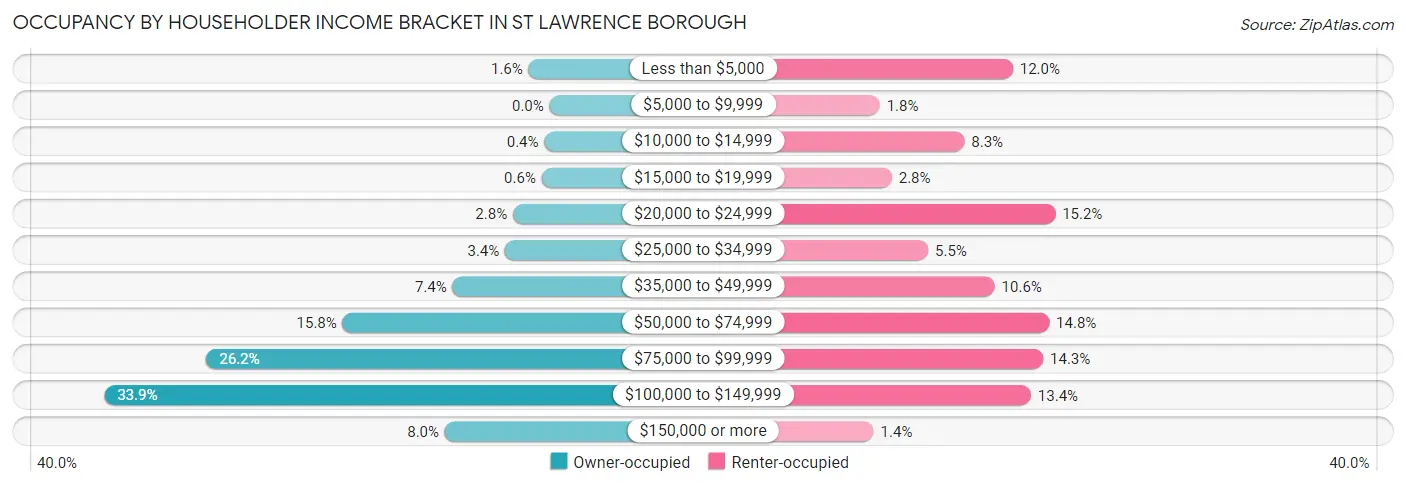
| Income Bracket | Owner-occupied | Renter-occupied |
| Less than $5,000 | 8 (1.6%) | 26 (12.0%) |
| $5,000 to $9,999 | 0 (0.0%) | 4 (1.8%) |
| $10,000 to $14,999 | 2 (0.4%) | 18 (8.3%) |
| $15,000 to $19,999 | 3 (0.6%) | 6 (2.8%) |
| $20,000 to $24,999 | 14 (2.8%) | 33 (15.2%) |
| $25,000 to $34,999 | 17 (3.4%) | 12 (5.5%) |
| $35,000 to $49,999 | 37 (7.4%) | 23 (10.6%) |
| $50,000 to $74,999 | 79 (15.8%) | 32 (14.7%) |
| $75,000 to $99,999 | 131 (26.2%) | 31 (14.3%) |
| $100,000 to $149,999 | 170 (33.9%) | 29 (13.4%) |
| $150,000 or more | 40 (8.0%) | 3 (1.4%) |
| Total | 501 (100.0%) | 217 (100.0%) |
Monthly Housing Cost Tiers in St Lawrence borough
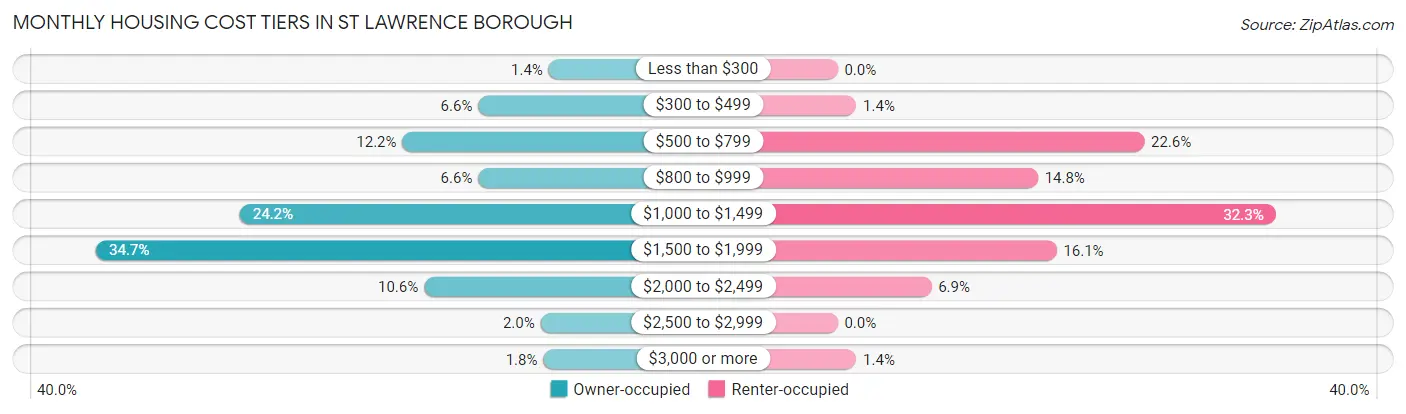
| Monthly Cost | Owner-occupied | Renter-occupied |
| Less than $300 | 7 (1.4%) | 0 (0.0%) |
| $300 to $499 | 33 (6.6%) | 3 (1.4%) |
| $500 to $799 | 61 (12.2%) | 49 (22.6%) |
| $800 to $999 | 33 (6.6%) | 32 (14.7%) |
| $1,000 to $1,499 | 121 (24.1%) | 70 (32.3%) |
| $1,500 to $1,999 | 174 (34.7%) | 35 (16.1%) |
| $2,000 to $2,499 | 53 (10.6%) | 15 (6.9%) |
| $2,500 to $2,999 | 10 (2.0%) | 0 (0.0%) |
| $3,000 or more | 9 (1.8%) | 3 (1.4%) |
| Total | 501 (100.0%) | 217 (100.0%) |
Physical Housing Characteristics in St Lawrence borough
Housing Structures in St Lawrence borough
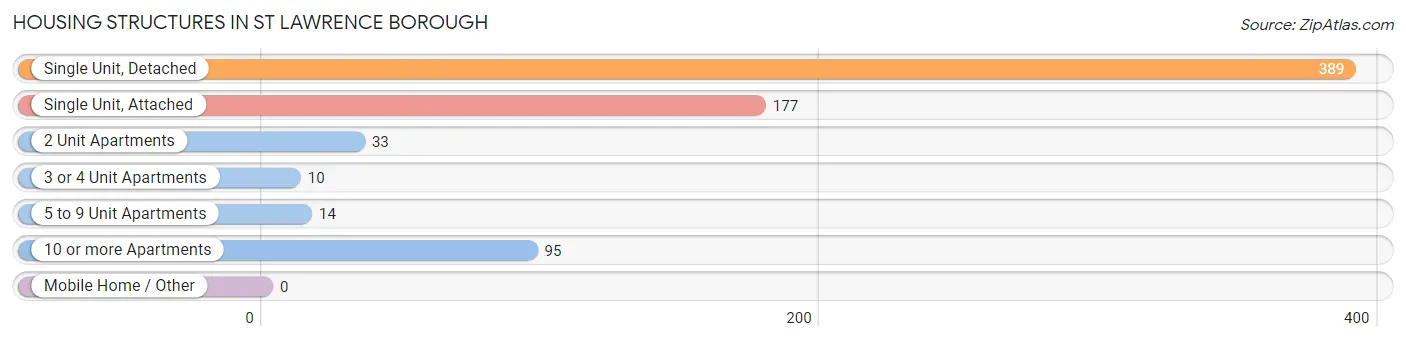
| Structure Type | # Housing Units | % Housing Units |
| Single Unit, Detached | 389 | 54.2% |
| Single Unit, Attached | 177 | 24.6% |
| 2 Unit Apartments | 33 | 4.6% |
| 3 or 4 Unit Apartments | 10 | 1.4% |
| 5 to 9 Unit Apartments | 14 | 1.9% |
| 10 or more Apartments | 95 | 13.2% |
| Mobile Home / Other | 0 | 0.0% |
| Total | 718 | 100.0% |
Housing Structures by Occupancy in St Lawrence borough
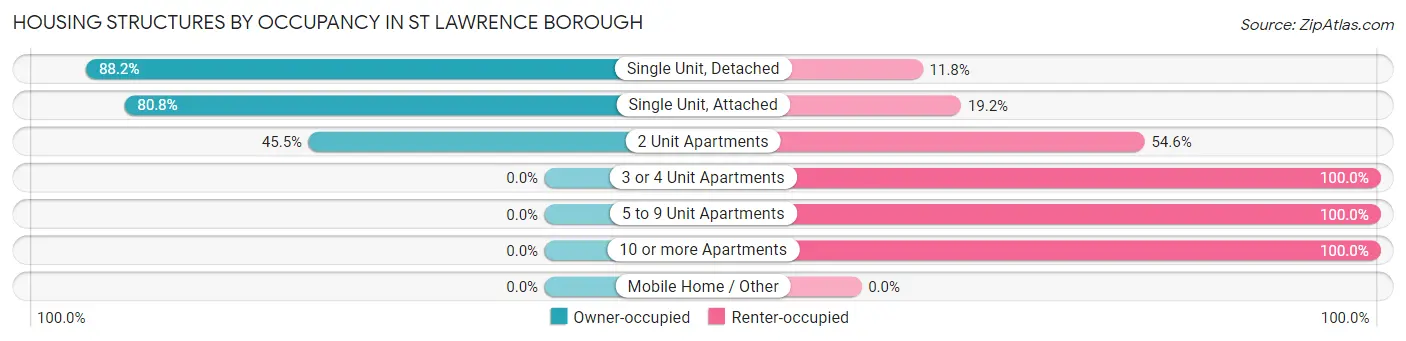
| Structure Type | Owner-occupied | Renter-occupied |
| Single Unit, Detached | 343 (88.2%) | 46 (11.8%) |
| Single Unit, Attached | 143 (80.8%) | 34 (19.2%) |
| 2 Unit Apartments | 15 (45.5%) | 18 (54.5%) |
| 3 or 4 Unit Apartments | 0 (0.0%) | 10 (100.0%) |
| 5 to 9 Unit Apartments | 0 (0.0%) | 14 (100.0%) |
| 10 or more Apartments | 0 (0.0%) | 95 (100.0%) |
| Mobile Home / Other | 0 (0.0%) | 0 (0.0%) |
| Total | 501 (69.8%) | 217 (30.2%) |
Housing Structures by Number of Rooms in St Lawrence borough
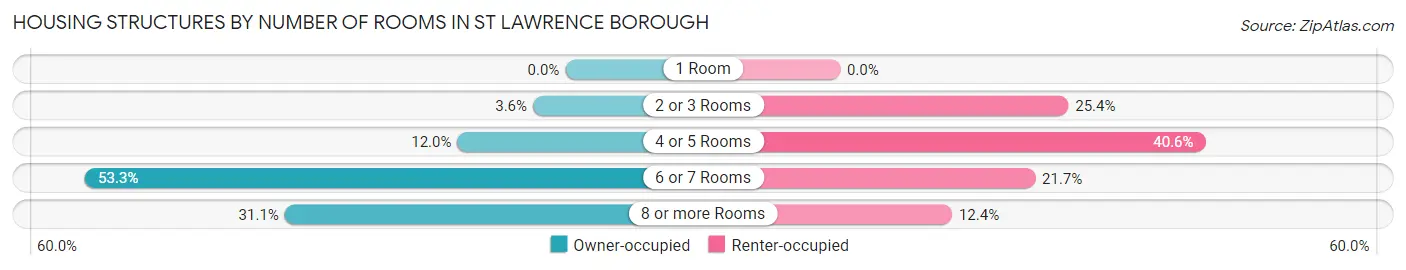
| Number of Rooms | Owner-occupied | Renter-occupied |
| 1 Room | 0 (0.0%) | 0 (0.0%) |
| 2 or 3 Rooms | 18 (3.6%) | 55 (25.4%) |
| 4 or 5 Rooms | 60 (12.0%) | 88 (40.6%) |
| 6 or 7 Rooms | 267 (53.3%) | 47 (21.7%) |
| 8 or more Rooms | 156 (31.1%) | 27 (12.4%) |
| Total | 501 (100.0%) | 217 (100.0%) |
Housing Structure by Heating Type in St Lawrence borough
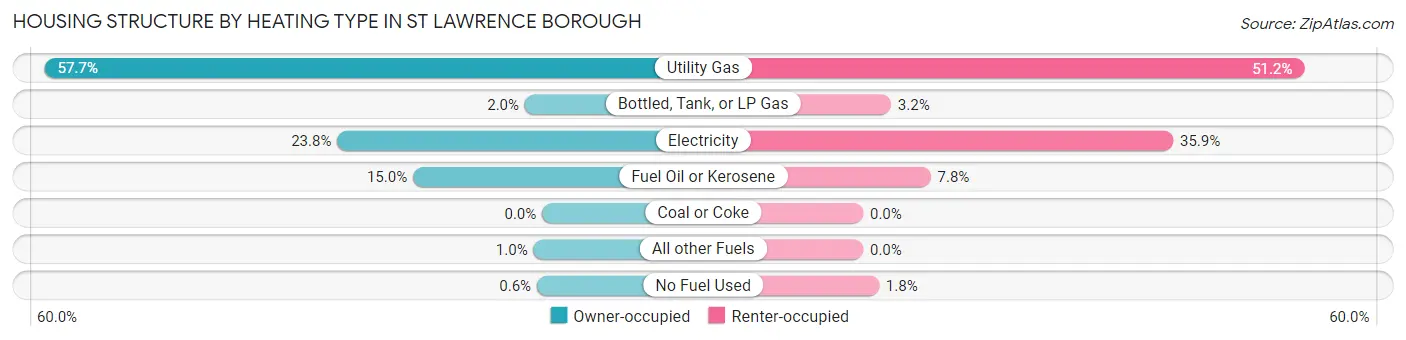
| Heating Type | Owner-occupied | Renter-occupied |
| Utility Gas | 289 (57.7%) | 111 (51.1%) |
| Bottled, Tank, or LP Gas | 10 (2.0%) | 7 (3.2%) |
| Electricity | 119 (23.7%) | 78 (35.9%) |
| Fuel Oil or Kerosene | 75 (15.0%) | 17 (7.8%) |
| Coal or Coke | 0 (0.0%) | 0 (0.0%) |
| All other Fuels | 5 (1.0%) | 0 (0.0%) |
| No Fuel Used | 3 (0.6%) | 4 (1.8%) |
| Total | 501 (100.0%) | 217 (100.0%) |
Household Vehicle Usage in St Lawrence borough
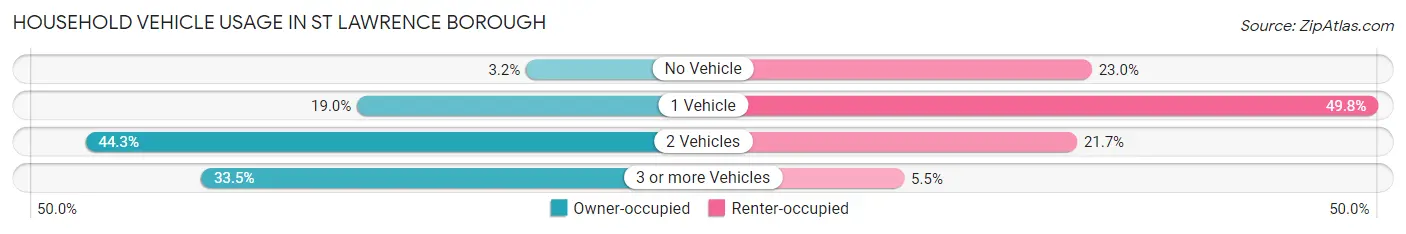
| Vehicles per Household | Owner-occupied | Renter-occupied |
| No Vehicle | 16 (3.2%) | 50 (23.0%) |
| 1 Vehicle | 95 (19.0%) | 108 (49.8%) |
| 2 Vehicles | 222 (44.3%) | 47 (21.7%) |
| 3 or more Vehicles | 168 (33.5%) | 12 (5.5%) |
| Total | 501 (100.0%) | 217 (100.0%) |
Real Estate & Mortgages in St Lawrence borough
Real Estate and Mortgage Overview in St Lawrence borough
| Characteristic | Without Mortgage | With Mortgage |
| Housing Units | 132 | 369 |
| Median Property Value | $172,200 | $195,400 |
| Median Household Income | $70,667 | $32 |
| Monthly Housing Costs | $675 | $9 |
| Real Estate Taxes | $4,231 | $0 |
Property Value by Mortgage Status in St Lawrence borough
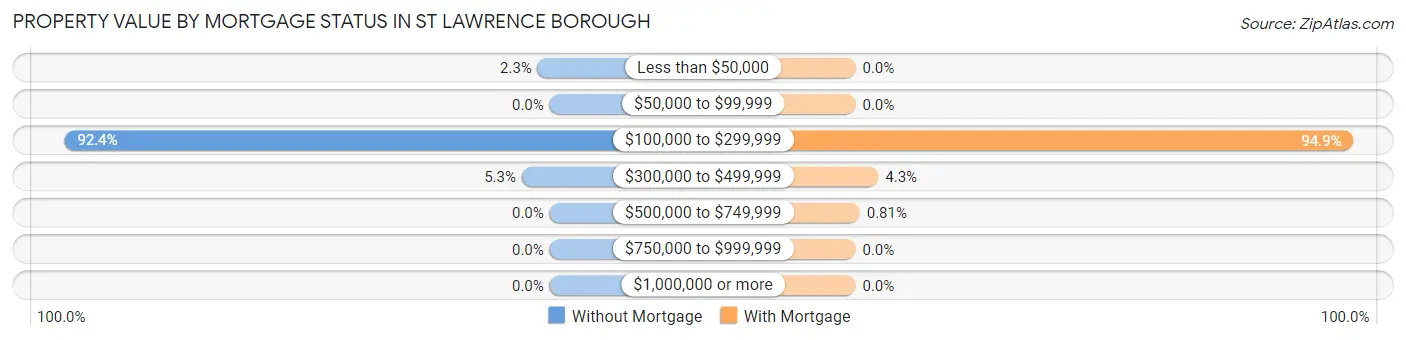
| Property Value | Without Mortgage | With Mortgage |
| Less than $50,000 | 3 (2.3%) | 0 (0.0%) |
| $50,000 to $99,999 | 0 (0.0%) | 0 (0.0%) |
| $100,000 to $299,999 | 122 (92.4%) | 350 (94.9%) |
| $300,000 to $499,999 | 7 (5.3%) | 16 (4.3%) |
| $500,000 to $749,999 | 0 (0.0%) | 3 (0.8%) |
| $750,000 to $999,999 | 0 (0.0%) | 0 (0.0%) |
| $1,000,000 or more | 0 (0.0%) | 0 (0.0%) |
| Total | 132 (100.0%) | 369 (100.0%) |
Household Income by Mortgage Status in St Lawrence borough
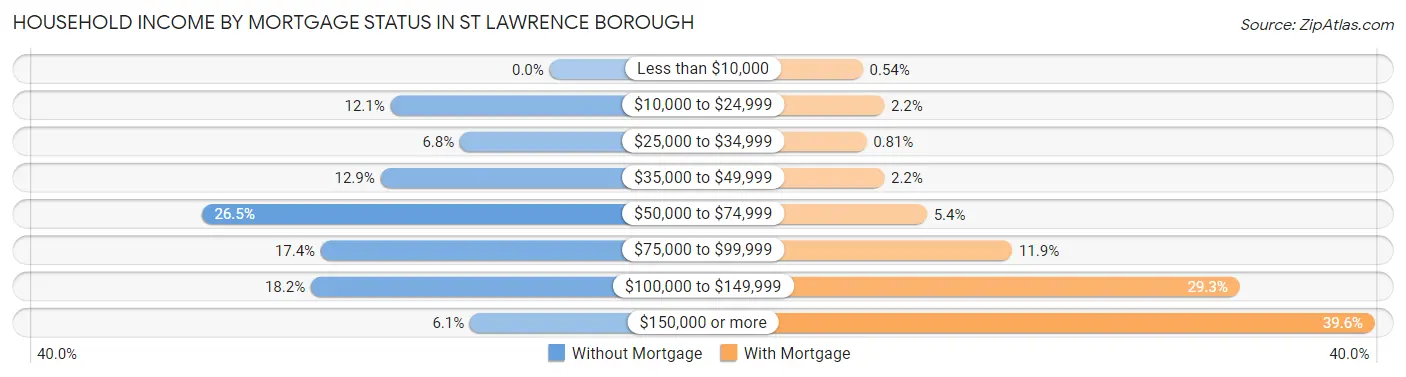
| Household Income | Without Mortgage | With Mortgage |
| Less than $10,000 | 0 (0.0%) | 2 (0.5%) |
| $10,000 to $24,999 | 16 (12.1%) | 8 (2.2%) |
| $25,000 to $34,999 | 9 (6.8%) | 3 (0.8%) |
| $35,000 to $49,999 | 17 (12.9%) | 8 (2.2%) |
| $50,000 to $74,999 | 35 (26.5%) | 20 (5.4%) |
| $75,000 to $99,999 | 23 (17.4%) | 44 (11.9%) |
| $100,000 to $149,999 | 24 (18.2%) | 108 (29.3%) |
| $150,000 or more | 8 (6.1%) | 146 (39.6%) |
| Total | 132 (100.0%) | 369 (100.0%) |
Property Value to Household Income Ratio in St Lawrence borough
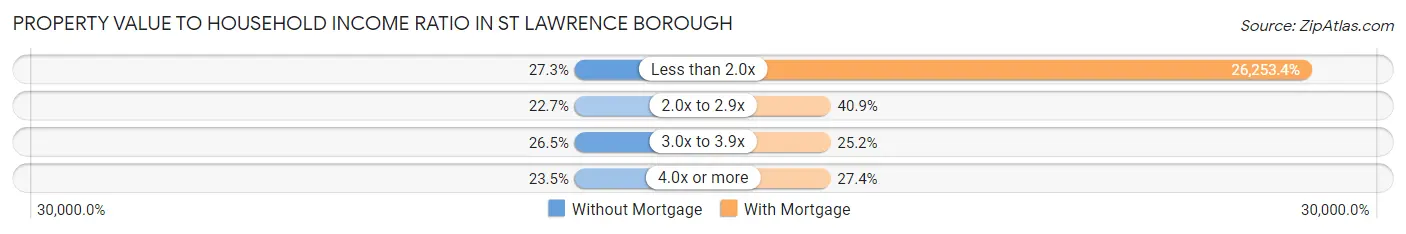
| Value-to-Income Ratio | Without Mortgage | With Mortgage |
| Less than 2.0x | 36 (27.3%) | 96,875 (26,253.4%) |
| 2.0x to 2.9x | 30 (22.7%) | 151 (40.9%) |
| 3.0x to 3.9x | 35 (26.5%) | 93 (25.2%) |
| 4.0x or more | 31 (23.5%) | 101 (27.4%) |
| Total | 132 (100.0%) | 369 (100.0%) |
Real Estate Taxes by Mortgage Status in St Lawrence borough
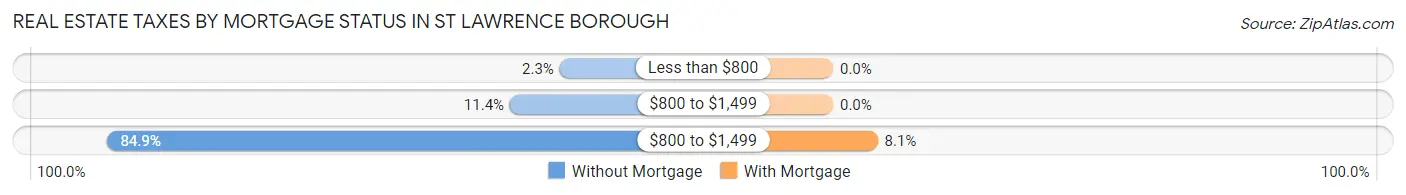
| Property Taxes | Without Mortgage | With Mortgage |
| Less than $800 | 3 (2.3%) | 0 (0.0%) |
| $800 to $1,499 | 15 (11.4%) | 0 (0.0%) |
| $800 to $1,499 | 112 (84.9%) | 30 (8.1%) |
| Total | 132 (100.0%) | 369 (100.0%) |
Health & Disability in St Lawrence borough
Health Insurance Coverage by Age in St Lawrence borough
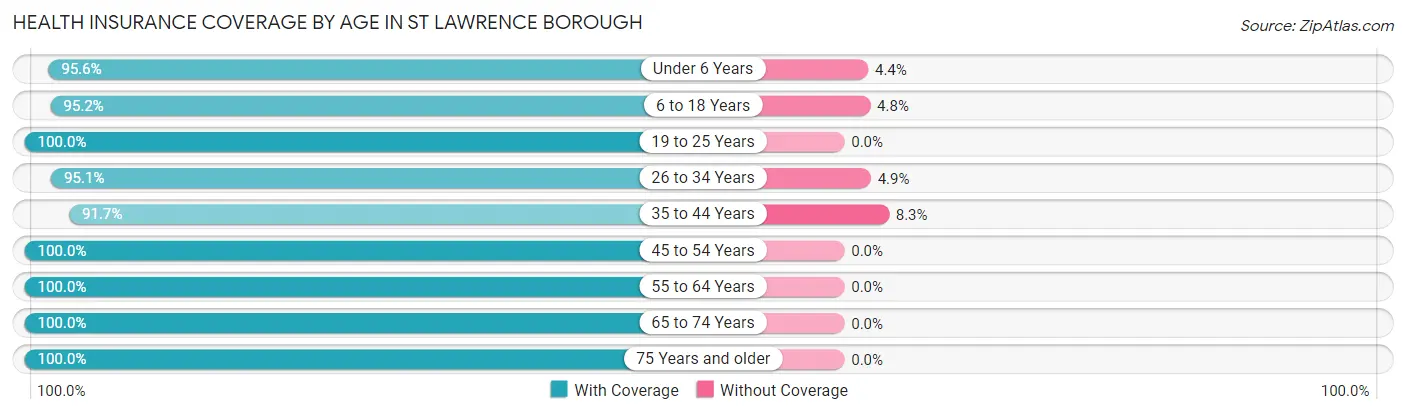
| Age Bracket | With Coverage | Without Coverage |
| Under 6 Years | 151 (95.6%) | 7 (4.4%) |
| 6 to 18 Years | 296 (95.2%) | 15 (4.8%) |
| 19 to 25 Years | 103 (100.0%) | 0 (0.0%) |
| 26 to 34 Years | 193 (95.1%) | 10 (4.9%) |
| 35 to 44 Years | 265 (91.7%) | 24 (8.3%) |
| 45 to 54 Years | 201 (100.0%) | 0 (0.0%) |
| 55 to 64 Years | 223 (100.0%) | 0 (0.0%) |
| 65 to 74 Years | 116 (100.0%) | 0 (0.0%) |
| 75 Years and older | 176 (100.0%) | 0 (0.0%) |
| Total | 1,724 (96.9%) | 56 (3.2%) |
Health Insurance Coverage by Citizenship Status in St Lawrence borough
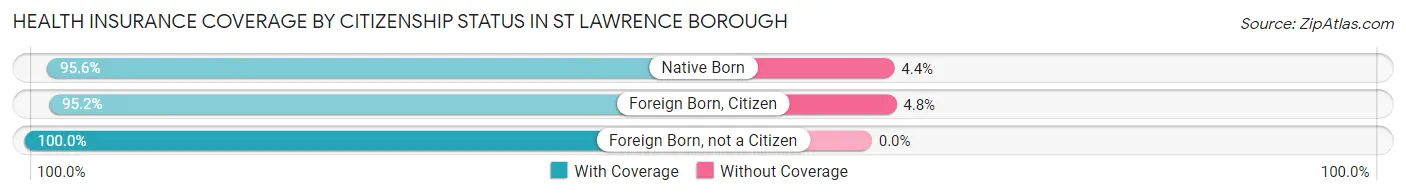
| Citizenship Status | With Coverage | Without Coverage |
| Native Born | 151 (95.6%) | 7 (4.4%) |
| Foreign Born, Citizen | 296 (95.2%) | 15 (4.8%) |
| Foreign Born, not a Citizen | 103 (100.0%) | 0 (0.0%) |
Health Insurance Coverage by Household Income in St Lawrence borough
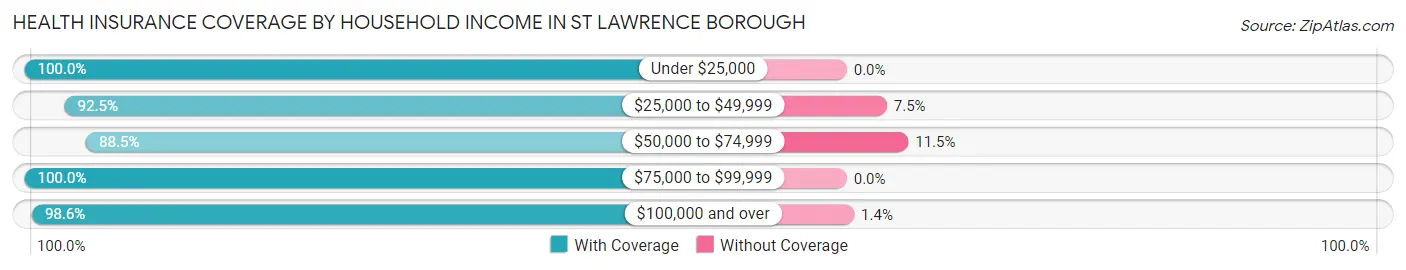
| Household Income | With Coverage | Without Coverage |
| Under $25,000 | 170 (100.0%) | 0 (0.0%) |
| $25,000 to $49,999 | 148 (92.5%) | 12 (7.5%) |
| $50,000 to $74,999 | 261 (88.5%) | 34 (11.5%) |
| $75,000 to $99,999 | 429 (100.0%) | 0 (0.0%) |
| $100,000 and over | 716 (98.6%) | 10 (1.4%) |
Public vs Private Health Insurance Coverage by Age in St Lawrence borough
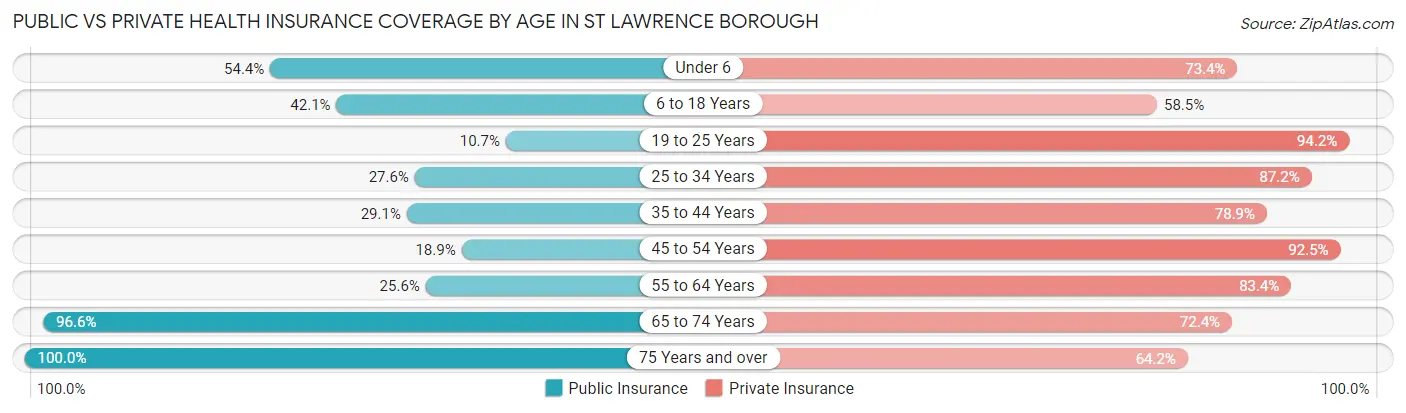
| Age Bracket | Public Insurance | Private Insurance |
| Under 6 | 86 (54.4%) | 116 (73.4%) |
| 6 to 18 Years | 131 (42.1%) | 182 (58.5%) |
| 19 to 25 Years | 11 (10.7%) | 97 (94.2%) |
| 25 to 34 Years | 56 (27.6%) | 177 (87.2%) |
| 35 to 44 Years | 84 (29.1%) | 228 (78.9%) |
| 45 to 54 Years | 38 (18.9%) | 186 (92.5%) |
| 55 to 64 Years | 57 (25.6%) | 186 (83.4%) |
| 65 to 74 Years | 112 (96.6%) | 84 (72.4%) |
| 75 Years and over | 176 (100.0%) | 113 (64.2%) |
| Total | 751 (42.2%) | 1,369 (76.9%) |
Disability Status by Sex by Age in St Lawrence borough
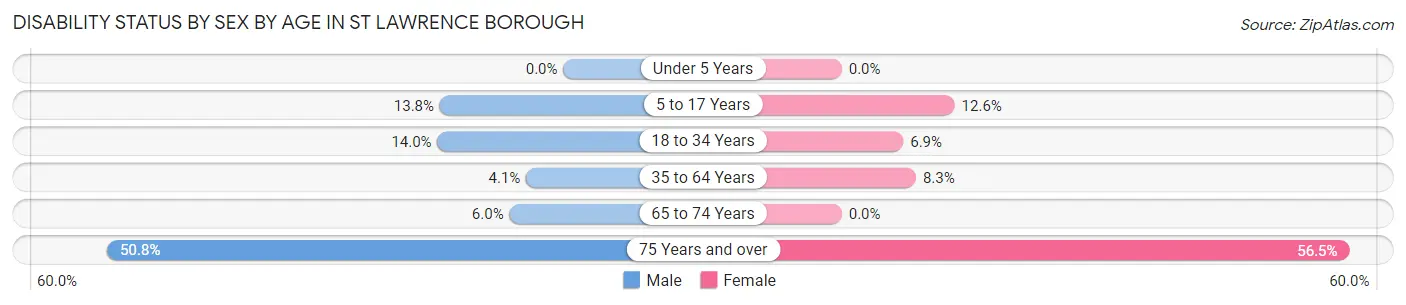
| Age Bracket | Male | Female |
| Under 5 Years | 0 (0.0%) | 0 (0.0%) |
| 5 to 17 Years | 22 (13.8%) | 21 (12.6%) |
| 18 to 34 Years | 15 (14.0%) | 15 (6.9%) |
| 35 to 64 Years | 15 (4.1%) | 29 (8.3%) |
| 65 to 74 Years | 3 (6.0%) | 0 (0.0%) |
| 75 Years and over | 31 (50.8%) | 65 (56.5%) |
Disability Class by Sex by Age in St Lawrence borough
Disability Class: Hearing Difficulty
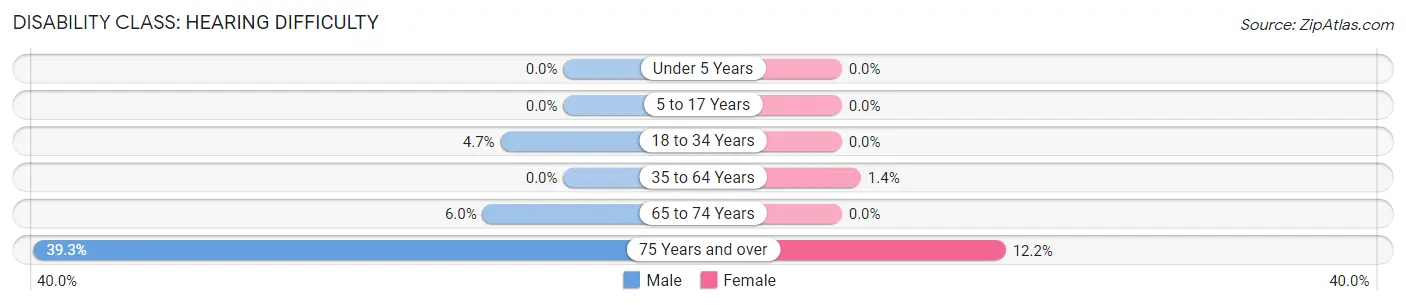
| Age Bracket | Male | Female |
| Under 5 Years | 0 (0.0%) | 0 (0.0%) |
| 5 to 17 Years | 0 (0.0%) | 0 (0.0%) |
| 18 to 34 Years | 5 (4.7%) | 0 (0.0%) |
| 35 to 64 Years | 0 (0.0%) | 5 (1.4%) |
| 65 to 74 Years | 3 (6.0%) | 0 (0.0%) |
| 75 Years and over | 24 (39.3%) | 14 (12.2%) |
Disability Class: Vision Difficulty
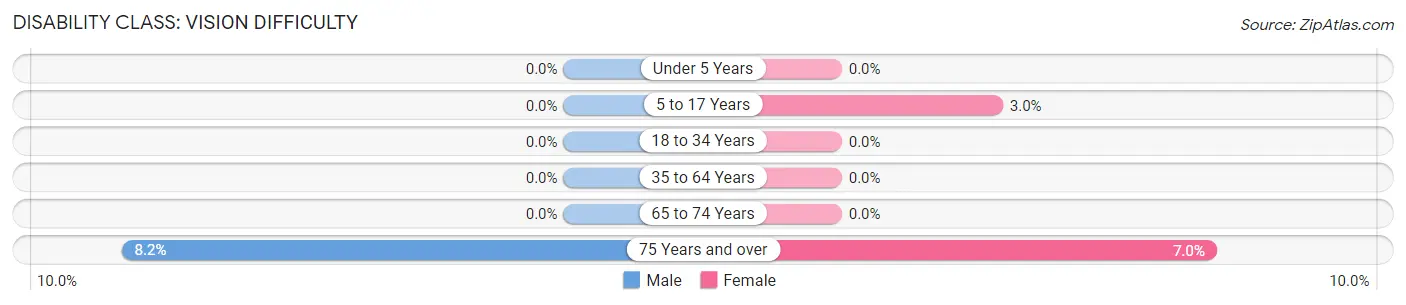
| Age Bracket | Male | Female |
| Under 5 Years | 0 (0.0%) | 0 (0.0%) |
| 5 to 17 Years | 0 (0.0%) | 5 (3.0%) |
| 18 to 34 Years | 0 (0.0%) | 0 (0.0%) |
| 35 to 64 Years | 0 (0.0%) | 0 (0.0%) |
| 65 to 74 Years | 0 (0.0%) | 0 (0.0%) |
| 75 Years and over | 5 (8.2%) | 8 (7.0%) |
Disability Class: Cognitive Difficulty
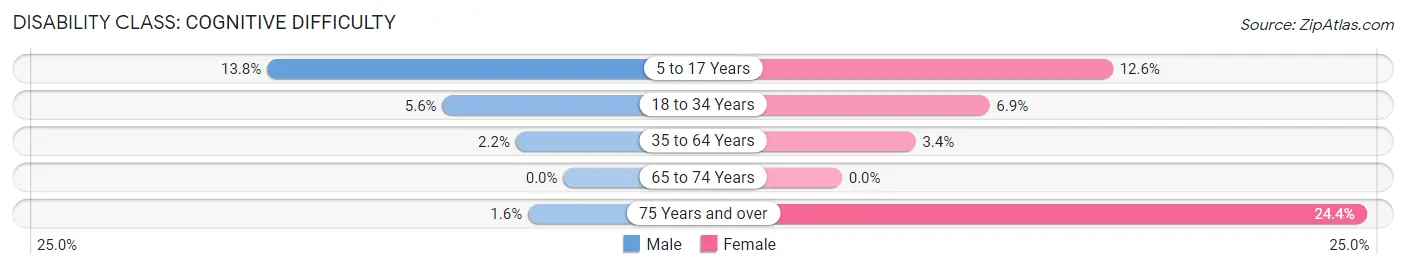
| Age Bracket | Male | Female |
| 5 to 17 Years | 22 (13.8%) | 21 (12.6%) |
| 18 to 34 Years | 6 (5.6%) | 15 (6.9%) |
| 35 to 64 Years | 8 (2.2%) | 12 (3.4%) |
| 65 to 74 Years | 0 (0.0%) | 0 (0.0%) |
| 75 Years and over | 1 (1.6%) | 28 (24.3%) |
Disability Class: Ambulatory Difficulty
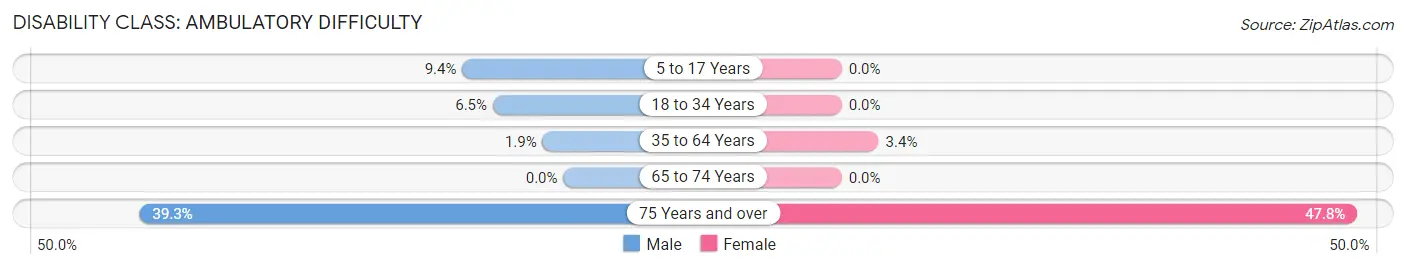
| Age Bracket | Male | Female |
| 5 to 17 Years | 15 (9.4%) | 0 (0.0%) |
| 18 to 34 Years | 7 (6.5%) | 0 (0.0%) |
| 35 to 64 Years | 7 (1.9%) | 12 (3.4%) |
| 65 to 74 Years | 0 (0.0%) | 0 (0.0%) |
| 75 Years and over | 24 (39.3%) | 55 (47.8%) |
Disability Class: Self-Care Difficulty
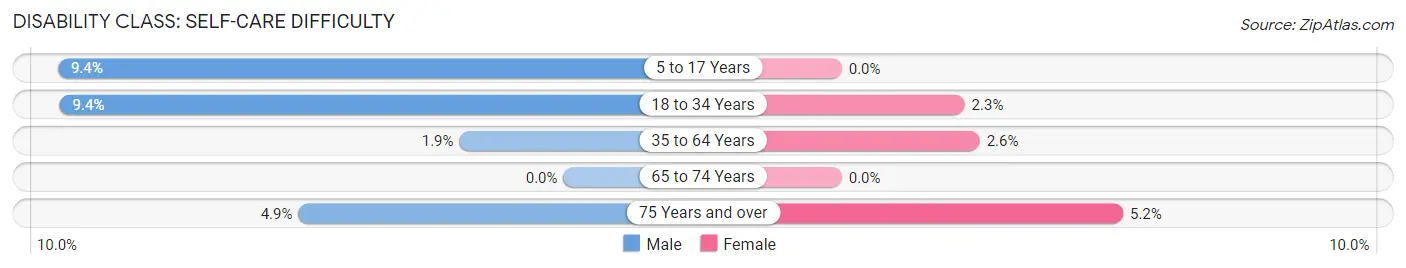
| Age Bracket | Male | Female |
| 5 to 17 Years | 15 (9.4%) | 0 (0.0%) |
| 18 to 34 Years | 10 (9.3%) | 5 (2.3%) |
| 35 to 64 Years | 7 (1.9%) | 9 (2.6%) |
| 65 to 74 Years | 0 (0.0%) | 0 (0.0%) |
| 75 Years and over | 3 (4.9%) | 6 (5.2%) |
Technology Access in St Lawrence borough
Computing Device Access in St Lawrence borough
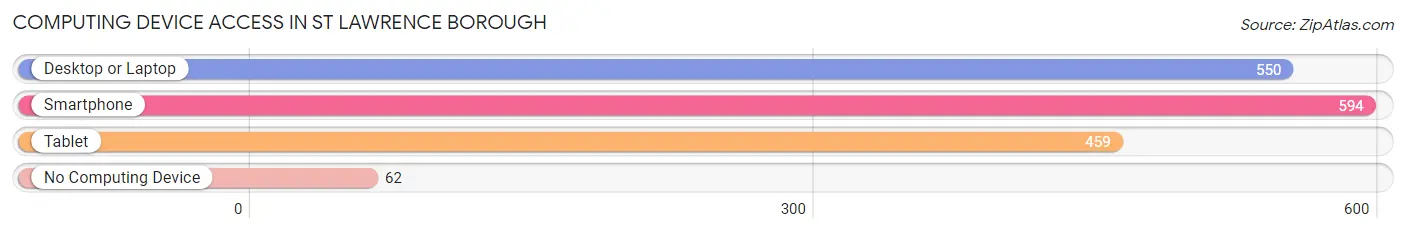
| Device Type | # Households | % Households |
| Desktop or Laptop | 550 | 76.6% |
| Smartphone | 594 | 82.7% |
| Tablet | 459 | 63.9% |
| No Computing Device | 62 | 8.6% |
| Total | 718 | 100.0% |
Internet Access in St Lawrence borough
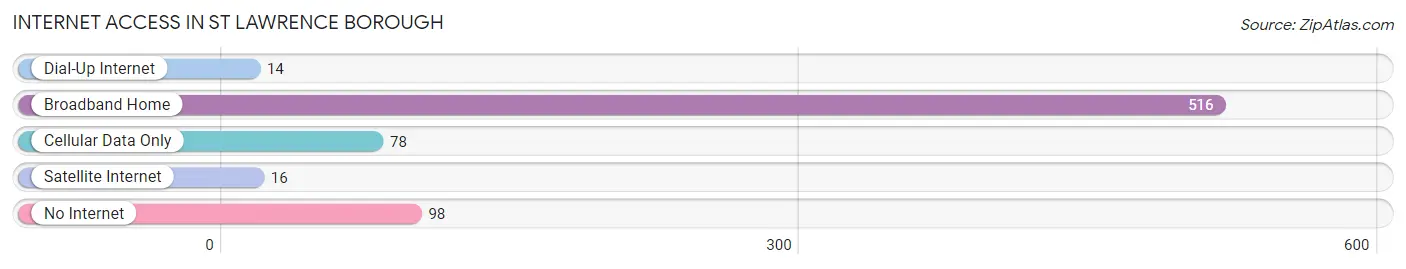
| Internet Type | # Households | % Households |
| Dial-Up Internet | 14 | 1.9% |
| Broadband Home | 516 | 71.9% |
| Cellular Data Only | 78 | 10.9% |
| Satellite Internet | 16 | 2.2% |
| No Internet | 98 | 13.7% |
| Total | 718 | 100.0% |
St Lawrence borough Summary
St. Lawrence Borough is a small borough located in Lawrence County, Pennsylvania. It is situated in the northwest corner of the county, and is bordered by the boroughs of New Castle and Shenango, as well as the townships of Neshannock and Union. The population of St. Lawrence Borough was 1,845 at the 2010 census.
History
St. Lawrence Borough was founded in 1876, when the area was still part of Mercer County. The borough was named after St. Lawrence Church, which was built in 1875. The church was named after St. Lawrence, the patron saint of the Roman Catholic Church.
The first settlers in the area were mostly of Irish and German descent. The area was primarily agricultural, and the main crops were wheat, corn, and oats. The first industry in the area was a sawmill, which was built in 1876.
In the late 19th century, the area began to develop into a small industrial center. The first industry was a glass factory, which was built in 1887. This was followed by a brickyard, a tannery, and a furniture factory.
Geography
St. Lawrence Borough is located at 41°14'45"N 80°25'45"W (41.245833, -80.429167). According to the United States Census Bureau, the borough has a total area of 0.7 square miles (1.8 km2), all of it land.
The borough is located in the northwest corner of Lawrence County, and is bordered by the boroughs of New Castle and Shenango, as well as the townships of Neshannock and Union.
Economy
The economy of St. Lawrence Borough is primarily based on manufacturing and services. The largest employers in the borough are the St. Lawrence Glass Company, the St. Lawrence Furniture Company, and the St. Lawrence Tannery.
The St. Lawrence Glass Company is the largest employer in the borough, and produces a variety of glass products, including bottles, jars, and windows. The St. Lawrence Furniture Company produces a variety of furniture, including bedroom sets, dining room sets, and office furniture. The St. Lawrence Tannery produces leather goods, such as wallets, belts, and purses.
Demographics
As of the 2010 census, there were 1,845 people, 745 households, and 486 families residing in the borough. The population density was 2,621.4 people per square mile (1,011.2/km2). There were 809 housing units at an average density of 1,145.7 per square mile (443.2/km2). The racial makeup of the borough was 97.2% White, 0.7% African American, 0.2% Native American, 0.2% Asian, 0.2% from other races, and 1.7% from two or more races. Hispanic or Latino of any race were 0.9% of the population.
There were 745 households, out of which 28.2% had children under the age of 18 living with them, 44.2% were married couples living together, 14.7% had a female householder with no husband present, and 35.2% were non-families. 30.2% of all households were made up of individuals, and 14.2% had someone living alone who was 65 years of age or older. The average household size was 2.45 and the average family size was 3.03.
In the borough, the population was spread out, with 24.2% under the age of 18, 8.2% from 18 to 24, 27.2% from 25 to 44, 24.2% from 45 to 64, and 16.2% who were 65 years of age or older. The median age was 38 years. For every 100 females, there were 91.2 males. For every 100 females age 18 and over, there were 87.2 males.
The median income for a household in the borough was $30,938, and the median income for a family was $37,500. Males had a median income of $30,000 versus $21,250 for females. The per capita income for the borough was $15,945. About 10.2% of families and 12.2% of the population were below the poverty line, including 16.2% of those under age 18 and 8.2% of those age 65 or over.
Common Questions
What is Per Capita Income in St Lawrence borough?
Per Capita income in St Lawrence borough is $34,363.
What is the Median Family Income in St Lawrence borough?
Median Family Income in St Lawrence borough is $89,250.
What is the Median Household income in St Lawrence borough?
Median Household Income in St Lawrence borough is $78,953.
What is Income or Wage Gap in St Lawrence borough?
Income or Wage Gap in St Lawrence borough is 35.1%.
Women in St Lawrence borough earn 64.9 cents for every dollar earned by a man.
What is Inequality or Gini Index in St Lawrence borough?
Inequality or Gini Index in St Lawrence borough is 0.37.
What is the Total Population of St Lawrence borough?
Total Population of St Lawrence borough is 1,780.
What is the Total Male Population of St Lawrence borough?
Total Male Population of St Lawrence borough is 772.
What is the Total Female Population of St Lawrence borough?
Total Female Population of St Lawrence borough is 1,008.
What is the Ratio of Males per 100 Females in St Lawrence borough?
There are 76.59 Males per 100 Females in St Lawrence borough.
What is the Ratio of Females per 100 Males in St Lawrence borough?
There are 130.57 Females per 100 Males in St Lawrence borough.
What is the Median Population Age in St Lawrence borough?
Median Population Age in St Lawrence borough is 38.2 Years.
What is the Average Family Size in St Lawrence borough
Average Family Size in St Lawrence borough is 3.2 People.
What is the Average Household Size in St Lawrence borough
Average Household Size in St Lawrence borough is 2.5 People.
How Large is the Labor Force in St Lawrence borough?
There are 919 People in the Labor Forcein in St Lawrence borough.
What is the Percentage of People in the Labor Force in St Lawrence borough?
66.2% of People are in the Labor Force in St Lawrence borough.
What is the Unemployment Rate in St Lawrence borough?
Unemployment Rate in St Lawrence borough is 4.7%.