Shoemakersville borough, PA Map & Demographics
Shoemakersville borough Overview
$35,308
PER CAPITA INCOME
$86,923
AVG FAMILY INCOME
$70,833
AVG HOUSEHOLD INCOME
35.3%
WAGE / INCOME GAP [ % ]
64.7¢/ $1
WAGE / INCOME GAP [ $ ]
0.36
INEQUALITY / GINI INDEX
1,427
TOTAL POPULATION
753
MALE POPULATION
674
FEMALE POPULATION
111.72
MALES / 100 FEMALES
89.51
FEMALES / 100 MALES
39.9
MEDIAN AGE
2.8
AVG FAMILY SIZE
2.3
AVG HOUSEHOLD SIZE
893
LABOR FORCE [ PEOPLE ]
75.7%
PERCENT IN LABOR FORCE
4.7%
UNEMPLOYMENT RATE
Income in Shoemakersville borough
Income Overview in Shoemakersville borough
Per Capita Income in Shoemakersville borough is $35,308, while median incomes of families and households are $86,923 and $70,833 respectively.
| Characteristic | Number | Measure |
| Per Capita Income | 1,427 | $35,308 |
| Median Family Income | 396 | $86,923 |
| Mean Family Income | 396 | $92,989 |
| Median Household Income | 622 | $70,833 |
| Mean Household Income | 622 | $79,421 |
| Income Deficit | 396 | $0 |
| Wage / Income Gap (%) | 1,427 | 35.34% |
| Wage / Income Gap ($) | 1,427 | 64.66¢ per $1 |
| Gini / Inequality Index | 1,427 | 0.36 |
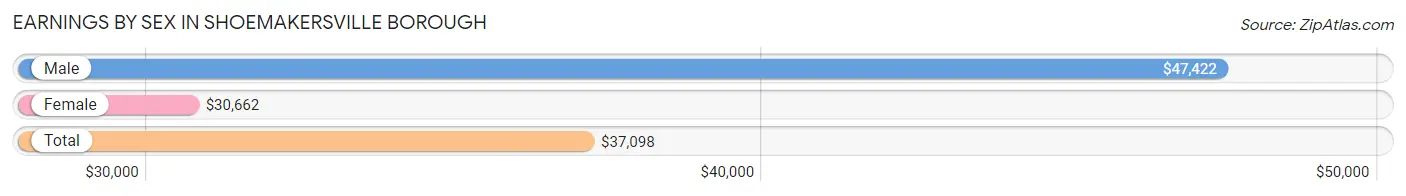
Earnings by Sex in Shoemakersville borough
Average Earnings in Shoemakersville borough are $37,098, $47,422 for men and $30,662 for women, a difference of 35.3%.
| Sex | Number | Average Earnings |
| Male | 500 (54.6%) | $47,422 |
| Female | 415 (45.4%) | $30,662 |
| Total | 915 (100.0%) | $37,098 |
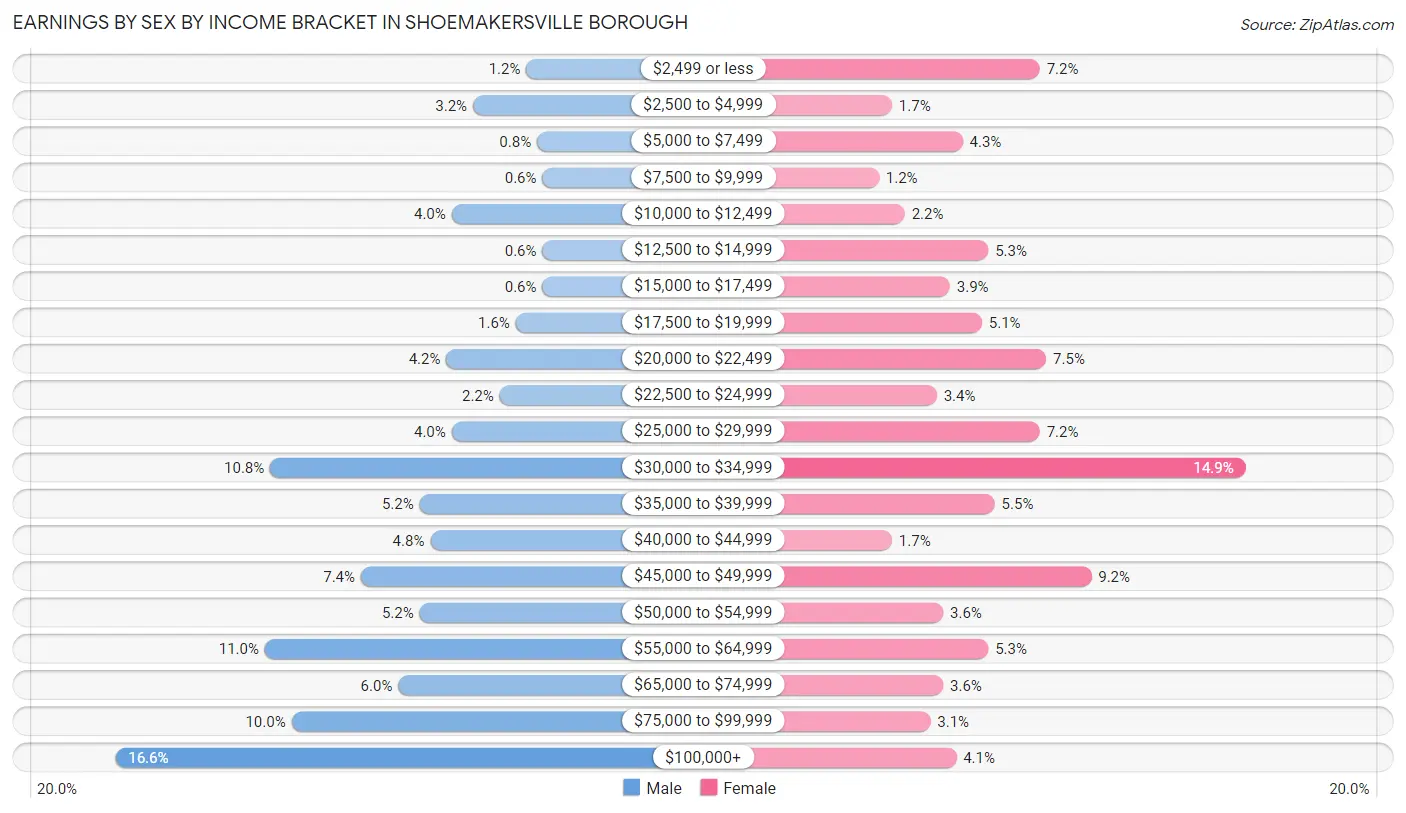
Earnings by Sex by Income Bracket in Shoemakersville borough
The most common earnings brackets in Shoemakersville borough are $100,000+ for men (83 | 16.6%) and $30,000 to $34,999 for women (62 | 14.9%).
| Income | Male | Female |
| $2,499 or less | 6 (1.2%) | 30 (7.2%) |
| $2,500 to $4,999 | 16 (3.2%) | 7 (1.7%) |
| $5,000 to $7,499 | 4 (0.8%) | 18 (4.3%) |
| $7,500 to $9,999 | 3 (0.6%) | 5 (1.2%) |
| $10,000 to $12,499 | 20 (4.0%) | 9 (2.2%) |
| $12,500 to $14,999 | 3 (0.6%) | 22 (5.3%) |
| $15,000 to $17,499 | 3 (0.6%) | 16 (3.9%) |
| $17,500 to $19,999 | 8 (1.6%) | 21 (5.1%) |
| $20,000 to $22,499 | 21 (4.2%) | 31 (7.5%) |
| $22,500 to $24,999 | 11 (2.2%) | 14 (3.4%) |
| $25,000 to $29,999 | 20 (4.0%) | 30 (7.2%) |
| $30,000 to $34,999 | 54 (10.8%) | 62 (14.9%) |
| $35,000 to $39,999 | 26 (5.2%) | 23 (5.5%) |
| $40,000 to $44,999 | 24 (4.8%) | 7 (1.7%) |
| $45,000 to $49,999 | 37 (7.4%) | 38 (9.2%) |
| $50,000 to $54,999 | 26 (5.2%) | 15 (3.6%) |
| $55,000 to $64,999 | 55 (11.0%) | 22 (5.3%) |
| $65,000 to $74,999 | 30 (6.0%) | 15 (3.6%) |
| $75,000 to $99,999 | 50 (10.0%) | 13 (3.1%) |
| $100,000+ | 83 (16.6%) | 17 (4.1%) |
| Total | 500 (100.0%) | 415 (100.0%) |
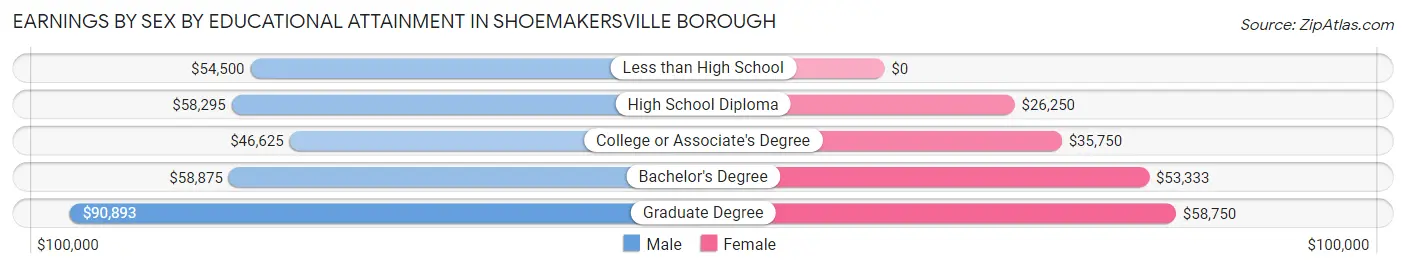
Earnings by Sex by Educational Attainment in Shoemakersville borough
Average earnings in Shoemakersville borough are $57,625 for men and $32,727 for women, a difference of 43.2%. Men with an educational attainment of graduate degree enjoy the highest average annual earnings of $90,893, while those with college or associate's degree education earn the least with $46,625. Women with an educational attainment of graduate degree earn the most with the average annual earnings of $58,750, while those with high school diploma education have the smallest earnings of $26,250.
| Educational Attainment | Male Income | Female Income |
| Less than High School | $54,500 | $0 |
| High School Diploma | $58,295 | $26,250 |
| College or Associate's Degree | $46,625 | $35,750 |
| Bachelor's Degree | $58,875 | $53,333 |
| Graduate Degree | $90,893 | $58,750 |
| Total | $57,625 | $32,727 |
Family Income in Shoemakersville borough
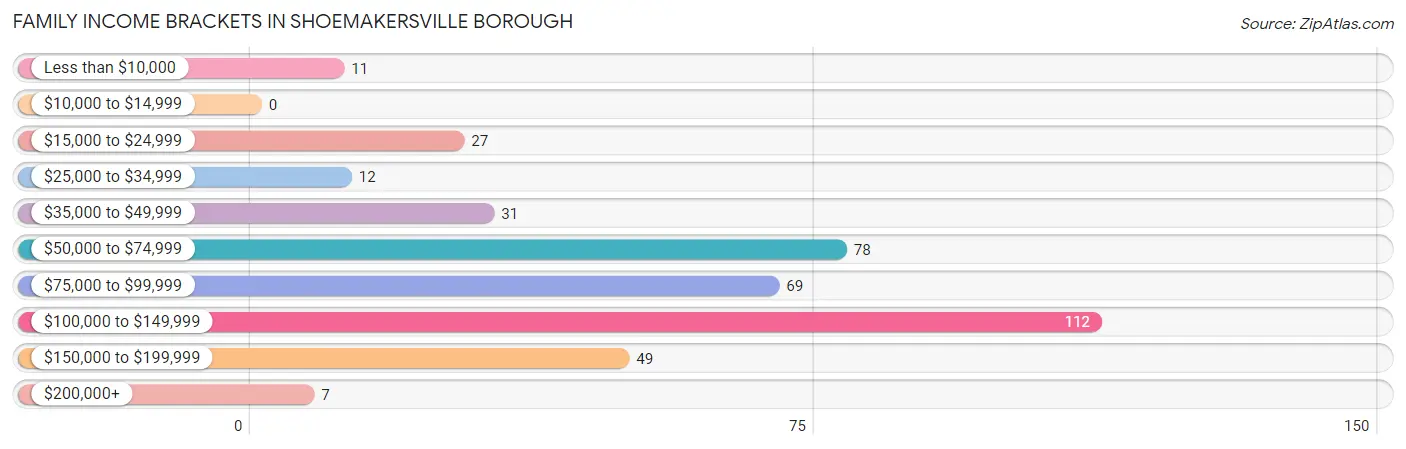
Family Income Brackets in Shoemakersville borough
According to the Shoemakersville borough family income data, there are 112 families falling into the $100,000 to $149,999 income range, which is the most common income bracket and makes up 28.3% of all families.
| Income Bracket | # Families | % Families |
| Less than $10,000 | 11 | 2.8% |
| $10,000 to $14,999 | 0 | 0.0% |
| $15,000 to $24,999 | 27 | 6.8% |
| $25,000 to $34,999 | 12 | 3.0% |
| $35,000 to $49,999 | 31 | 7.8% |
| $50,000 to $74,999 | 78 | 19.7% |
| $75,000 to $99,999 | 69 | 17.4% |
| $100,000 to $149,999 | 112 | 28.3% |
| $150,000 to $199,999 | 49 | 12.4% |
| $200,000+ | 7 | 1.8% |
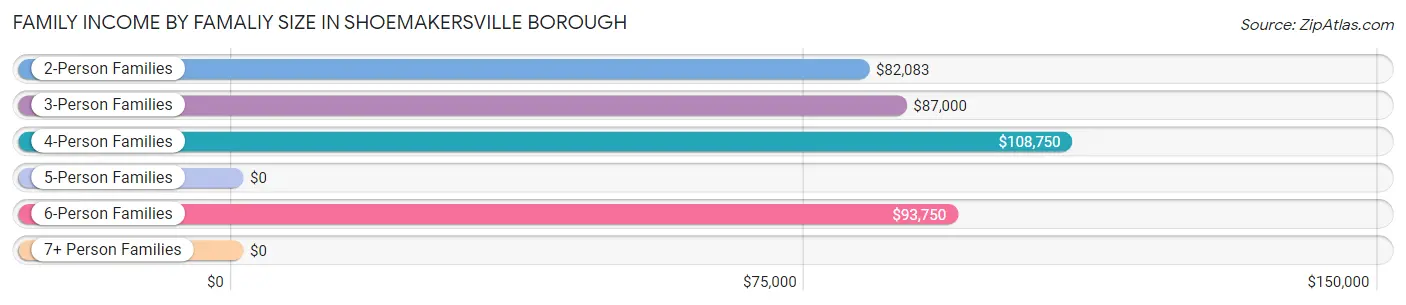
Family Income by Famaliy Size in Shoemakersville borough
4-person families (55 | 13.9%) account for the highest median family income in Shoemakersville borough with $108,750 per family, while 2-person families (224 | 56.6%) have the highest median income of $41,042 per family member.
| Income Bracket | # Families | Median Income |
| 2-Person Families | 224 (56.6%) | $82,083 |
| 3-Person Families | 88 (22.2%) | $87,000 |
| 4-Person Families | 55 (13.9%) | $108,750 |
| 5-Person Families | 15 (3.8%) | $0 |
| 6-Person Families | 14 (3.5%) | $93,750 |
| 7+ Person Families | 0 (0.0%) | $0 |
| Total | 396 (100.0%) | $86,923 |
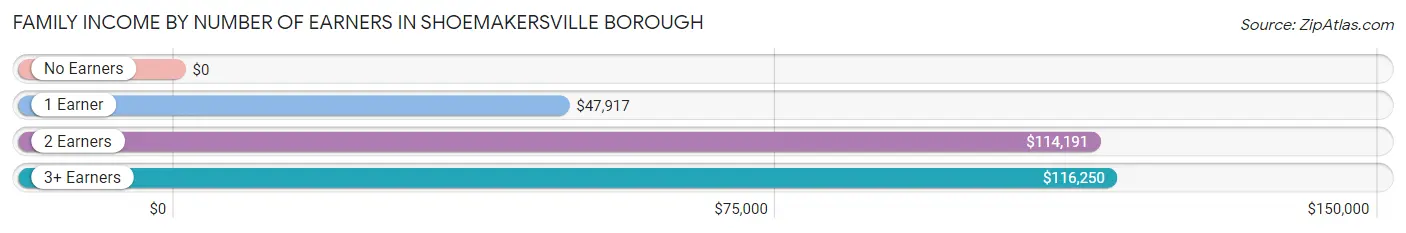
Family Income by Number of Earners in Shoemakersville borough
| Number of Earners | # Families | Median Income |
| No Earners | 31 (7.8%) | $0 |
| 1 Earner | 99 (25.0%) | $47,917 |
| 2 Earners | 213 (53.8%) | $114,191 |
| 3+ Earners | 53 (13.4%) | $116,250 |
| Total | 396 (100.0%) | $86,923 |
Household Income in Shoemakersville borough
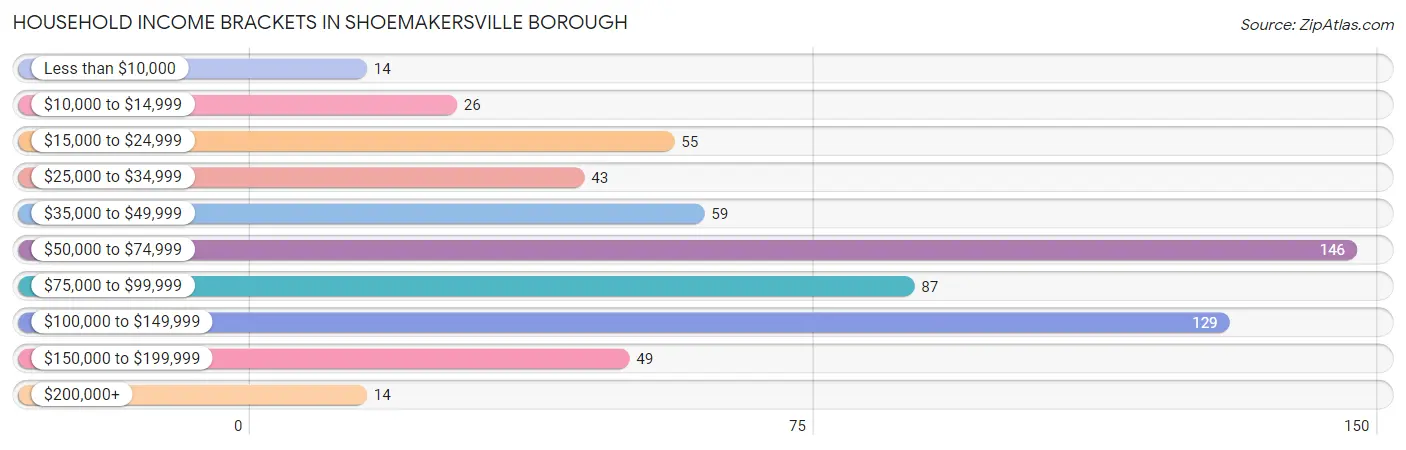
Household Income Brackets in Shoemakersville borough
With 146 households falling in the category, the $50,000 to $74,999 income range is the most frequent in Shoemakersville borough, accounting for 23.5% of all households. In contrast, only 14 households (2.2%) fall into the less than $10,000 income bracket, making it the least populous group.
| Income Bracket | # Households | % Households |
| Less than $10,000 | 14 | 2.3% |
| $10,000 to $14,999 | 26 | 4.2% |
| $15,000 to $24,999 | 55 | 8.8% |
| $25,000 to $34,999 | 43 | 6.9% |
| $35,000 to $49,999 | 59 | 9.5% |
| $50,000 to $74,999 | 146 | 23.5% |
| $75,000 to $99,999 | 87 | 14.0% |
| $100,000 to $149,999 | 129 | 20.7% |
| $150,000 to $199,999 | 49 | 7.9% |
| $200,000+ | 14 | 2.3% |
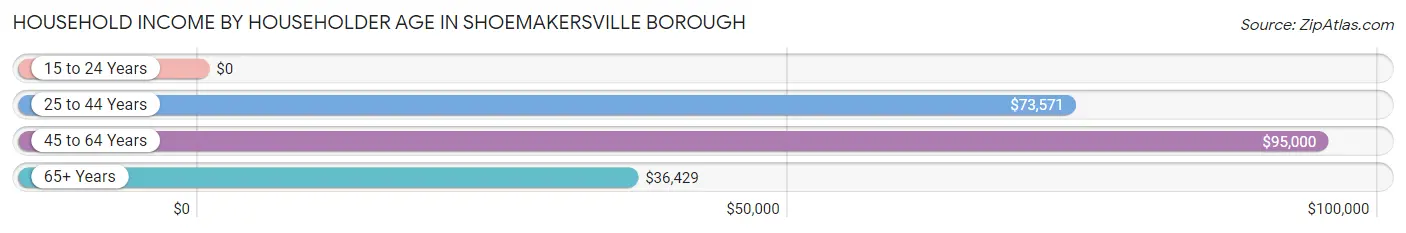
Household Income by Householder Age in Shoemakersville borough
The median household income in Shoemakersville borough is $70,833, with the highest median household income of $95,000 found in the 45 to 64 years age bracket for the primary householder. A total of 260 households (41.8%) fall into this category. Meanwhile, the 15 to 24 years age bracket for the primary householder has the lowest median household income of $0, with 26 households (4.2%) in this group.
| Income Bracket | # Households | Median Income |
| 15 to 24 Years | 26 (4.2%) | $0 |
| 25 to 44 Years | 186 (29.9%) | $73,571 |
| 45 to 64 Years | 260 (41.8%) | $95,000 |
| 65+ Years | 150 (24.1%) | $36,429 |
| Total | 622 (100.0%) | $70,833 |
Poverty in Shoemakersville borough
Income Below Poverty by Sex and Age in Shoemakersville borough
With 7.1% poverty level for males and 12.3% for females among the residents of Shoemakersville borough, 12 to 14 year old males and 15 year old females are the most vulnerable to poverty, with 8 males (23.5%) and 9 females (75.0%) in their respective age groups living below the poverty level.
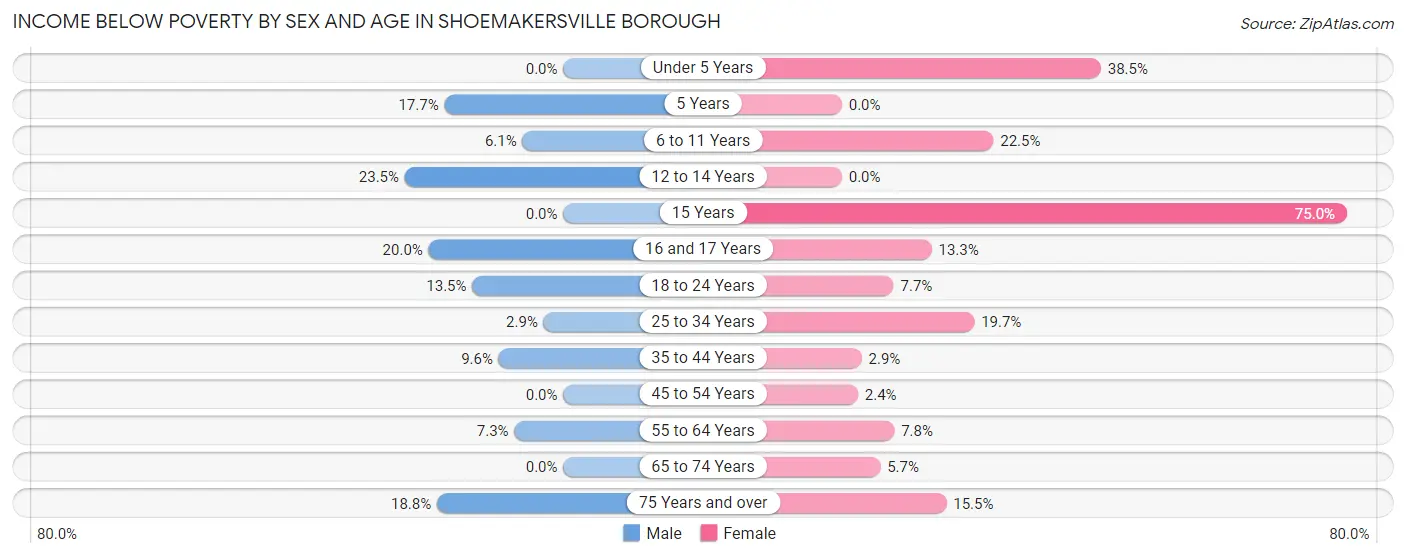
| Age Bracket | Male | Female |
| Under 5 Years | 0 (0.0%) | 10 (38.5%) |
| 5 Years | 3 (17.6%) | 0 (0.0%) |
| 6 to 11 Years | 4 (6.1%) | 9 (22.5%) |
| 12 to 14 Years | 8 (23.5%) | 0 (0.0%) |
| 15 Years | 0 (0.0%) | 9 (75.0%) |
| 16 and 17 Years | 3 (20.0%) | 4 (13.3%) |
| 18 to 24 Years | 10 (13.5%) | 3 (7.7%) |
| 25 to 34 Years | 3 (2.9%) | 23 (19.7%) |
| 35 to 44 Years | 7 (9.6%) | 2 (2.9%) |
| 45 to 54 Years | 0 (0.0%) | 3 (2.4%) |
| 55 to 64 Years | 9 (7.3%) | 6 (7.8%) |
| 65 to 74 Years | 0 (0.0%) | 4 (5.7%) |
| 75 Years and over | 6 (18.8%) | 9 (15.5%) |
| Total | 53 (7.1%) | 82 (12.3%) |
Income Above Poverty by Sex and Age in Shoemakersville borough
According to the poverty statistics in Shoemakersville borough, males aged under 5 years and females aged 5 years are the age groups that are most secure financially, with 100.0% of males and 100.0% of females in these age groups living above the poverty line.
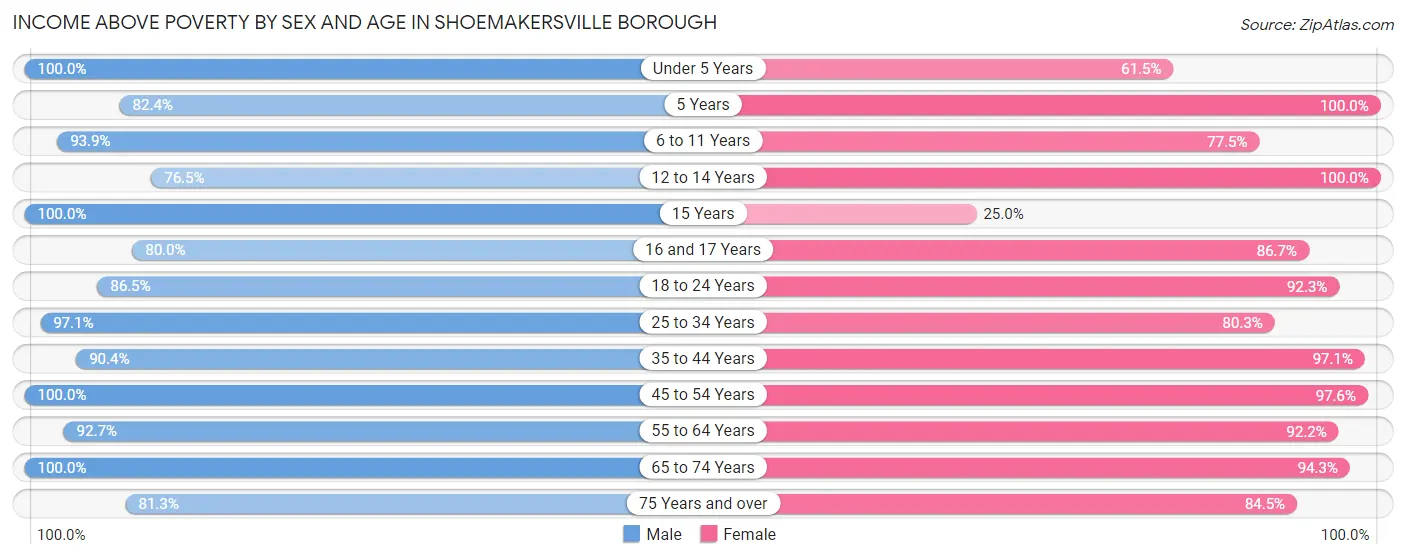
| Age Bracket | Male | Female |
| Under 5 Years | 30 (100.0%) | 16 (61.5%) |
| 5 Years | 14 (82.4%) | 3 (100.0%) |
| 6 to 11 Years | 62 (93.9%) | 31 (77.5%) |
| 12 to 14 Years | 26 (76.5%) | 2 (100.0%) |
| 15 Years | 10 (100.0%) | 3 (25.0%) |
| 16 and 17 Years | 12 (80.0%) | 26 (86.7%) |
| 18 to 24 Years | 64 (86.5%) | 36 (92.3%) |
| 25 to 34 Years | 100 (97.1%) | 94 (80.3%) |
| 35 to 44 Years | 66 (90.4%) | 66 (97.1%) |
| 45 to 54 Years | 117 (100.0%) | 123 (97.6%) |
| 55 to 64 Years | 115 (92.7%) | 71 (92.2%) |
| 65 to 74 Years | 56 (100.0%) | 66 (94.3%) |
| 75 Years and over | 26 (81.2%) | 49 (84.5%) |
| Total | 698 (92.9%) | 586 (87.7%) |
Income Below Poverty Among Married-Couple Families in Shoemakersville borough
The poverty statistics for married-couple families in Shoemakersville borough show that 2.1% or 6 of the total 291 families live below the poverty line. Families with no children have the highest poverty rate of 2.9%, comprising of 6 families. On the other hand, families with 1 or 2 children have the lowest poverty rate of 0.0%, which includes 0 families.
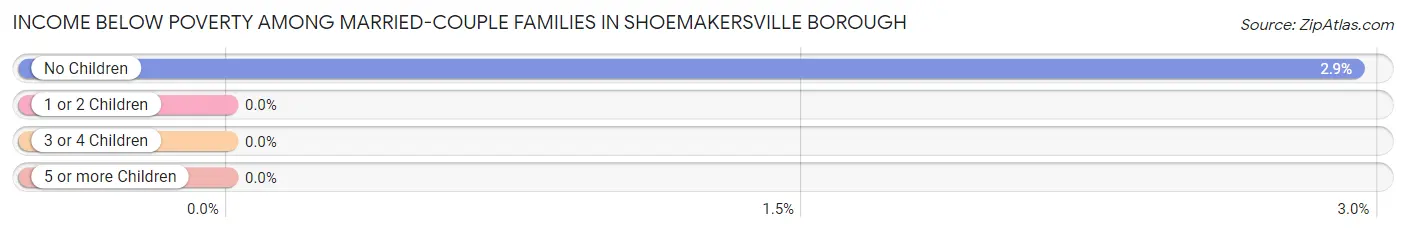
| Children | Above Poverty | Below Poverty |
| No Children | 198 (97.1%) | 6 (2.9%) |
| 1 or 2 Children | 72 (100.0%) | 0 (0.0%) |
| 3 or 4 Children | 15 (100.0%) | 0 (0.0%) |
| 5 or more Children | 0 (0.0%) | 0 (0.0%) |
| Total | 285 (97.9%) | 6 (2.1%) |
Income Below Poverty Among Single-Parent Households in Shoemakersville borough
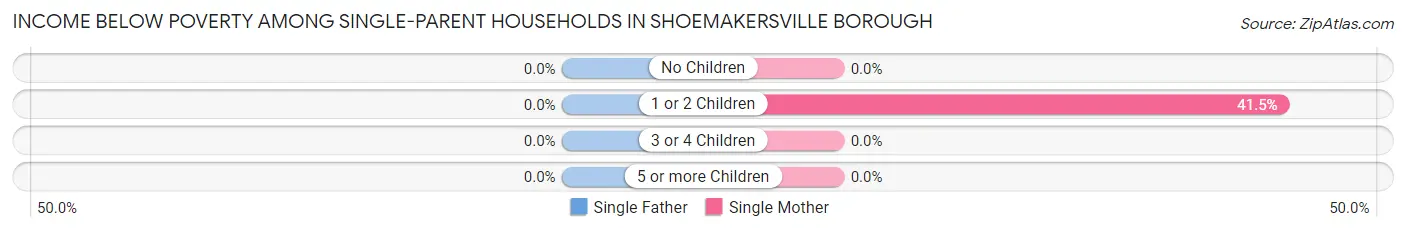
| Children | Single Father | Single Mother |
| No Children | 0 (0.0%) | 0 (0.0%) |
| 1 or 2 Children | 0 (0.0%) | 22 (41.5%) |
| 3 or 4 Children | 0 (0.0%) | 0 (0.0%) |
| 5 or more Children | 0 (0.0%) | 0 (0.0%) |
| Total | 0 (0.0%) | 22 (32.8%) |
Income Below Poverty Among Married-Couple vs Single-Parent Households in Shoemakersville borough
The poverty data for Shoemakersville borough shows that 6 of the married-couple family households (2.1%) and 22 of the single-parent households (20.9%) are living below the poverty level. Within the married-couple family households, those with no children have the highest poverty rate, with 6 households (2.9%) falling below the poverty line. Among the single-parent households, those with 1 or 2 children have the highest poverty rate, with 22 household (31.9%) living below poverty.
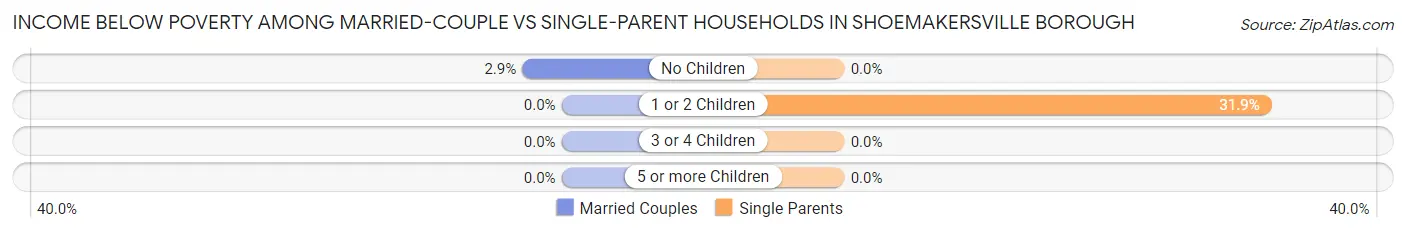
| Children | Married-Couple Families | Single-Parent Households |
| No Children | 6 (2.9%) | 0 (0.0%) |
| 1 or 2 Children | 0 (0.0%) | 22 (31.9%) |
| 3 or 4 Children | 0 (0.0%) | 0 (0.0%) |
| 5 or more Children | 0 (0.0%) | 0 (0.0%) |
| Total | 6 (2.1%) | 22 (20.9%) |
Race in Shoemakersville borough
The most populous races in Shoemakersville borough are White / Caucasian (1,330 | 93.2%), Hispanic or Latino (103 | 7.2%), and Two or more Races (60 | 4.2%).
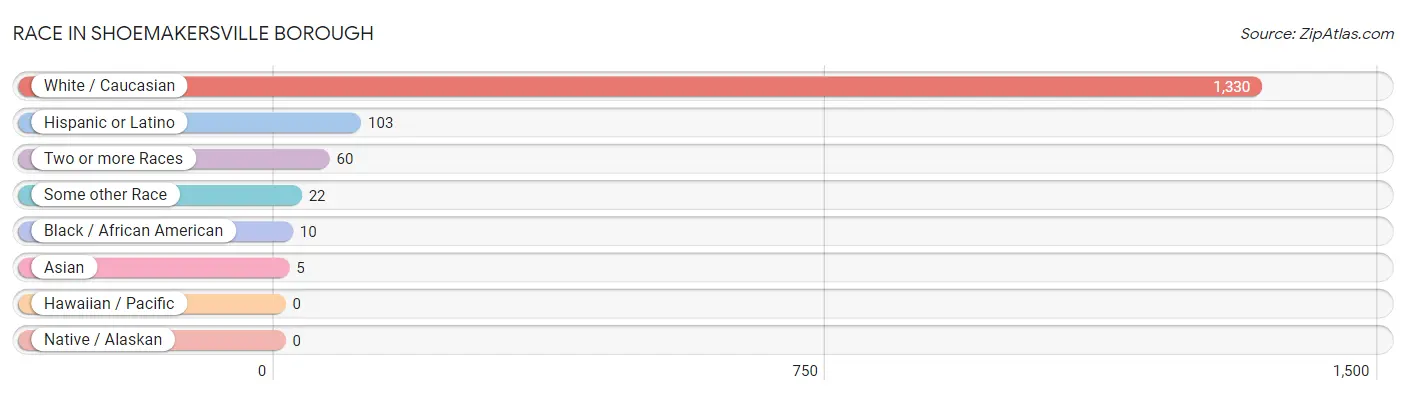
| Race | # Population | % Population |
| Asian | 5 | 0.4% |
| Black / African American | 10 | 0.7% |
| Hawaiian / Pacific | 0 | 0.0% |
| Hispanic or Latino | 103 | 7.2% |
| Native / Alaskan | 0 | 0.0% |
| White / Caucasian | 1,330 | 93.2% |
| Two or more Races | 60 | 4.2% |
| Some other Race | 22 | 1.5% |
| Total | 1,427 | 100.0% |
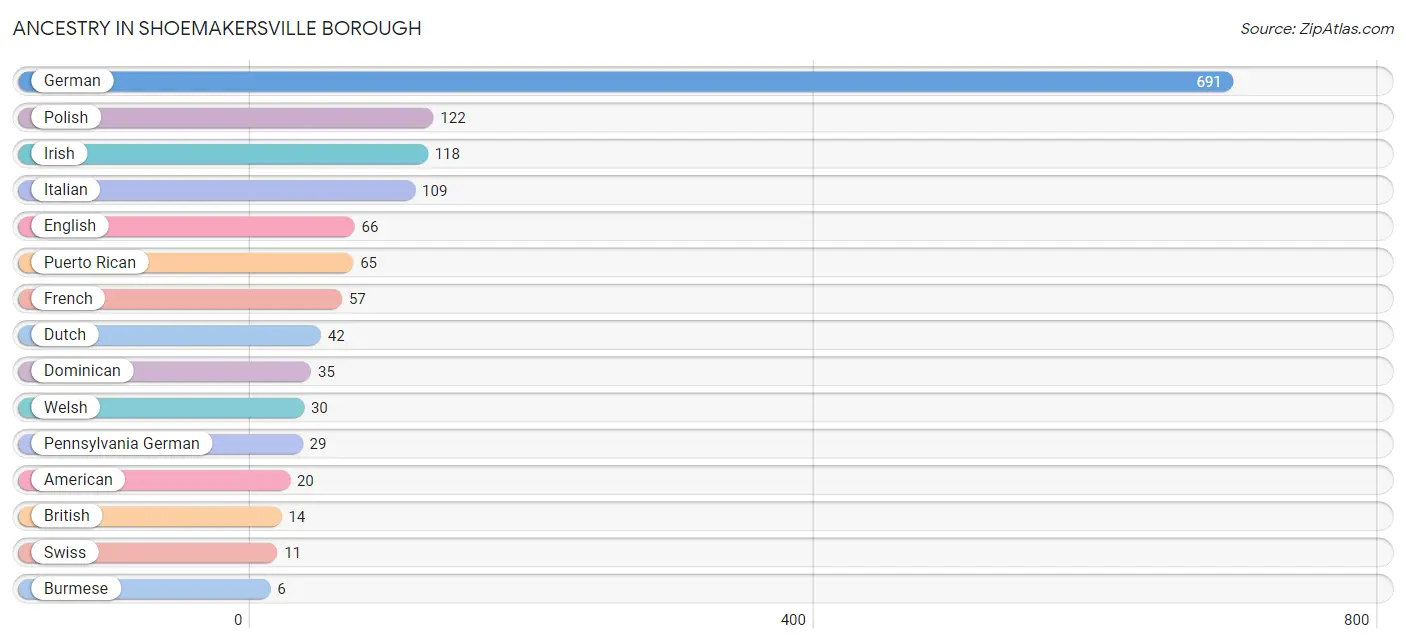
Ancestry in Shoemakersville borough
The most populous ancestries reported in Shoemakersville borough are German (691 | 48.4%), Polish (122 | 8.6%), Irish (118 | 8.3%), Italian (109 | 7.6%), and English (66 | 4.6%), together accounting for 77.5% of all Shoemakersville borough residents.
| Ancestry | # Population | % Population |
| American | 20 | 1.4% |
| Belgian | 3 | 0.2% |
| British | 14 | 1.0% |
| Burmese | 6 | 0.4% |
| Dominican | 35 | 2.5% |
| Dutch | 42 | 2.9% |
| Eastern European | 4 | 0.3% |
| English | 66 | 4.6% |
| French | 57 | 4.0% |
| German | 691 | 48.4% |
| Greek | 3 | 0.2% |
| Indian (Asian) | 2 | 0.1% |
| Irish | 118 | 8.3% |
| Italian | 109 | 7.6% |
| Lithuanian | 2 | 0.1% |
| Pennsylvania German | 29 | 2.0% |
| Polish | 122 | 8.6% |
| Puerto Rican | 65 | 4.6% |
| Russian | 3 | 0.2% |
| Scotch-Irish | 1 | 0.1% |
| Scottish | 6 | 0.4% |
| Spaniard | 3 | 0.2% |
| Swedish | 3 | 0.2% |
| Swiss | 11 | 0.8% |
| Vietnamese | 3 | 0.2% |
| Welsh | 30 | 2.1% | View All 26 Rows |
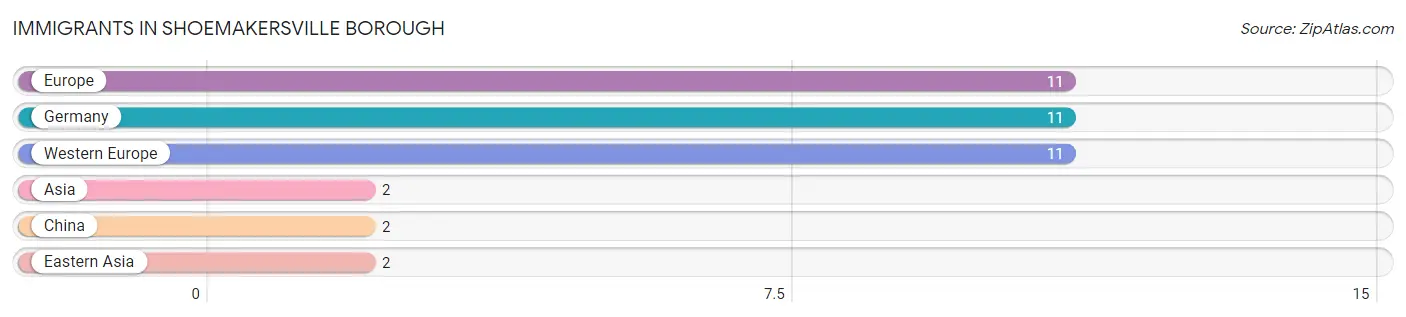
Immigrants in Shoemakersville borough
The most numerous immigrant groups reported in Shoemakersville borough came from Europe (11 | 0.8%), Germany (11 | 0.8%), Western Europe (11 | 0.8%), Asia (2 | 0.1%), and China (2 | 0.1%), together accounting for 2.6% of all Shoemakersville borough residents.
| Immigration Origin | # Population | % Population |
| Asia | 2 | 0.1% |
| China | 2 | 0.1% |
| Eastern Asia | 2 | 0.1% |
| Europe | 11 | 0.8% |
| Germany | 11 | 0.8% |
| Western Europe | 11 | 0.8% | View All 6 Rows |
Sex and Age in Shoemakersville borough
Sex and Age in Shoemakersville borough
The most populous age groups in Shoemakersville borough are 55 to 59 Years (74 | 9.8%) for men and 45 to 49 Years (71 | 10.5%) for women.
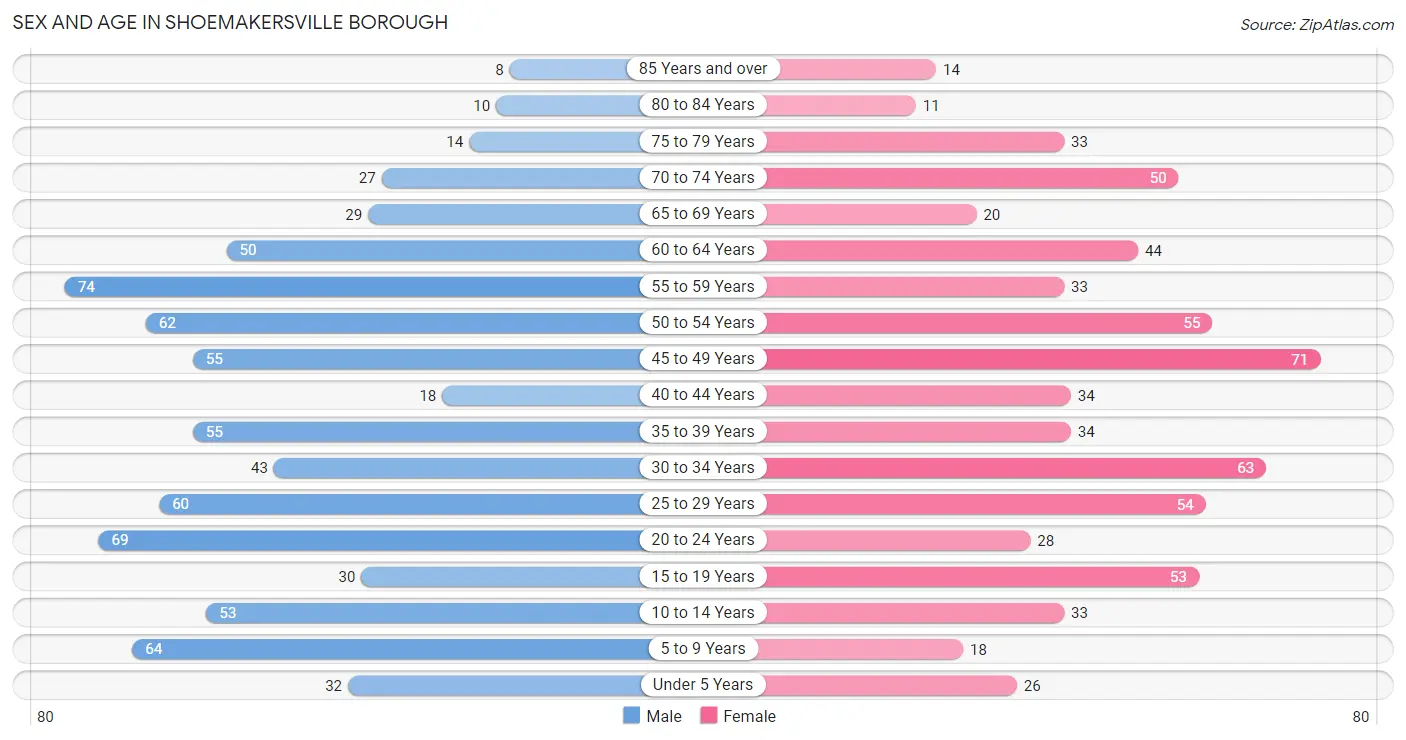
| Age Bracket | Male | Female |
| Under 5 Years | 32 (4.3%) | 26 (3.9%) |
| 5 to 9 Years | 64 (8.5%) | 18 (2.7%) |
| 10 to 14 Years | 53 (7.0%) | 33 (4.9%) |
| 15 to 19 Years | 30 (4.0%) | 53 (7.9%) |
| 20 to 24 Years | 69 (9.2%) | 28 (4.2%) |
| 25 to 29 Years | 60 (8.0%) | 54 (8.0%) |
| 30 to 34 Years | 43 (5.7%) | 63 (9.3%) |
| 35 to 39 Years | 55 (7.3%) | 34 (5.0%) |
| 40 to 44 Years | 18 (2.4%) | 34 (5.0%) |
| 45 to 49 Years | 55 (7.3%) | 71 (10.5%) |
| 50 to 54 Years | 62 (8.2%) | 55 (8.2%) |
| 55 to 59 Years | 74 (9.8%) | 33 (4.9%) |
| 60 to 64 Years | 50 (6.6%) | 44 (6.5%) |
| 65 to 69 Years | 29 (3.8%) | 20 (3.0%) |
| 70 to 74 Years | 27 (3.6%) | 50 (7.4%) |
| 75 to 79 Years | 14 (1.9%) | 33 (4.9%) |
| 80 to 84 Years | 10 (1.3%) | 11 (1.6%) |
| 85 Years and over | 8 (1.1%) | 14 (2.1%) |
| Total | 753 (100.0%) | 674 (100.0%) |
Families and Households in Shoemakersville borough
Median Family Size in Shoemakersville borough
The median family size in Shoemakersville borough is 2.83 persons per family, with single male/father families (38 | 9.6%) accounting for the largest median family size of 2.95 persons per family. On the other hand, single female/mother families (67 | 16.9%) represent the smallest median family size with 2.60 persons per family.
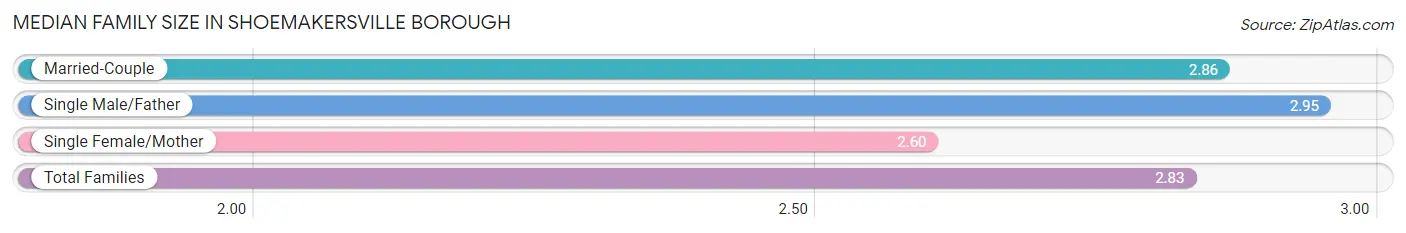
| Family Type | # Families | Family Size |
| Married-Couple | 291 (73.5%) | 2.86 |
| Single Male/Father | 38 (9.6%) | 2.95 |
| Single Female/Mother | 67 (16.9%) | 2.60 |
| Total Families | 396 (100.0%) | 2.83 |
Median Household Size in Shoemakersville borough
The median household size in Shoemakersville borough is 2.29 persons per household, with single male/father households (38 | 6.1%) accounting for the largest median household size of 3.26 persons per household. non-family households (226 | 36.3%) represent the smallest median household size with 1.21 persons per household.
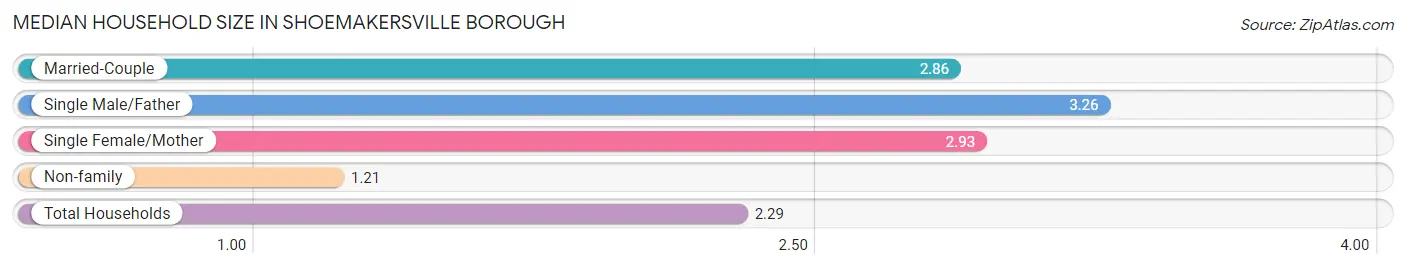
| Household Type | # Households | Household Size |
| Married-Couple | 291 (46.8%) | 2.86 |
| Single Male/Father | 38 (6.1%) | 3.26 |
| Single Female/Mother | 67 (10.8%) | 2.93 |
| Non-family | 226 (36.3%) | 1.21 |
| Total Households | 622 (100.0%) | 2.29 |
Household Size by Marriage Status in Shoemakersville borough
Out of a total of 622 households in Shoemakersville borough, 396 (63.7%) are family households, while 226 (36.3%) are nonfamily households. The most numerous type of family households are 2-person households, comprising 213, and the most common type of nonfamily households are 1-person households, comprising 188.
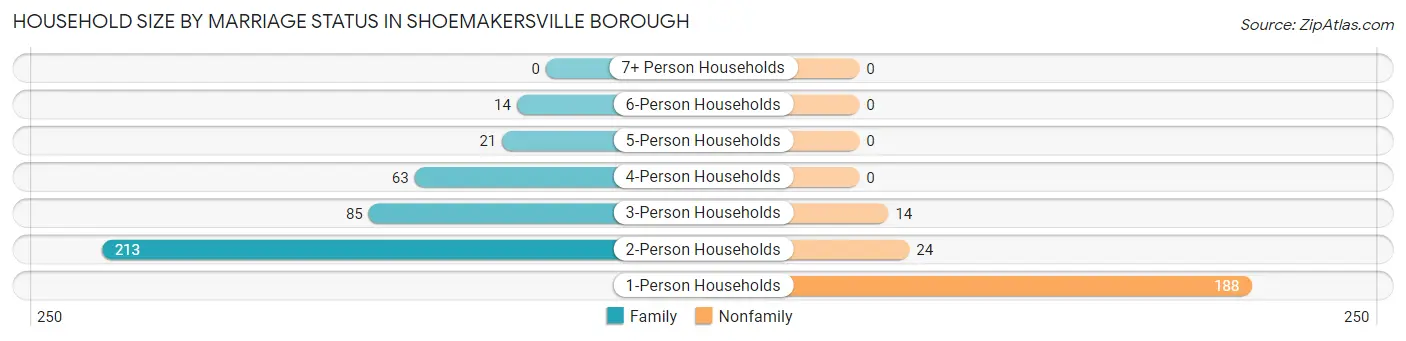
| Household Size | Family Households | Nonfamily Households |
| 1-Person Households | - | 188 (30.2%) |
| 2-Person Households | 213 (34.2%) | 24 (3.9%) |
| 3-Person Households | 85 (13.7%) | 14 (2.2%) |
| 4-Person Households | 63 (10.1%) | 0 (0.0%) |
| 5-Person Households | 21 (3.4%) | 0 (0.0%) |
| 6-Person Households | 14 (2.2%) | 0 (0.0%) |
| 7+ Person Households | 0 (0.0%) | 0 (0.0%) |
| Total | 396 (63.7%) | 226 (36.3%) |
Female Fertility in Shoemakersville borough
Fertility by Age in Shoemakersville borough
Average fertility rate in Shoemakersville borough is 24.0 births per 1,000 women. Women in the age bracket of 20 to 34 years have the highest fertility rate with 62.0 births per 1,000 women. Women in the age bracket of 20 to 34 years acount for 100.0% of all women with births.
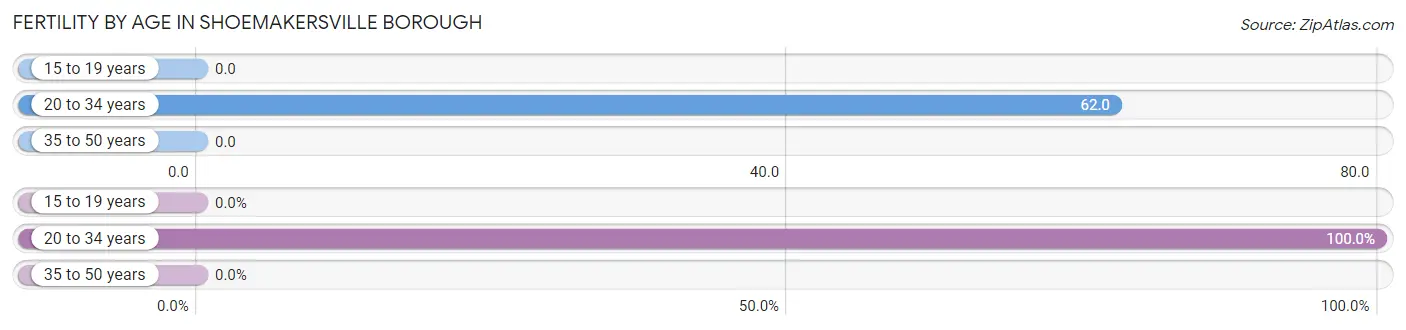
| Age Bracket | Women with Births | Births / 1,000 Women |
| 15 to 19 years | 0 (0.0%) | 0.0 |
| 20 to 34 years | 9 (100.0%) | 62.0 |
| 35 to 50 years | 0 (0.0%) | 0.0 |
| Total | 9 (100.0%) | 24.0 |
Fertility by Age by Marriage Status in Shoemakersville borough
22.2% of women with births (9) in Shoemakersville borough are married. The highest percentage of unmarried women with births falls into 20 to 34 years age bracket with 77.8% of them unmarried at the time of birth, while the lowest percentage of unmarried women with births belong to 20 to 34 years age bracket with 77.8% of them unmarried.
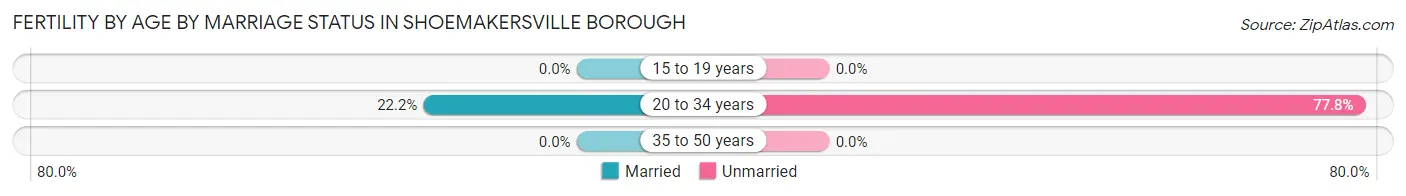
| Age Bracket | Married | Unmarried |
| 15 to 19 years | 0 (0.0%) | 0 (0.0%) |
| 20 to 34 years | 2 (22.2%) | 7 (77.8%) |
| 35 to 50 years | 0 (0.0%) | 0 (0.0%) |
| Total | 2 (22.2%) | 7 (77.8%) |
Fertility by Education in Shoemakersville borough
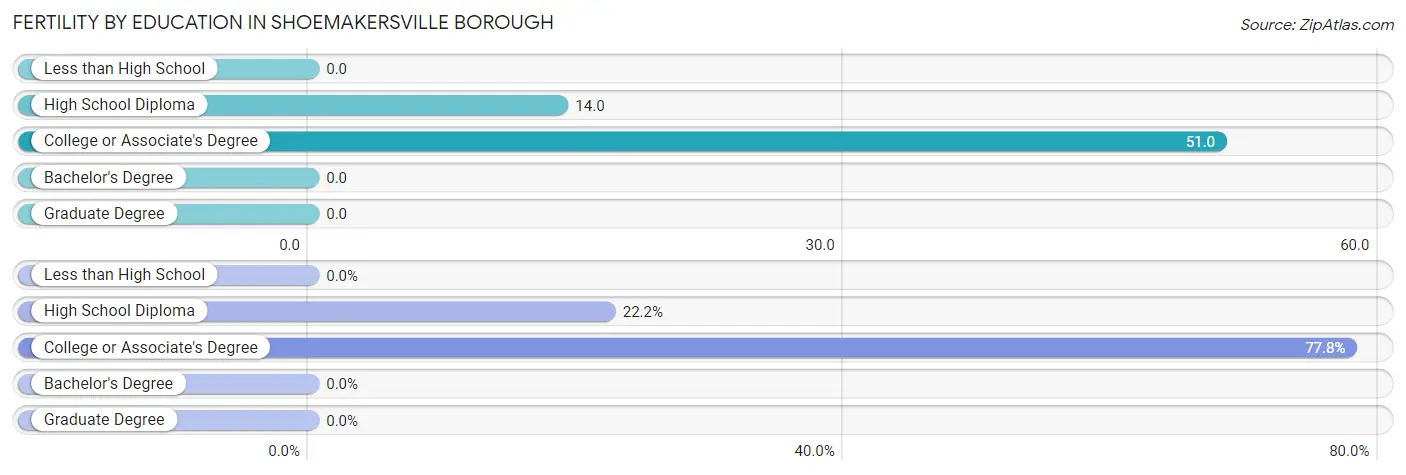
| Educational Attainment | Women with Births | Births / 1,000 Women |
| Less than High School | 0 (0.0%) | 0.0 |
| High School Diploma | 2 (22.2%) | 14.0 |
| College or Associate's Degree | 7 (77.8%) | 51.0 |
| Bachelor's Degree | 0 (0.0%) | 0.0 |
| Graduate Degree | 0 (0.0%) | 0.0 |
| Total | 9 (100.0%) | 24.0 |
Fertility by Education by Marriage Status in Shoemakersville borough
77.8% of women with births in Shoemakersville borough are unmarried. Women with the educational attainment of high school diploma are most likely to be married with 100.0% of them married at childbirth, while women with the educational attainment of college or associate's degree are least likely to be married with 100.0% of them unmarried at childbirth.
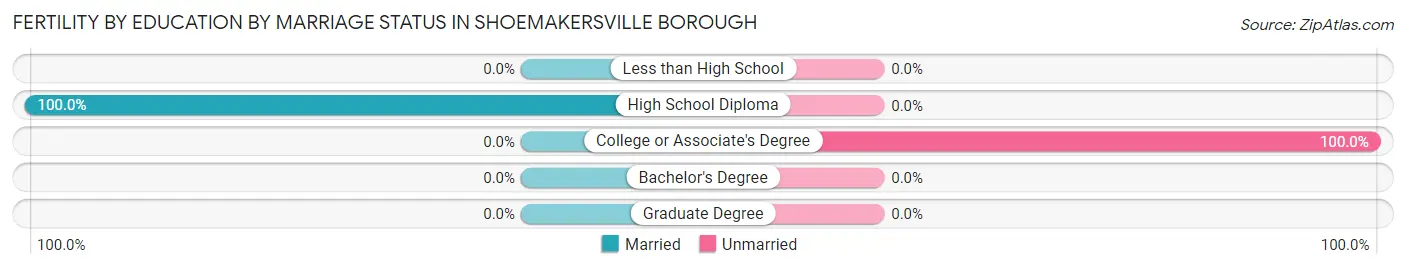
| Educational Attainment | Married | Unmarried |
| Less than High School | 0 (0.0%) | 0 (0.0%) |
| High School Diploma | 2 (100.0%) | 0 (0.0%) |
| College or Associate's Degree | 0 (0.0%) | 7 (100.0%) |
| Bachelor's Degree | 0 (0.0%) | 0 (0.0%) |
| Graduate Degree | 0 (0.0%) | 0 (0.0%) |
| Total | 2 (22.2%) | 7 (77.8%) |
Employment Characteristics in Shoemakersville borough
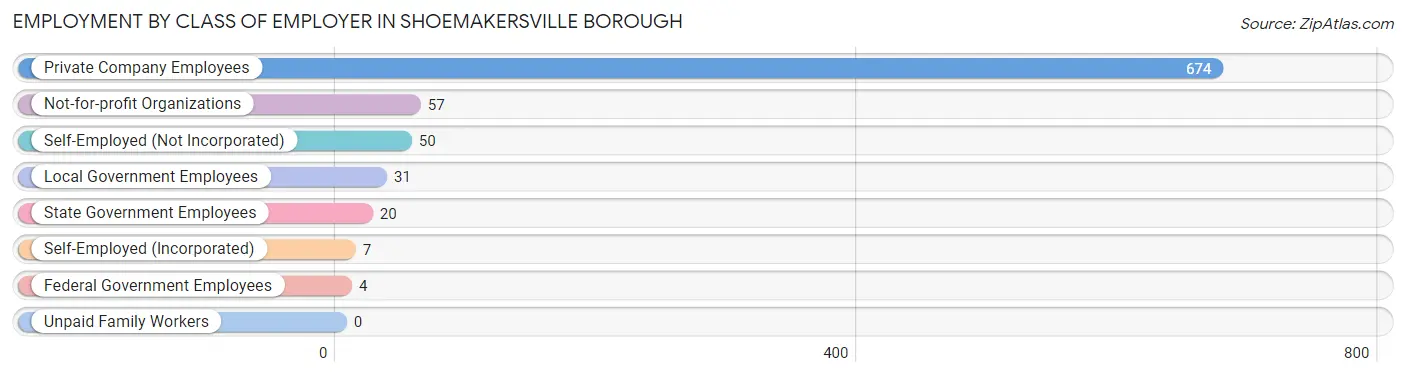
Employment by Class of Employer in Shoemakersville borough
Among the 843 employed individuals in Shoemakersville borough, private company employees (674 | 79.9%), not-for-profit organizations (57 | 6.8%), and self-employed (not incorporated) (50 | 5.9%) make up the most common classes of employment.
| Employer Class | # Employees | % Employees |
| Private Company Employees | 674 | 79.9% |
| Self-Employed (Incorporated) | 7 | 0.8% |
| Self-Employed (Not Incorporated) | 50 | 5.9% |
| Not-for-profit Organizations | 57 | 6.8% |
| Local Government Employees | 31 | 3.7% |
| State Government Employees | 20 | 2.4% |
| Federal Government Employees | 4 | 0.5% |
| Unpaid Family Workers | 0 | 0.0% |
| Total | 843 | 100.0% |
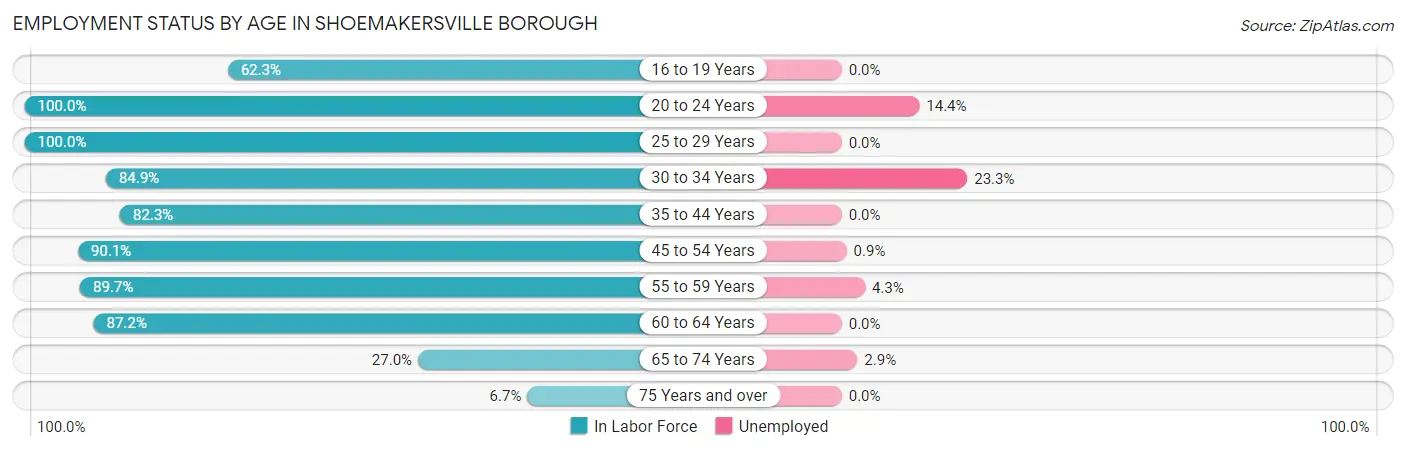
Employment Status by Age in Shoemakersville borough
According to the labor force statistics for Shoemakersville borough, out of the total population over 16 years of age (1,179), 75.7% or 893 individuals are in the labor force, with 4.7% or 42 of them unemployed. The age group with the highest labor force participation rate is 20 to 24 years, with 100.0% or 97 individuals in the labor force. Within the labor force, the 30 to 34 years age range has the highest percentage of unemployed individuals, with 23.3% or 21 of them being unemployed.
| Age Bracket | In Labor Force | Unemployed |
| 16 to 19 Years | 38 (62.3%) | 0 (0.0%) |
| 20 to 24 Years | 97 (100.0%) | 14 (14.4%) |
| 25 to 29 Years | 114 (100.0%) | 0 (0.0%) |
| 30 to 34 Years | 90 (84.9%) | 21 (23.3%) |
| 35 to 44 Years | 116 (82.3%) | 0 (0.0%) |
| 45 to 54 Years | 219 (90.1%) | 2 (0.9%) |
| 55 to 59 Years | 96 (89.7%) | 4 (4.3%) |
| 60 to 64 Years | 82 (87.2%) | 0 (0.0%) |
| 65 to 74 Years | 34 (27.0%) | 1 (2.9%) |
| 75 Years and over | 6 (6.7%) | 0 (0.0%) |
| Total | 893 (75.7%) | 42 (4.7%) |
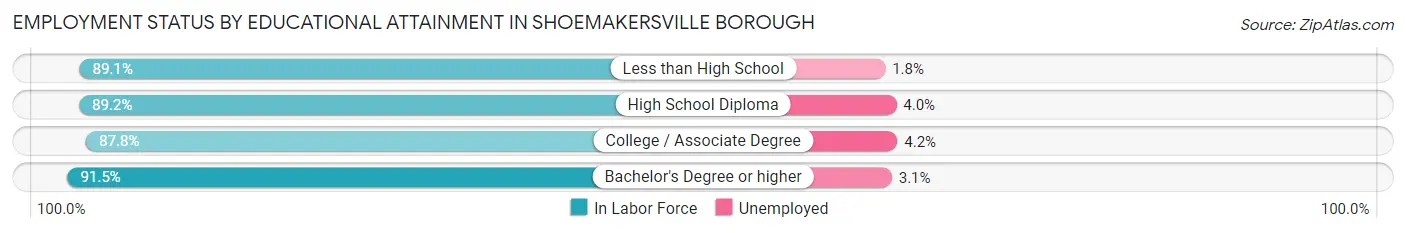
Employment Status by Educational Attainment in Shoemakersville borough
According to labor force statistics for Shoemakersville borough, 89.1% of individuals (717) out of the total population between 25 and 64 years of age (805) are in the labor force, with 3.8% or 27 of them being unemployed. The group with the highest labor force participation rate are those with the educational attainment of bachelor's degree or higher, with 91.5% or 97 individuals in the labor force. Within the labor force, individuals with college / associate degree education have the highest percentage of unemployment, with 4.2% or 9 of them being unemployed.
| Educational Attainment | In Labor Force | Unemployed |
| Less than High School | 57 (89.1%) | 1 (1.8%) |
| High School Diploma | 347 (89.2%) | 16 (4.0%) |
| College / Associate Degree | 216 (87.8%) | 10 (4.2%) |
| Bachelor's Degree or higher | 97 (91.5%) | 3 (3.1%) |
| Total | 717 (89.1%) | 31 (3.8%) |
Employment Occupations by Sex in Shoemakersville borough
Management, Business, Science and Arts Occupations
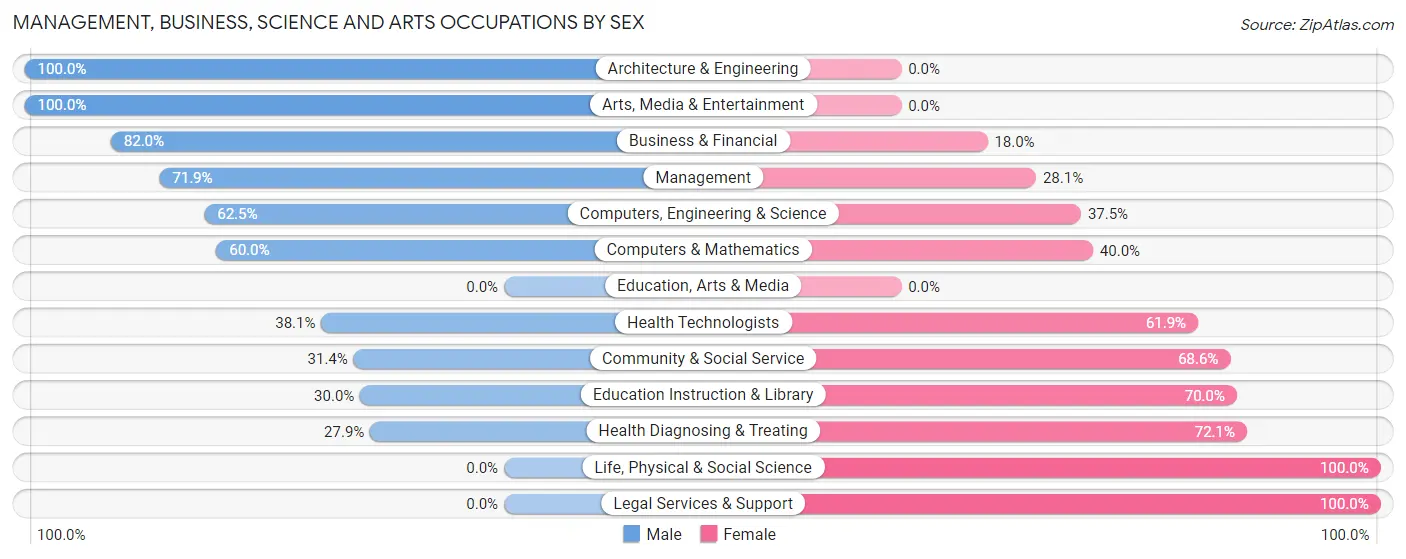
The most common Management, Business, Science and Arts occupations in Shoemakersville borough are Management (64 | 7.6%), Community & Social Service (51 | 6.0%), Business & Financial (50 | 5.9%), Health Diagnosing & Treating (43 | 5.1%), and Education Instruction & Library (30 | 3.5%).
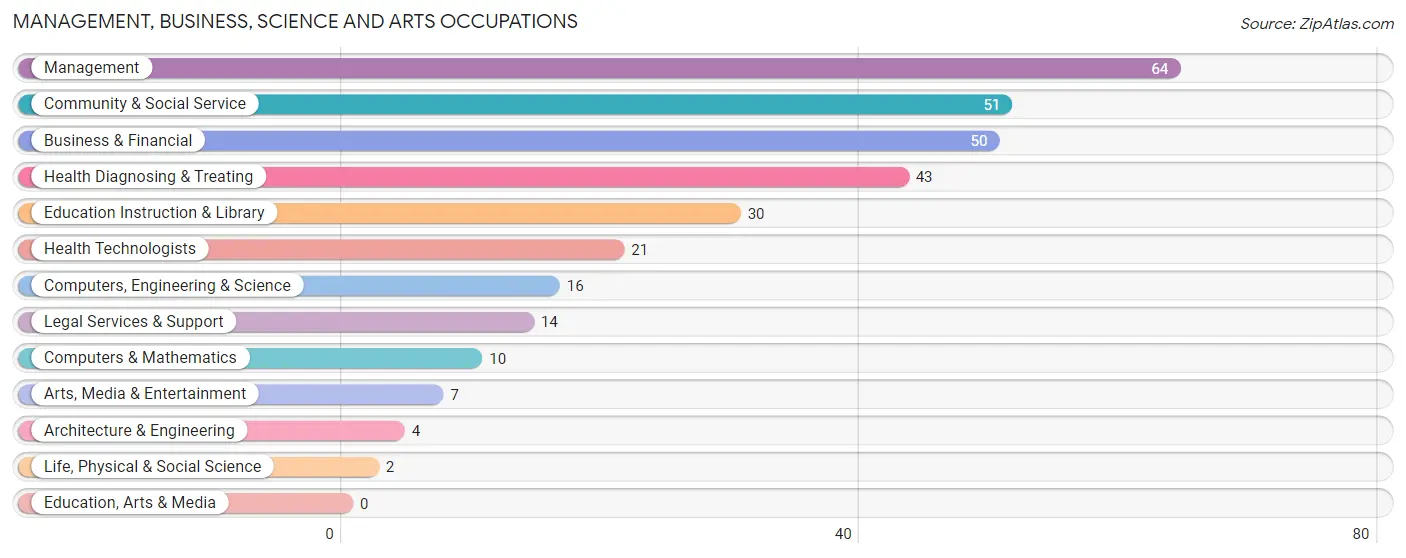
Management, Business, Science and Arts Occupations by Sex
Within the Management, Business, Science and Arts occupations in Shoemakersville borough, the most male-oriented occupations are Architecture & Engineering (100.0%), Arts, Media & Entertainment (100.0%), and Business & Financial (82.0%), while the most female-oriented occupations are Life, Physical & Social Science (100.0%), Legal Services & Support (100.0%), and Health Diagnosing & Treating (72.1%).
| Occupation | Male | Female |
| Management | 46 (71.9%) | 18 (28.1%) |
| Business & Financial | 41 (82.0%) | 9 (18.0%) |
| Computers, Engineering & Science | 10 (62.5%) | 6 (37.5%) |
| Computers & Mathematics | 6 (60.0%) | 4 (40.0%) |
| Architecture & Engineering | 4 (100.0%) | 0 (0.0%) |
| Life, Physical & Social Science | 0 (0.0%) | 2 (100.0%) |
| Community & Social Service | 16 (31.4%) | 35 (68.6%) |
| Education, Arts & Media | 0 (0.0%) | 0 (0.0%) |
| Legal Services & Support | 0 (0.0%) | 14 (100.0%) |
| Education Instruction & Library | 9 (30.0%) | 21 (70.0%) |
| Arts, Media & Entertainment | 7 (100.0%) | 0 (0.0%) |
| Health Diagnosing & Treating | 12 (27.9%) | 31 (72.1%) |
| Health Technologists | 8 (38.1%) | 13 (61.9%) |
| Total (Category) | 125 (55.8%) | 99 (44.2%) |
| Total (Overall) | 469 (55.4%) | 377 (44.6%) |
Services Occupations
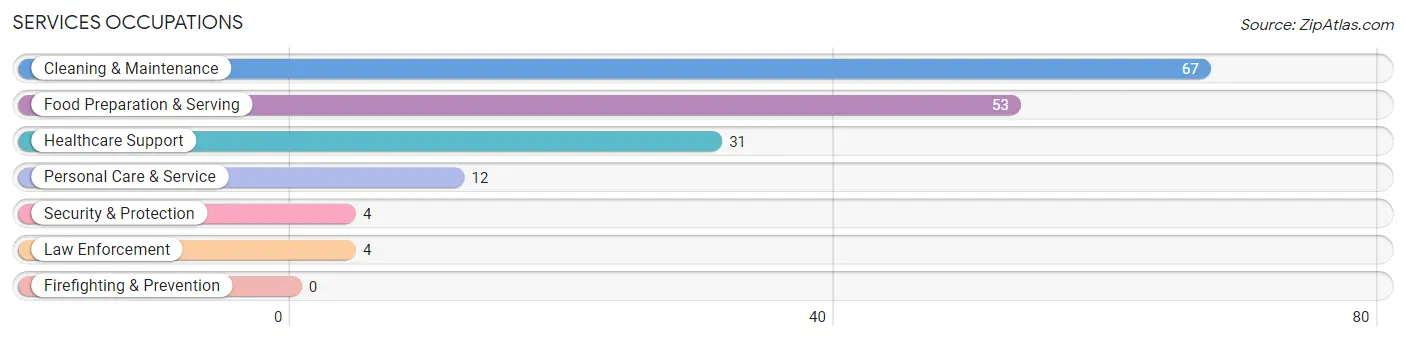
The most common Services occupations in Shoemakersville borough are Cleaning & Maintenance (67 | 7.9%), Food Preparation & Serving (53 | 6.3%), Healthcare Support (31 | 3.7%), Personal Care & Service (12 | 1.4%), and Security & Protection (4 | 0.5%).
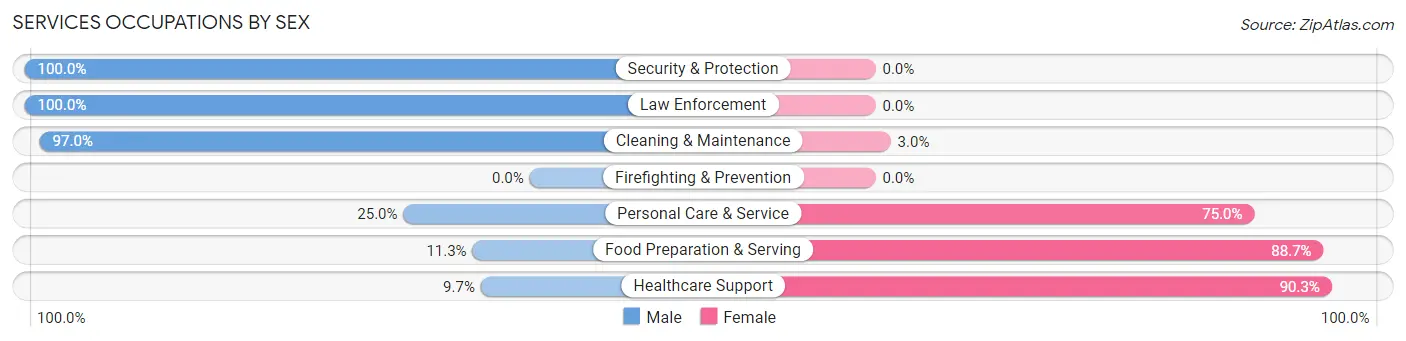
Services Occupations by Sex
Within the Services occupations in Shoemakersville borough, the most male-oriented occupations are Security & Protection (100.0%), Law Enforcement (100.0%), and Cleaning & Maintenance (97.0%), while the most female-oriented occupations are Healthcare Support (90.3%), Food Preparation & Serving (88.7%), and Personal Care & Service (75.0%).
| Occupation | Male | Female |
| Healthcare Support | 3 (9.7%) | 28 (90.3%) |
| Security & Protection | 4 (100.0%) | 0 (0.0%) |
| Firefighting & Prevention | 0 (0.0%) | 0 (0.0%) |
| Law Enforcement | 4 (100.0%) | 0 (0.0%) |
| Food Preparation & Serving | 6 (11.3%) | 47 (88.7%) |
| Cleaning & Maintenance | 65 (97.0%) | 2 (3.0%) |
| Personal Care & Service | 3 (25.0%) | 9 (75.0%) |
| Total (Category) | 81 (48.5%) | 86 (51.5%) |
| Total (Overall) | 469 (55.4%) | 377 (44.6%) |
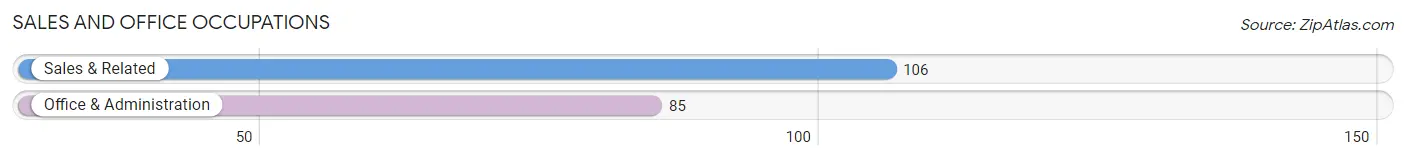
Sales and Office Occupations
The most common Sales and Office occupations in Shoemakersville borough are Sales & Related (106 | 12.5%), and Office & Administration (85 | 10.1%).
Sales and Office Occupations by Sex
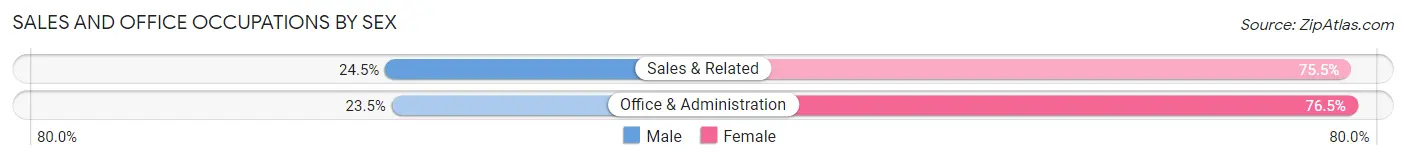
| Occupation | Male | Female |
| Sales & Related | 26 (24.5%) | 80 (75.5%) |
| Office & Administration | 20 (23.5%) | 65 (76.5%) |
| Total (Category) | 46 (24.1%) | 145 (75.9%) |
| Total (Overall) | 469 (55.4%) | 377 (44.6%) |
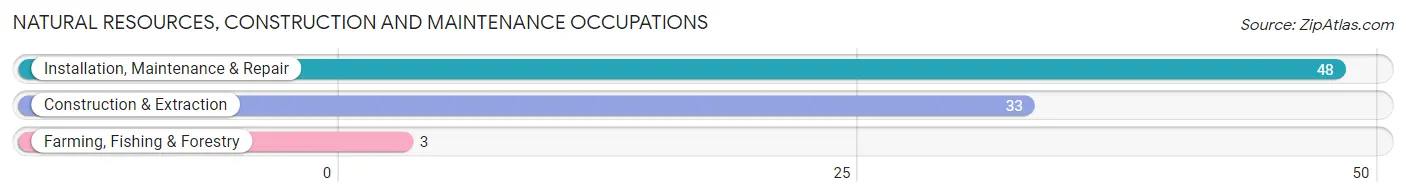
Natural Resources, Construction and Maintenance Occupations
The most common Natural Resources, Construction and Maintenance occupations in Shoemakersville borough are Installation, Maintenance & Repair (48 | 5.7%), Construction & Extraction (33 | 3.9%), and Farming, Fishing & Forestry (3 | 0.4%).
Natural Resources, Construction and Maintenance Occupations by Sex
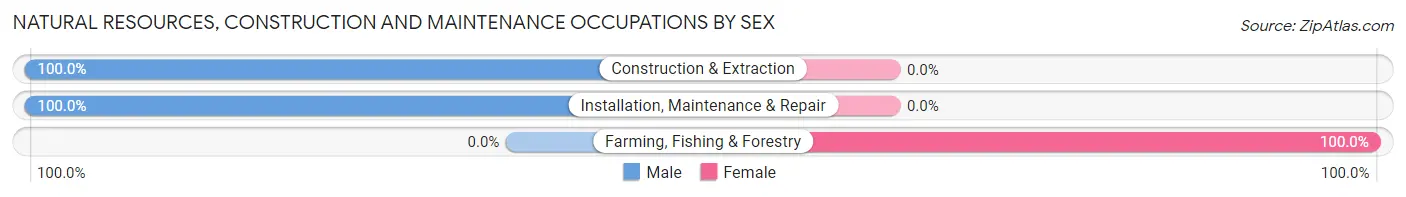
| Occupation | Male | Female |
| Farming, Fishing & Forestry | 0 (0.0%) | 3 (100.0%) |
| Construction & Extraction | 33 (100.0%) | 0 (0.0%) |
| Installation, Maintenance & Repair | 48 (100.0%) | 0 (0.0%) |
| Total (Category) | 81 (96.4%) | 3 (3.6%) |
| Total (Overall) | 469 (55.4%) | 377 (44.6%) |
Production, Transportation and Moving Occupations
The most common Production, Transportation and Moving occupations in Shoemakersville borough are Production (76 | 9.0%), Transportation (57 | 6.7%), and Material Moving (47 | 5.6%).
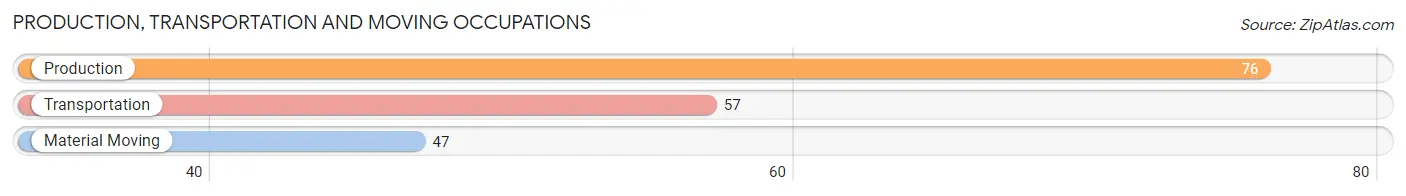
Production, Transportation and Moving Occupations by Sex
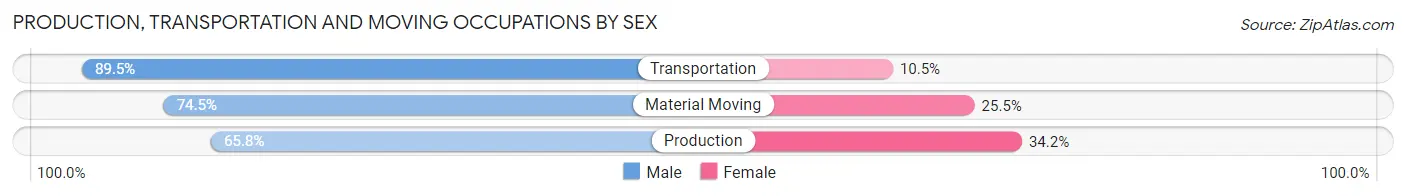
| Occupation | Male | Female |
| Production | 50 (65.8%) | 26 (34.2%) |
| Transportation | 51 (89.5%) | 6 (10.5%) |
| Material Moving | 35 (74.5%) | 12 (25.5%) |
| Total (Category) | 136 (75.6%) | 44 (24.4%) |
| Total (Overall) | 469 (55.4%) | 377 (44.6%) |
Employment Industries by Sex in Shoemakersville borough
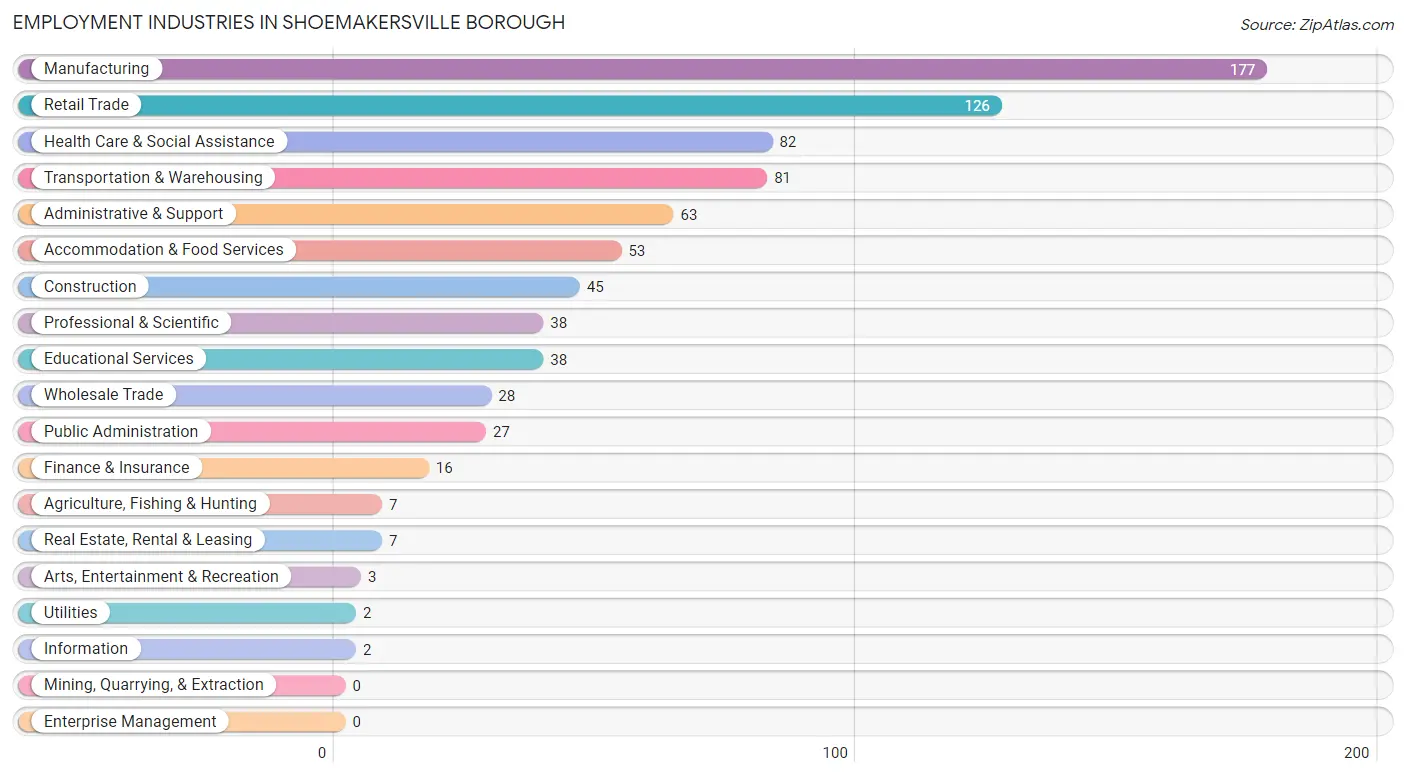
Employment Industries in Shoemakersville borough
The major employment industries in Shoemakersville borough include Manufacturing (177 | 20.9%), Retail Trade (126 | 14.9%), Health Care & Social Assistance (82 | 9.7%), Transportation & Warehousing (81 | 9.6%), and Administrative & Support (63 | 7.4%).
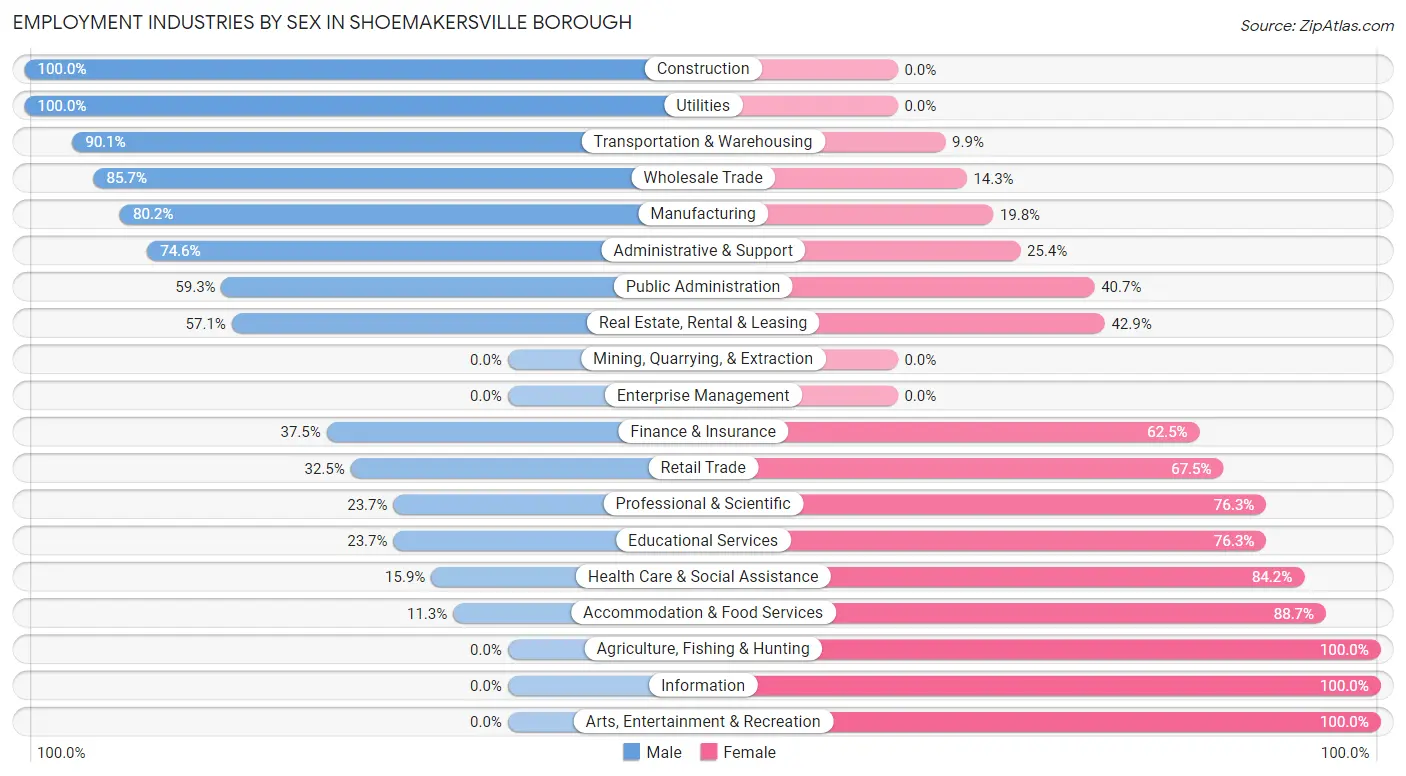
Employment Industries by Sex in Shoemakersville borough
The Shoemakersville borough industries that see more men than women are Construction (100.0%), Utilities (100.0%), and Transportation & Warehousing (90.1%), whereas the industries that tend to have a higher number of women are Agriculture, Fishing & Hunting (100.0%), Information (100.0%), and Arts, Entertainment & Recreation (100.0%).
| Industry | Male | Female |
| Agriculture, Fishing & Hunting | 0 (0.0%) | 7 (100.0%) |
| Mining, Quarrying, & Extraction | 0 (0.0%) | 0 (0.0%) |
| Construction | 45 (100.0%) | 0 (0.0%) |
| Manufacturing | 142 (80.2%) | 35 (19.8%) |
| Wholesale Trade | 24 (85.7%) | 4 (14.3%) |
| Retail Trade | 41 (32.5%) | 85 (67.5%) |
| Transportation & Warehousing | 73 (90.1%) | 8 (9.9%) |
| Utilities | 2 (100.0%) | 0 (0.0%) |
| Information | 0 (0.0%) | 2 (100.0%) |
| Finance & Insurance | 6 (37.5%) | 10 (62.5%) |
| Real Estate, Rental & Leasing | 4 (57.1%) | 3 (42.9%) |
| Professional & Scientific | 9 (23.7%) | 29 (76.3%) |
| Enterprise Management | 0 (0.0%) | 0 (0.0%) |
| Administrative & Support | 47 (74.6%) | 16 (25.4%) |
| Educational Services | 9 (23.7%) | 29 (76.3%) |
| Health Care & Social Assistance | 13 (15.9%) | 69 (84.2%) |
| Arts, Entertainment & Recreation | 0 (0.0%) | 3 (100.0%) |
| Accommodation & Food Services | 6 (11.3%) | 47 (88.7%) |
| Public Administration | 16 (59.3%) | 11 (40.7%) |
| Total | 469 (55.4%) | 377 (44.6%) |
Education in Shoemakersville borough
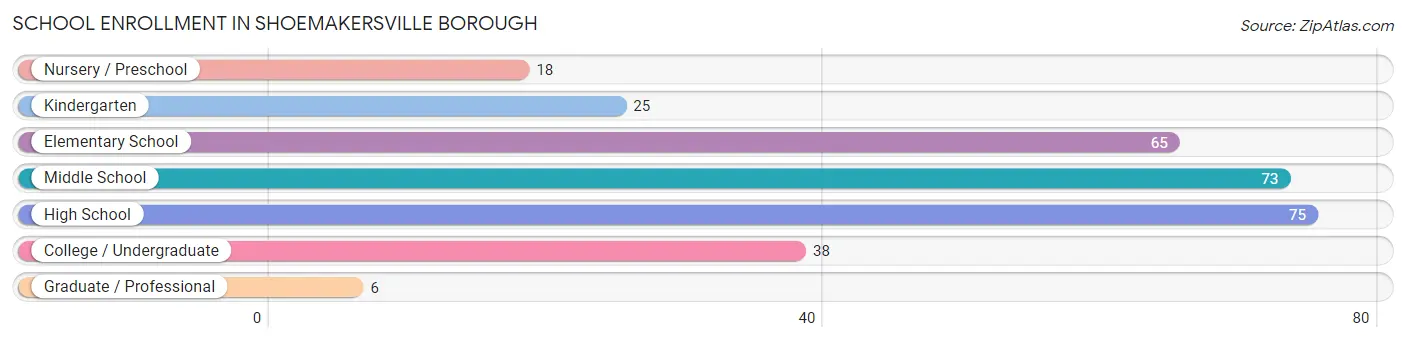
School Enrollment in Shoemakersville borough
The most common levels of schooling among the 300 students in Shoemakersville borough are high school (75 | 25.0%), middle school (73 | 24.3%), and elementary school (65 | 21.7%).
| School Level | # Students | % Students |
| Nursery / Preschool | 18 | 6.0% |
| Kindergarten | 25 | 8.3% |
| Elementary School | 65 | 21.7% |
| Middle School | 73 | 24.3% |
| High School | 75 | 25.0% |
| College / Undergraduate | 38 | 12.7% |
| Graduate / Professional | 6 | 2.0% |
| Total | 300 | 100.0% |
School Enrollment by Age by Funding Source in Shoemakersville borough
Out of a total of 300 students who are enrolled in schools in Shoemakersville borough, 27 (9.0%) attend a private institution, while the remaining 273 (91.0%) are enrolled in public schools. The age group of 20 to 24 year olds has the highest likelihood of being enrolled in private schools, with 10 (55.6% in the age bracket) enrolled. Conversely, the age group of 5 to 9 year old has the lowest likelihood of being enrolled in a private school, with 80 (100.0% in the age bracket) attending a public institution.
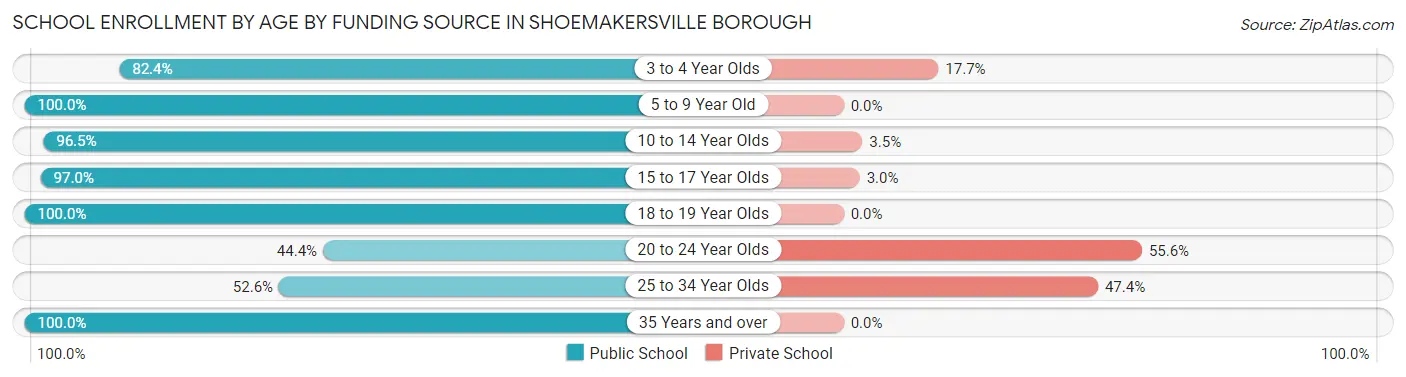
| Age Bracket | Public School | Private School |
| 3 to 4 Year Olds | 14 (82.4%) | 3 (17.6%) |
| 5 to 9 Year Old | 80 (100.0%) | 0 (0.0%) |
| 10 to 14 Year Olds | 83 (96.5%) | 3 (3.5%) |
| 15 to 17 Year Olds | 65 (97.0%) | 2 (3.0%) |
| 18 to 19 Year Olds | 10 (100.0%) | 0 (0.0%) |
| 20 to 24 Year Olds | 8 (44.4%) | 10 (55.6%) |
| 25 to 34 Year Olds | 10 (52.6%) | 9 (47.4%) |
| 35 Years and over | 3 (100.0%) | 0 (0.0%) |
| Total | 273 (91.0%) | 27 (9.0%) |
Educational Attainment by Field of Study in Shoemakersville borough
Business (49 | 35.5%), education (28 | 20.3%), bio, nature & agricultural (11 | 8.0%), engineering (8 | 5.8%), and science & technology (8 | 5.8%) are the most common fields of study among 138 individuals in Shoemakersville borough who have obtained a bachelor's degree or higher.
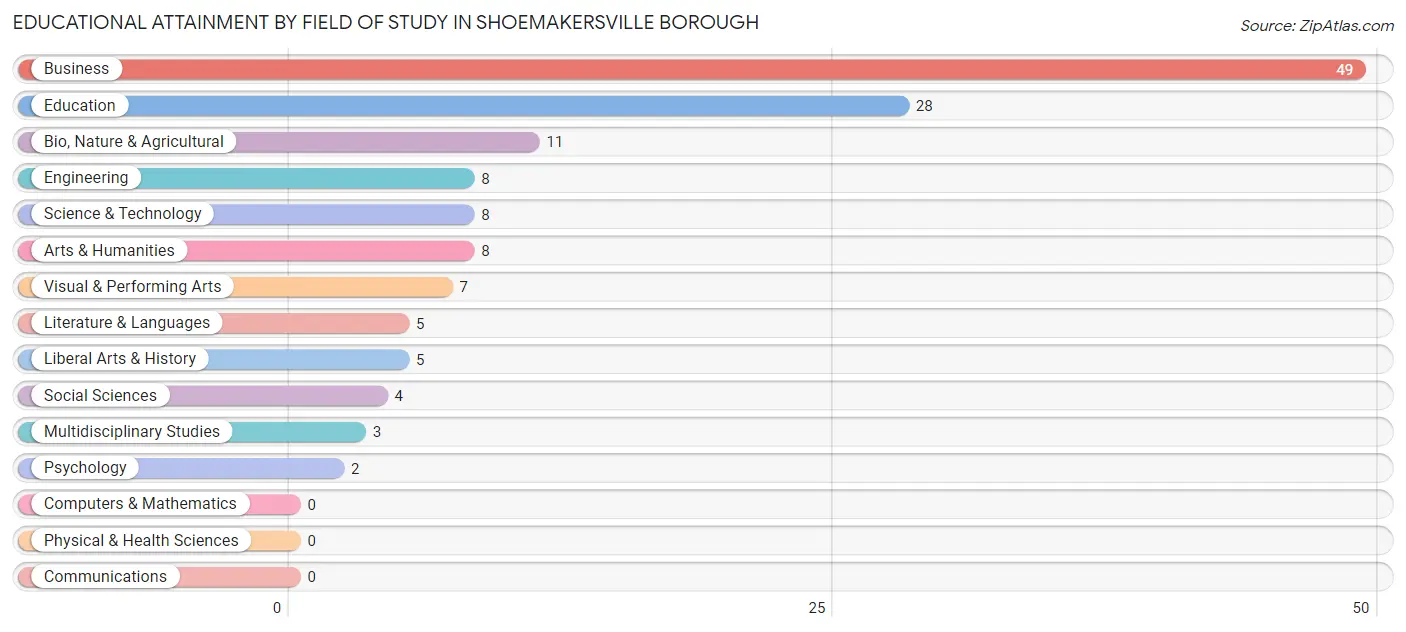
| Field of Study | # Graduates | % Graduates |
| Computers & Mathematics | 0 | 0.0% |
| Bio, Nature & Agricultural | 11 | 8.0% |
| Physical & Health Sciences | 0 | 0.0% |
| Psychology | 2 | 1.5% |
| Social Sciences | 4 | 2.9% |
| Engineering | 8 | 5.8% |
| Multidisciplinary Studies | 3 | 2.2% |
| Science & Technology | 8 | 5.8% |
| Business | 49 | 35.5% |
| Education | 28 | 20.3% |
| Literature & Languages | 5 | 3.6% |
| Liberal Arts & History | 5 | 3.6% |
| Visual & Performing Arts | 7 | 5.1% |
| Communications | 0 | 0.0% |
| Arts & Humanities | 8 | 5.8% |
| Total | 138 | 100.0% |
Transportation & Commute in Shoemakersville borough
Vehicle Availability by Sex in Shoemakersville borough
The most prevalent vehicle ownership categories in Shoemakersville borough are males with 2 vehicles (178, accounting for 37.6%) and females with 2 vehicles (141, making up 48.1%).
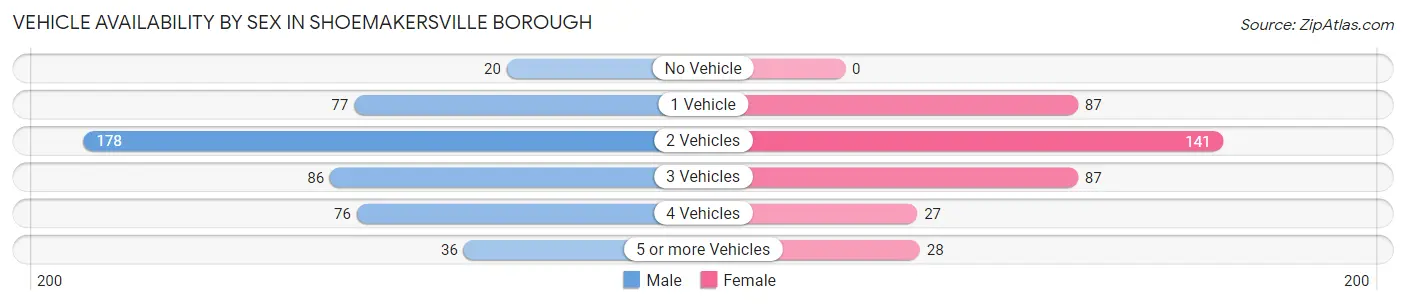
| Vehicles Available | Male | Female |
| No Vehicle | 20 (4.2%) | 0 (0.0%) |
| 1 Vehicle | 77 (16.3%) | 87 (23.5%) |
| 2 Vehicles | 178 (37.6%) | 141 (38.1%) |
| 3 Vehicles | 86 (18.2%) | 87 (23.5%) |
| 4 Vehicles | 76 (16.1%) | 27 (7.3%) |
| 5 or more Vehicles | 36 (7.6%) | 28 (7.6%) |
| Total | 473 (100.0%) | 370 (100.0%) |
Commute Time in Shoemakersville borough
The most frequently occuring commute durations in Shoemakersville borough are 30 to 34 minutes (163 commuters, 20.2%), 10 to 14 minutes (101 commuters, 12.5%), and 25 to 29 minutes (100 commuters, 12.4%).
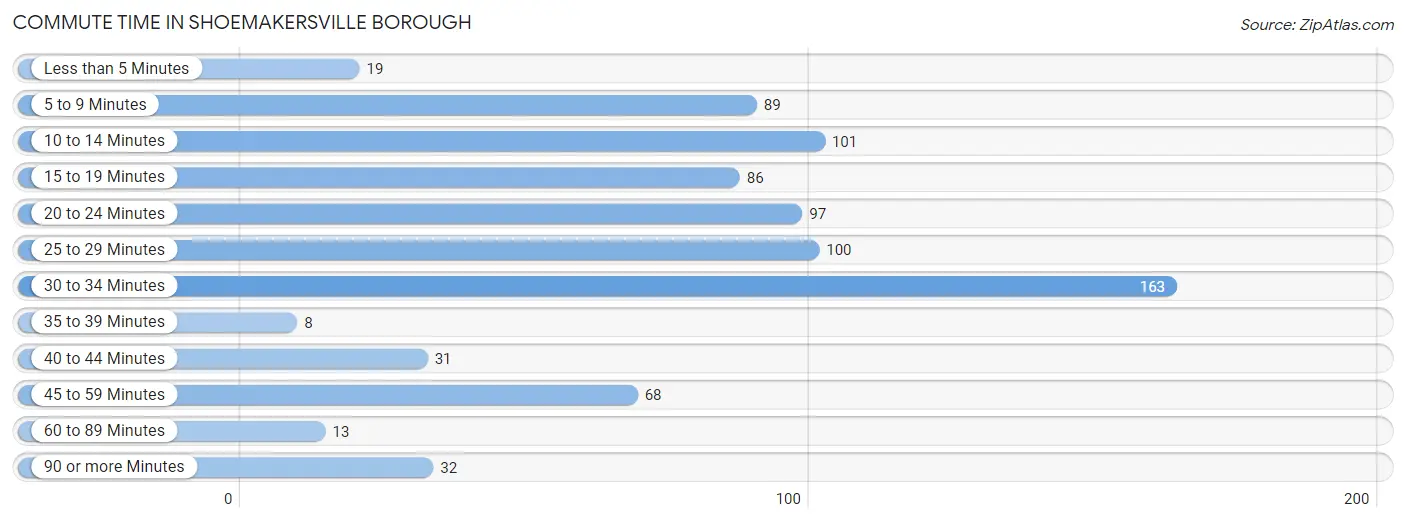
| Commute Time | # Commuters | % Commuters |
| Less than 5 Minutes | 19 | 2.4% |
| 5 to 9 Minutes | 89 | 11.0% |
| 10 to 14 Minutes | 101 | 12.5% |
| 15 to 19 Minutes | 86 | 10.7% |
| 20 to 24 Minutes | 97 | 12.0% |
| 25 to 29 Minutes | 100 | 12.4% |
| 30 to 34 Minutes | 163 | 20.2% |
| 35 to 39 Minutes | 8 | 1.0% |
| 40 to 44 Minutes | 31 | 3.8% |
| 45 to 59 Minutes | 68 | 8.4% |
| 60 to 89 Minutes | 13 | 1.6% |
| 90 or more Minutes | 32 | 4.0% |
Commute Time by Sex in Shoemakersville borough
The most common commute times in Shoemakersville borough are 30 to 34 minutes (87 commuters, 19.3%) for males and 10 to 14 minutes (78 commuters, 21.9%) for females.
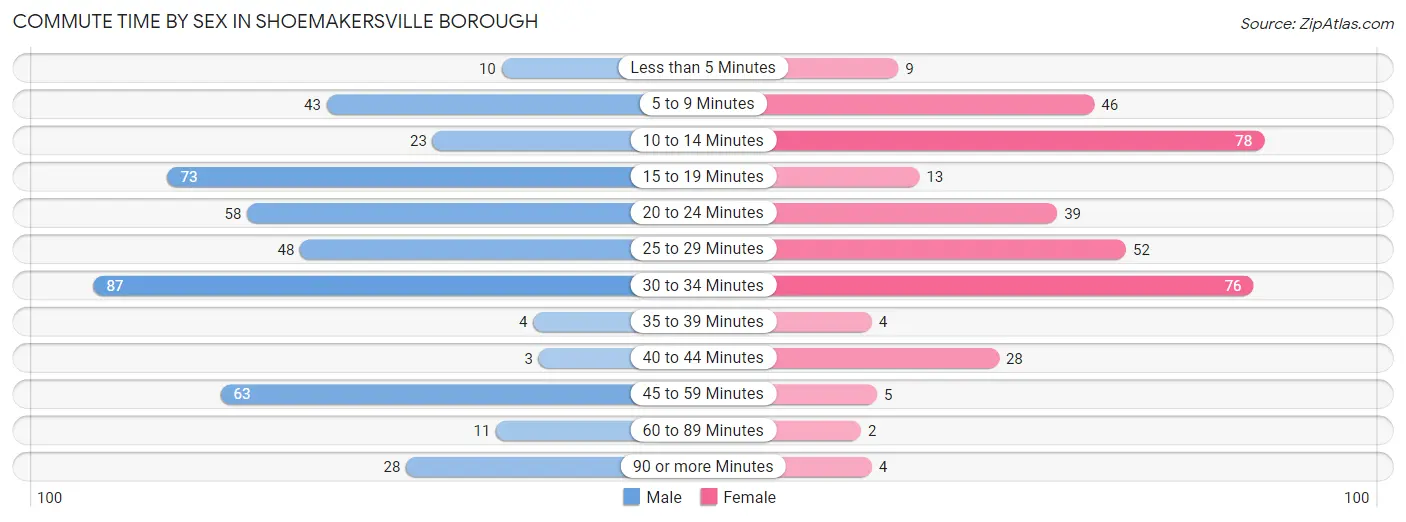
| Commute Time | Male | Female |
| Less than 5 Minutes | 10 (2.2%) | 9 (2.5%) |
| 5 to 9 Minutes | 43 (9.5%) | 46 (12.9%) |
| 10 to 14 Minutes | 23 (5.1%) | 78 (21.9%) |
| 15 to 19 Minutes | 73 (16.2%) | 13 (3.6%) |
| 20 to 24 Minutes | 58 (12.9%) | 39 (11.0%) |
| 25 to 29 Minutes | 48 (10.6%) | 52 (14.6%) |
| 30 to 34 Minutes | 87 (19.3%) | 76 (21.3%) |
| 35 to 39 Minutes | 4 (0.9%) | 4 (1.1%) |
| 40 to 44 Minutes | 3 (0.7%) | 28 (7.9%) |
| 45 to 59 Minutes | 63 (14.0%) | 5 (1.4%) |
| 60 to 89 Minutes | 11 (2.4%) | 2 (0.6%) |
| 90 or more Minutes | 28 (6.2%) | 4 (1.1%) |
Time of Departure to Work by Sex in Shoemakersville borough
The most frequent times of departure to work in Shoemakersville borough are 6:00 AM to 6:29 AM (93, 20.6%) for males and 7:00 AM to 7:29 AM (48, 13.5%) for females.
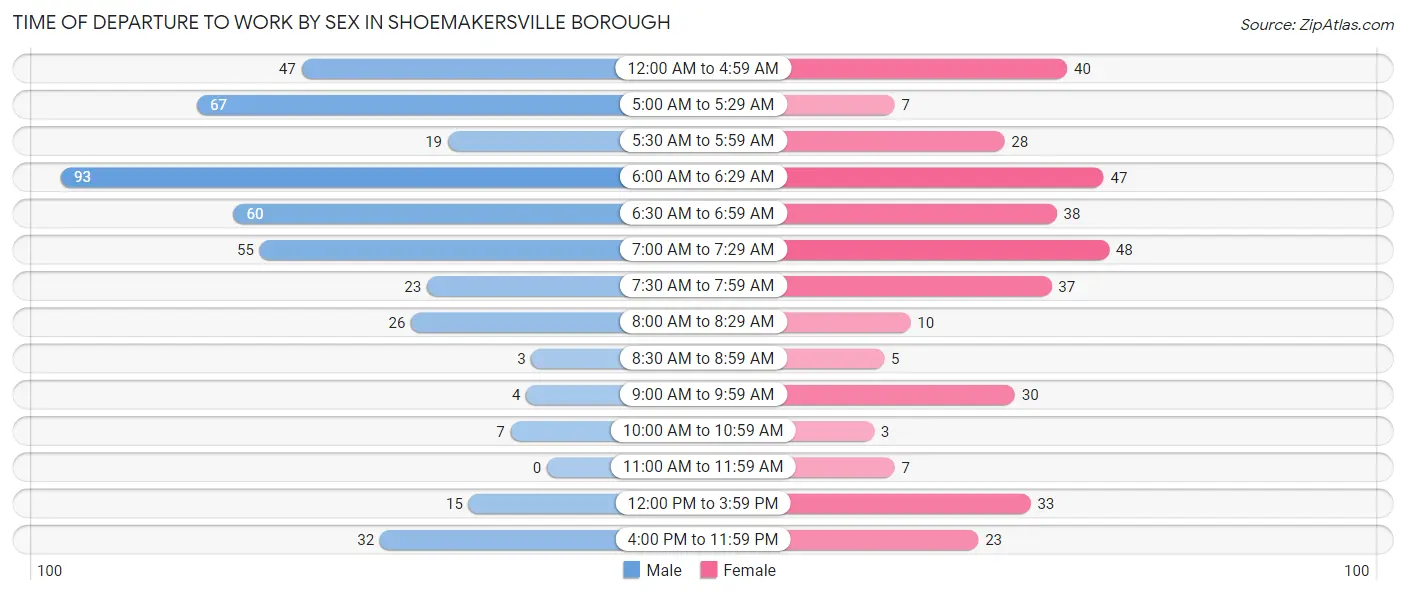
| Time of Departure | Male | Female |
| 12:00 AM to 4:59 AM | 47 (10.4%) | 40 (11.2%) |
| 5:00 AM to 5:29 AM | 67 (14.9%) | 7 (2.0%) |
| 5:30 AM to 5:59 AM | 19 (4.2%) | 28 (7.9%) |
| 6:00 AM to 6:29 AM | 93 (20.6%) | 47 (13.2%) |
| 6:30 AM to 6:59 AM | 60 (13.3%) | 38 (10.7%) |
| 7:00 AM to 7:29 AM | 55 (12.2%) | 48 (13.5%) |
| 7:30 AM to 7:59 AM | 23 (5.1%) | 37 (10.4%) |
| 8:00 AM to 8:29 AM | 26 (5.8%) | 10 (2.8%) |
| 8:30 AM to 8:59 AM | 3 (0.7%) | 5 (1.4%) |
| 9:00 AM to 9:59 AM | 4 (0.9%) | 30 (8.4%) |
| 10:00 AM to 10:59 AM | 7 (1.5%) | 3 (0.8%) |
| 11:00 AM to 11:59 AM | 0 (0.0%) | 7 (2.0%) |
| 12:00 PM to 3:59 PM | 15 (3.3%) | 33 (9.3%) |
| 4:00 PM to 11:59 PM | 32 (7.1%) | 23 (6.5%) |
| Total | 451 (100.0%) | 356 (100.0%) |
Housing Occupancy in Shoemakersville borough
Occupancy by Ownership in Shoemakersville borough
Of the total 622 dwellings in Shoemakersville borough, owner-occupied units account for 414 (66.6%), while renter-occupied units make up 208 (33.4%).
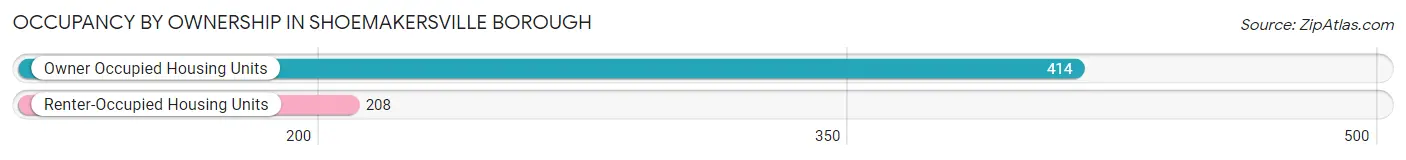
| Occupancy | # Housing Units | % Housing Units |
| Owner Occupied Housing Units | 414 | 66.6% |
| Renter-Occupied Housing Units | 208 | 33.4% |
| Total Occupied Housing Units | 622 | 100.0% |
Occupancy by Household Size in Shoemakersville borough
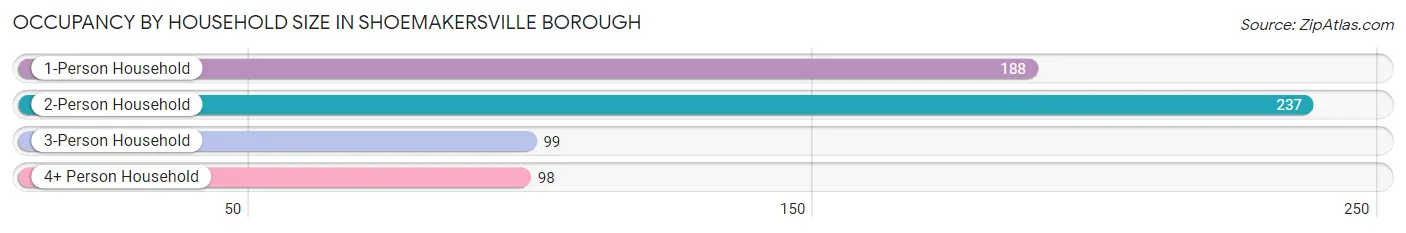
| Household Size | # Housing Units | % Housing Units |
| 1-Person Household | 188 | 30.2% |
| 2-Person Household | 237 | 38.1% |
| 3-Person Household | 99 | 15.9% |
| 4+ Person Household | 98 | 15.8% |
| Total Housing Units | 622 | 100.0% |
Occupancy by Ownership by Household Size in Shoemakersville borough
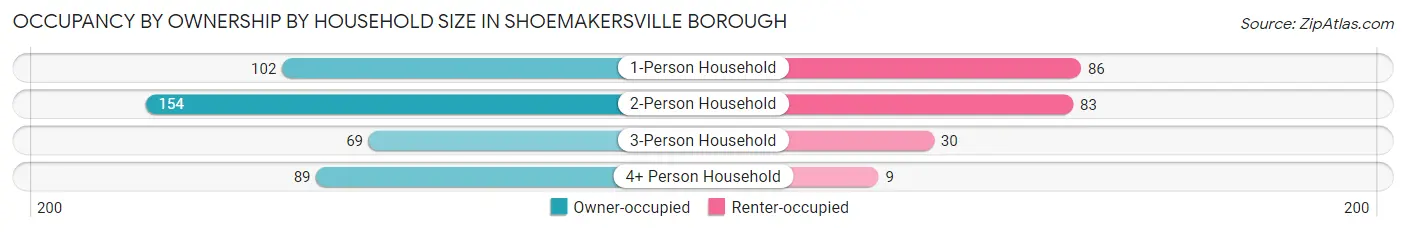
| Household Size | Owner-occupied | Renter-occupied |
| 1-Person Household | 102 (54.3%) | 86 (45.7%) |
| 2-Person Household | 154 (65.0%) | 83 (35.0%) |
| 3-Person Household | 69 (69.7%) | 30 (30.3%) |
| 4+ Person Household | 89 (90.8%) | 9 (9.2%) |
| Total Housing Units | 414 (66.6%) | 208 (33.4%) |
Occupancy by Educational Attainment in Shoemakersville borough
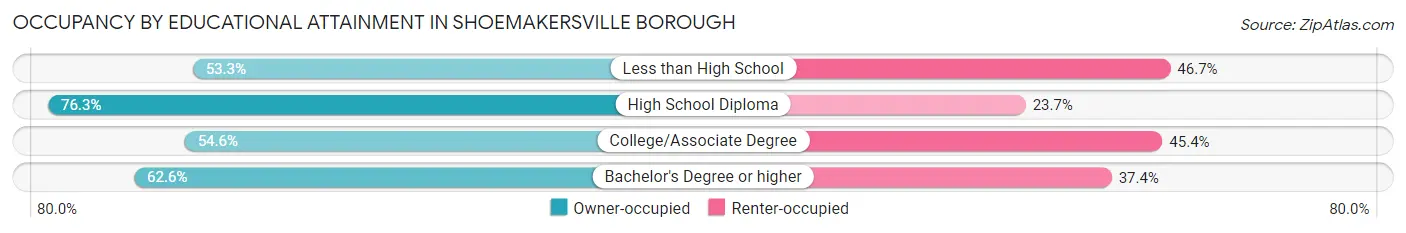
| Household Size | Owner-occupied | Renter-occupied |
| Less than High School | 24 (53.3%) | 21 (46.7%) |
| High School Diploma | 238 (76.3%) | 74 (23.7%) |
| College/Associate Degree | 95 (54.6%) | 79 (45.4%) |
| Bachelor's Degree or higher | 57 (62.6%) | 34 (37.4%) |
Occupancy by Age of Householder in Shoemakersville borough
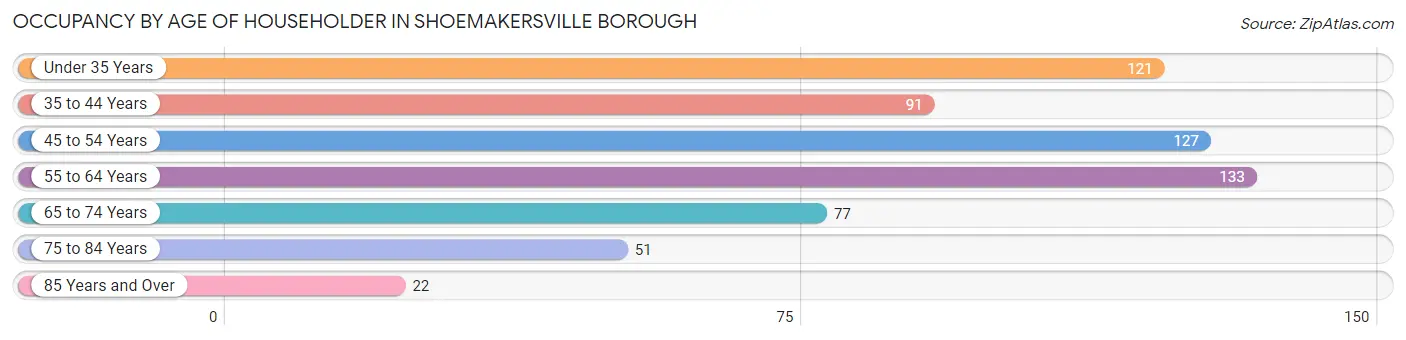
| Age Bracket | # Households | % Households |
| Under 35 Years | 121 | 19.5% |
| 35 to 44 Years | 91 | 14.6% |
| 45 to 54 Years | 127 | 20.4% |
| 55 to 64 Years | 133 | 21.4% |
| 65 to 74 Years | 77 | 12.4% |
| 75 to 84 Years | 51 | 8.2% |
| 85 Years and Over | 22 | 3.5% |
| Total | 622 | 100.0% |
Housing Finances in Shoemakersville borough
Median Income by Occupancy in Shoemakersville borough
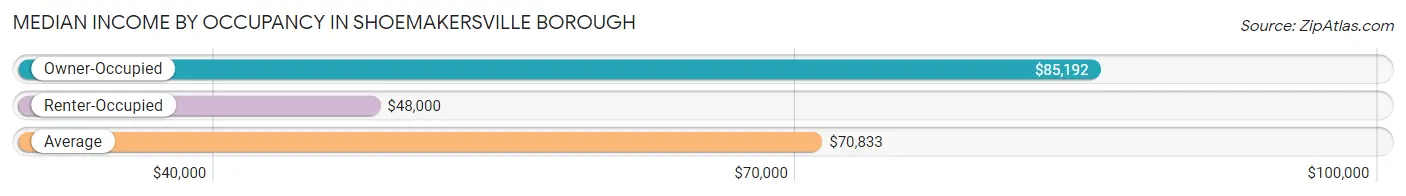
| Occupancy Type | # Households | Median Income |
| Owner-Occupied | 414 (66.6%) | $85,192 |
| Renter-Occupied | 208 (33.4%) | $48,000 |
| Average | 622 (100.0%) | $70,833 |
Occupancy by Householder Income Bracket in Shoemakersville borough
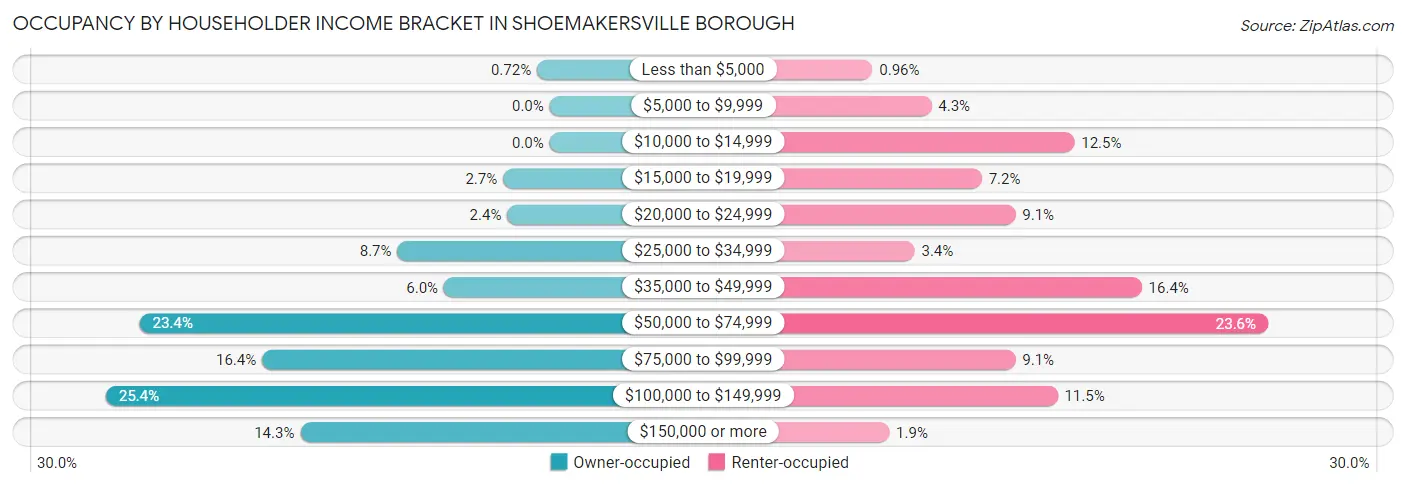
| Income Bracket | Owner-occupied | Renter-occupied |
| Less than $5,000 | 3 (0.7%) | 2 (1.0%) |
| $5,000 to $9,999 | 0 (0.0%) | 9 (4.3%) |
| $10,000 to $14,999 | 0 (0.0%) | 26 (12.5%) |
| $15,000 to $19,999 | 11 (2.7%) | 15 (7.2%) |
| $20,000 to $24,999 | 10 (2.4%) | 19 (9.1%) |
| $25,000 to $34,999 | 36 (8.7%) | 7 (3.4%) |
| $35,000 to $49,999 | 25 (6.0%) | 34 (16.4%) |
| $50,000 to $74,999 | 97 (23.4%) | 49 (23.6%) |
| $75,000 to $99,999 | 68 (16.4%) | 19 (9.1%) |
| $100,000 to $149,999 | 105 (25.4%) | 24 (11.5%) |
| $150,000 or more | 59 (14.2%) | 4 (1.9%) |
| Total | 414 (100.0%) | 208 (100.0%) |
Monthly Housing Cost Tiers in Shoemakersville borough
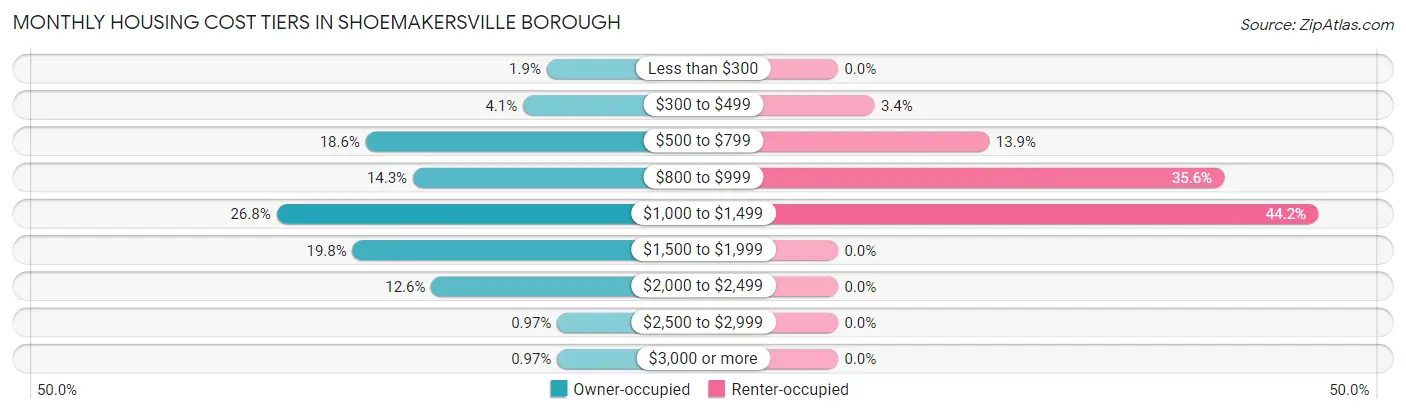
| Monthly Cost | Owner-occupied | Renter-occupied |
| Less than $300 | 8 (1.9%) | 0 (0.0%) |
| $300 to $499 | 17 (4.1%) | 7 (3.4%) |
| $500 to $799 | 77 (18.6%) | 29 (13.9%) |
| $800 to $999 | 59 (14.2%) | 74 (35.6%) |
| $1,000 to $1,499 | 111 (26.8%) | 92 (44.2%) |
| $1,500 to $1,999 | 82 (19.8%) | 0 (0.0%) |
| $2,000 to $2,499 | 52 (12.6%) | 0 (0.0%) |
| $2,500 to $2,999 | 4 (1.0%) | 0 (0.0%) |
| $3,000 or more | 4 (1.0%) | 0 (0.0%) |
| Total | 414 (100.0%) | 208 (100.0%) |
Physical Housing Characteristics in Shoemakersville borough
Housing Structures in Shoemakersville borough
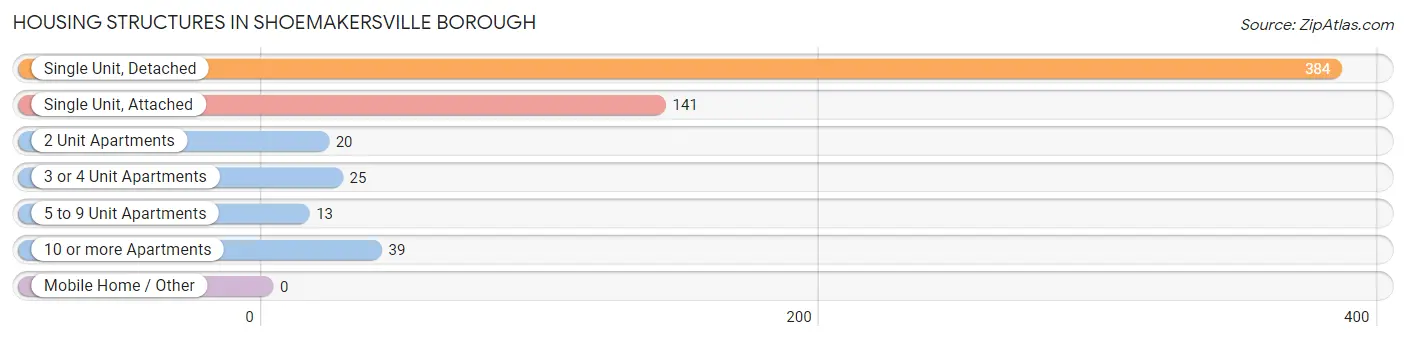
| Structure Type | # Housing Units | % Housing Units |
| Single Unit, Detached | 384 | 61.7% |
| Single Unit, Attached | 141 | 22.7% |
| 2 Unit Apartments | 20 | 3.2% |
| 3 or 4 Unit Apartments | 25 | 4.0% |
| 5 to 9 Unit Apartments | 13 | 2.1% |
| 10 or more Apartments | 39 | 6.3% |
| Mobile Home / Other | 0 | 0.0% |
| Total | 622 | 100.0% |
Housing Structures by Occupancy in Shoemakersville borough
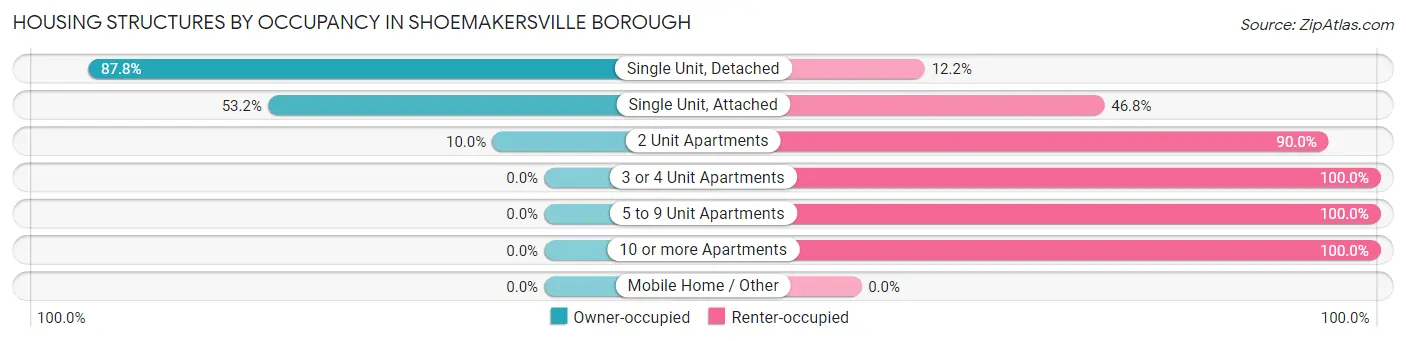
| Structure Type | Owner-occupied | Renter-occupied |
| Single Unit, Detached | 337 (87.8%) | 47 (12.2%) |
| Single Unit, Attached | 75 (53.2%) | 66 (46.8%) |
| 2 Unit Apartments | 2 (10.0%) | 18 (90.0%) |
| 3 or 4 Unit Apartments | 0 (0.0%) | 25 (100.0%) |
| 5 to 9 Unit Apartments | 0 (0.0%) | 13 (100.0%) |
| 10 or more Apartments | 0 (0.0%) | 39 (100.0%) |
| Mobile Home / Other | 0 (0.0%) | 0 (0.0%) |
| Total | 414 (66.6%) | 208 (33.4%) |
Housing Structures by Number of Rooms in Shoemakersville borough
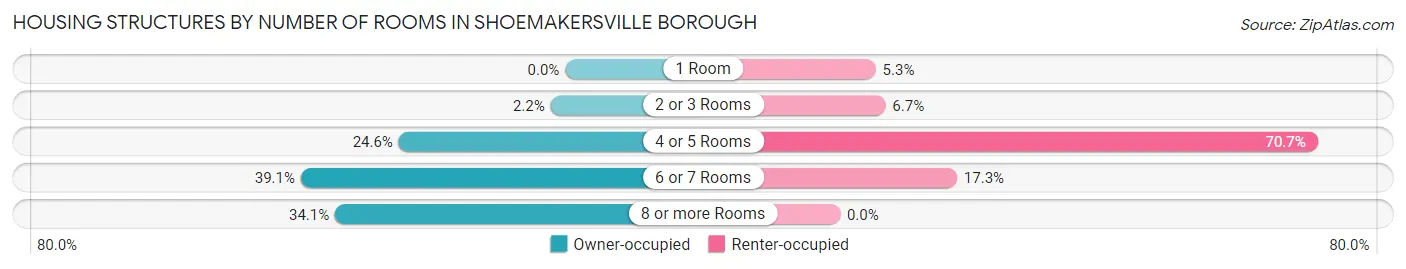
| Number of Rooms | Owner-occupied | Renter-occupied |
| 1 Room | 0 (0.0%) | 11 (5.3%) |
| 2 or 3 Rooms | 9 (2.2%) | 14 (6.7%) |
| 4 or 5 Rooms | 102 (24.6%) | 147 (70.7%) |
| 6 or 7 Rooms | 162 (39.1%) | 36 (17.3%) |
| 8 or more Rooms | 141 (34.1%) | 0 (0.0%) |
| Total | 414 (100.0%) | 208 (100.0%) |
Housing Structure by Heating Type in Shoemakersville borough
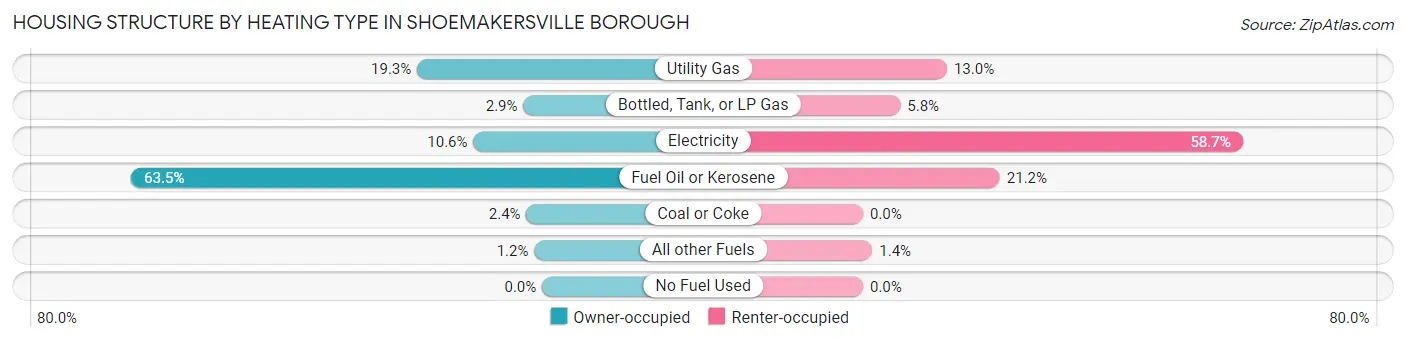
| Heating Type | Owner-occupied | Renter-occupied |
| Utility Gas | 80 (19.3%) | 27 (13.0%) |
| Bottled, Tank, or LP Gas | 12 (2.9%) | 12 (5.8%) |
| Electricity | 44 (10.6%) | 122 (58.7%) |
| Fuel Oil or Kerosene | 263 (63.5%) | 44 (21.1%) |
| Coal or Coke | 10 (2.4%) | 0 (0.0%) |
| All other Fuels | 5 (1.2%) | 3 (1.4%) |
| No Fuel Used | 0 (0.0%) | 0 (0.0%) |
| Total | 414 (100.0%) | 208 (100.0%) |
Household Vehicle Usage in Shoemakersville borough
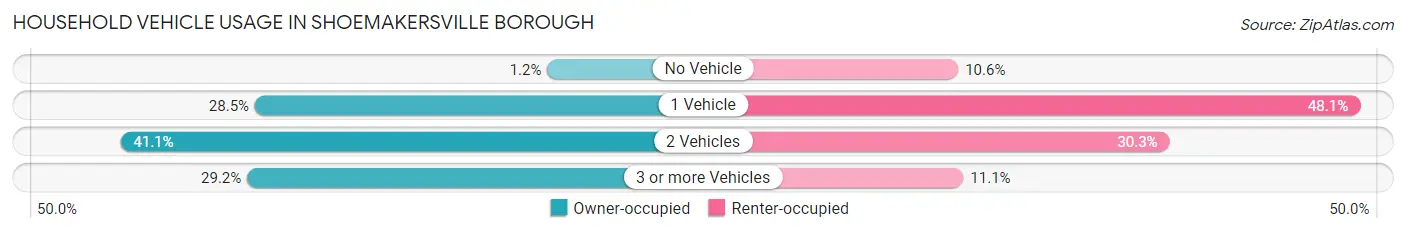
| Vehicles per Household | Owner-occupied | Renter-occupied |
| No Vehicle | 5 (1.2%) | 22 (10.6%) |
| 1 Vehicle | 118 (28.5%) | 100 (48.1%) |
| 2 Vehicles | 170 (41.1%) | 63 (30.3%) |
| 3 or more Vehicles | 121 (29.2%) | 23 (11.1%) |
| Total | 414 (100.0%) | 208 (100.0%) |
Real Estate & Mortgages in Shoemakersville borough
Real Estate and Mortgage Overview in Shoemakersville borough
| Characteristic | Without Mortgage | With Mortgage |
| Housing Units | 144 | 270 |
| Median Property Value | $150,000 | $167,400 |
| Median Household Income | $63,500 | $46 |
| Monthly Housing Costs | $679 | $0 |
| Real Estate Taxes | $2,737 | $0 |
Property Value by Mortgage Status in Shoemakersville borough
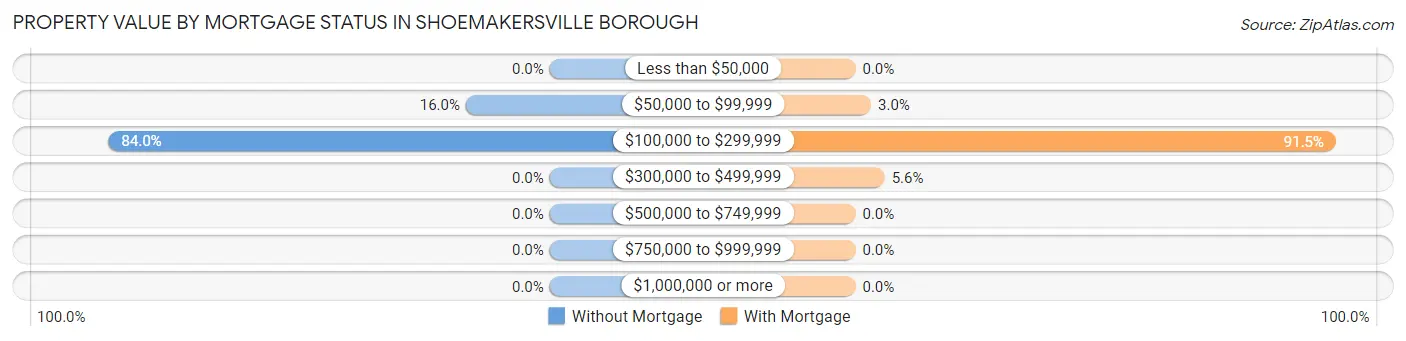
| Property Value | Without Mortgage | With Mortgage |
| Less than $50,000 | 0 (0.0%) | 0 (0.0%) |
| $50,000 to $99,999 | 23 (16.0%) | 8 (3.0%) |
| $100,000 to $299,999 | 121 (84.0%) | 247 (91.5%) |
| $300,000 to $499,999 | 0 (0.0%) | 15 (5.6%) |
| $500,000 to $749,999 | 0 (0.0%) | 0 (0.0%) |
| $750,000 to $999,999 | 0 (0.0%) | 0 (0.0%) |
| $1,000,000 or more | 0 (0.0%) | 0 (0.0%) |
| Total | 144 (100.0%) | 270 (100.0%) |
Household Income by Mortgage Status in Shoemakersville borough
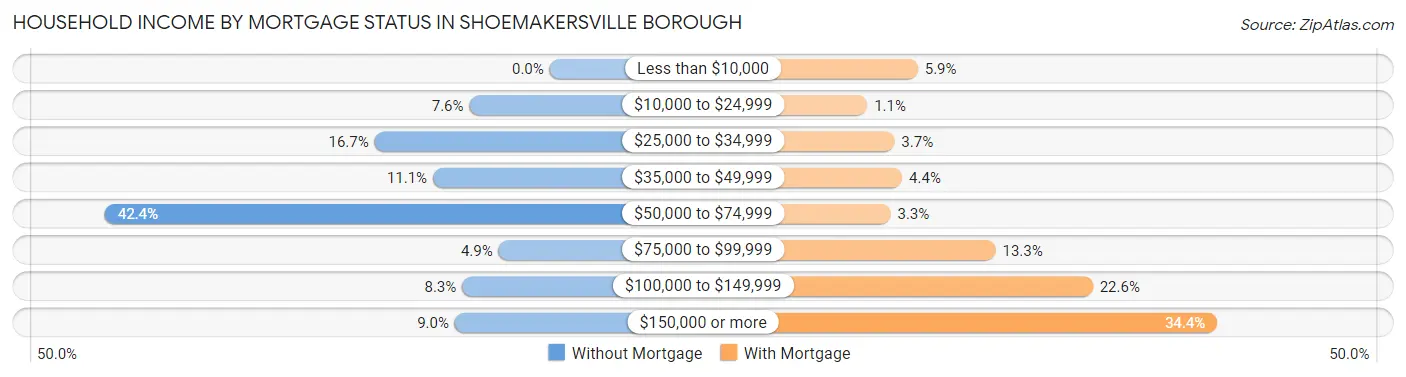
| Household Income | Without Mortgage | With Mortgage |
| Less than $10,000 | 0 (0.0%) | 16 (5.9%) |
| $10,000 to $24,999 | 11 (7.6%) | 3 (1.1%) |
| $25,000 to $34,999 | 24 (16.7%) | 10 (3.7%) |
| $35,000 to $49,999 | 16 (11.1%) | 12 (4.4%) |
| $50,000 to $74,999 | 61 (42.4%) | 9 (3.3%) |
| $75,000 to $99,999 | 7 (4.9%) | 36 (13.3%) |
| $100,000 to $149,999 | 12 (8.3%) | 61 (22.6%) |
| $150,000 or more | 13 (9.0%) | 93 (34.4%) |
| Total | 144 (100.0%) | 270 (100.0%) |
Property Value to Household Income Ratio in Shoemakersville borough
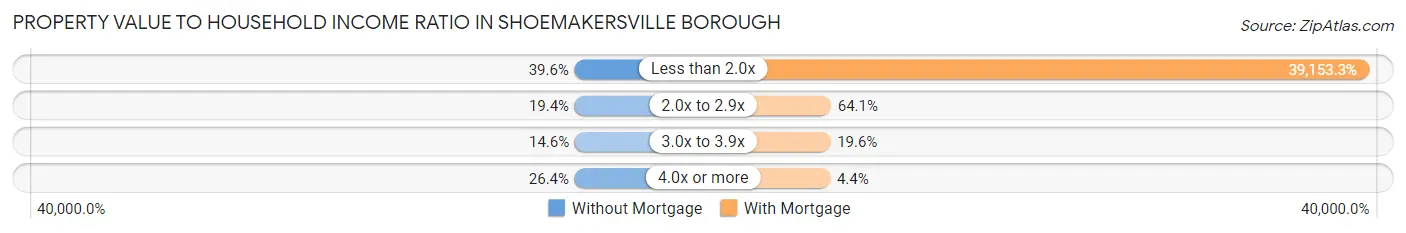
| Value-to-Income Ratio | Without Mortgage | With Mortgage |
| Less than 2.0x | 57 (39.6%) | 105,714 (39,153.3%) |
| 2.0x to 2.9x | 28 (19.4%) | 173 (64.1%) |
| 3.0x to 3.9x | 21 (14.6%) | 53 (19.6%) |
| 4.0x or more | 38 (26.4%) | 12 (4.4%) |
| Total | 144 (100.0%) | 270 (100.0%) |
Real Estate Taxes by Mortgage Status in Shoemakersville borough
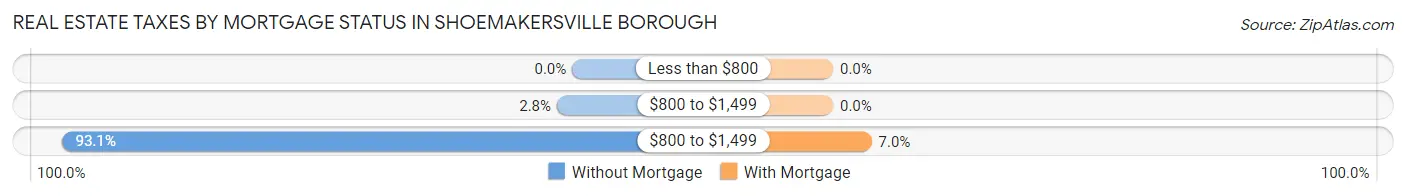
| Property Taxes | Without Mortgage | With Mortgage |
| Less than $800 | 0 (0.0%) | 0 (0.0%) |
| $800 to $1,499 | 4 (2.8%) | 0 (0.0%) |
| $800 to $1,499 | 134 (93.1%) | 19 (7.0%) |
| Total | 144 (100.0%) | 270 (100.0%) |
Health & Disability in Shoemakersville borough
Health Insurance Coverage by Age in Shoemakersville borough
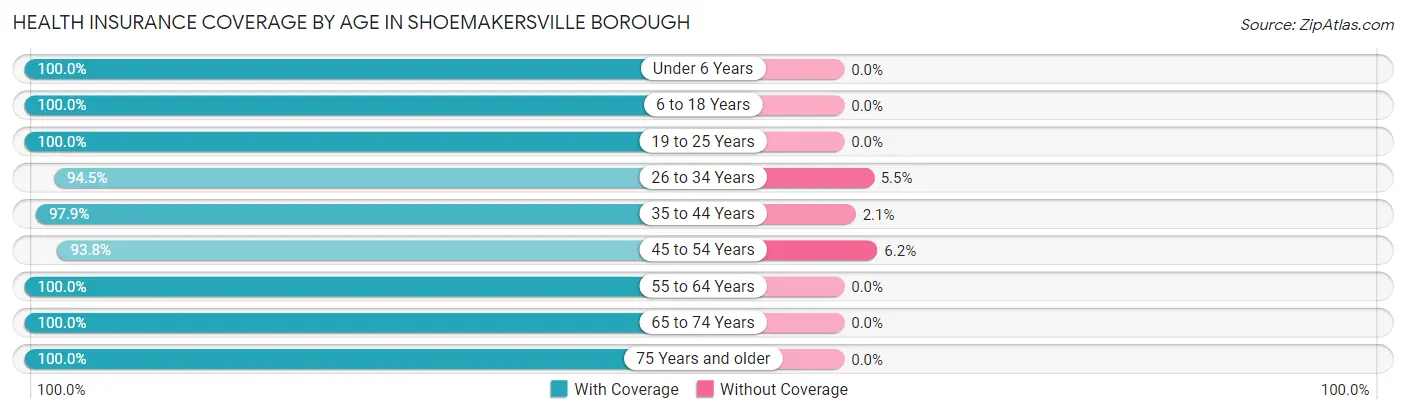
| Age Bracket | With Coverage | Without Coverage |
| Under 6 Years | 78 (100.0%) | 0 (0.0%) |
| 6 to 18 Years | 218 (100.0%) | 0 (0.0%) |
| 19 to 25 Years | 148 (100.0%) | 0 (0.0%) |
| 26 to 34 Years | 172 (94.5%) | 10 (5.5%) |
| 35 to 44 Years | 138 (97.9%) | 3 (2.1%) |
| 45 to 54 Years | 228 (93.8%) | 15 (6.2%) |
| 55 to 64 Years | 197 (100.0%) | 0 (0.0%) |
| 65 to 74 Years | 126 (100.0%) | 0 (0.0%) |
| 75 Years and older | 90 (100.0%) | 0 (0.0%) |
| Total | 1,395 (98.0%) | 28 (2.0%) |
Health Insurance Coverage by Citizenship Status in Shoemakersville borough
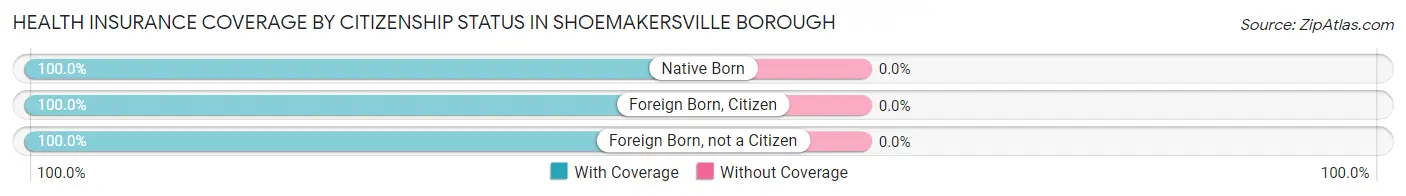
| Citizenship Status | With Coverage | Without Coverage |
| Native Born | 78 (100.0%) | 0 (0.0%) |
| Foreign Born, Citizen | 218 (100.0%) | 0 (0.0%) |
| Foreign Born, not a Citizen | 148 (100.0%) | 0 (0.0%) |
Health Insurance Coverage by Household Income in Shoemakersville borough
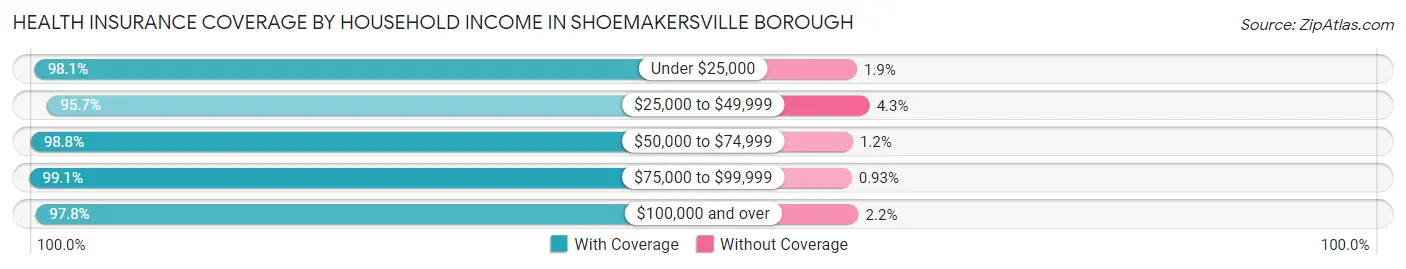
| Household Income | With Coverage | Without Coverage |
| Under $25,000 | 154 (98.1%) | 3 (1.9%) |
| $25,000 to $49,999 | 156 (95.7%) | 7 (4.3%) |
| $50,000 to $74,999 | 342 (98.8%) | 4 (1.2%) |
| $75,000 to $99,999 | 214 (99.1%) | 2 (0.9%) |
| $100,000 and over | 529 (97.8%) | 12 (2.2%) |
Public vs Private Health Insurance Coverage by Age in Shoemakersville borough
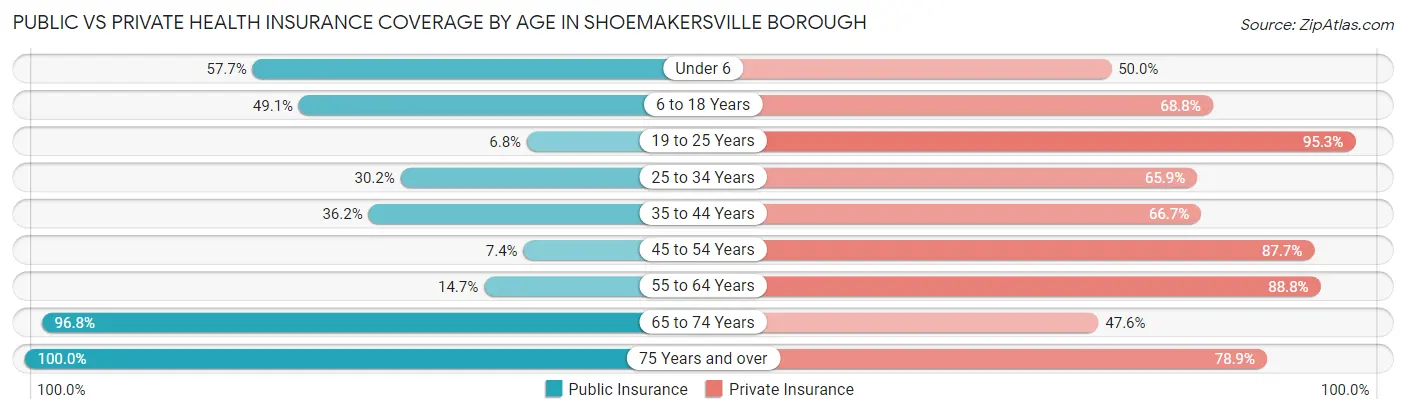
| Age Bracket | Public Insurance | Private Insurance |
| Under 6 | 45 (57.7%) | 39 (50.0%) |
| 6 to 18 Years | 107 (49.1%) | 150 (68.8%) |
| 19 to 25 Years | 10 (6.8%) | 141 (95.3%) |
| 25 to 34 Years | 55 (30.2%) | 120 (65.9%) |
| 35 to 44 Years | 51 (36.2%) | 94 (66.7%) |
| 45 to 54 Years | 18 (7.4%) | 213 (87.6%) |
| 55 to 64 Years | 29 (14.7%) | 175 (88.8%) |
| 65 to 74 Years | 122 (96.8%) | 60 (47.6%) |
| 75 Years and over | 90 (100.0%) | 71 (78.9%) |
| Total | 527 (37.0%) | 1,063 (74.7%) |
Disability Status by Sex by Age in Shoemakersville borough
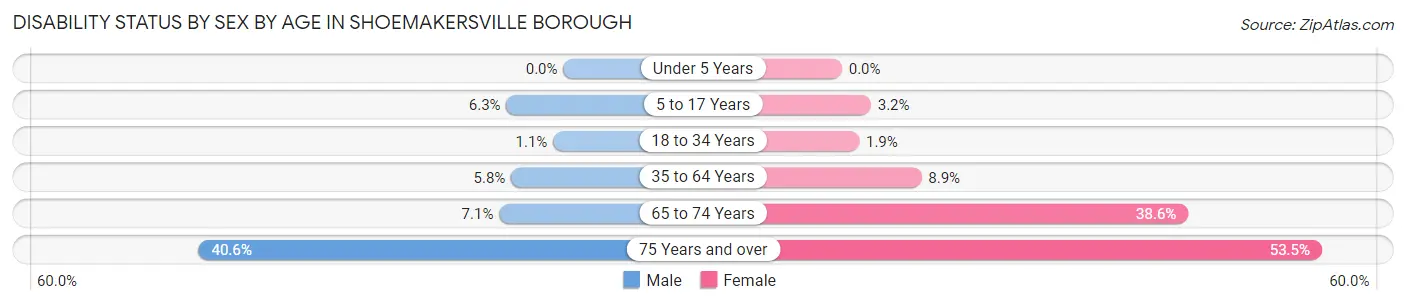
| Age Bracket | Male | Female |
| Under 5 Years | 0 (0.0%) | 0 (0.0%) |
| 5 to 17 Years | 9 (6.3%) | 3 (3.2%) |
| 18 to 34 Years | 2 (1.1%) | 3 (1.9%) |
| 35 to 64 Years | 18 (5.8%) | 24 (8.9%) |
| 65 to 74 Years | 4 (7.1%) | 27 (38.6%) |
| 75 Years and over | 13 (40.6%) | 31 (53.4%) |
Disability Class by Sex by Age in Shoemakersville borough
Disability Class: Hearing Difficulty
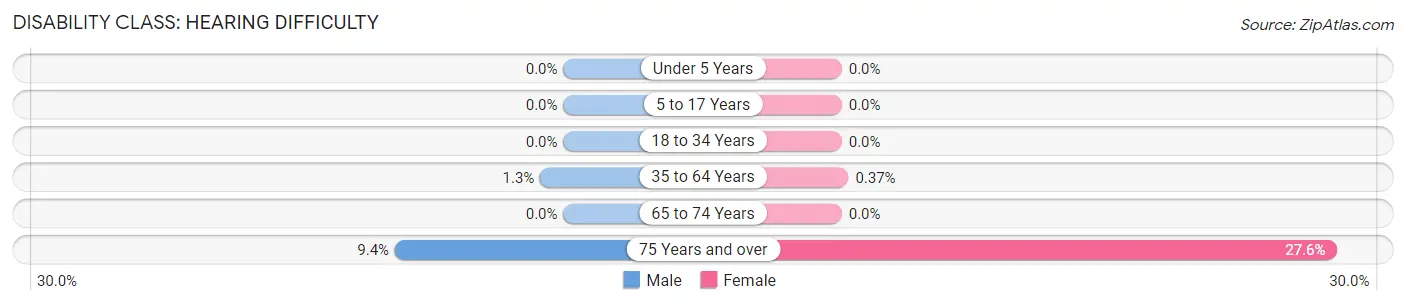
| Age Bracket | Male | Female |
| Under 5 Years | 0 (0.0%) | 0 (0.0%) |
| 5 to 17 Years | 0 (0.0%) | 0 (0.0%) |
| 18 to 34 Years | 0 (0.0%) | 0 (0.0%) |
| 35 to 64 Years | 4 (1.3%) | 1 (0.4%) |
| 65 to 74 Years | 0 (0.0%) | 0 (0.0%) |
| 75 Years and over | 3 (9.4%) | 16 (27.6%) |
Disability Class: Vision Difficulty
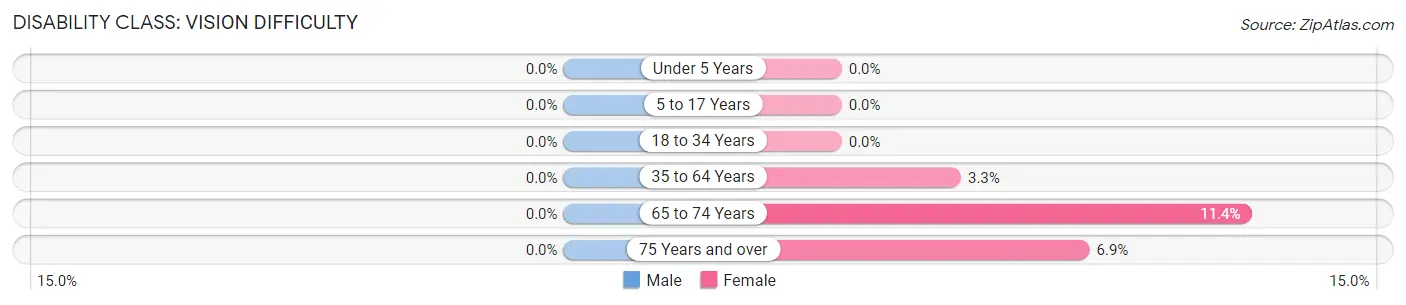
| Age Bracket | Male | Female |
| Under 5 Years | 0 (0.0%) | 0 (0.0%) |
| 5 to 17 Years | 0 (0.0%) | 0 (0.0%) |
| 18 to 34 Years | 0 (0.0%) | 0 (0.0%) |
| 35 to 64 Years | 0 (0.0%) | 9 (3.3%) |
| 65 to 74 Years | 0 (0.0%) | 8 (11.4%) |
| 75 Years and over | 0 (0.0%) | 4 (6.9%) |
Disability Class: Cognitive Difficulty
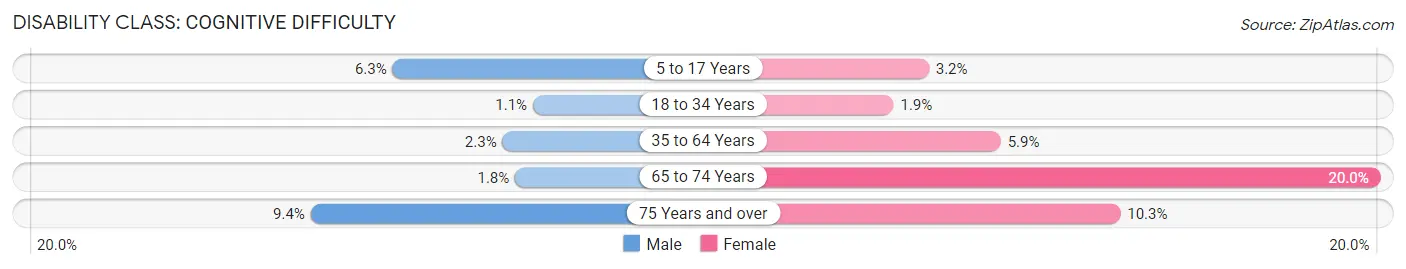
| Age Bracket | Male | Female |
| 5 to 17 Years | 9 (6.3%) | 3 (3.2%) |
| 18 to 34 Years | 2 (1.1%) | 3 (1.9%) |
| 35 to 64 Years | 7 (2.3%) | 16 (5.9%) |
| 65 to 74 Years | 1 (1.8%) | 14 (20.0%) |
| 75 Years and over | 3 (9.4%) | 6 (10.3%) |
Disability Class: Ambulatory Difficulty
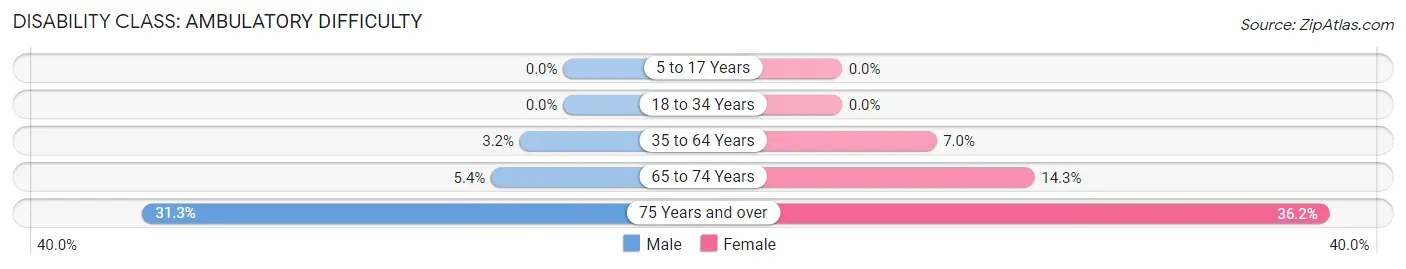
| Age Bracket | Male | Female |
| 5 to 17 Years | 0 (0.0%) | 0 (0.0%) |
| 18 to 34 Years | 0 (0.0%) | 0 (0.0%) |
| 35 to 64 Years | 10 (3.2%) | 19 (7.0%) |
| 65 to 74 Years | 3 (5.4%) | 10 (14.3%) |
| 75 Years and over | 10 (31.2%) | 21 (36.2%) |
Disability Class: Self-Care Difficulty
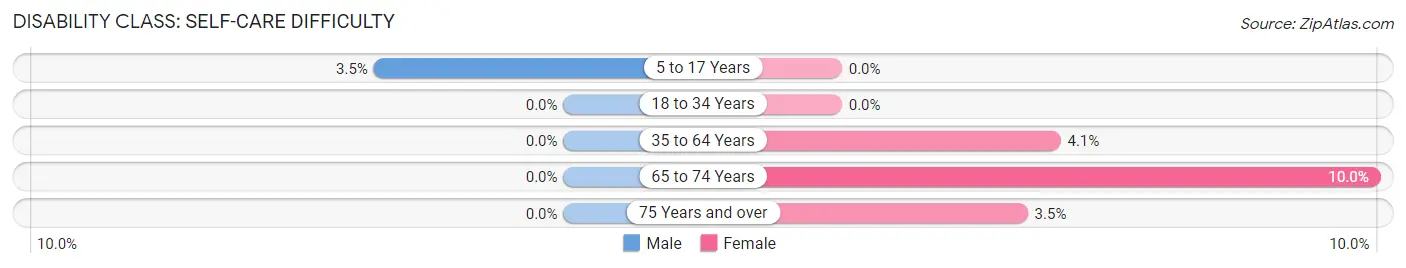
| Age Bracket | Male | Female |
| 5 to 17 Years | 5 (3.5%) | 0 (0.0%) |
| 18 to 34 Years | 0 (0.0%) | 0 (0.0%) |
| 35 to 64 Years | 0 (0.0%) | 11 (4.1%) |
| 65 to 74 Years | 0 (0.0%) | 7 (10.0%) |
| 75 Years and over | 0 (0.0%) | 2 (3.5%) |
Technology Access in Shoemakersville borough
Computing Device Access in Shoemakersville borough
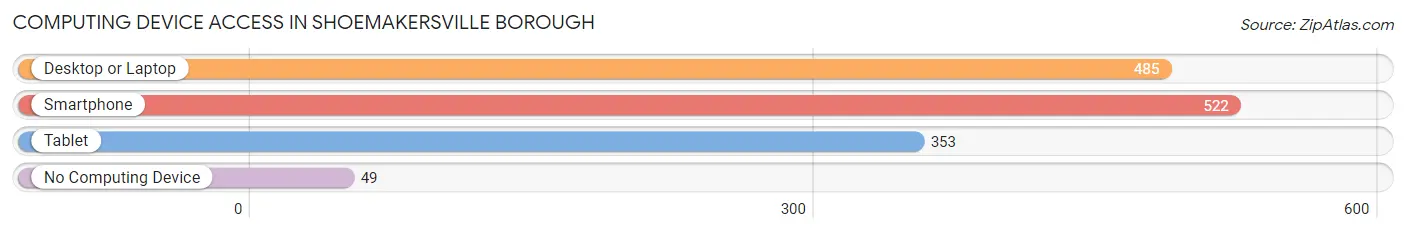
| Device Type | # Households | % Households |
| Desktop or Laptop | 485 | 78.0% |
| Smartphone | 522 | 83.9% |
| Tablet | 353 | 56.8% |
| No Computing Device | 49 | 7.9% |
| Total | 622 | 100.0% |
Internet Access in Shoemakersville borough
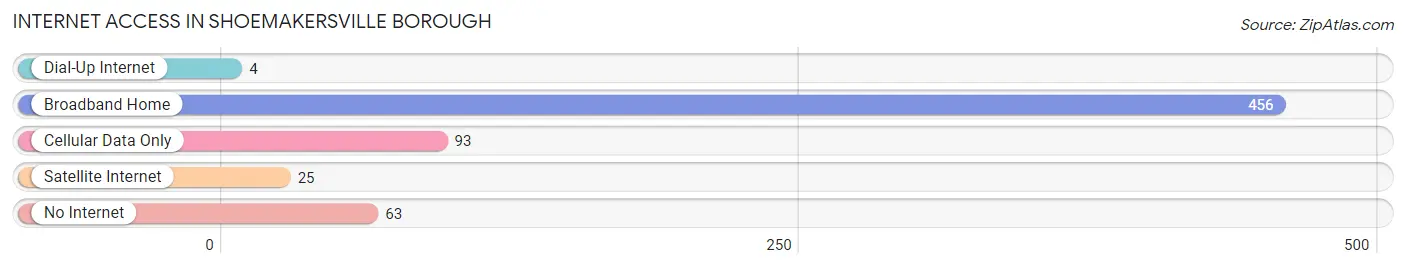
| Internet Type | # Households | % Households |
| Dial-Up Internet | 4 | 0.6% |
| Broadband Home | 456 | 73.3% |
| Cellular Data Only | 93 | 14.9% |
| Satellite Internet | 25 | 4.0% |
| No Internet | 63 | 10.1% |
| Total | 622 | 100.0% |
Shoemakersville borough Summary
Shoemakersville Borough is a small borough located in Berks County, Pennsylvania. It is situated in the Schuylkill River Valley, approximately 10 miles northwest of Reading. The borough was incorporated in 1876 and has a population of 1,717 as of the 2010 census.
History
Shoemakersville was founded in 1750 by a group of German settlers led by Jacob Shoemaker. The settlers were attracted to the area by the abundance of natural resources, including the Schuylkill River and its tributaries, which provided a source of power for the early industries. The first industry in the area was a grist mill, which was built in 1753. This was followed by a sawmill, a tannery, and a distillery.
The town was officially incorporated in 1876 and was named after its founder, Jacob Shoemaker. The town grew steadily throughout the 19th century, with the population reaching 1,000 by 1900. The town was home to a variety of industries, including a brickyard, a cigar factory, and a furniture factory.
Geography
Shoemakersville is located in Berks County, Pennsylvania, approximately 10 miles northwest of Reading. The borough is situated in the Schuylkill River Valley, which is part of the Appalachian Mountains. The borough is bordered by Perry Township to the north, Tilden Township to the east, and Perry Township to the south. The borough covers an area of 0.8 square miles and has a population of 1,717 as of the 2010 census.
The borough is located in a rural area and is surrounded by farmland. The Schuylkill River runs through the borough and is a popular destination for fishing and boating. The borough is also home to several parks, including Shoemakersville Park, which features a playground, picnic area, and walking trails.
Economy
The economy of Shoemakersville is largely based on agriculture and manufacturing. The borough is home to several farms, which produce a variety of crops, including corn, soybeans, and hay. The borough is also home to several manufacturing companies, including a furniture factory, a brickyard, and a cigar factory.
The borough is also home to several small businesses, including restaurants, retail stores, and service providers. The borough is served by the Reading Area Community College, which offers a variety of educational and training programs.
Demographics
As of the 2010 census, the population of Shoemakersville was 1,717. The racial makeup of the borough was 97.3% White, 0.9% African American, 0.2% Native American, 0.3% Asian, 0.1% Pacific Islander, 0.3% from other races, and 0.9% from two or more races. Hispanic or Latino of any race were 1.2% of the population.
The median household income in the borough was $45,938, and the median family income was $51,250. The per capita income was $20,945. About 8.3% of families and 10.2% of the population were below the poverty line, including 14.2% of those under age 18 and 6.2% of those age 65 or over.
Common Questions
What is Per Capita Income in Shoemakersville borough?
Per Capita income in Shoemakersville borough is $35,308.
What is the Median Family Income in Shoemakersville borough?
Median Family Income in Shoemakersville borough is $86,923.
What is the Median Household income in Shoemakersville borough?
Median Household Income in Shoemakersville borough is $70,833.
What is Income or Wage Gap in Shoemakersville borough?
Income or Wage Gap in Shoemakersville borough is 35.3%.
Women in Shoemakersville borough earn 64.7 cents for every dollar earned by a man.
What is Inequality or Gini Index in Shoemakersville borough?
Inequality or Gini Index in Shoemakersville borough is 0.36.
What is the Total Population of Shoemakersville borough?
Total Population of Shoemakersville borough is 1,427.
What is the Total Male Population of Shoemakersville borough?
Total Male Population of Shoemakersville borough is 753.
What is the Total Female Population of Shoemakersville borough?
Total Female Population of Shoemakersville borough is 674.
What is the Ratio of Males per 100 Females in Shoemakersville borough?
There are 111.72 Males per 100 Females in Shoemakersville borough.
What is the Ratio of Females per 100 Males in Shoemakersville borough?
There are 89.51 Females per 100 Males in Shoemakersville borough.
What is the Median Population Age in Shoemakersville borough?
Median Population Age in Shoemakersville borough is 39.9 Years.
What is the Average Family Size in Shoemakersville borough
Average Family Size in Shoemakersville borough is 2.8 People.
What is the Average Household Size in Shoemakersville borough
Average Household Size in Shoemakersville borough is 2.3 People.
How Large is the Labor Force in Shoemakersville borough?
There are 893 People in the Labor Forcein in Shoemakersville borough.
What is the Percentage of People in the Labor Force in Shoemakersville borough?
75.7% of People are in the Labor Force in Shoemakersville borough.
What is the Unemployment Rate in Shoemakersville borough?
Unemployment Rate in Shoemakersville borough is 4.7%.