Gastonville, PA Map & Demographics
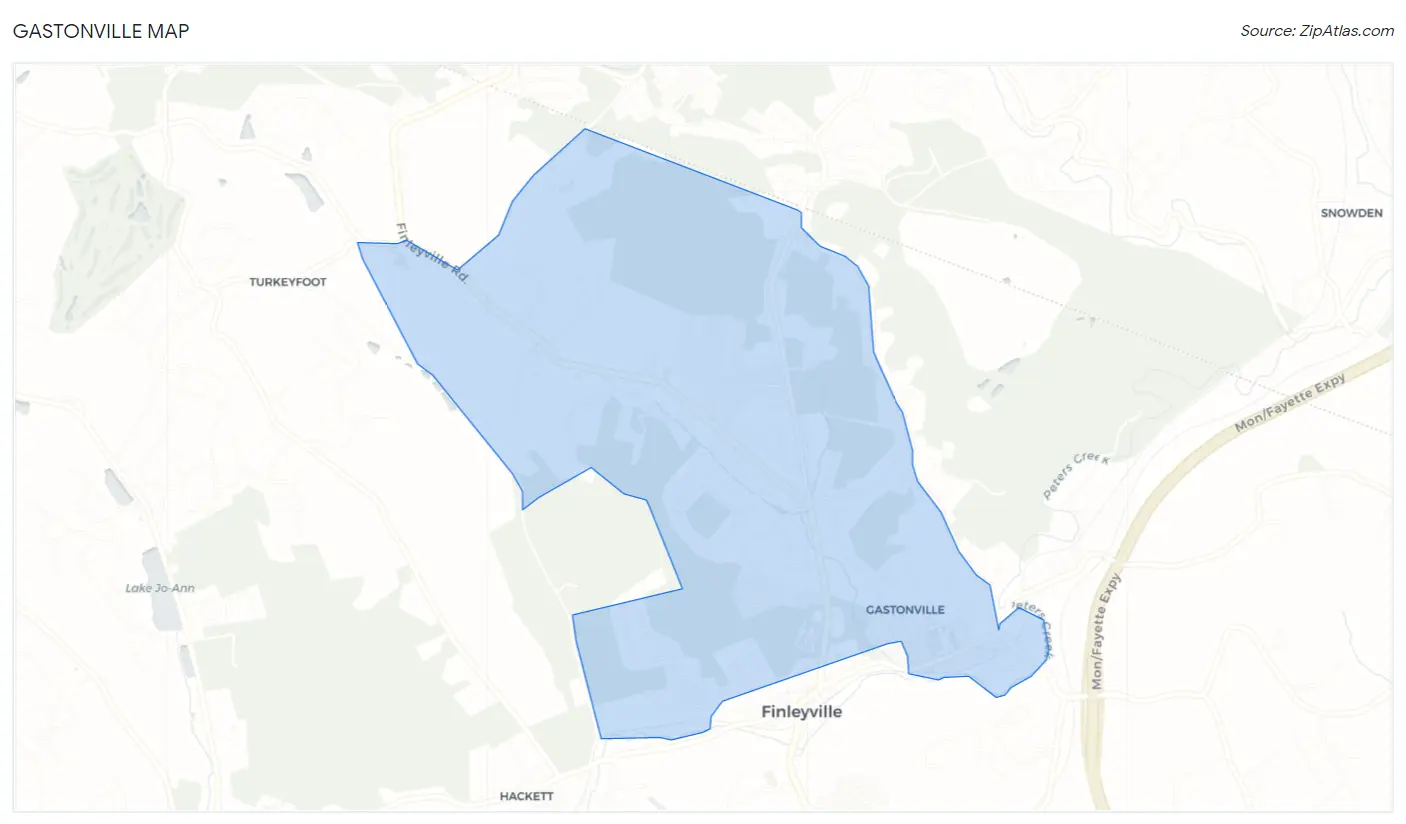
Gastonville Map
Gastonville Overview
$44,098
PER CAPITA INCOME
$86,219
AVG FAMILY INCOME
$78,953
AVG HOUSEHOLD INCOME
43.9%
WAGE / INCOME GAP [ % ]
56.1¢/ $1
WAGE / INCOME GAP [ $ ]
0.41
INEQUALITY / GINI INDEX
2,575
TOTAL POPULATION
1,252
MALE POPULATION
1,323
FEMALE POPULATION
94.63
MALES / 100 FEMALES
105.67
FEMALES / 100 MALES
53.3
MEDIAN AGE
2.6
AVG FAMILY SIZE
2.0
AVG HOUSEHOLD SIZE
1,485
LABOR FORCE [ PEOPLE ]
64.3%
PERCENT IN LABOR FORCE
0.9%
UNEMPLOYMENT RATE
Gastonville Area Codes
Income in Gastonville
Income Overview in Gastonville
Per Capita Income in Gastonville is $44,098, while median incomes of families and households are $86,219 and $78,953 respectively.
| Characteristic | Number | Measure |
| Per Capita Income | 2,575 | $44,098 |
| Median Family Income | 727 | $86,219 |
| Mean Family Income | 727 | $103,464 |
| Median Household Income | 1,281 | $78,953 |
| Mean Household Income | 1,281 | $86,896 |
| Income Deficit | 727 | $0 |
| Wage / Income Gap (%) | 2,575 | 43.91% |
| Wage / Income Gap ($) | 2,575 | 56.09¢ per $1 |
| Gini / Inequality Index | 2,575 | 0.41 |
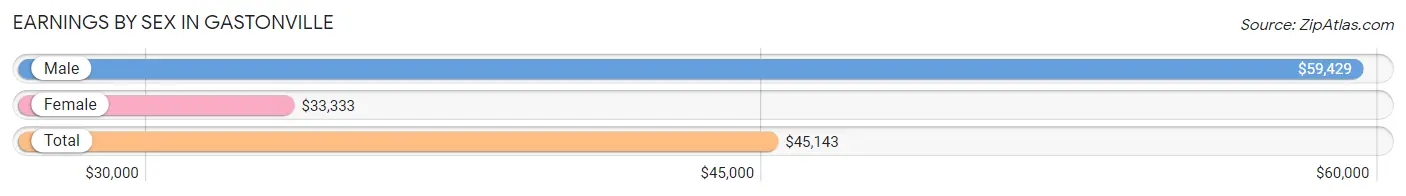
Earnings by Sex in Gastonville
Average Earnings in Gastonville are $45,143, $59,429 for men and $33,333 for women, a difference of 43.9%.
| Sex | Number | Average Earnings |
| Male | 791 (51.8%) | $59,429 |
| Female | 736 (48.2%) | $33,333 |
| Total | 1,527 (100.0%) | $45,143 |
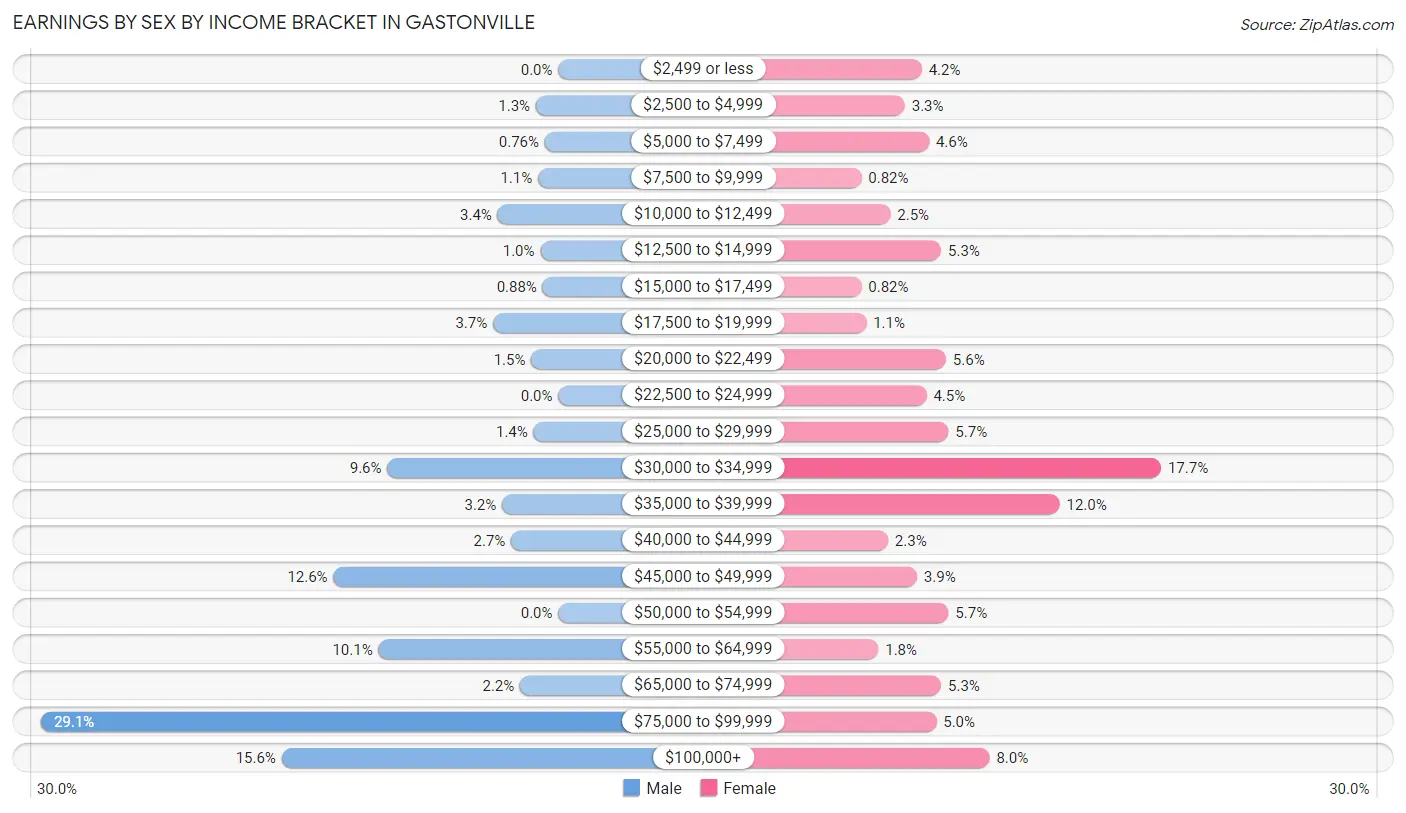
Earnings by Sex by Income Bracket in Gastonville
The most common earnings brackets in Gastonville are $75,000 to $99,999 for men (230 | 29.1%) and $30,000 to $34,999 for women (130 | 17.7%).
| Income | Male | Female |
| $2,499 or less | 0 (0.0%) | 31 (4.2%) |
| $2,500 to $4,999 | 10 (1.3%) | 24 (3.3%) |
| $5,000 to $7,499 | 6 (0.8%) | 34 (4.6%) |
| $7,500 to $9,999 | 9 (1.1%) | 6 (0.8%) |
| $10,000 to $12,499 | 27 (3.4%) | 18 (2.5%) |
| $12,500 to $14,999 | 8 (1.0%) | 39 (5.3%) |
| $15,000 to $17,499 | 7 (0.9%) | 6 (0.8%) |
| $17,500 to $19,999 | 29 (3.7%) | 8 (1.1%) |
| $20,000 to $22,499 | 12 (1.5%) | 41 (5.6%) |
| $22,500 to $24,999 | 0 (0.0%) | 33 (4.5%) |
| $25,000 to $29,999 | 11 (1.4%) | 42 (5.7%) |
| $30,000 to $34,999 | 76 (9.6%) | 130 (17.7%) |
| $35,000 to $39,999 | 25 (3.2%) | 88 (12.0%) |
| $40,000 to $44,999 | 21 (2.6%) | 17 (2.3%) |
| $45,000 to $49,999 | 100 (12.6%) | 29 (3.9%) |
| $50,000 to $54,999 | 0 (0.0%) | 42 (5.7%) |
| $55,000 to $64,999 | 80 (10.1%) | 13 (1.8%) |
| $65,000 to $74,999 | 17 (2.1%) | 39 (5.3%) |
| $75,000 to $99,999 | 230 (29.1%) | 37 (5.0%) |
| $100,000+ | 123 (15.5%) | 59 (8.0%) |
| Total | 791 (100.0%) | 736 (100.0%) |
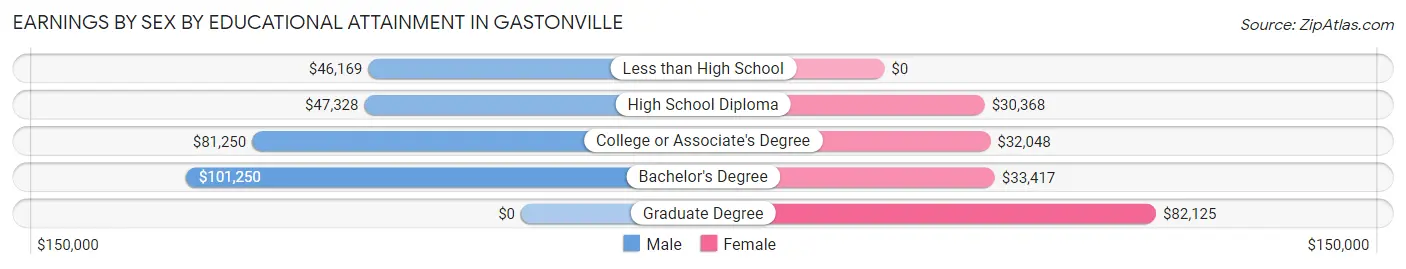
Earnings by Sex by Educational Attainment in Gastonville
Average earnings in Gastonville are $62,250 for men and $32,324 for women, a difference of 48.1%. Men with an educational attainment of bachelor's degree enjoy the highest average annual earnings of $101,250, while those with less than high school education earn the least with $46,169. Women with an educational attainment of graduate degree earn the most with the average annual earnings of $82,125, while those with high school diploma education have the smallest earnings of $30,368.
| Educational Attainment | Male Income | Female Income |
| Less than High School | $46,169 | $0 |
| High School Diploma | $47,328 | $30,368 |
| College or Associate's Degree | $81,250 | $32,048 |
| Bachelor's Degree | $101,250 | $33,417 |
| Graduate Degree | - | - |
| Total | $62,250 | $32,324 |
Family Income in Gastonville
Family Income Brackets in Gastonville
According to the Gastonville family income data, there are 169 families falling into the $75,000 to $99,999 income range, which is the most common income bracket and makes up 23.3% of all families.
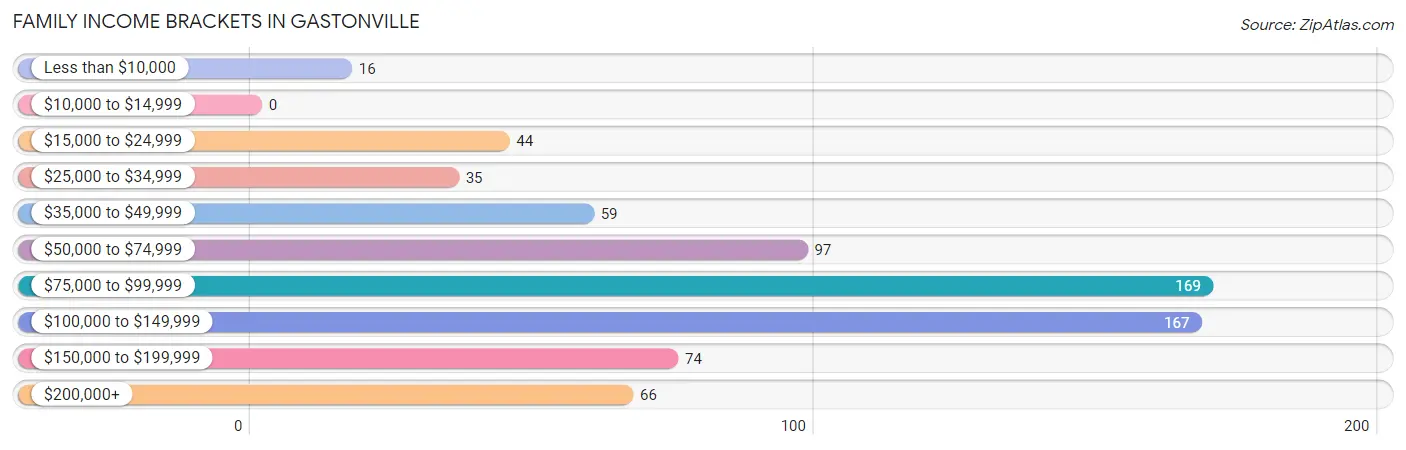
| Income Bracket | # Families | % Families |
| Less than $10,000 | 16 | 2.2% |
| $10,000 to $14,999 | 0 | 0.0% |
| $15,000 to $24,999 | 44 | 6.1% |
| $25,000 to $34,999 | 35 | 4.8% |
| $35,000 to $49,999 | 59 | 8.1% |
| $50,000 to $74,999 | 97 | 13.3% |
| $75,000 to $99,999 | 169 | 23.2% |
| $100,000 to $149,999 | 167 | 23.0% |
| $150,000 to $199,999 | 74 | 10.2% |
| $200,000+ | 66 | 9.1% |
Family Income by Famaliy Size in Gastonville
5-person families (45 | 6.2%) account for the highest median family income in Gastonville with $202,656 per family, while 3-person families (129 | 17.7%) have the highest median income of $41,477 per family member.
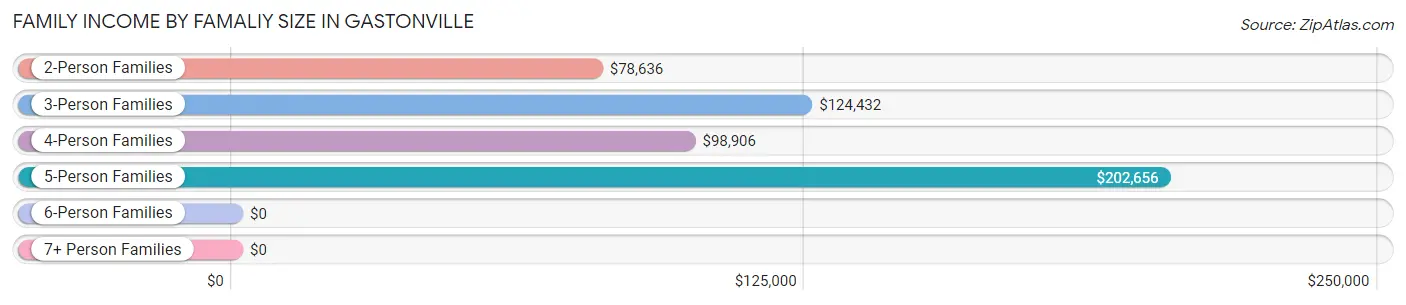
| Income Bracket | # Families | Median Income |
| 2-Person Families | 494 (67.9%) | $78,636 |
| 3-Person Families | 129 (17.7%) | $124,432 |
| 4-Person Families | 59 (8.1%) | $98,906 |
| 5-Person Families | 45 (6.2%) | $202,656 |
| 6-Person Families | 0 (0.0%) | $0 |
| 7+ Person Families | 0 (0.0%) | $0 |
| Total | 727 (100.0%) | $86,219 |
Family Income by Number of Earners in Gastonville
The median family income in Gastonville is $86,219, with families comprising 3+ earners (62) having the highest median family income of $197,500, while families with 1 earner (197) have the lowest median family income of $56,406, accounting for 8.5% and 27.1% of families, respectively.
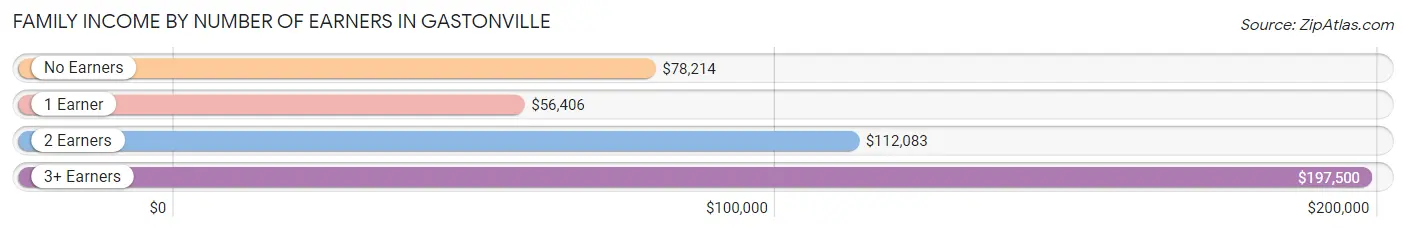
| Number of Earners | # Families | Median Income |
| No Earners | 154 (21.2%) | $78,214 |
| 1 Earner | 197 (27.1%) | $56,406 |
| 2 Earners | 314 (43.2%) | $112,083 |
| 3+ Earners | 62 (8.5%) | $197,500 |
| Total | 727 (100.0%) | $86,219 |
Household Income in Gastonville
Household Income Brackets in Gastonville
With 298 households falling in the category, the $75,000 to $99,999 income range is the most frequent in Gastonville, accounting for 23.3% of all households. In contrast, only 23 households (1.8%) fall into the $10,000 to $14,999 income bracket, making it the least populous group.
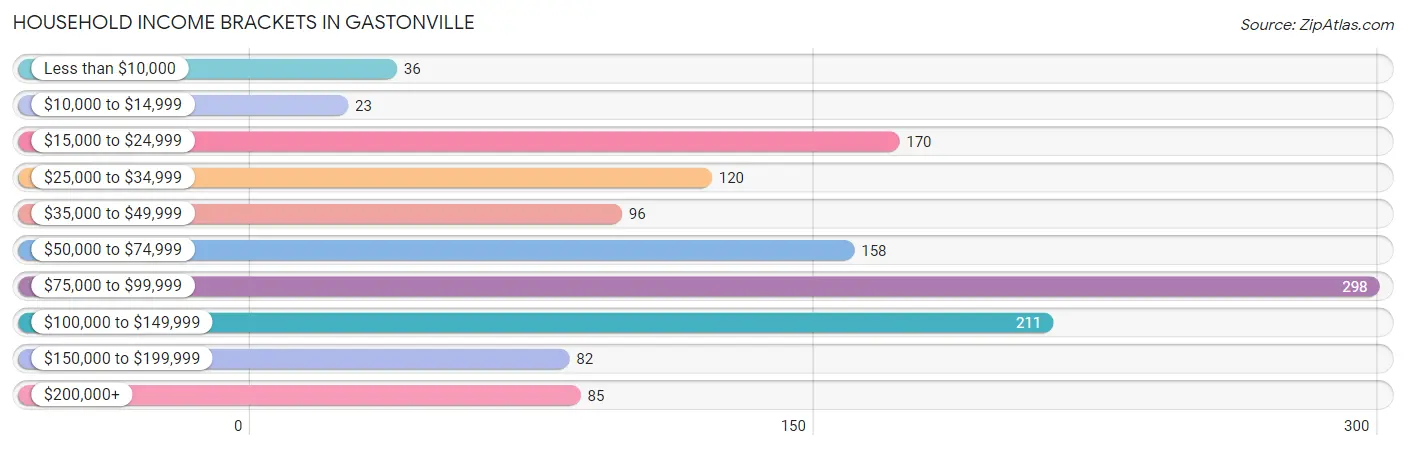
| Income Bracket | # Households | % Households |
| Less than $10,000 | 36 | 2.8% |
| $10,000 to $14,999 | 23 | 1.8% |
| $15,000 to $24,999 | 170 | 13.3% |
| $25,000 to $34,999 | 120 | 9.4% |
| $35,000 to $49,999 | 96 | 7.5% |
| $50,000 to $74,999 | 158 | 12.3% |
| $75,000 to $99,999 | 298 | 23.3% |
| $100,000 to $149,999 | 211 | 16.5% |
| $150,000 to $199,999 | 82 | 6.4% |
| $200,000+ | 85 | 6.6% |
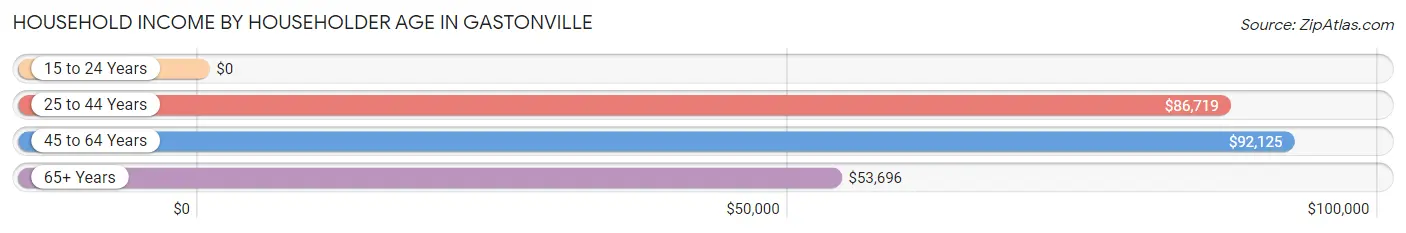
Household Income by Householder Age in Gastonville
The median household income in Gastonville is $78,953, with the highest median household income of $92,125 found in the 45 to 64 years age bracket for the primary householder. A total of 471 households (36.8%) fall into this category. Meanwhile, the 15 to 24 years age bracket for the primary householder has the lowest median household income of $0, with 90 households (7.0%) in this group.
| Income Bracket | # Households | Median Income |
| 15 to 24 Years | 90 (7.0%) | $0 |
| 25 to 44 Years | 216 (16.9%) | $86,719 |
| 45 to 64 Years | 471 (36.8%) | $92,125 |
| 65+ Years | 504 (39.3%) | $53,696 |
| Total | 1,281 (100.0%) | $78,953 |
Poverty in Gastonville
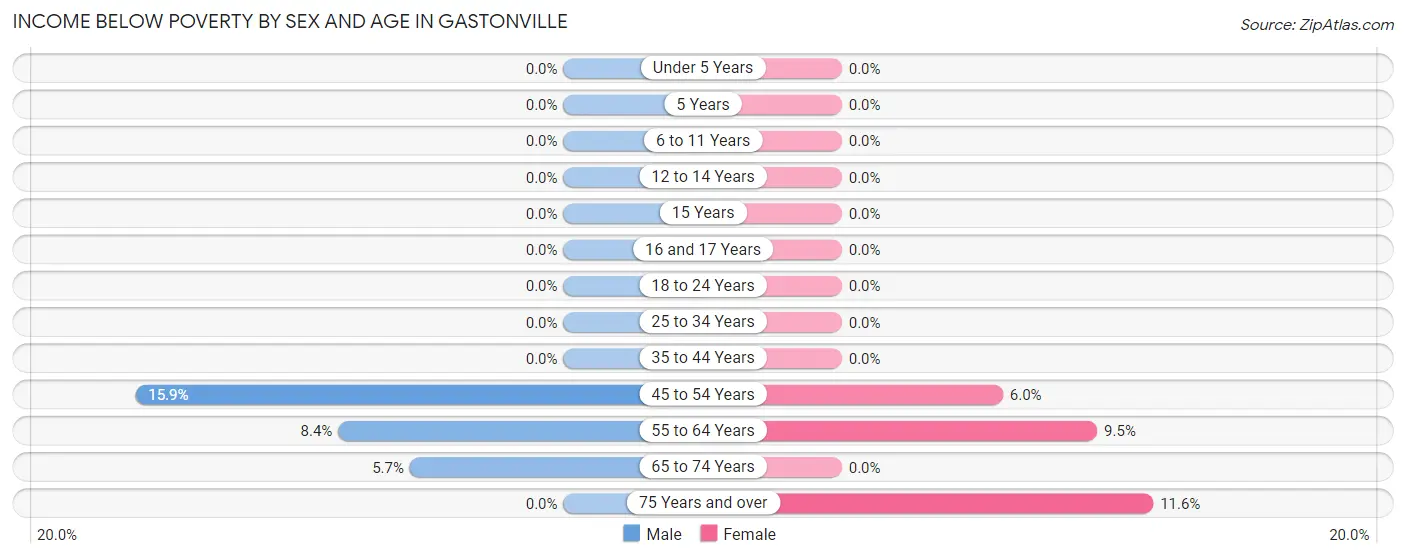
Income Below Poverty by Sex and Age in Gastonville
With 4.5% poverty level for males and 4.1% for females among the residents of Gastonville, 45 to 54 year old males and 75 year old and over females are the most vulnerable to poverty, with 24 males (15.9%) and 23 females (11.6%) in their respective age groups living below the poverty level.
| Age Bracket | Male | Female |
| Under 5 Years | 0 (0.0%) | 0 (0.0%) |
| 5 Years | 0 (0.0%) | 0 (0.0%) |
| 6 to 11 Years | 0 (0.0%) | 0 (0.0%) |
| 12 to 14 Years | 0 (0.0%) | 0 (0.0%) |
| 15 Years | 0 (0.0%) | 0 (0.0%) |
| 16 and 17 Years | 0 (0.0%) | 0 (0.0%) |
| 18 to 24 Years | 0 (0.0%) | 0 (0.0%) |
| 25 to 34 Years | 0 (0.0%) | 0 (0.0%) |
| 35 to 44 Years | 0 (0.0%) | 0 (0.0%) |
| 45 to 54 Years | 24 (15.9%) | 11 (6.0%) |
| 55 to 64 Years | 23 (8.4%) | 20 (9.5%) |
| 65 to 74 Years | 9 (5.7%) | 0 (0.0%) |
| 75 Years and over | 0 (0.0%) | 23 (11.6%) |
| Total | 56 (4.5%) | 54 (4.1%) |
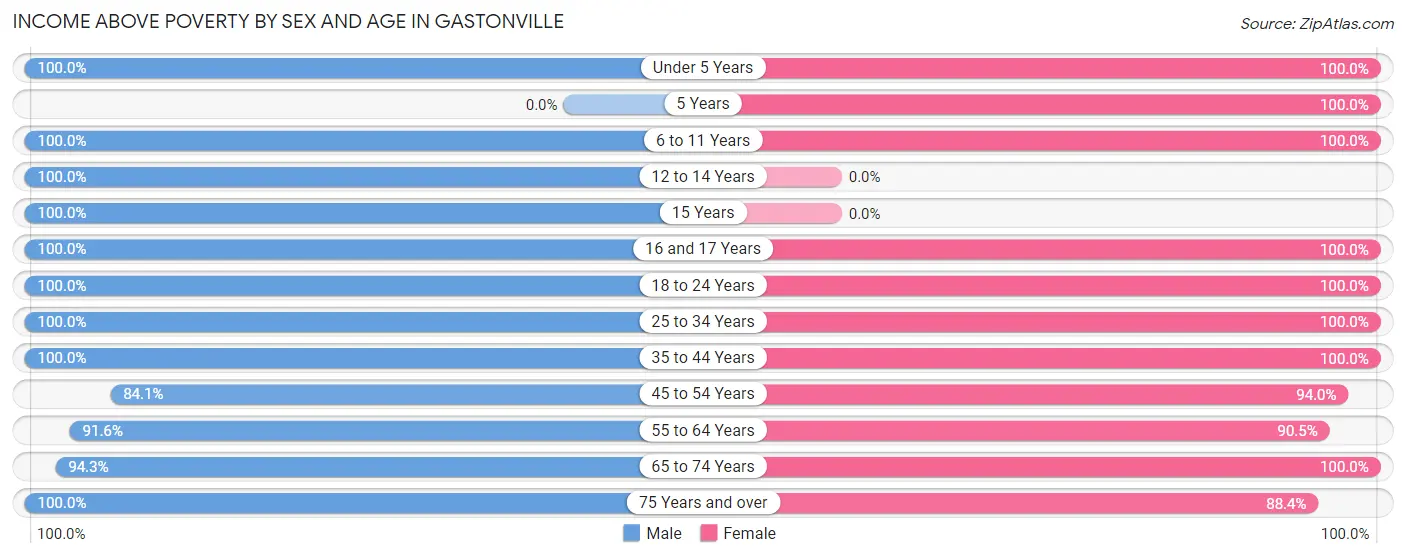
Income Above Poverty by Sex and Age in Gastonville
According to the poverty statistics in Gastonville, males aged under 5 years and females aged under 5 years are the age groups that are most secure financially, with 100.0% of males and 100.0% of females in these age groups living above the poverty line.
| Age Bracket | Male | Female |
| Under 5 Years | 46 (100.0%) | 72 (100.0%) |
| 5 Years | 0 (0.0%) | 26 (100.0%) |
| 6 to 11 Years | 57 (100.0%) | 21 (100.0%) |
| 12 to 14 Years | 17 (100.0%) | 0 (0.0%) |
| 15 Years | 26 (100.0%) | 0 (0.0%) |
| 16 and 17 Years | 18 (100.0%) | 37 (100.0%) |
| 18 to 24 Years | 106 (100.0%) | 107 (100.0%) |
| 25 to 34 Years | 177 (100.0%) | 97 (100.0%) |
| 35 to 44 Years | 147 (100.0%) | 83 (100.0%) |
| 45 to 54 Years | 127 (84.1%) | 173 (94.0%) |
| 55 to 64 Years | 252 (91.6%) | 191 (90.5%) |
| 65 to 74 Years | 149 (94.3%) | 286 (100.0%) |
| 75 Years and over | 74 (100.0%) | 176 (88.4%) |
| Total | 1,196 (95.5%) | 1,269 (95.9%) |
Income Below Poverty Among Married-Couple Families in Gastonville
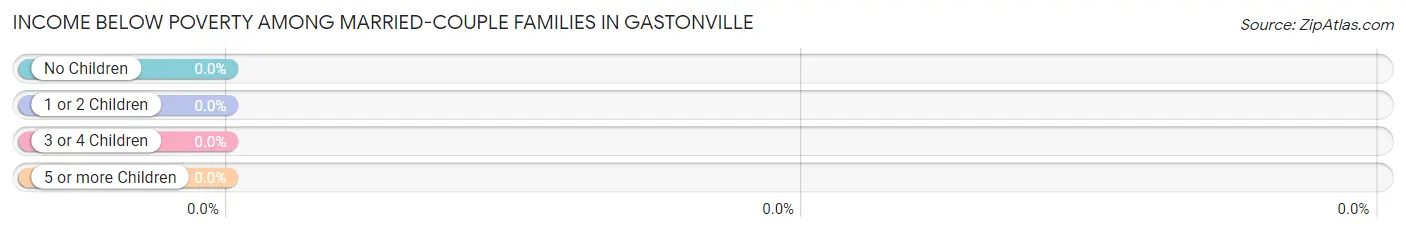
| Children | Above Poverty | Below Poverty |
| No Children | 377 (100.0%) | 0 (0.0%) |
| 1 or 2 Children | 134 (100.0%) | 0 (0.0%) |
| 3 or 4 Children | 13 (100.0%) | 0 (0.0%) |
| 5 or more Children | 0 (0.0%) | 0 (0.0%) |
| Total | 524 (100.0%) | 0 (0.0%) |
Income Below Poverty Among Single-Parent Households in Gastonville
According to the poverty data in Gastonville, 36.4% or 16 single-father households and 6.9% or 11 single-mother households are living below the poverty line. Among single-father households, those with no children have the highest poverty rate, with 16 households (57.1%) experiencing poverty. Likewise, among single-mother households, those with no children have the highest poverty rate, with 11 households (10.9%) falling below the poverty line.
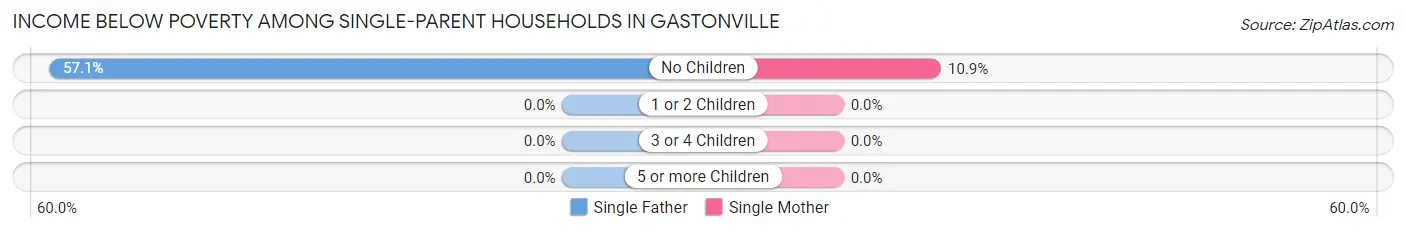
| Children | Single Father | Single Mother |
| No Children | 16 (57.1%) | 11 (10.9%) |
| 1 or 2 Children | 0 (0.0%) | 0 (0.0%) |
| 3 or 4 Children | 0 (0.0%) | 0 (0.0%) |
| 5 or more Children | 0 (0.0%) | 0 (0.0%) |
| Total | 16 (36.4%) | 11 (6.9%) |
Income Below Poverty Among Married-Couple vs Single-Parent Households in Gastonville
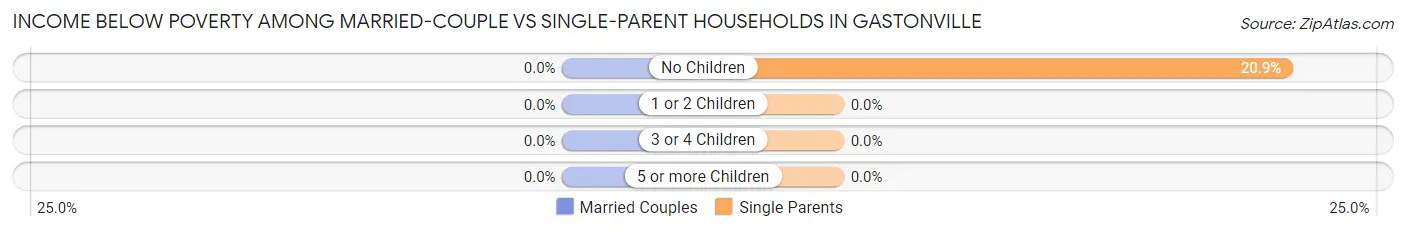
| Children | Married-Couple Families | Single-Parent Households |
| No Children | 0 (0.0%) | 27 (20.9%) |
| 1 or 2 Children | 0 (0.0%) | 0 (0.0%) |
| 3 or 4 Children | 0 (0.0%) | 0 (0.0%) |
| 5 or more Children | 0 (0.0%) | 0 (0.0%) |
| Total | 0 (0.0%) | 27 (13.3%) |
Race in Gastonville
The most populous races in Gastonville are White / Caucasian (2,517 | 97.8%), Black / African American (37 | 1.4%), and Hawaiian / Pacific (20 | 0.8%).
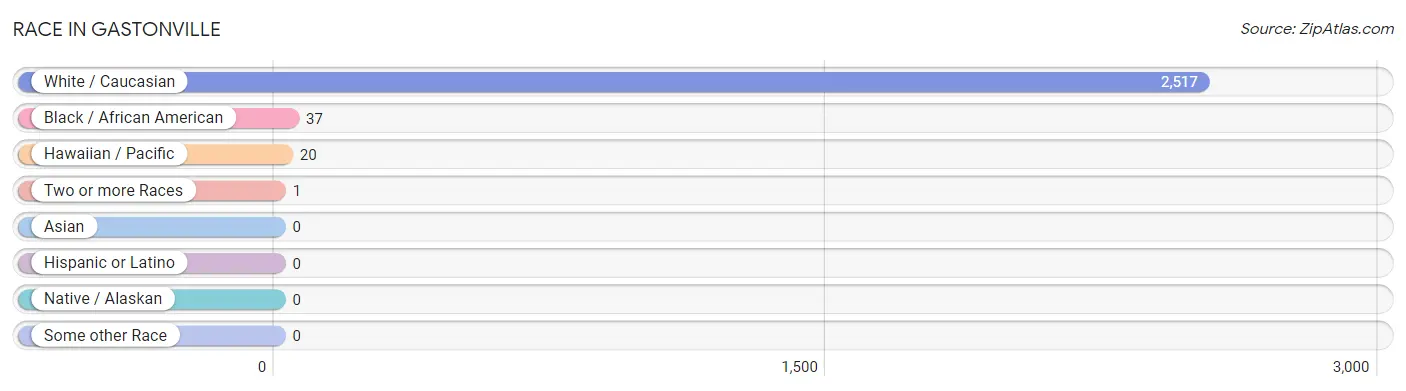
| Race | # Population | % Population |
| Asian | 0 | 0.0% |
| Black / African American | 37 | 1.4% |
| Hawaiian / Pacific | 20 | 0.8% |
| Hispanic or Latino | 0 | 0.0% |
| Native / Alaskan | 0 | 0.0% |
| White / Caucasian | 2,517 | 97.8% |
| Two or more Races | 1 | 0.0% |
| Some other Race | 0 | 0.0% |
| Total | 2,575 | 100.0% |
Ancestry in Gastonville
The most populous ancestries reported in Gastonville are German (864 | 33.6%), English (559 | 21.7%), Irish (517 | 20.1%), Italian (384 | 14.9%), and Polish (307 | 11.9%), together accounting for 102.2% of all Gastonville residents.
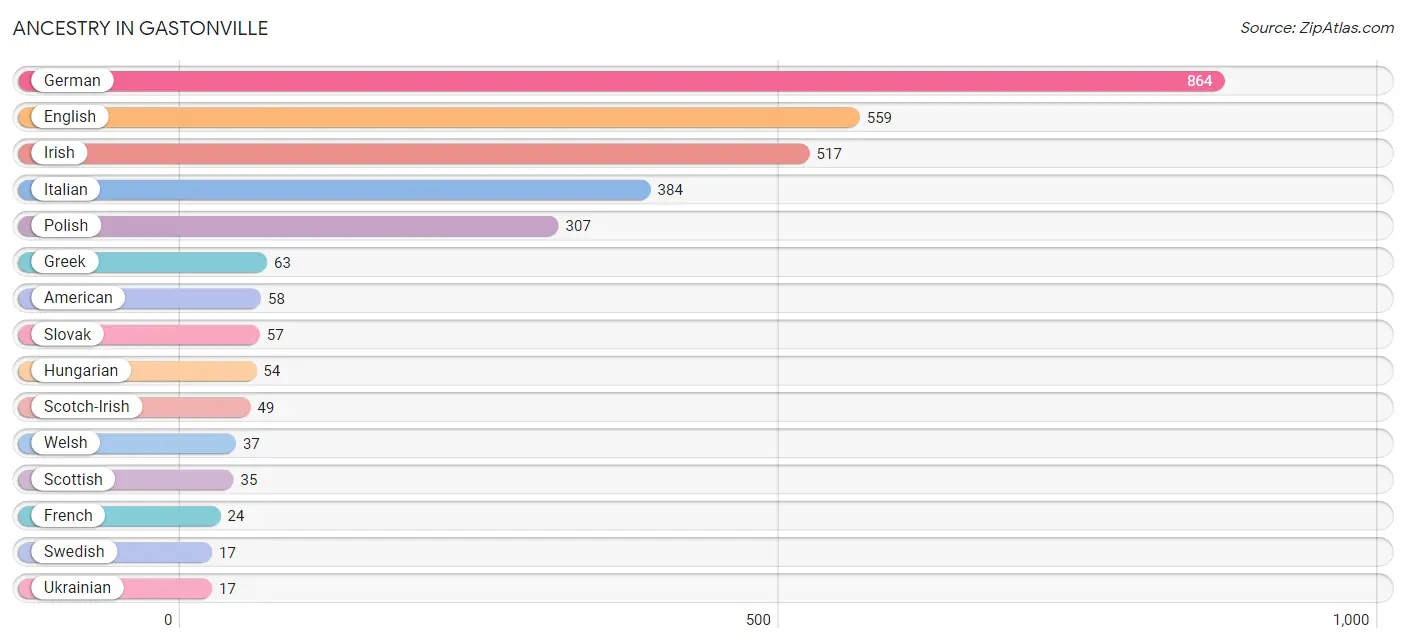
| Ancestry | # Population | % Population |
| American | 58 | 2.2% |
| Arab | 9 | 0.4% |
| Austrian | 9 | 0.4% |
| British | 9 | 0.4% |
| Burmese | 1 | 0.0% |
| Croatian | 15 | 0.6% |
| Czechoslovakian | 9 | 0.4% |
| Dutch | 11 | 0.4% |
| English | 559 | 21.7% |
| European | 8 | 0.3% |
| Finnish | 11 | 0.4% |
| French | 24 | 0.9% |
| German | 864 | 33.6% |
| Greek | 63 | 2.5% |
| Guamanian / Chamorro | 10 | 0.4% |
| Hungarian | 54 | 2.1% |
| Irish | 517 | 20.1% |
| Italian | 384 | 14.9% |
| Lebanese | 9 | 0.4% |
| Lithuanian | 8 | 0.3% |
| Norwegian | 7 | 0.3% |
| Polish | 307 | 11.9% |
| Russian | 10 | 0.4% |
| Samoan | 10 | 0.4% |
| Scotch-Irish | 49 | 1.9% |
| Scottish | 35 | 1.4% |
| Serbian | 10 | 0.4% |
| Slavic | 8 | 0.3% |
| Slovak | 57 | 2.2% |
| Slovene | 14 | 0.5% |
| Swedish | 17 | 0.7% |
| Ukrainian | 17 | 0.7% |
| Welsh | 37 | 1.4% | View All 33 Rows |
Immigrants in Gastonville
The most numerous immigrant groups reported in Gastonville came from , and Canada (11 | 0.4%), together accounting for 0.4% of all Gastonville residents.

| Immigration Origin | # Population | % Population |
| Canada | 11 | 0.4% | View All 1 Rows |
Sex and Age in Gastonville
Sex and Age in Gastonville
The most populous age groups in Gastonville are 60 to 64 Years (180 | 14.4%) for men and 65 to 69 Years (179 | 13.5%) for women.
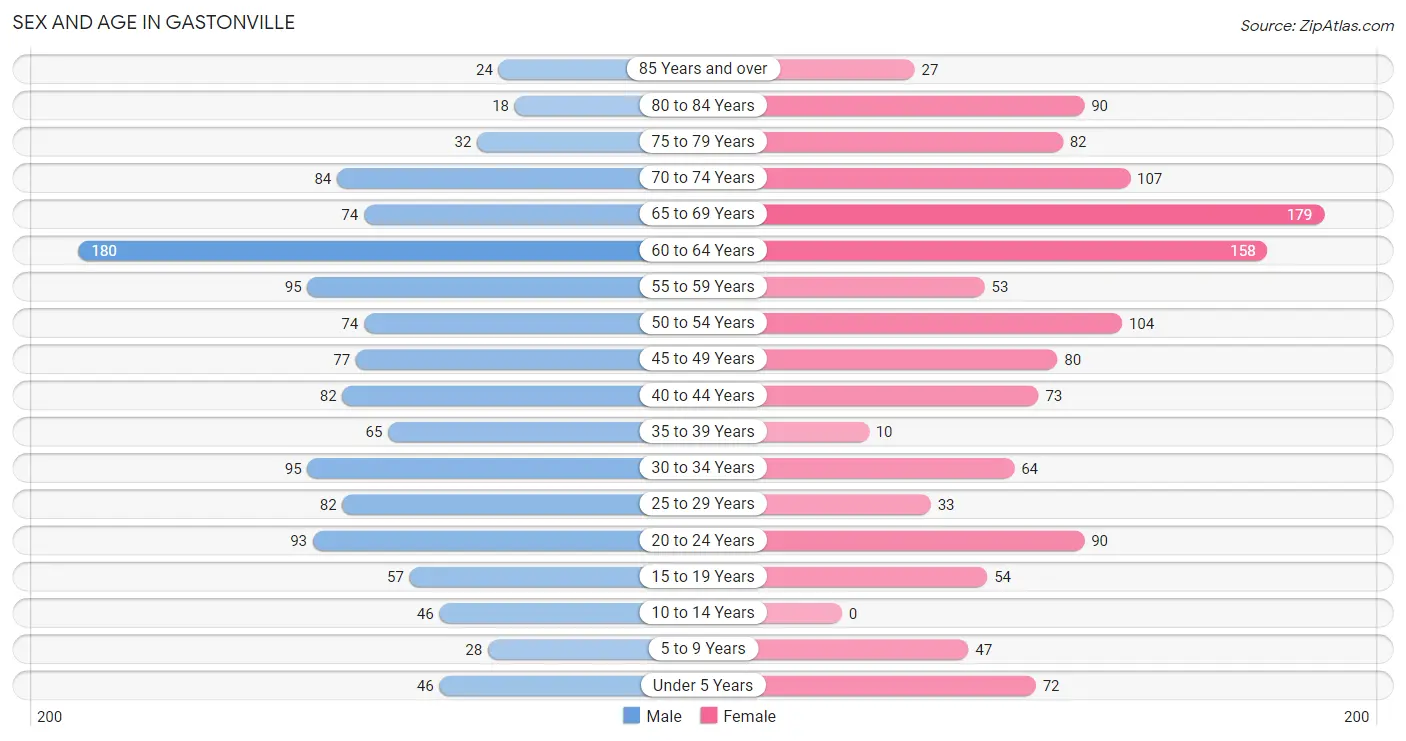
| Age Bracket | Male | Female |
| Under 5 Years | 46 (3.7%) | 72 (5.4%) |
| 5 to 9 Years | 28 (2.2%) | 47 (3.5%) |
| 10 to 14 Years | 46 (3.7%) | 0 (0.0%) |
| 15 to 19 Years | 57 (4.5%) | 54 (4.1%) |
| 20 to 24 Years | 93 (7.4%) | 90 (6.8%) |
| 25 to 29 Years | 82 (6.6%) | 33 (2.5%) |
| 30 to 34 Years | 95 (7.6%) | 64 (4.8%) |
| 35 to 39 Years | 65 (5.2%) | 10 (0.8%) |
| 40 to 44 Years | 82 (6.6%) | 73 (5.5%) |
| 45 to 49 Years | 77 (6.1%) | 80 (6.0%) |
| 50 to 54 Years | 74 (5.9%) | 104 (7.9%) |
| 55 to 59 Years | 95 (7.6%) | 53 (4.0%) |
| 60 to 64 Years | 180 (14.4%) | 158 (11.9%) |
| 65 to 69 Years | 74 (5.9%) | 179 (13.5%) |
| 70 to 74 Years | 84 (6.7%) | 107 (8.1%) |
| 75 to 79 Years | 32 (2.6%) | 82 (6.2%) |
| 80 to 84 Years | 18 (1.4%) | 90 (6.8%) |
| 85 Years and over | 24 (1.9%) | 27 (2.0%) |
| Total | 1,252 (100.0%) | 1,323 (100.0%) |
Families and Households in Gastonville
Median Family Size in Gastonville
The median family size in Gastonville is 2.65 persons per family, with married-couple families (524 | 72.1%) accounting for the largest median family size of 2.77 persons per family. On the other hand, single female/mother families (159 | 21.9%) represent the smallest median family size with 2.26 persons per family.
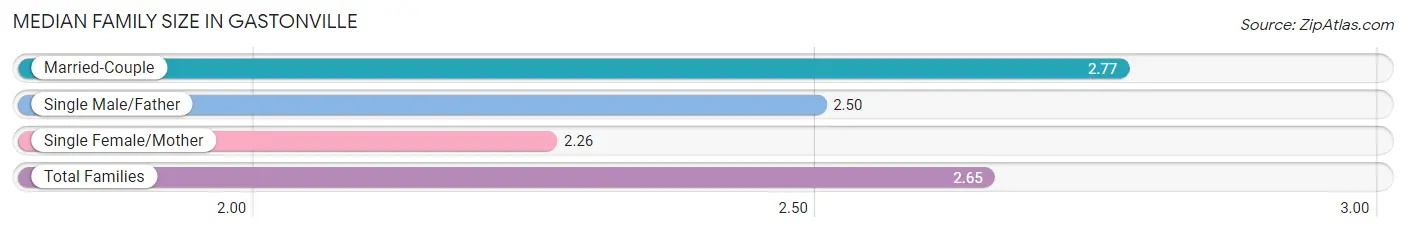
| Family Type | # Families | Family Size |
| Married-Couple | 524 (72.1%) | 2.77 |
| Single Male/Father | 44 (6.0%) | 2.50 |
| Single Female/Mother | 159 (21.9%) | 2.26 |
| Total Families | 727 (100.0%) | 2.65 |
Median Household Size in Gastonville
The median household size in Gastonville is 2.01 persons per household, with married-couple households (524 | 40.9%) accounting for the largest median household size of 2.77 persons per household. non-family households (554 | 43.2%) represent the smallest median household size with 1.15 persons per household.
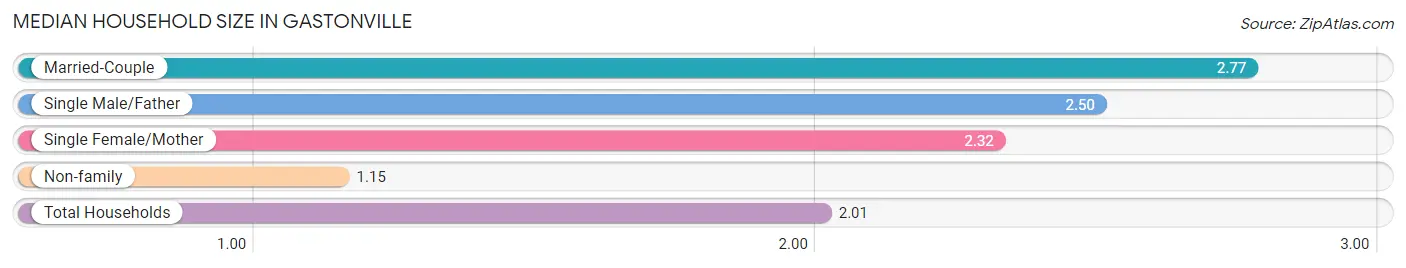
| Household Type | # Households | Household Size |
| Married-Couple | 524 (40.9%) | 2.77 |
| Single Male/Father | 44 (3.4%) | 2.50 |
| Single Female/Mother | 159 (12.4%) | 2.32 |
| Non-family | 554 (43.2%) | 1.15 |
| Total Households | 1,281 (100.0%) | 2.01 |
Household Size by Marriage Status in Gastonville
Out of a total of 1,281 households in Gastonville, 727 (56.8%) are family households, while 554 (43.2%) are nonfamily households. The most numerous type of family households are 2-person households, comprising 484, and the most common type of nonfamily households are 1-person households, comprising 468.
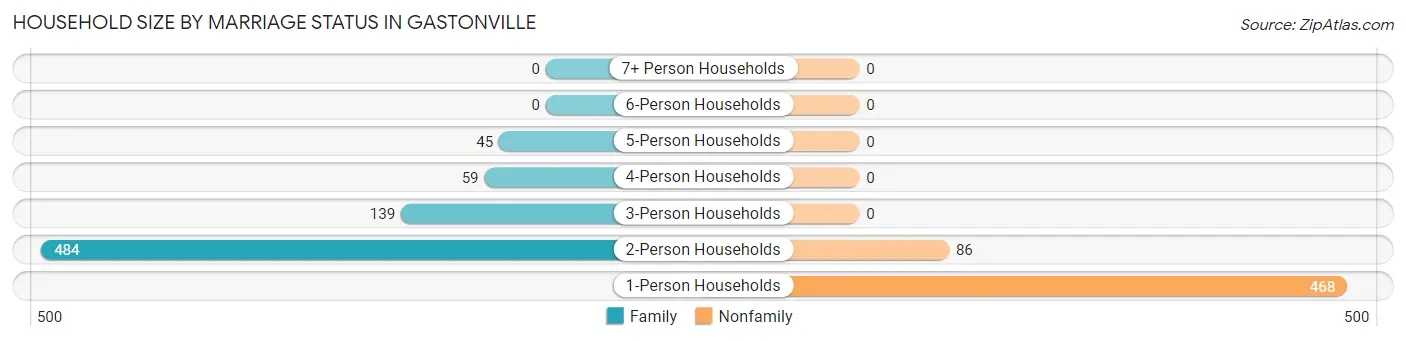
| Household Size | Family Households | Nonfamily Households |
| 1-Person Households | - | 468 (36.5%) |
| 2-Person Households | 484 (37.8%) | 86 (6.7%) |
| 3-Person Households | 139 (10.8%) | 0 (0.0%) |
| 4-Person Households | 59 (4.6%) | 0 (0.0%) |
| 5-Person Households | 45 (3.5%) | 0 (0.0%) |
| 6-Person Households | 0 (0.0%) | 0 (0.0%) |
| 7+ Person Households | 0 (0.0%) | 0 (0.0%) |
| Total | 727 (56.8%) | 554 (43.2%) |
Female Fertility in Gastonville
Fertility by Age in Gastonville
Average fertility rate in Gastonville is 17.0 births per 1,000 women. Women in the age bracket of 20 to 34 years have the highest fertility rate with 37.0 births per 1,000 women. Women in the age bracket of 20 to 34 years acount for 100.0% of all women with births.
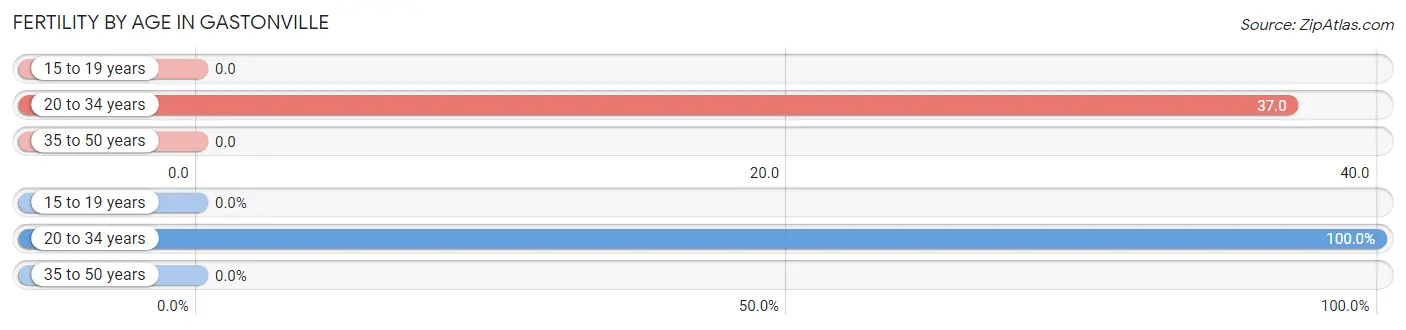
| Age Bracket | Women with Births | Births / 1,000 Women |
| 15 to 19 years | 0 (0.0%) | 0.0 |
| 20 to 34 years | 7 (100.0%) | 37.0 |
| 35 to 50 years | 0 (0.0%) | 0.0 |
| Total | 7 (100.0%) | 17.0 |
Fertility by Age by Marriage Status in Gastonville
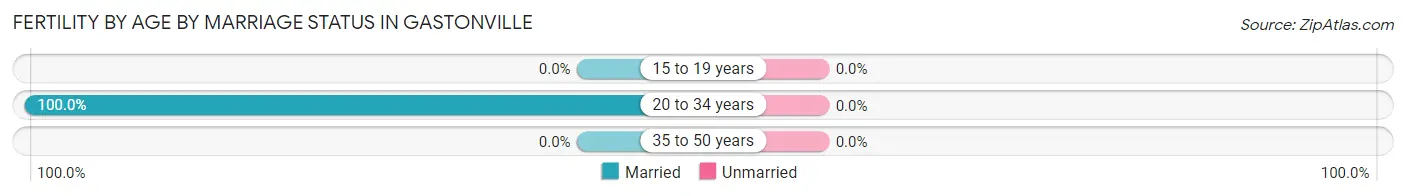
| Age Bracket | Married | Unmarried |
| 15 to 19 years | 0 (0.0%) | 0 (0.0%) |
| 20 to 34 years | 7 (100.0%) | 0 (0.0%) |
| 35 to 50 years | 0 (0.0%) | 0 (0.0%) |
| Total | 7 (100.0%) | 0 (0.0%) |
Fertility by Education in Gastonville
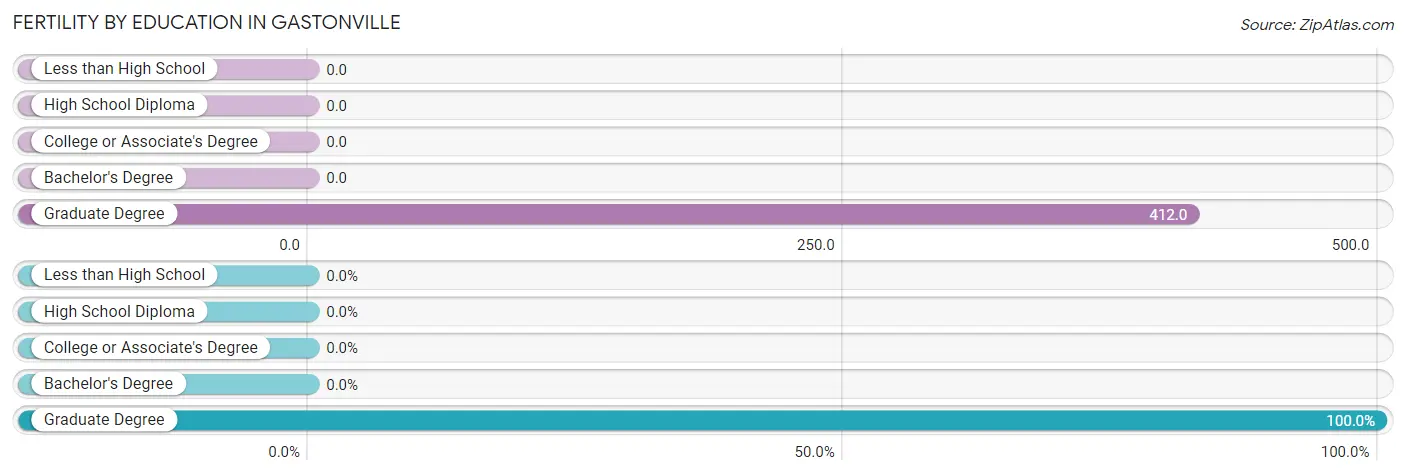
| Educational Attainment | Women with Births | Births / 1,000 Women |
| Less than High School | 0 (0.0%) | 0.0 |
| High School Diploma | 0 (0.0%) | 0.0 |
| College or Associate's Degree | 0 (0.0%) | 0.0 |
| Bachelor's Degree | 0 (0.0%) | 0.0 |
| Graduate Degree | 7 (100.0%) | 412.0 |
| Total | 7 (100.0%) | 17.0 |
Fertility by Education by Marriage Status in Gastonville
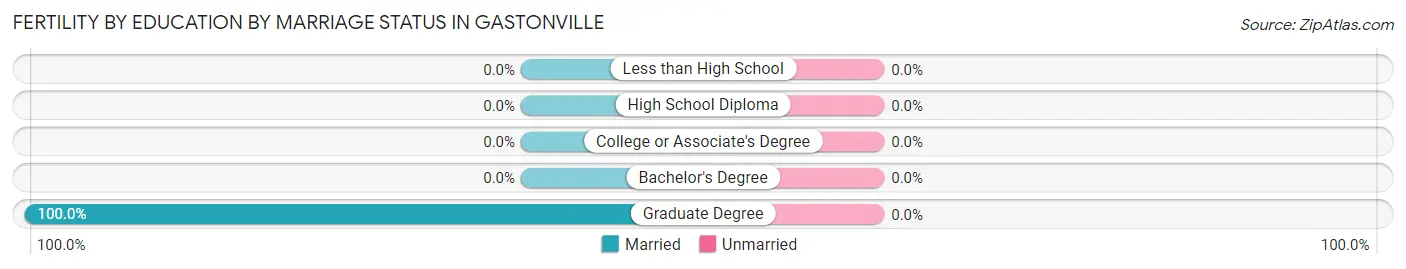
| Educational Attainment | Married | Unmarried |
| Less than High School | 0 (0.0%) | 0 (0.0%) |
| High School Diploma | 0 (0.0%) | 0 (0.0%) |
| College or Associate's Degree | 0 (0.0%) | 0 (0.0%) |
| Bachelor's Degree | 0 (0.0%) | 0 (0.0%) |
| Graduate Degree | 7 (100.0%) | 0 (0.0%) |
| Total | 7 (100.0%) | 0 (0.0%) |
Employment Characteristics in Gastonville
Employment by Class of Employer in Gastonville
Among the 1,444 employed individuals in Gastonville, private company employees (1,081 | 74.9%), not-for-profit organizations (126 | 8.7%), and self-employed (incorporated) (83 | 5.8%) make up the most common classes of employment.
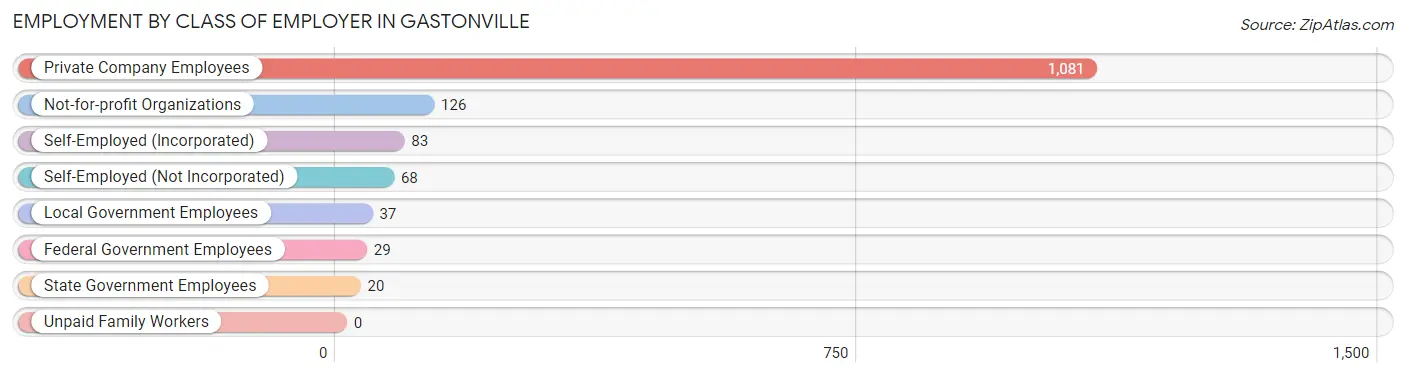
| Employer Class | # Employees | % Employees |
| Private Company Employees | 1,081 | 74.9% |
| Self-Employed (Incorporated) | 83 | 5.8% |
| Self-Employed (Not Incorporated) | 68 | 4.7% |
| Not-for-profit Organizations | 126 | 8.7% |
| Local Government Employees | 37 | 2.6% |
| State Government Employees | 20 | 1.4% |
| Federal Government Employees | 29 | 2.0% |
| Unpaid Family Workers | 0 | 0.0% |
| Total | 1,444 | 100.0% |
Employment Status by Age in Gastonville
According to the labor force statistics for Gastonville, out of the total population over 16 years of age (2,310), 64.3% or 1,485 individuals are in the labor force, with 0.9% or 13 of them unemployed. The age group with the highest labor force participation rate is 20 to 24 years, with 100.0% or 183 individuals in the labor force. Within the labor force, the 35 to 44 years age range has the highest percentage of unemployed individuals, with 4.8% or 10 of them being unemployed.
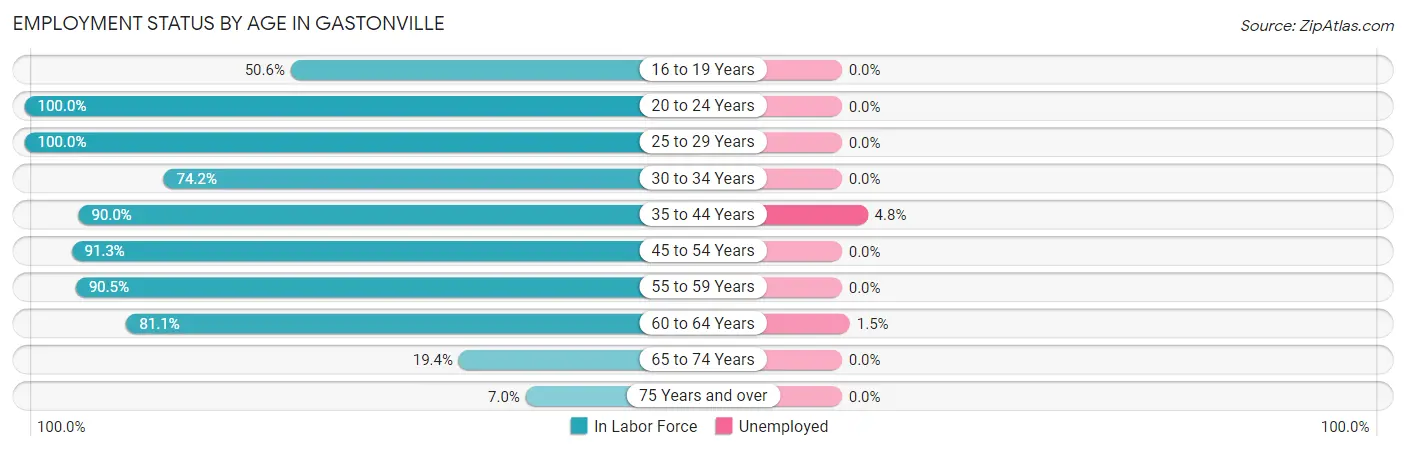
| Age Bracket | In Labor Force | Unemployed |
| 16 to 19 Years | 43 (50.6%) | 0 (0.0%) |
| 20 to 24 Years | 183 (100.0%) | 0 (0.0%) |
| 25 to 29 Years | 115 (100.0%) | 0 (0.0%) |
| 30 to 34 Years | 118 (74.2%) | 0 (0.0%) |
| 35 to 44 Years | 207 (90.0%) | 10 (4.8%) |
| 45 to 54 Years | 306 (91.3%) | 0 (0.0%) |
| 55 to 59 Years | 134 (90.5%) | 0 (0.0%) |
| 60 to 64 Years | 274 (81.1%) | 4 (1.5%) |
| 65 to 74 Years | 86 (19.4%) | 0 (0.0%) |
| 75 Years and over | 19 (7.0%) | 0 (0.0%) |
| Total | 1,485 (64.3%) | 13 (0.9%) |
Employment Status by Educational Attainment in Gastonville
According to labor force statistics for Gastonville, 87.1% of individuals (1,154) out of the total population between 25 and 64 years of age (1,325) are in the labor force, with 1.2% or 14 of them being unemployed. The group with the highest labor force participation rate are those with the educational attainment of college / associate degree, with 97.0% or 358 individuals in the labor force. Within the labor force, individuals with bachelor's degree or higher education have the highest percentage of unemployment, with 3.6% or 10 of them being unemployed.
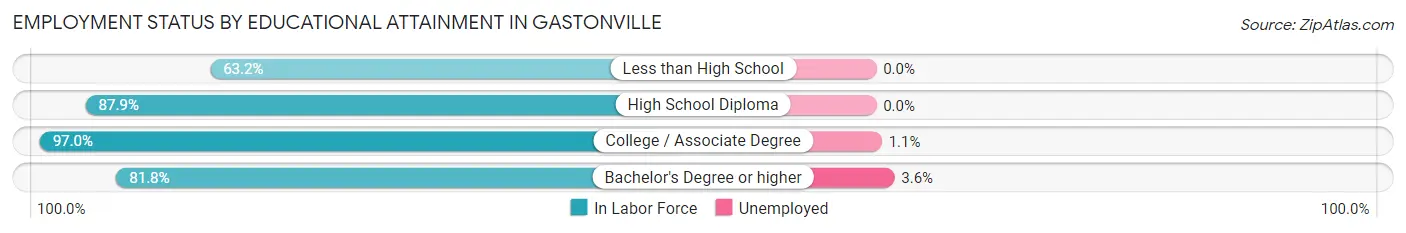
| Educational Attainment | In Labor Force | Unemployed |
| Less than High School | 60 (63.2%) | 0 (0.0%) |
| High School Diploma | 457 (87.9%) | 0 (0.0%) |
| College / Associate Degree | 358 (97.0%) | 4 (1.1%) |
| Bachelor's Degree or higher | 279 (81.8%) | 12 (3.6%) |
| Total | 1,154 (87.1%) | 16 (1.2%) |
Employment Occupations by Sex in Gastonville
Management, Business, Science and Arts Occupations
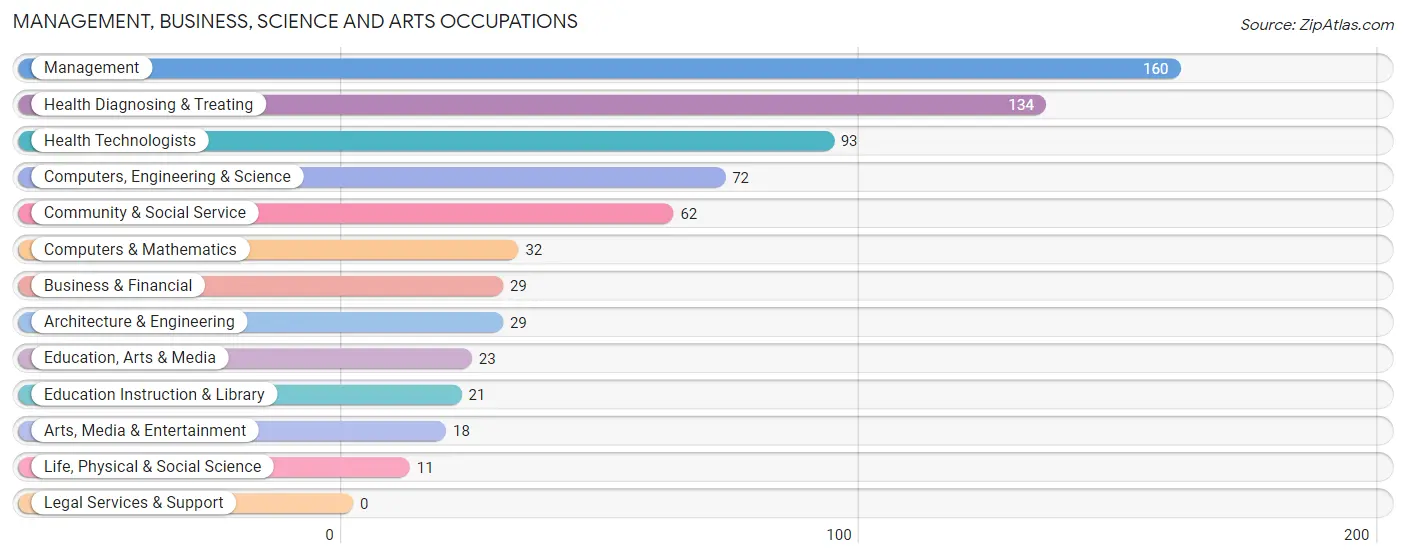
The most common Management, Business, Science and Arts occupations in Gastonville are Management (160 | 10.9%), Health Diagnosing & Treating (134 | 9.1%), Health Technologists (93 | 6.3%), Computers, Engineering & Science (72 | 4.9%), and Community & Social Service (62 | 4.2%).
Management, Business, Science and Arts Occupations by Sex
Within the Management, Business, Science and Arts occupations in Gastonville, the most male-oriented occupations are Management (69.4%), Arts, Media & Entertainment (66.7%), and Architecture & Engineering (65.5%), while the most female-oriented occupations are Life, Physical & Social Science (100.0%), Health Technologists (100.0%), and Health Diagnosing & Treating (79.1%).
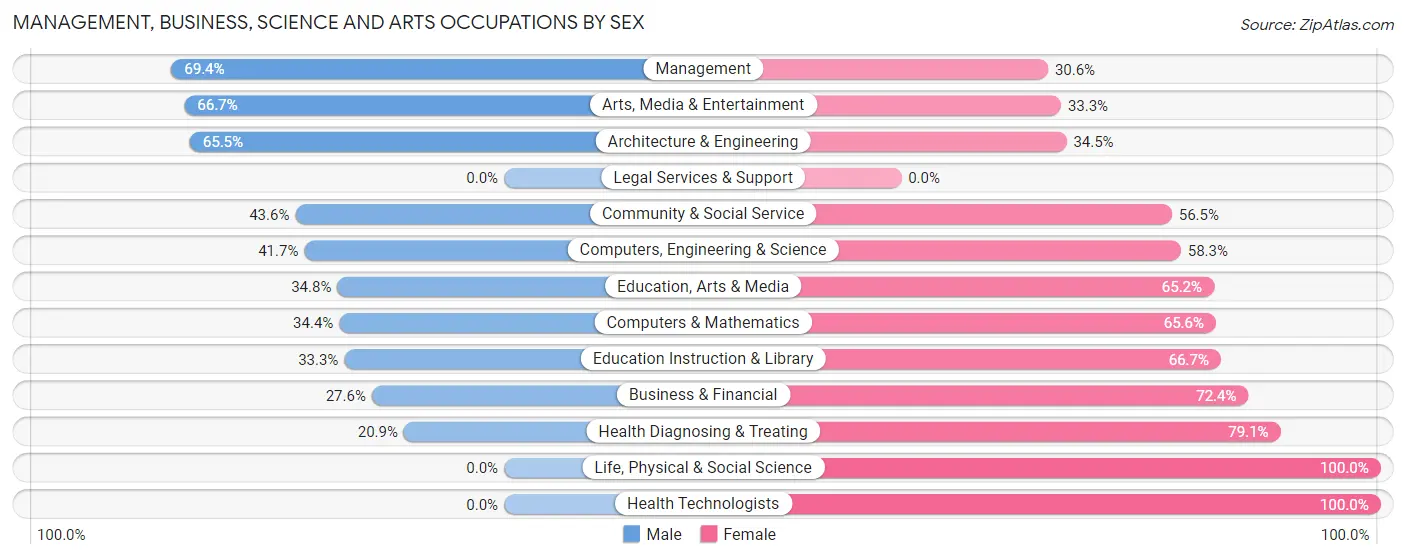
| Occupation | Male | Female |
| Management | 111 (69.4%) | 49 (30.6%) |
| Business & Financial | 8 (27.6%) | 21 (72.4%) |
| Computers, Engineering & Science | 30 (41.7%) | 42 (58.3%) |
| Computers & Mathematics | 11 (34.4%) | 21 (65.6%) |
| Architecture & Engineering | 19 (65.5%) | 10 (34.5%) |
| Life, Physical & Social Science | 0 (0.0%) | 11 (100.0%) |
| Community & Social Service | 27 (43.5%) | 35 (56.5%) |
| Education, Arts & Media | 8 (34.8%) | 15 (65.2%) |
| Legal Services & Support | 0 (0.0%) | 0 (0.0%) |
| Education Instruction & Library | 7 (33.3%) | 14 (66.7%) |
| Arts, Media & Entertainment | 12 (66.7%) | 6 (33.3%) |
| Health Diagnosing & Treating | 28 (20.9%) | 106 (79.1%) |
| Health Technologists | 0 (0.0%) | 93 (100.0%) |
| Total (Category) | 204 (44.6%) | 253 (55.4%) |
| Total (Overall) | 787 (53.5%) | 684 (46.5%) |
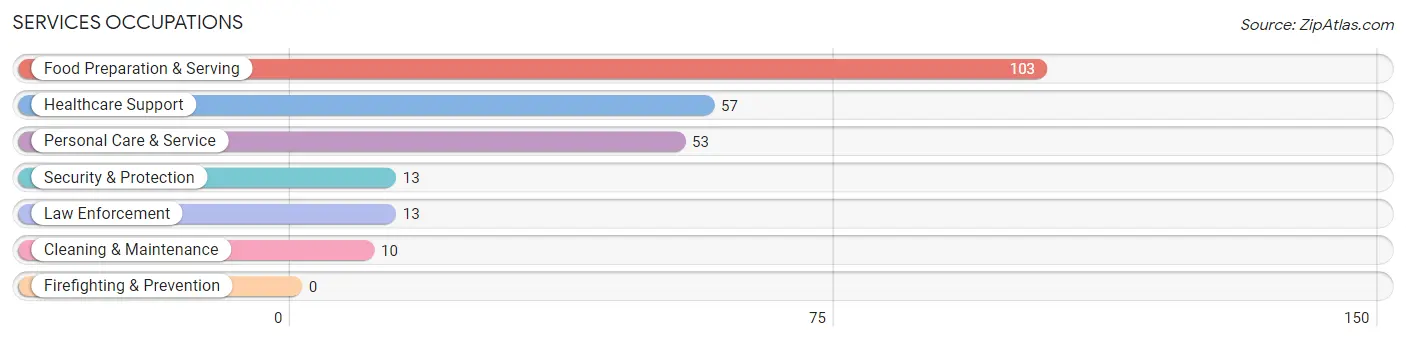
Services Occupations
The most common Services occupations in Gastonville are Food Preparation & Serving (103 | 7.0%), Healthcare Support (57 | 3.9%), Personal Care & Service (53 | 3.6%), Security & Protection (13 | 0.9%), and Law Enforcement (13 | 0.9%).
Services Occupations by Sex
Within the Services occupations in Gastonville, the most male-oriented occupations are Security & Protection (100.0%), Law Enforcement (100.0%), and Cleaning & Maintenance (100.0%), while the most female-oriented occupations are Healthcare Support (100.0%), Personal Care & Service (100.0%), and Food Preparation & Serving (71.8%).
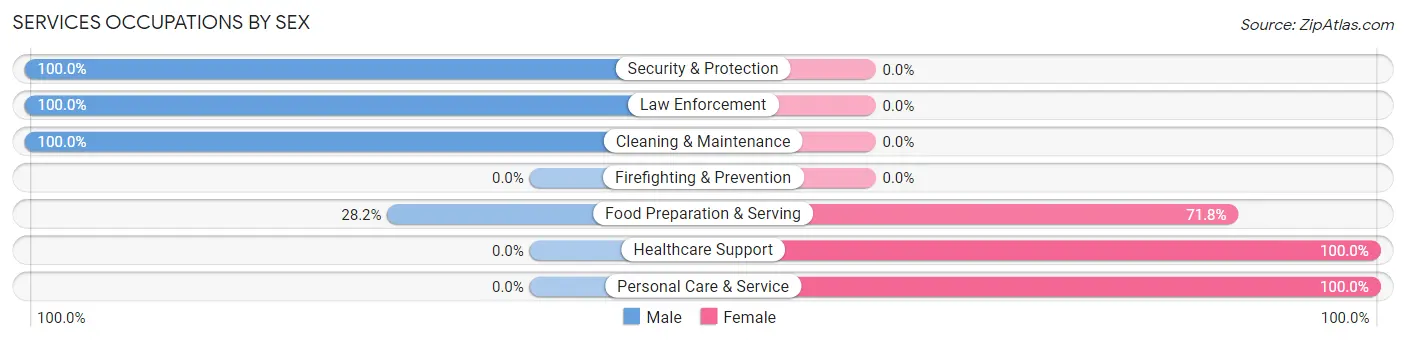
| Occupation | Male | Female |
| Healthcare Support | 0 (0.0%) | 57 (100.0%) |
| Security & Protection | 13 (100.0%) | 0 (0.0%) |
| Firefighting & Prevention | 0 (0.0%) | 0 (0.0%) |
| Law Enforcement | 13 (100.0%) | 0 (0.0%) |
| Food Preparation & Serving | 29 (28.2%) | 74 (71.8%) |
| Cleaning & Maintenance | 10 (100.0%) | 0 (0.0%) |
| Personal Care & Service | 0 (0.0%) | 53 (100.0%) |
| Total (Category) | 52 (22.0%) | 184 (78.0%) |
| Total (Overall) | 787 (53.5%) | 684 (46.5%) |
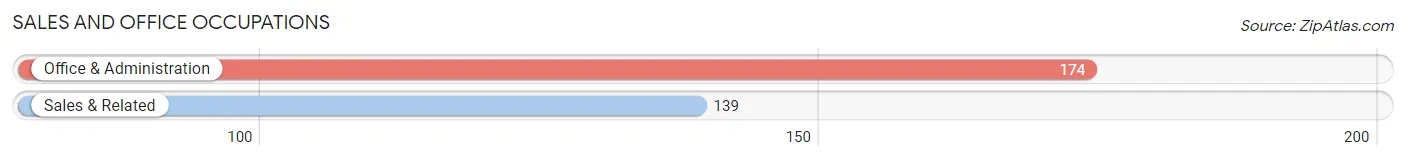
Sales and Office Occupations
The most common Sales and Office occupations in Gastonville are Office & Administration (174 | 11.8%), and Sales & Related (139 | 9.5%).
Sales and Office Occupations by Sex
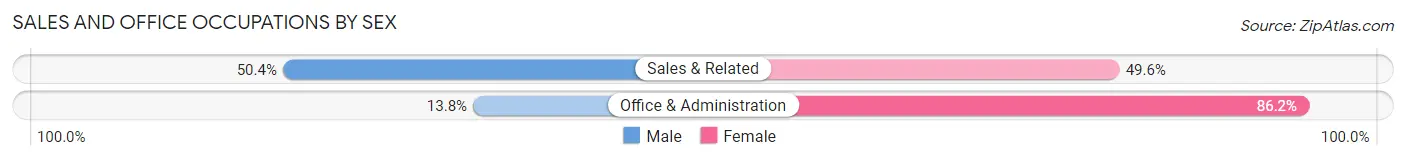
| Occupation | Male | Female |
| Sales & Related | 70 (50.4%) | 69 (49.6%) |
| Office & Administration | 24 (13.8%) | 150 (86.2%) |
| Total (Category) | 94 (30.0%) | 219 (70.0%) |
| Total (Overall) | 787 (53.5%) | 684 (46.5%) |
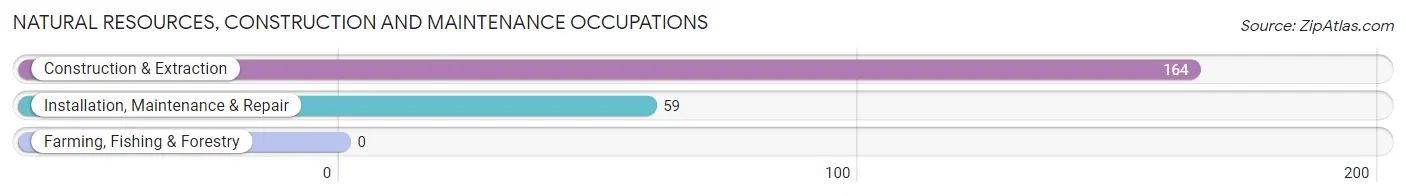
Natural Resources, Construction and Maintenance Occupations
The most common Natural Resources, Construction and Maintenance occupations in Gastonville are Construction & Extraction (164 | 11.2%), and Installation, Maintenance & Repair (59 | 4.0%).
Natural Resources, Construction and Maintenance Occupations by Sex
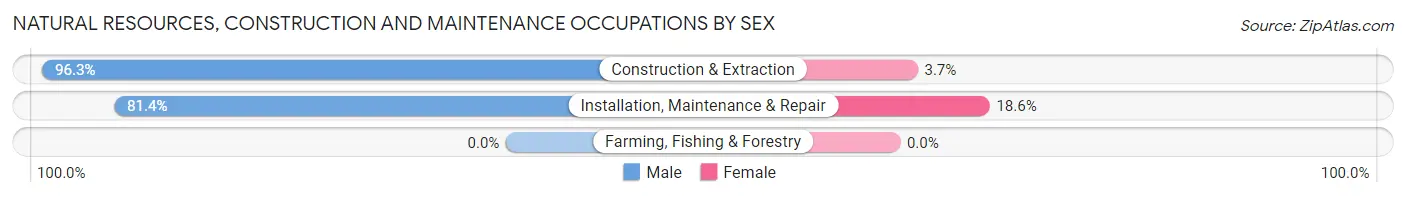
| Occupation | Male | Female |
| Farming, Fishing & Forestry | 0 (0.0%) | 0 (0.0%) |
| Construction & Extraction | 158 (96.3%) | 6 (3.7%) |
| Installation, Maintenance & Repair | 48 (81.4%) | 11 (18.6%) |
| Total (Category) | 206 (92.4%) | 17 (7.6%) |
| Total (Overall) | 787 (53.5%) | 684 (46.5%) |
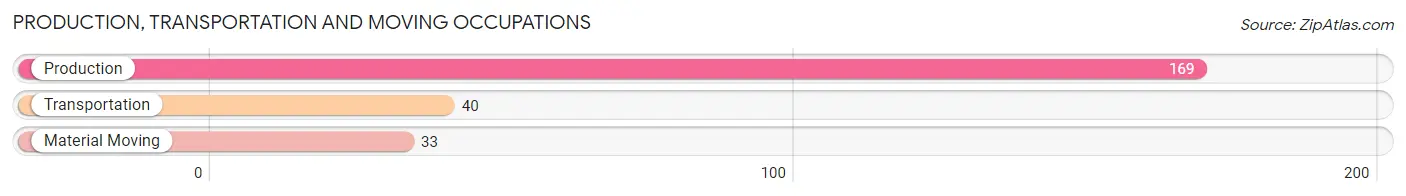
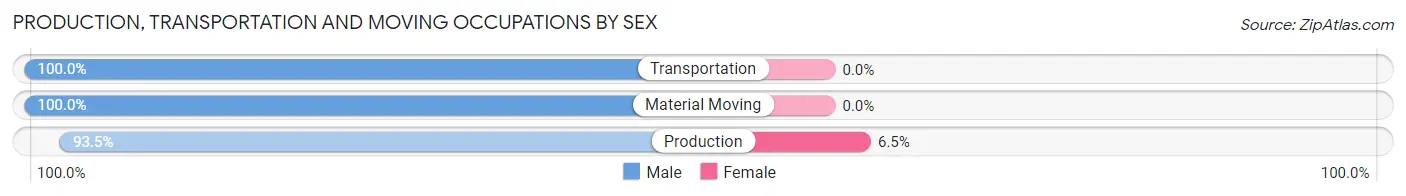
Production, Transportation and Moving Occupations
The most common Production, Transportation and Moving occupations in Gastonville are Production (169 | 11.5%), Transportation (40 | 2.7%), and Material Moving (33 | 2.2%).
Production, Transportation and Moving Occupations by Sex
| Occupation | Male | Female |
| Production | 158 (93.5%) | 11 (6.5%) |
| Transportation | 40 (100.0%) | 0 (0.0%) |
| Material Moving | 33 (100.0%) | 0 (0.0%) |
| Total (Category) | 231 (95.5%) | 11 (4.5%) |
| Total (Overall) | 787 (53.5%) | 684 (46.5%) |
Employment Industries by Sex in Gastonville
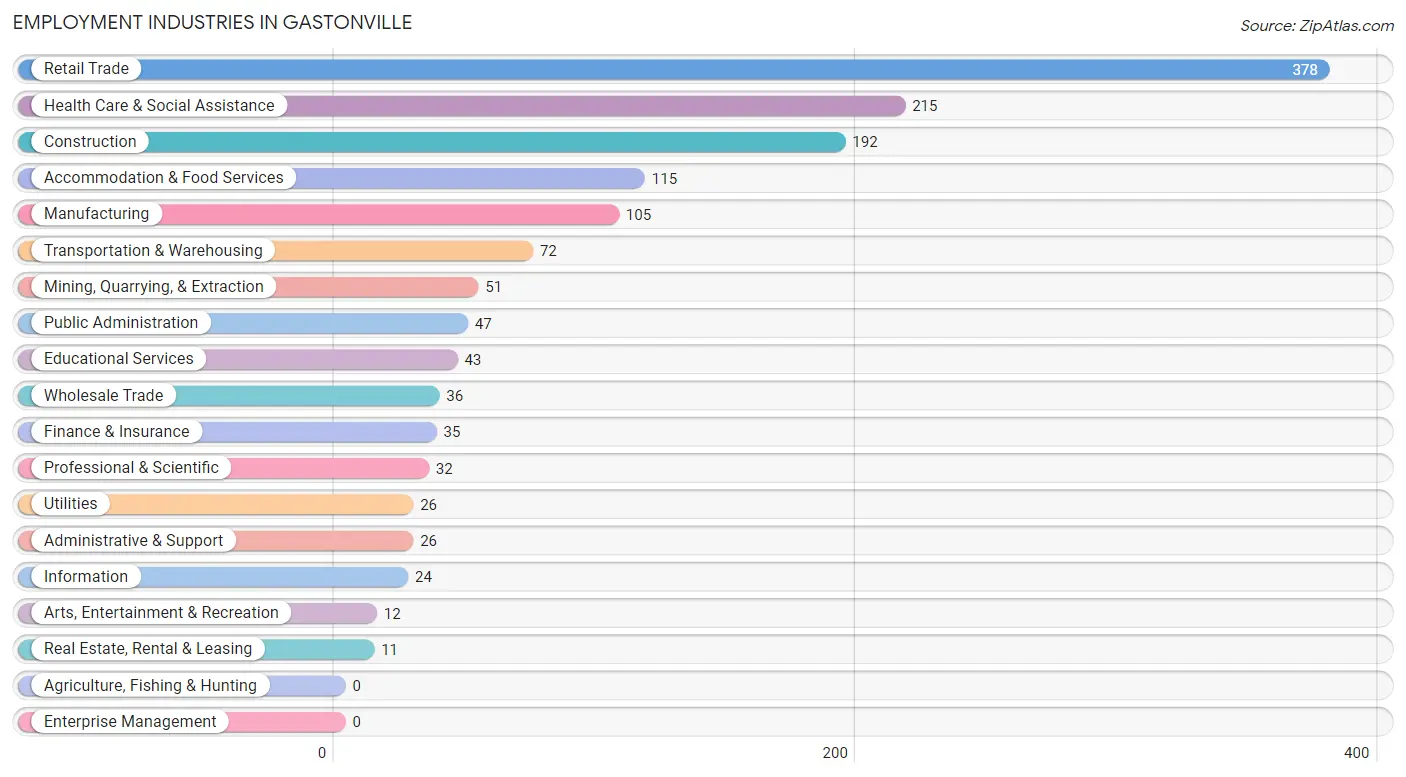
Employment Industries in Gastonville
The major employment industries in Gastonville include Retail Trade (378 | 25.7%), Health Care & Social Assistance (215 | 14.6%), Construction (192 | 13.1%), Accommodation & Food Services (115 | 7.8%), and Manufacturing (105 | 7.1%).
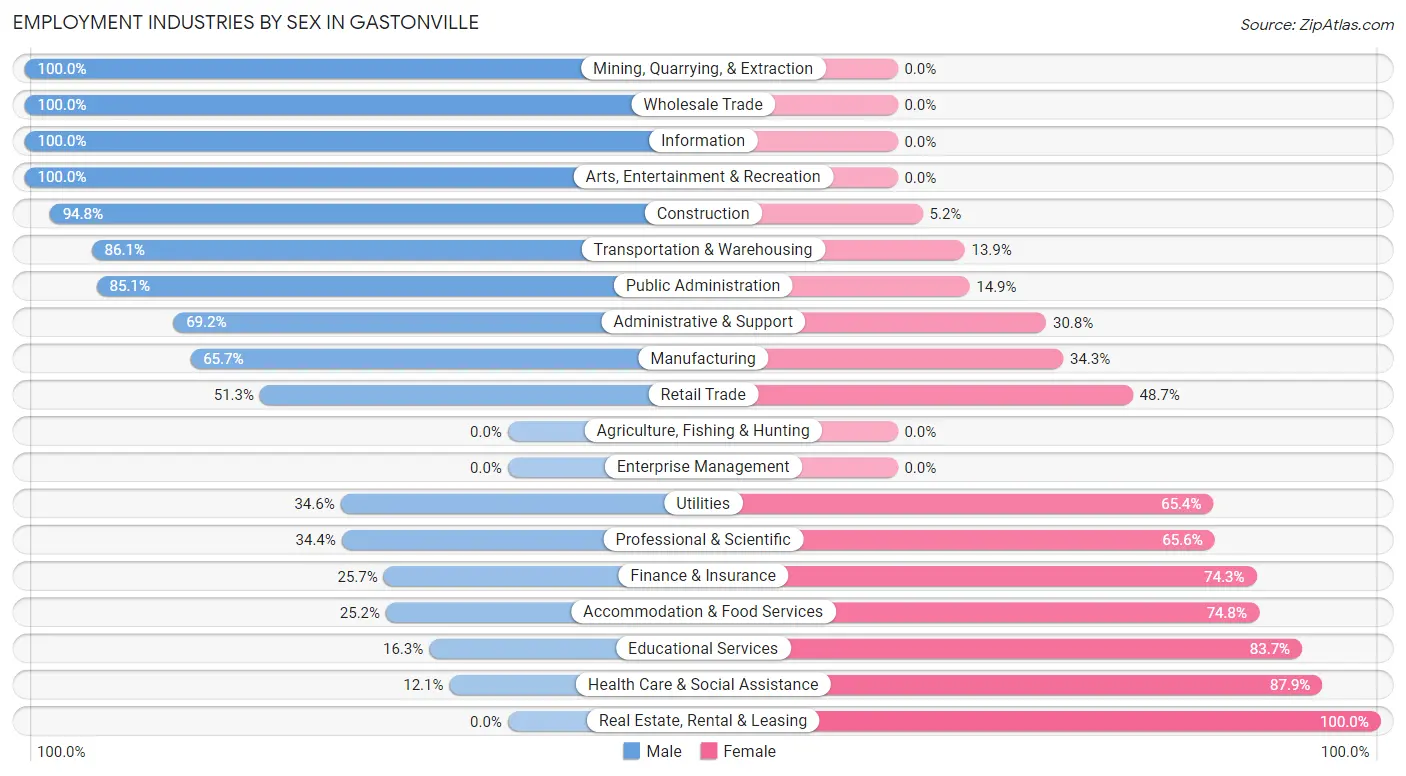
Employment Industries by Sex in Gastonville
The Gastonville industries that see more men than women are Mining, Quarrying, & Extraction (100.0%), Wholesale Trade (100.0%), and Information (100.0%), whereas the industries that tend to have a higher number of women are Real Estate, Rental & Leasing (100.0%), Health Care & Social Assistance (87.9%), and Educational Services (83.7%).
| Industry | Male | Female |
| Agriculture, Fishing & Hunting | 0 (0.0%) | 0 (0.0%) |
| Mining, Quarrying, & Extraction | 51 (100.0%) | 0 (0.0%) |
| Construction | 182 (94.8%) | 10 (5.2%) |
| Manufacturing | 69 (65.7%) | 36 (34.3%) |
| Wholesale Trade | 36 (100.0%) | 0 (0.0%) |
| Retail Trade | 194 (51.3%) | 184 (48.7%) |
| Transportation & Warehousing | 62 (86.1%) | 10 (13.9%) |
| Utilities | 9 (34.6%) | 17 (65.4%) |
| Information | 24 (100.0%) | 0 (0.0%) |
| Finance & Insurance | 9 (25.7%) | 26 (74.3%) |
| Real Estate, Rental & Leasing | 0 (0.0%) | 11 (100.0%) |
| Professional & Scientific | 11 (34.4%) | 21 (65.6%) |
| Enterprise Management | 0 (0.0%) | 0 (0.0%) |
| Administrative & Support | 18 (69.2%) | 8 (30.8%) |
| Educational Services | 7 (16.3%) | 36 (83.7%) |
| Health Care & Social Assistance | 26 (12.1%) | 189 (87.9%) |
| Arts, Entertainment & Recreation | 12 (100.0%) | 0 (0.0%) |
| Accommodation & Food Services | 29 (25.2%) | 86 (74.8%) |
| Public Administration | 40 (85.1%) | 7 (14.9%) |
| Total | 787 (53.5%) | 684 (46.5%) |
Education in Gastonville
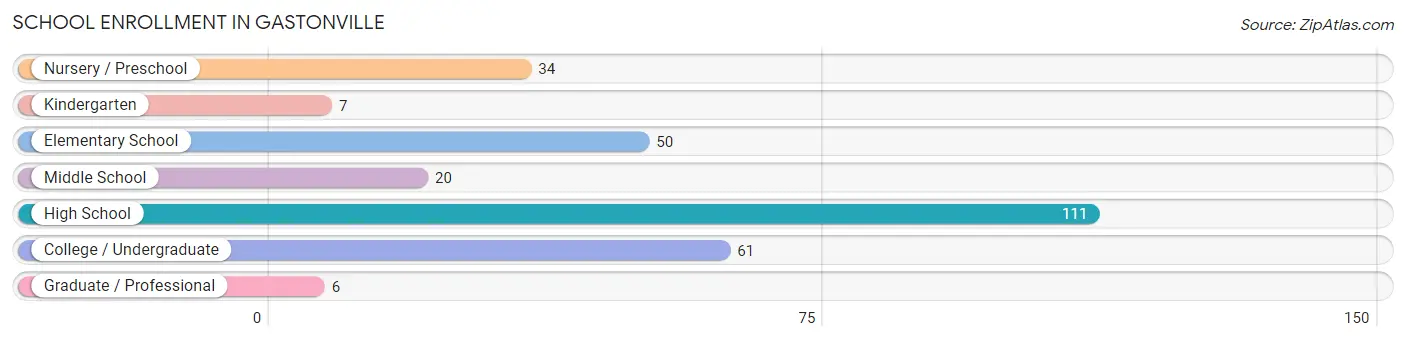
School Enrollment in Gastonville
The most common levels of schooling among the 289 students in Gastonville are high school (111 | 38.4%), college / undergraduate (61 | 21.1%), and elementary school (50 | 17.3%).
| School Level | # Students | % Students |
| Nursery / Preschool | 34 | 11.8% |
| Kindergarten | 7 | 2.4% |
| Elementary School | 50 | 17.3% |
| Middle School | 20 | 6.9% |
| High School | 111 | 38.4% |
| College / Undergraduate | 61 | 21.1% |
| Graduate / Professional | 6 | 2.1% |
| Total | 289 | 100.0% |
School Enrollment by Age by Funding Source in Gastonville
Out of a total of 289 students who are enrolled in schools in Gastonville, 66 (22.8%) attend a private institution, while the remaining 223 (77.2%) are enrolled in public schools. The age group of 3 to 4 year olds has the highest likelihood of being enrolled in private schools, with 27 (100.0% in the age bracket) enrolled. Conversely, the age group of 18 to 19 year olds has the lowest likelihood of being enrolled in a private school, with 30 (100.0% in the age bracket) attending a public institution.
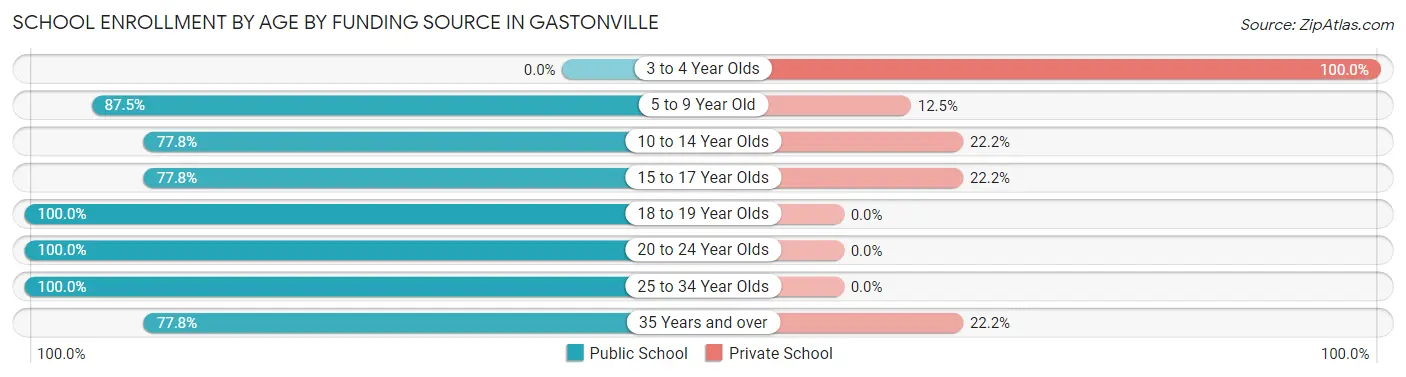
| Age Bracket | Public School | Private School |
| 3 to 4 Year Olds | 0 (0.0%) | 27 (100.0%) |
| 5 to 9 Year Old | 49 (87.5%) | 7 (12.5%) |
| 10 to 14 Year Olds | 28 (77.8%) | 8 (22.2%) |
| 15 to 17 Year Olds | 63 (77.8%) | 18 (22.2%) |
| 18 to 19 Year Olds | 30 (100.0%) | 0 (0.0%) |
| 20 to 24 Year Olds | 12 (100.0%) | 0 (0.0%) |
| 25 to 34 Year Olds | 20 (100.0%) | 0 (0.0%) |
| 35 Years and over | 21 (77.8%) | 6 (22.2%) |
| Total | 223 (77.2%) | 66 (22.8%) |
Educational Attainment by Field of Study in Gastonville
Education (124 | 23.8%), business (106 | 20.4%), science & technology (86 | 16.5%), liberal arts & history (38 | 7.3%), and engineering (37 | 7.1%) are the most common fields of study among 520 individuals in Gastonville who have obtained a bachelor's degree or higher.
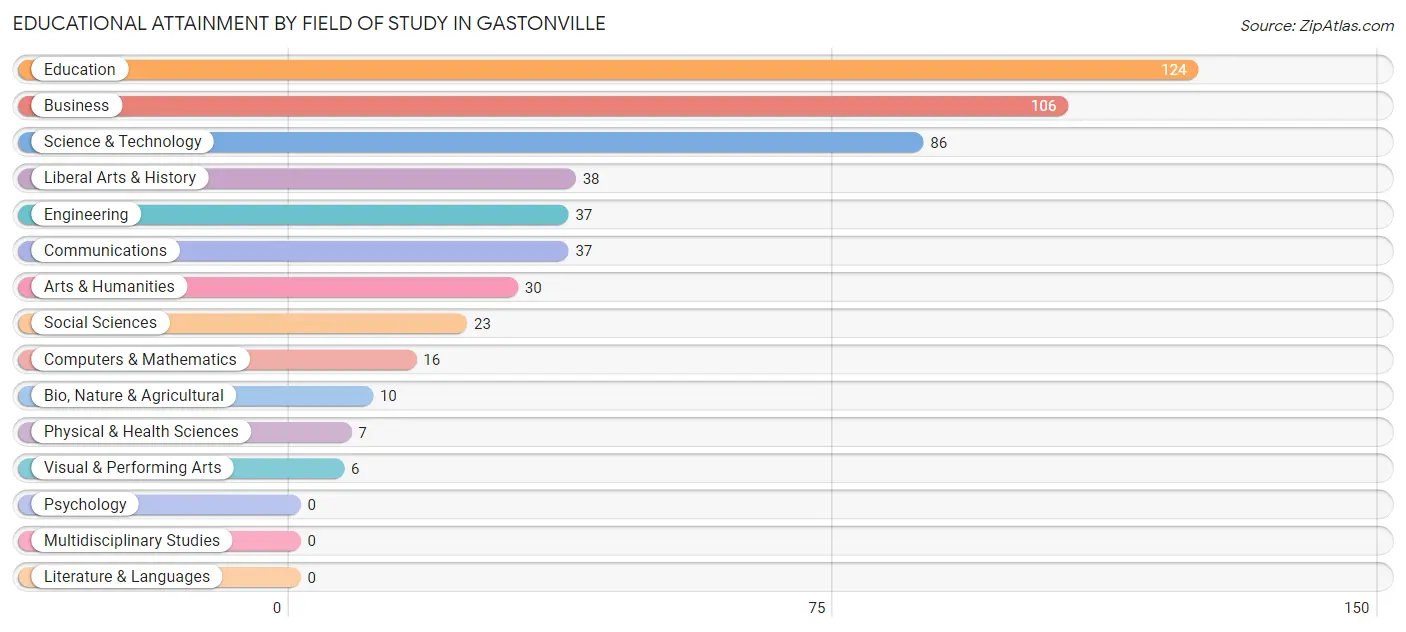
| Field of Study | # Graduates | % Graduates |
| Computers & Mathematics | 16 | 3.1% |
| Bio, Nature & Agricultural | 10 | 1.9% |
| Physical & Health Sciences | 7 | 1.3% |
| Psychology | 0 | 0.0% |
| Social Sciences | 23 | 4.4% |
| Engineering | 37 | 7.1% |
| Multidisciplinary Studies | 0 | 0.0% |
| Science & Technology | 86 | 16.5% |
| Business | 106 | 20.4% |
| Education | 124 | 23.8% |
| Literature & Languages | 0 | 0.0% |
| Liberal Arts & History | 38 | 7.3% |
| Visual & Performing Arts | 6 | 1.1% |
| Communications | 37 | 7.1% |
| Arts & Humanities | 30 | 5.8% |
| Total | 520 | 100.0% |
Transportation & Commute in Gastonville
Vehicle Availability by Sex in Gastonville
The most prevalent vehicle ownership categories in Gastonville are males with 2 vehicles (386, accounting for 49.7%) and females with 2 vehicles (269, making up 57.9%).
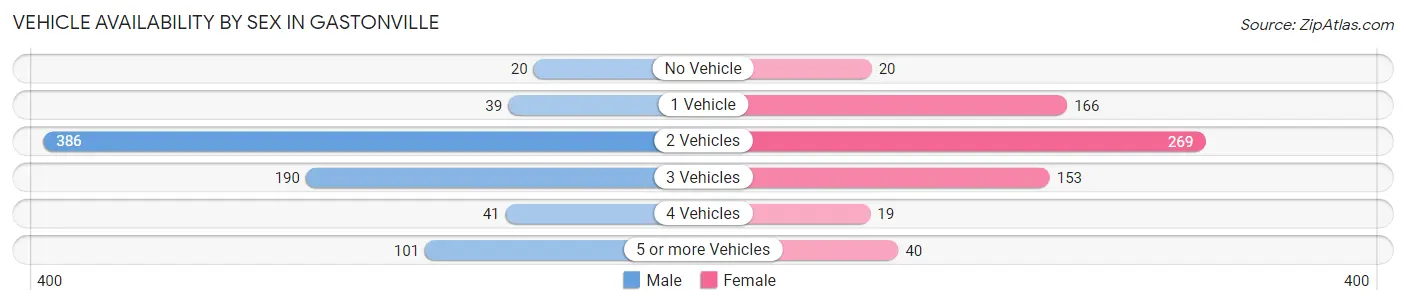
| Vehicles Available | Male | Female |
| No Vehicle | 20 (2.6%) | 20 (3.0%) |
| 1 Vehicle | 39 (5.0%) | 166 (24.9%) |
| 2 Vehicles | 386 (49.7%) | 269 (40.3%) |
| 3 Vehicles | 190 (24.4%) | 153 (22.9%) |
| 4 Vehicles | 41 (5.3%) | 19 (2.9%) |
| 5 or more Vehicles | 101 (13.0%) | 40 (6.0%) |
| Total | 777 (100.0%) | 667 (100.0%) |
Commute Time in Gastonville
The most frequently occuring commute durations in Gastonville are 20 to 24 minutes (329 commuters, 24.2%), 25 to 29 minutes (190 commuters, 14.0%), and 30 to 34 minutes (171 commuters, 12.6%).
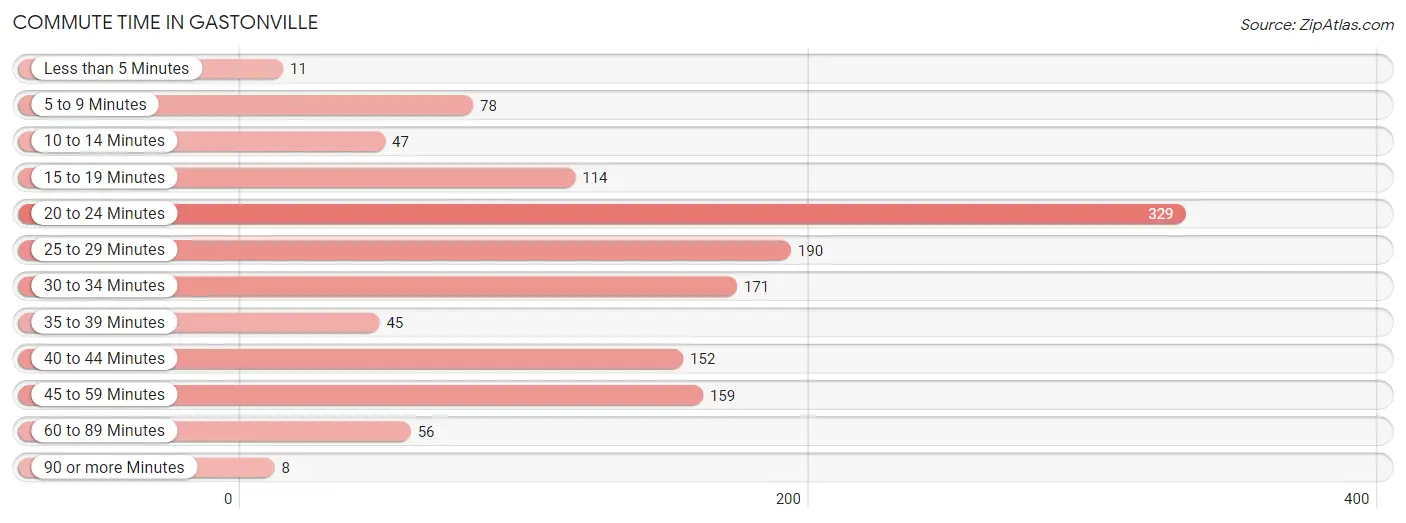
| Commute Time | # Commuters | % Commuters |
| Less than 5 Minutes | 11 | 0.8% |
| 5 to 9 Minutes | 78 | 5.7% |
| 10 to 14 Minutes | 47 | 3.5% |
| 15 to 19 Minutes | 114 | 8.4% |
| 20 to 24 Minutes | 329 | 24.2% |
| 25 to 29 Minutes | 190 | 14.0% |
| 30 to 34 Minutes | 171 | 12.6% |
| 35 to 39 Minutes | 45 | 3.3% |
| 40 to 44 Minutes | 152 | 11.2% |
| 45 to 59 Minutes | 159 | 11.7% |
| 60 to 89 Minutes | 56 | 4.1% |
| 90 or more Minutes | 8 | 0.6% |
Commute Time by Sex in Gastonville
The most common commute times in Gastonville are 20 to 24 minutes (146 commuters, 20.1%) for males and 20 to 24 minutes (183 commuters, 28.9%) for females.
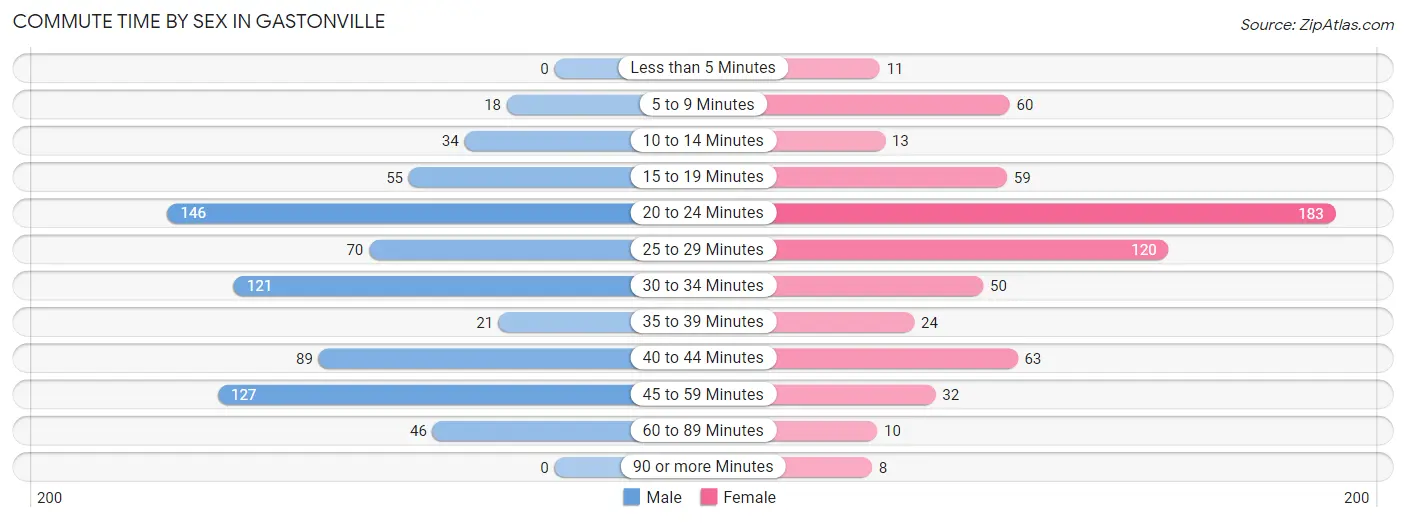
| Commute Time | Male | Female |
| Less than 5 Minutes | 0 (0.0%) | 11 (1.7%) |
| 5 to 9 Minutes | 18 (2.5%) | 60 (9.5%) |
| 10 to 14 Minutes | 34 (4.7%) | 13 (2.1%) |
| 15 to 19 Minutes | 55 (7.6%) | 59 (9.3%) |
| 20 to 24 Minutes | 146 (20.1%) | 183 (28.9%) |
| 25 to 29 Minutes | 70 (9.6%) | 120 (19.0%) |
| 30 to 34 Minutes | 121 (16.6%) | 50 (7.9%) |
| 35 to 39 Minutes | 21 (2.9%) | 24 (3.8%) |
| 40 to 44 Minutes | 89 (12.2%) | 63 (10.0%) |
| 45 to 59 Minutes | 127 (17.5%) | 32 (5.1%) |
| 60 to 89 Minutes | 46 (6.3%) | 10 (1.6%) |
| 90 or more Minutes | 0 (0.0%) | 8 (1.3%) |
Time of Departure to Work by Sex in Gastonville
The most frequent times of departure to work in Gastonville are 5:30 AM to 5:59 AM (131, 18.0%) for males and 6:30 AM to 6:59 AM (145, 22.9%) for females.
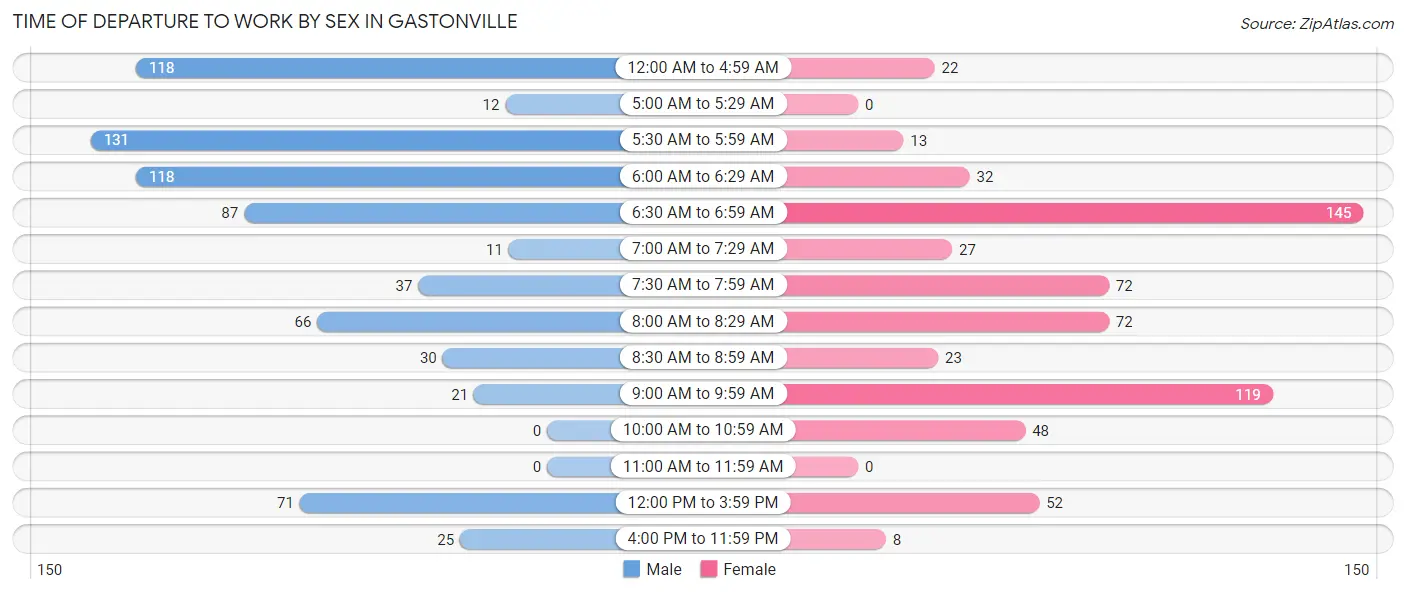
| Time of Departure | Male | Female |
| 12:00 AM to 4:59 AM | 118 (16.2%) | 22 (3.5%) |
| 5:00 AM to 5:29 AM | 12 (1.7%) | 0 (0.0%) |
| 5:30 AM to 5:59 AM | 131 (18.0%) | 13 (2.1%) |
| 6:00 AM to 6:29 AM | 118 (16.2%) | 32 (5.1%) |
| 6:30 AM to 6:59 AM | 87 (12.0%) | 145 (22.9%) |
| 7:00 AM to 7:29 AM | 11 (1.5%) | 27 (4.3%) |
| 7:30 AM to 7:59 AM | 37 (5.1%) | 72 (11.4%) |
| 8:00 AM to 8:29 AM | 66 (9.1%) | 72 (11.4%) |
| 8:30 AM to 8:59 AM | 30 (4.1%) | 23 (3.6%) |
| 9:00 AM to 9:59 AM | 21 (2.9%) | 119 (18.8%) |
| 10:00 AM to 10:59 AM | 0 (0.0%) | 48 (7.6%) |
| 11:00 AM to 11:59 AM | 0 (0.0%) | 0 (0.0%) |
| 12:00 PM to 3:59 PM | 71 (9.8%) | 52 (8.2%) |
| 4:00 PM to 11:59 PM | 25 (3.4%) | 8 (1.3%) |
| Total | 727 (100.0%) | 633 (100.0%) |
Housing Occupancy in Gastonville
Occupancy by Ownership in Gastonville
Of the total 1,281 dwellings in Gastonville, owner-occupied units account for 1,152 (89.9%), while renter-occupied units make up 129 (10.1%).
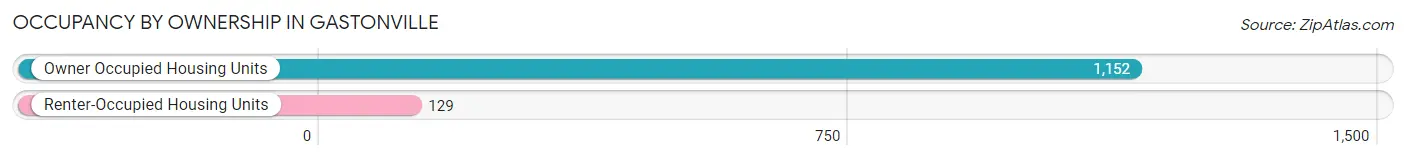
| Occupancy | # Housing Units | % Housing Units |
| Owner Occupied Housing Units | 1,152 | 89.9% |
| Renter-Occupied Housing Units | 129 | 10.1% |
| Total Occupied Housing Units | 1,281 | 100.0% |
Occupancy by Household Size in Gastonville
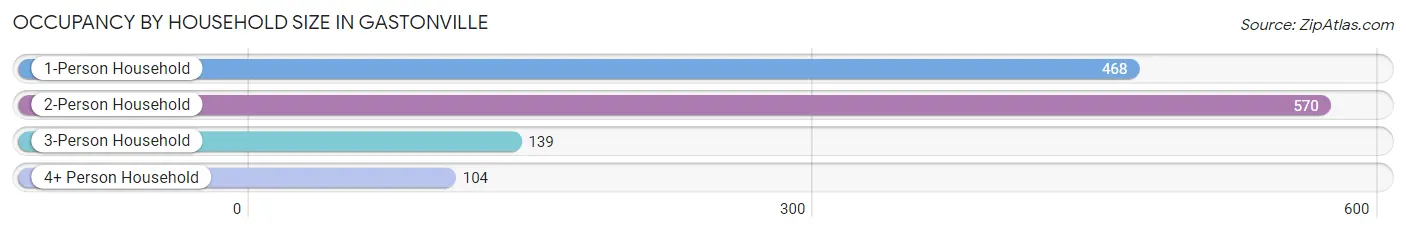
| Household Size | # Housing Units | % Housing Units |
| 1-Person Household | 468 | 36.5% |
| 2-Person Household | 570 | 44.5% |
| 3-Person Household | 139 | 10.8% |
| 4+ Person Household | 104 | 8.1% |
| Total Housing Units | 1,281 | 100.0% |
Occupancy by Ownership by Household Size in Gastonville
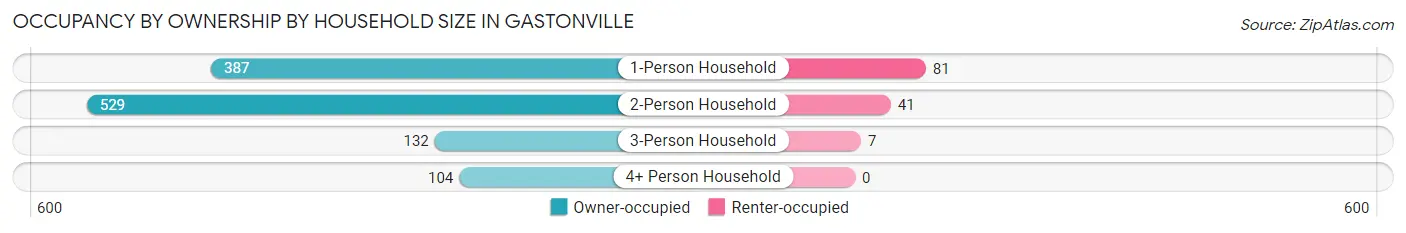
| Household Size | Owner-occupied | Renter-occupied |
| 1-Person Household | 387 (82.7%) | 81 (17.3%) |
| 2-Person Household | 529 (92.8%) | 41 (7.2%) |
| 3-Person Household | 132 (95.0%) | 7 (5.0%) |
| 4+ Person Household | 104 (100.0%) | 0 (0.0%) |
| Total Housing Units | 1,152 (89.9%) | 129 (10.1%) |
Occupancy by Educational Attainment in Gastonville
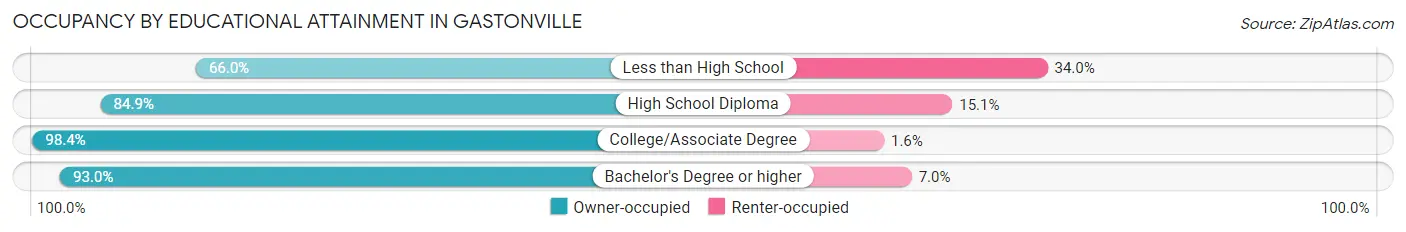
| Household Size | Owner-occupied | Renter-occupied |
| Less than High School | 68 (66.0%) | 35 (34.0%) |
| High School Diploma | 377 (84.9%) | 67 (15.1%) |
| College/Associate Degree | 443 (98.4%) | 7 (1.6%) |
| Bachelor's Degree or higher | 264 (93.0%) | 20 (7.0%) |
Occupancy by Age of Householder in Gastonville
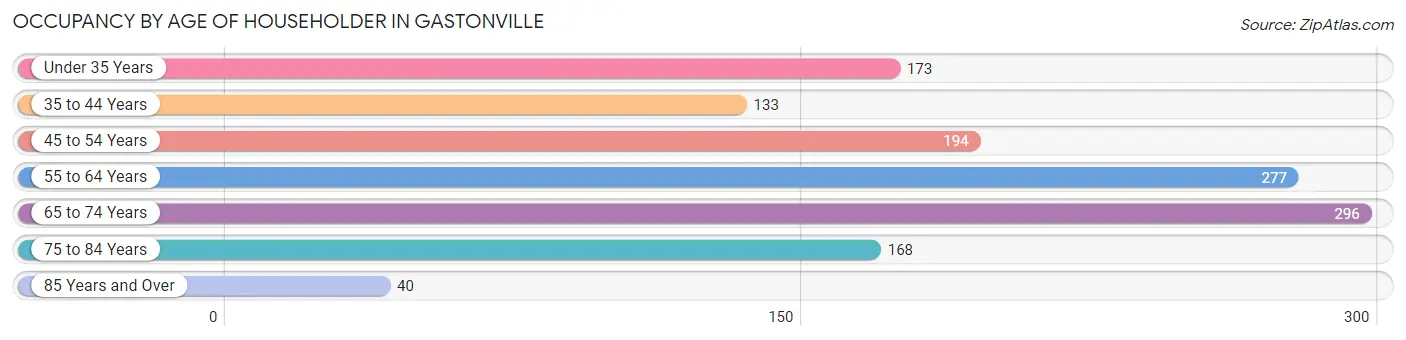
| Age Bracket | # Households | % Households |
| Under 35 Years | 173 | 13.5% |
| 35 to 44 Years | 133 | 10.4% |
| 45 to 54 Years | 194 | 15.1% |
| 55 to 64 Years | 277 | 21.6% |
| 65 to 74 Years | 296 | 23.1% |
| 75 to 84 Years | 168 | 13.1% |
| 85 Years and Over | 40 | 3.1% |
| Total | 1,281 | 100.0% |
Housing Finances in Gastonville
Median Income by Occupancy in Gastonville
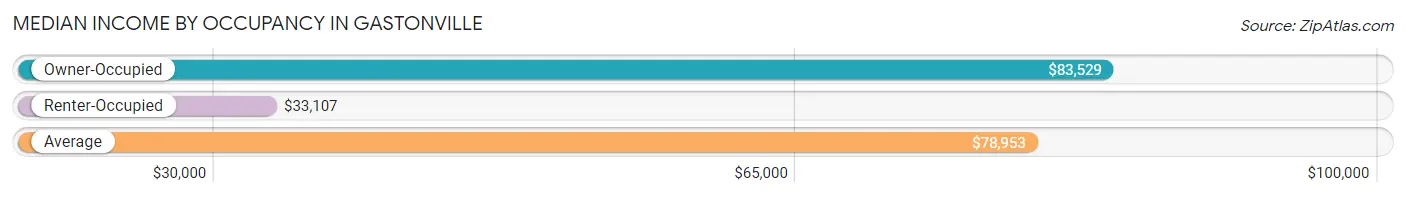
| Occupancy Type | # Households | Median Income |
| Owner-Occupied | 1,152 (89.9%) | $83,529 |
| Renter-Occupied | 129 (10.1%) | $33,107 |
| Average | 1,281 (100.0%) | $78,953 |
Occupancy by Householder Income Bracket in Gastonville
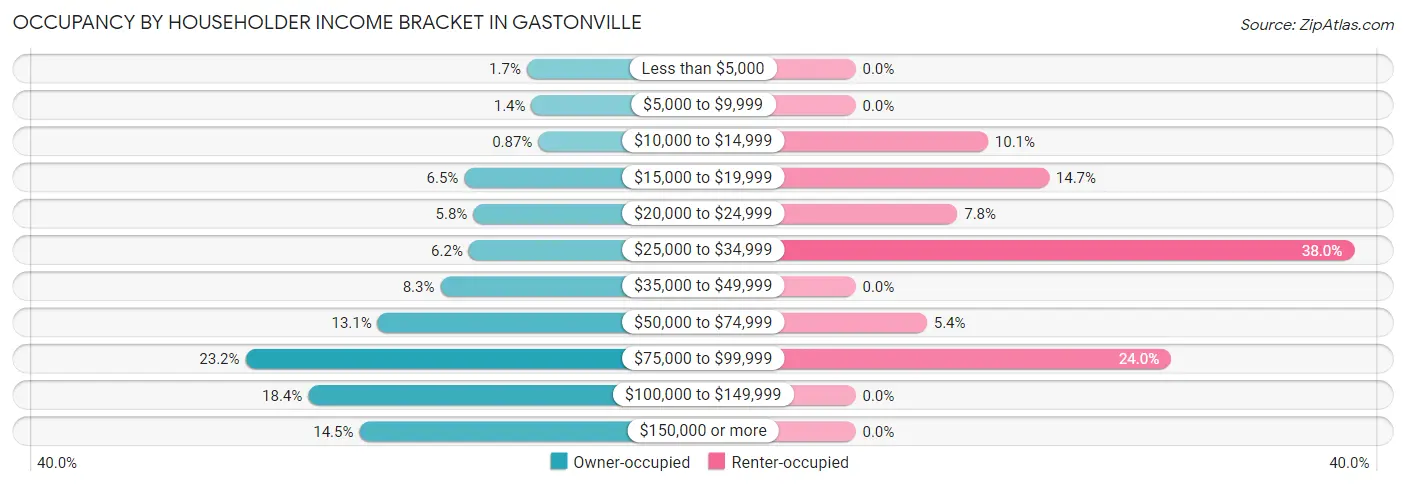
| Income Bracket | Owner-occupied | Renter-occupied |
| Less than $5,000 | 20 (1.7%) | 0 (0.0%) |
| $5,000 to $9,999 | 16 (1.4%) | 0 (0.0%) |
| $10,000 to $14,999 | 10 (0.9%) | 13 (10.1%) |
| $15,000 to $19,999 | 75 (6.5%) | 19 (14.7%) |
| $20,000 to $24,999 | 67 (5.8%) | 10 (7.7%) |
| $25,000 to $34,999 | 71 (6.2%) | 49 (38.0%) |
| $35,000 to $49,999 | 96 (8.3%) | 0 (0.0%) |
| $50,000 to $74,999 | 151 (13.1%) | 7 (5.4%) |
| $75,000 to $99,999 | 267 (23.2%) | 31 (24.0%) |
| $100,000 to $149,999 | 212 (18.4%) | 0 (0.0%) |
| $150,000 or more | 167 (14.5%) | 0 (0.0%) |
| Total | 1,152 (100.0%) | 129 (100.0%) |
Monthly Housing Cost Tiers in Gastonville
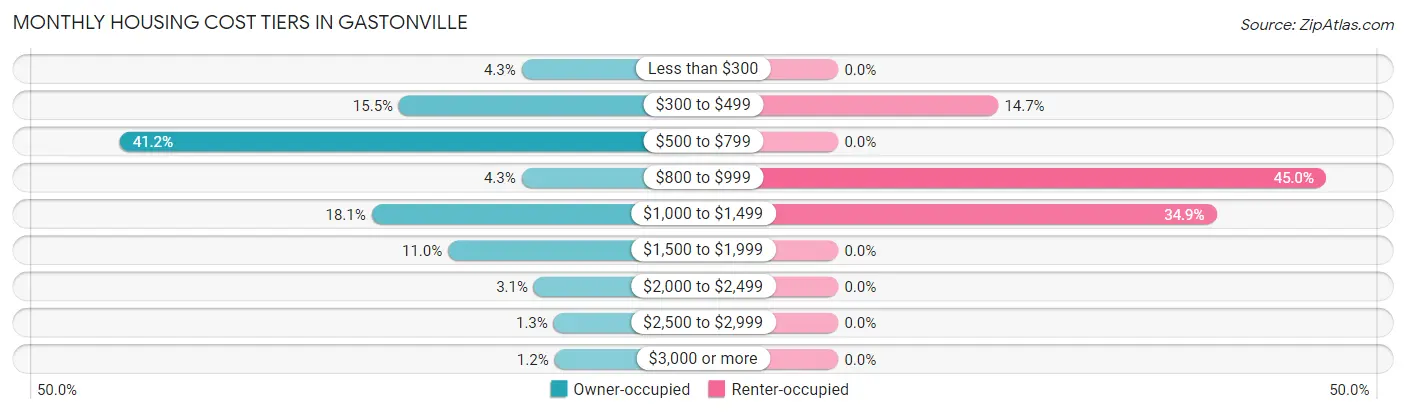
| Monthly Cost | Owner-occupied | Renter-occupied |
| Less than $300 | 49 (4.3%) | 0 (0.0%) |
| $300 to $499 | 179 (15.5%) | 19 (14.7%) |
| $500 to $799 | 475 (41.2%) | 0 (0.0%) |
| $800 to $999 | 49 (4.3%) | 58 (45.0%) |
| $1,000 to $1,499 | 208 (18.1%) | 45 (34.9%) |
| $1,500 to $1,999 | 127 (11.0%) | 0 (0.0%) |
| $2,000 to $2,499 | 36 (3.1%) | 0 (0.0%) |
| $2,500 to $2,999 | 15 (1.3%) | 0 (0.0%) |
| $3,000 or more | 14 (1.2%) | 0 (0.0%) |
| Total | 1,152 (100.0%) | 129 (100.0%) |
Physical Housing Characteristics in Gastonville
Housing Structures in Gastonville
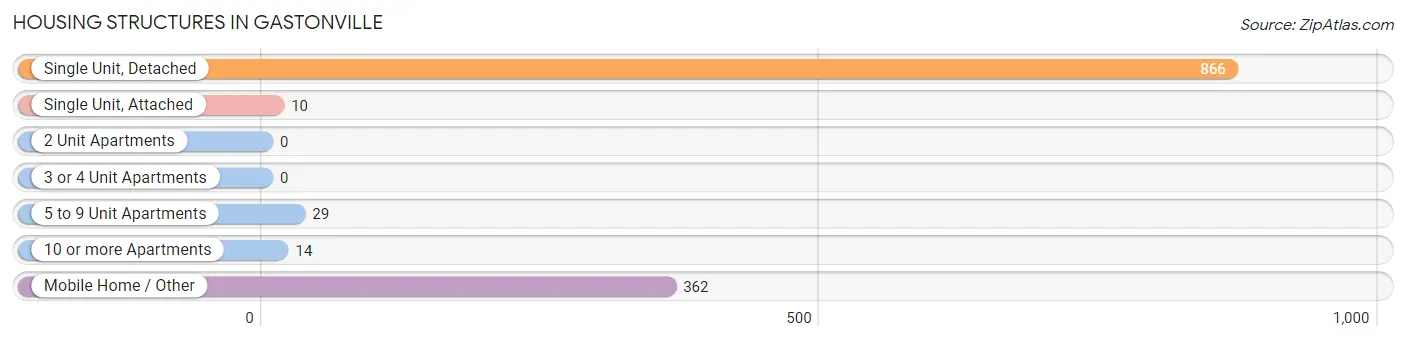
| Structure Type | # Housing Units | % Housing Units |
| Single Unit, Detached | 866 | 67.6% |
| Single Unit, Attached | 10 | 0.8% |
| 2 Unit Apartments | 0 | 0.0% |
| 3 or 4 Unit Apartments | 0 | 0.0% |
| 5 to 9 Unit Apartments | 29 | 2.3% |
| 10 or more Apartments | 14 | 1.1% |
| Mobile Home / Other | 362 | 28.3% |
| Total | 1,281 | 100.0% |
Housing Structures by Occupancy in Gastonville
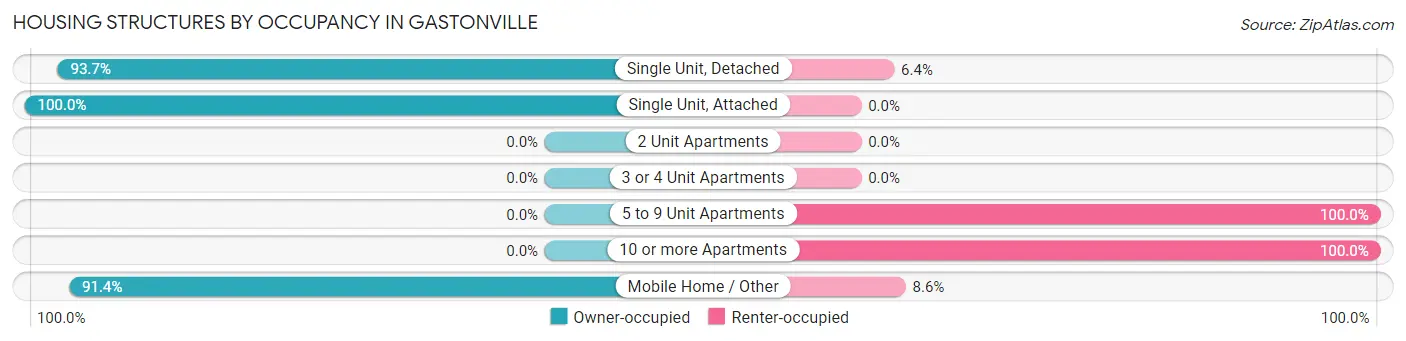
| Structure Type | Owner-occupied | Renter-occupied |
| Single Unit, Detached | 811 (93.6%) | 55 (6.4%) |
| Single Unit, Attached | 10 (100.0%) | 0 (0.0%) |
| 2 Unit Apartments | 0 (0.0%) | 0 (0.0%) |
| 3 or 4 Unit Apartments | 0 (0.0%) | 0 (0.0%) |
| 5 to 9 Unit Apartments | 0 (0.0%) | 29 (100.0%) |
| 10 or more Apartments | 0 (0.0%) | 14 (100.0%) |
| Mobile Home / Other | 331 (91.4%) | 31 (8.6%) |
| Total | 1,152 (89.9%) | 129 (10.1%) |
Housing Structures by Number of Rooms in Gastonville
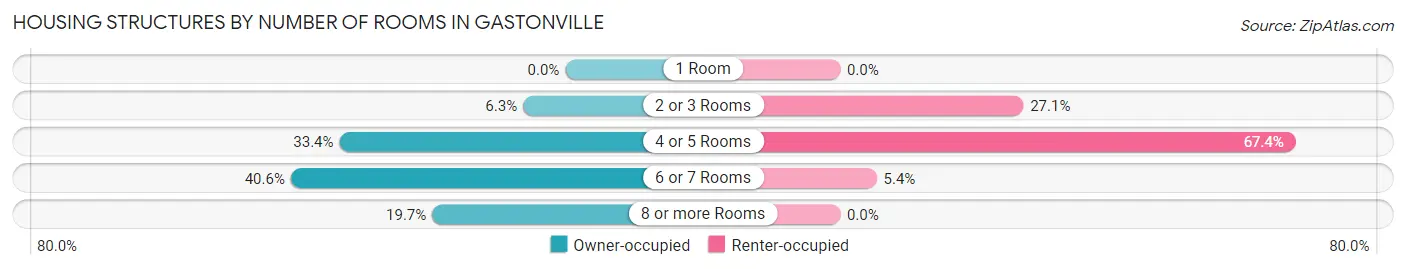
| Number of Rooms | Owner-occupied | Renter-occupied |
| 1 Room | 0 (0.0%) | 0 (0.0%) |
| 2 or 3 Rooms | 72 (6.2%) | 35 (27.1%) |
| 4 or 5 Rooms | 385 (33.4%) | 87 (67.4%) |
| 6 or 7 Rooms | 468 (40.6%) | 7 (5.4%) |
| 8 or more Rooms | 227 (19.7%) | 0 (0.0%) |
| Total | 1,152 (100.0%) | 129 (100.0%) |
Housing Structure by Heating Type in Gastonville
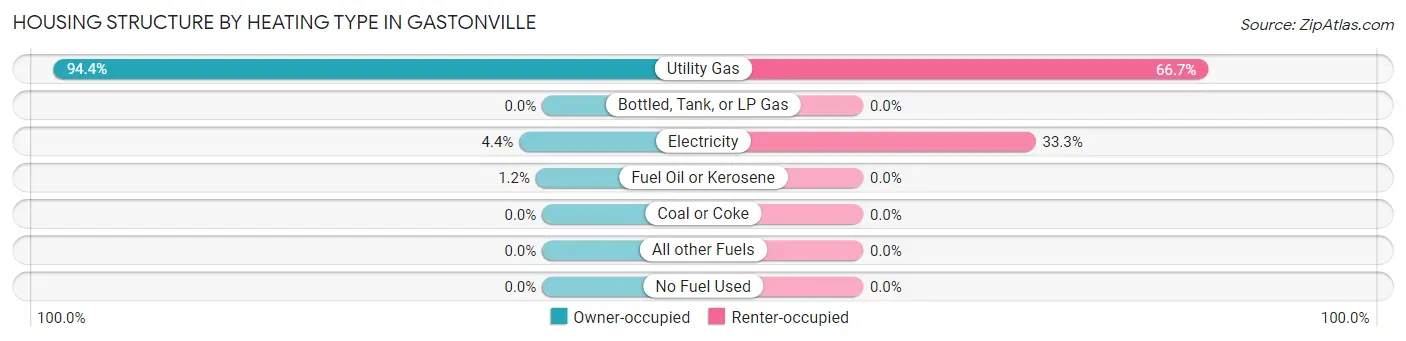
| Heating Type | Owner-occupied | Renter-occupied |
| Utility Gas | 1,087 (94.4%) | 86 (66.7%) |
| Bottled, Tank, or LP Gas | 0 (0.0%) | 0 (0.0%) |
| Electricity | 51 (4.4%) | 43 (33.3%) |
| Fuel Oil or Kerosene | 14 (1.2%) | 0 (0.0%) |
| Coal or Coke | 0 (0.0%) | 0 (0.0%) |
| All other Fuels | 0 (0.0%) | 0 (0.0%) |
| No Fuel Used | 0 (0.0%) | 0 (0.0%) |
| Total | 1,152 (100.0%) | 129 (100.0%) |
Household Vehicle Usage in Gastonville
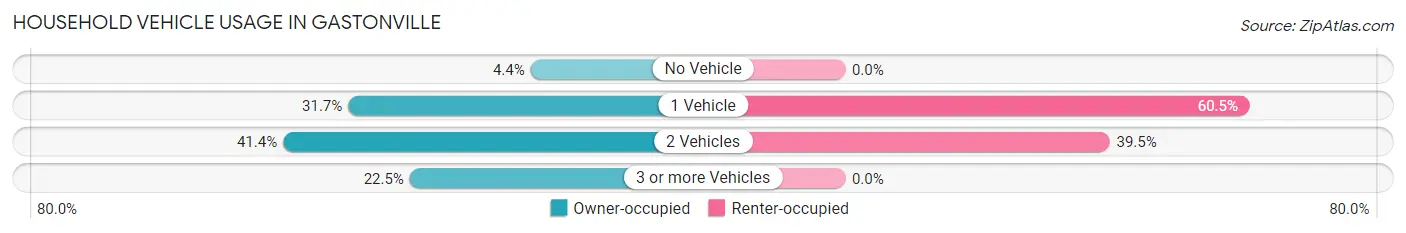
| Vehicles per Household | Owner-occupied | Renter-occupied |
| No Vehicle | 51 (4.4%) | 0 (0.0%) |
| 1 Vehicle | 365 (31.7%) | 78 (60.5%) |
| 2 Vehicles | 477 (41.4%) | 51 (39.5%) |
| 3 or more Vehicles | 259 (22.5%) | 0 (0.0%) |
| Total | 1,152 (100.0%) | 129 (100.0%) |
Real Estate & Mortgages in Gastonville
Real Estate and Mortgage Overview in Gastonville
| Characteristic | Without Mortgage | With Mortgage |
| Housing Units | 701 | 451 |
| Median Property Value | $104,300 | $197,400 |
| Median Household Income | $56,050 | $100 |
| Monthly Housing Costs | $601 | $14 |
| Real Estate Taxes | $1,543 | $8 |
Property Value by Mortgage Status in Gastonville
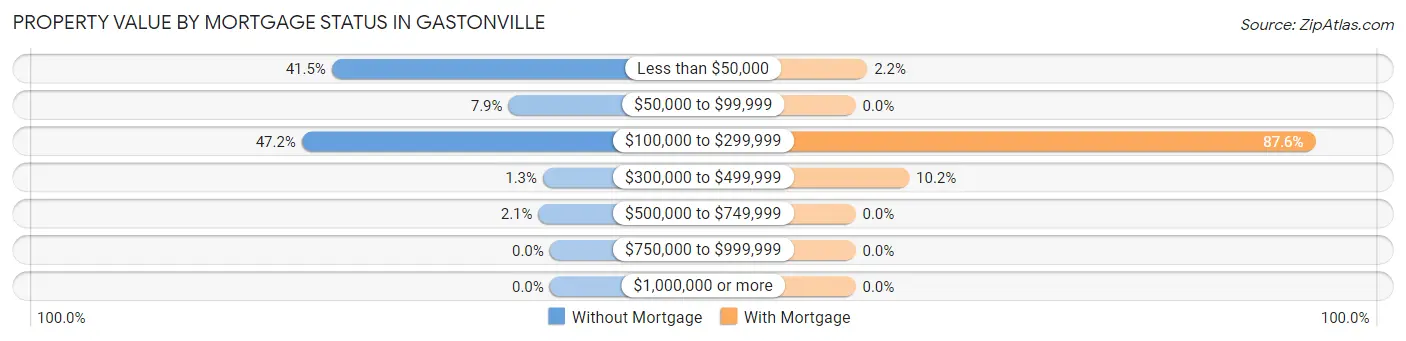
| Property Value | Without Mortgage | With Mortgage |
| Less than $50,000 | 291 (41.5%) | 10 (2.2%) |
| $50,000 to $99,999 | 55 (7.9%) | 0 (0.0%) |
| $100,000 to $299,999 | 331 (47.2%) | 395 (87.6%) |
| $300,000 to $499,999 | 9 (1.3%) | 46 (10.2%) |
| $500,000 to $749,999 | 15 (2.1%) | 0 (0.0%) |
| $750,000 to $999,999 | 0 (0.0%) | 0 (0.0%) |
| $1,000,000 or more | 0 (0.0%) | 0 (0.0%) |
| Total | 701 (100.0%) | 451 (100.0%) |
Household Income by Mortgage Status in Gastonville
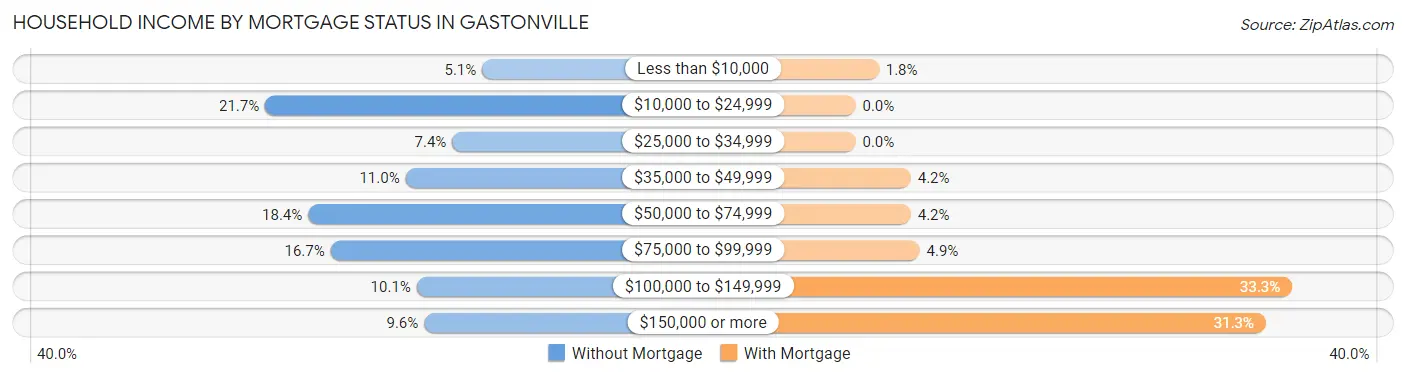
| Household Income | Without Mortgage | With Mortgage |
| Less than $10,000 | 36 (5.1%) | 8 (1.8%) |
| $10,000 to $24,999 | 152 (21.7%) | 0 (0.0%) |
| $25,000 to $34,999 | 52 (7.4%) | 0 (0.0%) |
| $35,000 to $49,999 | 77 (11.0%) | 19 (4.2%) |
| $50,000 to $74,999 | 129 (18.4%) | 19 (4.2%) |
| $75,000 to $99,999 | 117 (16.7%) | 22 (4.9%) |
| $100,000 to $149,999 | 71 (10.1%) | 150 (33.3%) |
| $150,000 or more | 67 (9.6%) | 141 (31.3%) |
| Total | 701 (100.0%) | 451 (100.0%) |
Property Value to Household Income Ratio in Gastonville
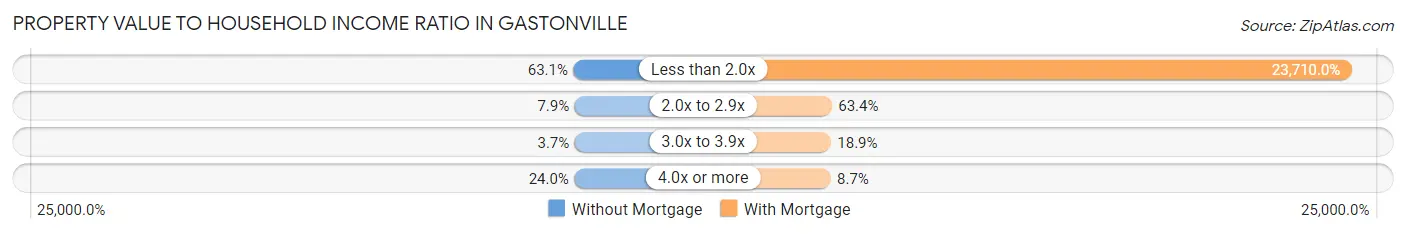
| Value-to-Income Ratio | Without Mortgage | With Mortgage |
| Less than 2.0x | 442 (63.0%) | 106,932 (23,710.0%) |
| 2.0x to 2.9x | 55 (7.9%) | 286 (63.4%) |
| 3.0x to 3.9x | 26 (3.7%) | 85 (18.9%) |
| 4.0x or more | 168 (24.0%) | 39 (8.6%) |
| Total | 701 (100.0%) | 451 (100.0%) |
Real Estate Taxes by Mortgage Status in Gastonville
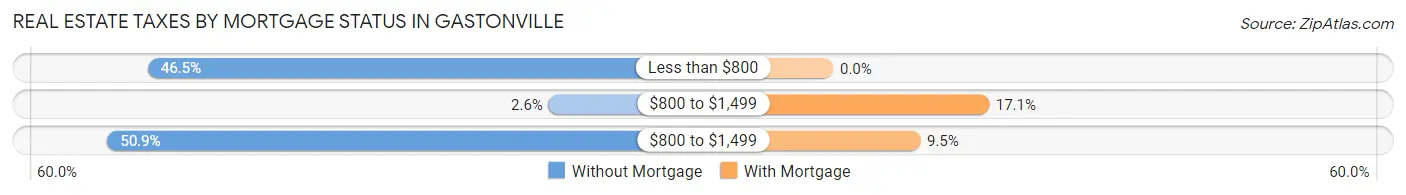
| Property Taxes | Without Mortgage | With Mortgage |
| Less than $800 | 326 (46.5%) | 0 (0.0%) |
| $800 to $1,499 | 18 (2.6%) | 77 (17.1%) |
| $800 to $1,499 | 357 (50.9%) | 43 (9.5%) |
| Total | 701 (100.0%) | 451 (100.0%) |
Health & Disability in Gastonville
Health Insurance Coverage by Age in Gastonville
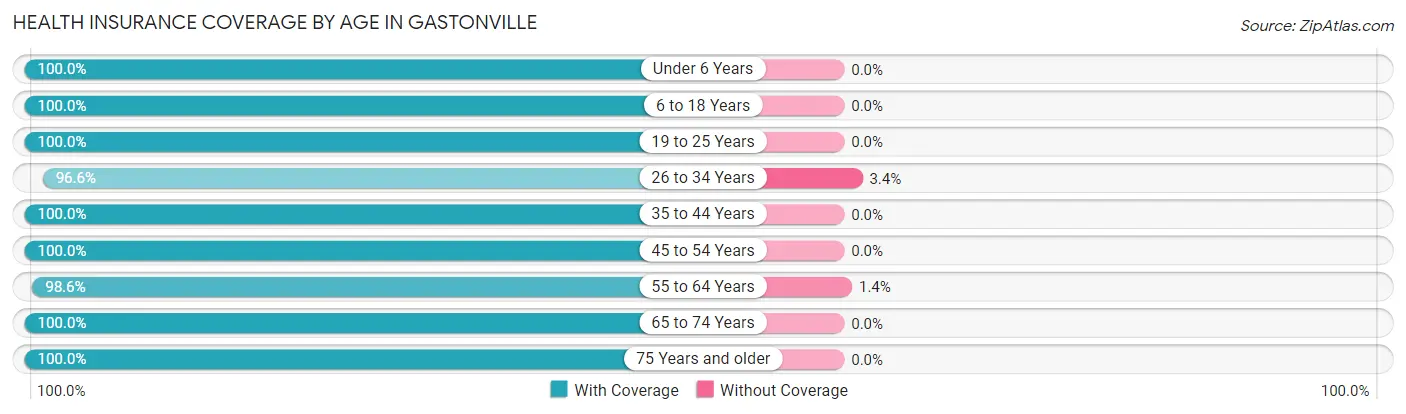
| Age Bracket | With Coverage | Without Coverage |
| Under 6 Years | 144 (100.0%) | 0 (0.0%) |
| 6 to 18 Years | 198 (100.0%) | 0 (0.0%) |
| 19 to 25 Years | 199 (100.0%) | 0 (0.0%) |
| 26 to 34 Years | 257 (96.6%) | 9 (3.4%) |
| 35 to 44 Years | 230 (100.0%) | 0 (0.0%) |
| 45 to 54 Years | 335 (100.0%) | 0 (0.0%) |
| 55 to 64 Years | 479 (98.6%) | 7 (1.4%) |
| 65 to 74 Years | 444 (100.0%) | 0 (0.0%) |
| 75 Years and older | 273 (100.0%) | 0 (0.0%) |
| Total | 2,559 (99.4%) | 16 (0.6%) |
Health Insurance Coverage by Citizenship Status in Gastonville
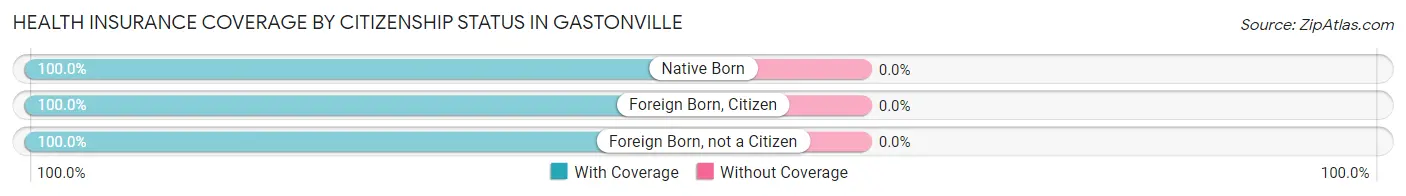
| Citizenship Status | With Coverage | Without Coverage |
| Native Born | 144 (100.0%) | 0 (0.0%) |
| Foreign Born, Citizen | 198 (100.0%) | 0 (0.0%) |
| Foreign Born, not a Citizen | 199 (100.0%) | 0 (0.0%) |
Health Insurance Coverage by Household Income in Gastonville
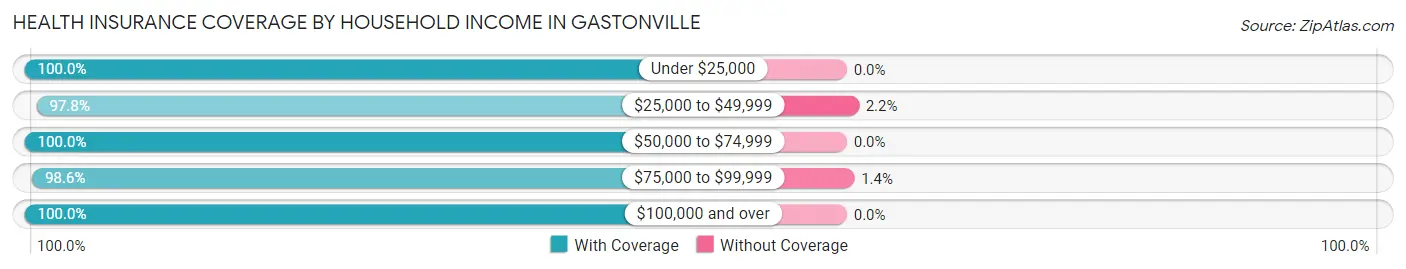
| Household Income | With Coverage | Without Coverage |
| Under $25,000 | 286 (100.0%) | 0 (0.0%) |
| $25,000 to $49,999 | 307 (97.8%) | 7 (2.2%) |
| $50,000 to $74,999 | 292 (100.0%) | 0 (0.0%) |
| $75,000 to $99,999 | 639 (98.6%) | 9 (1.4%) |
| $100,000 and over | 1,030 (100.0%) | 0 (0.0%) |
Public vs Private Health Insurance Coverage by Age in Gastonville
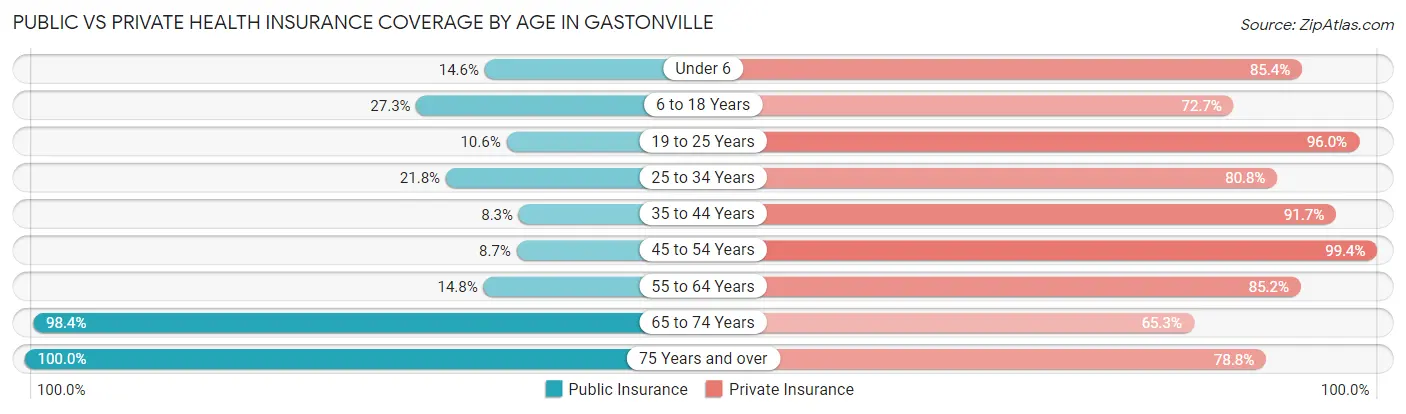
| Age Bracket | Public Insurance | Private Insurance |
| Under 6 | 21 (14.6%) | 123 (85.4%) |
| 6 to 18 Years | 54 (27.3%) | 144 (72.7%) |
| 19 to 25 Years | 21 (10.5%) | 191 (96.0%) |
| 25 to 34 Years | 58 (21.8%) | 215 (80.8%) |
| 35 to 44 Years | 19 (8.3%) | 211 (91.7%) |
| 45 to 54 Years | 29 (8.7%) | 333 (99.4%) |
| 55 to 64 Years | 72 (14.8%) | 414 (85.2%) |
| 65 to 74 Years | 437 (98.4%) | 290 (65.3%) |
| 75 Years and over | 273 (100.0%) | 215 (78.7%) |
| Total | 984 (38.2%) | 2,136 (83.0%) |
Disability Status by Sex by Age in Gastonville
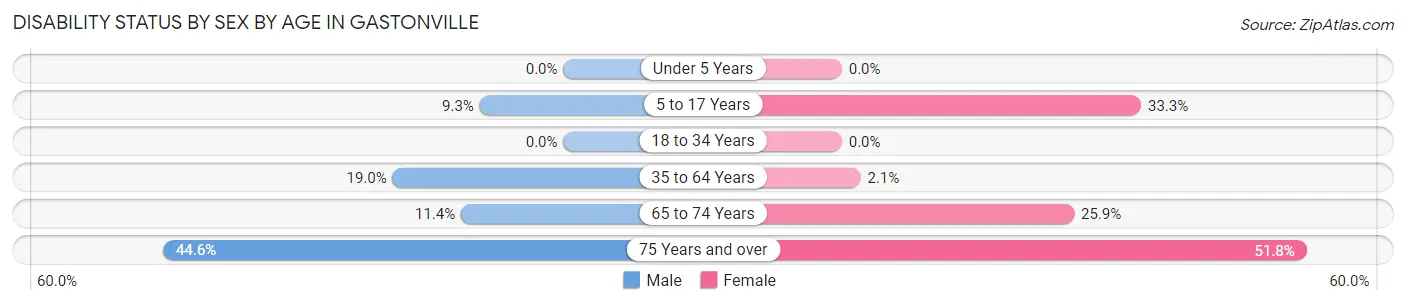
| Age Bracket | Male | Female |
| Under 5 Years | 0 (0.0%) | 0 (0.0%) |
| 5 to 17 Years | 11 (9.3%) | 28 (33.3%) |
| 18 to 34 Years | 0 (0.0%) | 0 (0.0%) |
| 35 to 64 Years | 109 (19.0%) | 10 (2.1%) |
| 65 to 74 Years | 18 (11.4%) | 74 (25.9%) |
| 75 Years and over | 33 (44.6%) | 103 (51.8%) |
Disability Class by Sex by Age in Gastonville
Disability Class: Hearing Difficulty
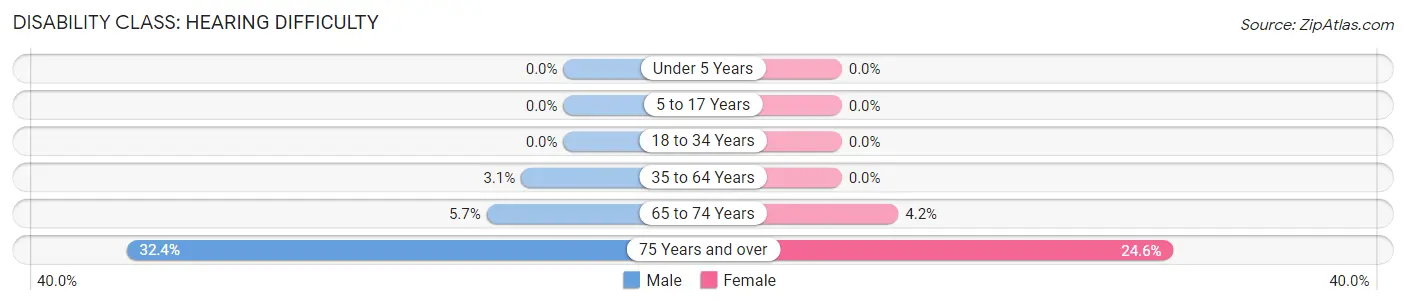
| Age Bracket | Male | Female |
| Under 5 Years | 0 (0.0%) | 0 (0.0%) |
| 5 to 17 Years | 0 (0.0%) | 0 (0.0%) |
| 18 to 34 Years | 0 (0.0%) | 0 (0.0%) |
| 35 to 64 Years | 18 (3.1%) | 0 (0.0%) |
| 65 to 74 Years | 9 (5.7%) | 12 (4.2%) |
| 75 Years and over | 24 (32.4%) | 49 (24.6%) |
Disability Class: Vision Difficulty
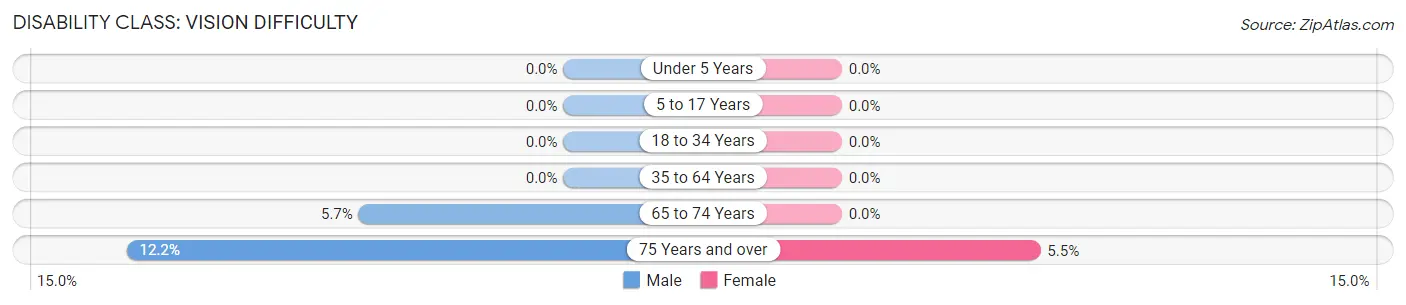
| Age Bracket | Male | Female |
| Under 5 Years | 0 (0.0%) | 0 (0.0%) |
| 5 to 17 Years | 0 (0.0%) | 0 (0.0%) |
| 18 to 34 Years | 0 (0.0%) | 0 (0.0%) |
| 35 to 64 Years | 0 (0.0%) | 0 (0.0%) |
| 65 to 74 Years | 9 (5.7%) | 0 (0.0%) |
| 75 Years and over | 9 (12.2%) | 11 (5.5%) |
Disability Class: Cognitive Difficulty
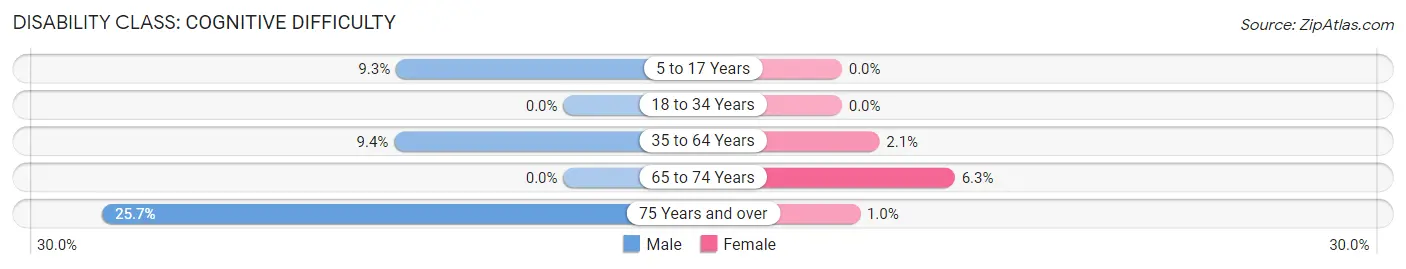
| Age Bracket | Male | Female |
| 5 to 17 Years | 11 (9.3%) | 0 (0.0%) |
| 18 to 34 Years | 0 (0.0%) | 0 (0.0%) |
| 35 to 64 Years | 54 (9.4%) | 10 (2.1%) |
| 65 to 74 Years | 0 (0.0%) | 18 (6.3%) |
| 75 Years and over | 19 (25.7%) | 2 (1.0%) |
Disability Class: Ambulatory Difficulty
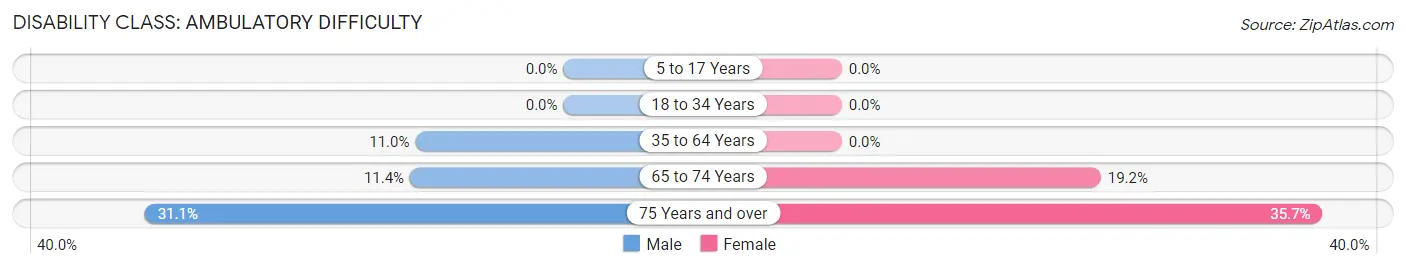
| Age Bracket | Male | Female |
| 5 to 17 Years | 0 (0.0%) | 0 (0.0%) |
| 18 to 34 Years | 0 (0.0%) | 0 (0.0%) |
| 35 to 64 Years | 63 (11.0%) | 0 (0.0%) |
| 65 to 74 Years | 18 (11.4%) | 55 (19.2%) |
| 75 Years and over | 23 (31.1%) | 71 (35.7%) |
Disability Class: Self-Care Difficulty
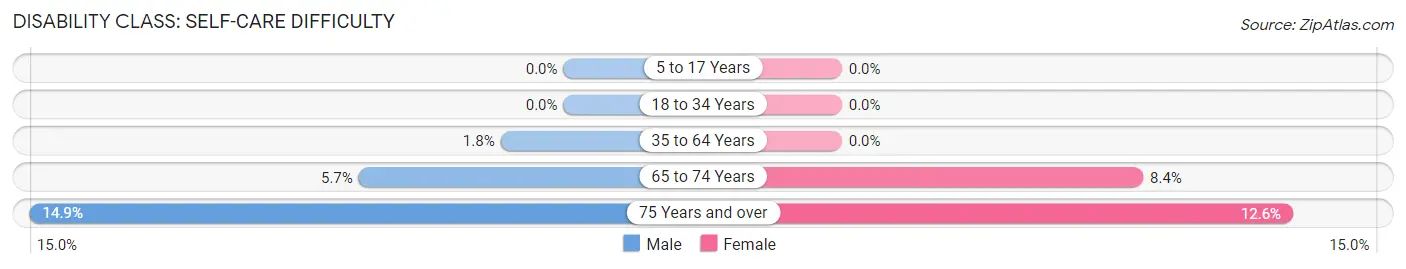
| Age Bracket | Male | Female |
| 5 to 17 Years | 0 (0.0%) | 0 (0.0%) |
| 18 to 34 Years | 0 (0.0%) | 0 (0.0%) |
| 35 to 64 Years | 10 (1.8%) | 0 (0.0%) |
| 65 to 74 Years | 9 (5.7%) | 24 (8.4%) |
| 75 Years and over | 11 (14.9%) | 25 (12.6%) |
Technology Access in Gastonville
Computing Device Access in Gastonville
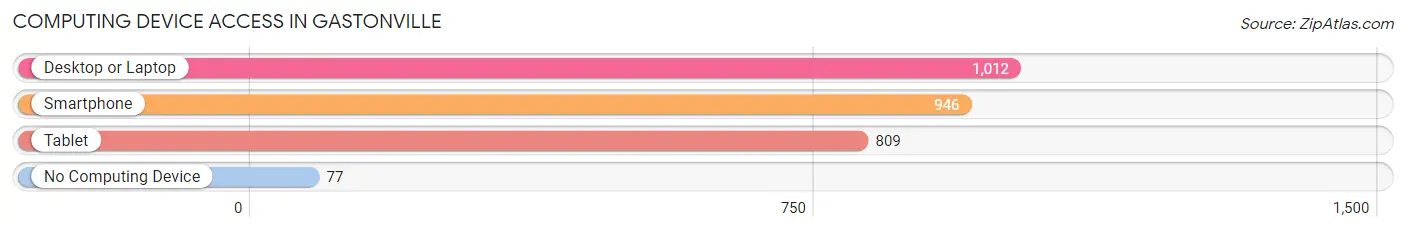
| Device Type | # Households | % Households |
| Desktop or Laptop | 1,012 | 79.0% |
| Smartphone | 946 | 73.9% |
| Tablet | 809 | 63.1% |
| No Computing Device | 77 | 6.0% |
| Total | 1,281 | 100.0% |
Internet Access in Gastonville
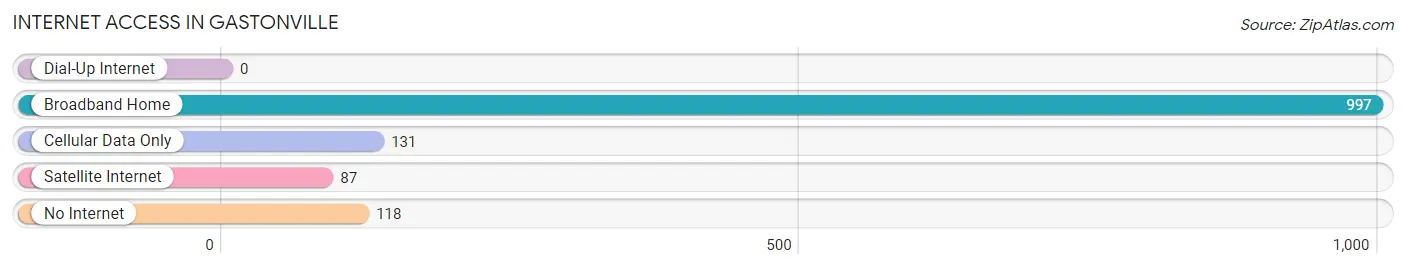
| Internet Type | # Households | % Households |
| Dial-Up Internet | 0 | 0.0% |
| Broadband Home | 997 | 77.8% |
| Cellular Data Only | 131 | 10.2% |
| Satellite Internet | 87 | 6.8% |
| No Internet | 118 | 9.2% |
| Total | 1,281 | 100.0% |
Gastonville Summary
Gastonville, Pennsylvania is a small borough located in Allegheny County, Pennsylvania. It is situated in the southwestern part of the state, approximately 20 miles south of Pittsburgh. The borough is bordered by the boroughs of Elizabeth and West Elizabeth, as well as the townships of South Park and Jefferson. According to the 2010 census, the population of Gastonville was 1,845.
History
Gastonville was founded in 1845 by John Gaston, a local landowner. The borough was named after him. Gastonville was originally a farming community, but it soon developed into a small industrial center. The first industry to be established in the borough was a sawmill, which was built in 1848. This was followed by a grist mill, a tannery, and a brickyard.
In the late 19th century, Gastonville experienced a period of growth and development. The borough was incorporated in 1891, and the first mayor was elected in 1892. During this time, the borough saw the construction of several churches, a school, and a post office.
Geography
Gastonville is located in southwestern Pennsylvania, approximately 20 miles south of Pittsburgh. The borough is situated in the Allegheny Plateau region of the state, and is bordered by the boroughs of Elizabeth and West Elizabeth, as well as the townships of South Park and Jefferson.
The borough has a total area of 0.7 square miles, all of which is land. The terrain is mostly flat, with some rolling hills. The borough is located in the Monongahela River watershed.
Economy
Gastonville’s economy is largely based on manufacturing and services. The borough is home to several small businesses, including a sawmill, a grist mill, a tannery, and a brickyard. The borough also has a few retail stores, restaurants, and other small businesses.
The borough is also home to several industrial parks, which are home to a variety of businesses, including manufacturing, warehousing, and distribution.
Demographics
According to the 2010 census, the population of Gastonville was 1,845. The racial makeup of the borough was 94.3% White, 2.7% African American, 0.2% Native American, 0.7% Asian, 0.1% Pacific Islander, 0.7% from other races, and 1.2% from two or more races. Hispanic or Latino of any race were 1.7% of the population.
The median household income in Gastonville was $41,250, and the median family income was $50,000. The per capita income was $20,945. About 8.3% of families and 10.2% of the population were below the poverty line, including 14.3% of those under age 18 and 6.2% of those age 65 or over.
Common Questions
What is Per Capita Income in Gastonville?
Per Capita income in Gastonville is $44,098.
What is the Median Family Income in Gastonville?
Median Family Income in Gastonville is $86,219.
What is the Median Household income in Gastonville?
Median Household Income in Gastonville is $78,953.
What is Income or Wage Gap in Gastonville?
Income or Wage Gap in Gastonville is 43.9%.
Women in Gastonville earn 56.1 cents for every dollar earned by a man.
What is Inequality or Gini Index in Gastonville?
Inequality or Gini Index in Gastonville is 0.41.
What is the Total Population of Gastonville?
Total Population of Gastonville is 2,575.
What is the Total Male Population of Gastonville?
Total Male Population of Gastonville is 1,252.
What is the Total Female Population of Gastonville?
Total Female Population of Gastonville is 1,323.
What is the Ratio of Males per 100 Females in Gastonville?
There are 94.63 Males per 100 Females in Gastonville.
What is the Ratio of Females per 100 Males in Gastonville?
There are 105.67 Females per 100 Males in Gastonville.
What is the Median Population Age in Gastonville?
Median Population Age in Gastonville is 53.3 Years.
What is the Average Family Size in Gastonville
Average Family Size in Gastonville is 2.6 People.
What is the Average Household Size in Gastonville
Average Household Size in Gastonville is 2.0 People.
How Large is the Labor Force in Gastonville?
There are 1,485 People in the Labor Forcein in Gastonville.
What is the Percentage of People in the Labor Force in Gastonville?
64.3% of People are in the Labor Force in Gastonville.
What is the Unemployment Rate in Gastonville?
Unemployment Rate in Gastonville is 0.9%.