Potlicker Flats, PA Map & Demographics
Potlicker Flats Map
Potlicker Flats Overview
$52,939
PER CAPITA INCOME
$93,711
AVG FAMILY INCOME
$93,711
AVG HOUSEHOLD INCOME
0.23
INEQUALITY / GINI INDEX
141
TOTAL POPULATION
119
MALE POPULATION
22
FEMALE POPULATION
540.91
MALES / 100 FEMALES
18.49
FEMALES / 100 MALES
51.1
MEDIAN AGE
2.4
AVG FAMILY SIZE
2.0
AVG HOUSEHOLD SIZE
112
LABOR FORCE [ PEOPLE ]
79.4%
PERCENT IN LABOR FORCE
4.5%
UNEMPLOYMENT RATE
Income in Potlicker Flats
Income Overview in Potlicker Flats
Per Capita Income in Potlicker Flats is $52,939, while median incomes of families and households are $93,711 and $93,711 respectively.
| Characteristic | Number | Measure |
| Per Capita Income | 141 | $52,939 |
| Median Family Income | 51 | $93,711 |
| Mean Family Income | 51 | $109,524 |
| Median Household Income | 69 | $93,711 |
| Mean Household Income | 69 | $101,404 |
| Income Deficit | 51 | $0 |
| Wage / Income Gap (%) | 141 | 0.00% |
| Wage / Income Gap ($) | 141 | 100.00¢ per $1 |
| Gini / Inequality Index | 141 | 0.23 |
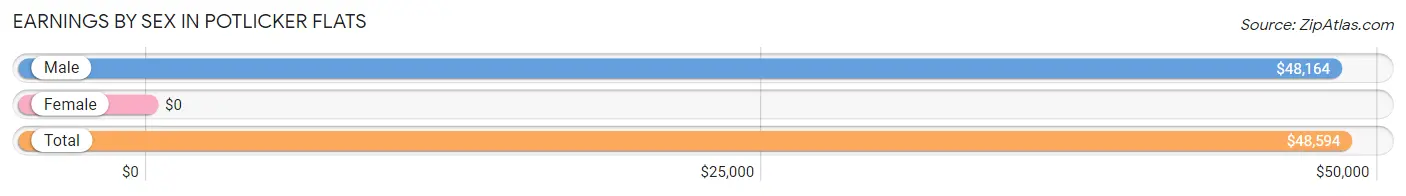
Earnings by Sex in Potlicker Flats
| Sex | Number | Average Earnings |
| Male | 101 (90.2%) | $48,164 |
| Female | 11 (9.8%) | $0 |
| Total | 112 (100.0%) | $48,594 |
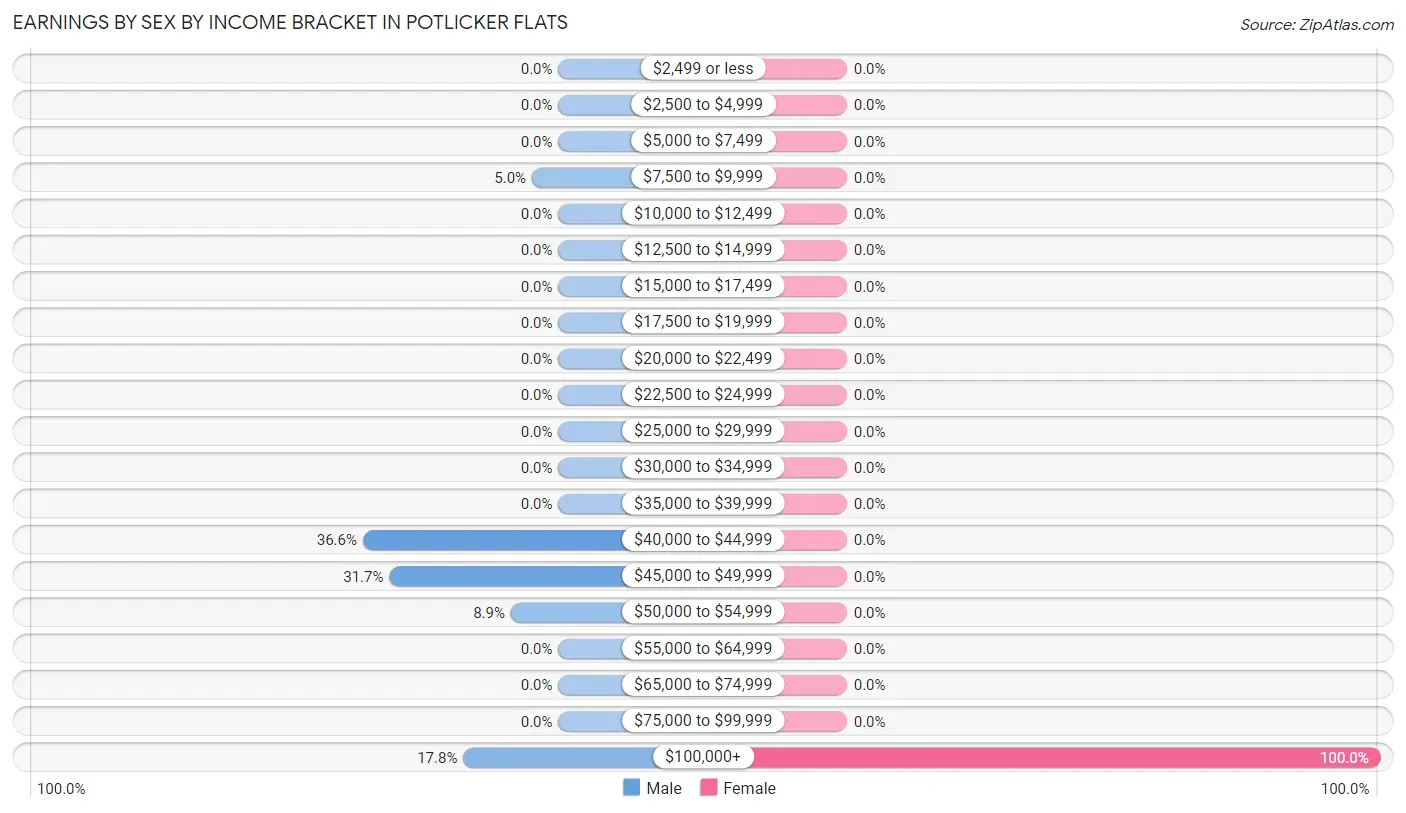
Earnings by Sex by Income Bracket in Potlicker Flats
The most common earnings brackets in Potlicker Flats are $40,000 to $44,999 for men (37 | 36.6%) and $100,000+ for women (11 | 100.0%).
| Income | Male | Female |
| $2,499 or less | 0 (0.0%) | 0 (0.0%) |
| $2,500 to $4,999 | 0 (0.0%) | 0 (0.0%) |
| $5,000 to $7,499 | 0 (0.0%) | 0 (0.0%) |
| $7,500 to $9,999 | 5 (5.0%) | 0 (0.0%) |
| $10,000 to $12,499 | 0 (0.0%) | 0 (0.0%) |
| $12,500 to $14,999 | 0 (0.0%) | 0 (0.0%) |
| $15,000 to $17,499 | 0 (0.0%) | 0 (0.0%) |
| $17,500 to $19,999 | 0 (0.0%) | 0 (0.0%) |
| $20,000 to $22,499 | 0 (0.0%) | 0 (0.0%) |
| $22,500 to $24,999 | 0 (0.0%) | 0 (0.0%) |
| $25,000 to $29,999 | 0 (0.0%) | 0 (0.0%) |
| $30,000 to $34,999 | 0 (0.0%) | 0 (0.0%) |
| $35,000 to $39,999 | 0 (0.0%) | 0 (0.0%) |
| $40,000 to $44,999 | 37 (36.6%) | 0 (0.0%) |
| $45,000 to $49,999 | 32 (31.7%) | 0 (0.0%) |
| $50,000 to $54,999 | 9 (8.9%) | 0 (0.0%) |
| $55,000 to $64,999 | 0 (0.0%) | 0 (0.0%) |
| $65,000 to $74,999 | 0 (0.0%) | 0 (0.0%) |
| $75,000 to $99,999 | 0 (0.0%) | 0 (0.0%) |
| $100,000+ | 18 (17.8%) | 11 (100.0%) |
| Total | 101 (100.0%) | 11 (100.0%) |
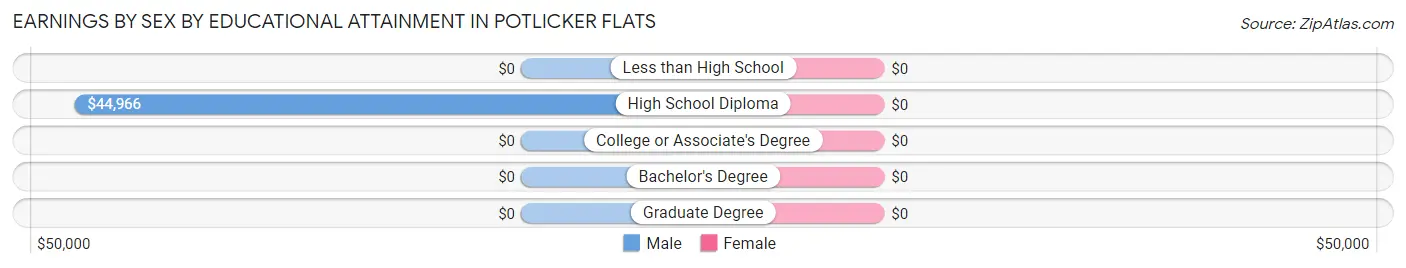
Earnings by Sex by Educational Attainment in Potlicker Flats
| Educational Attainment | Male Income | Female Income |
| Less than High School | - | - |
| High School Diploma | $44,966 | $0 |
| College or Associate's Degree | - | - |
| Bachelor's Degree | - | - |
| Graduate Degree | - | - |
| Total | $48,164 | $0 |
Family Income in Potlicker Flats
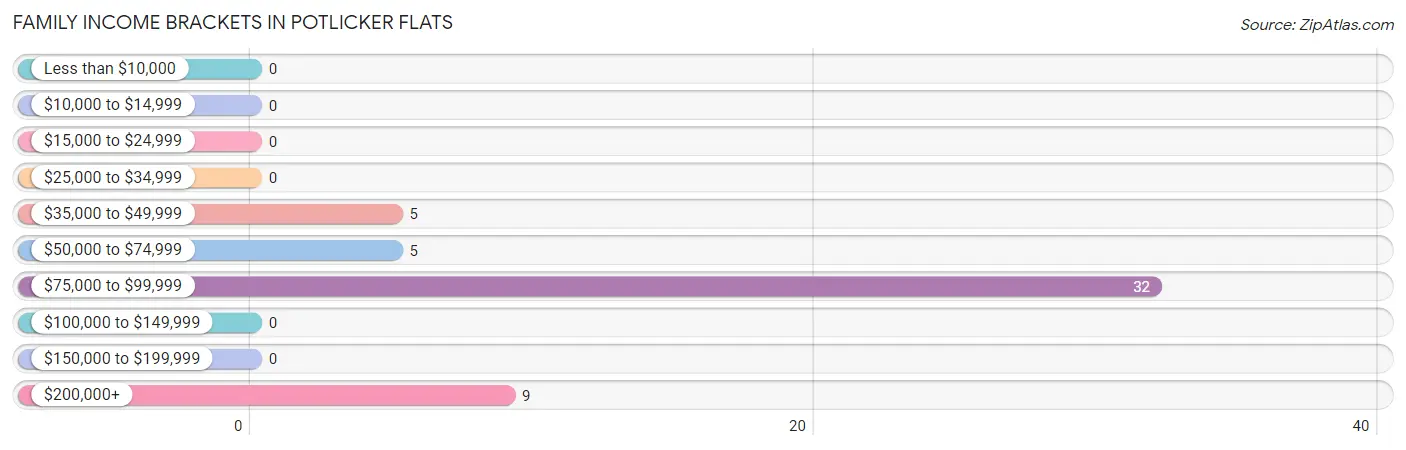
Family Income Brackets in Potlicker Flats
According to the Potlicker Flats family income data, there are 32 families falling into the $75,000 to $99,999 income range, which is the most common income bracket and makes up 62.7% of all families.
| Income Bracket | # Families | % Families |
| Less than $10,000 | 0 | 0.0% |
| $10,000 to $14,999 | 0 | 0.0% |
| $15,000 to $24,999 | 0 | 0.0% |
| $25,000 to $34,999 | 0 | 0.0% |
| $35,000 to $49,999 | 5 | 9.8% |
| $50,000 to $74,999 | 5 | 9.8% |
| $75,000 to $99,999 | 32 | 62.7% |
| $100,000 to $149,999 | 0 | 0.0% |
| $150,000 to $199,999 | 0 | 0.0% |
| $200,000+ | 9 | 17.6% |
Family Income by Famaliy Size in Potlicker Flats
| Income Bracket | # Families | Median Income |
| 2-Person Families | 37 (72.6%) | $0 |
| 3-Person Families | 14 (27.5%) | $0 |
| 4-Person Families | 0 (0.0%) | $0 |
| 5-Person Families | 0 (0.0%) | $0 |
| 6-Person Families | 0 (0.0%) | $0 |
| 7+ Person Families | 0 (0.0%) | $0 |
| Total | 51 (100.0%) | $93,711 |
Family Income by Number of Earners in Potlicker Flats
| Number of Earners | # Families | Median Income |
| No Earners | 5 (9.8%) | $0 |
| 1 Earner | 5 (9.8%) | $0 |
| 2 Earners | 41 (80.4%) | $0 |
| 3+ Earners | 0 (0.0%) | $0 |
| Total | 51 (100.0%) | $93,711 |
Household Income in Potlicker Flats
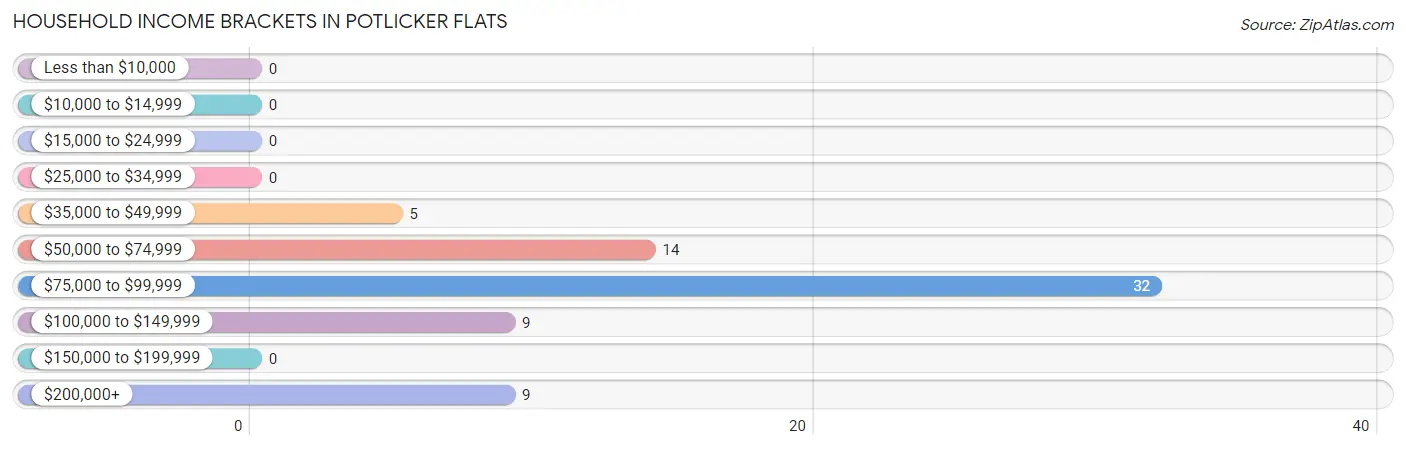
Household Income Brackets in Potlicker Flats
With 32 households falling in the category, the $75,000 to $99,999 income range is the most frequent in Potlicker Flats, accounting for 46.4% of all households.
| Income Bracket | # Households | % Households |
| Less than $10,000 | 0 | 0.0% |
| $10,000 to $14,999 | 0 | 0.0% |
| $15,000 to $24,999 | 0 | 0.0% |
| $25,000 to $34,999 | 0 | 0.0% |
| $35,000 to $49,999 | 5 | 7.2% |
| $50,000 to $74,999 | 14 | 20.3% |
| $75,000 to $99,999 | 32 | 46.4% |
| $100,000 to $149,999 | 9 | 13.0% |
| $150,000 to $199,999 | 0 | 0.0% |
| $200,000+ | 9 | 13.0% |
Household Income by Householder Age in Potlicker Flats
The median household income in Potlicker Flats is $93,711, with the highest median household income of $94,102 found in the 45 to 64 years age bracket for the primary householder. A total of 59 households (85.5%) fall into this category.
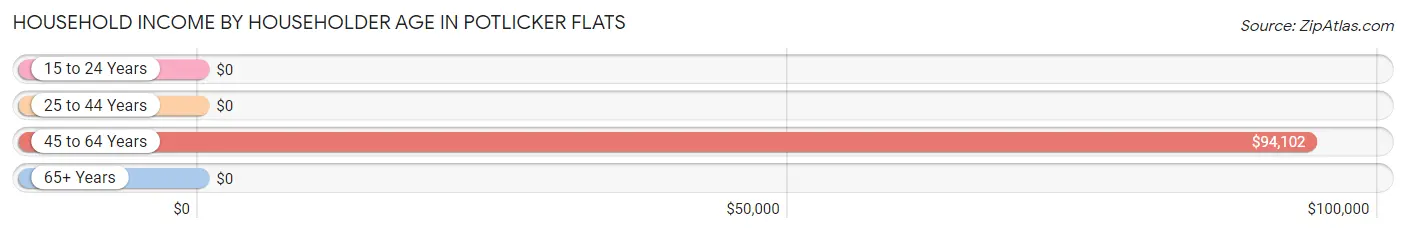
| Income Bracket | # Households | Median Income |
| 15 to 24 Years | 0 (0.0%) | $0 |
| 25 to 44 Years | 0 (0.0%) | $0 |
| 45 to 64 Years | 59 (85.5%) | $94,102 |
| 65+ Years | 10 (14.5%) | $0 |
| Total | 69 (100.0%) | $93,711 |
Poverty in Potlicker Flats
Income Below Poverty by Sex and Age in Potlicker Flats
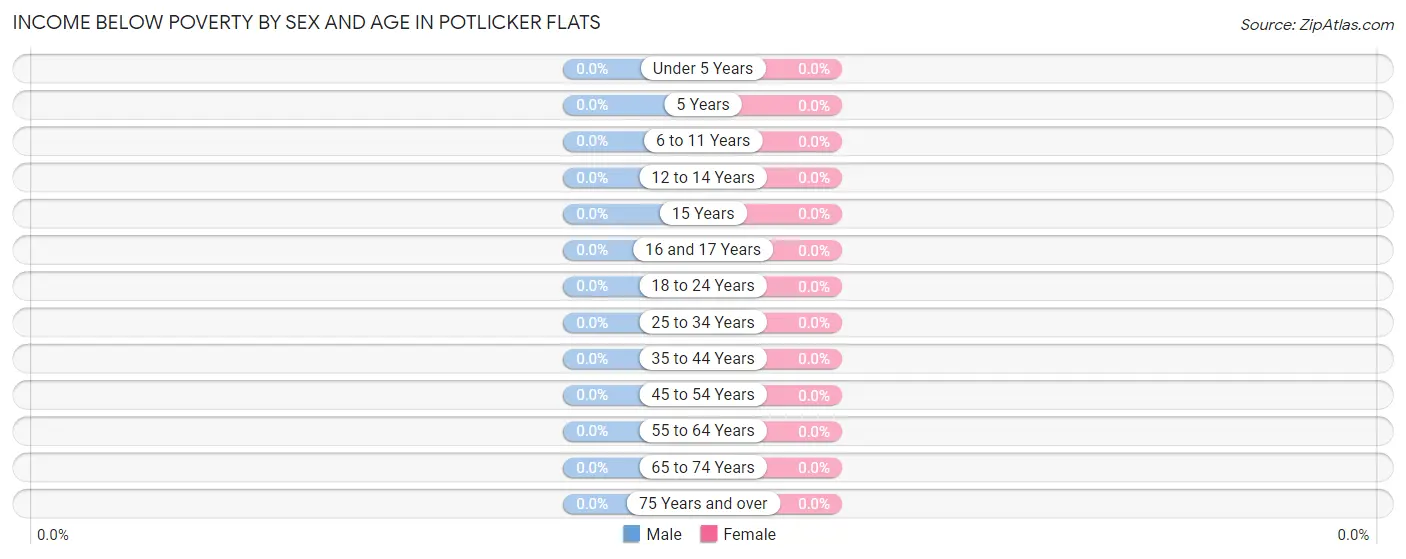
| Age Bracket | Male | Female |
| Under 5 Years | 0 (0.0%) | 0 (0.0%) |
| 5 Years | 0 (0.0%) | 0 (0.0%) |
| 6 to 11 Years | 0 (0.0%) | 0 (0.0%) |
| 12 to 14 Years | 0 (0.0%) | 0 (0.0%) |
| 15 Years | 0 (0.0%) | 0 (0.0%) |
| 16 and 17 Years | 0 (0.0%) | 0 (0.0%) |
| 18 to 24 Years | 0 (0.0%) | 0 (0.0%) |
| 25 to 34 Years | 0 (0.0%) | 0 (0.0%) |
| 35 to 44 Years | 0 (0.0%) | 0 (0.0%) |
| 45 to 54 Years | 0 (0.0%) | 0 (0.0%) |
| 55 to 64 Years | 0 (0.0%) | 0 (0.0%) |
| 65 to 74 Years | 0 (0.0%) | 0 (0.0%) |
| 75 Years and over | 0 (0.0%) | 0 (0.0%) |
| Total | 0 (0.0%) | 0 (0.0%) |
Income Above Poverty by Sex and Age in Potlicker Flats
According to the poverty statistics in Potlicker Flats, males aged 18 to 24 years and females aged 45 to 54 years are the age groups that are most secure financially, with 100.0% of males and 100.0% of females in these age groups living above the poverty line.
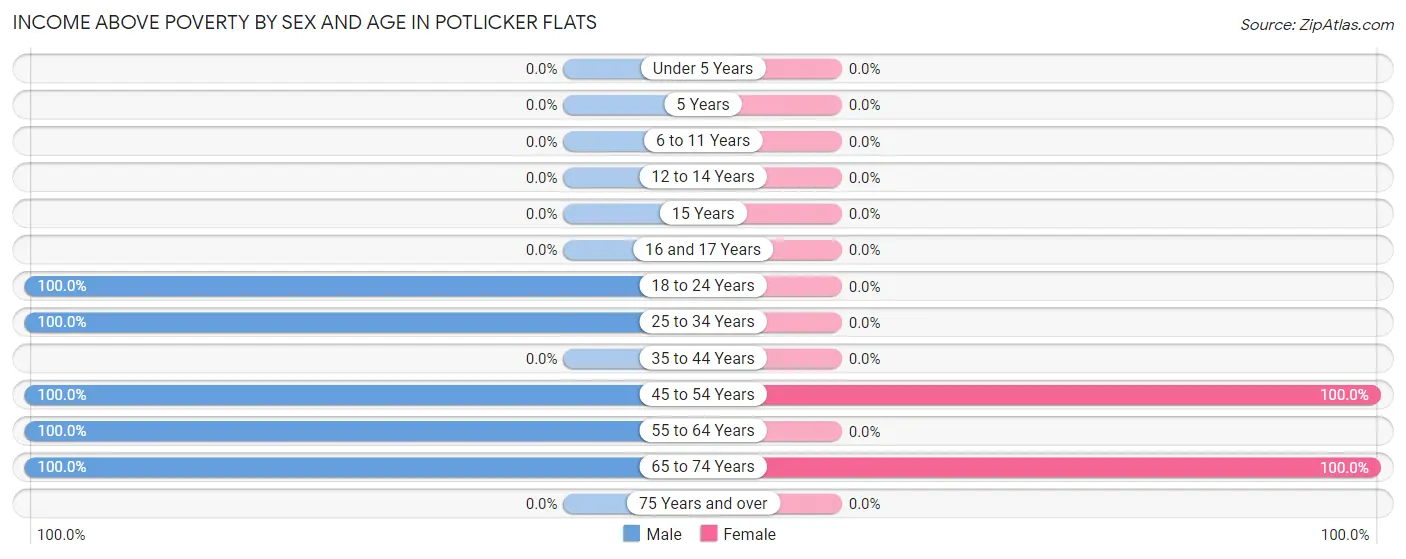
| Age Bracket | Male | Female |
| Under 5 Years | 0 (0.0%) | 0 (0.0%) |
| 5 Years | 0 (0.0%) | 0 (0.0%) |
| 6 to 11 Years | 0 (0.0%) | 0 (0.0%) |
| 12 to 14 Years | 0 (0.0%) | 0 (0.0%) |
| 15 Years | 0 (0.0%) | 0 (0.0%) |
| 16 and 17 Years | 0 (0.0%) | 0 (0.0%) |
| 18 to 24 Years | 13 (100.0%) | 0 (0.0%) |
| 25 to 34 Years | 37 (100.0%) | 0 (0.0%) |
| 35 to 44 Years | 0 (0.0%) | 0 (0.0%) |
| 45 to 54 Years | 18 (100.0%) | 11 (100.0%) |
| 55 to 64 Years | 41 (100.0%) | 0 (0.0%) |
| 65 to 74 Years | 10 (100.0%) | 11 (100.0%) |
| 75 Years and over | 0 (0.0%) | 0 (0.0%) |
| Total | 119 (100.0%) | 22 (100.0%) |
Income Below Poverty Among Married-Couple Families in Potlicker Flats
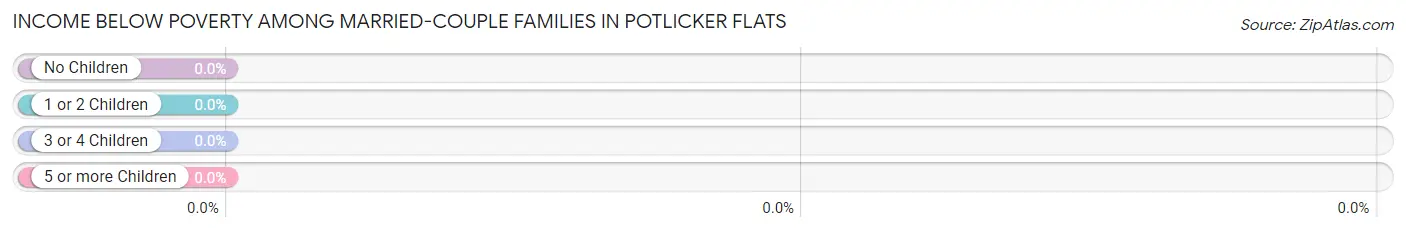
| Children | Above Poverty | Below Poverty |
| No Children | 19 (100.0%) | 0 (0.0%) |
| 1 or 2 Children | 0 (0.0%) | 0 (0.0%) |
| 3 or 4 Children | 0 (0.0%) | 0 (0.0%) |
| 5 or more Children | 0 (0.0%) | 0 (0.0%) |
| Total | 19 (100.0%) | 0 (0.0%) |
Income Below Poverty Among Single-Parent Households in Potlicker Flats
| Children | Single Father | Single Mother |
| No Children | 0 (0.0%) | 0 (0.0%) |
| 1 or 2 Children | 0 (0.0%) | 0 (0.0%) |
| 3 or 4 Children | 0 (0.0%) | 0 (0.0%) |
| 5 or more Children | 0 (0.0%) | 0 (0.0%) |
| Total | 0 (0.0%) | 0 (0.0%) |
Income Below Poverty Among Married-Couple vs Single-Parent Households in Potlicker Flats
| Children | Married-Couple Families | Single-Parent Households |
| No Children | 0 (0.0%) | 0 (0.0%) |
| 1 or 2 Children | 0 (0.0%) | 0 (0.0%) |
| 3 or 4 Children | 0 (0.0%) | 0 (0.0%) |
| 5 or more Children | 0 (0.0%) | 0 (0.0%) |
| Total | 0 (0.0%) | 0 (0.0%) |
Race in Potlicker Flats
The most populous races in Potlicker Flats are , and White / Caucasian (141 | 100.0%).
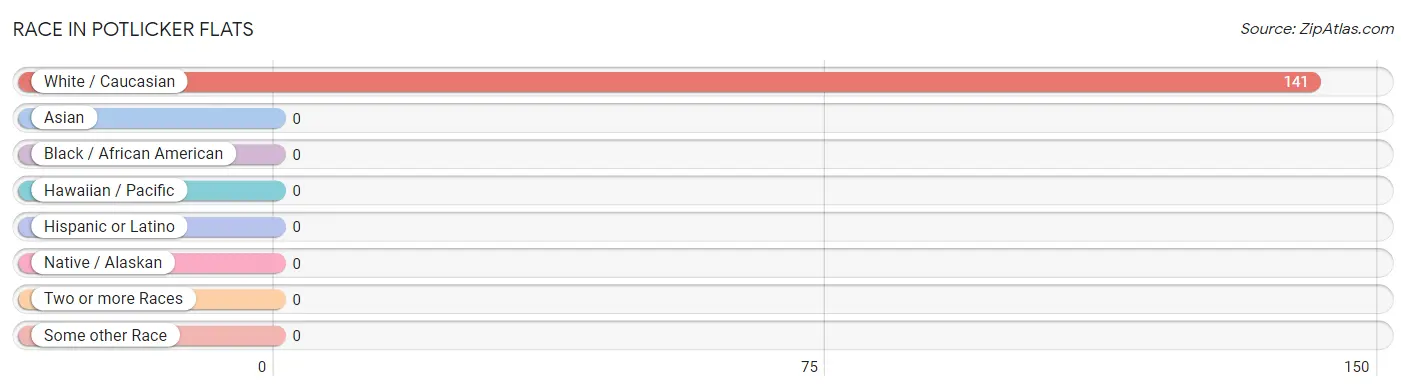
| Race | # Population | % Population |
| Asian | 0 | 0.0% |
| Black / African American | 0 | 0.0% |
| Hawaiian / Pacific | 0 | 0.0% |
| Hispanic or Latino | 0 | 0.0% |
| Native / Alaskan | 0 | 0.0% |
| White / Caucasian | 141 | 100.0% |
| Two or more Races | 0 | 0.0% |
| Some other Race | 0 | 0.0% |
| Total | 141 | 100.0% |
Ancestry in Potlicker Flats
The most populous ancestries reported in Potlicker Flats are German (38 | 27.0%), European (9 | 6.4%), Italian (9 | 6.4%), Scandinavian (9 | 6.4%), and Norwegian (7 | 5.0%), together accounting for 51.0% of all Potlicker Flats residents.
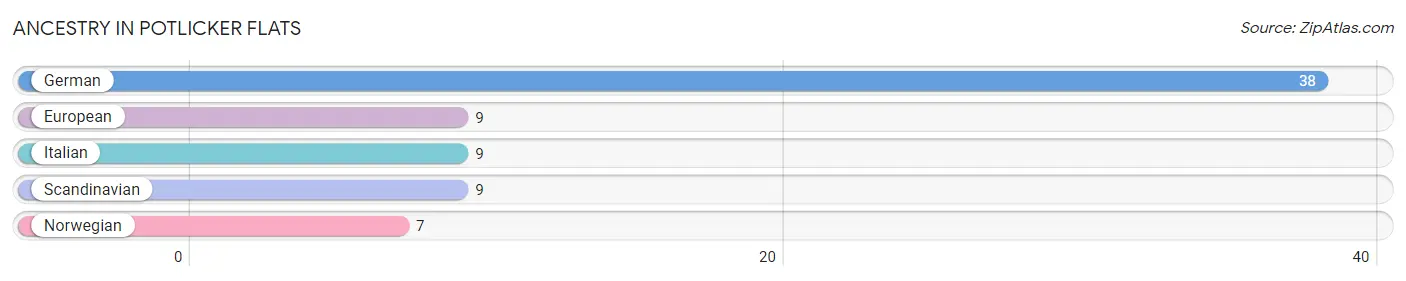
| Ancestry | # Population | % Population |
| European | 9 | 6.4% |
| German | 38 | 27.0% |
| Italian | 9 | 6.4% |
| Norwegian | 7 | 5.0% |
| Scandinavian | 9 | 6.4% | View All 5 Rows |
Immigrants in Potlicker Flats

| Immigration Origin | # Population | % Population | View All 0 Rows |
Sex and Age in Potlicker Flats
Sex and Age in Potlicker Flats
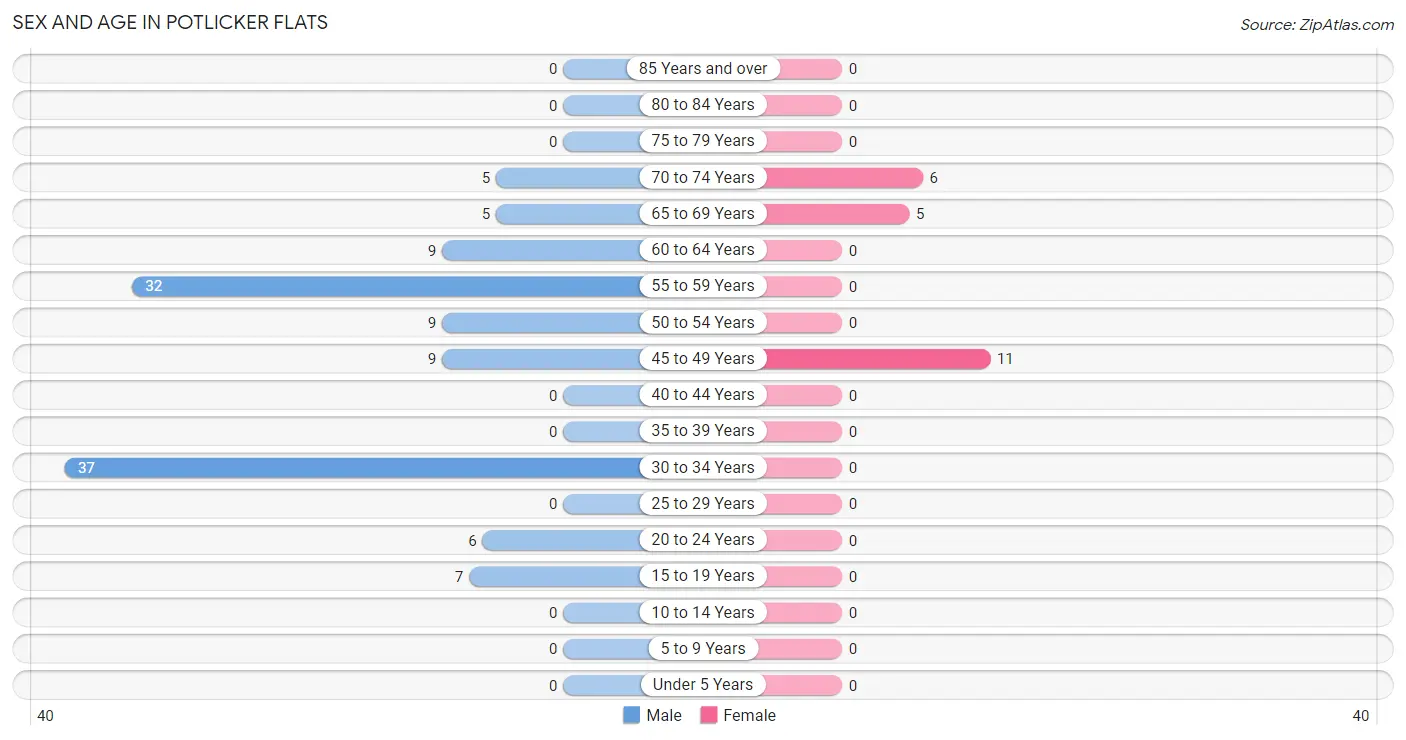
The most populous age groups in Potlicker Flats are 30 to 34 Years (37 | 31.1%) for men and 45 to 49 Years (11 | 50.0%) for women.
| Age Bracket | Male | Female |
| Under 5 Years | 0 (0.0%) | 0 (0.0%) |
| 5 to 9 Years | 0 (0.0%) | 0 (0.0%) |
| 10 to 14 Years | 0 (0.0%) | 0 (0.0%) |
| 15 to 19 Years | 7 (5.9%) | 0 (0.0%) |
| 20 to 24 Years | 6 (5.0%) | 0 (0.0%) |
| 25 to 29 Years | 0 (0.0%) | 0 (0.0%) |
| 30 to 34 Years | 37 (31.1%) | 0 (0.0%) |
| 35 to 39 Years | 0 (0.0%) | 0 (0.0%) |
| 40 to 44 Years | 0 (0.0%) | 0 (0.0%) |
| 45 to 49 Years | 9 (7.6%) | 11 (50.0%) |
| 50 to 54 Years | 9 (7.6%) | 0 (0.0%) |
| 55 to 59 Years | 32 (26.9%) | 0 (0.0%) |
| 60 to 64 Years | 9 (7.6%) | 0 (0.0%) |
| 65 to 69 Years | 5 (4.2%) | 5 (22.7%) |
| 70 to 74 Years | 5 (4.2%) | 6 (27.3%) |
| 75 to 79 Years | 0 (0.0%) | 0 (0.0%) |
| 80 to 84 Years | 0 (0.0%) | 0 (0.0%) |
| 85 Years and over | 0 (0.0%) | 0 (0.0%) |
| Total | 119 (100.0%) | 22 (100.0%) |
Families and Households in Potlicker Flats
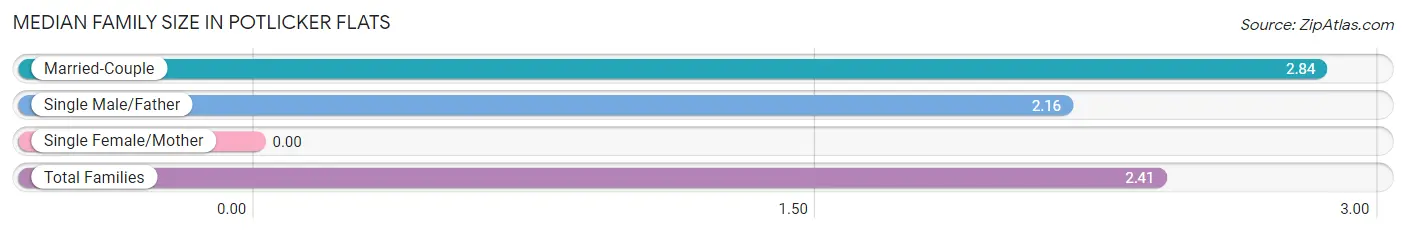
Median Family Size in Potlicker Flats
| Family Type | # Families | Family Size |
| Married-Couple | 19 (37.2%) | 2.84 |
| Single Male/Father | 32 (62.7%) | 2.16 |
| Single Female/Mother | 0 (0.0%) | - |
| Total Families | 51 (100.0%) | 2.41 |
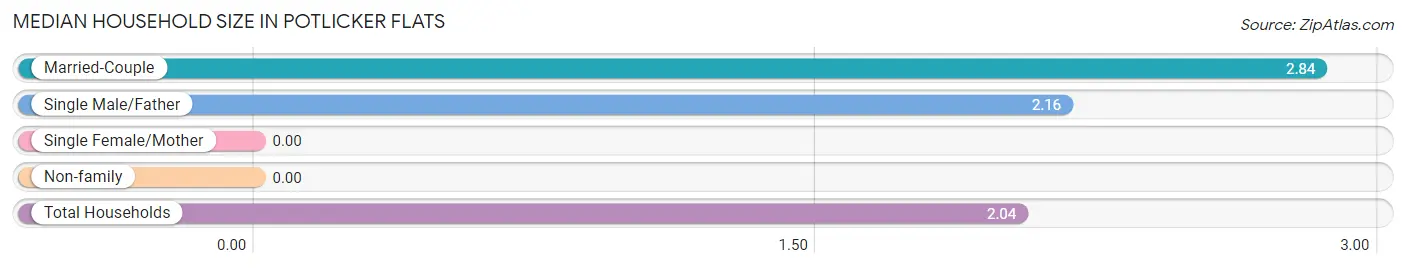
Median Household Size in Potlicker Flats
| Household Type | # Households | Household Size |
| Married-Couple | 19 (27.5%) | 2.84 |
| Single Male/Father | 32 (46.4%) | 2.16 |
| Single Female/Mother | 0 (0.0%) | - |
| Non-family | 18 (26.1%) | - |
| Total Households | 69 (100.0%) | 2.04 |
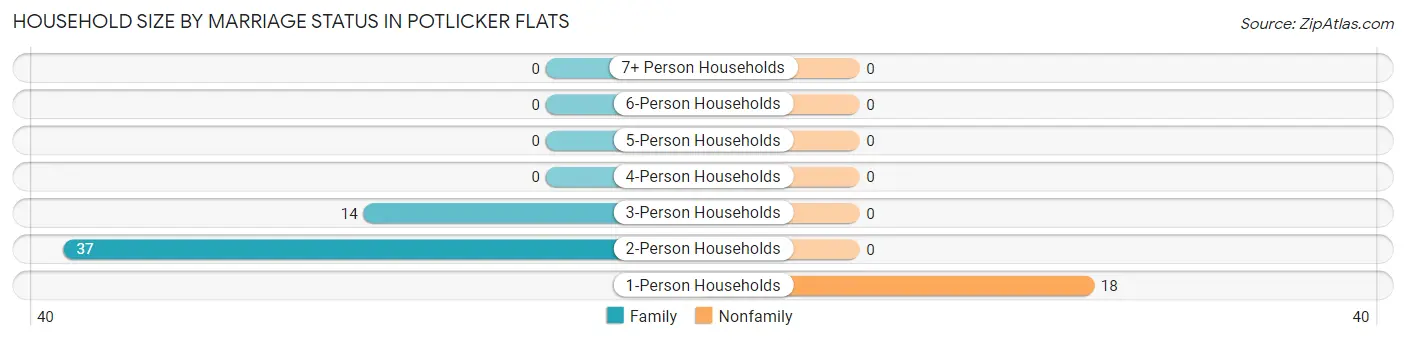
Household Size by Marriage Status in Potlicker Flats
Out of a total of 69 households in Potlicker Flats, 51 (73.9%) are family households, while 18 (26.1%) are nonfamily households. The most numerous type of family households are 2-person households, comprising 37, and the most common type of nonfamily households are 1-person households, comprising 18.
| Household Size | Family Households | Nonfamily Households |
| 1-Person Households | - | 18 (26.1%) |
| 2-Person Households | 37 (53.6%) | 0 (0.0%) |
| 3-Person Households | 14 (20.3%) | 0 (0.0%) |
| 4-Person Households | 0 (0.0%) | 0 (0.0%) |
| 5-Person Households | 0 (0.0%) | 0 (0.0%) |
| 6-Person Households | 0 (0.0%) | 0 (0.0%) |
| 7+ Person Households | 0 (0.0%) | 0 (0.0%) |
| Total | 51 (73.9%) | 18 (26.1%) |
Female Fertility in Potlicker Flats
Fertility by Age in Potlicker Flats
| Age Bracket | Women with Births | Births / 1,000 Women |
| 15 to 19 years | 0 (0.0%) | 0.0 |
| 20 to 34 years | 0 (0.0%) | 0.0 |
| 35 to 50 years | 0 (0.0%) | 0.0 |
| Total | 0 (0.0%) | 0.0 |
Fertility by Age by Marriage Status in Potlicker Flats
| Age Bracket | Married | Unmarried |
| 15 to 19 years | 0 (0.0%) | 0 (0.0%) |
| 20 to 34 years | 0 (0.0%) | 0 (0.0%) |
| 35 to 50 years | 0 (0.0%) | 0 (0.0%) |
| Total | 0 (0.0%) | 0 (0.0%) |
Fertility by Education in Potlicker Flats
| Educational Attainment | Women with Births | Births / 1,000 Women |
| Less than High School | 0 (0.0%) | 0.0 |
| High School Diploma | 0 (0.0%) | 0.0 |
| College or Associate's Degree | 0 (0.0%) | 0.0 |
| Bachelor's Degree | 0 (0.0%) | 0.0 |
| Graduate Degree | 0 (0.0%) | 0.0 |
| Total | 0 (0.0%) | 0.0 |
Fertility by Education by Marriage Status in Potlicker Flats
| Educational Attainment | Married | Unmarried |
| Less than High School | 0 (0.0%) | 0 (0.0%) |
| High School Diploma | 0 (0.0%) | 0 (0.0%) |
| College or Associate's Degree | 0 (0.0%) | 0 (0.0%) |
| Bachelor's Degree | 0 (0.0%) | 0 (0.0%) |
| Graduate Degree | 0 (0.0%) | 0 (0.0%) |
| Total | 0 (0.0%) | 0 (0.0%) |
Employment Characteristics in Potlicker Flats
Employment by Class of Employer in Potlicker Flats
Among the 107 employed individuals in Potlicker Flats, private company employees (61 | 57.0%), state government employees (37 | 34.6%), and not-for-profit organizations (9 | 8.4%) make up the most common classes of employment.
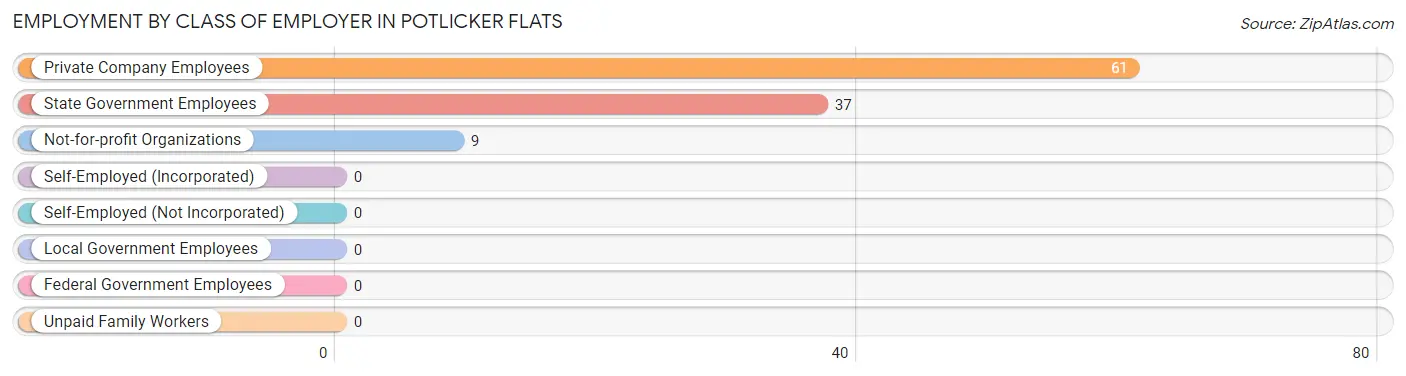
| Employer Class | # Employees | % Employees |
| Private Company Employees | 61 | 57.0% |
| Self-Employed (Incorporated) | 0 | 0.0% |
| Self-Employed (Not Incorporated) | 0 | 0.0% |
| Not-for-profit Organizations | 9 | 8.4% |
| Local Government Employees | 0 | 0.0% |
| State Government Employees | 37 | 34.6% |
| Federal Government Employees | 0 | 0.0% |
| Unpaid Family Workers | 0 | 0.0% |
| Total | 107 | 100.0% |
Employment Status by Age in Potlicker Flats
According to the labor force statistics for Potlicker Flats, out of the total population over 16 years of age (141), 79.4% or 112 individuals are in the labor force, with 4.5% or 5 of them unemployed. The age group with the highest labor force participation rate is 30 to 34 years, with 100.0% or 37 individuals in the labor force. Within the labor force, the 65 to 74 years age range has the highest percentage of unemployed individuals, with 100.0% or 5 of them being unemployed.
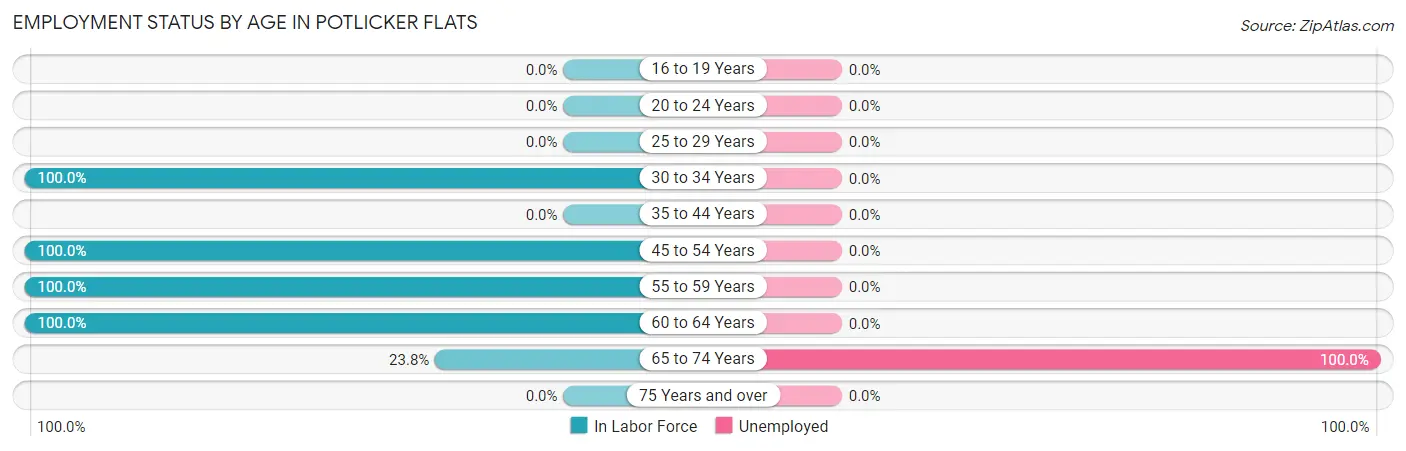
| Age Bracket | In Labor Force | Unemployed |
| 16 to 19 Years | 0 (0.0%) | 0 (0.0%) |
| 20 to 24 Years | 0 (0.0%) | 0 (0.0%) |
| 25 to 29 Years | 0 (0.0%) | 0 (0.0%) |
| 30 to 34 Years | 37 (100.0%) | 0 (0.0%) |
| 35 to 44 Years | 0 (0.0%) | 0 (0.0%) |
| 45 to 54 Years | 29 (100.0%) | 0 (0.0%) |
| 55 to 59 Years | 32 (100.0%) | 0 (0.0%) |
| 60 to 64 Years | 9 (100.0%) | 0 (0.0%) |
| 65 to 74 Years | 5 (23.8%) | 5 (100.0%) |
| 75 Years and over | 0 (0.0%) | 0 (0.0%) |
| Total | 112 (79.4%) | 5 (4.5%) |
Employment Status by Educational Attainment in Potlicker Flats
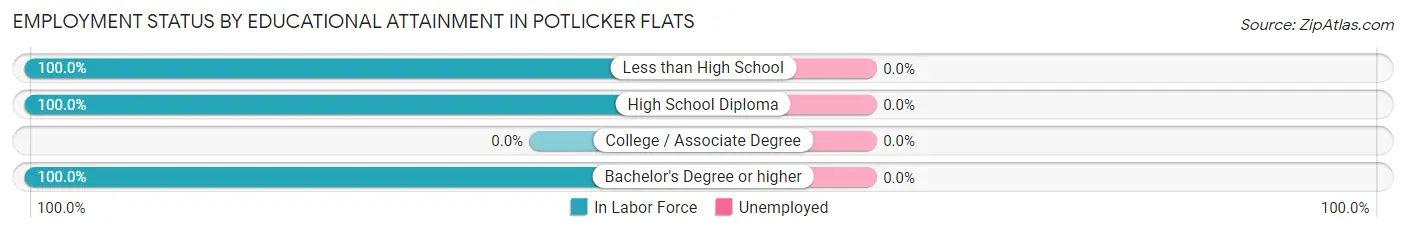
| Educational Attainment | In Labor Force | Unemployed |
| Less than High School | 9 (100.0%) | 0 (0.0%) |
| High School Diploma | 89 (100.0%) | 0 (0.0%) |
| College / Associate Degree | 0 (0.0%) | 0 (0.0%) |
| Bachelor's Degree or higher | 9 (100.0%) | 0 (0.0%) |
| Total | 107 (100.0%) | 0 (0.0%) |
Employment Occupations by Sex in Potlicker Flats
Management, Business, Science and Arts Occupations
The most common Management, Business, Science and Arts occupations in Potlicker Flats are Computers, Engineering & Science (9 | 8.4%), and Computers & Mathematics (9 | 8.4%).
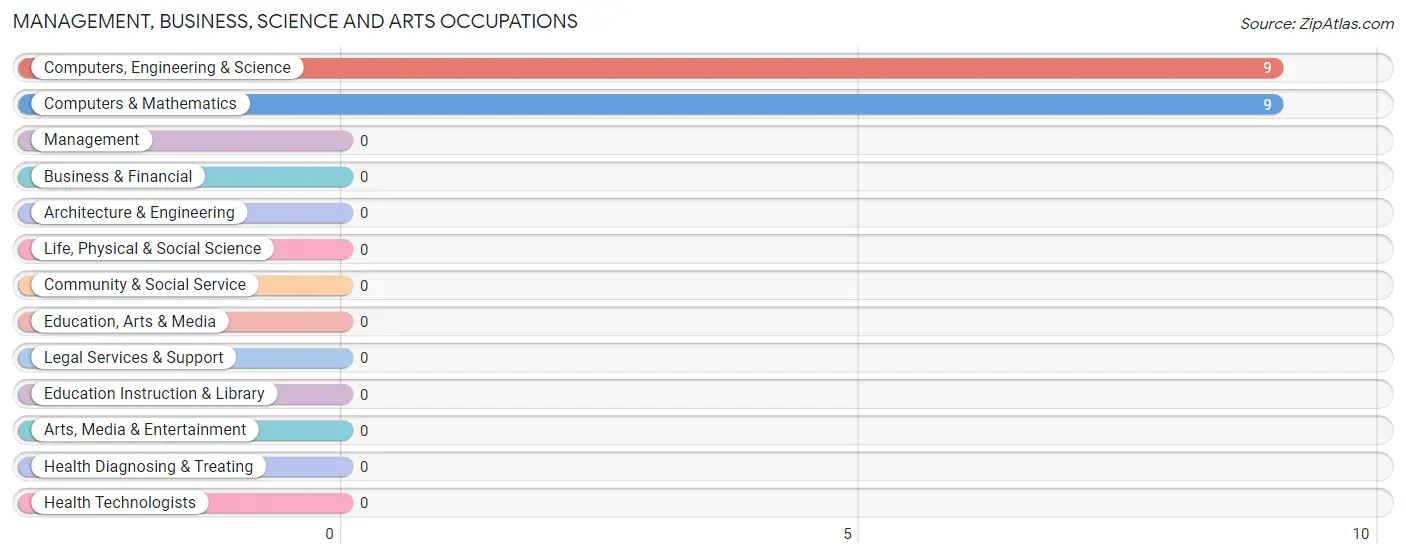
Management, Business, Science and Arts Occupations by Sex
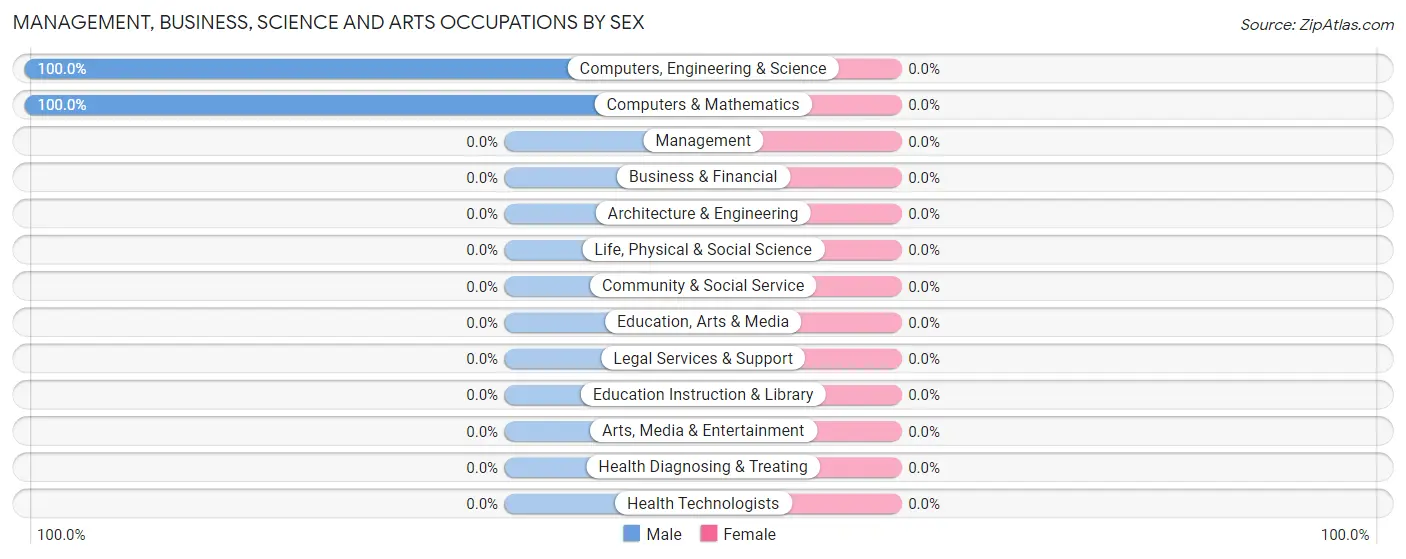
| Occupation | Male | Female |
| Management | 0 (0.0%) | 0 (0.0%) |
| Business & Financial | 0 (0.0%) | 0 (0.0%) |
| Computers, Engineering & Science | 9 (100.0%) | 0 (0.0%) |
| Computers & Mathematics | 9 (100.0%) | 0 (0.0%) |
| Architecture & Engineering | 0 (0.0%) | 0 (0.0%) |
| Life, Physical & Social Science | 0 (0.0%) | 0 (0.0%) |
| Community & Social Service | 0 (0.0%) | 0 (0.0%) |
| Education, Arts & Media | 0 (0.0%) | 0 (0.0%) |
| Legal Services & Support | 0 (0.0%) | 0 (0.0%) |
| Education Instruction & Library | 0 (0.0%) | 0 (0.0%) |
| Arts, Media & Entertainment | 0 (0.0%) | 0 (0.0%) |
| Health Diagnosing & Treating | 0 (0.0%) | 0 (0.0%) |
| Health Technologists | 0 (0.0%) | 0 (0.0%) |
| Total (Category) | 9 (100.0%) | 0 (0.0%) |
| Total (Overall) | 96 (89.7%) | 11 (10.3%) |
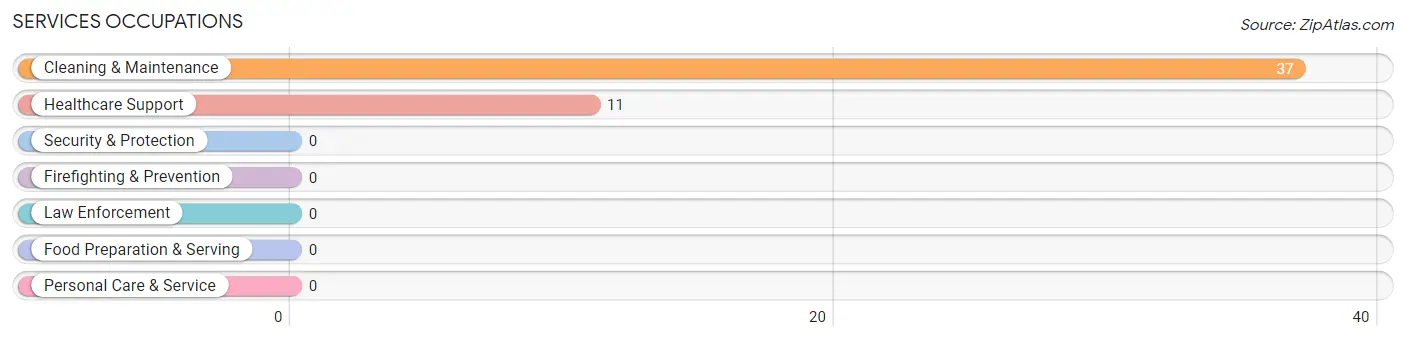
Services Occupations
The most common Services occupations in Potlicker Flats are Cleaning & Maintenance (37 | 34.6%), and Healthcare Support (11 | 10.3%).
Services Occupations by Sex
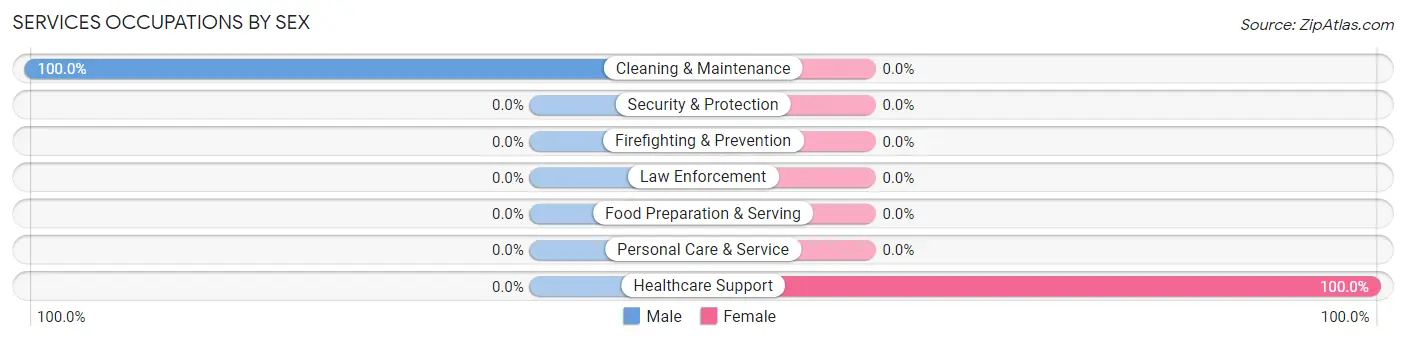
| Occupation | Male | Female |
| Healthcare Support | 0 (0.0%) | 11 (100.0%) |
| Security & Protection | 0 (0.0%) | 0 (0.0%) |
| Firefighting & Prevention | 0 (0.0%) | 0 (0.0%) |
| Law Enforcement | 0 (0.0%) | 0 (0.0%) |
| Food Preparation & Serving | 0 (0.0%) | 0 (0.0%) |
| Cleaning & Maintenance | 37 (100.0%) | 0 (0.0%) |
| Personal Care & Service | 0 (0.0%) | 0 (0.0%) |
| Total (Category) | 37 (77.1%) | 11 (22.9%) |
| Total (Overall) | 96 (89.7%) | 11 (10.3%) |
Sales and Office Occupations
Sales and Office Occupations by Sex
| Occupation | Male | Female |
| Sales & Related | 0 (0.0%) | 0 (0.0%) |
| Office & Administration | 0 (0.0%) | 0 (0.0%) |
| Total (Category) | 0 (0.0%) | 0 (0.0%) |
| Total (Overall) | 96 (89.7%) | 11 (10.3%) |
Natural Resources, Construction and Maintenance Occupations
Natural Resources, Construction and Maintenance Occupations by Sex
| Occupation | Male | Female |
| Farming, Fishing & Forestry | 0 (0.0%) | 0 (0.0%) |
| Construction & Extraction | 0 (0.0%) | 0 (0.0%) |
| Installation, Maintenance & Repair | 0 (0.0%) | 0 (0.0%) |
| Total (Category) | 0 (0.0%) | 0 (0.0%) |
| Total (Overall) | 96 (89.7%) | 11 (10.3%) |
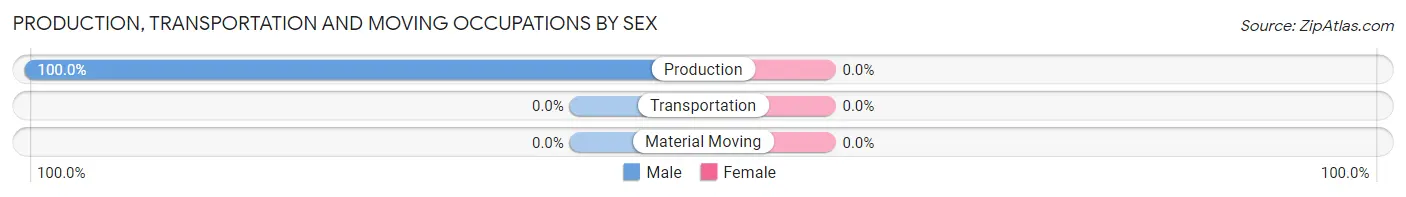
Production, Transportation and Moving Occupations
The most common Production, Transportation and Moving occupations in Potlicker Flats are , and Production (50 | 46.7%).
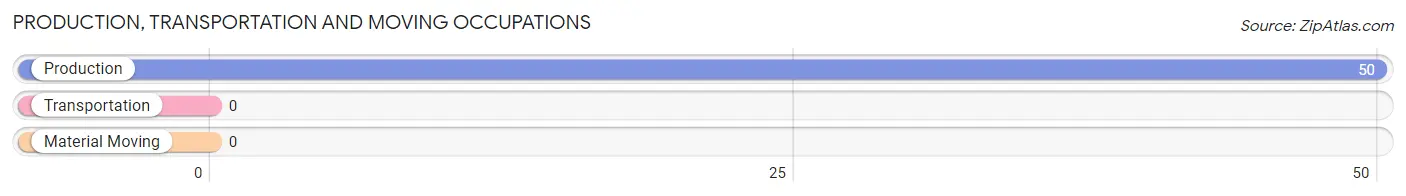
Production, Transportation and Moving Occupations by Sex
| Occupation | Male | Female |
| Production | 50 (100.0%) | 0 (0.0%) |
| Transportation | 0 (0.0%) | 0 (0.0%) |
| Material Moving | 0 (0.0%) | 0 (0.0%) |
| Total (Category) | 50 (100.0%) | 0 (0.0%) |
| Total (Overall) | 96 (89.7%) | 11 (10.3%) |
Employment Industries by Sex in Potlicker Flats
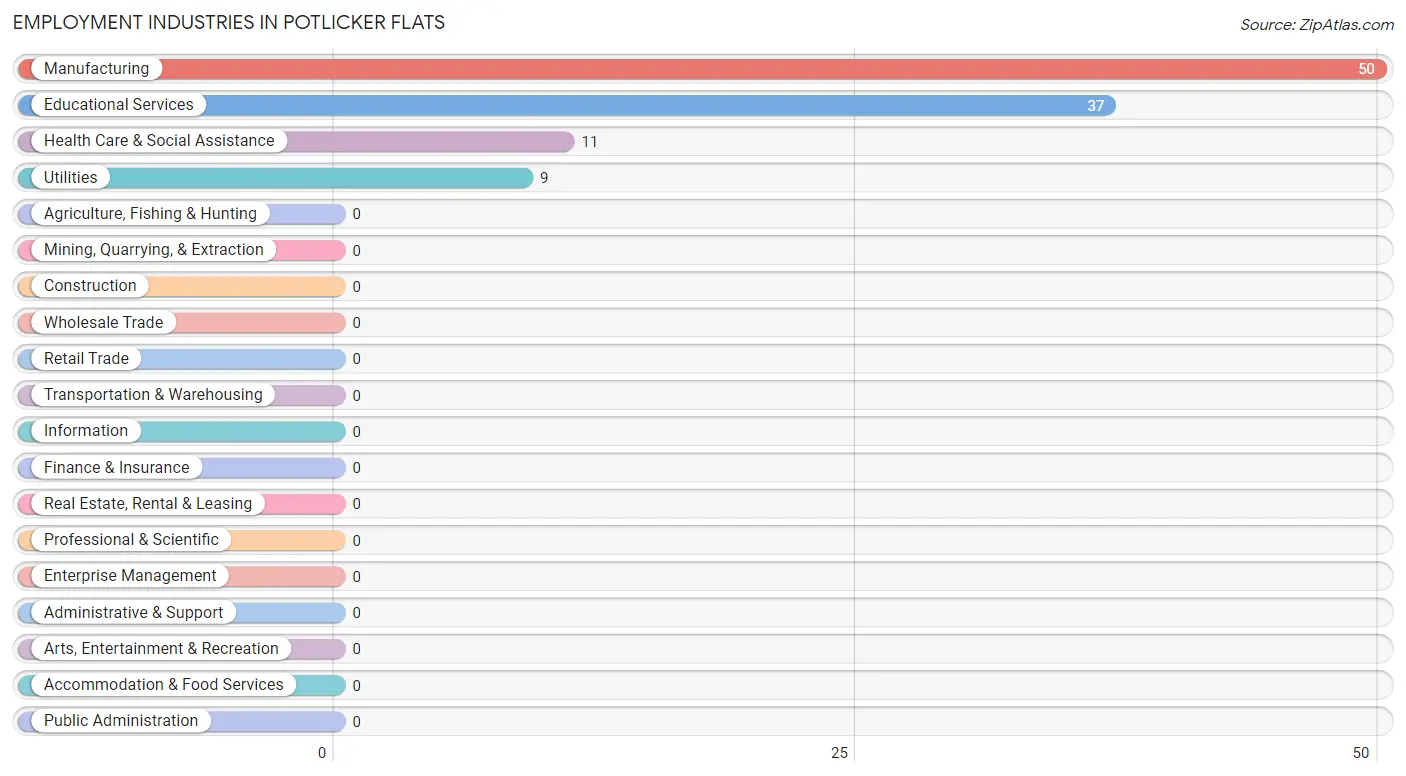
Employment Industries in Potlicker Flats
The major employment industries in Potlicker Flats include Manufacturing (50 | 46.7%), Educational Services (37 | 34.6%), Health Care & Social Assistance (11 | 10.3%), and Utilities (9 | 8.4%).
Employment Industries by Sex in Potlicker Flats
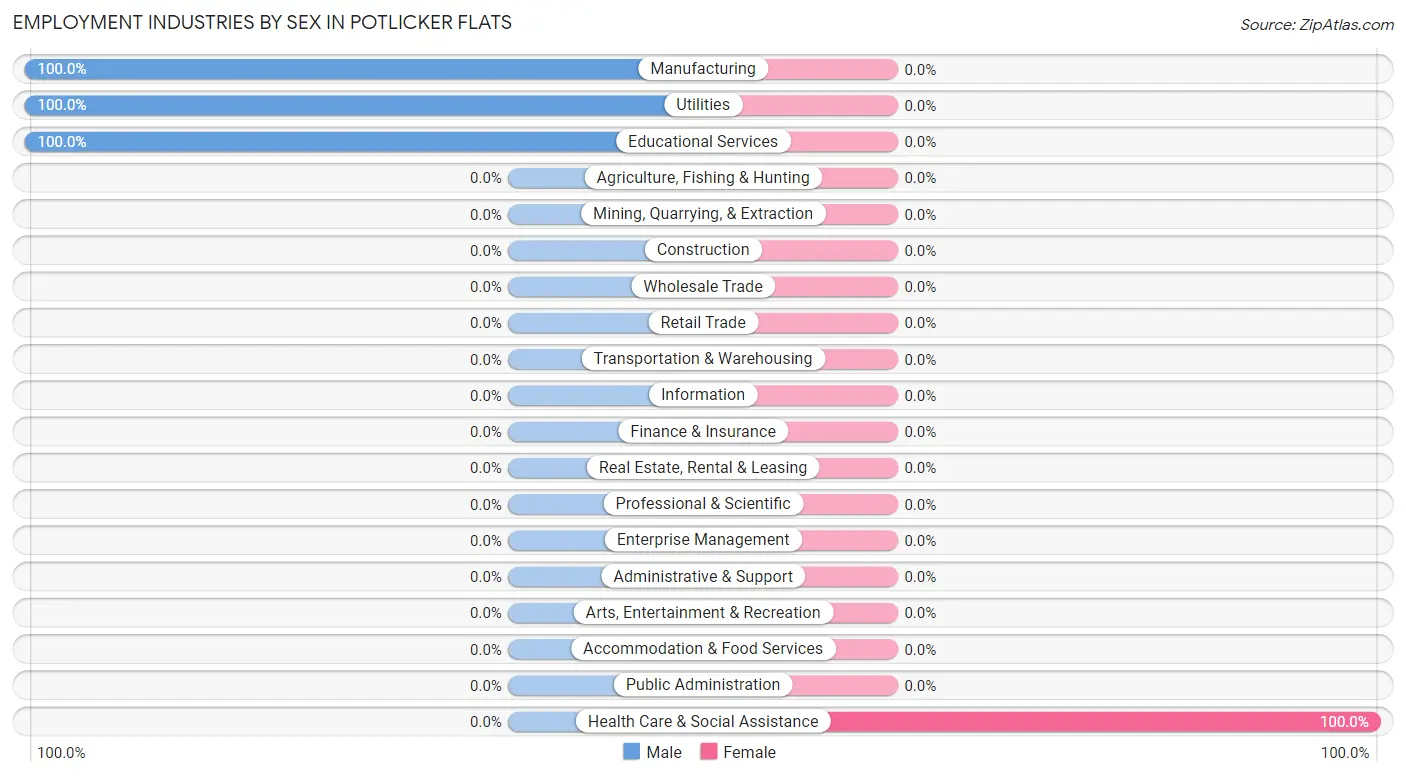
| Industry | Male | Female |
| Agriculture, Fishing & Hunting | 0 (0.0%) | 0 (0.0%) |
| Mining, Quarrying, & Extraction | 0 (0.0%) | 0 (0.0%) |
| Construction | 0 (0.0%) | 0 (0.0%) |
| Manufacturing | 50 (100.0%) | 0 (0.0%) |
| Wholesale Trade | 0 (0.0%) | 0 (0.0%) |
| Retail Trade | 0 (0.0%) | 0 (0.0%) |
| Transportation & Warehousing | 0 (0.0%) | 0 (0.0%) |
| Utilities | 9 (100.0%) | 0 (0.0%) |
| Information | 0 (0.0%) | 0 (0.0%) |
| Finance & Insurance | 0 (0.0%) | 0 (0.0%) |
| Real Estate, Rental & Leasing | 0 (0.0%) | 0 (0.0%) |
| Professional & Scientific | 0 (0.0%) | 0 (0.0%) |
| Enterprise Management | 0 (0.0%) | 0 (0.0%) |
| Administrative & Support | 0 (0.0%) | 0 (0.0%) |
| Educational Services | 37 (100.0%) | 0 (0.0%) |
| Health Care & Social Assistance | 0 (0.0%) | 11 (100.0%) |
| Arts, Entertainment & Recreation | 0 (0.0%) | 0 (0.0%) |
| Accommodation & Food Services | 0 (0.0%) | 0 (0.0%) |
| Public Administration | 0 (0.0%) | 0 (0.0%) |
| Total | 96 (89.7%) | 11 (10.3%) |
Education in Potlicker Flats
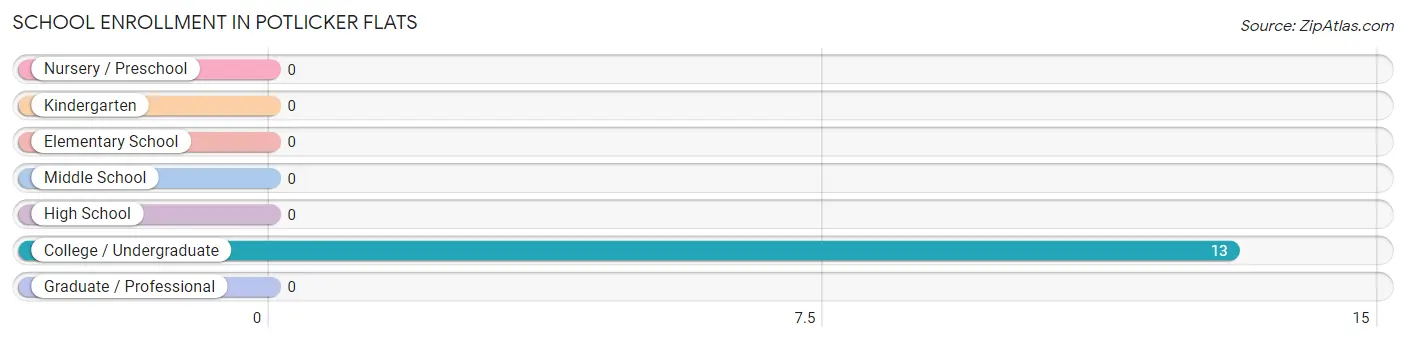
School Enrollment in Potlicker Flats
| School Level | # Students | % Students |
| Nursery / Preschool | 0 | 0.0% |
| Kindergarten | 0 | 0.0% |
| Elementary School | 0 | 0.0% |
| Middle School | 0 | 0.0% |
| High School | 0 | 0.0% |
| College / Undergraduate | 13 | 100.0% |
| Graduate / Professional | 0 | 0.0% |
| Total | 13 | 100.0% |
School Enrollment by Age by Funding Source in Potlicker Flats
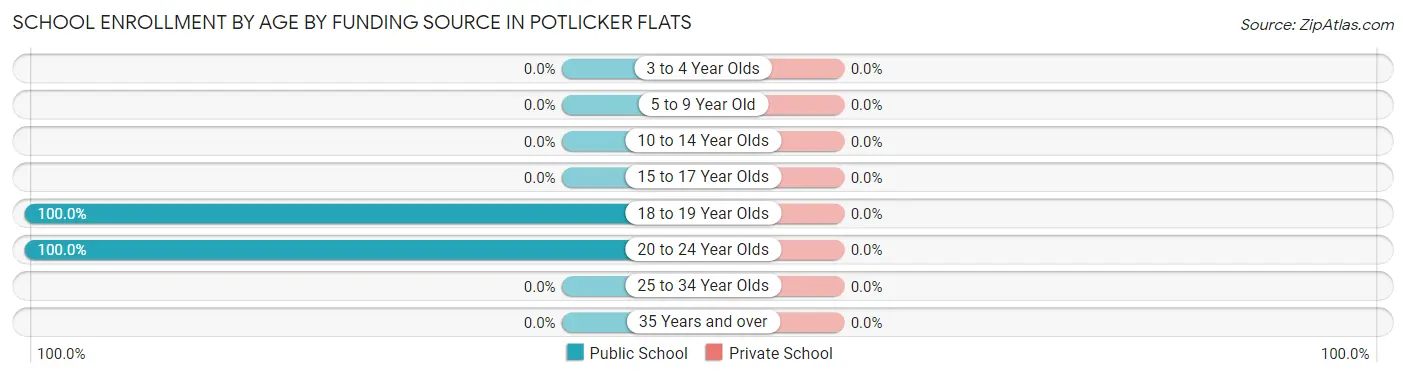
| Age Bracket | Public School | Private School |
| 3 to 4 Year Olds | 0 (0.0%) | 0 (0.0%) |
| 5 to 9 Year Old | 0 (0.0%) | 0 (0.0%) |
| 10 to 14 Year Olds | 0 (0.0%) | 0 (0.0%) |
| 15 to 17 Year Olds | 0 (0.0%) | 0 (0.0%) |
| 18 to 19 Year Olds | 7 (100.0%) | 0 (0.0%) |
| 20 to 24 Year Olds | 6 (100.0%) | 0 (0.0%) |
| 25 to 34 Year Olds | 0 (0.0%) | 0 (0.0%) |
| 35 Years and over | 0 (0.0%) | 0 (0.0%) |
| Total | 13 (100.0%) | 0 (0.0%) |
Educational Attainment by Field of Study in Potlicker Flats
, and business (9 | 100.0%) are the most common fields of study among 9 individuals in Potlicker Flats who have obtained a bachelor's degree or higher.
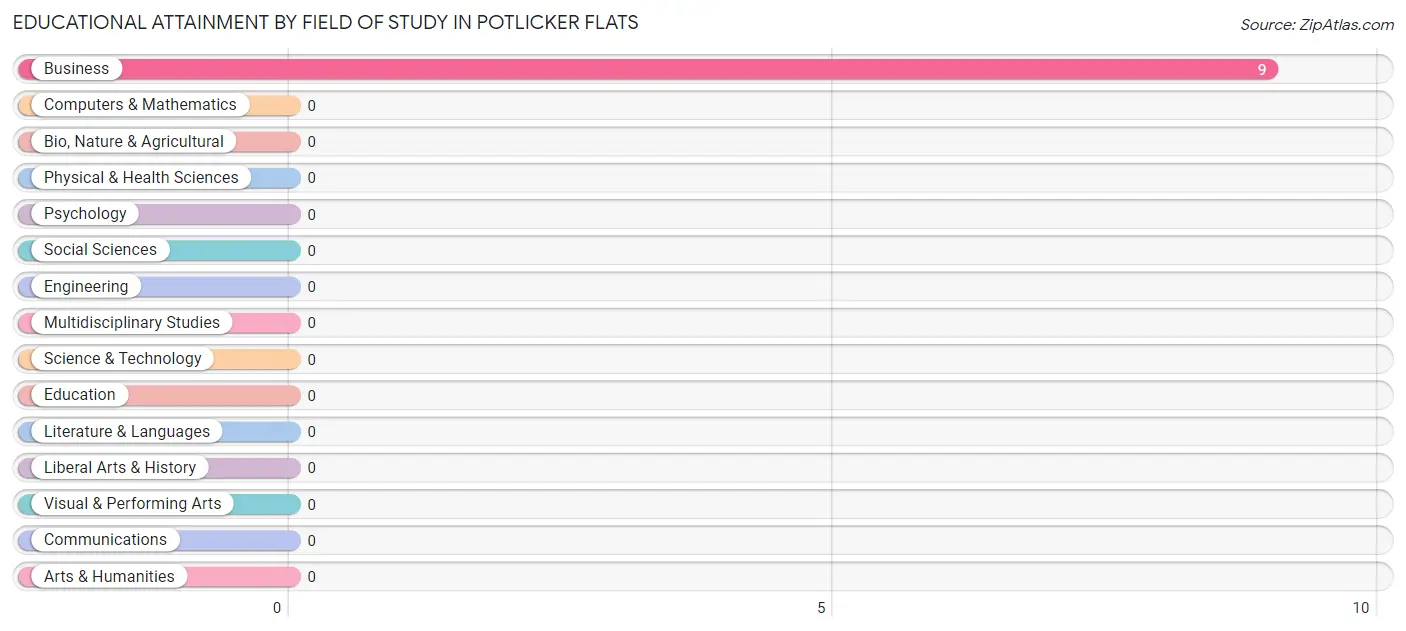
| Field of Study | # Graduates | % Graduates |
| Computers & Mathematics | 0 | 0.0% |
| Bio, Nature & Agricultural | 0 | 0.0% |
| Physical & Health Sciences | 0 | 0.0% |
| Psychology | 0 | 0.0% |
| Social Sciences | 0 | 0.0% |
| Engineering | 0 | 0.0% |
| Multidisciplinary Studies | 0 | 0.0% |
| Science & Technology | 0 | 0.0% |
| Business | 9 | 100.0% |
| Education | 0 | 0.0% |
| Literature & Languages | 0 | 0.0% |
| Liberal Arts & History | 0 | 0.0% |
| Visual & Performing Arts | 0 | 0.0% |
| Communications | 0 | 0.0% |
| Arts & Humanities | 0 | 0.0% |
| Total | 9 | 100.0% |
Transportation & Commute in Potlicker Flats
Vehicle Availability by Sex in Potlicker Flats
The most prevalent vehicle ownership categories in Potlicker Flats are males with 4 vehicles (69, accounting for 71.9%) and females with 4 vehicles (0, making up 627.3%).
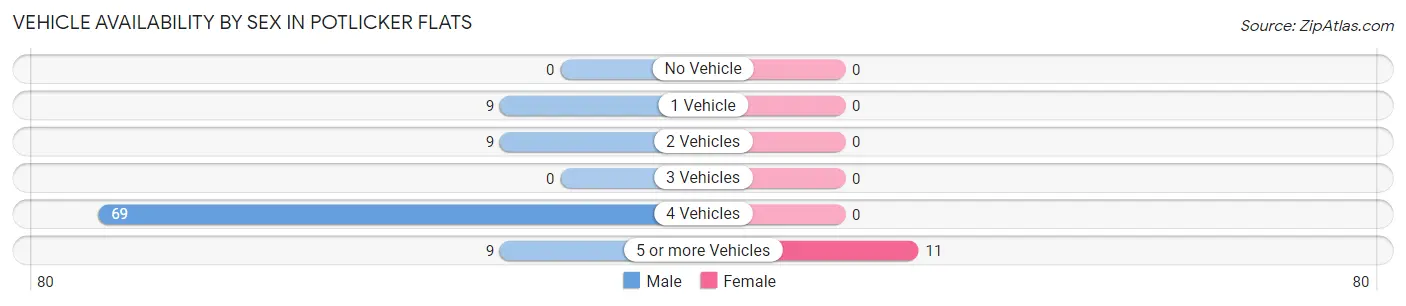
| Vehicles Available | Male | Female |
| No Vehicle | 0 (0.0%) | 0 (0.0%) |
| 1 Vehicle | 9 (9.4%) | 0 (0.0%) |
| 2 Vehicles | 9 (9.4%) | 0 (0.0%) |
| 3 Vehicles | 0 (0.0%) | 0 (0.0%) |
| 4 Vehicles | 69 (71.9%) | 0 (0.0%) |
| 5 or more Vehicles | 9 (9.4%) | 11 (100.0%) |
| Total | 96 (100.0%) | 11 (100.0%) |
Commute Time in Potlicker Flats
The most frequently occuring commute durations in Potlicker Flats are 30 to 34 minutes (37 commuters, 34.6%), 20 to 24 minutes (32 commuters, 29.9%), and 15 to 19 minutes (20 commuters, 18.7%).
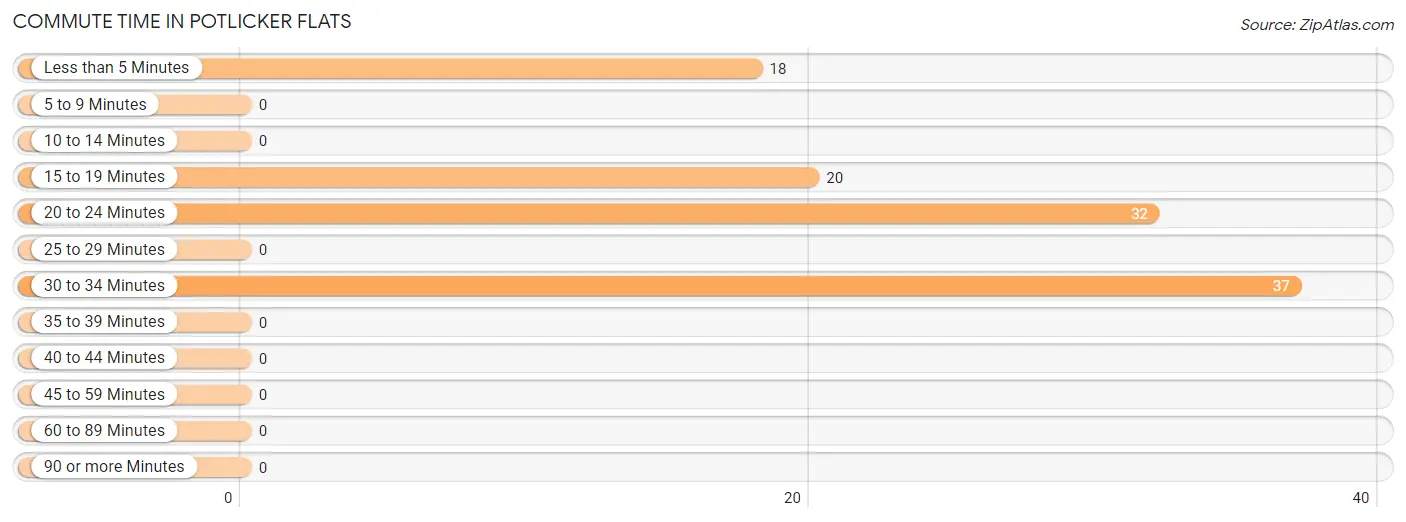
| Commute Time | # Commuters | % Commuters |
| Less than 5 Minutes | 18 | 16.8% |
| 5 to 9 Minutes | 0 | 0.0% |
| 10 to 14 Minutes | 0 | 0.0% |
| 15 to 19 Minutes | 20 | 18.7% |
| 20 to 24 Minutes | 32 | 29.9% |
| 25 to 29 Minutes | 0 | 0.0% |
| 30 to 34 Minutes | 37 | 34.6% |
| 35 to 39 Minutes | 0 | 0.0% |
| 40 to 44 Minutes | 0 | 0.0% |
| 45 to 59 Minutes | 0 | 0.0% |
| 60 to 89 Minutes | 0 | 0.0% |
| 90 or more Minutes | 0 | 0.0% |
Commute Time by Sex in Potlicker Flats
The most common commute times in Potlicker Flats are 30 to 34 minutes (37 commuters, 38.5%) for males and 15 to 19 minutes (11 commuters, 100.0%) for females.
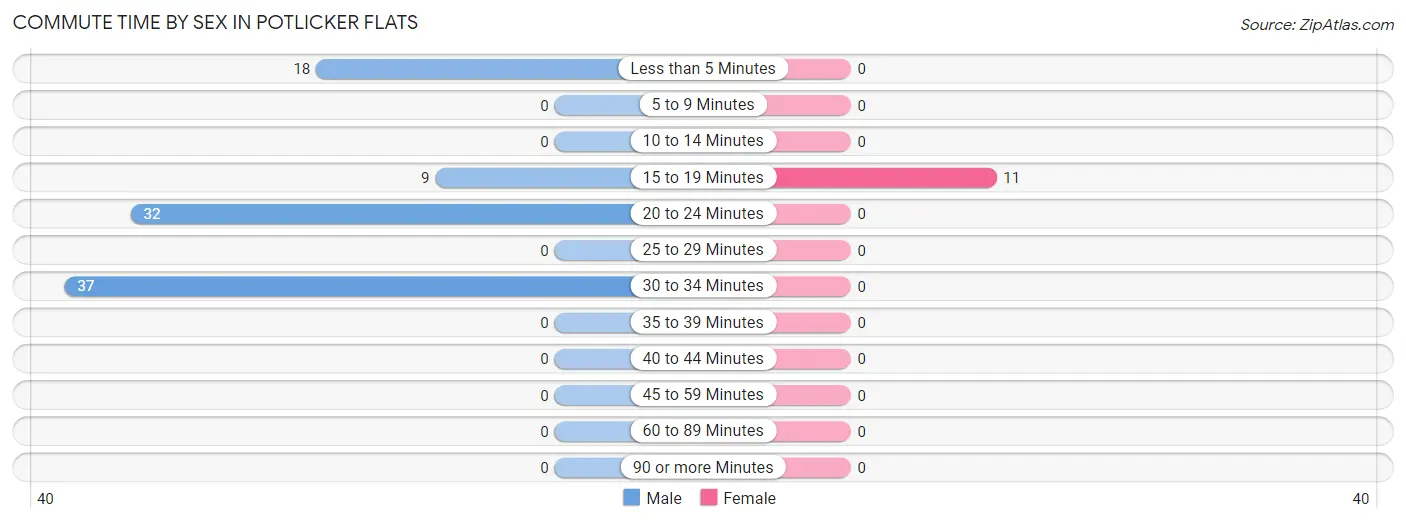
| Commute Time | Male | Female |
| Less than 5 Minutes | 18 (18.8%) | 0 (0.0%) |
| 5 to 9 Minutes | 0 (0.0%) | 0 (0.0%) |
| 10 to 14 Minutes | 0 (0.0%) | 0 (0.0%) |
| 15 to 19 Minutes | 9 (9.4%) | 11 (100.0%) |
| 20 to 24 Minutes | 32 (33.3%) | 0 (0.0%) |
| 25 to 29 Minutes | 0 (0.0%) | 0 (0.0%) |
| 30 to 34 Minutes | 37 (38.5%) | 0 (0.0%) |
| 35 to 39 Minutes | 0 (0.0%) | 0 (0.0%) |
| 40 to 44 Minutes | 0 (0.0%) | 0 (0.0%) |
| 45 to 59 Minutes | 0 (0.0%) | 0 (0.0%) |
| 60 to 89 Minutes | 0 (0.0%) | 0 (0.0%) |
| 90 or more Minutes | 0 (0.0%) | 0 (0.0%) |
Time of Departure to Work by Sex in Potlicker Flats
The most frequent times of departure to work in Potlicker Flats are 12:00 AM to 4:59 AM (37, 38.5%) for males and 4:00 PM to 11:59 PM (11, 100.0%) for females.
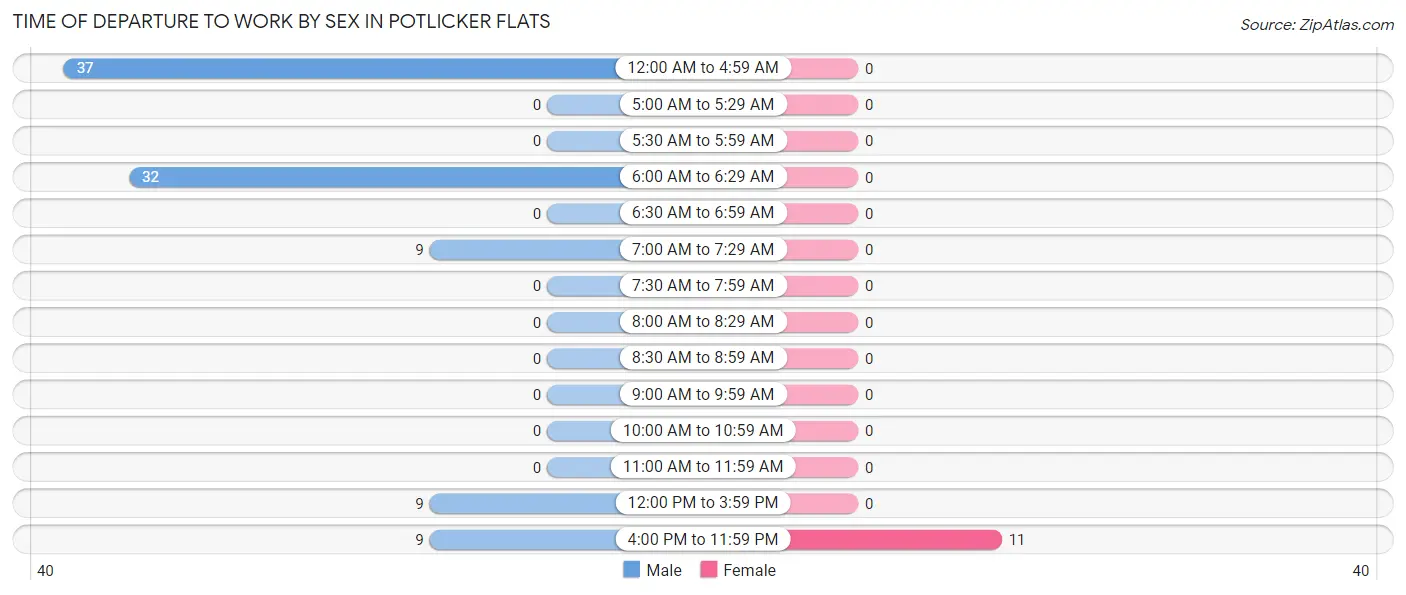
| Time of Departure | Male | Female |
| 12:00 AM to 4:59 AM | 37 (38.5%) | 0 (0.0%) |
| 5:00 AM to 5:29 AM | 0 (0.0%) | 0 (0.0%) |
| 5:30 AM to 5:59 AM | 0 (0.0%) | 0 (0.0%) |
| 6:00 AM to 6:29 AM | 32 (33.3%) | 0 (0.0%) |
| 6:30 AM to 6:59 AM | 0 (0.0%) | 0 (0.0%) |
| 7:00 AM to 7:29 AM | 9 (9.4%) | 0 (0.0%) |
| 7:30 AM to 7:59 AM | 0 (0.0%) | 0 (0.0%) |
| 8:00 AM to 8:29 AM | 0 (0.0%) | 0 (0.0%) |
| 8:30 AM to 8:59 AM | 0 (0.0%) | 0 (0.0%) |
| 9:00 AM to 9:59 AM | 0 (0.0%) | 0 (0.0%) |
| 10:00 AM to 10:59 AM | 0 (0.0%) | 0 (0.0%) |
| 11:00 AM to 11:59 AM | 0 (0.0%) | 0 (0.0%) |
| 12:00 PM to 3:59 PM | 9 (9.4%) | 0 (0.0%) |
| 4:00 PM to 11:59 PM | 9 (9.4%) | 11 (100.0%) |
| Total | 96 (100.0%) | 11 (100.0%) |
Housing Occupancy in Potlicker Flats
Occupancy by Ownership in Potlicker Flats
Of the total 69 dwellings in Potlicker Flats, owner-occupied units account for 69 (100.0%), while renter-occupied units make up 0 (0.0%).
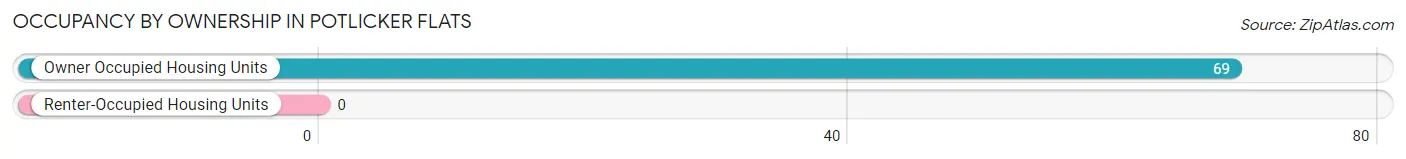
| Occupancy | # Housing Units | % Housing Units |
| Owner Occupied Housing Units | 69 | 100.0% |
| Renter-Occupied Housing Units | 0 | 0.0% |
| Total Occupied Housing Units | 69 | 100.0% |
Occupancy by Household Size in Potlicker Flats
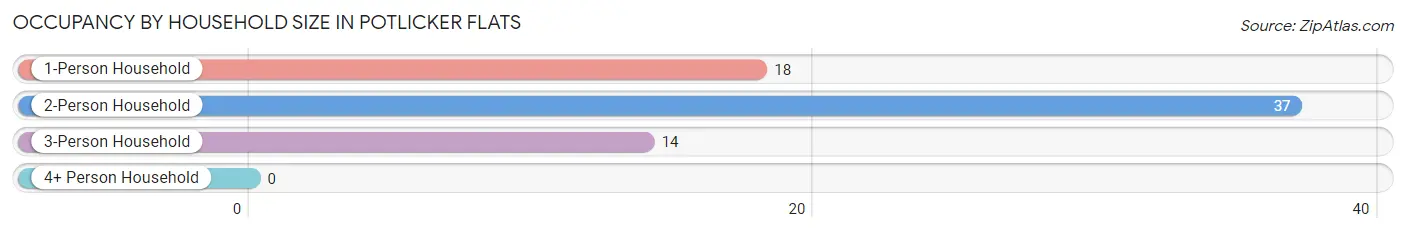
| Household Size | # Housing Units | % Housing Units |
| 1-Person Household | 18 | 26.1% |
| 2-Person Household | 37 | 53.6% |
| 3-Person Household | 14 | 20.3% |
| 4+ Person Household | 0 | 0.0% |
| Total Housing Units | 69 | 100.0% |
Occupancy by Ownership by Household Size in Potlicker Flats
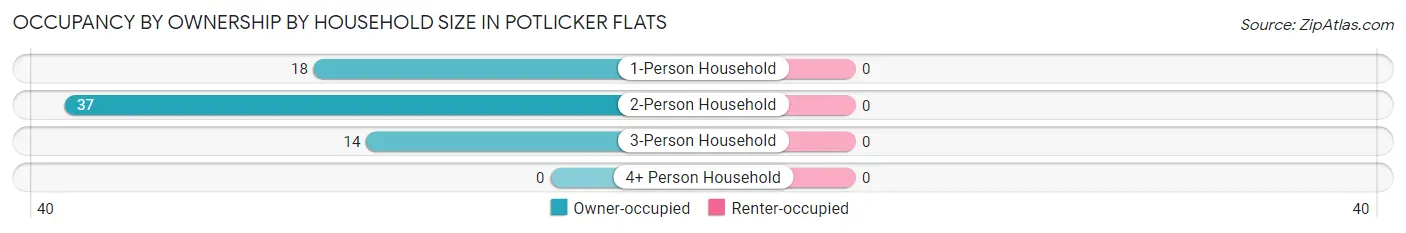
| Household Size | Owner-occupied | Renter-occupied |
| 1-Person Household | 18 (100.0%) | 0 (0.0%) |
| 2-Person Household | 37 (100.0%) | 0 (0.0%) |
| 3-Person Household | 14 (100.0%) | 0 (0.0%) |
| 4+ Person Household | 0 (0.0%) | 0 (0.0%) |
| Total Housing Units | 69 (100.0%) | 0 (0.0%) |
Occupancy by Educational Attainment in Potlicker Flats
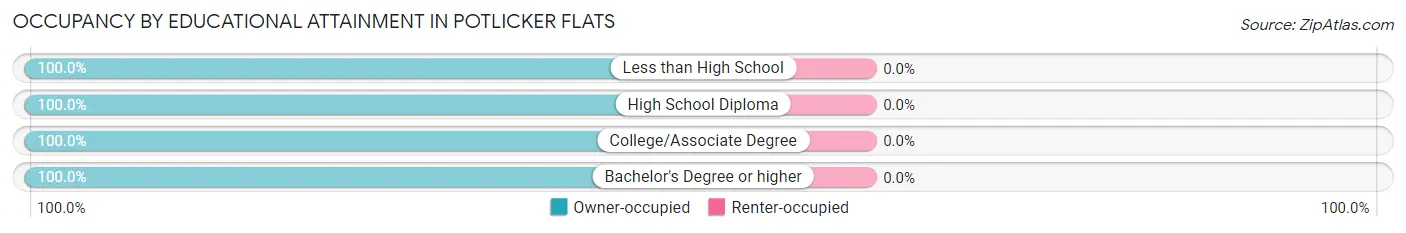
| Household Size | Owner-occupied | Renter-occupied |
| Less than High School | 9 (100.0%) | 0 (0.0%) |
| High School Diploma | 46 (100.0%) | 0 (0.0%) |
| College/Associate Degree | 5 (100.0%) | 0 (0.0%) |
| Bachelor's Degree or higher | 9 (100.0%) | 0 (0.0%) |
Occupancy by Age of Householder in Potlicker Flats
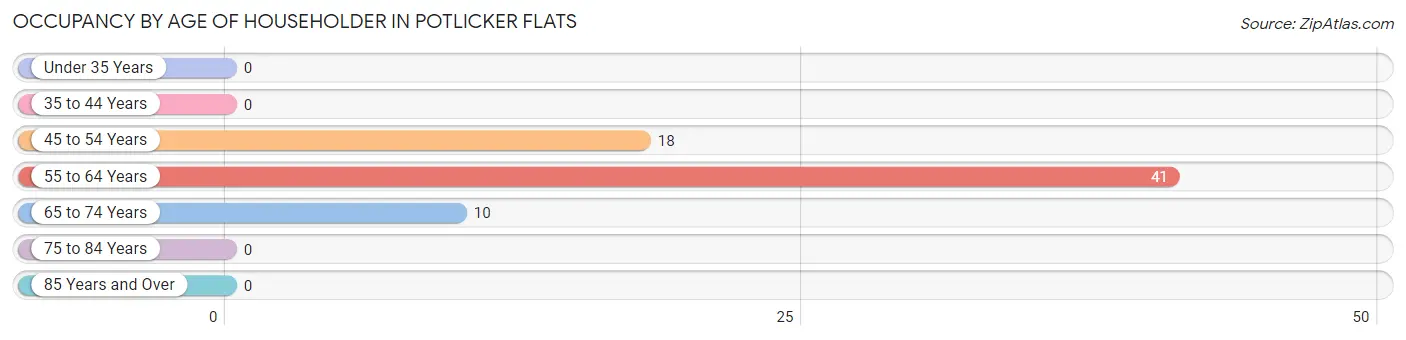
| Age Bracket | # Households | % Households |
| Under 35 Years | 0 | 0.0% |
| 35 to 44 Years | 0 | 0.0% |
| 45 to 54 Years | 18 | 26.1% |
| 55 to 64 Years | 41 | 59.4% |
| 65 to 74 Years | 10 | 14.5% |
| 75 to 84 Years | 0 | 0.0% |
| 85 Years and Over | 0 | 0.0% |
| Total | 69 | 100.0% |
Housing Finances in Potlicker Flats
Median Income by Occupancy in Potlicker Flats
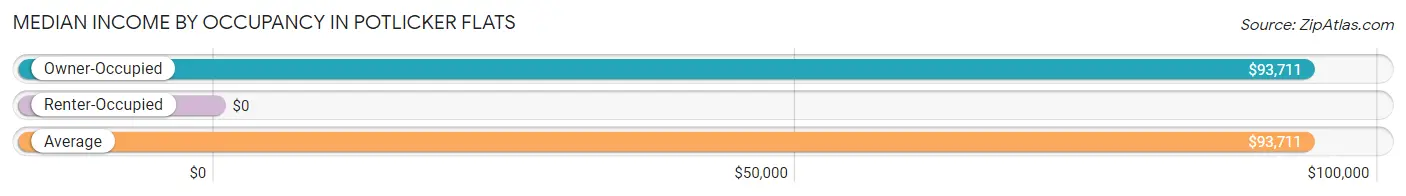
| Occupancy Type | # Households | Median Income |
| Owner-Occupied | 69 (100.0%) | $93,711 |
| Renter-Occupied | 0 (0.0%) | $0 |
| Average | 69 (100.0%) | $93,711 |
Occupancy by Householder Income Bracket in Potlicker Flats
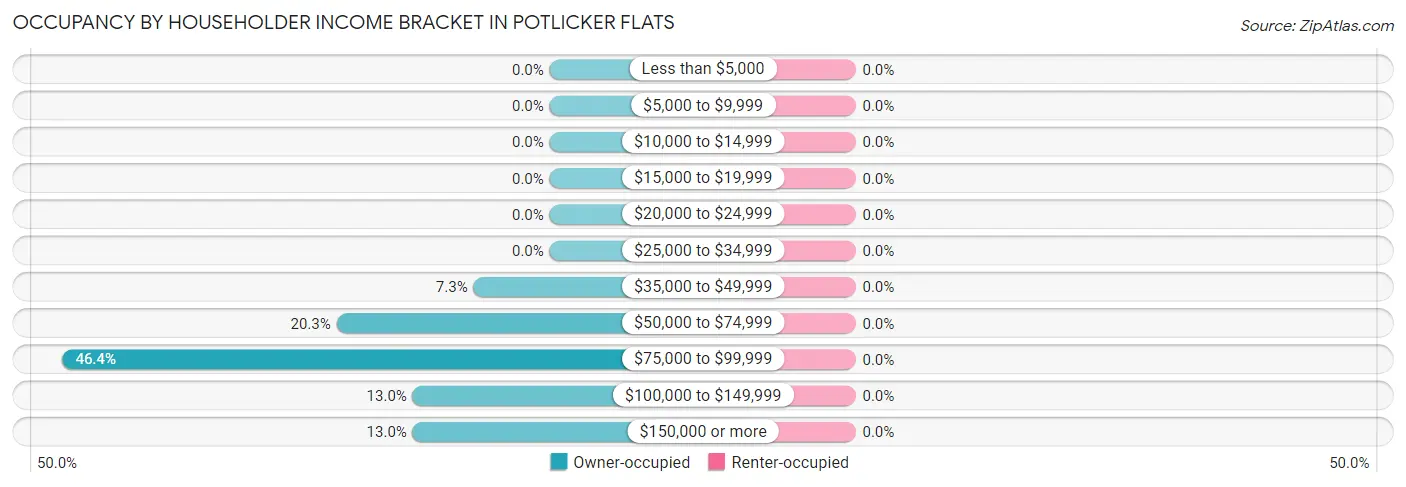
| Income Bracket | Owner-occupied | Renter-occupied |
| Less than $5,000 | 0 (0.0%) | 0 (0.0%) |
| $5,000 to $9,999 | 0 (0.0%) | 0 (0.0%) |
| $10,000 to $14,999 | 0 (0.0%) | 0 (0.0%) |
| $15,000 to $19,999 | 0 (0.0%) | 0 (0.0%) |
| $20,000 to $24,999 | 0 (0.0%) | 0 (0.0%) |
| $25,000 to $34,999 | 0 (0.0%) | 0 (0.0%) |
| $35,000 to $49,999 | 5 (7.2%) | 0 (0.0%) |
| $50,000 to $74,999 | 14 (20.3%) | 0 (0.0%) |
| $75,000 to $99,999 | 32 (46.4%) | 0 (0.0%) |
| $100,000 to $149,999 | 9 (13.0%) | 0 (0.0%) |
| $150,000 or more | 9 (13.0%) | 0 (0.0%) |
| Total | 69 (100.0%) | 0 (0.0%) |
Monthly Housing Cost Tiers in Potlicker Flats
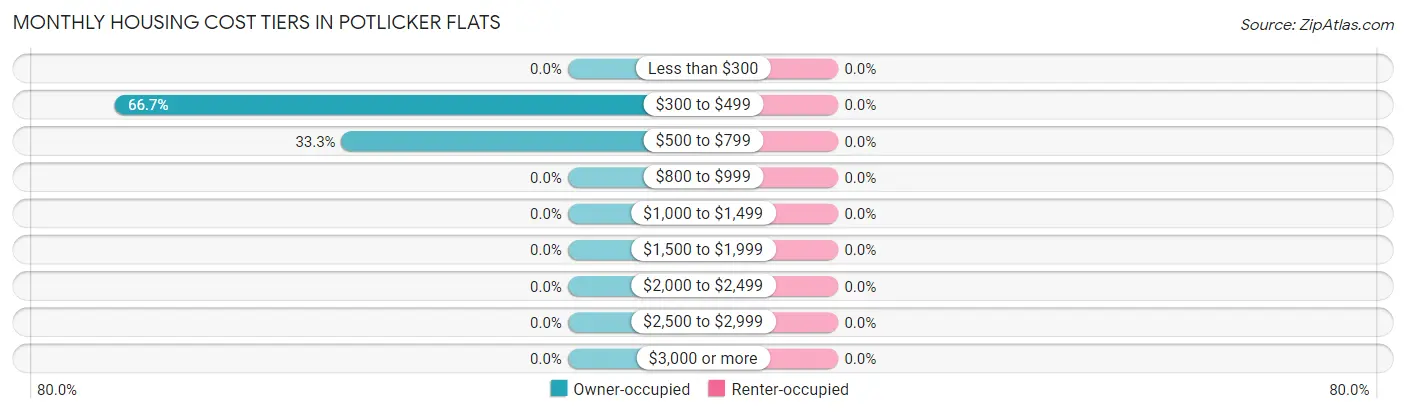
| Monthly Cost | Owner-occupied | Renter-occupied |
| Less than $300 | 0 (0.0%) | 0 (0.0%) |
| $300 to $499 | 46 (66.7%) | 0 (0.0%) |
| $500 to $799 | 23 (33.3%) | 0 (0.0%) |
| $800 to $999 | 0 (0.0%) | 0 (0.0%) |
| $1,000 to $1,499 | 0 (0.0%) | 0 (0.0%) |
| $1,500 to $1,999 | 0 (0.0%) | 0 (0.0%) |
| $2,000 to $2,499 | 0 (0.0%) | 0 (0.0%) |
| $2,500 to $2,999 | 0 (0.0%) | 0 (0.0%) |
| $3,000 or more | 0 (0.0%) | 0 (0.0%) |
| Total | 69 (100.0%) | 0 (0.0%) |
Physical Housing Characteristics in Potlicker Flats
Housing Structures in Potlicker Flats
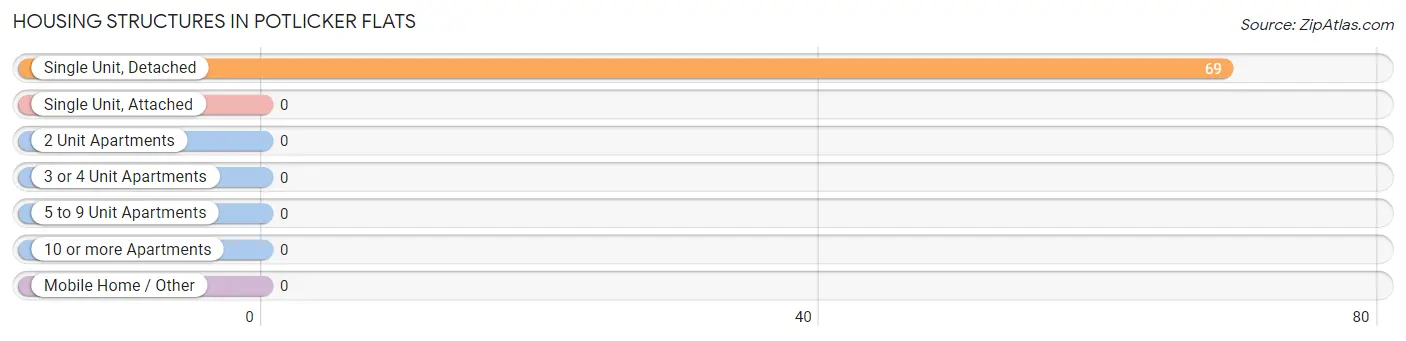
| Structure Type | # Housing Units | % Housing Units |
| Single Unit, Detached | 69 | 100.0% |
| Single Unit, Attached | 0 | 0.0% |
| 2 Unit Apartments | 0 | 0.0% |
| 3 or 4 Unit Apartments | 0 | 0.0% |
| 5 to 9 Unit Apartments | 0 | 0.0% |
| 10 or more Apartments | 0 | 0.0% |
| Mobile Home / Other | 0 | 0.0% |
| Total | 69 | 100.0% |
Housing Structures by Occupancy in Potlicker Flats
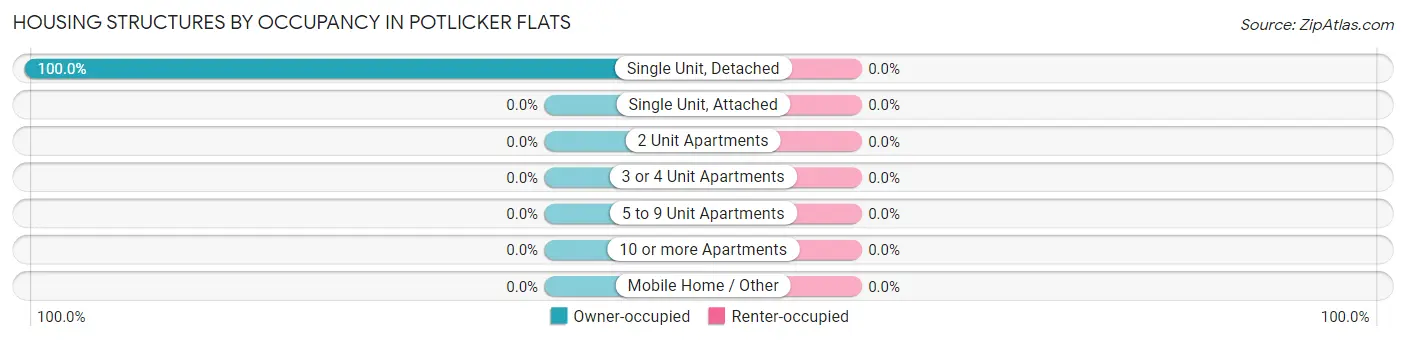
| Structure Type | Owner-occupied | Renter-occupied |
| Single Unit, Detached | 69 (100.0%) | 0 (0.0%) |
| Single Unit, Attached | 0 (0.0%) | 0 (0.0%) |
| 2 Unit Apartments | 0 (0.0%) | 0 (0.0%) |
| 3 or 4 Unit Apartments | 0 (0.0%) | 0 (0.0%) |
| 5 to 9 Unit Apartments | 0 (0.0%) | 0 (0.0%) |
| 10 or more Apartments | 0 (0.0%) | 0 (0.0%) |
| Mobile Home / Other | 0 (0.0%) | 0 (0.0%) |
| Total | 69 (100.0%) | 0 (0.0%) |
Housing Structures by Number of Rooms in Potlicker Flats
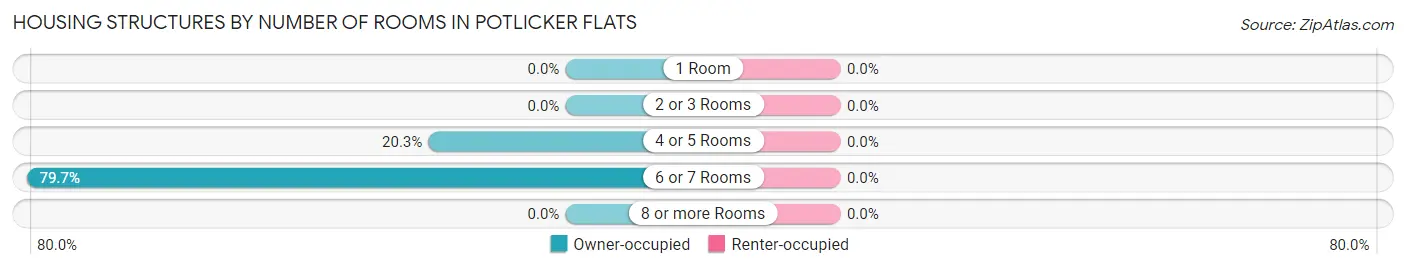
| Number of Rooms | Owner-occupied | Renter-occupied |
| 1 Room | 0 (0.0%) | 0 (0.0%) |
| 2 or 3 Rooms | 0 (0.0%) | 0 (0.0%) |
| 4 or 5 Rooms | 14 (20.3%) | 0 (0.0%) |
| 6 or 7 Rooms | 55 (79.7%) | 0 (0.0%) |
| 8 or more Rooms | 0 (0.0%) | 0 (0.0%) |
| Total | 69 (100.0%) | 0 (0.0%) |
Housing Structure by Heating Type in Potlicker Flats
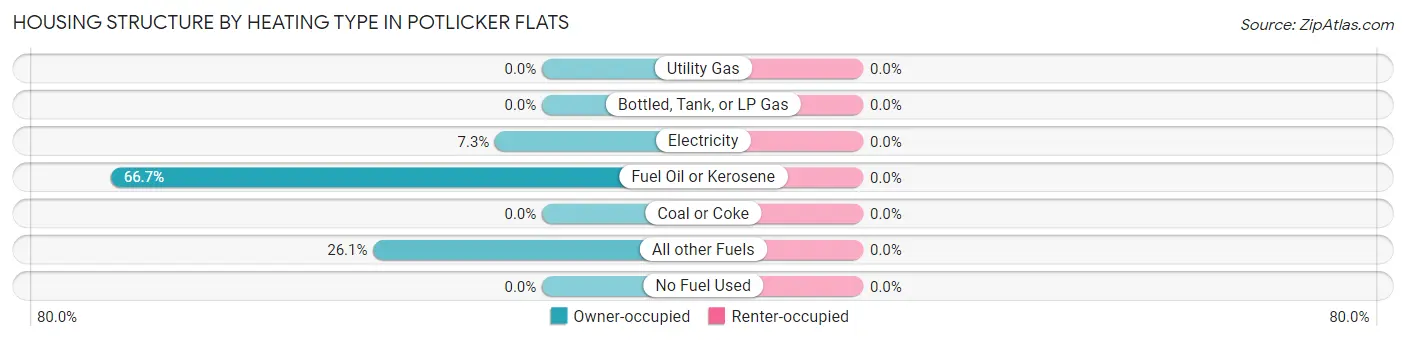
| Heating Type | Owner-occupied | Renter-occupied |
| Utility Gas | 0 (0.0%) | 0 (0.0%) |
| Bottled, Tank, or LP Gas | 0 (0.0%) | 0 (0.0%) |
| Electricity | 5 (7.2%) | 0 (0.0%) |
| Fuel Oil or Kerosene | 46 (66.7%) | 0 (0.0%) |
| Coal or Coke | 0 (0.0%) | 0 (0.0%) |
| All other Fuels | 18 (26.1%) | 0 (0.0%) |
| No Fuel Used | 0 (0.0%) | 0 (0.0%) |
| Total | 69 (100.0%) | 0 (0.0%) |
Household Vehicle Usage in Potlicker Flats
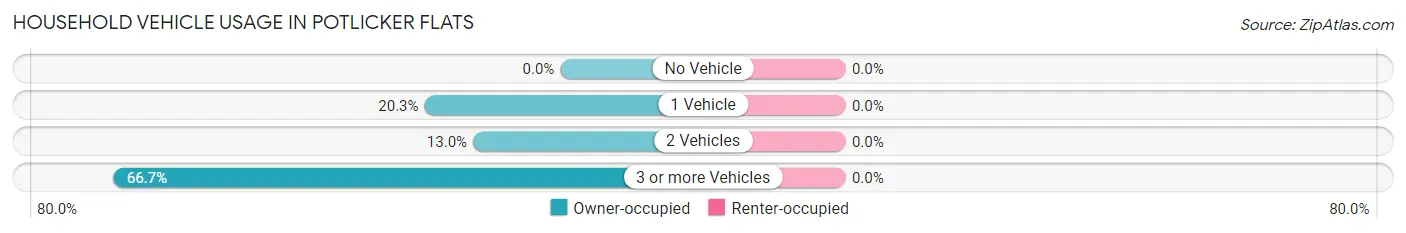
| Vehicles per Household | Owner-occupied | Renter-occupied |
| No Vehicle | 0 (0.0%) | 0 (0.0%) |
| 1 Vehicle | 14 (20.3%) | 0 (0.0%) |
| 2 Vehicles | 9 (13.0%) | 0 (0.0%) |
| 3 or more Vehicles | 46 (66.7%) | 0 (0.0%) |
| Total | 69 (100.0%) | 0 (0.0%) |
Real Estate & Mortgages in Potlicker Flats
Real Estate and Mortgage Overview in Potlicker Flats
| Characteristic | Without Mortgage | With Mortgage |
| Housing Units | 69 | 0 |
| Median Property Value | $88,000 | $0 |
| Median Household Income | $93,711 | $0 |
| Monthly Housing Costs | $475 | $0 |
| Real Estate Taxes | $1,655 | $0 |
Property Value by Mortgage Status in Potlicker Flats
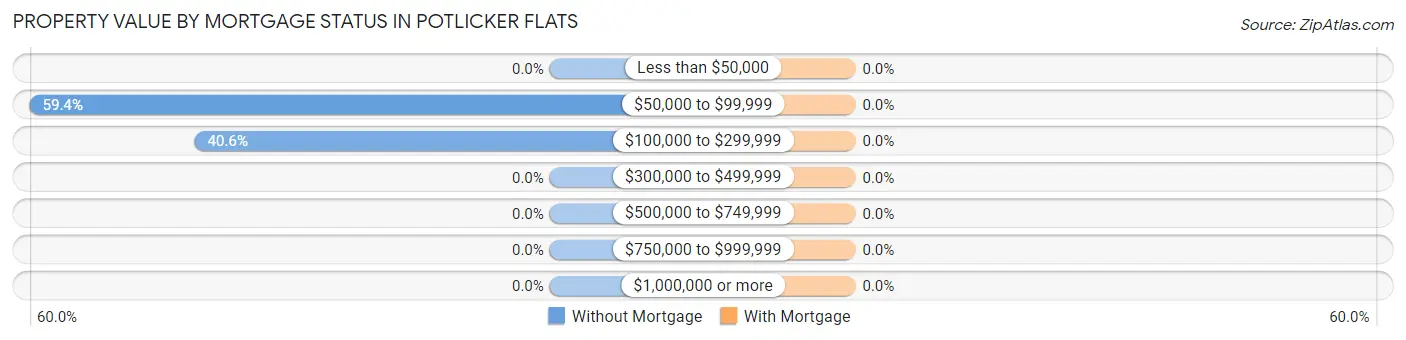
| Property Value | Without Mortgage | With Mortgage |
| Less than $50,000 | 0 (0.0%) | 0 (0.0%) |
| $50,000 to $99,999 | 41 (59.4%) | 0 (0.0%) |
| $100,000 to $299,999 | 28 (40.6%) | 0 (0.0%) |
| $300,000 to $499,999 | 0 (0.0%) | 0 (0.0%) |
| $500,000 to $749,999 | 0 (0.0%) | 0 (0.0%) |
| $750,000 to $999,999 | 0 (0.0%) | 0 (0.0%) |
| $1,000,000 or more | 0 (0.0%) | 0 (0.0%) |
| Total | 69 (100.0%) | 0 (0.0%) |
Household Income by Mortgage Status in Potlicker Flats
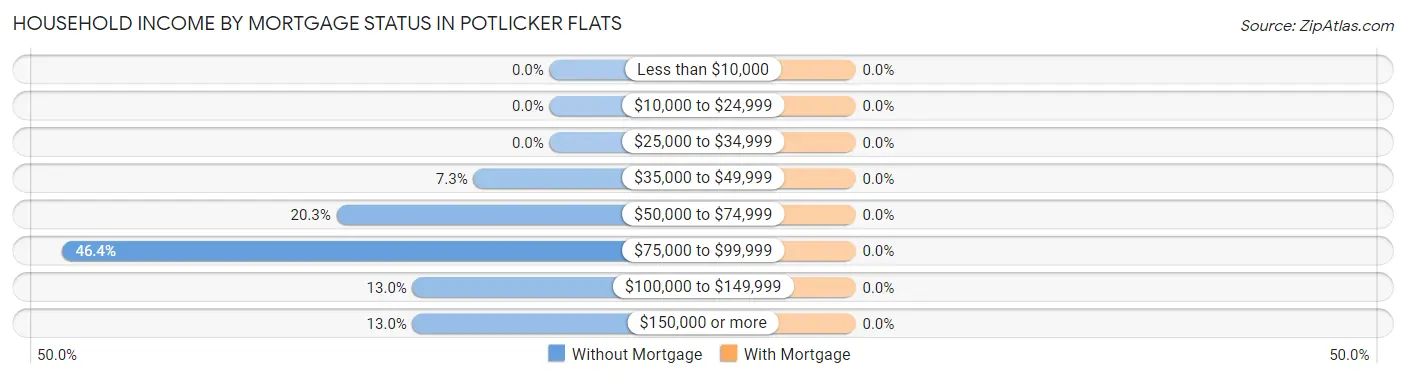
| Household Income | Without Mortgage | With Mortgage |
| Less than $10,000 | 0 (0.0%) | 0 (0.0%) |
| $10,000 to $24,999 | 0 (0.0%) | 0 (0.0%) |
| $25,000 to $34,999 | 0 (0.0%) | 0 (0.0%) |
| $35,000 to $49,999 | 5 (7.2%) | 0 (0.0%) |
| $50,000 to $74,999 | 14 (20.3%) | 0 (0.0%) |
| $75,000 to $99,999 | 32 (46.4%) | 0 (0.0%) |
| $100,000 to $149,999 | 9 (13.0%) | 0 (0.0%) |
| $150,000 or more | 9 (13.0%) | 0 (0.0%) |
| Total | 69 (100.0%) | 0 (0.0%) |
Property Value to Household Income Ratio in Potlicker Flats
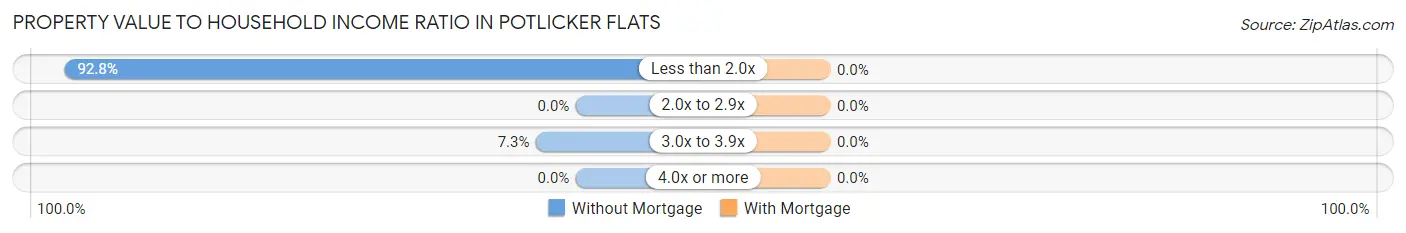
| Value-to-Income Ratio | Without Mortgage | With Mortgage |
| Less than 2.0x | 64 (92.7%) | 0 (0.0%) |
| 2.0x to 2.9x | 0 (0.0%) | 0 (0.0%) |
| 3.0x to 3.9x | 5 (7.2%) | 0 (0.0%) |
| 4.0x or more | 0 (0.0%) | 0 (0.0%) |
| Total | 69 (100.0%) | 0 (0.0%) |
Real Estate Taxes by Mortgage Status in Potlicker Flats
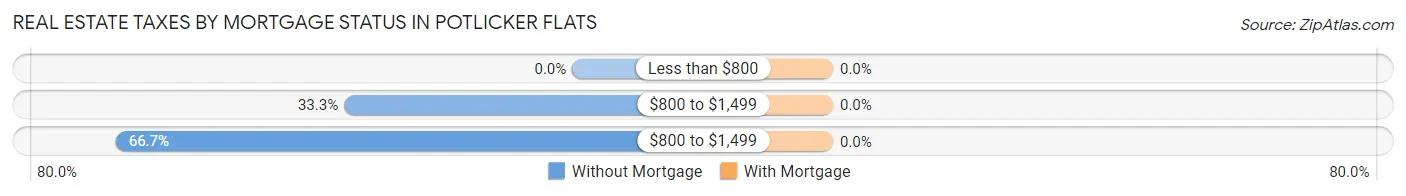
| Property Taxes | Without Mortgage | With Mortgage |
| Less than $800 | 0 (0.0%) | 0 (0.0%) |
| $800 to $1,499 | 23 (33.3%) | 0 (0.0%) |
| $800 to $1,499 | 46 (66.7%) | 0 (0.0%) |
| Total | 69 (100.0%) | 0 (0.0%) |
Health & Disability in Potlicker Flats
Health Insurance Coverage by Age in Potlicker Flats
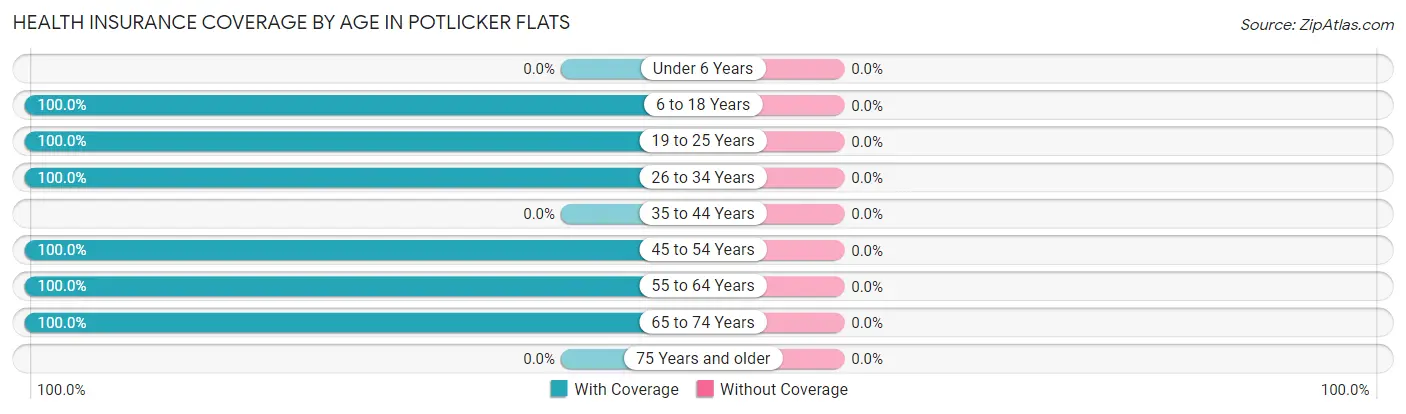
| Age Bracket | With Coverage | Without Coverage |
| Under 6 Years | 0 (0.0%) | 0 (0.0%) |
| 6 to 18 Years | 7 (100.0%) | 0 (0.0%) |
| 19 to 25 Years | 6 (100.0%) | 0 (0.0%) |
| 26 to 34 Years | 37 (100.0%) | 0 (0.0%) |
| 35 to 44 Years | 0 (0.0%) | 0 (0.0%) |
| 45 to 54 Years | 29 (100.0%) | 0 (0.0%) |
| 55 to 64 Years | 41 (100.0%) | 0 (0.0%) |
| 65 to 74 Years | 21 (100.0%) | 0 (0.0%) |
| 75 Years and older | 0 (0.0%) | 0 (0.0%) |
| Total | 141 (100.0%) | 0 (0.0%) |
Health Insurance Coverage by Citizenship Status in Potlicker Flats

| Citizenship Status | With Coverage | Without Coverage |
| Native Born | 0 (0.0%) | 0 (0.0%) |
| Foreign Born, Citizen | 7 (100.0%) | 0 (0.0%) |
| Foreign Born, not a Citizen | 6 (100.0%) | 0 (0.0%) |
Health Insurance Coverage by Household Income in Potlicker Flats
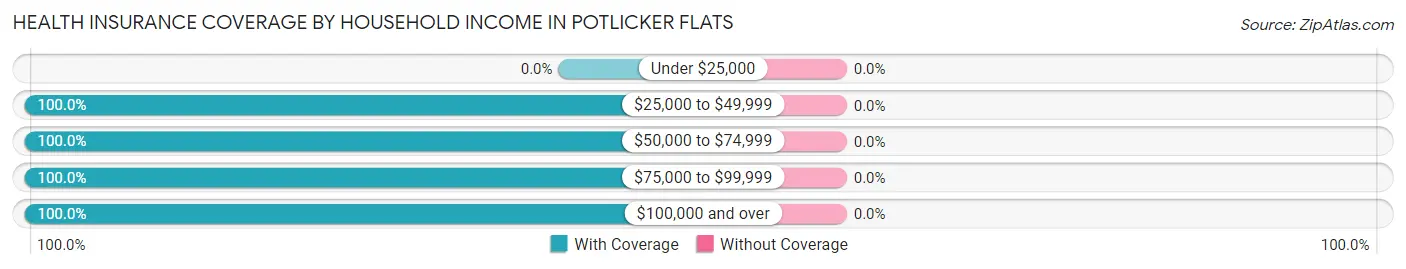
| Household Income | With Coverage | Without Coverage |
| Under $25,000 | 0 (0.0%) | 0 (0.0%) |
| $25,000 to $49,999 | 11 (100.0%) | 0 (0.0%) |
| $50,000 to $74,999 | 25 (100.0%) | 0 (0.0%) |
| $75,000 to $99,999 | 69 (100.0%) | 0 (0.0%) |
| $100,000 and over | 36 (100.0%) | 0 (0.0%) |
Public vs Private Health Insurance Coverage by Age in Potlicker Flats
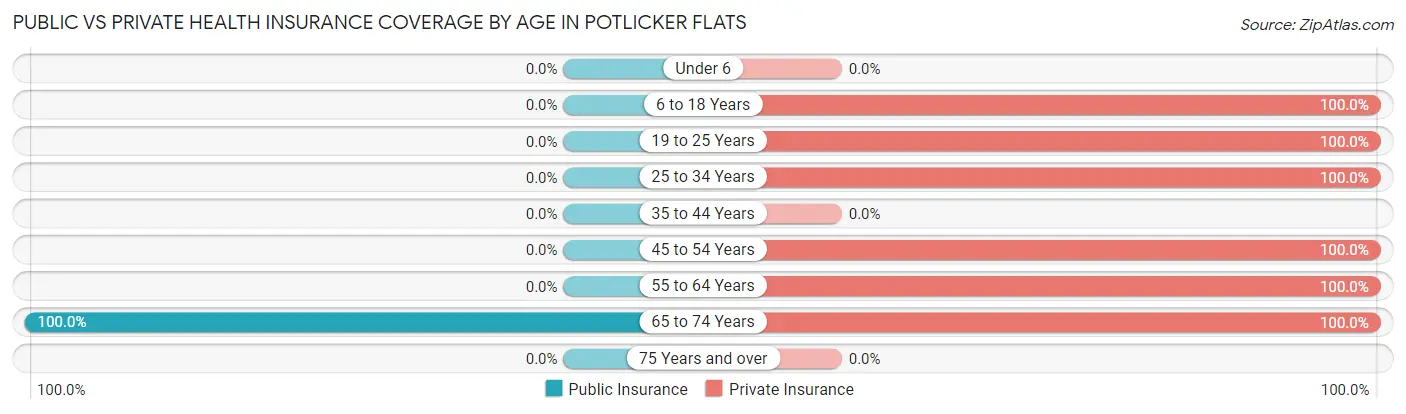
| Age Bracket | Public Insurance | Private Insurance |
| Under 6 | 0 (0.0%) | 0 (0.0%) |
| 6 to 18 Years | 0 (0.0%) | 7 (100.0%) |
| 19 to 25 Years | 0 (0.0%) | 6 (100.0%) |
| 25 to 34 Years | 0 (0.0%) | 37 (100.0%) |
| 35 to 44 Years | 0 (0.0%) | 0 (0.0%) |
| 45 to 54 Years | 0 (0.0%) | 29 (100.0%) |
| 55 to 64 Years | 0 (0.0%) | 41 (100.0%) |
| 65 to 74 Years | 21 (100.0%) | 21 (100.0%) |
| 75 Years and over | 0 (0.0%) | 0 (0.0%) |
| Total | 21 (14.9%) | 141 (100.0%) |
Disability Status by Sex by Age in Potlicker Flats
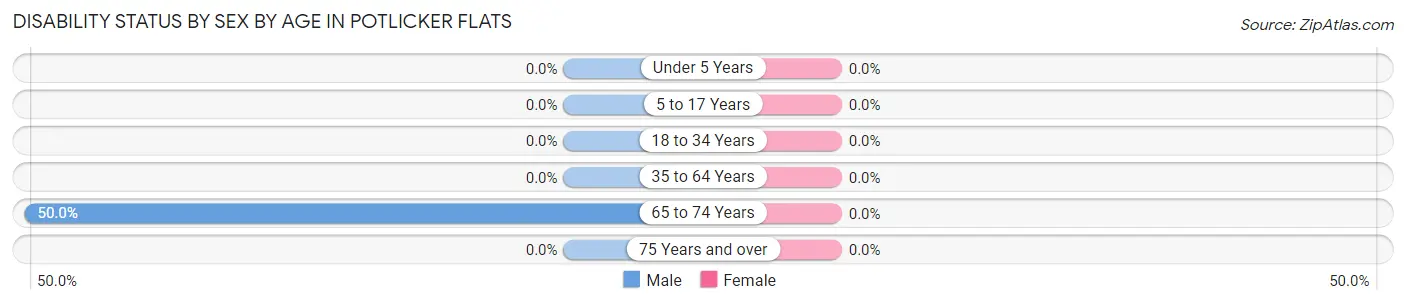
| Age Bracket | Male | Female |
| Under 5 Years | 0 (0.0%) | 0 (0.0%) |
| 5 to 17 Years | 0 (0.0%) | 0 (0.0%) |
| 18 to 34 Years | 0 (0.0%) | 0 (0.0%) |
| 35 to 64 Years | 0 (0.0%) | 0 (0.0%) |
| 65 to 74 Years | 5 (50.0%) | 0 (0.0%) |
| 75 Years and over | 0 (0.0%) | 0 (0.0%) |
Disability Class by Sex by Age in Potlicker Flats
Disability Class: Hearing Difficulty
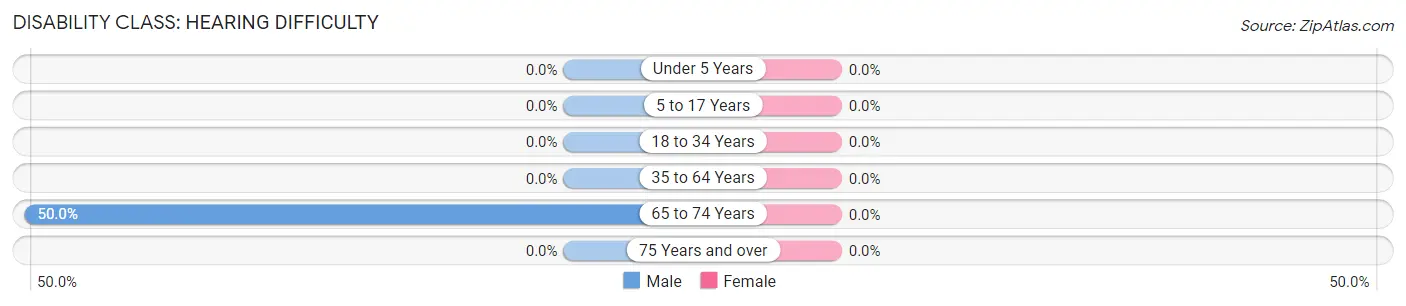
| Age Bracket | Male | Female |
| Under 5 Years | 0 (0.0%) | 0 (0.0%) |
| 5 to 17 Years | 0 (0.0%) | 0 (0.0%) |
| 18 to 34 Years | 0 (0.0%) | 0 (0.0%) |
| 35 to 64 Years | 0 (0.0%) | 0 (0.0%) |
| 65 to 74 Years | 5 (50.0%) | 0 (0.0%) |
| 75 Years and over | 0 (0.0%) | 0 (0.0%) |
Disability Class: Vision Difficulty
| Age Bracket | Male | Female |
| Under 5 Years | 0 (0.0%) | 0 (0.0%) |
| 5 to 17 Years | 0 (0.0%) | 0 (0.0%) |
| 18 to 34 Years | 0 (0.0%) | 0 (0.0%) |
| 35 to 64 Years | 0 (0.0%) | 0 (0.0%) |
| 65 to 74 Years | 0 (0.0%) | 0 (0.0%) |
| 75 Years and over | 0 (0.0%) | 0 (0.0%) |
Disability Class: Cognitive Difficulty
| Age Bracket | Male | Female |
| 5 to 17 Years | 0 (0.0%) | 0 (0.0%) |
| 18 to 34 Years | 0 (0.0%) | 0 (0.0%) |
| 35 to 64 Years | 0 (0.0%) | 0 (0.0%) |
| 65 to 74 Years | 0 (0.0%) | 0 (0.0%) |
| 75 Years and over | 0 (0.0%) | 0 (0.0%) |
Disability Class: Ambulatory Difficulty
| Age Bracket | Male | Female |
| 5 to 17 Years | 0 (0.0%) | 0 (0.0%) |
| 18 to 34 Years | 0 (0.0%) | 0 (0.0%) |
| 35 to 64 Years | 0 (0.0%) | 0 (0.0%) |
| 65 to 74 Years | 0 (0.0%) | 0 (0.0%) |
| 75 Years and over | 0 (0.0%) | 0 (0.0%) |
Disability Class: Self-Care Difficulty
| Age Bracket | Male | Female |
| 5 to 17 Years | 0 (0.0%) | 0 (0.0%) |
| 18 to 34 Years | 0 (0.0%) | 0 (0.0%) |
| 35 to 64 Years | 0 (0.0%) | 0 (0.0%) |
| 65 to 74 Years | 0 (0.0%) | 0 (0.0%) |
| 75 Years and over | 0 (0.0%) | 0 (0.0%) |
Technology Access in Potlicker Flats
Computing Device Access in Potlicker Flats
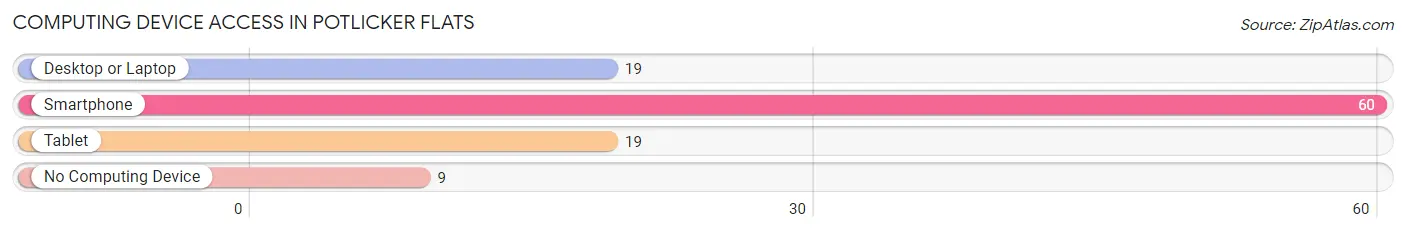
| Device Type | # Households | % Households |
| Desktop or Laptop | 19 | 27.5% |
| Smartphone | 60 | 87.0% |
| Tablet | 19 | 27.5% |
| No Computing Device | 9 | 13.0% |
| Total | 69 | 100.0% |
Internet Access in Potlicker Flats
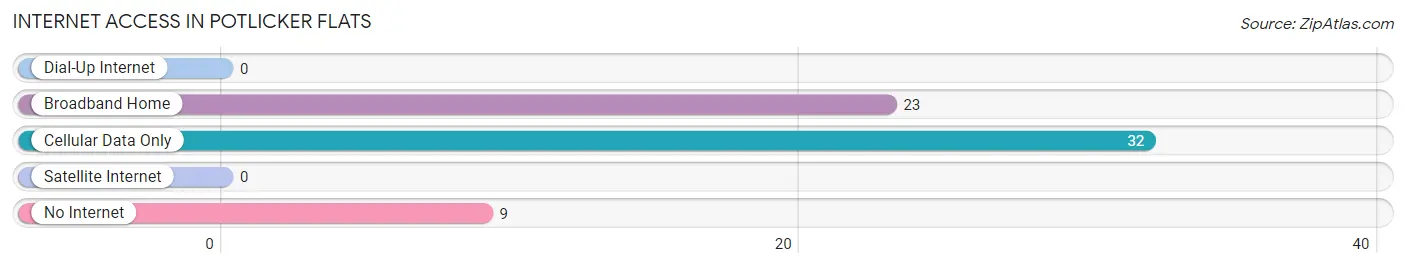
| Internet Type | # Households | % Households |
| Dial-Up Internet | 0 | 0.0% |
| Broadband Home | 23 | 33.3% |
| Cellular Data Only | 32 | 46.4% |
| Satellite Internet | 0 | 0.0% |
| No Internet | 9 | 13.0% |
| Total | 69 | 100.0% |
Potlicker Flats Summary
History
Potlicker Flats, Pennsylvania is a small town located in the Allegheny Mountains of Pennsylvania. The town was founded in 1820 by a group of settlers from the nearby town of Potlicker. The settlers were looking for a place to settle and start a new life. The town was named after the Potlicker Creek, which runs through the area.
The town was originally a farming community, with the main crops being corn, wheat, and oats. The town also had a few small businesses, such as a general store, a blacksmith, and a sawmill.
In the late 1800s, the town began to grow and develop. The railroad came to town in 1887, bringing with it new opportunities for growth and development. The town also became a popular tourist destination, as it was located near several popular attractions, such as the Allegheny National Forest and the Allegheny River.
The town continued to grow and develop throughout the 20th century. In the 1950s, the town was home to several small businesses, including a grocery store, a hardware store, and a gas station. The town also had a post office, a bank, and a library.
In the late 20th century, the town began to decline. Many of the businesses closed, and the population began to decline. In the early 2000s, the town was in danger of becoming a ghost town.
Geography
Potlicker Flats is located in the Allegheny Mountains of Pennsylvania. The town is situated in a valley, surrounded by mountains on all sides. The town is located near the Allegheny National Forest and the Allegheny River.
The town is located at an elevation of 1,400 feet above sea level. The climate in the area is temperate, with cold winters and warm summers. The average annual temperature is around 50 degrees Fahrenheit.
Economy
The economy of Potlicker Flats is largely based on tourism. The town is home to several popular attractions, such as the Allegheny National Forest and the Allegheny River. The town also has several small businesses, such as a grocery store, a hardware store, and a gas station.
The town also has a few manufacturing businesses, such as a furniture factory and a woodworking shop. The town also has a few small farms, which produce corn, wheat, and oats.
Demographics
As of the 2010 census, the population of Potlicker Flats was 1,845. The town has a population density of 8.3 people per square mile. The median age of the population is 44.7 years.
The racial makeup of the town is 97.3% White, 0.7% African American, 0.2% Native American, 0.2% Asian, 0.1% Pacific Islander, 0.3% from other races, and 1.4% from two or more races. The median household income is $37,941. The per capita income is $19,945.
Conclusion
Potlicker Flats, Pennsylvania is a small town located in the Allegheny Mountains of Pennsylvania. The town was founded in 1820 and has a population of 1,845 as of the 2010 census. The town is largely based on tourism, with several popular attractions in the area. The town also has several small businesses, such as a grocery store, a hardware store, and a gas station. The median household income is $37,941 and the per capita income is $19,945.
Common Questions
What is Per Capita Income in Potlicker Flats?
Per Capita income in Potlicker Flats is $52,939.
What is the Median Family Income in Potlicker Flats?
Median Family Income in Potlicker Flats is $93,711.
What is the Median Household income in Potlicker Flats?
Median Household Income in Potlicker Flats is $93,711.
What is Inequality or Gini Index in Potlicker Flats?
Inequality or Gini Index in Potlicker Flats is 0.23.
What is the Total Population of Potlicker Flats?
Total Population of Potlicker Flats is 141.
What is the Total Male Population of Potlicker Flats?
Total Male Population of Potlicker Flats is 119.
What is the Total Female Population of Potlicker Flats?
Total Female Population of Potlicker Flats is 22.
What is the Ratio of Males per 100 Females in Potlicker Flats?
There are 540.91 Males per 100 Females in Potlicker Flats.
What is the Ratio of Females per 100 Males in Potlicker Flats?
There are 18.49 Females per 100 Males in Potlicker Flats.
What is the Median Population Age in Potlicker Flats?
Median Population Age in Potlicker Flats is 51.1 Years.
What is the Average Family Size in Potlicker Flats
Average Family Size in Potlicker Flats is 2.4 People.
What is the Average Household Size in Potlicker Flats
Average Household Size in Potlicker Flats is 2.0 People.
How Large is the Labor Force in Potlicker Flats?
There are 112 People in the Labor Forcein in Potlicker Flats.
What is the Percentage of People in the Labor Force in Potlicker Flats?
79.4% of People are in the Labor Force in Potlicker Flats.
What is the Unemployment Rate in Potlicker Flats?
Unemployment Rate in Potlicker Flats is 4.5%.