Elim, PA Map & Demographics
Elim Map
Elim Overview
$33,103
PER CAPITA INCOME
$92,942
AVG FAMILY INCOME
$62,198
AVG HOUSEHOLD INCOME
14.2%
WAGE / INCOME GAP [ % ]
85.8¢/ $1
WAGE / INCOME GAP [ $ ]
0.40
INEQUALITY / GINI INDEX
3,903
TOTAL POPULATION
1,639
MALE POPULATION
2,264
FEMALE POPULATION
72.39
MALES / 100 FEMALES
138.13
FEMALES / 100 MALES
43.4
MEDIAN AGE
3.0
AVG FAMILY SIZE
2.4
AVG HOUSEHOLD SIZE
1,792
LABOR FORCE [ PEOPLE ]
59.5%
PERCENT IN LABOR FORCE
6.1%
UNEMPLOYMENT RATE
Income in Elim
Income Overview in Elim
Per Capita Income in Elim is $33,103, while median incomes of families and households are $92,942 and $62,198 respectively.
| Characteristic | Number | Measure |
| Per Capita Income | 3,903 | $33,103 |
| Median Family Income | 903 | $92,942 |
| Mean Family Income | 903 | $108,760 |
| Median Household Income | 1,481 | $62,198 |
| Mean Household Income | 1,481 | $85,156 |
| Income Deficit | 903 | $0 |
| Wage / Income Gap (%) | 3,903 | 14.20% |
| Wage / Income Gap ($) | 3,903 | 85.80¢ per $1 |
| Gini / Inequality Index | 3,903 | 0.40 |
Earnings by Sex in Elim
Average Earnings in Elim are $44,386, $50,136 for men and $43,017 for women, a difference of 14.2%.
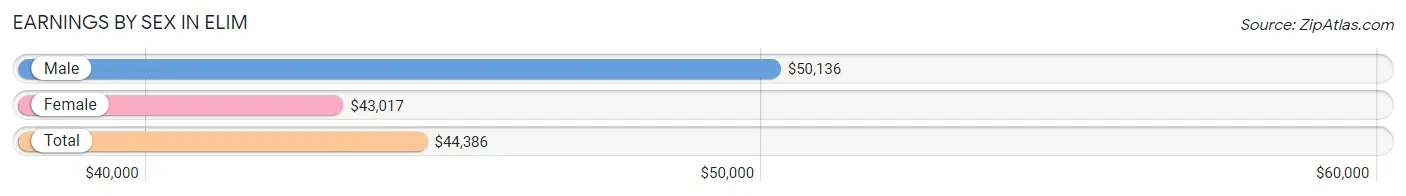
| Sex | Number | Average Earnings |
| Male | 855 (48.4%) | $50,136 |
| Female | 912 (51.6%) | $43,017 |
| Total | 1,767 (100.0%) | $44,386 |
Earnings by Sex by Income Bracket in Elim
The most common earnings brackets in Elim are $30,000 to $34,999 for men (182 | 21.3%) and $40,000 to $44,999 for women (137 | 15.0%).
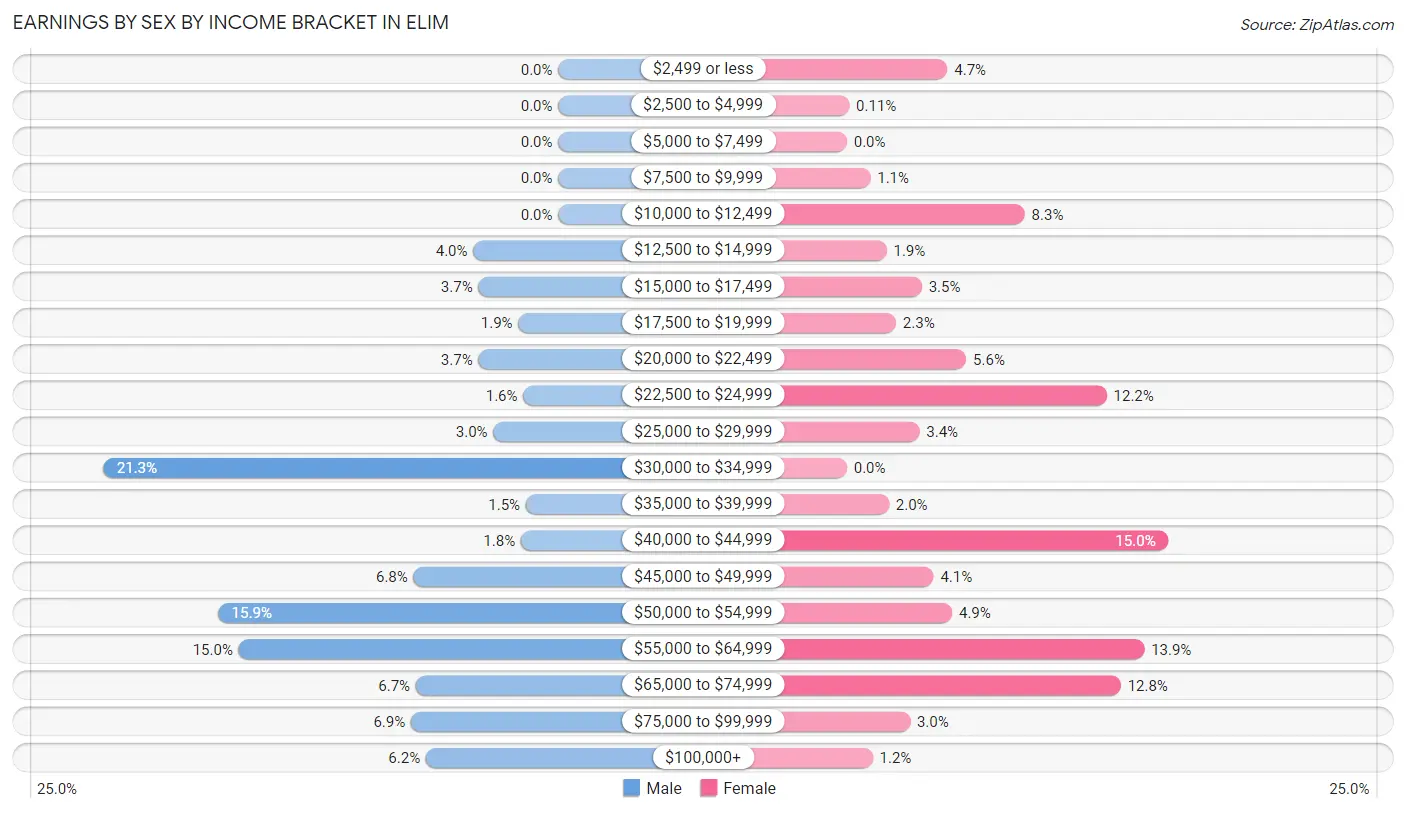
| Income | Male | Female |
| $2,499 or less | 0 (0.0%) | 43 (4.7%) |
| $2,500 to $4,999 | 0 (0.0%) | 1 (0.1%) |
| $5,000 to $7,499 | 0 (0.0%) | 0 (0.0%) |
| $7,500 to $9,999 | 0 (0.0%) | 10 (1.1%) |
| $10,000 to $12,499 | 0 (0.0%) | 76 (8.3%) |
| $12,500 to $14,999 | 34 (4.0%) | 17 (1.9%) |
| $15,000 to $17,499 | 32 (3.7%) | 32 (3.5%) |
| $17,500 to $19,999 | 16 (1.9%) | 21 (2.3%) |
| $20,000 to $22,499 | 32 (3.7%) | 51 (5.6%) |
| $22,500 to $24,999 | 14 (1.6%) | 111 (12.2%) |
| $25,000 to $29,999 | 26 (3.0%) | 31 (3.4%) |
| $30,000 to $34,999 | 182 (21.3%) | 0 (0.0%) |
| $35,000 to $39,999 | 13 (1.5%) | 18 (2.0%) |
| $40,000 to $44,999 | 15 (1.8%) | 137 (15.0%) |
| $45,000 to $49,999 | 58 (6.8%) | 37 (4.1%) |
| $50,000 to $54,999 | 136 (15.9%) | 45 (4.9%) |
| $55,000 to $64,999 | 128 (15.0%) | 127 (13.9%) |
| $65,000 to $74,999 | 57 (6.7%) | 117 (12.8%) |
| $75,000 to $99,999 | 59 (6.9%) | 27 (3.0%) |
| $100,000+ | 53 (6.2%) | 11 (1.2%) |
| Total | 855 (100.0%) | 912 (100.0%) |
Earnings by Sex by Educational Attainment in Elim
Average earnings in Elim are $51,262 for men and $43,481 for women, a difference of 15.2%. Men with an educational attainment of high school diploma enjoy the highest average annual earnings of $50,536, while those with high school diploma education earn the least with $50,536. Women with an educational attainment of bachelor's degree earn the most with the average annual earnings of $66,250, while those with high school diploma education have the smallest earnings of $24,217.
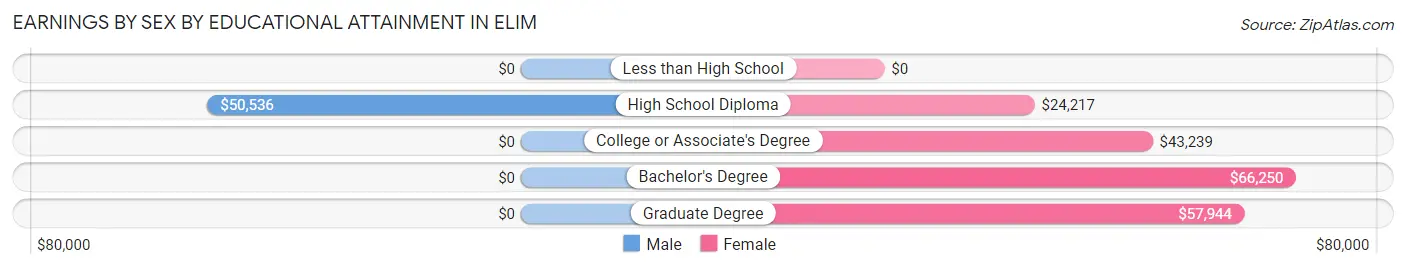
| Educational Attainment | Male Income | Female Income |
| Less than High School | - | - |
| High School Diploma | $50,536 | $24,217 |
| College or Associate's Degree | - | - |
| Bachelor's Degree | - | - |
| Graduate Degree | - | - |
| Total | $51,262 | $43,481 |
Family Income in Elim
Family Income Brackets in Elim
According to the Elim family income data, there are 269 families falling into the $75,000 to $99,999 income range, which is the most common income bracket and makes up 29.8% of all families.
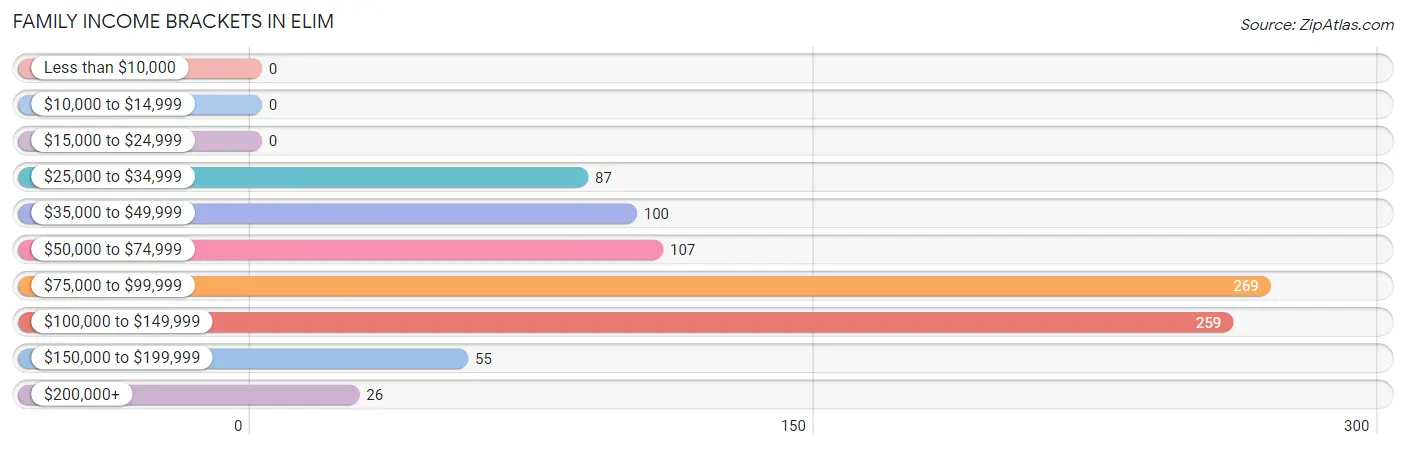
| Income Bracket | # Families | % Families |
| Less than $10,000 | 0 | 0.0% |
| $10,000 to $14,999 | 0 | 0.0% |
| $15,000 to $24,999 | 0 | 0.0% |
| $25,000 to $34,999 | 87 | 9.6% |
| $35,000 to $49,999 | 100 | 11.1% |
| $50,000 to $74,999 | 107 | 11.8% |
| $75,000 to $99,999 | 269 | 29.8% |
| $100,000 to $149,999 | 259 | 28.7% |
| $150,000 to $199,999 | 55 | 6.1% |
| $200,000+ | 26 | 2.9% |
Family Income by Famaliy Size in Elim
4-person families (62 | 6.9%) account for the highest median family income in Elim with $111,875 per family, while 2-person families (446 | 49.4%) have the highest median income of $41,964 per family member.
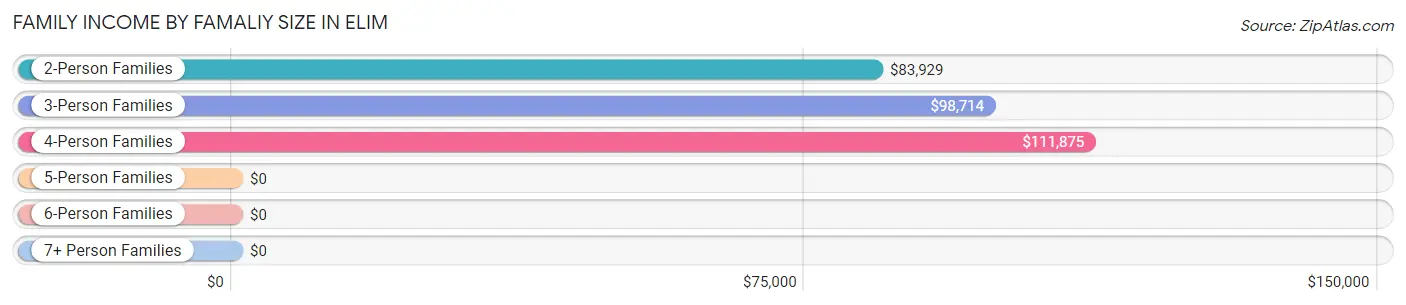
| Income Bracket | # Families | Median Income |
| 2-Person Families | 446 (49.4%) | $83,929 |
| 3-Person Families | 230 (25.5%) | $98,714 |
| 4-Person Families | 62 (6.9%) | $111,875 |
| 5-Person Families | 117 (13.0%) | $0 |
| 6-Person Families | 48 (5.3%) | $0 |
| 7+ Person Families | 0 (0.0%) | $0 |
| Total | 903 (100.0%) | $92,942 |
Family Income by Number of Earners in Elim
The median family income in Elim is $92,942, with families comprising 3+ earners (108) having the highest median family income of $138,958, while families with no earners (142) have the lowest median family income of $50,833, accounting for 12.0% and 15.7% of families, respectively.
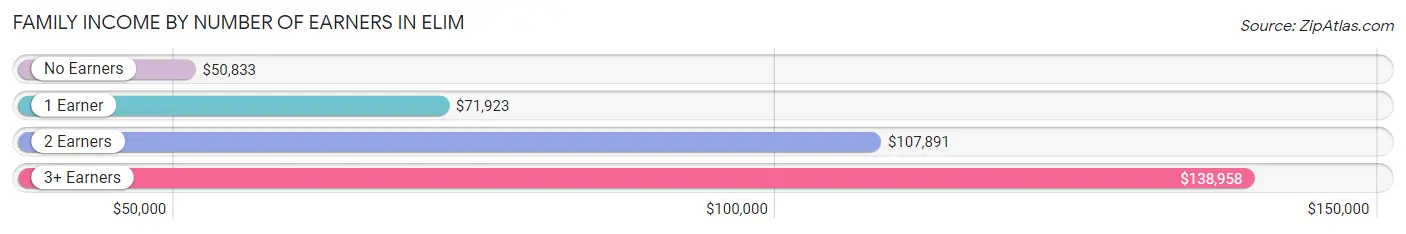
| Number of Earners | # Families | Median Income |
| No Earners | 142 (15.7%) | $50,833 |
| 1 Earner | 316 (35.0%) | $71,923 |
| 2 Earners | 337 (37.3%) | $107,891 |
| 3+ Earners | 108 (12.0%) | $138,958 |
| Total | 903 (100.0%) | $92,942 |
Household Income in Elim
Household Income Brackets in Elim
With 315 households falling in the category, the $100,000 to $149,999 income range is the most frequent in Elim, accounting for 21.3% of all households.
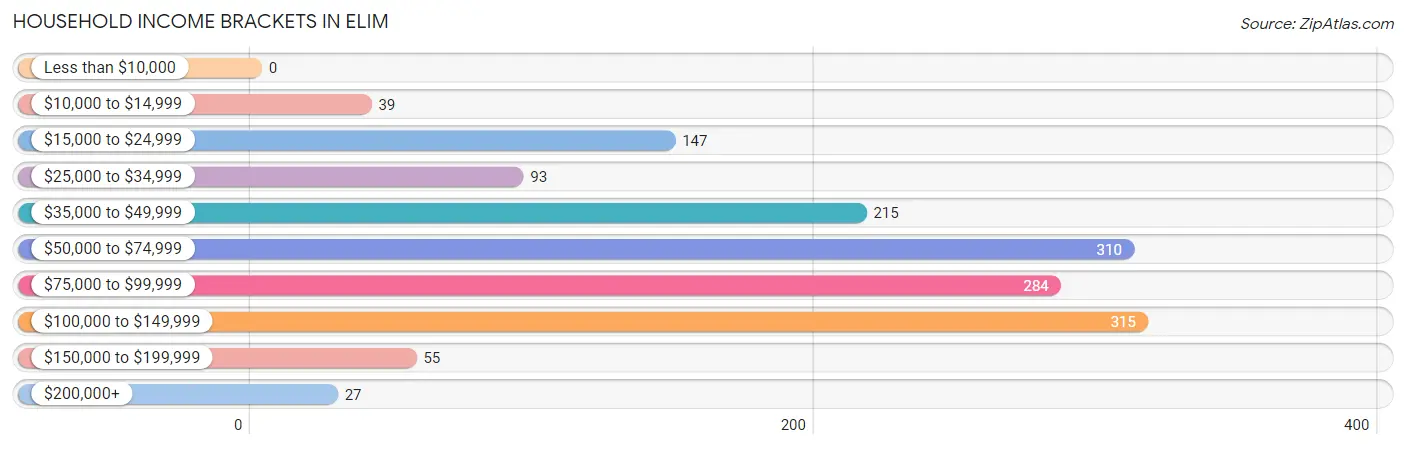
| Income Bracket | # Households | % Households |
| Less than $10,000 | 0 | 0.0% |
| $10,000 to $14,999 | 39 | 2.6% |
| $15,000 to $24,999 | 147 | 9.9% |
| $25,000 to $34,999 | 93 | 6.3% |
| $35,000 to $49,999 | 215 | 14.5% |
| $50,000 to $74,999 | 310 | 20.9% |
| $75,000 to $99,999 | 284 | 19.2% |
| $100,000 to $149,999 | 315 | 21.3% |
| $150,000 to $199,999 | 55 | 3.7% |
| $200,000+ | 27 | 1.8% |
Household Income by Householder Age in Elim
The median household income in Elim is $62,198, with the highest median household income of $84,464 found in the 45 to 64 years age bracket for the primary householder. A total of 439 households (29.6%) fall into this category. Meanwhile, the 15 to 24 years age bracket for the primary householder has the lowest median household income of $0, with 22 households (1.5%) in this group.
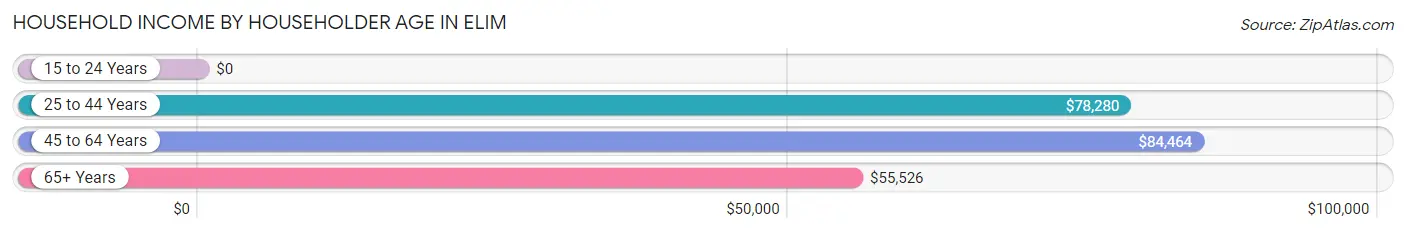
| Income Bracket | # Households | Median Income |
| 15 to 24 Years | 22 (1.5%) | $0 |
| 25 to 44 Years | 442 (29.8%) | $78,280 |
| 45 to 64 Years | 439 (29.6%) | $84,464 |
| 65+ Years | 578 (39.0%) | $55,526 |
| Total | 1,481 (100.0%) | $62,198 |
Poverty in Elim
Income Below Poverty by Sex and Age in Elim
With 3.5% poverty level for males and 12.9% for females among the residents of Elim, 25 to 34 year old males and 6 to 11 year old females are the most vulnerable to poverty, with 19 males (18.4%) and 26 females (100.0%) in their respective age groups living below the poverty level.
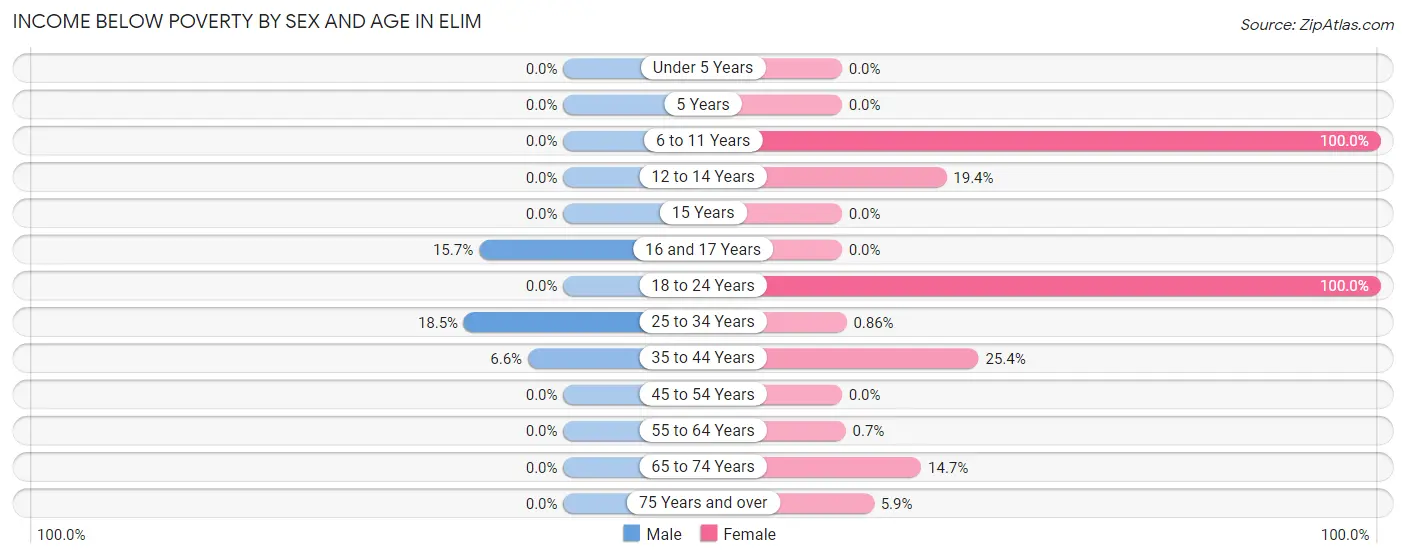
| Age Bracket | Male | Female |
| Under 5 Years | 0 (0.0%) | 0 (0.0%) |
| 5 Years | 0 (0.0%) | 0 (0.0%) |
| 6 to 11 Years | 0 (0.0%) | 26 (100.0%) |
| 12 to 14 Years | 0 (0.0%) | 53 (19.4%) |
| 15 Years | 0 (0.0%) | 0 (0.0%) |
| 16 and 17 Years | 13 (15.7%) | 0 (0.0%) |
| 18 to 24 Years | 0 (0.0%) | 19 (100.0%) |
| 25 to 34 Years | 19 (18.4%) | 1 (0.9%) |
| 35 to 44 Years | 22 (6.6%) | 100 (25.4%) |
| 45 to 54 Years | 0 (0.0%) | 0 (0.0%) |
| 55 to 64 Years | 0 (0.0%) | 2 (0.7%) |
| 65 to 74 Years | 0 (0.0%) | 39 (14.7%) |
| 75 Years and over | 0 (0.0%) | 16 (5.9%) |
| Total | 54 (3.5%) | 256 (12.9%) |
Income Above Poverty by Sex and Age in Elim
According to the poverty statistics in Elim, males aged under 5 years and females aged under 5 years are the age groups that are most secure financially, with 100.0% of males and 100.0% of females in these age groups living above the poverty line.
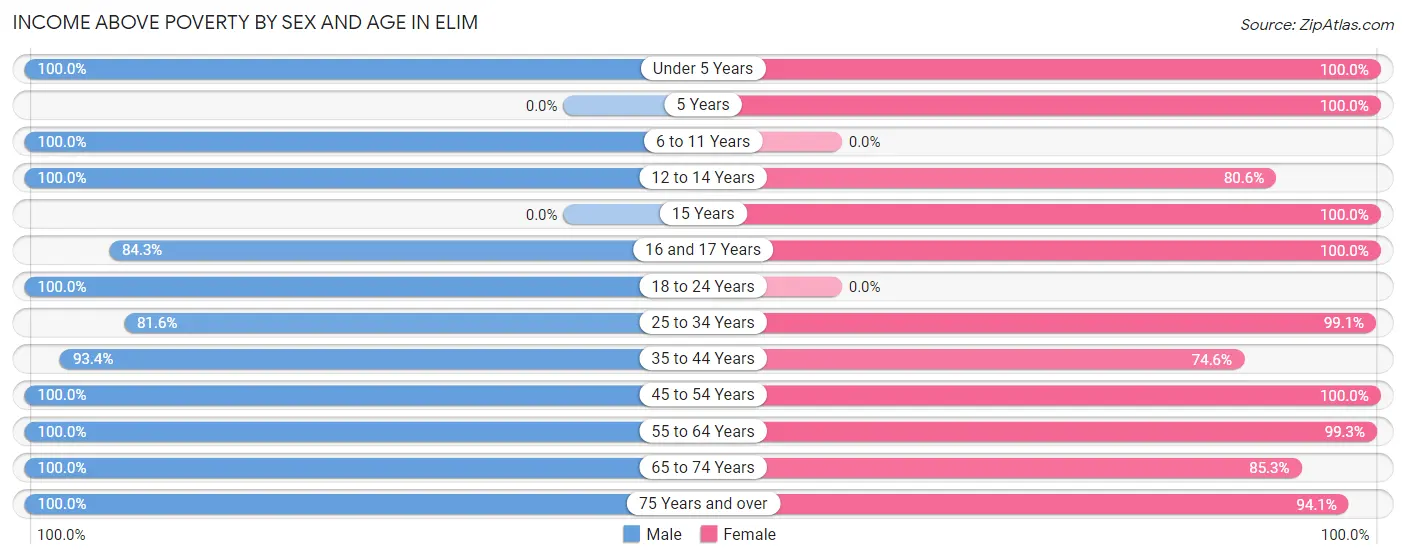
| Age Bracket | Male | Female |
| Under 5 Years | 161 (100.0%) | 44 (100.0%) |
| 5 Years | 0 (0.0%) | 18 (100.0%) |
| 6 to 11 Years | 68 (100.0%) | 0 (0.0%) |
| 12 to 14 Years | 47 (100.0%) | 220 (80.6%) |
| 15 Years | 0 (0.0%) | 85 (100.0%) |
| 16 and 17 Years | 70 (84.3%) | 27 (100.0%) |
| 18 to 24 Years | 91 (100.0%) | 0 (0.0%) |
| 25 to 34 Years | 84 (81.6%) | 115 (99.1%) |
| 35 to 44 Years | 313 (93.4%) | 294 (74.6%) |
| 45 to 54 Years | 174 (100.0%) | 168 (100.0%) |
| 55 to 64 Years | 175 (100.0%) | 284 (99.3%) |
| 65 to 74 Years | 152 (100.0%) | 226 (85.3%) |
| 75 Years and over | 178 (100.0%) | 254 (94.1%) |
| Total | 1,513 (96.6%) | 1,735 (87.1%) |
Income Below Poverty Among Married-Couple Families in Elim
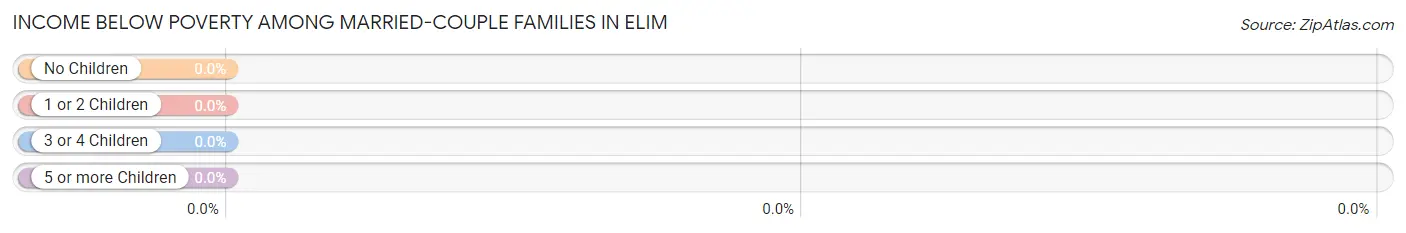
| Children | Above Poverty | Below Poverty |
| No Children | 510 (100.0%) | 0 (0.0%) |
| 1 or 2 Children | 156 (100.0%) | 0 (0.0%) |
| 3 or 4 Children | 141 (100.0%) | 0 (0.0%) |
| 5 or more Children | 0 (0.0%) | 0 (0.0%) |
| Total | 807 (100.0%) | 0 (0.0%) |
Income Below Poverty Among Single-Parent Households in Elim
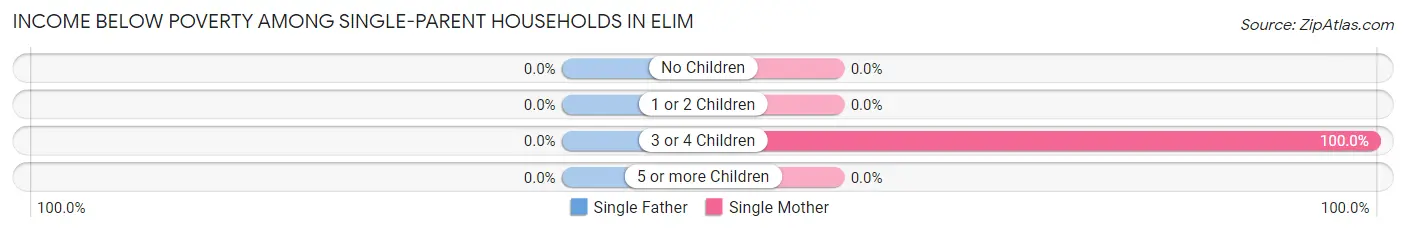
| Children | Single Father | Single Mother |
| No Children | 0 (0.0%) | 0 (0.0%) |
| 1 or 2 Children | 0 (0.0%) | 0 (0.0%) |
| 3 or 4 Children | 0 (0.0%) | 24 (100.0%) |
| 5 or more Children | 0 (0.0%) | 0 (0.0%) |
| Total | 0 (0.0%) | 24 (32.4%) |
Income Below Poverty Among Married-Couple vs Single-Parent Households in Elim
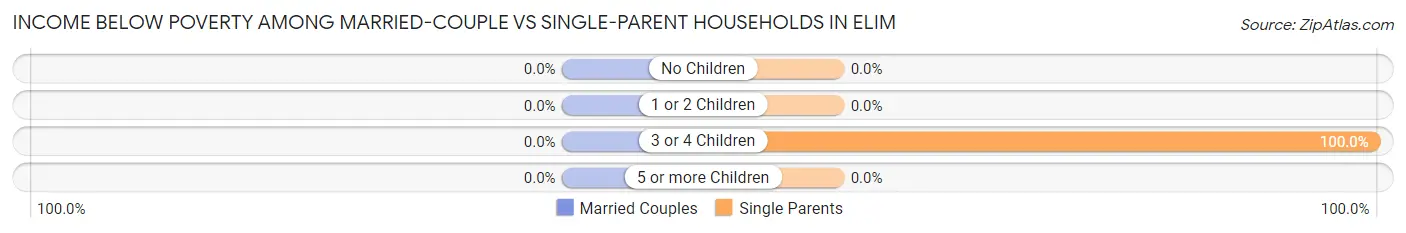
| Children | Married-Couple Families | Single-Parent Households |
| No Children | 0 (0.0%) | 0 (0.0%) |
| 1 or 2 Children | 0 (0.0%) | 0 (0.0%) |
| 3 or 4 Children | 0 (0.0%) | 24 (100.0%) |
| 5 or more Children | 0 (0.0%) | 0 (0.0%) |
| Total | 0 (0.0%) | 24 (25.0%) |
Race in Elim
The most populous races in Elim are White / Caucasian (3,670 | 94.0%), Black / African American (172 | 4.4%), and Hispanic or Latino (90 | 2.3%).
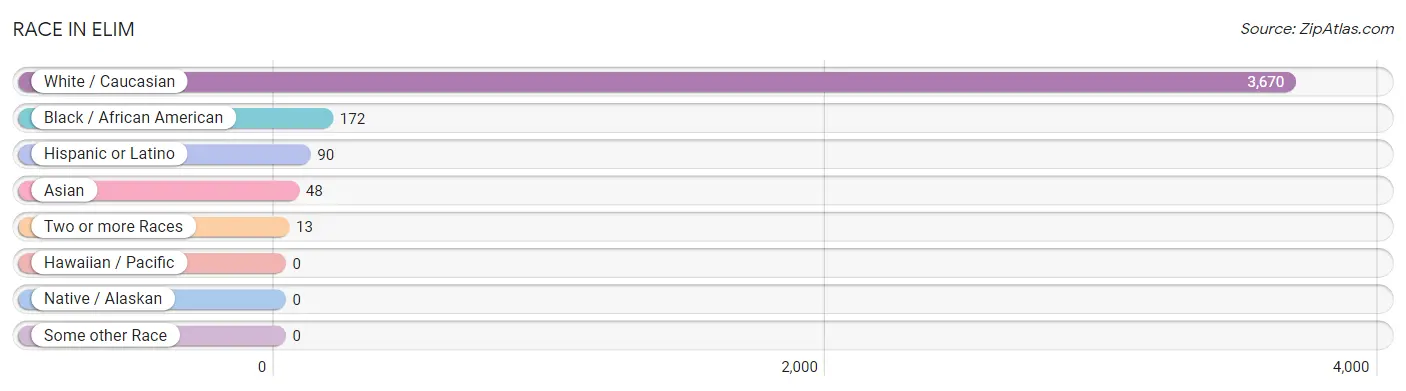
| Race | # Population | % Population |
| Asian | 48 | 1.2% |
| Black / African American | 172 | 4.4% |
| Hawaiian / Pacific | 0 | 0.0% |
| Hispanic or Latino | 90 | 2.3% |
| Native / Alaskan | 0 | 0.0% |
| White / Caucasian | 3,670 | 94.0% |
| Two or more Races | 13 | 0.3% |
| Some other Race | 0 | 0.0% |
| Total | 3,903 | 100.0% |
Ancestry in Elim
The most populous ancestries reported in Elim are German (1,423 | 36.5%), Italian (935 | 24.0%), Irish (440 | 11.3%), Polish (422 | 10.8%), and Slovak (383 | 9.8%), together accounting for 92.3% of all Elim residents.
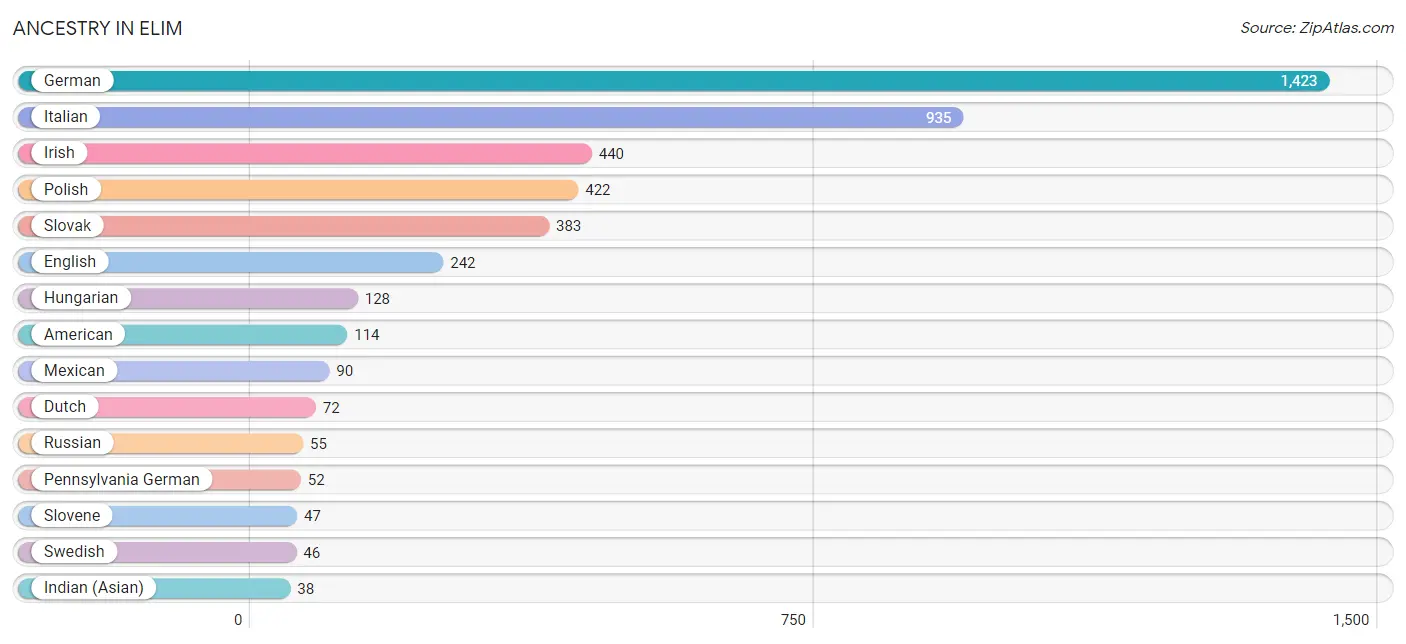
| Ancestry | # Population | % Population |
| African | 1 | 0.0% |
| American | 114 | 2.9% |
| Arab | 28 | 0.7% |
| Armenian | 27 | 0.7% |
| Burmese | 10 | 0.3% |
| Croatian | 13 | 0.3% |
| Czech | 16 | 0.4% |
| Czechoslovakian | 21 | 0.5% |
| Dutch | 72 | 1.8% |
| Eastern European | 8 | 0.2% |
| English | 242 | 6.2% |
| European | 20 | 0.5% |
| German | 1,423 | 36.5% |
| Hungarian | 128 | 3.3% |
| Indian (Asian) | 38 | 1.0% |
| Iranian | 38 | 1.0% |
| Irish | 440 | 11.3% |
| Italian | 935 | 24.0% |
| Lebanese | 28 | 0.7% |
| Lithuanian | 8 | 0.2% |
| Mexican | 90 | 2.3% |
| Pennsylvania German | 52 | 1.3% |
| Polish | 422 | 10.8% |
| Romanian | 38 | 1.0% |
| Russian | 55 | 1.4% |
| Scottish | 22 | 0.6% |
| Serbian | 13 | 0.3% |
| Slovak | 383 | 9.8% |
| Slovene | 47 | 1.2% |
| Subsaharan African | 1 | 0.0% |
| Swedish | 46 | 1.2% | View All 31 Rows |
Immigrants in Elim
The most numerous immigrant groups reported in Elim came from Asia (109 | 2.8%), Western Asia (61 | 1.6%), Eastern Asia (48 | 1.2%), China (38 | 1.0%), and Israel (38 | 1.0%), together accounting for 7.5% of all Elim residents.
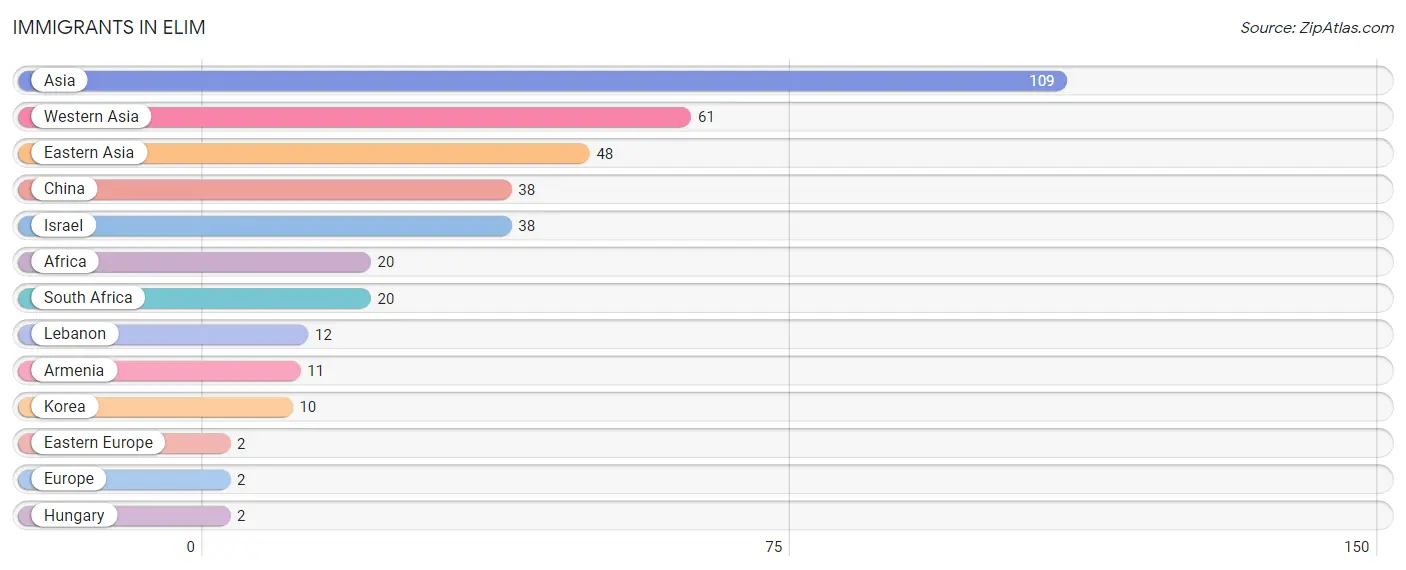
| Immigration Origin | # Population | % Population |
| Africa | 20 | 0.5% |
| Armenia | 11 | 0.3% |
| Asia | 109 | 2.8% |
| China | 38 | 1.0% |
| Eastern Asia | 48 | 1.2% |
| Eastern Europe | 2 | 0.1% |
| Europe | 2 | 0.1% |
| Hungary | 2 | 0.1% |
| Israel | 38 | 1.0% |
| Korea | 10 | 0.3% |
| Lebanon | 12 | 0.3% |
| South Africa | 20 | 0.5% |
| Western Asia | 61 | 1.6% | View All 13 Rows |
Sex and Age in Elim
Sex and Age in Elim
The most populous age groups in Elim are 40 to 44 Years (267 | 16.3%) for men and 10 to 14 Years (331 | 14.6%) for women.
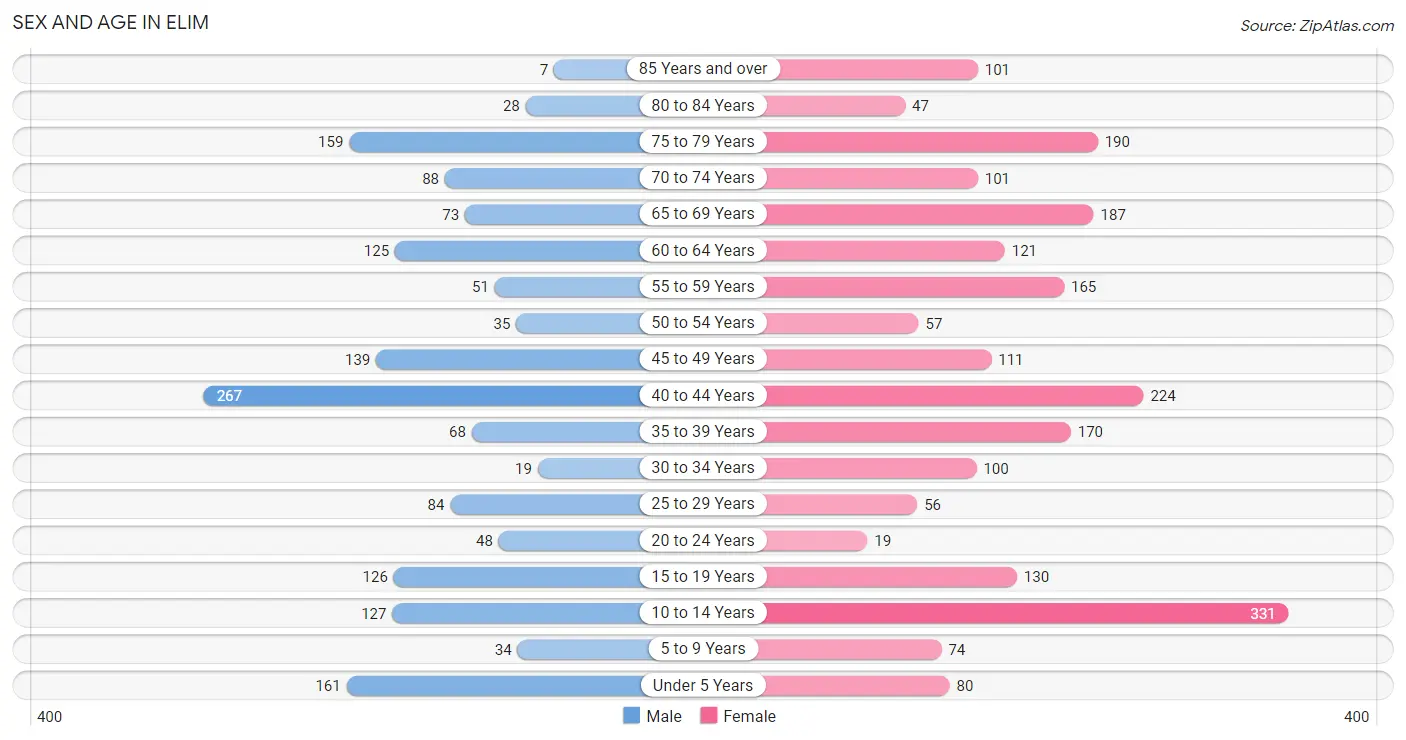
| Age Bracket | Male | Female |
| Under 5 Years | 161 (9.8%) | 80 (3.5%) |
| 5 to 9 Years | 34 (2.1%) | 74 (3.3%) |
| 10 to 14 Years | 127 (7.7%) | 331 (14.6%) |
| 15 to 19 Years | 126 (7.7%) | 130 (5.7%) |
| 20 to 24 Years | 48 (2.9%) | 19 (0.8%) |
| 25 to 29 Years | 84 (5.1%) | 56 (2.5%) |
| 30 to 34 Years | 19 (1.2%) | 100 (4.4%) |
| 35 to 39 Years | 68 (4.2%) | 170 (7.5%) |
| 40 to 44 Years | 267 (16.3%) | 224 (9.9%) |
| 45 to 49 Years | 139 (8.5%) | 111 (4.9%) |
| 50 to 54 Years | 35 (2.1%) | 57 (2.5%) |
| 55 to 59 Years | 51 (3.1%) | 165 (7.3%) |
| 60 to 64 Years | 125 (7.6%) | 121 (5.3%) |
| 65 to 69 Years | 73 (4.4%) | 187 (8.3%) |
| 70 to 74 Years | 88 (5.4%) | 101 (4.5%) |
| 75 to 79 Years | 159 (9.7%) | 190 (8.4%) |
| 80 to 84 Years | 28 (1.7%) | 47 (2.1%) |
| 85 Years and over | 7 (0.4%) | 101 (4.5%) |
| Total | 1,639 (100.0%) | 2,264 (100.0%) |
Families and Households in Elim
Median Family Size in Elim
The median family size in Elim is 3.04 persons per family, with married-couple families (807 | 89.4%) accounting for the largest median family size of 3.05 persons per family. On the other hand, single male/father families (22 | 2.4%) represent the smallest median family size with 2.68 persons per family.
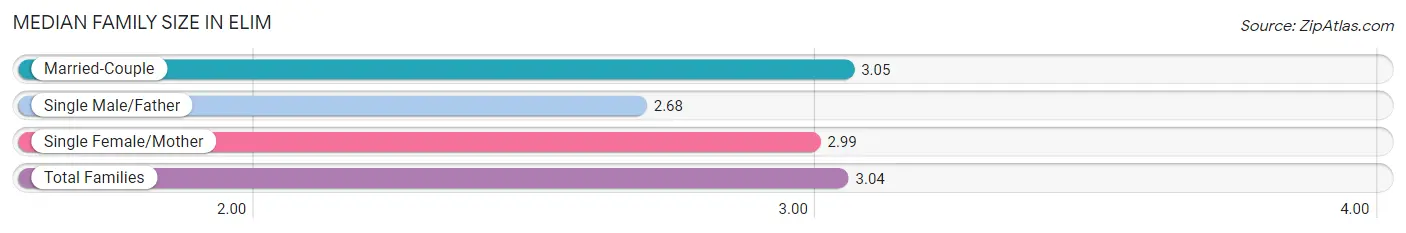
| Family Type | # Families | Family Size |
| Married-Couple | 807 (89.4%) | 3.05 |
| Single Male/Father | 22 (2.4%) | 2.68 |
| Single Female/Mother | 74 (8.2%) | 2.99 |
| Total Families | 903 (100.0%) | 3.04 |
Median Household Size in Elim
The median household size in Elim is 2.40 persons per household, with single male/father households (22 | 1.5%) accounting for the largest median household size of 3.5 persons per household. non-family households (578 | 39.0%) represent the smallest median household size with 1.24 persons per household.
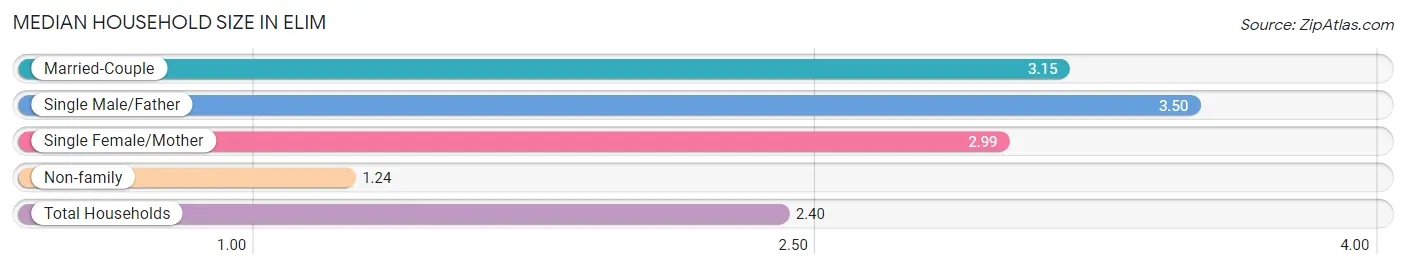
| Household Type | # Households | Household Size |
| Married-Couple | 807 (54.5%) | 3.15 |
| Single Male/Father | 22 (1.5%) | 3.50 |
| Single Female/Mother | 74 (5.0%) | 2.99 |
| Non-family | 578 (39.0%) | 1.24 |
| Total Households | 1,481 (100.0%) | 2.40 |
Household Size by Marriage Status in Elim
Out of a total of 1,481 households in Elim, 903 (61.0%) are family households, while 578 (39.0%) are nonfamily households. The most numerous type of family households are 2-person households, comprising 446, and the most common type of nonfamily households are 1-person households, comprising 447.
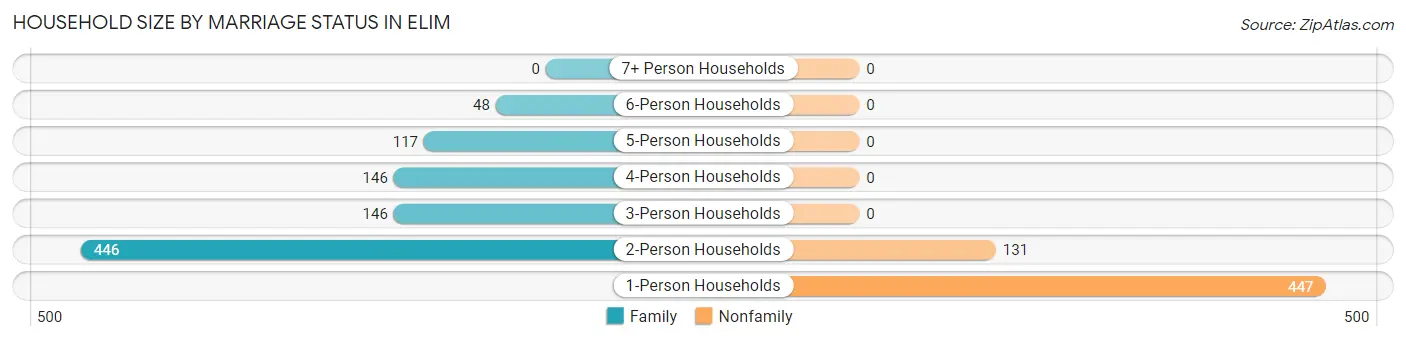
| Household Size | Family Households | Nonfamily Households |
| 1-Person Households | - | 447 (30.2%) |
| 2-Person Households | 446 (30.1%) | 131 (8.8%) |
| 3-Person Households | 146 (9.9%) | 0 (0.0%) |
| 4-Person Households | 146 (9.9%) | 0 (0.0%) |
| 5-Person Households | 117 (7.9%) | 0 (0.0%) |
| 6-Person Households | 48 (3.2%) | 0 (0.0%) |
| 7+ Person Households | 0 (0.0%) | 0 (0.0%) |
| Total | 903 (61.0%) | 578 (39.0%) |
Female Fertility in Elim
Fertility by Age in Elim
| Age Bracket | Women with Births | Births / 1,000 Women |
| 15 to 19 years | 0 (0.0%) | 0.0 |
| 20 to 34 years | 0 (0.0%) | 0.0 |
| 35 to 50 years | 0 (0.0%) | 0.0 |
| Total | 0 (0.0%) | 0.0 |
Fertility by Age by Marriage Status in Elim
| Age Bracket | Married | Unmarried |
| 15 to 19 years | 0 (0.0%) | 0 (0.0%) |
| 20 to 34 years | 0 (0.0%) | 0 (0.0%) |
| 35 to 50 years | 0 (0.0%) | 0 (0.0%) |
| Total | 0 (0.0%) | 0 (0.0%) |
Fertility by Education in Elim
| Educational Attainment | Women with Births | Births / 1,000 Women |
| Less than High School | 0 (0.0%) | 0.0 |
| High School Diploma | 0 (0.0%) | 0.0 |
| College or Associate's Degree | 0 (0.0%) | 0.0 |
| Bachelor's Degree | 0 (0.0%) | 0.0 |
| Graduate Degree | 0 (0.0%) | 0.0 |
| Total | 0 (0.0%) | 0.0 |
Fertility by Education by Marriage Status in Elim
| Educational Attainment | Married | Unmarried |
| Less than High School | 0 (0.0%) | 0 (0.0%) |
| High School Diploma | 0 (0.0%) | 0 (0.0%) |
| College or Associate's Degree | 0 (0.0%) | 0 (0.0%) |
| Bachelor's Degree | 0 (0.0%) | 0 (0.0%) |
| Graduate Degree | 0 (0.0%) | 0 (0.0%) |
| Total | 0 (0.0%) | 0 (0.0%) |
Employment Characteristics in Elim
Employment by Class of Employer in Elim
Among the 1,683 employed individuals in Elim, private company employees (1,302 | 77.4%), not-for-profit organizations (180 | 10.7%), and federal government employees (114 | 6.8%) make up the most common classes of employment.
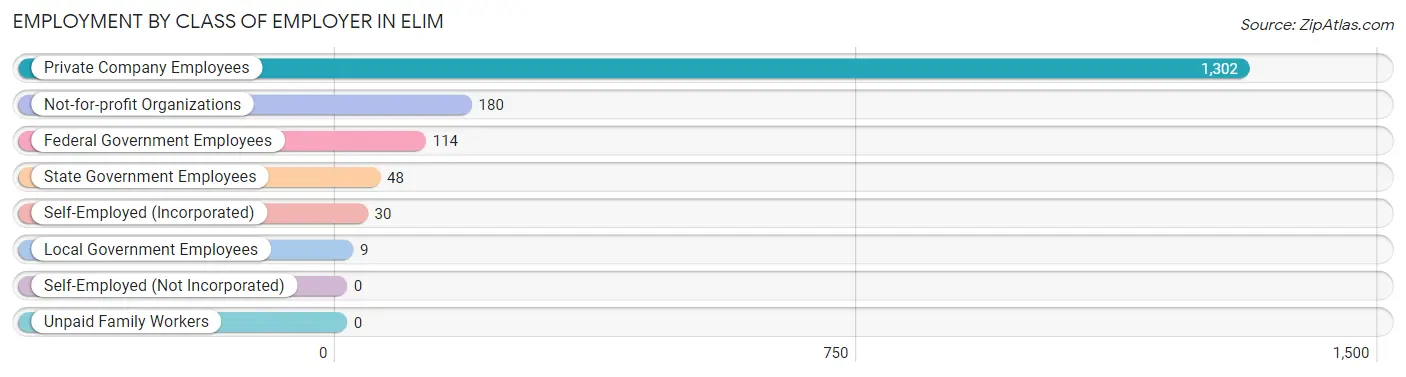
| Employer Class | # Employees | % Employees |
| Private Company Employees | 1,302 | 77.4% |
| Self-Employed (Incorporated) | 30 | 1.8% |
| Self-Employed (Not Incorporated) | 0 | 0.0% |
| Not-for-profit Organizations | 180 | 10.7% |
| Local Government Employees | 9 | 0.5% |
| State Government Employees | 48 | 2.9% |
| Federal Government Employees | 114 | 6.8% |
| Unpaid Family Workers | 0 | 0.0% |
| Total | 1,683 | 100.0% |
Employment Status by Age in Elim
According to the labor force statistics for Elim, out of the total population over 16 years of age (3,011), 59.5% or 1,792 individuals are in the labor force, with 6.1% or 109 of them unemployed. The age group with the highest labor force participation rate is 25 to 29 years, with 97.9% or 137 individuals in the labor force. Within the labor force, the 16 to 19 years age range has the highest percentage of unemployed individuals, with 21.3% or 19 of them being unemployed.
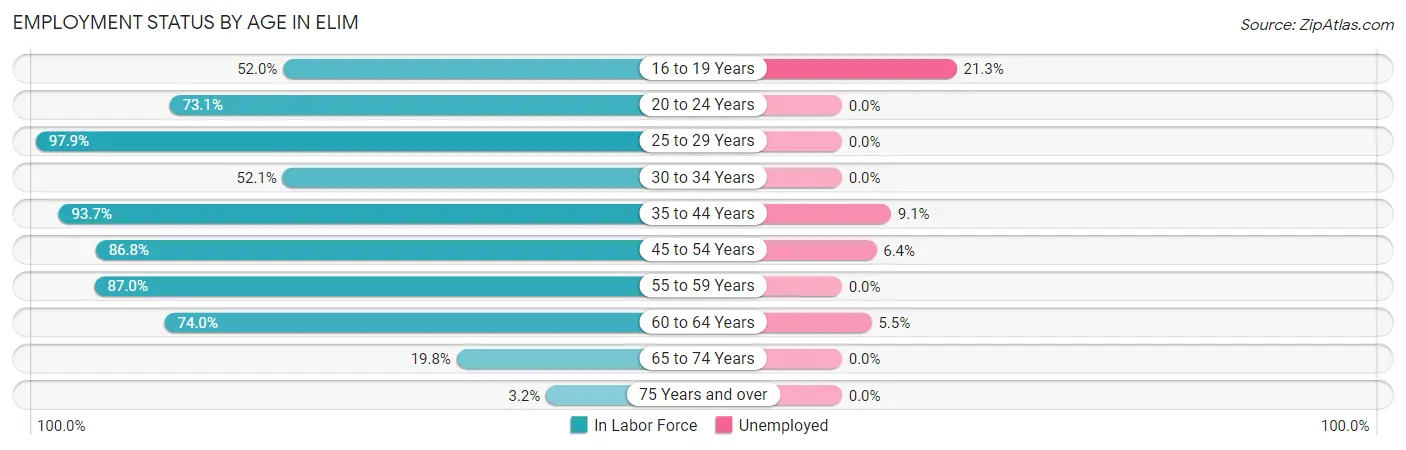
| Age Bracket | In Labor Force | Unemployed |
| 16 to 19 Years | 89 (52.0%) | 19 (21.3%) |
| 20 to 24 Years | 49 (73.1%) | 0 (0.0%) |
| 25 to 29 Years | 137 (97.9%) | 0 (0.0%) |
| 30 to 34 Years | 62 (52.1%) | 0 (0.0%) |
| 35 to 44 Years | 683 (93.7%) | 62 (9.1%) |
| 45 to 54 Years | 297 (86.8%) | 19 (6.4%) |
| 55 to 59 Years | 188 (87.0%) | 0 (0.0%) |
| 60 to 64 Years | 182 (74.0%) | 10 (5.5%) |
| 65 to 74 Years | 89 (19.8%) | 0 (0.0%) |
| 75 Years and over | 17 (3.2%) | 0 (0.0%) |
| Total | 1,792 (59.5%) | 109 (6.1%) |
Employment Status by Educational Attainment in Elim
According to labor force statistics for Elim, 86.4% of individuals (1,548) out of the total population between 25 and 64 years of age (1,792) are in the labor force, with 5.9% or 91 of them being unemployed. The group with the highest labor force participation rate are those with the educational attainment of bachelor's degree or higher, with 94.7% or 339 individuals in the labor force. Within the labor force, individuals with high school diploma education have the highest percentage of unemployment, with 15.2% or 91 of them being unemployed.
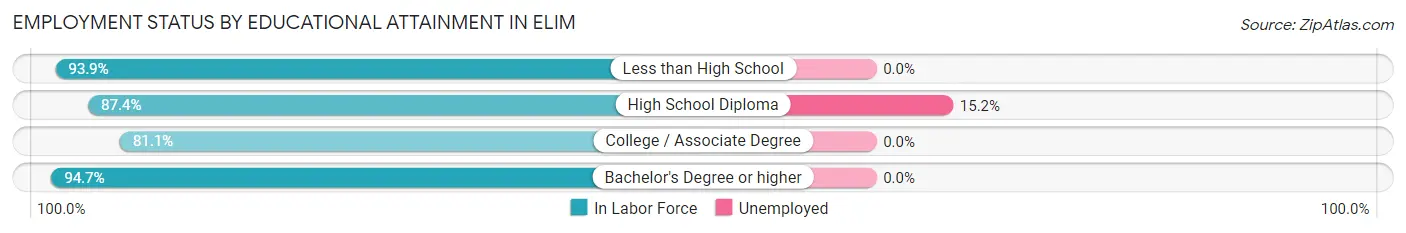
| Educational Attainment | In Labor Force | Unemployed |
| Less than High School | 31 (93.9%) | 0 (0.0%) |
| High School Diploma | 597 (87.4%) | 104 (15.2%) |
| College / Associate Degree | 582 (81.1%) | 0 (0.0%) |
| Bachelor's Degree or higher | 339 (94.7%) | 0 (0.0%) |
| Total | 1,548 (86.4%) | 106 (5.9%) |
Employment Occupations by Sex in Elim
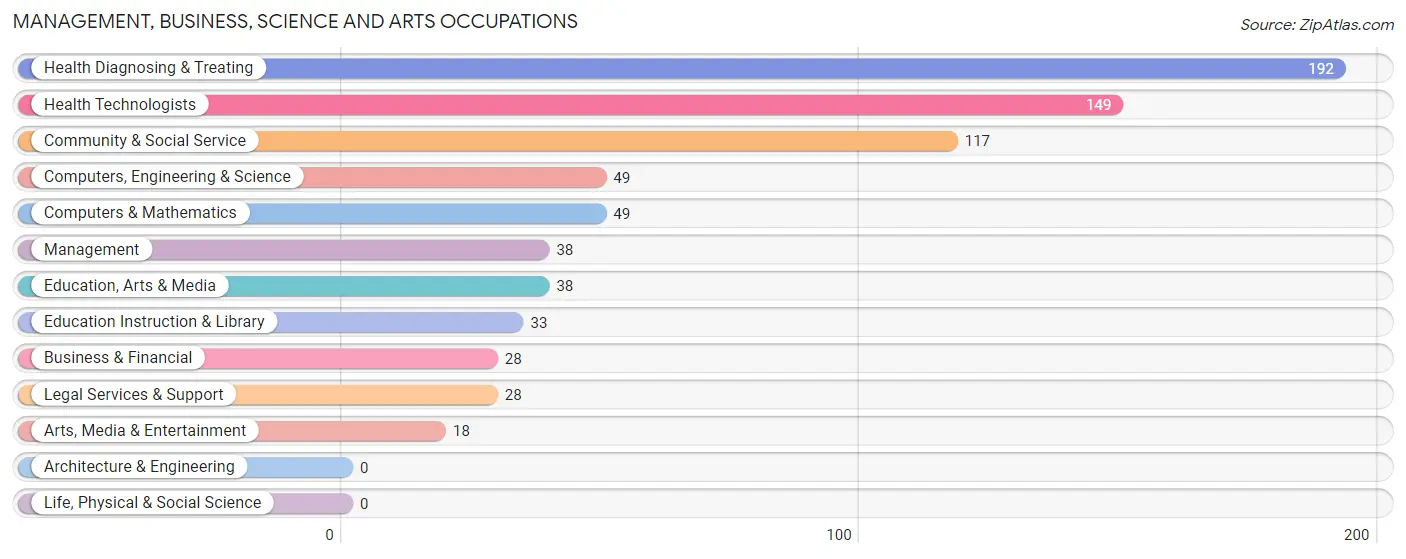
Management, Business, Science and Arts Occupations
The most common Management, Business, Science and Arts occupations in Elim are Health Diagnosing & Treating (192 | 11.4%), Health Technologists (149 | 8.8%), Community & Social Service (117 | 7.0%), Computers, Engineering & Science (49 | 2.9%), and Computers & Mathematics (49 | 2.9%).
Management, Business, Science and Arts Occupations by Sex
Within the Management, Business, Science and Arts occupations in Elim, the most male-oriented occupations are Business & Financial (75.0%), Education Instruction & Library (33.3%), and Management (28.9%), while the most female-oriented occupations are Computers, Engineering & Science (100.0%), Computers & Mathematics (100.0%), and Education, Arts & Media (100.0%).
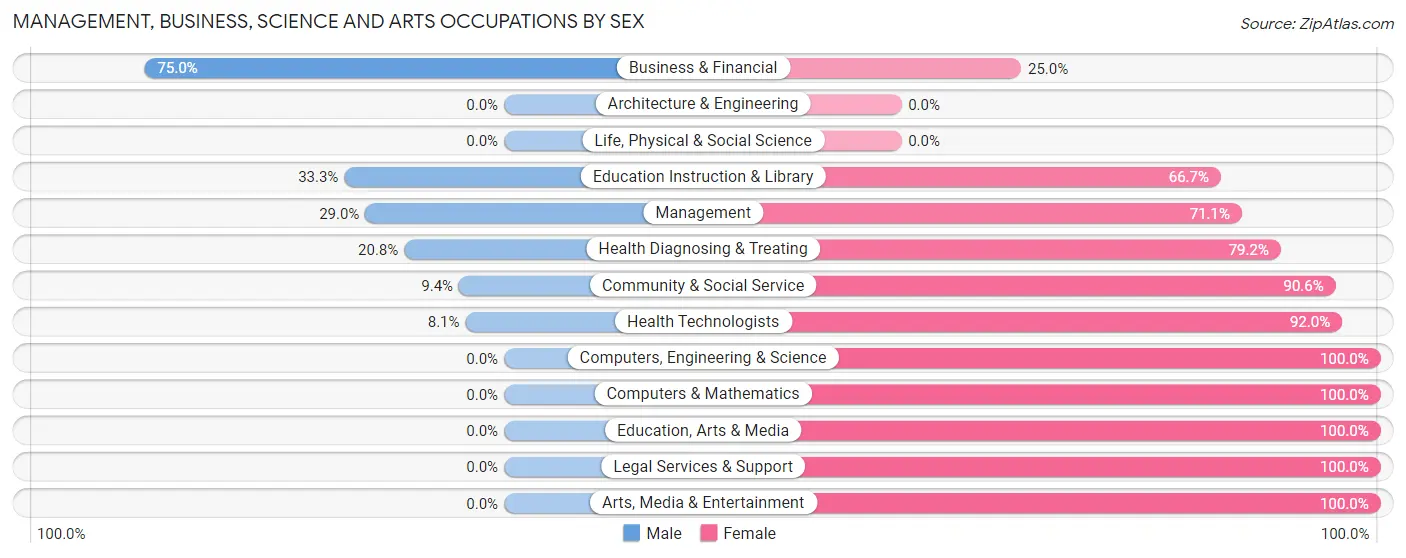
| Occupation | Male | Female |
| Management | 11 (28.9%) | 27 (71.1%) |
| Business & Financial | 21 (75.0%) | 7 (25.0%) |
| Computers, Engineering & Science | 0 (0.0%) | 49 (100.0%) |
| Computers & Mathematics | 0 (0.0%) | 49 (100.0%) |
| Architecture & Engineering | 0 (0.0%) | 0 (0.0%) |
| Life, Physical & Social Science | 0 (0.0%) | 0 (0.0%) |
| Community & Social Service | 11 (9.4%) | 106 (90.6%) |
| Education, Arts & Media | 0 (0.0%) | 38 (100.0%) |
| Legal Services & Support | 0 (0.0%) | 28 (100.0%) |
| Education Instruction & Library | 11 (33.3%) | 22 (66.7%) |
| Arts, Media & Entertainment | 0 (0.0%) | 18 (100.0%) |
| Health Diagnosing & Treating | 40 (20.8%) | 152 (79.2%) |
| Health Technologists | 12 (8.1%) | 137 (91.9%) |
| Total (Category) | 83 (19.6%) | 341 (80.4%) |
| Total (Overall) | 796 (47.3%) | 887 (52.7%) |
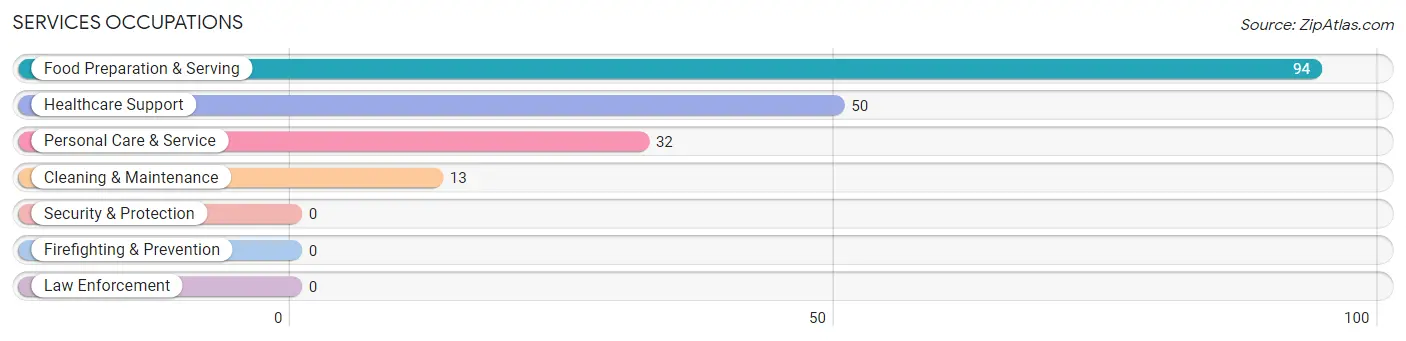
Services Occupations
The most common Services occupations in Elim are Food Preparation & Serving (94 | 5.6%), Healthcare Support (50 | 3.0%), Personal Care & Service (32 | 1.9%), and Cleaning & Maintenance (13 | 0.8%).
Services Occupations by Sex
Within the Services occupations in Elim, the most male-oriented occupations are Cleaning & Maintenance (100.0%), Healthcare Support (58.0%), and Food Preparation & Serving (14.9%), while the most female-oriented occupations are Personal Care & Service (100.0%), Food Preparation & Serving (85.1%), and Healthcare Support (42.0%).
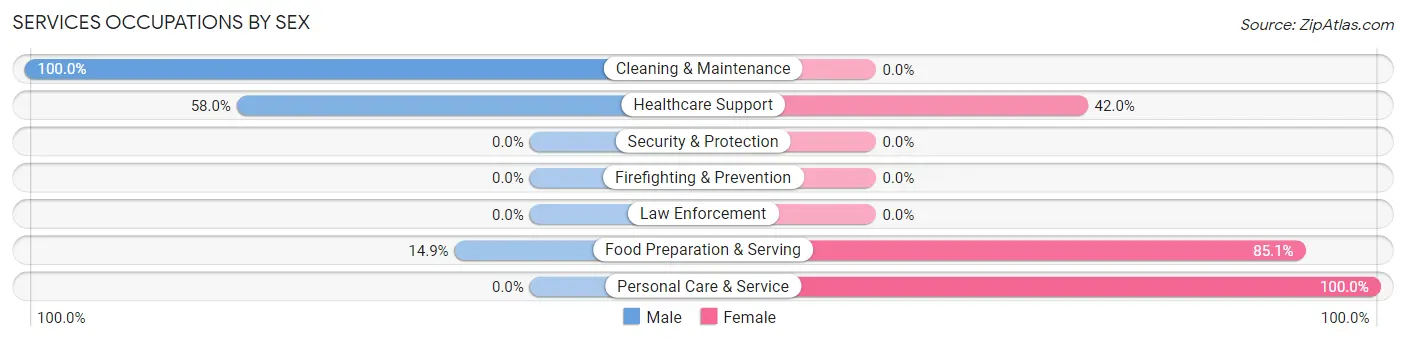
| Occupation | Male | Female |
| Healthcare Support | 29 (58.0%) | 21 (42.0%) |
| Security & Protection | 0 (0.0%) | 0 (0.0%) |
| Firefighting & Prevention | 0 (0.0%) | 0 (0.0%) |
| Law Enforcement | 0 (0.0%) | 0 (0.0%) |
| Food Preparation & Serving | 14 (14.9%) | 80 (85.1%) |
| Cleaning & Maintenance | 13 (100.0%) | 0 (0.0%) |
| Personal Care & Service | 0 (0.0%) | 32 (100.0%) |
| Total (Category) | 56 (29.6%) | 133 (70.4%) |
| Total (Overall) | 796 (47.3%) | 887 (52.7%) |
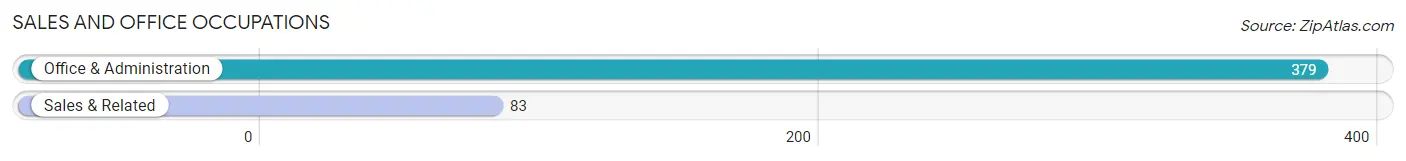
Sales and Office Occupations
The most common Sales and Office occupations in Elim are Office & Administration (379 | 22.5%), and Sales & Related (83 | 4.9%).
Sales and Office Occupations by Sex
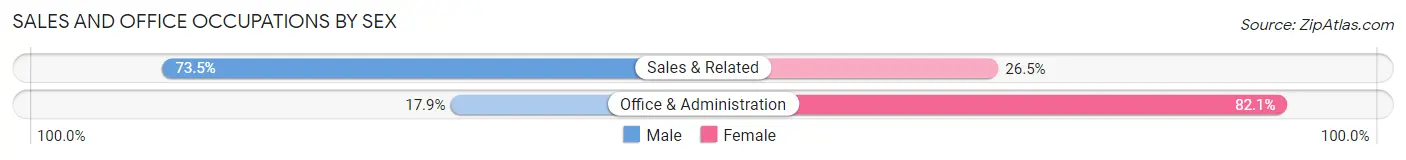
| Occupation | Male | Female |
| Sales & Related | 61 (73.5%) | 22 (26.5%) |
| Office & Administration | 68 (17.9%) | 311 (82.1%) |
| Total (Category) | 129 (27.9%) | 333 (72.1%) |
| Total (Overall) | 796 (47.3%) | 887 (52.7%) |
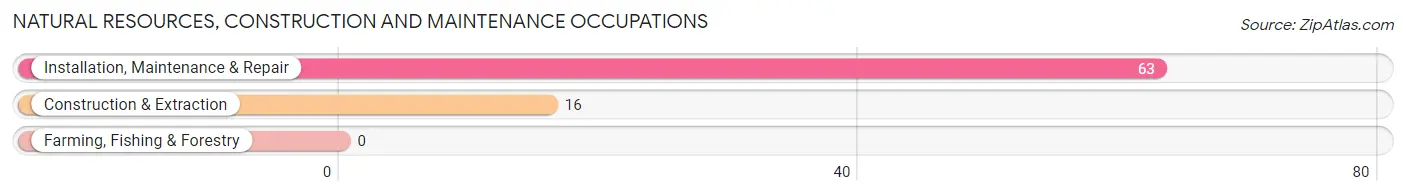
Natural Resources, Construction and Maintenance Occupations
The most common Natural Resources, Construction and Maintenance occupations in Elim are Installation, Maintenance & Repair (63 | 3.7%), and Construction & Extraction (16 | 0.9%).
Natural Resources, Construction and Maintenance Occupations by Sex
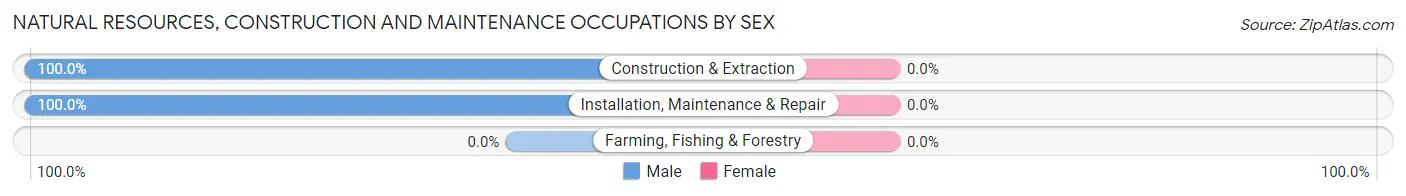
| Occupation | Male | Female |
| Farming, Fishing & Forestry | 0 (0.0%) | 0 (0.0%) |
| Construction & Extraction | 16 (100.0%) | 0 (0.0%) |
| Installation, Maintenance & Repair | 63 (100.0%) | 0 (0.0%) |
| Total (Category) | 79 (100.0%) | 0 (0.0%) |
| Total (Overall) | 796 (47.3%) | 887 (52.7%) |
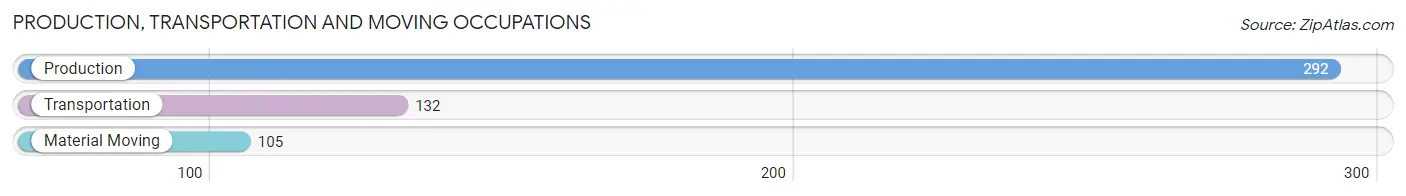
Production, Transportation and Moving Occupations
The most common Production, Transportation and Moving occupations in Elim are Production (292 | 17.3%), Transportation (132 | 7.8%), and Material Moving (105 | 6.2%).
Production, Transportation and Moving Occupations by Sex
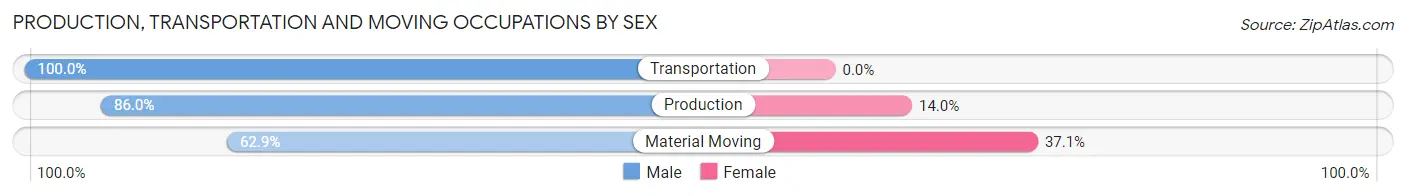
| Occupation | Male | Female |
| Production | 251 (86.0%) | 41 (14.0%) |
| Transportation | 132 (100.0%) | 0 (0.0%) |
| Material Moving | 66 (62.9%) | 39 (37.1%) |
| Total (Category) | 449 (84.9%) | 80 (15.1%) |
| Total (Overall) | 796 (47.3%) | 887 (52.7%) |
Employment Industries by Sex in Elim
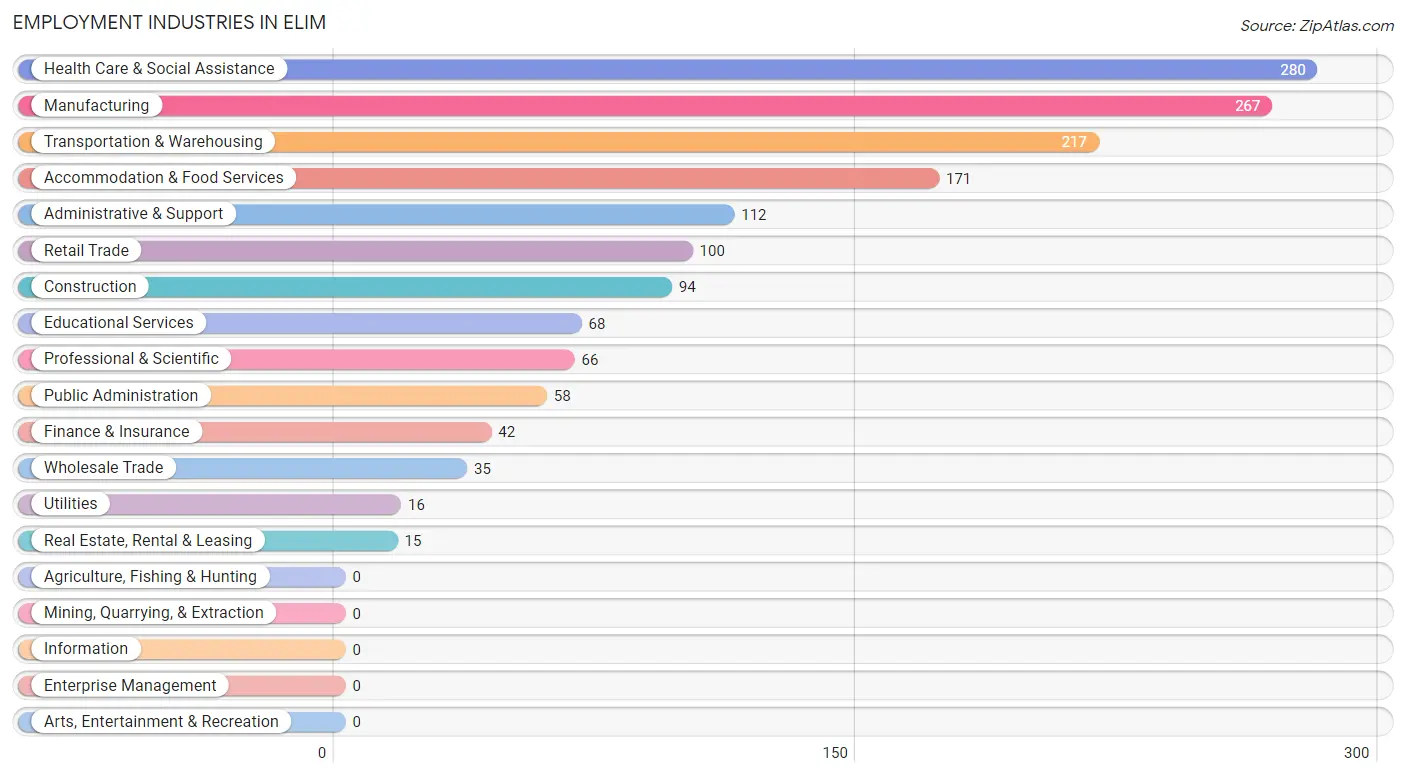
Employment Industries in Elim
The major employment industries in Elim include Health Care & Social Assistance (280 | 16.6%), Manufacturing (267 | 15.9%), Transportation & Warehousing (217 | 12.9%), Accommodation & Food Services (171 | 10.2%), and Administrative & Support (112 | 6.7%).
Employment Industries by Sex in Elim
The Elim industries that see more men than women are Wholesale Trade (100.0%), Utilities (100.0%), and Real Estate, Rental & Leasing (100.0%), whereas the industries that tend to have a higher number of women are Finance & Insurance (100.0%), Accommodation & Food Services (91.8%), and Educational Services (83.8%).
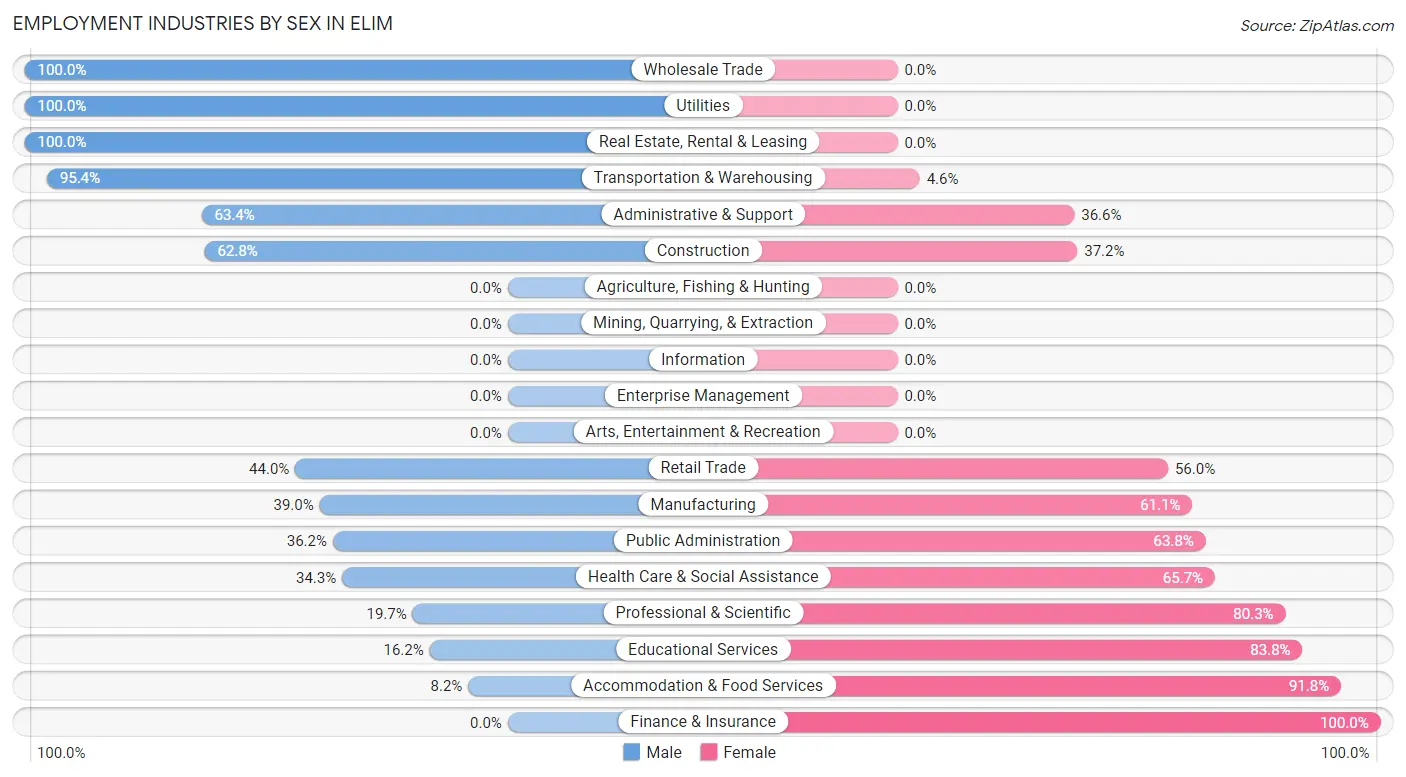
| Industry | Male | Female |
| Agriculture, Fishing & Hunting | 0 (0.0%) | 0 (0.0%) |
| Mining, Quarrying, & Extraction | 0 (0.0%) | 0 (0.0%) |
| Construction | 59 (62.8%) | 35 (37.2%) |
| Manufacturing | 104 (39.0%) | 163 (61.1%) |
| Wholesale Trade | 35 (100.0%) | 0 (0.0%) |
| Retail Trade | 44 (44.0%) | 56 (56.0%) |
| Transportation & Warehousing | 207 (95.4%) | 10 (4.6%) |
| Utilities | 16 (100.0%) | 0 (0.0%) |
| Information | 0 (0.0%) | 0 (0.0%) |
| Finance & Insurance | 0 (0.0%) | 42 (100.0%) |
| Real Estate, Rental & Leasing | 15 (100.0%) | 0 (0.0%) |
| Professional & Scientific | 13 (19.7%) | 53 (80.3%) |
| Enterprise Management | 0 (0.0%) | 0 (0.0%) |
| Administrative & Support | 71 (63.4%) | 41 (36.6%) |
| Educational Services | 11 (16.2%) | 57 (83.8%) |
| Health Care & Social Assistance | 96 (34.3%) | 184 (65.7%) |
| Arts, Entertainment & Recreation | 0 (0.0%) | 0 (0.0%) |
| Accommodation & Food Services | 14 (8.2%) | 157 (91.8%) |
| Public Administration | 21 (36.2%) | 37 (63.8%) |
| Total | 796 (47.3%) | 887 (52.7%) |
Education in Elim
School Enrollment in Elim
The most common levels of schooling among the 783 students in Elim are middle school (356 | 45.5%), high school (253 | 32.3%), and nursery / preschool (80 | 10.2%).
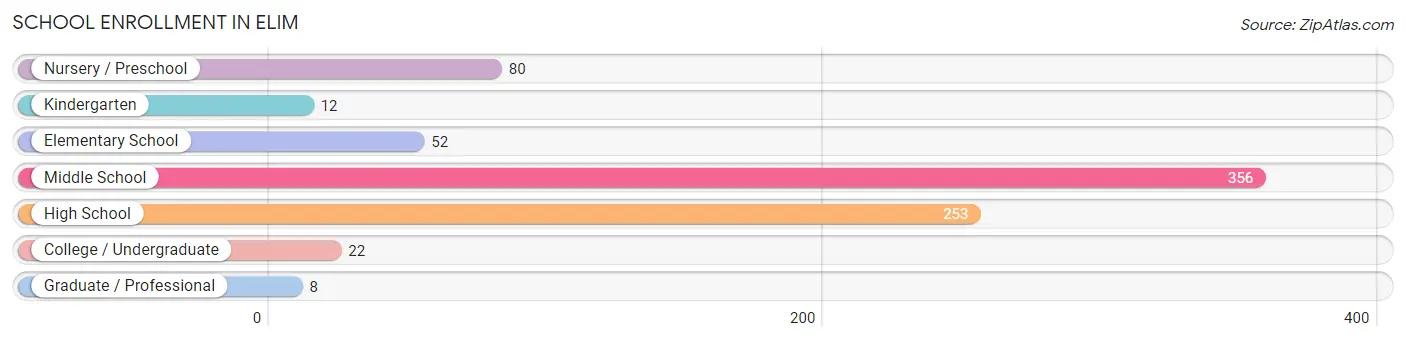
| School Level | # Students | % Students |
| Nursery / Preschool | 80 | 10.2% |
| Kindergarten | 12 | 1.5% |
| Elementary School | 52 | 6.6% |
| Middle School | 356 | 45.5% |
| High School | 253 | 32.3% |
| College / Undergraduate | 22 | 2.8% |
| Graduate / Professional | 8 | 1.0% |
| Total | 783 | 100.0% |
School Enrollment by Age by Funding Source in Elim
Out of a total of 783 students who are enrolled in schools in Elim, 203 (25.9%) attend a private institution, while the remaining 580 (74.1%) are enrolled in public schools. The age group of 35 years and over has the highest likelihood of being enrolled in private schools, with 8 (100.0% in the age bracket) enrolled. Conversely, the age group of 20 to 24 year olds has the lowest likelihood of being enrolled in a private school, with 1 (100.0% in the age bracket) attending a public institution.
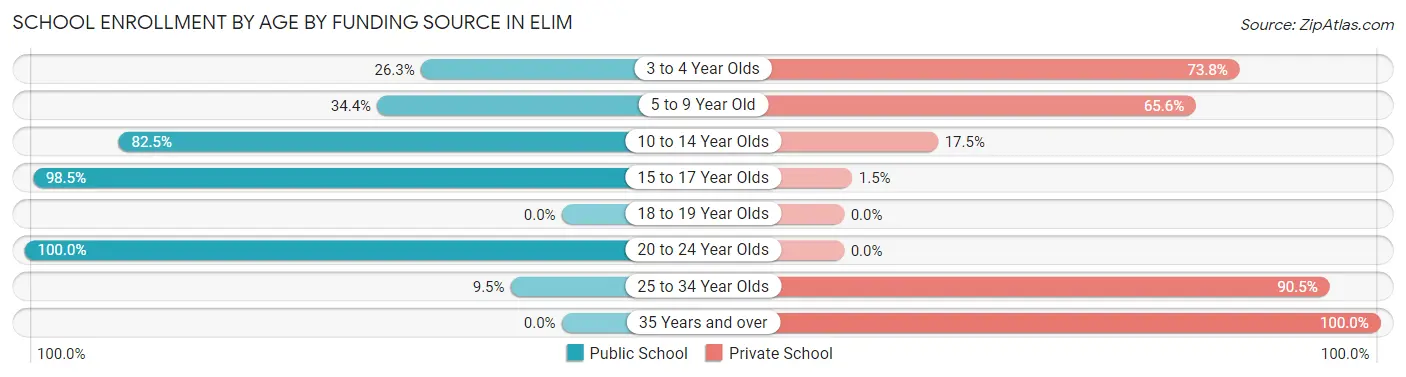
| Age Bracket | Public School | Private School |
| 3 to 4 Year Olds | 21 (26.3%) | 59 (73.8%) |
| 5 to 9 Year Old | 22 (34.4%) | 42 (65.6%) |
| 10 to 14 Year Olds | 339 (82.5%) | 72 (17.5%) |
| 15 to 17 Year Olds | 195 (98.5%) | 3 (1.5%) |
| 18 to 19 Year Olds | 0 (0.0%) | 0 (0.0%) |
| 20 to 24 Year Olds | 1 (100.0%) | 0 (0.0%) |
| 25 to 34 Year Olds | 2 (9.5%) | 19 (90.5%) |
| 35 Years and over | 0 (0.0%) | 8 (100.0%) |
| Total | 580 (74.1%) | 203 (25.9%) |
Educational Attainment by Field of Study in Elim
Education (191 | 28.2%), business (119 | 17.5%), science & technology (107 | 15.8%), social sciences (95 | 14.0%), and arts & humanities (45 | 6.6%) are the most common fields of study among 678 individuals in Elim who have obtained a bachelor's degree or higher.
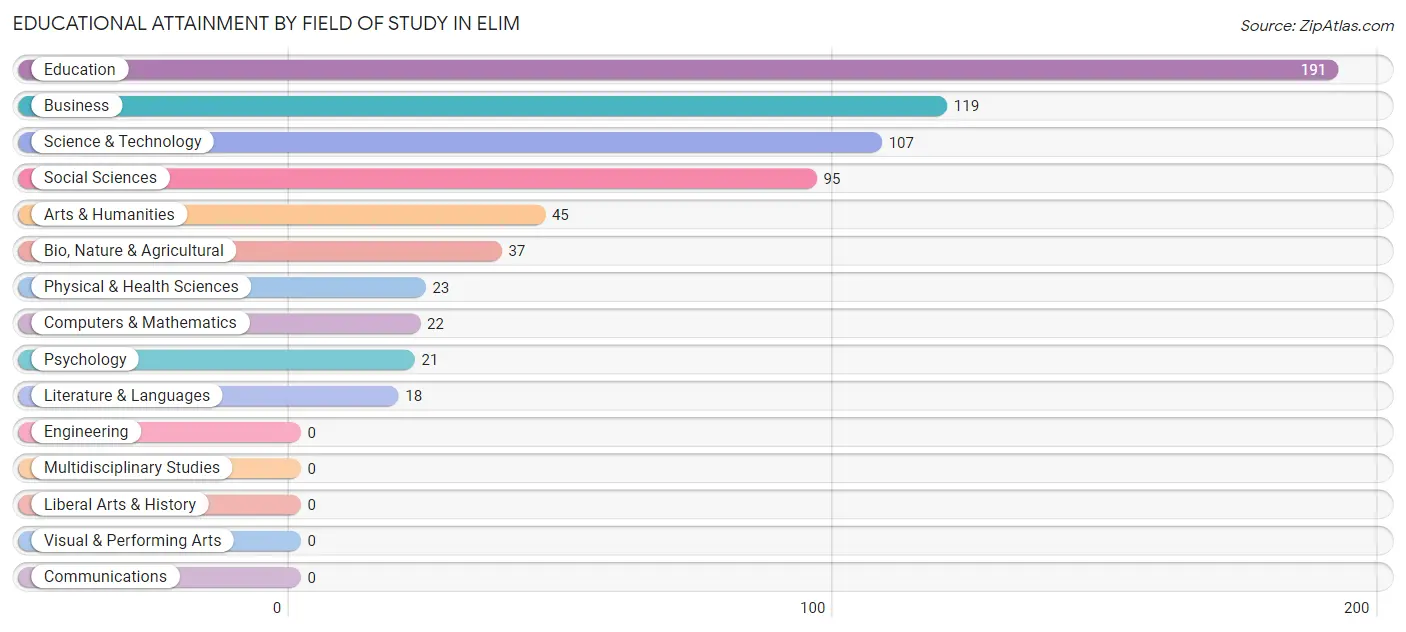
| Field of Study | # Graduates | % Graduates |
| Computers & Mathematics | 22 | 3.2% |
| Bio, Nature & Agricultural | 37 | 5.5% |
| Physical & Health Sciences | 23 | 3.4% |
| Psychology | 21 | 3.1% |
| Social Sciences | 95 | 14.0% |
| Engineering | 0 | 0.0% |
| Multidisciplinary Studies | 0 | 0.0% |
| Science & Technology | 107 | 15.8% |
| Business | 119 | 17.5% |
| Education | 191 | 28.2% |
| Literature & Languages | 18 | 2.6% |
| Liberal Arts & History | 0 | 0.0% |
| Visual & Performing Arts | 0 | 0.0% |
| Communications | 0 | 0.0% |
| Arts & Humanities | 45 | 6.6% |
| Total | 678 | 100.0% |
Transportation & Commute in Elim
Vehicle Availability by Sex in Elim
The most prevalent vehicle ownership categories in Elim are males with 2 vehicles (287, accounting for 36.1%) and females with 2 vehicles (315, making up 32.4%).
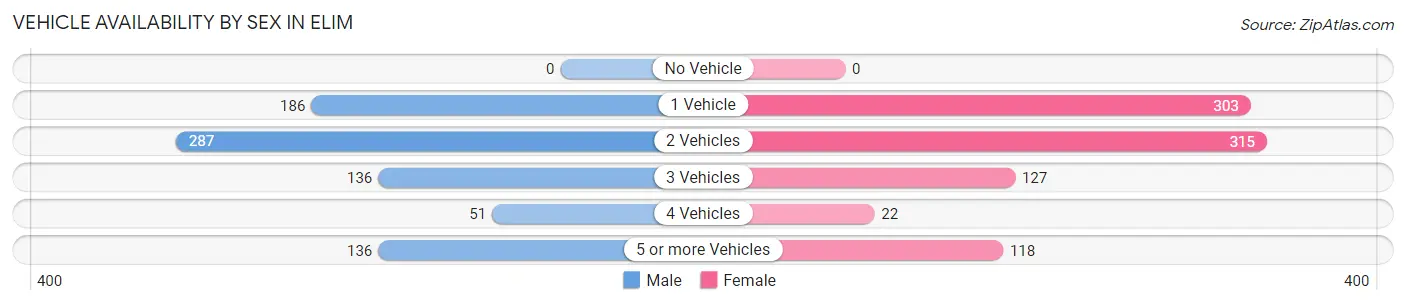
| Vehicles Available | Male | Female |
| No Vehicle | 0 (0.0%) | 0 (0.0%) |
| 1 Vehicle | 186 (23.4%) | 303 (34.2%) |
| 2 Vehicles | 287 (36.1%) | 315 (35.6%) |
| 3 Vehicles | 136 (17.1%) | 127 (14.3%) |
| 4 Vehicles | 51 (6.4%) | 22 (2.5%) |
| 5 or more Vehicles | 136 (17.1%) | 118 (13.3%) |
| Total | 796 (100.0%) | 885 (100.0%) |
Commute Time in Elim
The most frequently occuring commute durations in Elim are 10 to 14 minutes (442 commuters, 31.7%), 15 to 19 minutes (271 commuters, 19.5%), and 5 to 9 minutes (157 commuters, 11.3%).
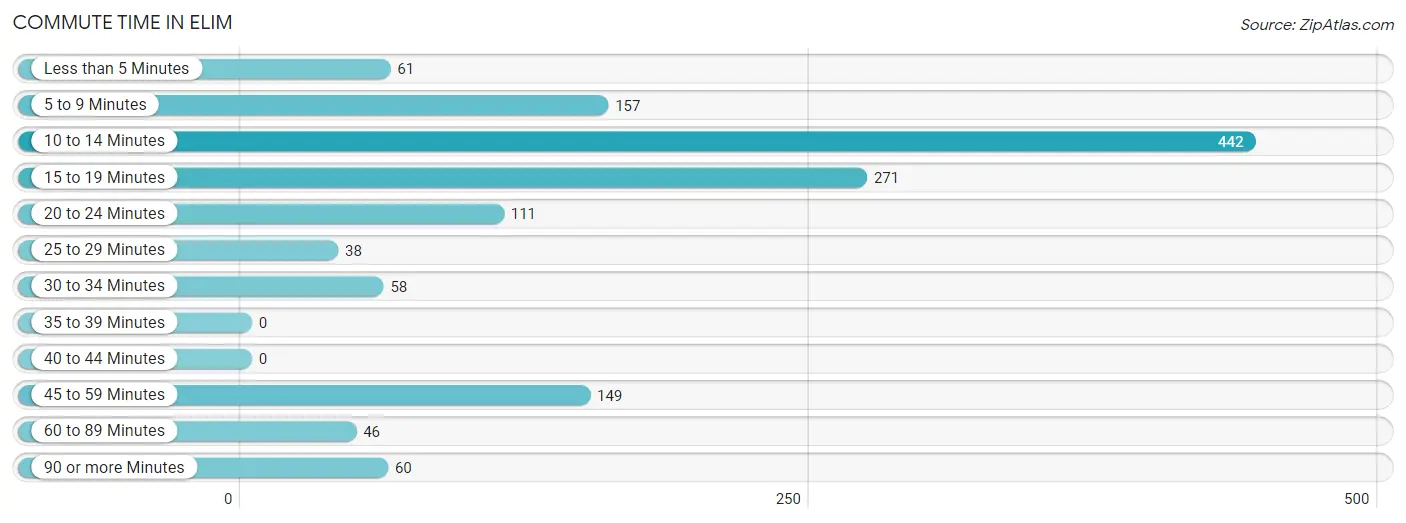
| Commute Time | # Commuters | % Commuters |
| Less than 5 Minutes | 61 | 4.4% |
| 5 to 9 Minutes | 157 | 11.3% |
| 10 to 14 Minutes | 442 | 31.7% |
| 15 to 19 Minutes | 271 | 19.5% |
| 20 to 24 Minutes | 111 | 8.0% |
| 25 to 29 Minutes | 38 | 2.7% |
| 30 to 34 Minutes | 58 | 4.2% |
| 35 to 39 Minutes | 0 | 0.0% |
| 40 to 44 Minutes | 0 | 0.0% |
| 45 to 59 Minutes | 149 | 10.7% |
| 60 to 89 Minutes | 46 | 3.3% |
| 90 or more Minutes | 60 | 4.3% |
Commute Time by Sex in Elim
The most common commute times in Elim are 10 to 14 minutes (238 commuters, 31.8%) for males and 10 to 14 minutes (204 commuters, 31.6%) for females.
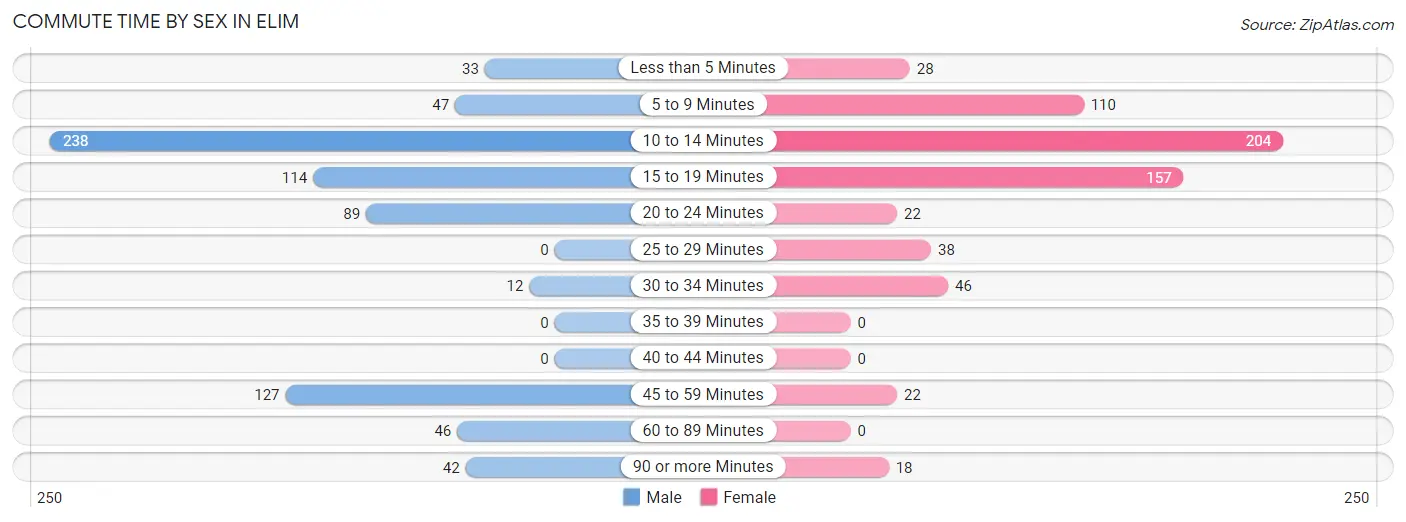
| Commute Time | Male | Female |
| Less than 5 Minutes | 33 (4.4%) | 28 (4.3%) |
| 5 to 9 Minutes | 47 (6.3%) | 110 (17.1%) |
| 10 to 14 Minutes | 238 (31.8%) | 204 (31.6%) |
| 15 to 19 Minutes | 114 (15.2%) | 157 (24.3%) |
| 20 to 24 Minutes | 89 (11.9%) | 22 (3.4%) |
| 25 to 29 Minutes | 0 (0.0%) | 38 (5.9%) |
| 30 to 34 Minutes | 12 (1.6%) | 46 (7.1%) |
| 35 to 39 Minutes | 0 (0.0%) | 0 (0.0%) |
| 40 to 44 Minutes | 0 (0.0%) | 0 (0.0%) |
| 45 to 59 Minutes | 127 (17.0%) | 22 (3.4%) |
| 60 to 89 Minutes | 46 (6.1%) | 0 (0.0%) |
| 90 or more Minutes | 42 (5.6%) | 18 (2.8%) |
Time of Departure to Work by Sex in Elim
The most frequent times of departure to work in Elim are 12:00 AM to 4:59 AM (127, 17.0%) for males and 7:30 AM to 7:59 AM (152, 23.6%) for females.
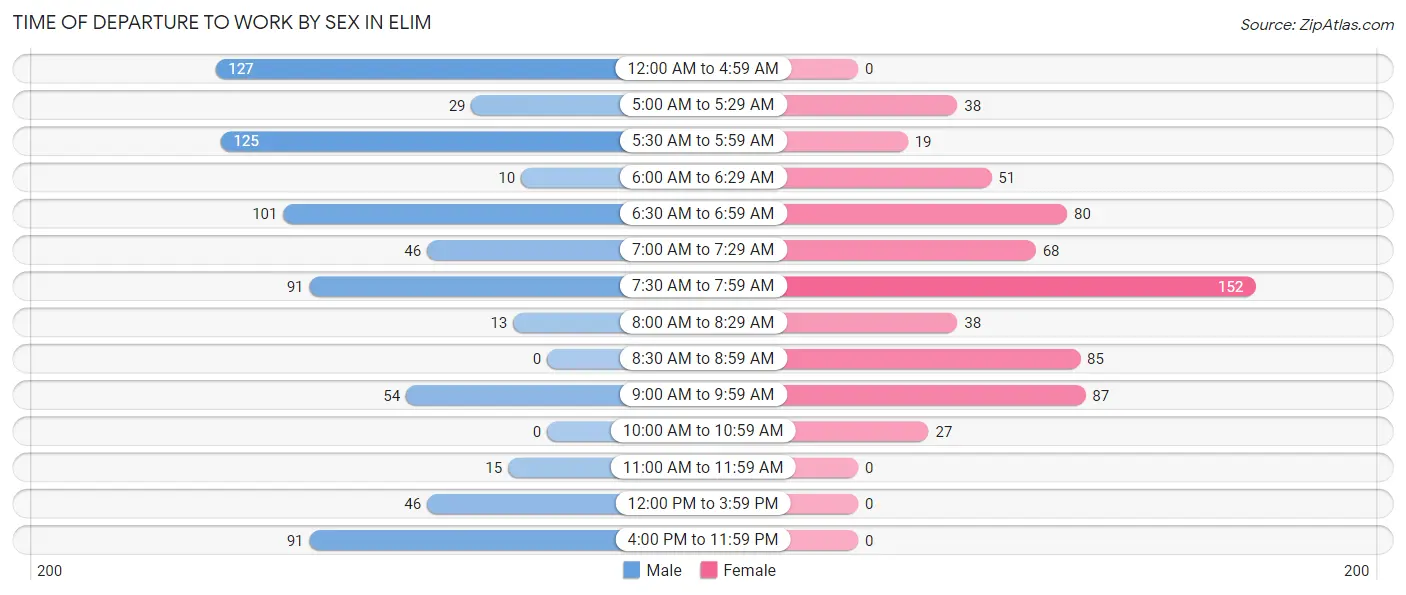
| Time of Departure | Male | Female |
| 12:00 AM to 4:59 AM | 127 (17.0%) | 0 (0.0%) |
| 5:00 AM to 5:29 AM | 29 (3.9%) | 38 (5.9%) |
| 5:30 AM to 5:59 AM | 125 (16.7%) | 19 (2.9%) |
| 6:00 AM to 6:29 AM | 10 (1.3%) | 51 (7.9%) |
| 6:30 AM to 6:59 AM | 101 (13.5%) | 80 (12.4%) |
| 7:00 AM to 7:29 AM | 46 (6.1%) | 68 (10.5%) |
| 7:30 AM to 7:59 AM | 91 (12.2%) | 152 (23.6%) |
| 8:00 AM to 8:29 AM | 13 (1.7%) | 38 (5.9%) |
| 8:30 AM to 8:59 AM | 0 (0.0%) | 85 (13.2%) |
| 9:00 AM to 9:59 AM | 54 (7.2%) | 87 (13.5%) |
| 10:00 AM to 10:59 AM | 0 (0.0%) | 27 (4.2%) |
| 11:00 AM to 11:59 AM | 15 (2.0%) | 0 (0.0%) |
| 12:00 PM to 3:59 PM | 46 (6.1%) | 0 (0.0%) |
| 4:00 PM to 11:59 PM | 91 (12.2%) | 0 (0.0%) |
| Total | 748 (100.0%) | 645 (100.0%) |
Housing Occupancy in Elim
Occupancy by Ownership in Elim
Of the total 1,481 dwellings in Elim, owner-occupied units account for 1,092 (73.7%), while renter-occupied units make up 389 (26.3%).
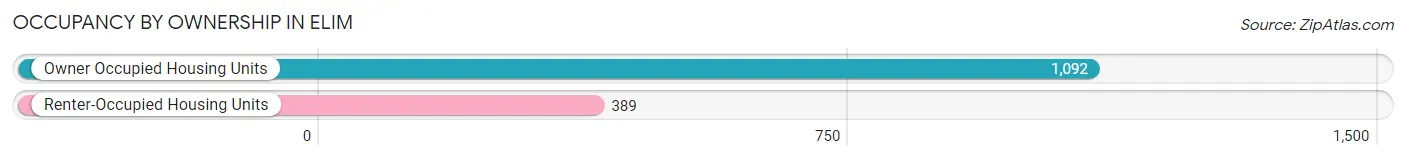
| Occupancy | # Housing Units | % Housing Units |
| Owner Occupied Housing Units | 1,092 | 73.7% |
| Renter-Occupied Housing Units | 389 | 26.3% |
| Total Occupied Housing Units | 1,481 | 100.0% |
Occupancy by Household Size in Elim
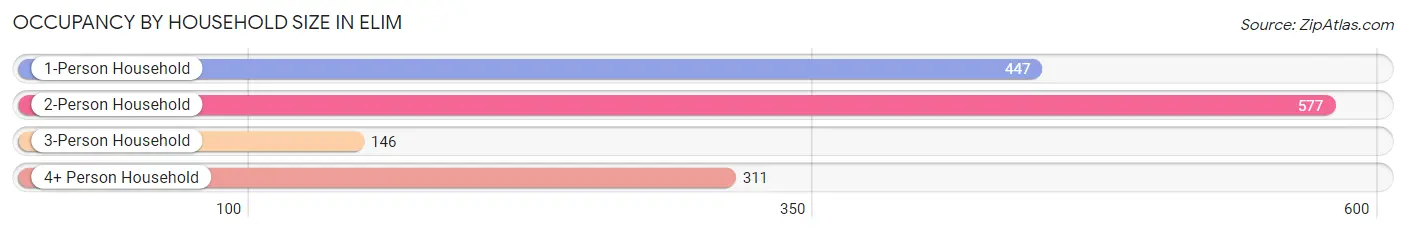
| Household Size | # Housing Units | % Housing Units |
| 1-Person Household | 447 | 30.2% |
| 2-Person Household | 577 | 39.0% |
| 3-Person Household | 146 | 9.9% |
| 4+ Person Household | 311 | 21.0% |
| Total Housing Units | 1,481 | 100.0% |
Occupancy by Ownership by Household Size in Elim
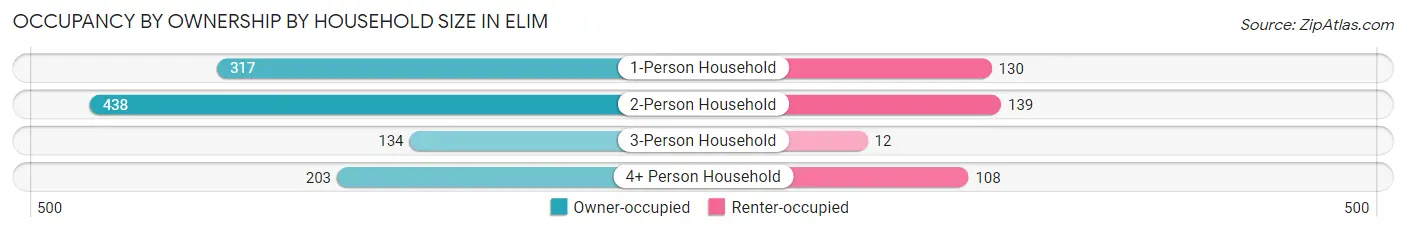
| Household Size | Owner-occupied | Renter-occupied |
| 1-Person Household | 317 (70.9%) | 130 (29.1%) |
| 2-Person Household | 438 (75.9%) | 139 (24.1%) |
| 3-Person Household | 134 (91.8%) | 12 (8.2%) |
| 4+ Person Household | 203 (65.3%) | 108 (34.7%) |
| Total Housing Units | 1,092 (73.7%) | 389 (26.3%) |
Occupancy by Educational Attainment in Elim
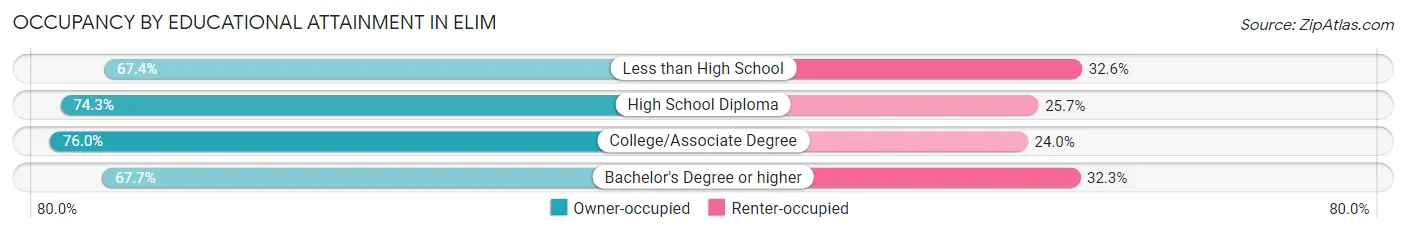
| Household Size | Owner-occupied | Renter-occupied |
| Less than High School | 31 (67.4%) | 15 (32.6%) |
| High School Diploma | 555 (74.3%) | 192 (25.7%) |
| College/Associate Degree | 370 (76.0%) | 117 (24.0%) |
| Bachelor's Degree or higher | 136 (67.7%) | 65 (32.3%) |
Occupancy by Age of Householder in Elim
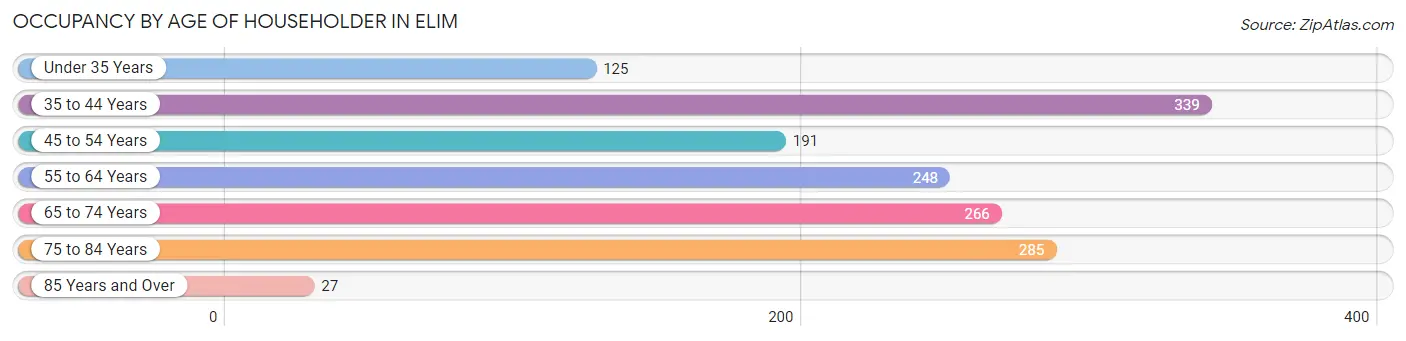
| Age Bracket | # Households | % Households |
| Under 35 Years | 125 | 8.4% |
| 35 to 44 Years | 339 | 22.9% |
| 45 to 54 Years | 191 | 12.9% |
| 55 to 64 Years | 248 | 16.8% |
| 65 to 74 Years | 266 | 18.0% |
| 75 to 84 Years | 285 | 19.2% |
| 85 Years and Over | 27 | 1.8% |
| Total | 1,481 | 100.0% |
Housing Finances in Elim
Median Income by Occupancy in Elim
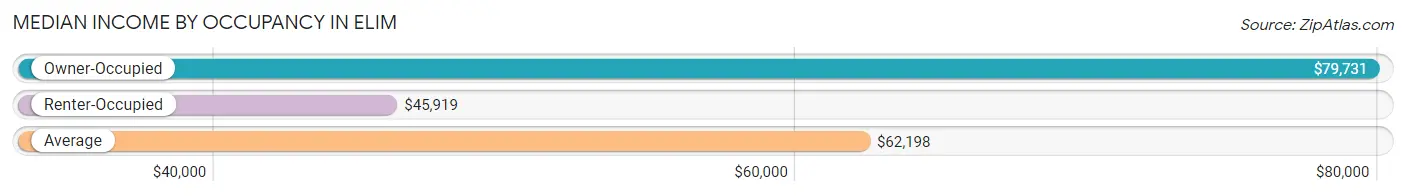
| Occupancy Type | # Households | Median Income |
| Owner-Occupied | 1,092 (73.7%) | $79,731 |
| Renter-Occupied | 389 (26.3%) | $45,919 |
| Average | 1,481 (100.0%) | $62,198 |
Occupancy by Householder Income Bracket in Elim
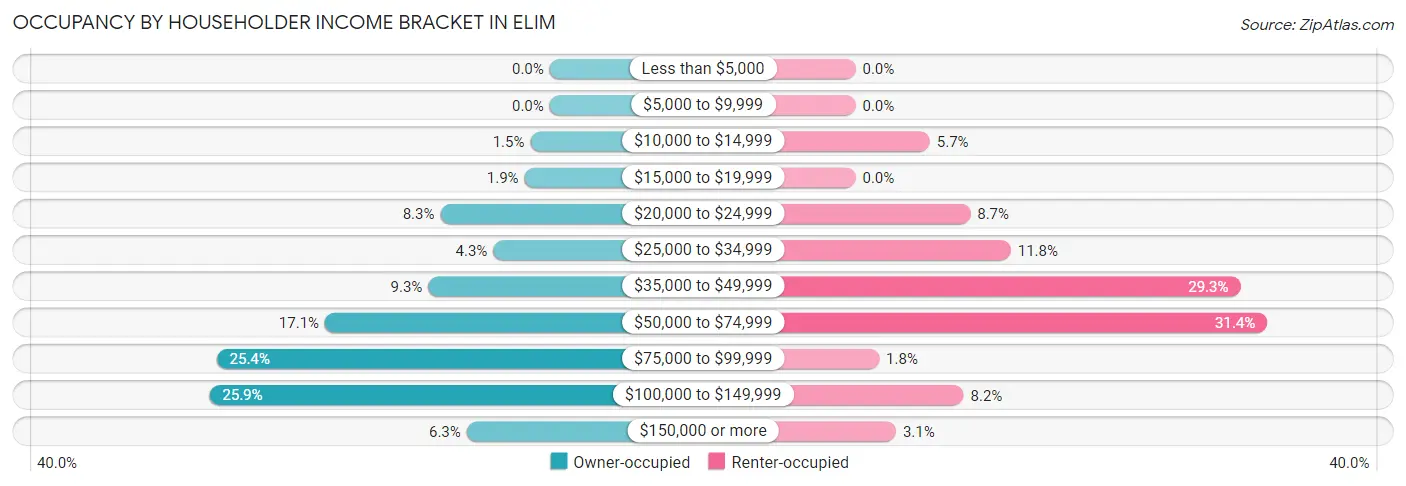
| Income Bracket | Owner-occupied | Renter-occupied |
| Less than $5,000 | 0 (0.0%) | 0 (0.0%) |
| $5,000 to $9,999 | 0 (0.0%) | 0 (0.0%) |
| $10,000 to $14,999 | 16 (1.5%) | 22 (5.7%) |
| $15,000 to $19,999 | 21 (1.9%) | 0 (0.0%) |
| $20,000 to $24,999 | 91 (8.3%) | 34 (8.7%) |
| $25,000 to $34,999 | 47 (4.3%) | 46 (11.8%) |
| $35,000 to $49,999 | 101 (9.2%) | 114 (29.3%) |
| $50,000 to $74,999 | 187 (17.1%) | 122 (31.4%) |
| $75,000 to $99,999 | 277 (25.4%) | 7 (1.8%) |
| $100,000 to $149,999 | 283 (25.9%) | 32 (8.2%) |
| $150,000 or more | 69 (6.3%) | 12 (3.1%) |
| Total | 1,092 (100.0%) | 389 (100.0%) |
Monthly Housing Cost Tiers in Elim
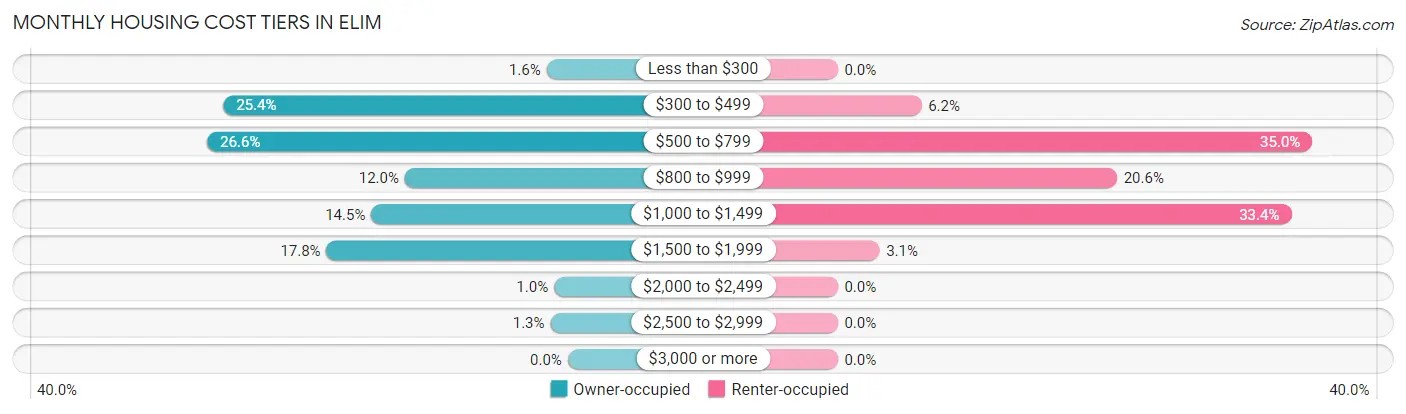
| Monthly Cost | Owner-occupied | Renter-occupied |
| Less than $300 | 17 (1.6%) | 0 (0.0%) |
| $300 to $499 | 277 (25.4%) | 24 (6.2%) |
| $500 to $799 | 290 (26.6%) | 136 (35.0%) |
| $800 to $999 | 131 (12.0%) | 80 (20.6%) |
| $1,000 to $1,499 | 158 (14.5%) | 130 (33.4%) |
| $1,500 to $1,999 | 194 (17.8%) | 12 (3.1%) |
| $2,000 to $2,499 | 11 (1.0%) | 0 (0.0%) |
| $2,500 to $2,999 | 14 (1.3%) | 0 (0.0%) |
| $3,000 or more | 0 (0.0%) | 0 (0.0%) |
| Total | 1,092 (100.0%) | 389 (100.0%) |
Physical Housing Characteristics in Elim
Housing Structures in Elim
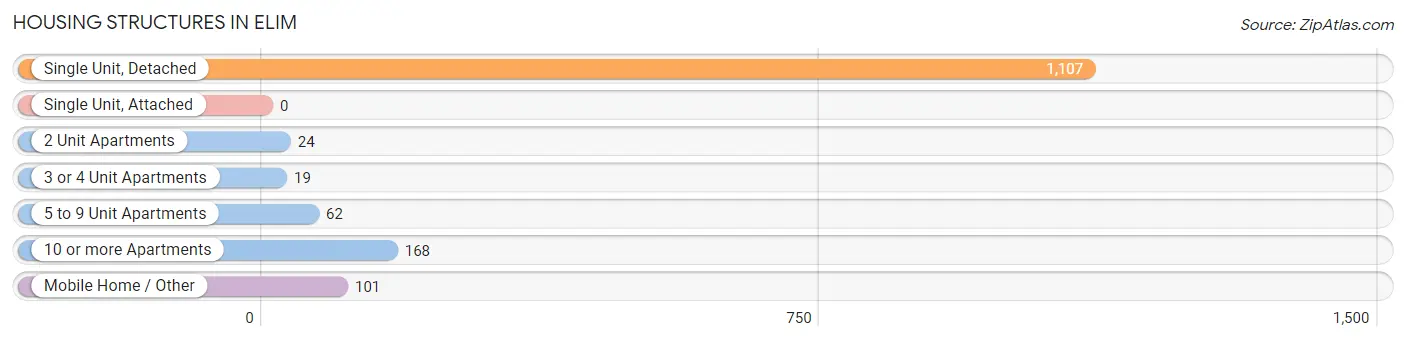
| Structure Type | # Housing Units | % Housing Units |
| Single Unit, Detached | 1,107 | 74.8% |
| Single Unit, Attached | 0 | 0.0% |
| 2 Unit Apartments | 24 | 1.6% |
| 3 or 4 Unit Apartments | 19 | 1.3% |
| 5 to 9 Unit Apartments | 62 | 4.2% |
| 10 or more Apartments | 168 | 11.3% |
| Mobile Home / Other | 101 | 6.8% |
| Total | 1,481 | 100.0% |
Housing Structures by Occupancy in Elim
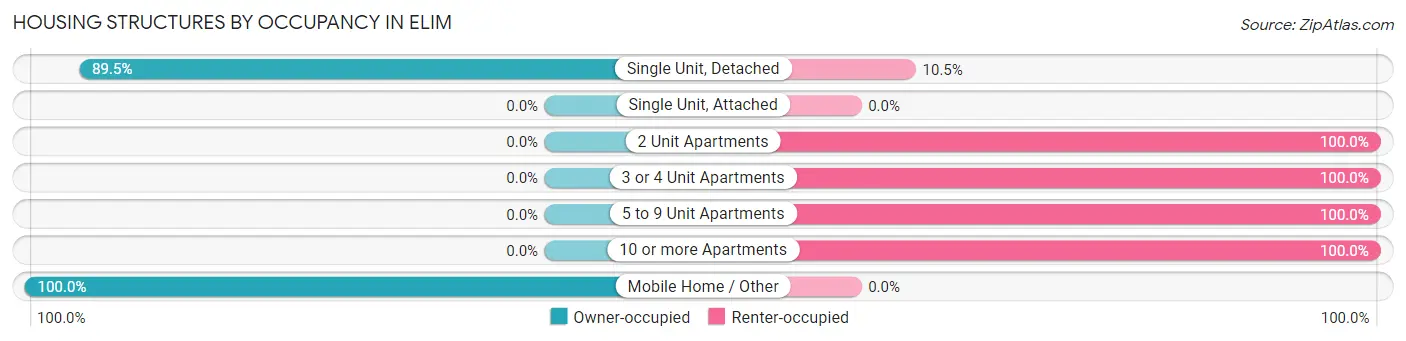
| Structure Type | Owner-occupied | Renter-occupied |
| Single Unit, Detached | 991 (89.5%) | 116 (10.5%) |
| Single Unit, Attached | 0 (0.0%) | 0 (0.0%) |
| 2 Unit Apartments | 0 (0.0%) | 24 (100.0%) |
| 3 or 4 Unit Apartments | 0 (0.0%) | 19 (100.0%) |
| 5 to 9 Unit Apartments | 0 (0.0%) | 62 (100.0%) |
| 10 or more Apartments | 0 (0.0%) | 168 (100.0%) |
| Mobile Home / Other | 101 (100.0%) | 0 (0.0%) |
| Total | 1,092 (73.7%) | 389 (26.3%) |
Housing Structures by Number of Rooms in Elim
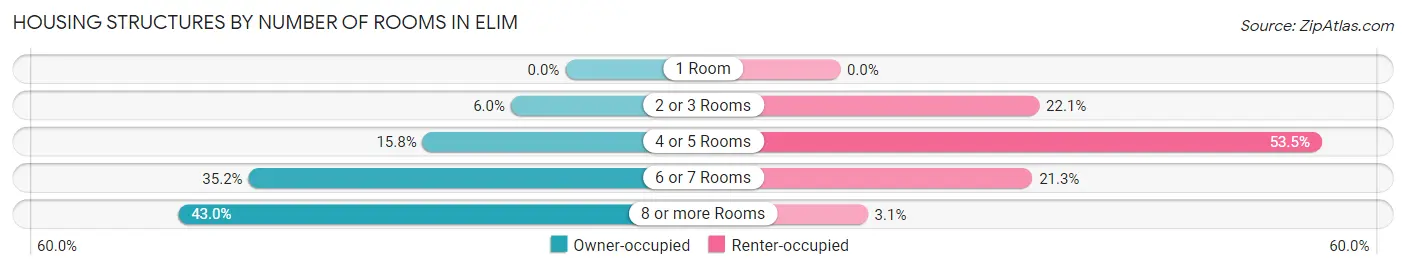
| Number of Rooms | Owner-occupied | Renter-occupied |
| 1 Room | 0 (0.0%) | 0 (0.0%) |
| 2 or 3 Rooms | 66 (6.0%) | 86 (22.1%) |
| 4 or 5 Rooms | 173 (15.8%) | 208 (53.5%) |
| 6 or 7 Rooms | 384 (35.2%) | 83 (21.3%) |
| 8 or more Rooms | 469 (42.9%) | 12 (3.1%) |
| Total | 1,092 (100.0%) | 389 (100.0%) |
Housing Structure by Heating Type in Elim
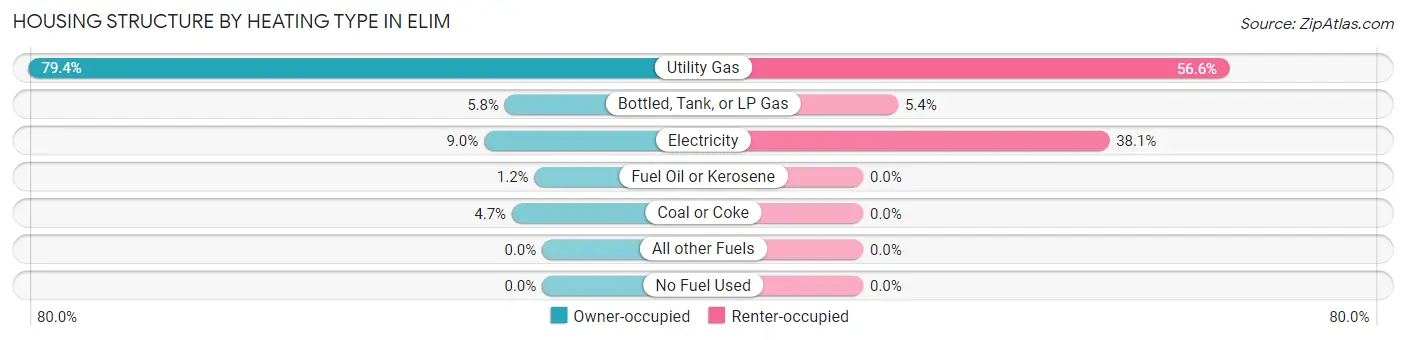
| Heating Type | Owner-occupied | Renter-occupied |
| Utility Gas | 867 (79.4%) | 220 (56.6%) |
| Bottled, Tank, or LP Gas | 63 (5.8%) | 21 (5.4%) |
| Electricity | 98 (9.0%) | 148 (38.1%) |
| Fuel Oil or Kerosene | 13 (1.2%) | 0 (0.0%) |
| Coal or Coke | 51 (4.7%) | 0 (0.0%) |
| All other Fuels | 0 (0.0%) | 0 (0.0%) |
| No Fuel Used | 0 (0.0%) | 0 (0.0%) |
| Total | 1,092 (100.0%) | 389 (100.0%) |
Household Vehicle Usage in Elim
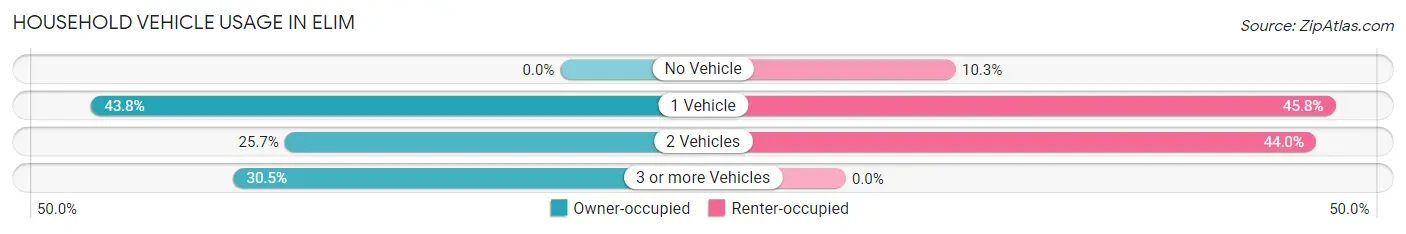
| Vehicles per Household | Owner-occupied | Renter-occupied |
| No Vehicle | 0 (0.0%) | 40 (10.3%) |
| 1 Vehicle | 478 (43.8%) | 178 (45.8%) |
| 2 Vehicles | 281 (25.7%) | 171 (44.0%) |
| 3 or more Vehicles | 333 (30.5%) | 0 (0.0%) |
| Total | 1,092 (100.0%) | 389 (100.0%) |
Real Estate & Mortgages in Elim
Real Estate and Mortgage Overview in Elim
| Characteristic | Without Mortgage | With Mortgage |
| Housing Units | 564 | 528 |
| Median Property Value | $102,400 | $118,800 |
| Median Household Income | $74,130 | $52 |
| Monthly Housing Costs | $590 | $0 |
| Real Estate Taxes | $2,350 | $0 |
Property Value by Mortgage Status in Elim
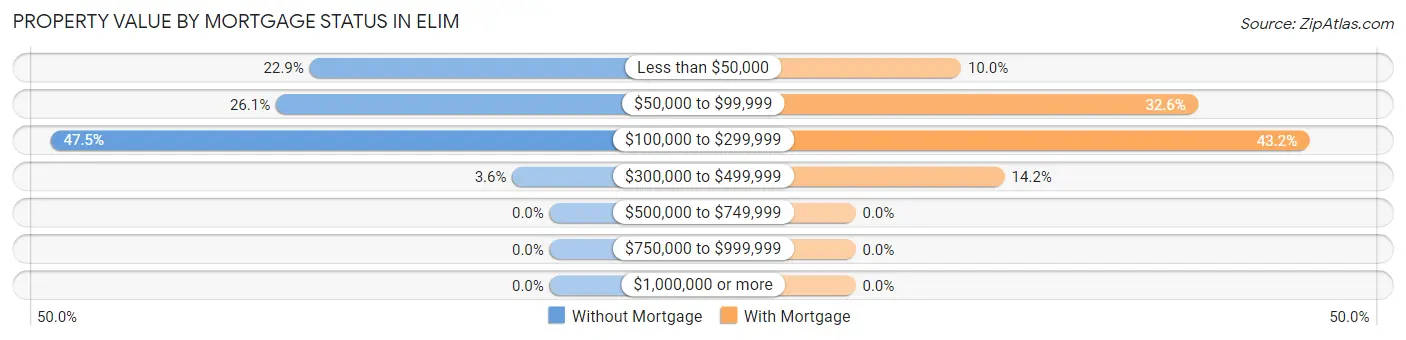
| Property Value | Without Mortgage | With Mortgage |
| Less than $50,000 | 129 (22.9%) | 53 (10.0%) |
| $50,000 to $99,999 | 147 (26.1%) | 172 (32.6%) |
| $100,000 to $299,999 | 268 (47.5%) | 228 (43.2%) |
| $300,000 to $499,999 | 20 (3.5%) | 75 (14.2%) |
| $500,000 to $749,999 | 0 (0.0%) | 0 (0.0%) |
| $750,000 to $999,999 | 0 (0.0%) | 0 (0.0%) |
| $1,000,000 or more | 0 (0.0%) | 0 (0.0%) |
| Total | 564 (100.0%) | 528 (100.0%) |
Household Income by Mortgage Status in Elim
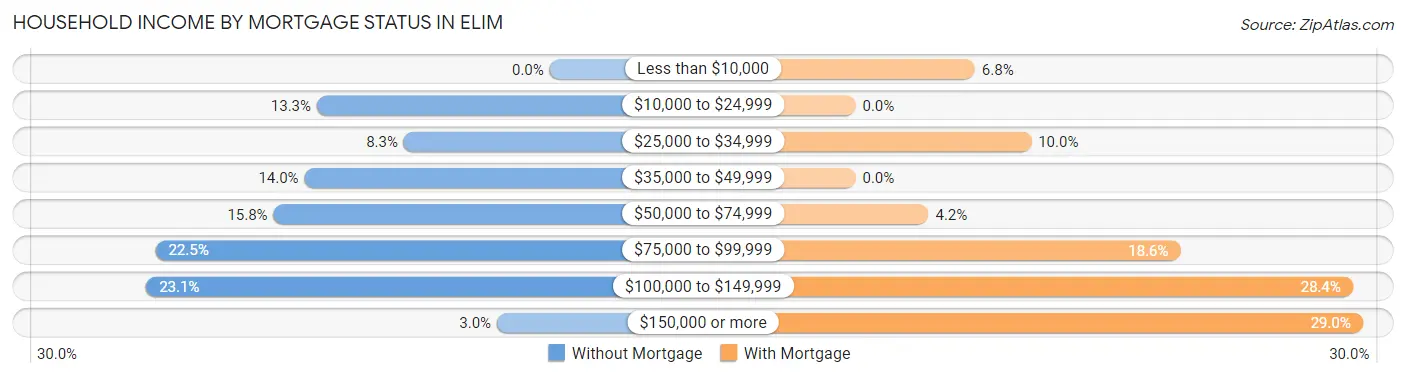
| Household Income | Without Mortgage | With Mortgage |
| Less than $10,000 | 0 (0.0%) | 36 (6.8%) |
| $10,000 to $24,999 | 75 (13.3%) | 0 (0.0%) |
| $25,000 to $34,999 | 47 (8.3%) | 53 (10.0%) |
| $35,000 to $49,999 | 79 (14.0%) | 0 (0.0%) |
| $50,000 to $74,999 | 89 (15.8%) | 22 (4.2%) |
| $75,000 to $99,999 | 127 (22.5%) | 98 (18.6%) |
| $100,000 to $149,999 | 130 (23.1%) | 150 (28.4%) |
| $150,000 or more | 17 (3.0%) | 153 (29.0%) |
| Total | 564 (100.0%) | 528 (100.0%) |
Property Value to Household Income Ratio in Elim
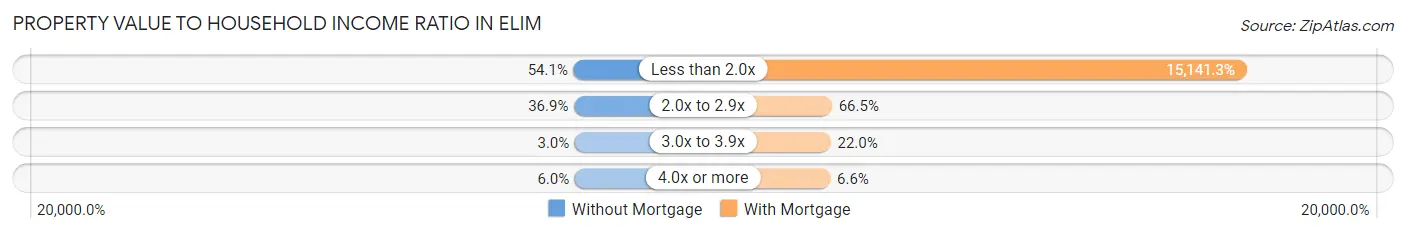
| Value-to-Income Ratio | Without Mortgage | With Mortgage |
| Less than 2.0x | 305 (54.1%) | 79,946 (15,141.3%) |
| 2.0x to 2.9x | 208 (36.9%) | 351 (66.5%) |
| 3.0x to 3.9x | 17 (3.0%) | 116 (22.0%) |
| 4.0x or more | 34 (6.0%) | 35 (6.6%) |
| Total | 564 (100.0%) | 528 (100.0%) |
Real Estate Taxes by Mortgage Status in Elim
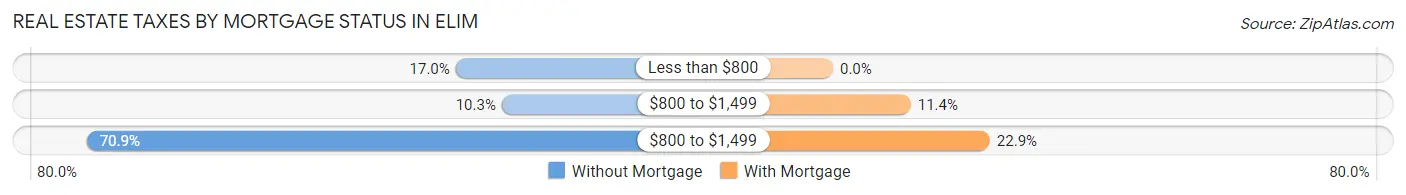
| Property Taxes | Without Mortgage | With Mortgage |
| Less than $800 | 96 (17.0%) | 0 (0.0%) |
| $800 to $1,499 | 58 (10.3%) | 60 (11.4%) |
| $800 to $1,499 | 400 (70.9%) | 121 (22.9%) |
| Total | 564 (100.0%) | 528 (100.0%) |
Health & Disability in Elim
Health Insurance Coverage by Age in Elim
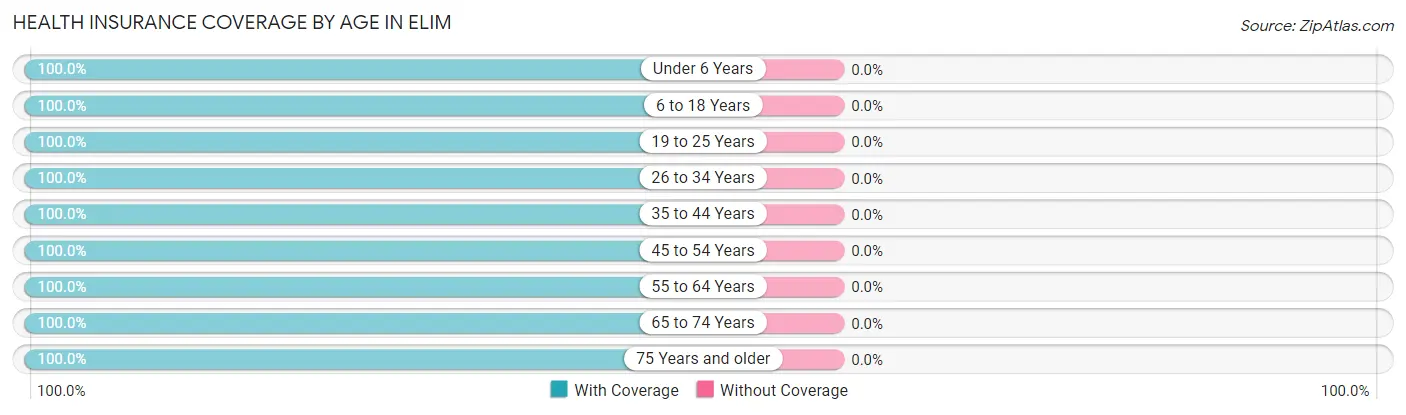
| Age Bracket | With Coverage | Without Coverage |
| Under 6 Years | 223 (100.0%) | 0 (0.0%) |
| 6 to 18 Years | 609 (100.0%) | 0 (0.0%) |
| 19 to 25 Years | 150 (100.0%) | 0 (0.0%) |
| 26 to 34 Years | 179 (100.0%) | 0 (0.0%) |
| 35 to 44 Years | 729 (100.0%) | 0 (0.0%) |
| 45 to 54 Years | 342 (100.0%) | 0 (0.0%) |
| 55 to 64 Years | 461 (100.0%) | 0 (0.0%) |
| 65 to 74 Years | 417 (100.0%) | 0 (0.0%) |
| 75 Years and older | 448 (100.0%) | 0 (0.0%) |
| Total | 3,558 (100.0%) | 0 (0.0%) |
Health Insurance Coverage by Citizenship Status in Elim
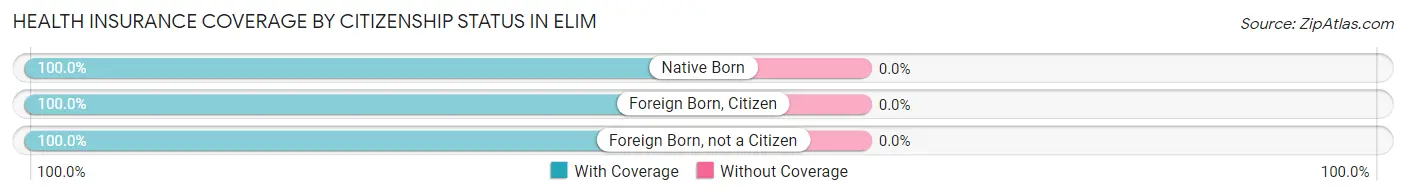
| Citizenship Status | With Coverage | Without Coverage |
| Native Born | 223 (100.0%) | 0 (0.0%) |
| Foreign Born, Citizen | 609 (100.0%) | 0 (0.0%) |
| Foreign Born, not a Citizen | 150 (100.0%) | 0 (0.0%) |
Health Insurance Coverage by Household Income in Elim
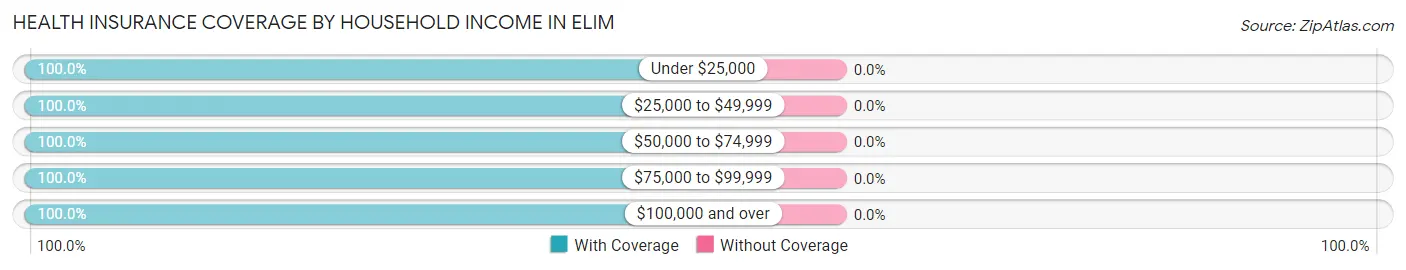
| Household Income | With Coverage | Without Coverage |
| Under $25,000 | 184 (100.0%) | 0 (0.0%) |
| $25,000 to $49,999 | 588 (100.0%) | 0 (0.0%) |
| $50,000 to $74,999 | 646 (100.0%) | 0 (0.0%) |
| $75,000 to $99,999 | 940 (100.0%) | 0 (0.0%) |
| $100,000 and over | 1,195 (100.0%) | 0 (0.0%) |
Public vs Private Health Insurance Coverage by Age in Elim
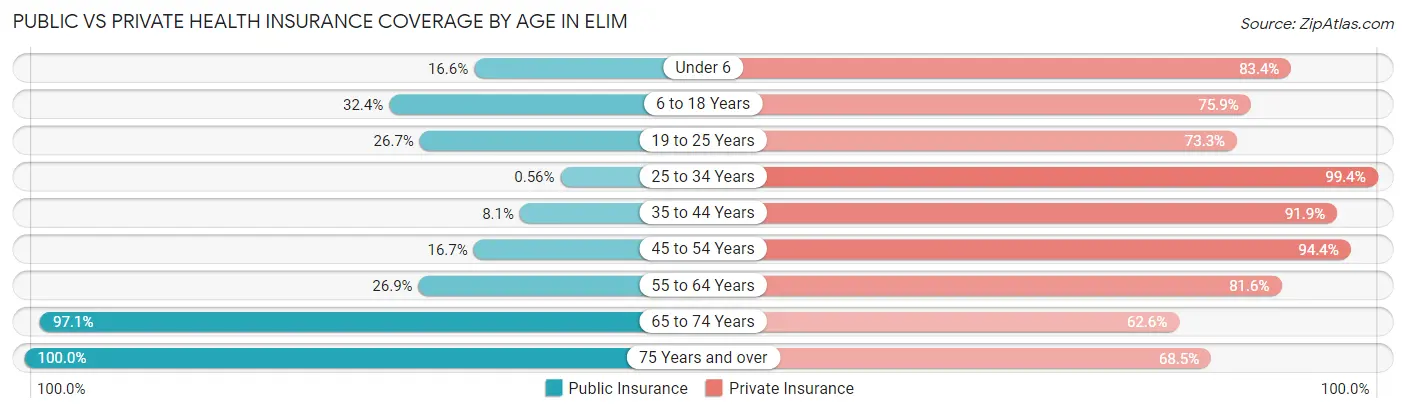
| Age Bracket | Public Insurance | Private Insurance |
| Under 6 | 37 (16.6%) | 186 (83.4%) |
| 6 to 18 Years | 197 (32.4%) | 462 (75.9%) |
| 19 to 25 Years | 40 (26.7%) | 110 (73.3%) |
| 25 to 34 Years | 1 (0.6%) | 178 (99.4%) |
| 35 to 44 Years | 59 (8.1%) | 670 (91.9%) |
| 45 to 54 Years | 57 (16.7%) | 323 (94.4%) |
| 55 to 64 Years | 124 (26.9%) | 376 (81.6%) |
| 65 to 74 Years | 405 (97.1%) | 261 (62.6%) |
| 75 Years and over | 448 (100.0%) | 307 (68.5%) |
| Total | 1,368 (38.5%) | 2,873 (80.7%) |
Disability Status by Sex by Age in Elim
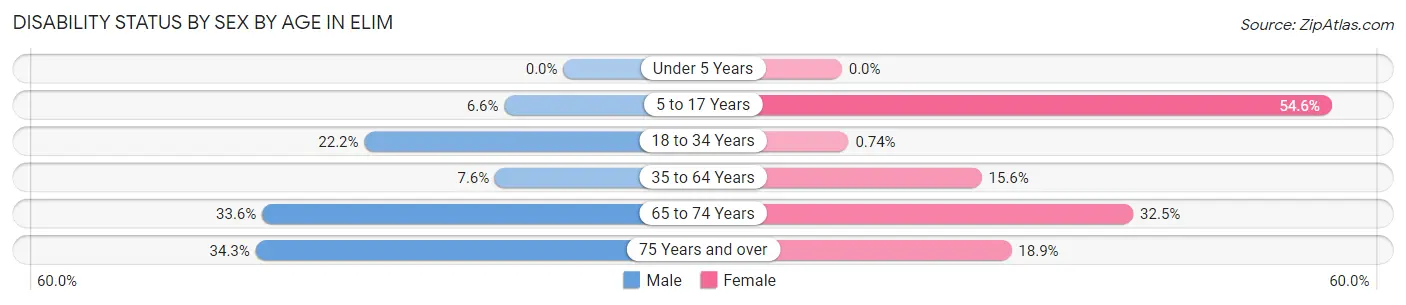
| Age Bracket | Male | Female |
| Under 5 Years | 0 (0.0%) | 0 (0.0%) |
| 5 to 17 Years | 13 (6.6%) | 234 (54.5%) |
| 18 to 34 Years | 43 (22.2%) | 1 (0.7%) |
| 35 to 64 Years | 52 (7.6%) | 132 (15.6%) |
| 65 to 74 Years | 51 (33.6%) | 86 (32.5%) |
| 75 Years and over | 61 (34.3%) | 51 (18.9%) |
Disability Class by Sex by Age in Elim
Disability Class: Hearing Difficulty
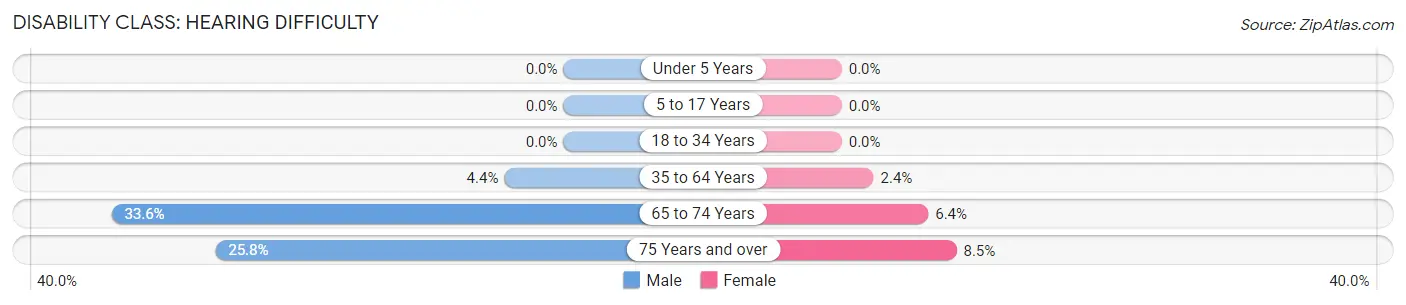
| Age Bracket | Male | Female |
| Under 5 Years | 0 (0.0%) | 0 (0.0%) |
| 5 to 17 Years | 0 (0.0%) | 0 (0.0%) |
| 18 to 34 Years | 0 (0.0%) | 0 (0.0%) |
| 35 to 64 Years | 30 (4.4%) | 20 (2.4%) |
| 65 to 74 Years | 51 (33.6%) | 17 (6.4%) |
| 75 Years and over | 46 (25.8%) | 23 (8.5%) |
Disability Class: Vision Difficulty
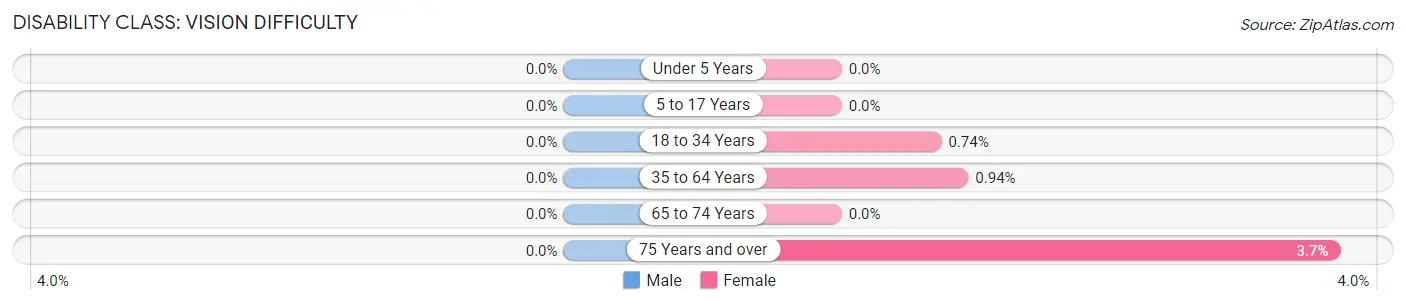
| Age Bracket | Male | Female |
| Under 5 Years | 0 (0.0%) | 0 (0.0%) |
| 5 to 17 Years | 0 (0.0%) | 0 (0.0%) |
| 18 to 34 Years | 0 (0.0%) | 1 (0.7%) |
| 35 to 64 Years | 0 (0.0%) | 8 (0.9%) |
| 65 to 74 Years | 0 (0.0%) | 0 (0.0%) |
| 75 Years and over | 0 (0.0%) | 10 (3.7%) |
Disability Class: Cognitive Difficulty
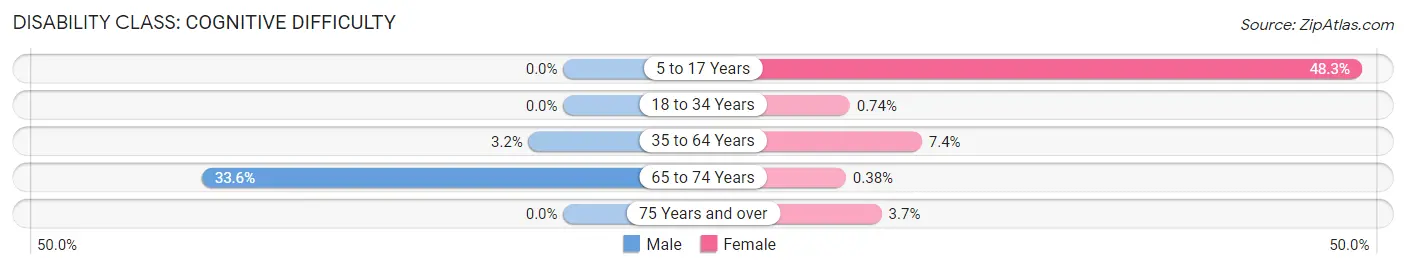
| Age Bracket | Male | Female |
| 5 to 17 Years | 0 (0.0%) | 207 (48.2%) |
| 18 to 34 Years | 0 (0.0%) | 1 (0.7%) |
| 35 to 64 Years | 22 (3.2%) | 63 (7.4%) |
| 65 to 74 Years | 51 (33.6%) | 1 (0.4%) |
| 75 Years and over | 0 (0.0%) | 10 (3.7%) |
Disability Class: Ambulatory Difficulty
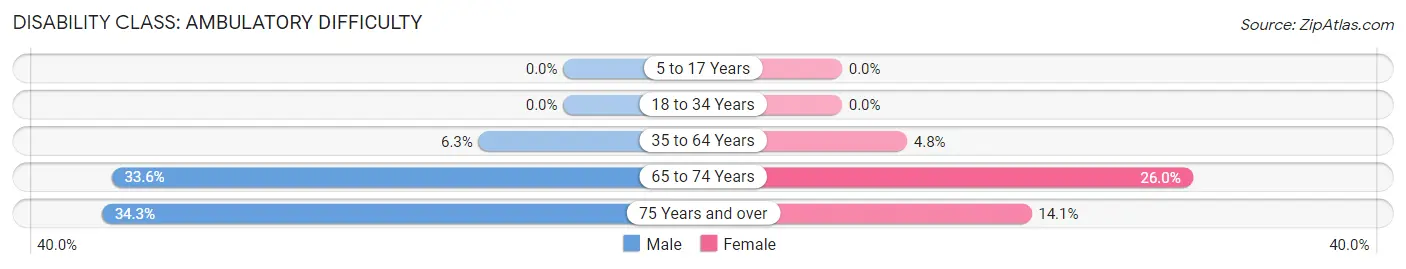
| Age Bracket | Male | Female |
| 5 to 17 Years | 0 (0.0%) | 0 (0.0%) |
| 18 to 34 Years | 0 (0.0%) | 0 (0.0%) |
| 35 to 64 Years | 43 (6.3%) | 41 (4.8%) |
| 65 to 74 Years | 51 (33.6%) | 69 (26.0%) |
| 75 Years and over | 61 (34.3%) | 38 (14.1%) |
Disability Class: Self-Care Difficulty
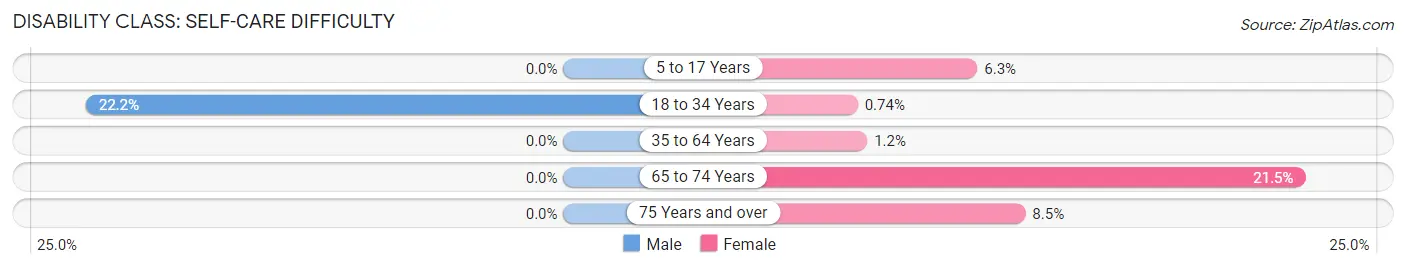
| Age Bracket | Male | Female |
| 5 to 17 Years | 0 (0.0%) | 27 (6.3%) |
| 18 to 34 Years | 43 (22.2%) | 1 (0.7%) |
| 35 to 64 Years | 0 (0.0%) | 10 (1.2%) |
| 65 to 74 Years | 0 (0.0%) | 57 (21.5%) |
| 75 Years and over | 0 (0.0%) | 23 (8.5%) |
Technology Access in Elim
Computing Device Access in Elim
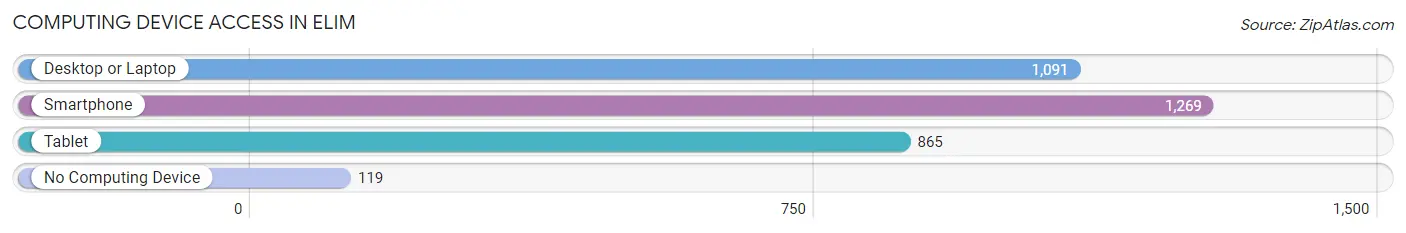
| Device Type | # Households | % Households |
| Desktop or Laptop | 1,091 | 73.7% |
| Smartphone | 1,269 | 85.7% |
| Tablet | 865 | 58.4% |
| No Computing Device | 119 | 8.0% |
| Total | 1,481 | 100.0% |
Internet Access in Elim
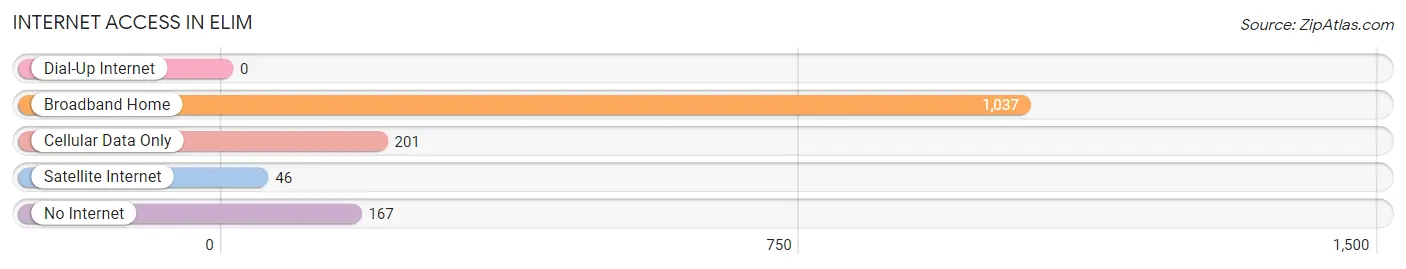
| Internet Type | # Households | % Households |
| Dial-Up Internet | 0 | 0.0% |
| Broadband Home | 1,037 | 70.0% |
| Cellular Data Only | 201 | 13.6% |
| Satellite Internet | 46 | 3.1% |
| No Internet | 167 | 11.3% |
| Total | 1,481 | 100.0% |
Elim Summary
Elim is a small unincorporated community located in the western part of the state of Pennsylvania. It is situated in the Allegheny Mountains, in the county of Somerset. The population of Elim was estimated to be around 200 people in 2000.
History
Elim was first settled in the late 1700s by German immigrants. The community was named after the biblical city of Elim, which is mentioned in the book of Exodus. The first settlers were mostly farmers, and the area was known for its rich soil and abundant natural resources.
In the early 1800s, the area was home to a number of small businesses, including a sawmill, a gristmill, and a tannery. The community also had a post office, which was established in 1837.
In the late 1800s, the area began to experience a period of growth and development. The population increased, and the community began to attract more businesses. In the early 1900s, the area was home to a number of stores, including a general store, a hardware store, and a drug store.
Geography
Elim is located in the Allegheny Mountains, in the county of Somerset. The community is situated at an elevation of 1,890 feet above sea level. The area is surrounded by forests and mountains, and is home to a number of small streams and creeks.
Economy
The economy of Elim is largely based on agriculture and tourism. The area is home to a number of small farms, which produce a variety of crops, including corn, wheat, and hay. The area is also home to a number of small businesses, including restaurants, stores, and lodging.
Demographics
In 2000, the population of Elim was estimated to be around 200 people. The racial makeup of the community was 97.5% White, 0.5% African American, 0.5% Native American, and 1.5% from other races. The median household income was $30,000, and the median family income was $35,000. The per capita income was $14,000.
Conclusion
Elim is a small unincorporated community located in the western part of the state of Pennsylvania. It is situated in the Allegheny Mountains, in the county of Somerset. The population of Elim was estimated to be around 200 people in 2000. The economy of Elim is largely based on agriculture and tourism, and the area is home to a number of small farms and businesses. The racial makeup of the community was 97.5% White, 0.5% African American, 0.5% Native American, and 1.5% from other races. The median household income was $30,000, and the median family income was $35,000.
Common Questions
What is Per Capita Income in Elim?
Per Capita income in Elim is $33,103.
What is the Median Family Income in Elim?
Median Family Income in Elim is $92,942.
What is the Median Household income in Elim?
Median Household Income in Elim is $62,198.
What is Income or Wage Gap in Elim?
Income or Wage Gap in Elim is 14.2%.
Women in Elim earn 85.8 cents for every dollar earned by a man.
What is Inequality or Gini Index in Elim?
Inequality or Gini Index in Elim is 0.40.
What is the Total Population of Elim?
Total Population of Elim is 3,903.
What is the Total Male Population of Elim?
Total Male Population of Elim is 1,639.
What is the Total Female Population of Elim?
Total Female Population of Elim is 2,264.
What is the Ratio of Males per 100 Females in Elim?
There are 72.39 Males per 100 Females in Elim.
What is the Ratio of Females per 100 Males in Elim?
There are 138.13 Females per 100 Males in Elim.
What is the Median Population Age in Elim?
Median Population Age in Elim is 43.4 Years.
What is the Average Family Size in Elim
Average Family Size in Elim is 3.0 People.
What is the Average Household Size in Elim
Average Household Size in Elim is 2.4 People.
How Large is the Labor Force in Elim?
There are 1,792 People in the Labor Forcein in Elim.
What is the Percentage of People in the Labor Force in Elim?
59.5% of People are in the Labor Force in Elim.
What is the Unemployment Rate in Elim?
Unemployment Rate in Elim is 6.1%.