Church Hill, PA Map & Demographics
Church Hill Map
Church Hill Overview
$37,054
PER CAPITA INCOME
$86,782
AVG FAMILY INCOME
$69,891
AVG HOUSEHOLD INCOME
21.2%
WAGE / INCOME GAP [ % ]
78.8¢/ $1
WAGE / INCOME GAP [ $ ]
0.35
INEQUALITY / GINI INDEX
1,634
TOTAL POPULATION
788
MALE POPULATION
846
FEMALE POPULATION
93.14
MALES / 100 FEMALES
107.36
FEMALES / 100 MALES
50.3
MEDIAN AGE
2.5
AVG FAMILY SIZE
2.0
AVG HOUSEHOLD SIZE
852
LABOR FORCE [ PEOPLE ]
59.8%
PERCENT IN LABOR FORCE
0.9%
UNEMPLOYMENT RATE
Income in Church Hill
Income Overview in Church Hill
Per Capita Income in Church Hill is $37,054, while median incomes of families and households are $86,782 and $69,891 respectively.
| Characteristic | Number | Measure |
| Per Capita Income | 1,634 | $37,054 |
| Median Family Income | 507 | $86,782 |
| Mean Family Income | 507 | $88,621 |
| Median Household Income | 808 | $69,891 |
| Mean Household Income | 808 | $75,109 |
| Income Deficit | 507 | $0 |
| Wage / Income Gap (%) | 1,634 | 21.22% |
| Wage / Income Gap ($) | 1,634 | 78.78¢ per $1 |
| Gini / Inequality Index | 1,634 | 0.35 |
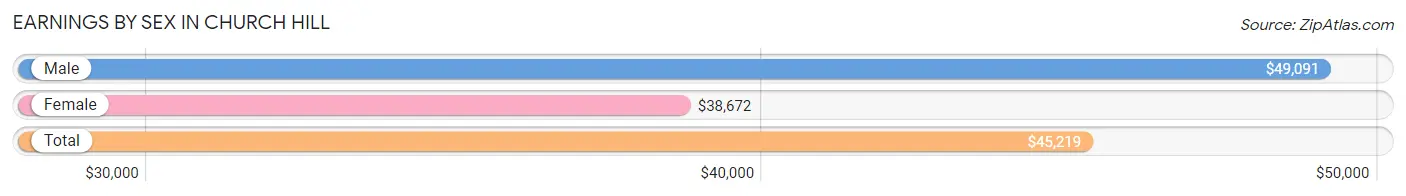
Earnings by Sex in Church Hill
Average Earnings in Church Hill are $45,219, $49,091 for men and $38,672 for women, a difference of 21.2%.
| Sex | Number | Average Earnings |
| Male | 468 (52.3%) | $49,091 |
| Female | 427 (47.7%) | $38,672 |
| Total | 895 (100.0%) | $45,219 |
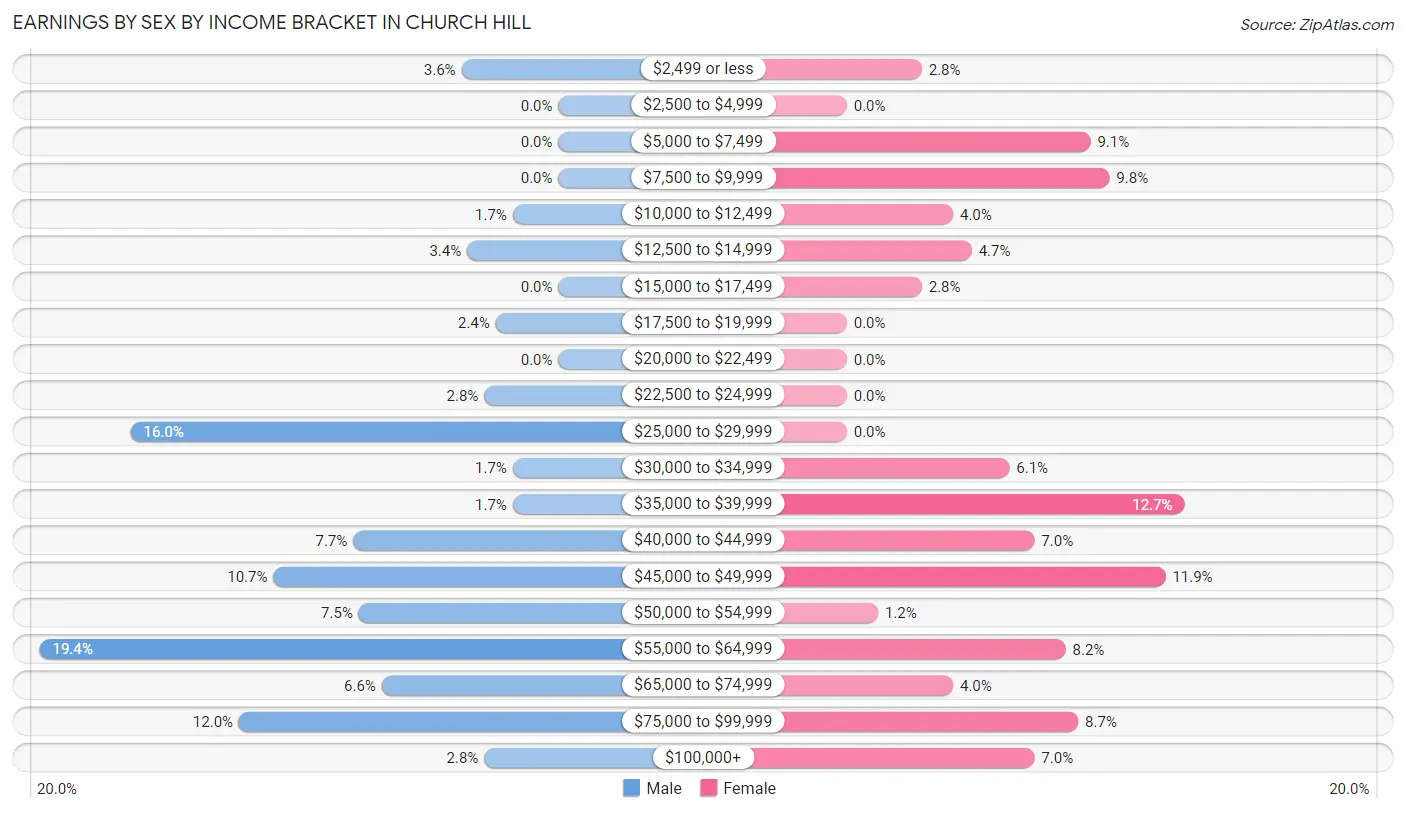
Earnings by Sex by Income Bracket in Church Hill
The most common earnings brackets in Church Hill are $55,000 to $64,999 for men (91 | 19.4%) and $35,000 to $39,999 for women (54 | 12.7%).
| Income | Male | Female |
| $2,499 or less | 17 (3.6%) | 12 (2.8%) |
| $2,500 to $4,999 | 0 (0.0%) | 0 (0.0%) |
| $5,000 to $7,499 | 0 (0.0%) | 39 (9.1%) |
| $7,500 to $9,999 | 0 (0.0%) | 42 (9.8%) |
| $10,000 to $12,499 | 8 (1.7%) | 17 (4.0%) |
| $12,500 to $14,999 | 16 (3.4%) | 20 (4.7%) |
| $15,000 to $17,499 | 0 (0.0%) | 12 (2.8%) |
| $17,500 to $19,999 | 11 (2.4%) | 0 (0.0%) |
| $20,000 to $22,499 | 0 (0.0%) | 0 (0.0%) |
| $22,500 to $24,999 | 13 (2.8%) | 0 (0.0%) |
| $25,000 to $29,999 | 75 (16.0%) | 0 (0.0%) |
| $30,000 to $34,999 | 8 (1.7%) | 26 (6.1%) |
| $35,000 to $39,999 | 8 (1.7%) | 54 (12.7%) |
| $40,000 to $44,999 | 36 (7.7%) | 30 (7.0%) |
| $45,000 to $49,999 | 50 (10.7%) | 51 (11.9%) |
| $50,000 to $54,999 | 35 (7.5%) | 5 (1.2%) |
| $55,000 to $64,999 | 91 (19.4%) | 35 (8.2%) |
| $65,000 to $74,999 | 31 (6.6%) | 17 (4.0%) |
| $75,000 to $99,999 | 56 (12.0%) | 37 (8.7%) |
| $100,000+ | 13 (2.8%) | 30 (7.0%) |
| Total | 468 (100.0%) | 427 (100.0%) |
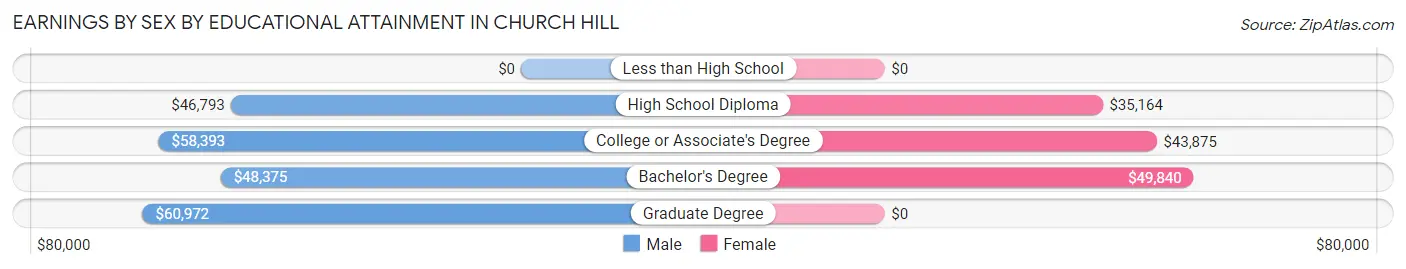
Earnings by Sex by Educational Attainment in Church Hill
Average earnings in Church Hill are $50,341 for men and $46,458 for women, a difference of 7.7%. Men with an educational attainment of graduate degree enjoy the highest average annual earnings of $60,972, while those with high school diploma education earn the least with $46,793. Women with an educational attainment of bachelor's degree earn the most with the average annual earnings of $49,840, while those with high school diploma education have the smallest earnings of $35,164.
| Educational Attainment | Male Income | Female Income |
| Less than High School | - | - |
| High School Diploma | $46,793 | $35,164 |
| College or Associate's Degree | $58,393 | $43,875 |
| Bachelor's Degree | $48,375 | $49,840 |
| Graduate Degree | $60,972 | $0 |
| Total | $50,341 | $46,458 |
Family Income in Church Hill
Family Income Brackets in Church Hill
According to the Church Hill family income data, there are 193 families falling into the $100,000 to $149,999 income range, which is the most common income bracket and makes up 38.1% of all families. Conversely, the $25,000 to $34,999 income bracket is the least frequent group with only 8 families (1.6%) belonging to this category.
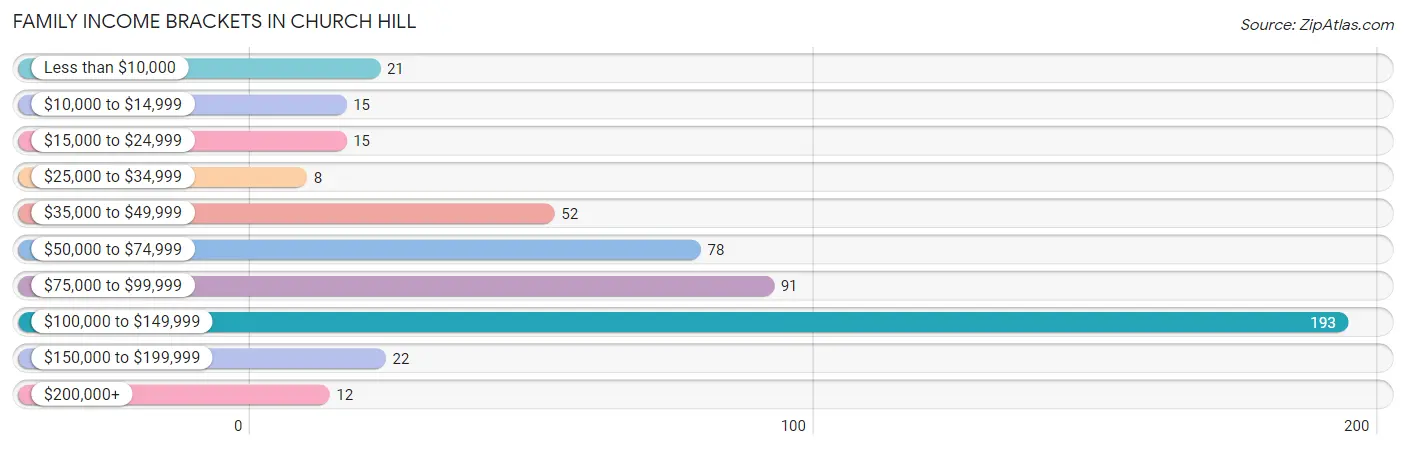
| Income Bracket | # Families | % Families |
| Less than $10,000 | 21 | 4.1% |
| $10,000 to $14,999 | 15 | 3.0% |
| $15,000 to $24,999 | 15 | 3.0% |
| $25,000 to $34,999 | 8 | 1.6% |
| $35,000 to $49,999 | 52 | 10.3% |
| $50,000 to $74,999 | 78 | 15.4% |
| $75,000 to $99,999 | 91 | 17.9% |
| $100,000 to $149,999 | 193 | 38.1% |
| $150,000 to $199,999 | 22 | 4.3% |
| $200,000+ | 12 | 2.4% |
Family Income by Famaliy Size in Church Hill
3-person families (109 | 21.5%) account for the highest median family income in Church Hill with $103,819 per family, while 2-person families (329 | 64.9%) have the highest median income of $42,992 per family member.
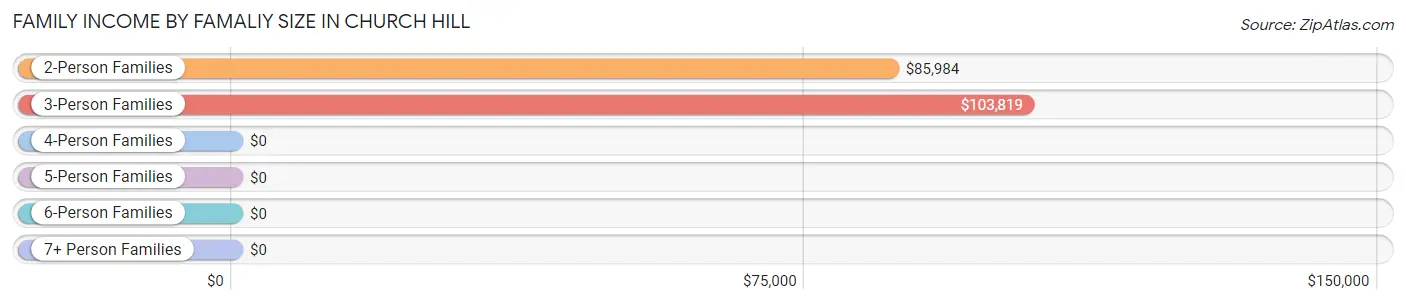
| Income Bracket | # Families | Median Income |
| 2-Person Families | 329 (64.9%) | $85,984 |
| 3-Person Families | 109 (21.5%) | $103,819 |
| 4-Person Families | 69 (13.6%) | $0 |
| 5-Person Families | 0 (0.0%) | $0 |
| 6-Person Families | 0 (0.0%) | $0 |
| 7+ Person Families | 0 (0.0%) | $0 |
| Total | 507 (100.0%) | $86,782 |
Family Income by Number of Earners in Church Hill
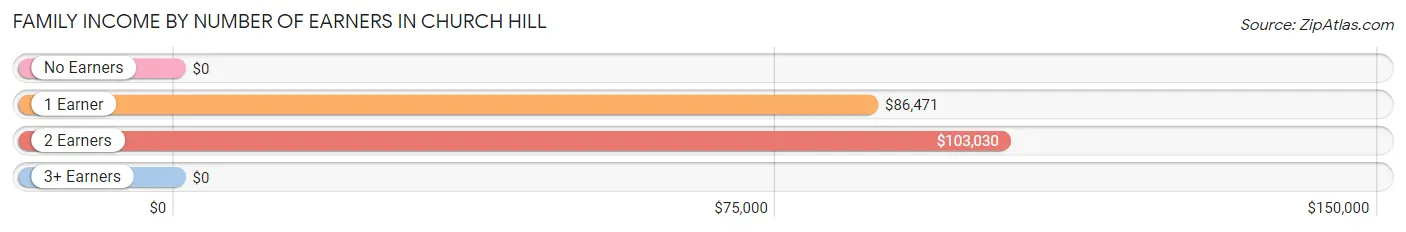
| Number of Earners | # Families | Median Income |
| No Earners | 111 (21.9%) | $0 |
| 1 Earner | 112 (22.1%) | $86,471 |
| 2 Earners | 250 (49.3%) | $103,030 |
| 3+ Earners | 34 (6.7%) | $0 |
| Total | 507 (100.0%) | $86,782 |
Household Income in Church Hill
Household Income Brackets in Church Hill
With 226 households falling in the category, the $100,000 to $149,999 income range is the most frequent in Church Hill, accounting for 28.0% of all households. In contrast, only 12 households (1.5%) fall into the $200,000+ income bracket, making it the least populous group.
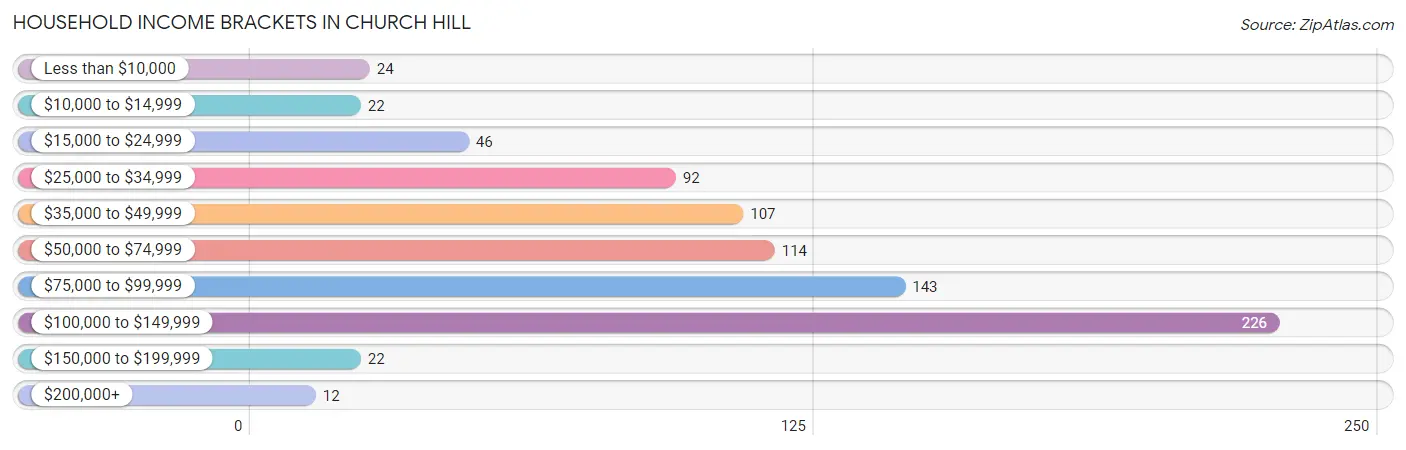
| Income Bracket | # Households | % Households |
| Less than $10,000 | 24 | 3.0% |
| $10,000 to $14,999 | 22 | 2.7% |
| $15,000 to $24,999 | 46 | 5.7% |
| $25,000 to $34,999 | 92 | 11.4% |
| $35,000 to $49,999 | 107 | 13.2% |
| $50,000 to $74,999 | 114 | 14.1% |
| $75,000 to $99,999 | 143 | 17.7% |
| $100,000 to $149,999 | 226 | 28.0% |
| $150,000 to $199,999 | 22 | 2.7% |
| $200,000+ | 12 | 1.5% |
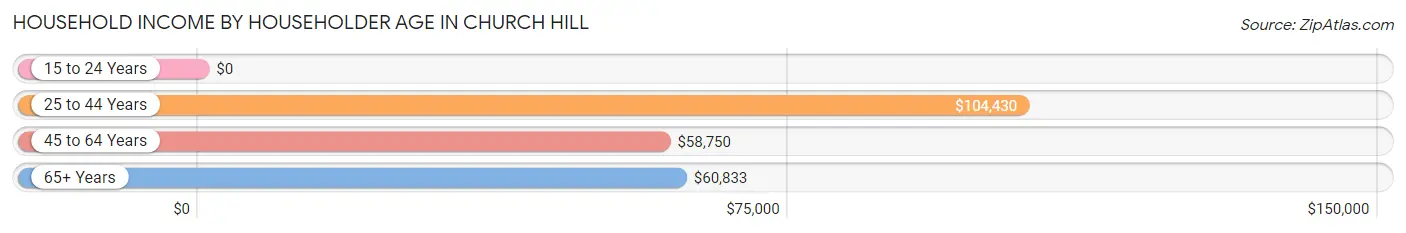
Household Income by Householder Age in Church Hill
The median household income in Church Hill is $69,891, with the highest median household income of $104,430 found in the 25 to 44 years age bracket for the primary householder. A total of 194 households (24.0%) fall into this category. Meanwhile, the 15 to 24 years age bracket for the primary householder has the lowest median household income of $0, with 13 households (1.6%) in this group.
| Income Bracket | # Households | Median Income |
| 15 to 24 Years | 13 (1.6%) | $0 |
| 25 to 44 Years | 194 (24.0%) | $104,430 |
| 45 to 64 Years | 255 (31.6%) | $58,750 |
| 65+ Years | 346 (42.8%) | $60,833 |
| Total | 808 (100.0%) | $69,891 |
Poverty in Church Hill
Income Below Poverty by Sex and Age in Church Hill
With 5.3% poverty level for males and 11.2% for females among the residents of Church Hill, 6 to 11 year old males and 16 and 17 year old females are the most vulnerable to poverty, with 20 males (32.3%) and 7 females (100.0%) in their respective age groups living below the poverty level.
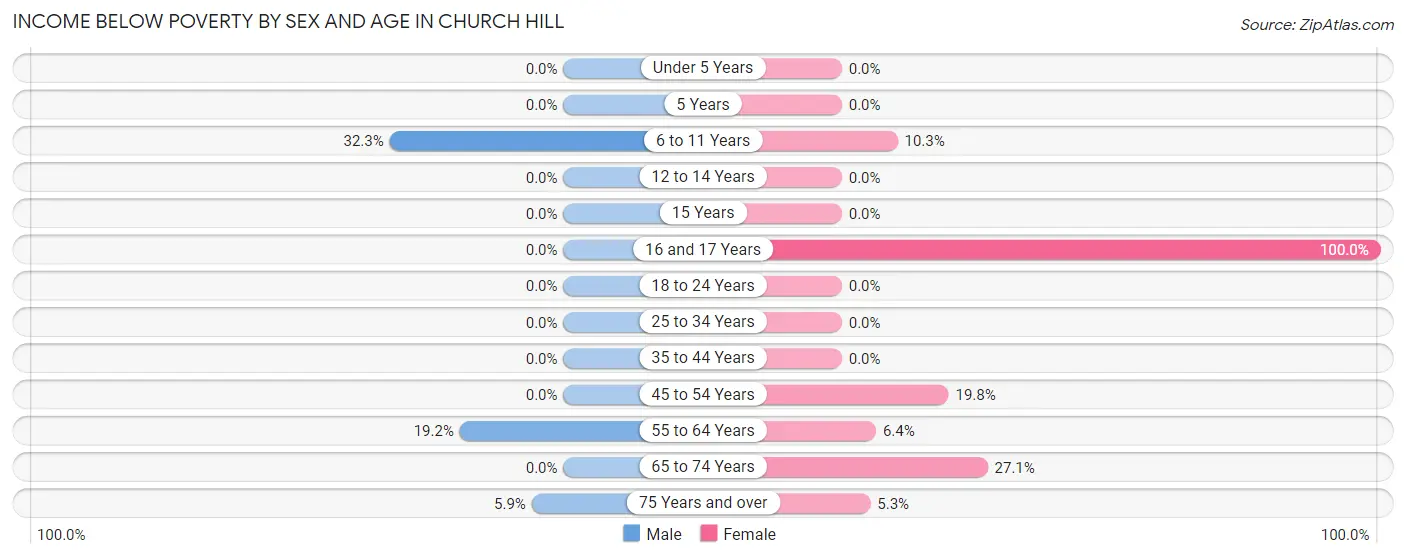
| Age Bracket | Male | Female |
| Under 5 Years | 0 (0.0%) | 0 (0.0%) |
| 5 Years | 0 (0.0%) | 0 (0.0%) |
| 6 to 11 Years | 20 (32.3%) | 6 (10.3%) |
| 12 to 14 Years | 0 (0.0%) | 0 (0.0%) |
| 15 Years | 0 (0.0%) | 0 (0.0%) |
| 16 and 17 Years | 0 (0.0%) | 7 (100.0%) |
| 18 to 24 Years | 0 (0.0%) | 0 (0.0%) |
| 25 to 34 Years | 0 (0.0%) | 0 (0.0%) |
| 35 to 44 Years | 0 (0.0%) | 0 (0.0%) |
| 45 to 54 Years | 0 (0.0%) | 21 (19.8%) |
| 55 to 64 Years | 15 (19.2%) | 8 (6.4%) |
| 65 to 74 Years | 0 (0.0%) | 46 (27.1%) |
| 75 Years and over | 7 (5.9%) | 7 (5.3%) |
| Total | 42 (5.3%) | 95 (11.2%) |
Income Above Poverty by Sex and Age in Church Hill
According to the poverty statistics in Church Hill, males aged under 5 years and females aged 15 years are the age groups that are most secure financially, with 100.0% of males and 100.0% of females in these age groups living above the poverty line.
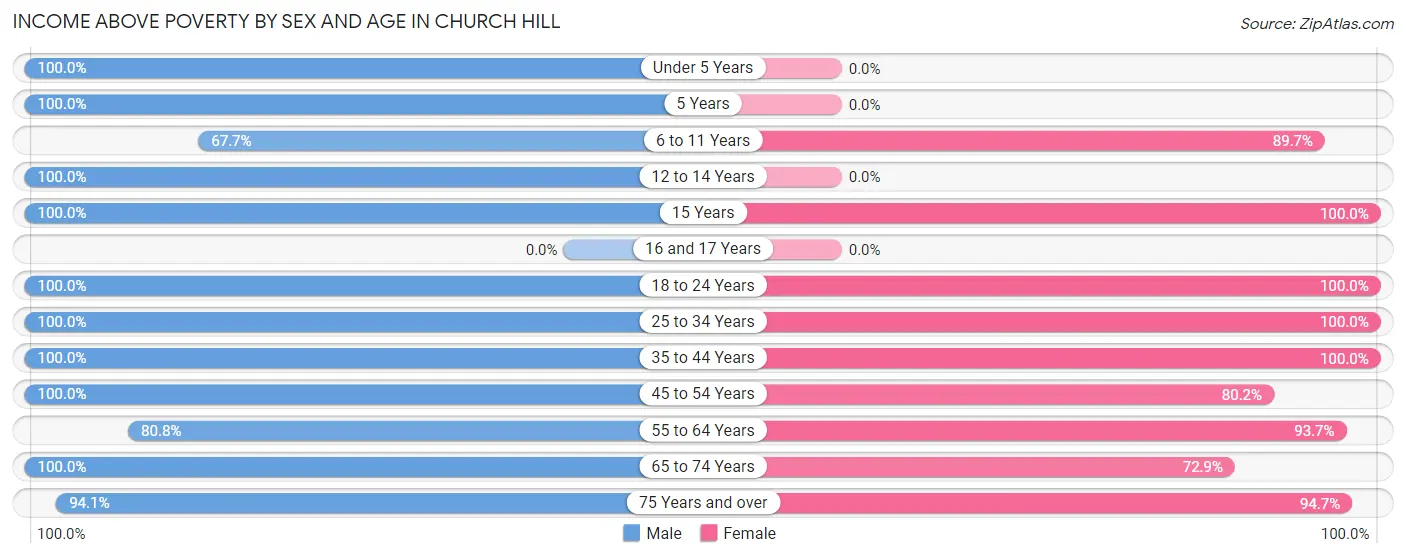
| Age Bracket | Male | Female |
| Under 5 Years | 37 (100.0%) | 0 (0.0%) |
| 5 Years | 6 (100.0%) | 0 (0.0%) |
| 6 to 11 Years | 42 (67.7%) | 52 (89.7%) |
| 12 to 14 Years | 7 (100.0%) | 0 (0.0%) |
| 15 Years | 23 (100.0%) | 14 (100.0%) |
| 16 and 17 Years | 0 (0.0%) | 0 (0.0%) |
| 18 to 24 Years | 29 (100.0%) | 91 (100.0%) |
| 25 to 34 Years | 99 (100.0%) | 69 (100.0%) |
| 35 to 44 Years | 65 (100.0%) | 73 (100.0%) |
| 45 to 54 Years | 160 (100.0%) | 85 (80.2%) |
| 55 to 64 Years | 63 (80.8%) | 118 (93.6%) |
| 65 to 74 Years | 100 (100.0%) | 124 (72.9%) |
| 75 Years and over | 112 (94.1%) | 125 (94.7%) |
| Total | 743 (94.7%) | 751 (88.8%) |
Income Below Poverty Among Married-Couple Families in Church Hill
The poverty statistics for married-couple families in Church Hill show that 5.0% or 22 of the total 444 families live below the poverty line. Families with no children have the highest poverty rate of 6.3%, comprising of 22 families. On the other hand, families with 1 or 2 children have the lowest poverty rate of 0.0%, which includes 0 families.
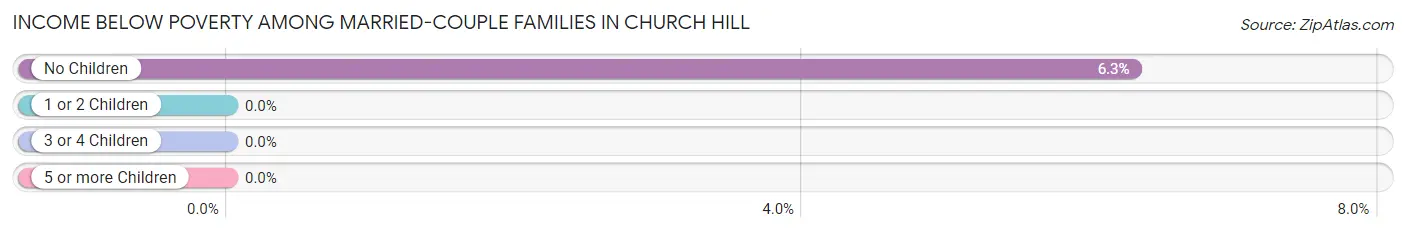
| Children | Above Poverty | Below Poverty |
| No Children | 328 (93.7%) | 22 (6.3%) |
| 1 or 2 Children | 94 (100.0%) | 0 (0.0%) |
| 3 or 4 Children | 0 (0.0%) | 0 (0.0%) |
| 5 or more Children | 0 (0.0%) | 0 (0.0%) |
| Total | 422 (95.1%) | 22 (5.0%) |
Income Below Poverty Among Single-Parent Households in Church Hill
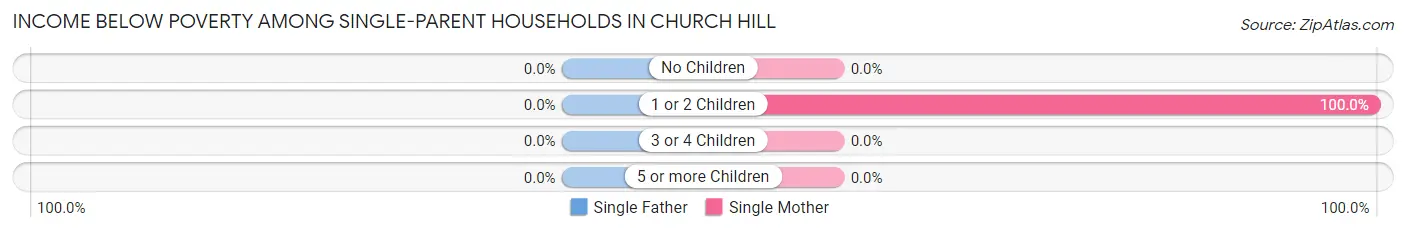
| Children | Single Father | Single Mother |
| No Children | 0 (0.0%) | 0 (0.0%) |
| 1 or 2 Children | 0 (0.0%) | 29 (100.0%) |
| 3 or 4 Children | 0 (0.0%) | 0 (0.0%) |
| 5 or more Children | 0 (0.0%) | 0 (0.0%) |
| Total | 0 (0.0%) | 29 (55.8%) |
Income Below Poverty Among Married-Couple vs Single-Parent Households in Church Hill
The poverty data for Church Hill shows that 22 of the married-couple family households (5.0%) and 29 of the single-parent households (46.0%) are living below the poverty level. Within the married-couple family households, those with no children have the highest poverty rate, with 22 households (6.3%) falling below the poverty line. Among the single-parent households, those with 1 or 2 children have the highest poverty rate, with 29 household (72.5%) living below poverty.
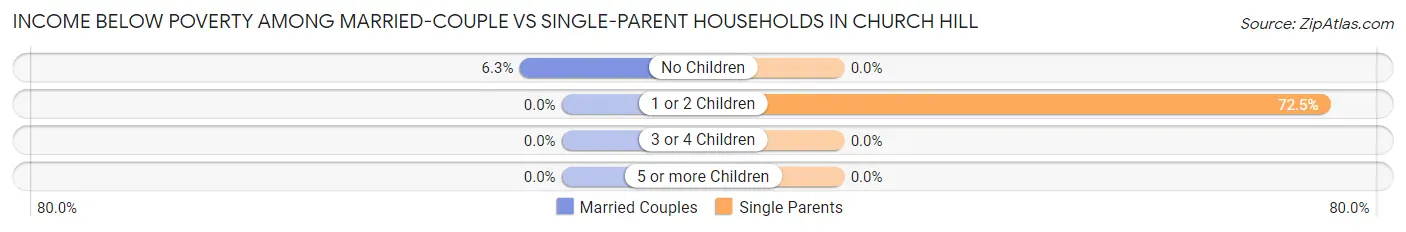
| Children | Married-Couple Families | Single-Parent Households |
| No Children | 22 (6.3%) | 0 (0.0%) |
| 1 or 2 Children | 0 (0.0%) | 29 (72.5%) |
| 3 or 4 Children | 0 (0.0%) | 0 (0.0%) |
| 5 or more Children | 0 (0.0%) | 0 (0.0%) |
| Total | 22 (5.0%) | 29 (46.0%) |
Race in Church Hill
The most populous races in Church Hill are White / Caucasian (1,508 | 92.3%), Two or more Races (81 | 5.0%), and Hispanic or Latino (66 | 4.0%).
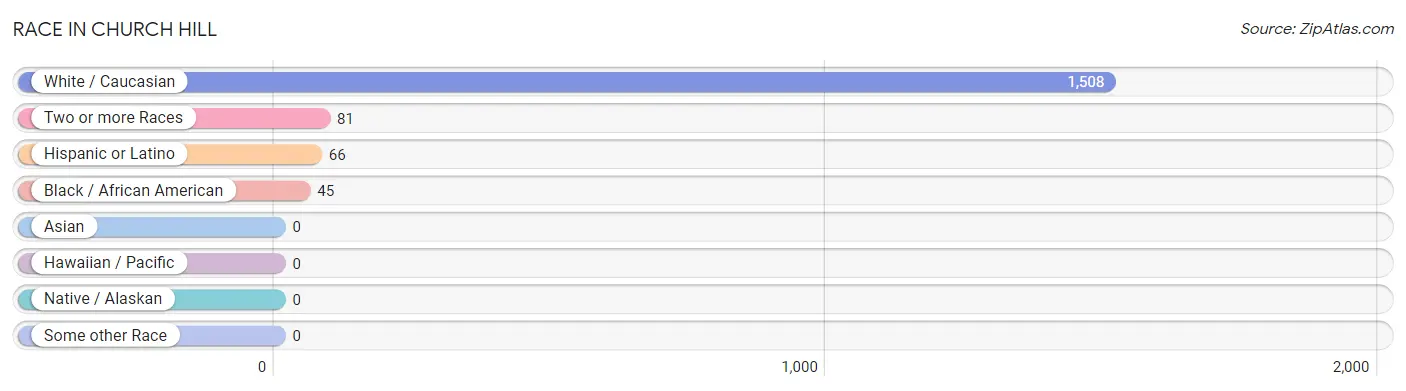
| Race | # Population | % Population |
| Asian | 0 | 0.0% |
| Black / African American | 45 | 2.8% |
| Hawaiian / Pacific | 0 | 0.0% |
| Hispanic or Latino | 66 | 4.0% |
| Native / Alaskan | 0 | 0.0% |
| White / Caucasian | 1,508 | 92.3% |
| Two or more Races | 81 | 5.0% |
| Some other Race | 0 | 0.0% |
| Total | 1,634 | 100.0% |
Ancestry in Church Hill
The most populous ancestries reported in Church Hill are German (535 | 32.7%), English (256 | 15.7%), Pennsylvania German (169 | 10.3%), American (164 | 10.0%), and Irish (146 | 8.9%), together accounting for 77.7% of all Church Hill residents.
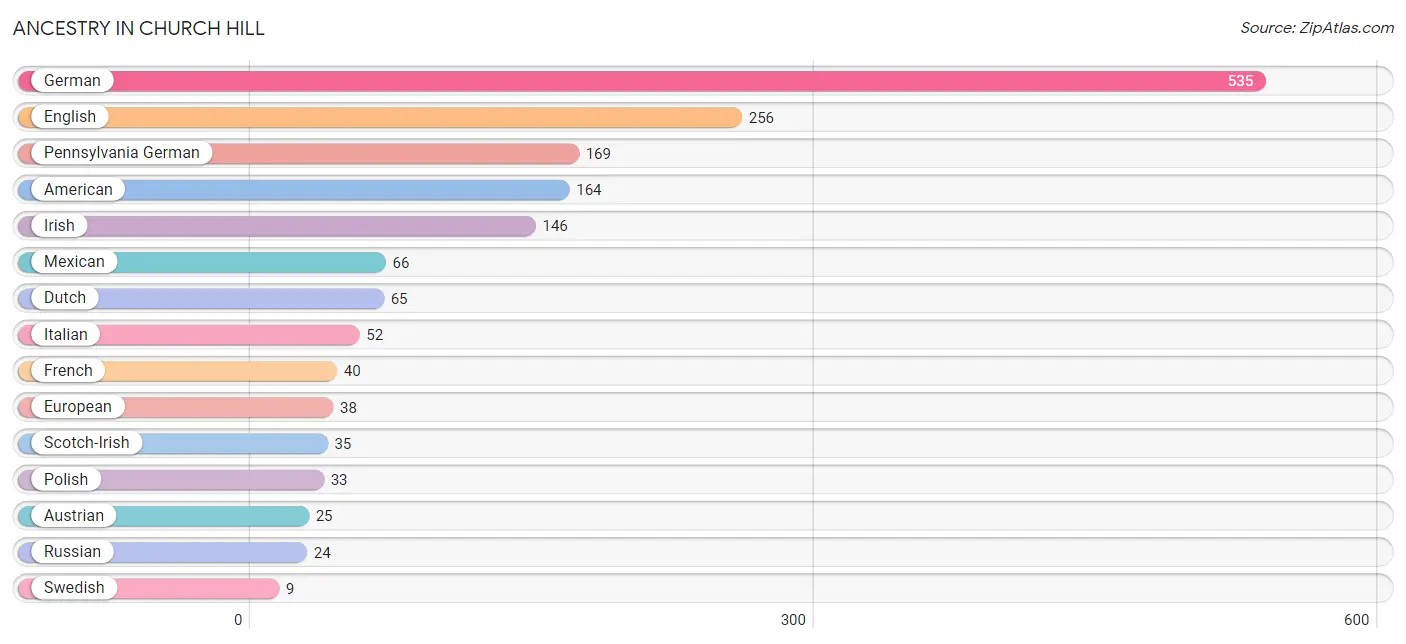
| Ancestry | # Population | % Population |
| American | 164 | 10.0% |
| Austrian | 25 | 1.5% |
| British | 8 | 0.5% |
| Danish | 6 | 0.4% |
| Dutch | 65 | 4.0% |
| English | 256 | 15.7% |
| European | 38 | 2.3% |
| French | 40 | 2.5% |
| German | 535 | 32.7% |
| Irish | 146 | 8.9% |
| Italian | 52 | 3.2% |
| Mexican | 66 | 4.0% |
| Pennsylvania German | 169 | 10.3% |
| Polish | 33 | 2.0% |
| Russian | 24 | 1.5% |
| Scotch-Irish | 35 | 2.1% |
| Scottish | 7 | 0.4% |
| Swedish | 9 | 0.5% |
| Ukrainian | 8 | 0.5% |
| Welsh | 9 | 0.5% | View All 20 Rows |
Immigrants in Church Hill

| Immigration Origin | # Population | % Population | View All 0 Rows |
Sex and Age in Church Hill
Sex and Age in Church Hill
The most populous age groups in Church Hill are 45 to 49 Years (94 | 11.9%) for men and 75 to 79 Years (126 | 14.9%) for women.
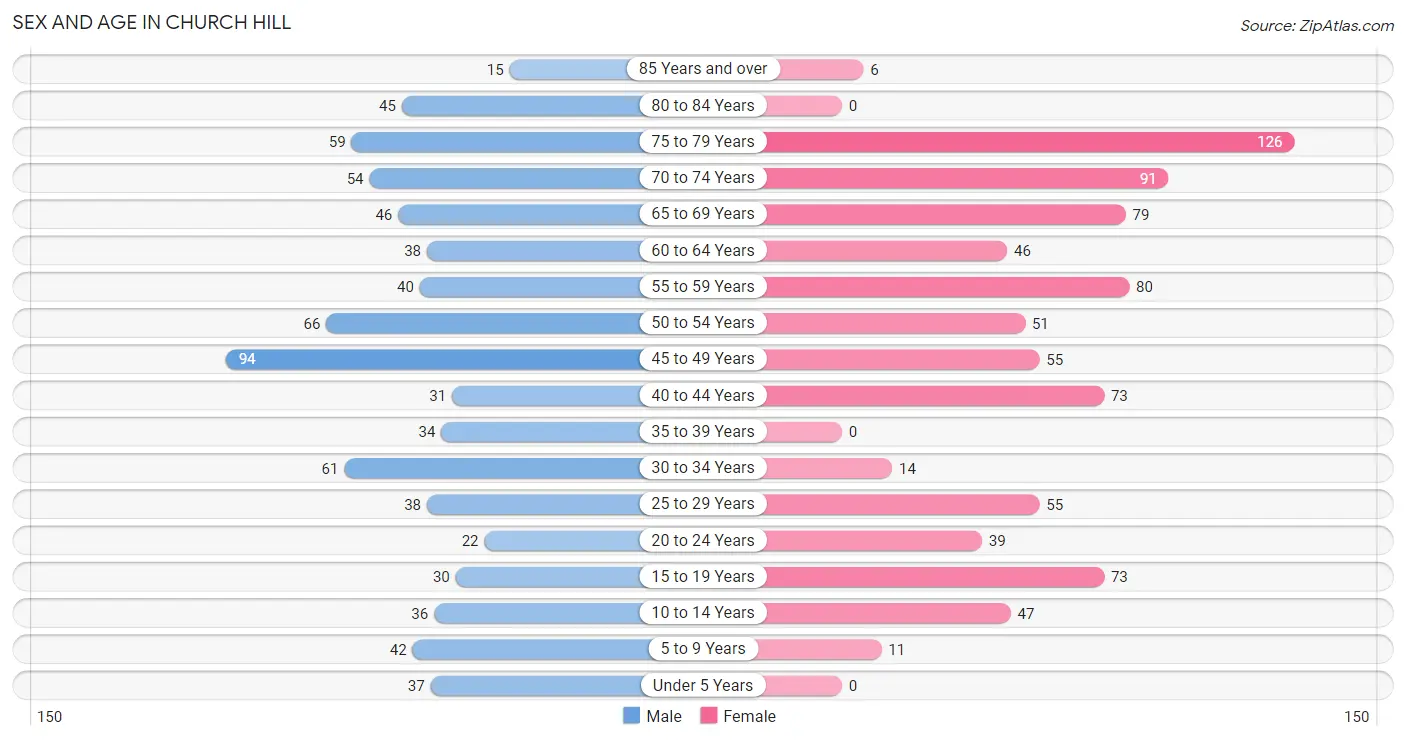
| Age Bracket | Male | Female |
| Under 5 Years | 37 (4.7%) | 0 (0.0%) |
| 5 to 9 Years | 42 (5.3%) | 11 (1.3%) |
| 10 to 14 Years | 36 (4.6%) | 47 (5.6%) |
| 15 to 19 Years | 30 (3.8%) | 73 (8.6%) |
| 20 to 24 Years | 22 (2.8%) | 39 (4.6%) |
| 25 to 29 Years | 38 (4.8%) | 55 (6.5%) |
| 30 to 34 Years | 61 (7.7%) | 14 (1.7%) |
| 35 to 39 Years | 34 (4.3%) | 0 (0.0%) |
| 40 to 44 Years | 31 (3.9%) | 73 (8.6%) |
| 45 to 49 Years | 94 (11.9%) | 55 (6.5%) |
| 50 to 54 Years | 66 (8.4%) | 51 (6.0%) |
| 55 to 59 Years | 40 (5.1%) | 80 (9.5%) |
| 60 to 64 Years | 38 (4.8%) | 46 (5.4%) |
| 65 to 69 Years | 46 (5.8%) | 79 (9.3%) |
| 70 to 74 Years | 54 (6.9%) | 91 (10.8%) |
| 75 to 79 Years | 59 (7.5%) | 126 (14.9%) |
| 80 to 84 Years | 45 (5.7%) | 0 (0.0%) |
| 85 Years and over | 15 (1.9%) | 6 (0.7%) |
| Total | 788 (100.0%) | 846 (100.0%) |
Families and Households in Church Hill
Median Family Size in Church Hill
The median family size in Church Hill is 2.54 persons per family, with single male/father families (11 | 2.2%) accounting for the largest median family size of 2.82 persons per family. On the other hand, single female/mother families (52 | 10.3%) represent the smallest median family size with 2.04 persons per family.
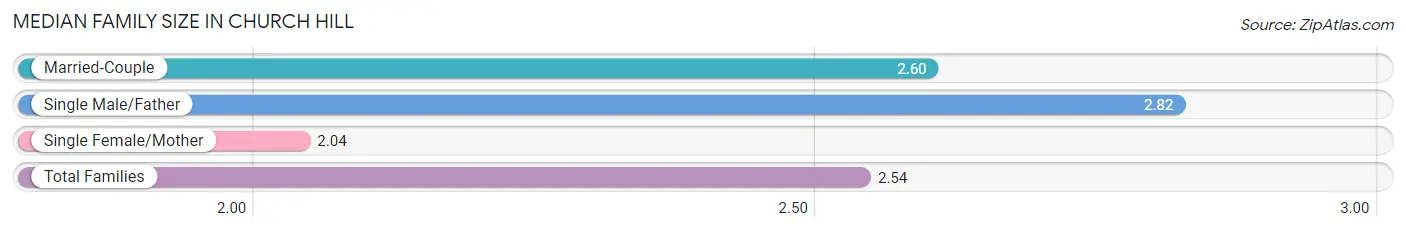
| Family Type | # Families | Family Size |
| Married-Couple | 444 (87.6%) | 2.60 |
| Single Male/Father | 11 (2.2%) | 2.82 |
| Single Female/Mother | 52 (10.3%) | 2.04 |
| Total Families | 507 (100.0%) | 2.54 |
Median Household Size in Church Hill
The median household size in Church Hill is 2.02 persons per household, with single male/father households (11 | 1.4%) accounting for the largest median household size of 2.82 persons per household. non-family households (301 | 37.2%) represent the smallest median household size with 1.10 persons per household.
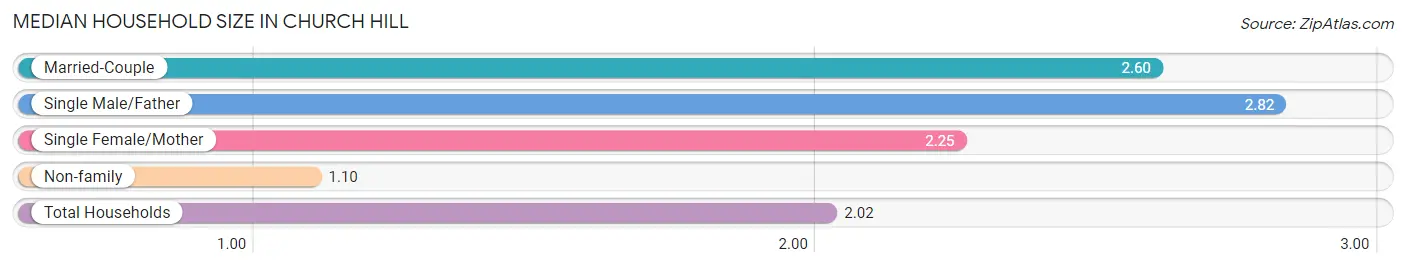
| Household Type | # Households | Household Size |
| Married-Couple | 444 (54.9%) | 2.60 |
| Single Male/Father | 11 (1.4%) | 2.82 |
| Single Female/Mother | 52 (6.4%) | 2.25 |
| Non-family | 301 (37.2%) | 1.10 |
| Total Households | 808 (100.0%) | 2.02 |
Household Size by Marriage Status in Church Hill
Out of a total of 808 households in Church Hill, 507 (62.7%) are family households, while 301 (37.2%) are nonfamily households. The most numerous type of family households are 2-person households, comprising 329, and the most common type of nonfamily households are 1-person households, comprising 268.
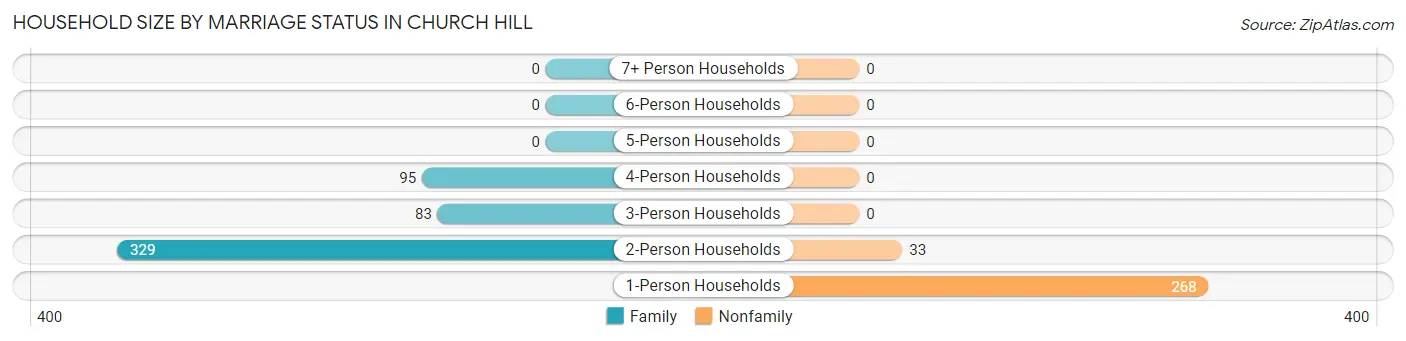
| Household Size | Family Households | Nonfamily Households |
| 1-Person Households | - | 268 (33.2%) |
| 2-Person Households | 329 (40.7%) | 33 (4.1%) |
| 3-Person Households | 83 (10.3%) | 0 (0.0%) |
| 4-Person Households | 95 (11.8%) | 0 (0.0%) |
| 5-Person Households | 0 (0.0%) | 0 (0.0%) |
| 6-Person Households | 0 (0.0%) | 0 (0.0%) |
| 7+ Person Households | 0 (0.0%) | 0 (0.0%) |
| Total | 507 (62.7%) | 301 (37.2%) |
Female Fertility in Church Hill
Fertility by Age in Church Hill
| Age Bracket | Women with Births | Births / 1,000 Women |
| 15 to 19 years | 0 (0.0%) | 0.0 |
| 20 to 34 years | 0 (0.0%) | 0.0 |
| 35 to 50 years | 0 (0.0%) | 0.0 |
| Total | 0 (0.0%) | 0.0 |
Fertility by Age by Marriage Status in Church Hill
| Age Bracket | Married | Unmarried |
| 15 to 19 years | 0 (0.0%) | 0 (0.0%) |
| 20 to 34 years | 0 (0.0%) | 0 (0.0%) |
| 35 to 50 years | 0 (0.0%) | 0 (0.0%) |
| Total | 0 (0.0%) | 0 (0.0%) |
Fertility by Education in Church Hill
| Educational Attainment | Women with Births | Births / 1,000 Women |
| Less than High School | 0 (0.0%) | 0.0 |
| High School Diploma | 0 (0.0%) | 0.0 |
| College or Associate's Degree | 0 (0.0%) | 0.0 |
| Bachelor's Degree | 0 (0.0%) | 0.0 |
| Graduate Degree | 0 (0.0%) | 0.0 |
| Total | 0 (0.0%) | 0.0 |
Fertility by Education by Marriage Status in Church Hill
| Educational Attainment | Married | Unmarried |
| Less than High School | 0 (0.0%) | 0 (0.0%) |
| High School Diploma | 0 (0.0%) | 0 (0.0%) |
| College or Associate's Degree | 0 (0.0%) | 0 (0.0%) |
| Bachelor's Degree | 0 (0.0%) | 0 (0.0%) |
| Graduate Degree | 0 (0.0%) | 0 (0.0%) |
| Total | 0 (0.0%) | 0 (0.0%) |
Employment Characteristics in Church Hill
Employment by Class of Employer in Church Hill
Among the 811 employed individuals in Church Hill, private company employees (363 | 44.8%), not-for-profit organizations (141 | 17.4%), and local government employees (91 | 11.2%) make up the most common classes of employment.
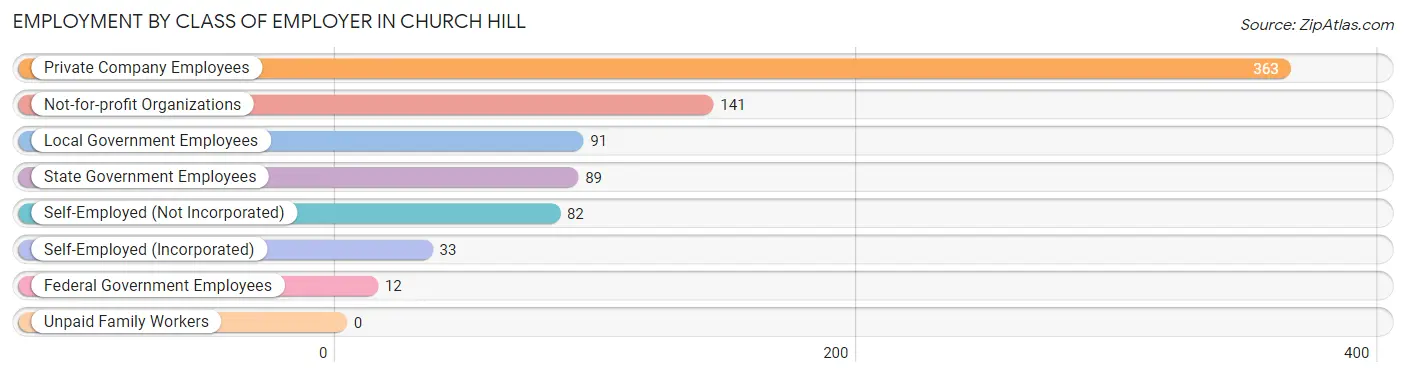
| Employer Class | # Employees | % Employees |
| Private Company Employees | 363 | 44.8% |
| Self-Employed (Incorporated) | 33 | 4.1% |
| Self-Employed (Not Incorporated) | 82 | 10.1% |
| Not-for-profit Organizations | 141 | 17.4% |
| Local Government Employees | 91 | 11.2% |
| State Government Employees | 89 | 11.0% |
| Federal Government Employees | 12 | 1.5% |
| Unpaid Family Workers | 0 | 0.0% |
| Total | 811 | 100.0% |
Employment Status by Age in Church Hill
According to the labor force statistics for Church Hill, out of the total population over 16 years of age (1,424), 59.8% or 852 individuals are in the labor force, with 0.9% or 8 of them unemployed. The age group with the highest labor force participation rate is 20 to 24 years, with 100.0% or 61 individuals in the labor force. Within the labor force, the 55 to 59 years age range has the highest percentage of unemployed individuals, with 11.3% or 8 of them being unemployed.
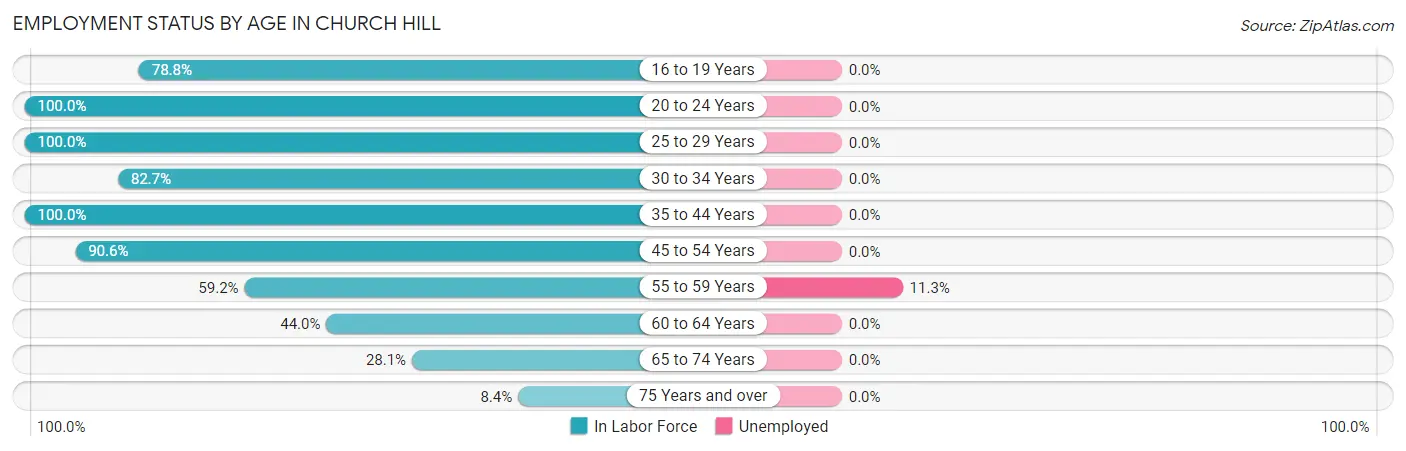
| Age Bracket | In Labor Force | Unemployed |
| 16 to 19 Years | 52 (78.8%) | 0 (0.0%) |
| 20 to 24 Years | 61 (100.0%) | 0 (0.0%) |
| 25 to 29 Years | 93 (100.0%) | 0 (0.0%) |
| 30 to 34 Years | 62 (82.7%) | 0 (0.0%) |
| 35 to 44 Years | 138 (100.0%) | 0 (0.0%) |
| 45 to 54 Years | 241 (90.6%) | 0 (0.0%) |
| 55 to 59 Years | 71 (59.2%) | 8 (11.3%) |
| 60 to 64 Years | 37 (44.0%) | 0 (0.0%) |
| 65 to 74 Years | 76 (28.1%) | 0 (0.0%) |
| 75 Years and over | 21 (8.4%) | 0 (0.0%) |
| Total | 852 (59.8%) | 8 (0.9%) |
Employment Status by Educational Attainment in Church Hill
According to labor force statistics for Church Hill, 82.7% of individuals (642) out of the total population between 25 and 64 years of age (776) are in the labor force, with 1.2% or 8 of them being unemployed. The group with the highest labor force participation rate are those with the educational attainment of less than high school, with 100.0% or 11 individuals in the labor force. Within the labor force, individuals with high school diploma education have the highest percentage of unemployment, with 3.5% or 8 of them being unemployed.
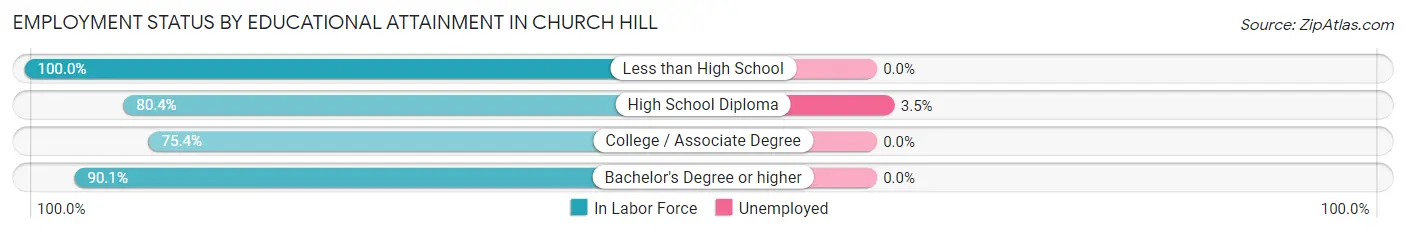
| Educational Attainment | In Labor Force | Unemployed |
| Less than High School | 11 (100.0%) | 0 (0.0%) |
| High School Diploma | 226 (80.4%) | 10 (3.5%) |
| College / Associate Degree | 159 (75.4%) | 0 (0.0%) |
| Bachelor's Degree or higher | 246 (90.1%) | 0 (0.0%) |
| Total | 642 (82.7%) | 9 (1.2%) |
Employment Occupations by Sex in Church Hill
Management, Business, Science and Arts Occupations
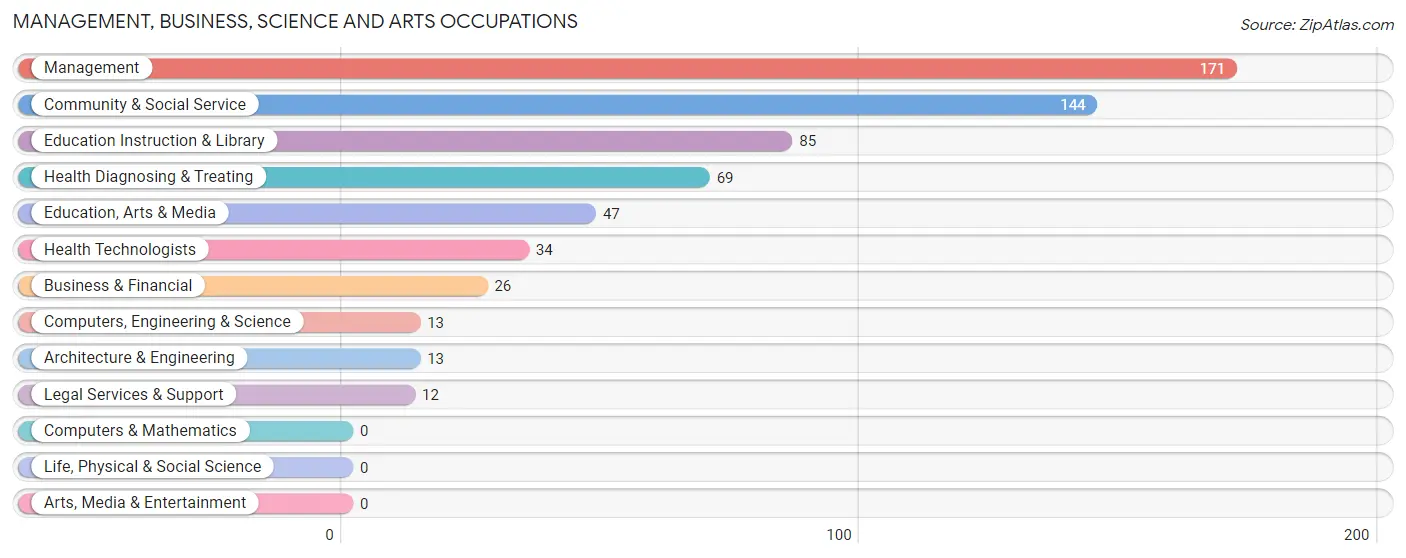
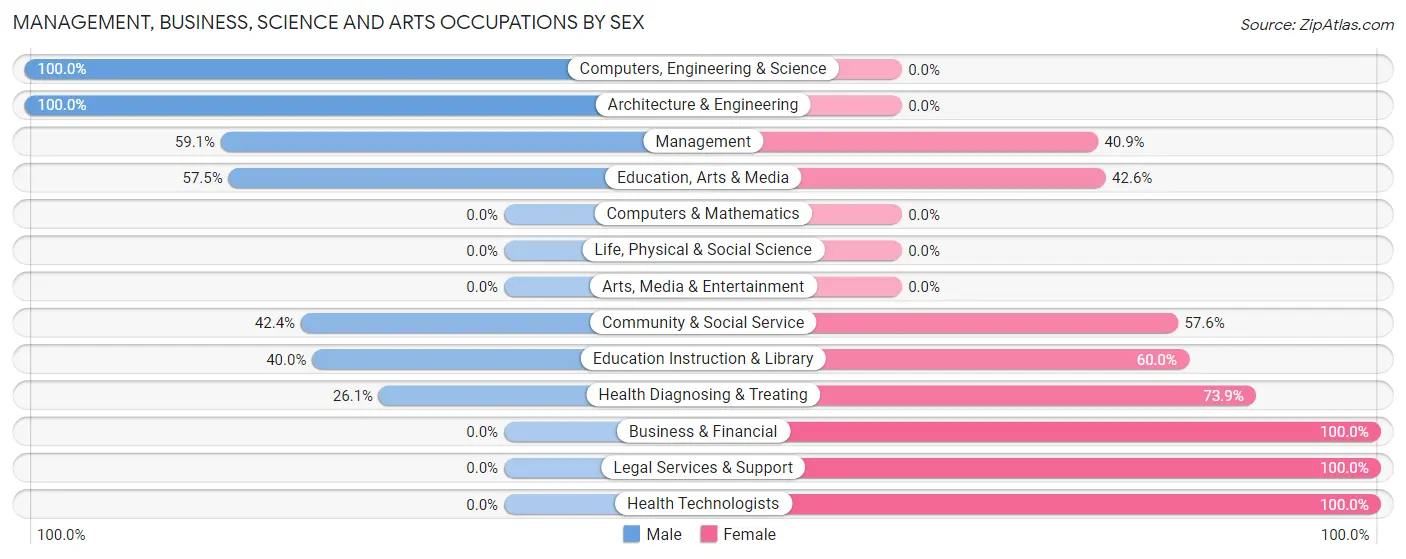
The most common Management, Business, Science and Arts occupations in Church Hill are Management (171 | 20.3%), Community & Social Service (144 | 17.1%), Education Instruction & Library (85 | 10.1%), Health Diagnosing & Treating (69 | 8.2%), and Education, Arts & Media (47 | 5.6%).
Management, Business, Science and Arts Occupations by Sex
Within the Management, Business, Science and Arts occupations in Church Hill, the most male-oriented occupations are Computers, Engineering & Science (100.0%), Architecture & Engineering (100.0%), and Management (59.1%), while the most female-oriented occupations are Business & Financial (100.0%), Legal Services & Support (100.0%), and Health Technologists (100.0%).
| Occupation | Male | Female |
| Management | 101 (59.1%) | 70 (40.9%) |
| Business & Financial | 0 (0.0%) | 26 (100.0%) |
| Computers, Engineering & Science | 13 (100.0%) | 0 (0.0%) |
| Computers & Mathematics | 0 (0.0%) | 0 (0.0%) |
| Architecture & Engineering | 13 (100.0%) | 0 (0.0%) |
| Life, Physical & Social Science | 0 (0.0%) | 0 (0.0%) |
| Community & Social Service | 61 (42.4%) | 83 (57.6%) |
| Education, Arts & Media | 27 (57.5%) | 20 (42.5%) |
| Legal Services & Support | 0 (0.0%) | 12 (100.0%) |
| Education Instruction & Library | 34 (40.0%) | 51 (60.0%) |
| Arts, Media & Entertainment | 0 (0.0%) | 0 (0.0%) |
| Health Diagnosing & Treating | 18 (26.1%) | 51 (73.9%) |
| Health Technologists | 0 (0.0%) | 34 (100.0%) |
| Total (Category) | 193 (45.6%) | 230 (54.4%) |
| Total (Overall) | 428 (50.7%) | 416 (49.3%) |
Services Occupations
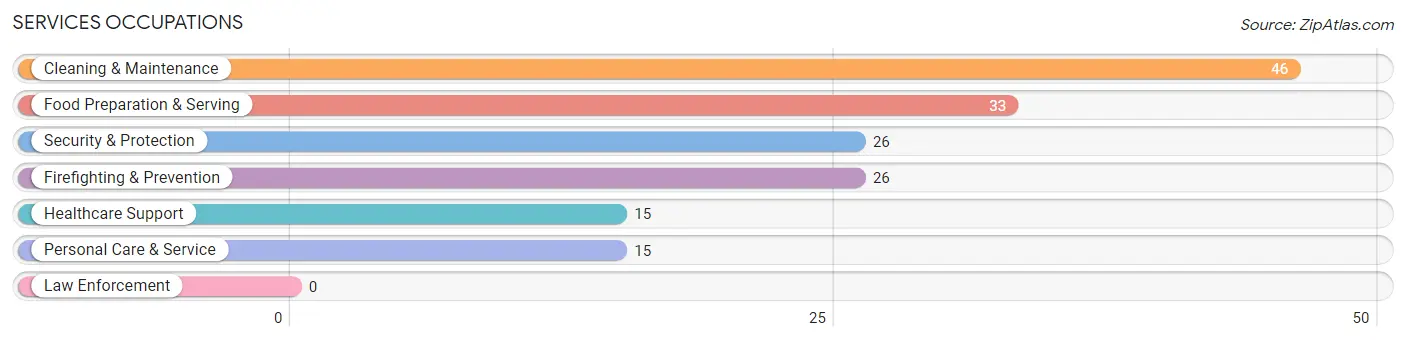
The most common Services occupations in Church Hill are Cleaning & Maintenance (46 | 5.4%), Food Preparation & Serving (33 | 3.9%), Security & Protection (26 | 3.1%), Firefighting & Prevention (26 | 3.1%), and Healthcare Support (15 | 1.8%).
Services Occupations by Sex
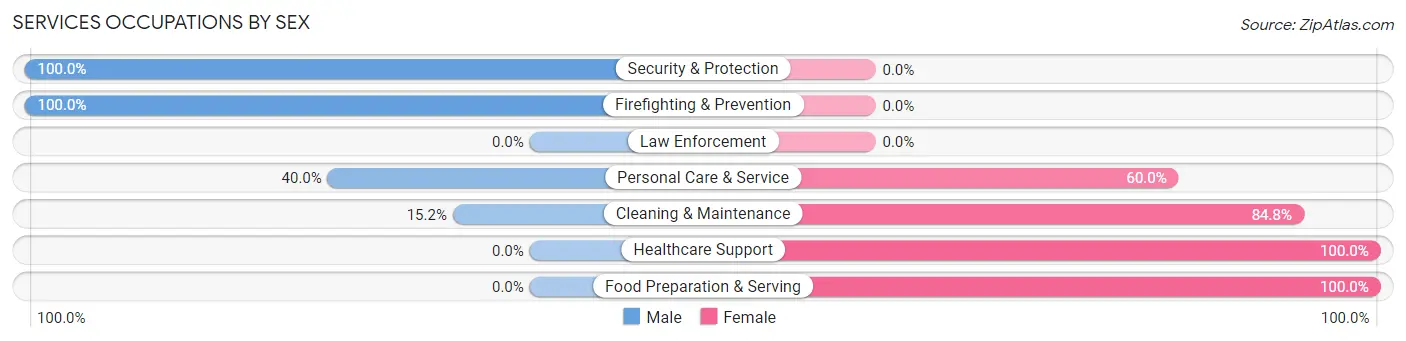
Within the Services occupations in Church Hill, the most male-oriented occupations are Security & Protection (100.0%), Firefighting & Prevention (100.0%), and Personal Care & Service (40.0%), while the most female-oriented occupations are Healthcare Support (100.0%), Food Preparation & Serving (100.0%), and Cleaning & Maintenance (84.8%).
| Occupation | Male | Female |
| Healthcare Support | 0 (0.0%) | 15 (100.0%) |
| Security & Protection | 26 (100.0%) | 0 (0.0%) |
| Firefighting & Prevention | 26 (100.0%) | 0 (0.0%) |
| Law Enforcement | 0 (0.0%) | 0 (0.0%) |
| Food Preparation & Serving | 0 (0.0%) | 33 (100.0%) |
| Cleaning & Maintenance | 7 (15.2%) | 39 (84.8%) |
| Personal Care & Service | 6 (40.0%) | 9 (60.0%) |
| Total (Category) | 39 (28.9%) | 96 (71.1%) |
| Total (Overall) | 428 (50.7%) | 416 (49.3%) |
Sales and Office Occupations
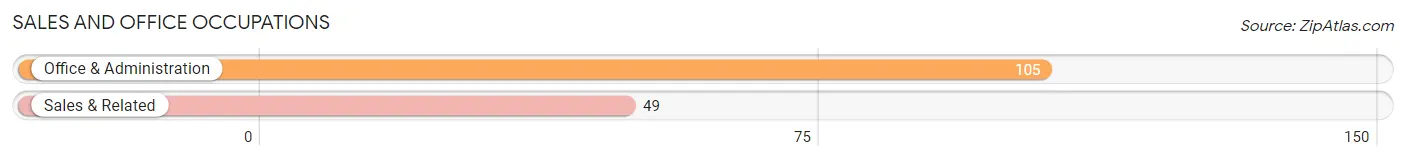
The most common Sales and Office occupations in Church Hill are Office & Administration (105 | 12.4%), and Sales & Related (49 | 5.8%).
Sales and Office Occupations by Sex
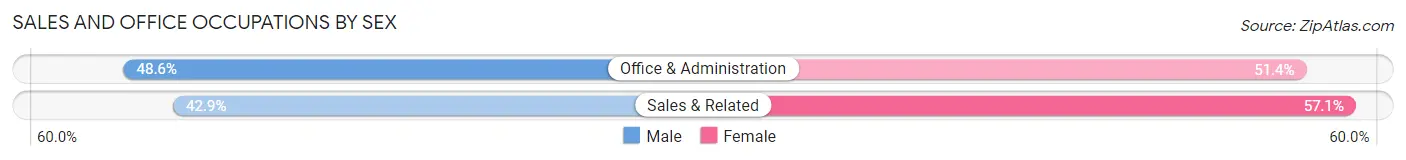
| Occupation | Male | Female |
| Sales & Related | 21 (42.9%) | 28 (57.1%) |
| Office & Administration | 51 (48.6%) | 54 (51.4%) |
| Total (Category) | 72 (46.8%) | 82 (53.2%) |
| Total (Overall) | 428 (50.7%) | 416 (49.3%) |
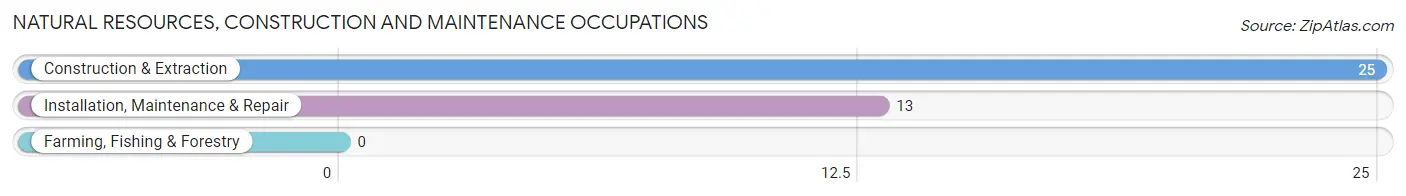
Natural Resources, Construction and Maintenance Occupations
The most common Natural Resources, Construction and Maintenance occupations in Church Hill are Construction & Extraction (25 | 3.0%), and Installation, Maintenance & Repair (13 | 1.5%).
Natural Resources, Construction and Maintenance Occupations by Sex
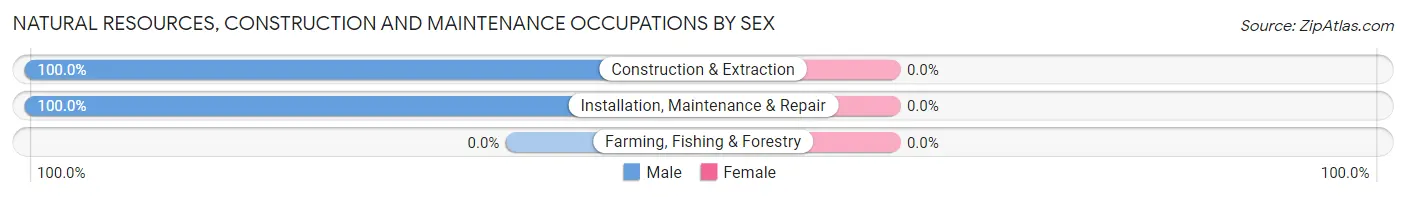
| Occupation | Male | Female |
| Farming, Fishing & Forestry | 0 (0.0%) | 0 (0.0%) |
| Construction & Extraction | 25 (100.0%) | 0 (0.0%) |
| Installation, Maintenance & Repair | 13 (100.0%) | 0 (0.0%) |
| Total (Category) | 38 (100.0%) | 0 (0.0%) |
| Total (Overall) | 428 (50.7%) | 416 (49.3%) |
Production, Transportation and Moving Occupations
The most common Production, Transportation and Moving occupations in Church Hill are Production (61 | 7.2%), Material Moving (17 | 2.0%), and Transportation (16 | 1.9%).
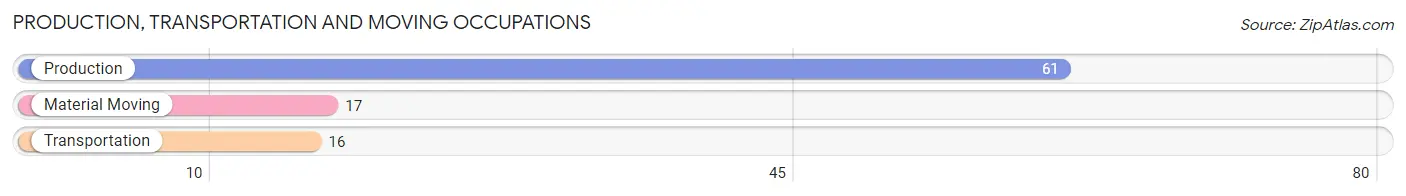
Production, Transportation and Moving Occupations by Sex
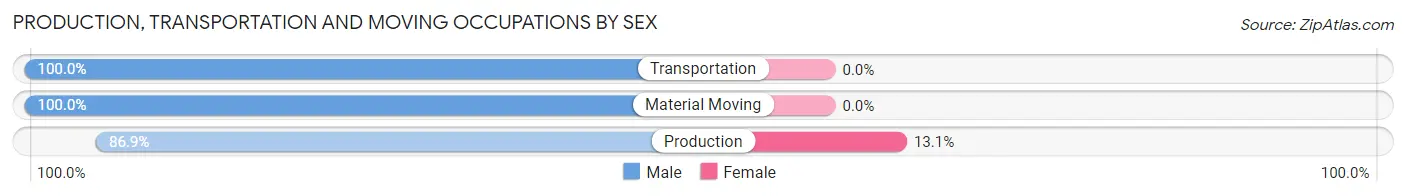
| Occupation | Male | Female |
| Production | 53 (86.9%) | 8 (13.1%) |
| Transportation | 16 (100.0%) | 0 (0.0%) |
| Material Moving | 17 (100.0%) | 0 (0.0%) |
| Total (Category) | 86 (91.5%) | 8 (8.5%) |
| Total (Overall) | 428 (50.7%) | 416 (49.3%) |
Employment Industries by Sex in Church Hill
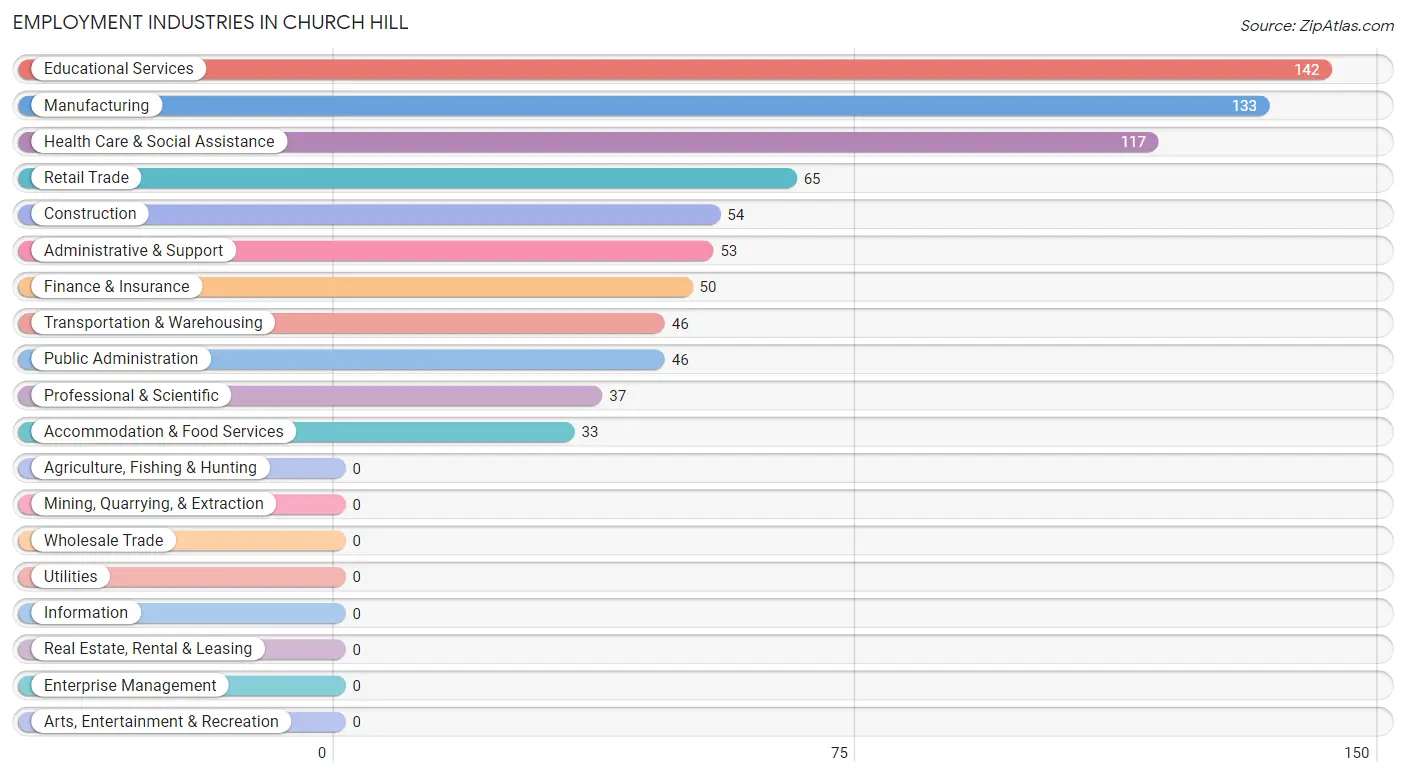
Employment Industries in Church Hill
The major employment industries in Church Hill include Educational Services (142 | 16.8%), Manufacturing (133 | 15.8%), Health Care & Social Assistance (117 | 13.9%), Retail Trade (65 | 7.7%), and Construction (54 | 6.4%).
Employment Industries by Sex in Church Hill
The Church Hill industries that see more men than women are Construction (100.0%), Transportation & Warehousing (100.0%), and Manufacturing (87.2%), whereas the industries that tend to have a higher number of women are Finance & Insurance (100.0%), Professional & Scientific (100.0%), and Accommodation & Food Services (100.0%).
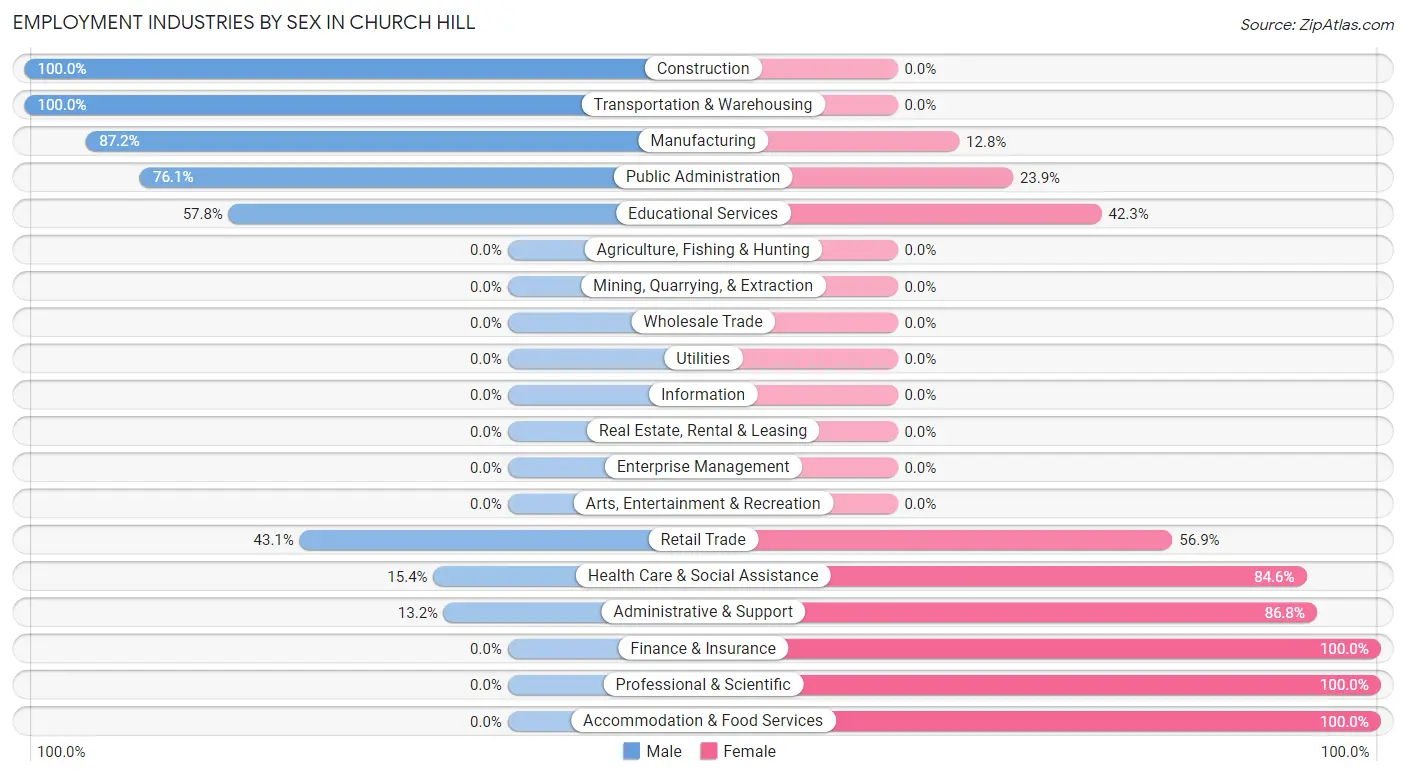
| Industry | Male | Female |
| Agriculture, Fishing & Hunting | 0 (0.0%) | 0 (0.0%) |
| Mining, Quarrying, & Extraction | 0 (0.0%) | 0 (0.0%) |
| Construction | 54 (100.0%) | 0 (0.0%) |
| Manufacturing | 116 (87.2%) | 17 (12.8%) |
| Wholesale Trade | 0 (0.0%) | 0 (0.0%) |
| Retail Trade | 28 (43.1%) | 37 (56.9%) |
| Transportation & Warehousing | 46 (100.0%) | 0 (0.0%) |
| Utilities | 0 (0.0%) | 0 (0.0%) |
| Information | 0 (0.0%) | 0 (0.0%) |
| Finance & Insurance | 0 (0.0%) | 50 (100.0%) |
| Real Estate, Rental & Leasing | 0 (0.0%) | 0 (0.0%) |
| Professional & Scientific | 0 (0.0%) | 37 (100.0%) |
| Enterprise Management | 0 (0.0%) | 0 (0.0%) |
| Administrative & Support | 7 (13.2%) | 46 (86.8%) |
| Educational Services | 82 (57.8%) | 60 (42.2%) |
| Health Care & Social Assistance | 18 (15.4%) | 99 (84.6%) |
| Arts, Entertainment & Recreation | 0 (0.0%) | 0 (0.0%) |
| Accommodation & Food Services | 0 (0.0%) | 33 (100.0%) |
| Public Administration | 35 (76.1%) | 11 (23.9%) |
| Total | 428 (50.7%) | 416 (49.3%) |
Education in Church Hill
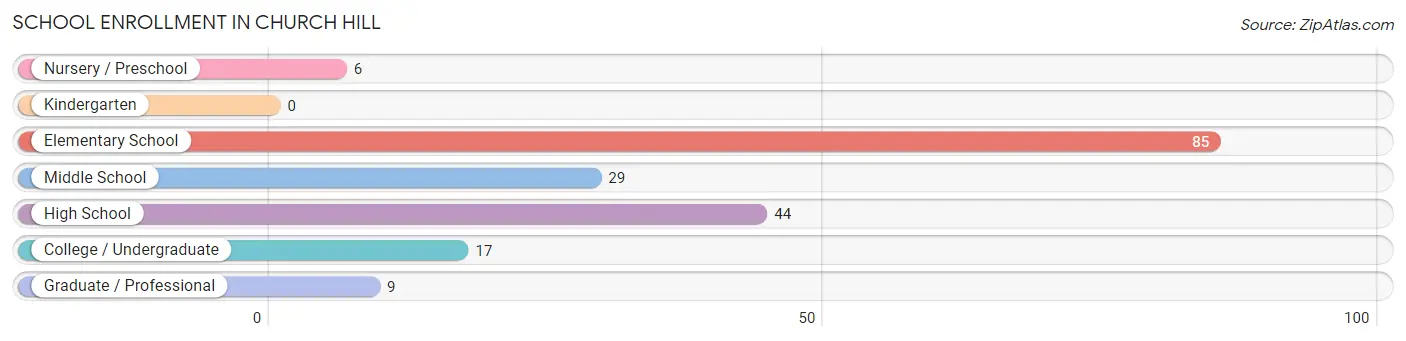
School Enrollment in Church Hill
The most common levels of schooling among the 190 students in Church Hill are elementary school (85 | 44.7%), high school (44 | 23.2%), and middle school (29 | 15.3%).
| School Level | # Students | % Students |
| Nursery / Preschool | 6 | 3.2% |
| Kindergarten | 0 | 0.0% |
| Elementary School | 85 | 44.7% |
| Middle School | 29 | 15.3% |
| High School | 44 | 23.2% |
| College / Undergraduate | 17 | 8.9% |
| Graduate / Professional | 9 | 4.7% |
| Total | 190 | 100.0% |
School Enrollment by Age by Funding Source in Church Hill
Out of a total of 190 students who are enrolled in schools in Church Hill, 63 (33.2%) attend a private institution, while the remaining 127 (66.8%) are enrolled in public schools. The age group of 18 to 19 year olds has the highest likelihood of being enrolled in private schools, with 8 (100.0% in the age bracket) enrolled. Conversely, the age group of 10 to 14 year olds has the lowest likelihood of being enrolled in a private school, with 70 (100.0% in the age bracket) attending a public institution.
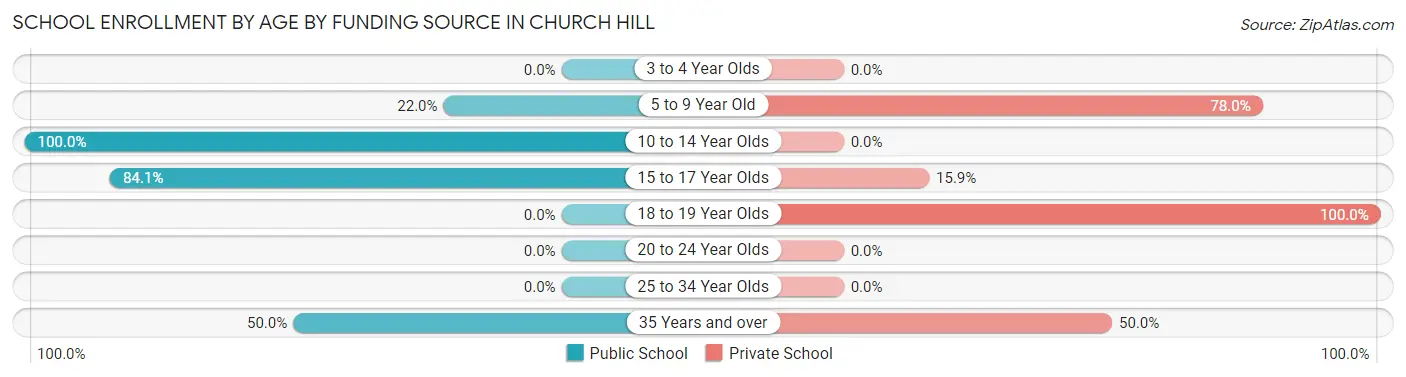
| Age Bracket | Public School | Private School |
| 3 to 4 Year Olds | 0 (0.0%) | 0 (0.0%) |
| 5 to 9 Year Old | 11 (22.0%) | 39 (78.0%) |
| 10 to 14 Year Olds | 70 (100.0%) | 0 (0.0%) |
| 15 to 17 Year Olds | 37 (84.1%) | 7 (15.9%) |
| 18 to 19 Year Olds | 0 (0.0%) | 8 (100.0%) |
| 20 to 24 Year Olds | 0 (0.0%) | 0 (0.0%) |
| 25 to 34 Year Olds | 0 (0.0%) | 0 (0.0%) |
| 35 Years and over | 9 (50.0%) | 9 (50.0%) |
| Total | 127 (66.8%) | 63 (33.2%) |
Educational Attainment by Field of Study in Church Hill
Education (155 | 36.6%), business (47 | 11.1%), bio, nature & agricultural (44 | 10.4%), arts & humanities (42 | 9.9%), and psychology (39 | 9.2%) are the most common fields of study among 423 individuals in Church Hill who have obtained a bachelor's degree or higher.
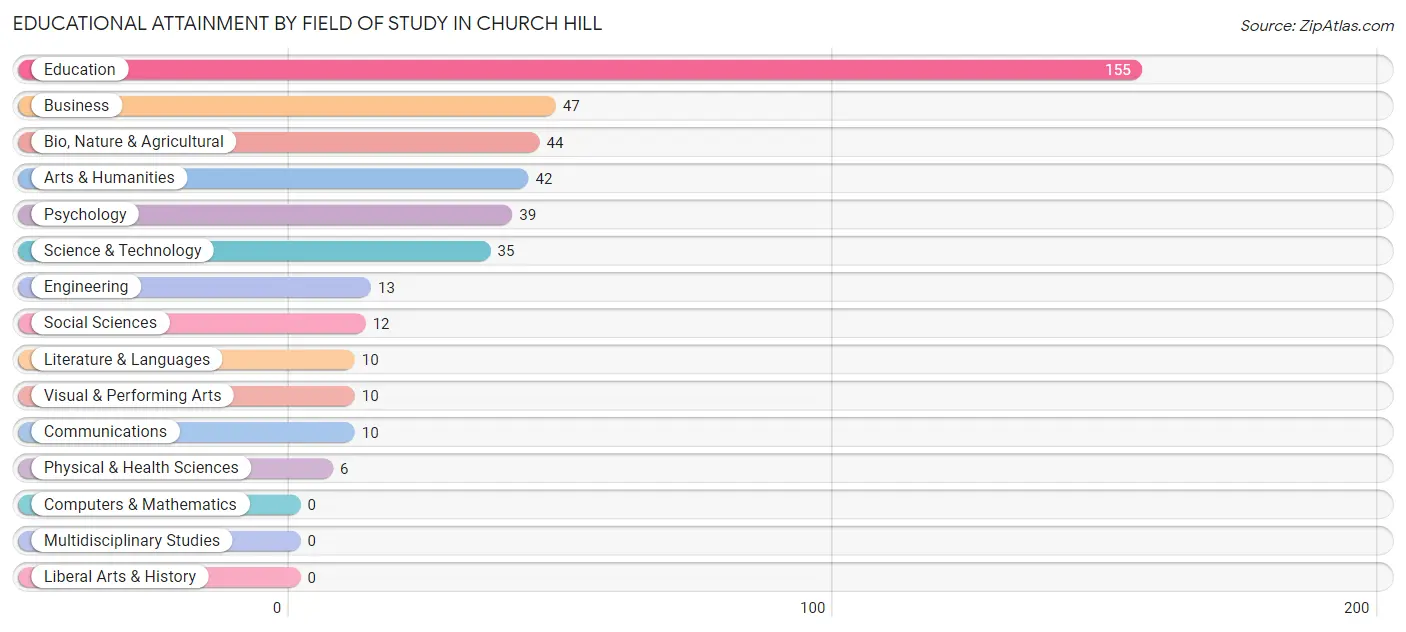
| Field of Study | # Graduates | % Graduates |
| Computers & Mathematics | 0 | 0.0% |
| Bio, Nature & Agricultural | 44 | 10.4% |
| Physical & Health Sciences | 6 | 1.4% |
| Psychology | 39 | 9.2% |
| Social Sciences | 12 | 2.8% |
| Engineering | 13 | 3.1% |
| Multidisciplinary Studies | 0 | 0.0% |
| Science & Technology | 35 | 8.3% |
| Business | 47 | 11.1% |
| Education | 155 | 36.6% |
| Literature & Languages | 10 | 2.4% |
| Liberal Arts & History | 0 | 0.0% |
| Visual & Performing Arts | 10 | 2.4% |
| Communications | 10 | 2.4% |
| Arts & Humanities | 42 | 9.9% |
| Total | 423 | 100.0% |
Transportation & Commute in Church Hill
Vehicle Availability by Sex in Church Hill
The most prevalent vehicle ownership categories in Church Hill are males with 2 vehicles (231, accounting for 54.0%) and females with 2 vehicles (221, making up 60.3%).
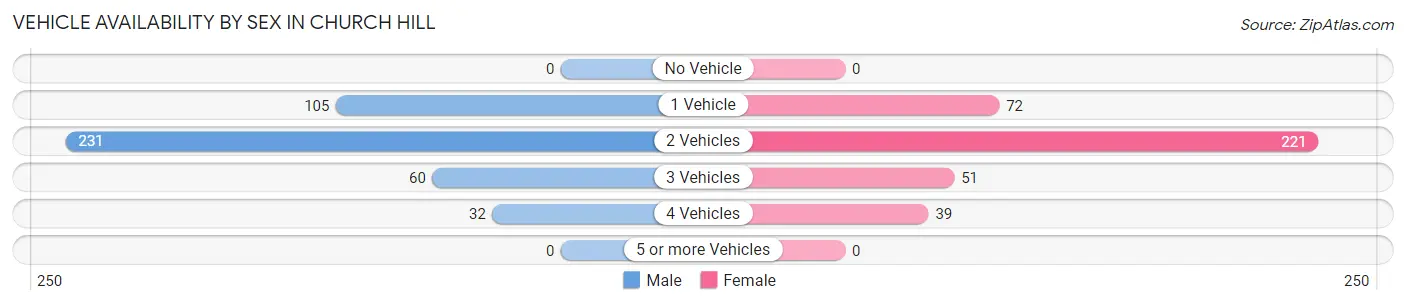
| Vehicles Available | Male | Female |
| No Vehicle | 0 (0.0%) | 0 (0.0%) |
| 1 Vehicle | 105 (24.5%) | 72 (18.8%) |
| 2 Vehicles | 231 (54.0%) | 221 (57.7%) |
| 3 Vehicles | 60 (14.0%) | 51 (13.3%) |
| 4 Vehicles | 32 (7.5%) | 39 (10.2%) |
| 5 or more Vehicles | 0 (0.0%) | 0 (0.0%) |
| Total | 428 (100.0%) | 383 (100.0%) |
Commute Time in Church Hill
The most frequently occuring commute durations in Church Hill are 10 to 14 minutes (268 commuters, 34.0%), 15 to 19 minutes (139 commuters, 17.6%), and 5 to 9 minutes (112 commuters, 14.2%).
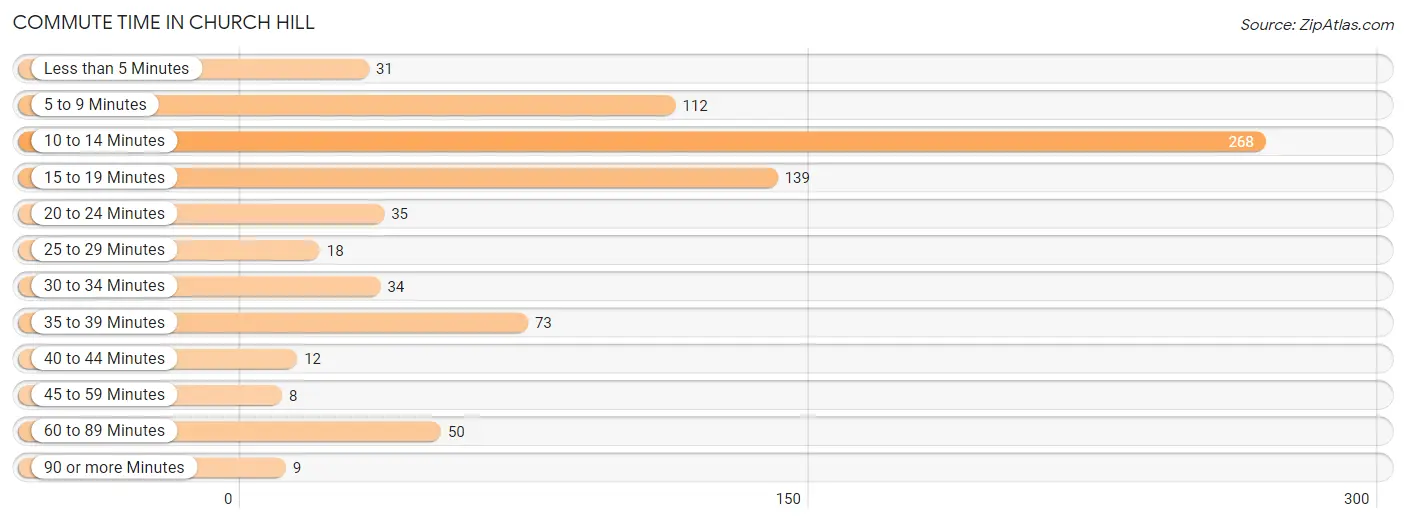
| Commute Time | # Commuters | % Commuters |
| Less than 5 Minutes | 31 | 3.9% |
| 5 to 9 Minutes | 112 | 14.2% |
| 10 to 14 Minutes | 268 | 34.0% |
| 15 to 19 Minutes | 139 | 17.6% |
| 20 to 24 Minutes | 35 | 4.4% |
| 25 to 29 Minutes | 18 | 2.3% |
| 30 to 34 Minutes | 34 | 4.3% |
| 35 to 39 Minutes | 73 | 9.2% |
| 40 to 44 Minutes | 12 | 1.5% |
| 45 to 59 Minutes | 8 | 1.0% |
| 60 to 89 Minutes | 50 | 6.3% |
| 90 or more Minutes | 9 | 1.1% |
Commute Time by Sex in Church Hill
The most common commute times in Church Hill are 10 to 14 minutes (123 commuters, 29.6%) for males and 10 to 14 minutes (145 commuters, 38.8%) for females.
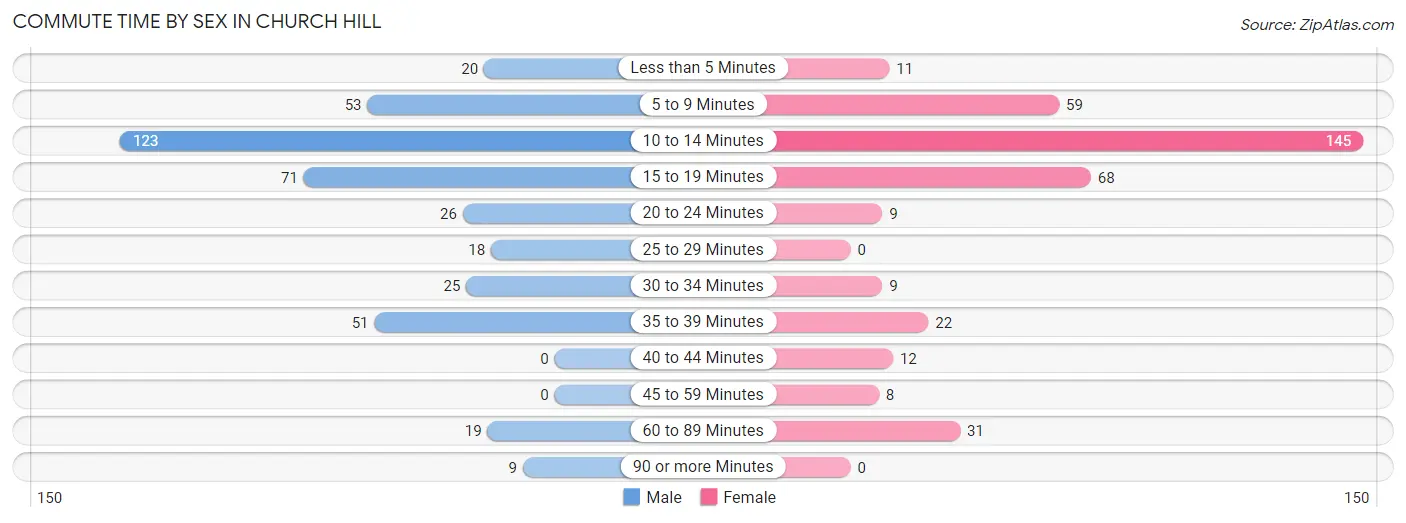
| Commute Time | Male | Female |
| Less than 5 Minutes | 20 (4.8%) | 11 (2.9%) |
| 5 to 9 Minutes | 53 (12.8%) | 59 (15.8%) |
| 10 to 14 Minutes | 123 (29.6%) | 145 (38.8%) |
| 15 to 19 Minutes | 71 (17.1%) | 68 (18.2%) |
| 20 to 24 Minutes | 26 (6.3%) | 9 (2.4%) |
| 25 to 29 Minutes | 18 (4.3%) | 0 (0.0%) |
| 30 to 34 Minutes | 25 (6.0%) | 9 (2.4%) |
| 35 to 39 Minutes | 51 (12.3%) | 22 (5.9%) |
| 40 to 44 Minutes | 0 (0.0%) | 12 (3.2%) |
| 45 to 59 Minutes | 0 (0.0%) | 8 (2.1%) |
| 60 to 89 Minutes | 19 (4.6%) | 31 (8.3%) |
| 90 or more Minutes | 9 (2.2%) | 0 (0.0%) |
Time of Departure to Work by Sex in Church Hill
The most frequent times of departure to work in Church Hill are 7:00 AM to 7:29 AM (79, 19.0%) for males and 7:00 AM to 7:29 AM (161, 43.0%) for females.
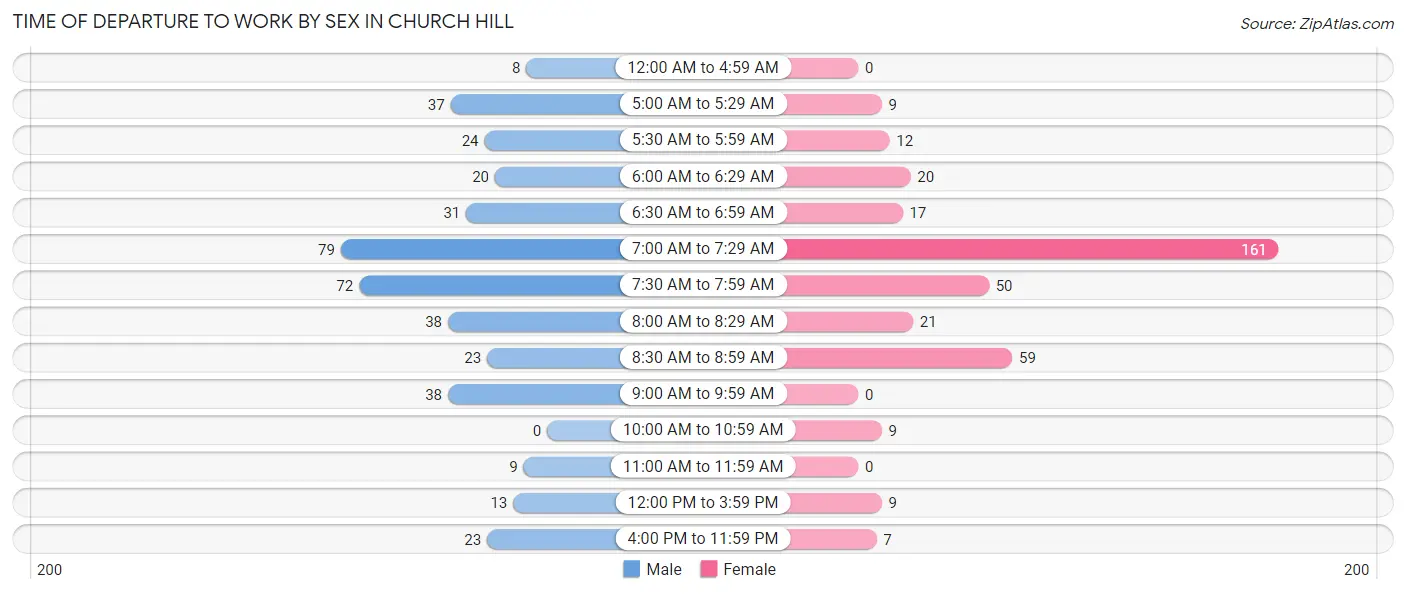
| Time of Departure | Male | Female |
| 12:00 AM to 4:59 AM | 8 (1.9%) | 0 (0.0%) |
| 5:00 AM to 5:29 AM | 37 (8.9%) | 9 (2.4%) |
| 5:30 AM to 5:59 AM | 24 (5.8%) | 12 (3.2%) |
| 6:00 AM to 6:29 AM | 20 (4.8%) | 20 (5.3%) |
| 6:30 AM to 6:59 AM | 31 (7.5%) | 17 (4.5%) |
| 7:00 AM to 7:29 AM | 79 (19.0%) | 161 (43.0%) |
| 7:30 AM to 7:59 AM | 72 (17.3%) | 50 (13.4%) |
| 8:00 AM to 8:29 AM | 38 (9.2%) | 21 (5.6%) |
| 8:30 AM to 8:59 AM | 23 (5.5%) | 59 (15.8%) |
| 9:00 AM to 9:59 AM | 38 (9.2%) | 0 (0.0%) |
| 10:00 AM to 10:59 AM | 0 (0.0%) | 9 (2.4%) |
| 11:00 AM to 11:59 AM | 9 (2.2%) | 0 (0.0%) |
| 12:00 PM to 3:59 PM | 13 (3.1%) | 9 (2.4%) |
| 4:00 PM to 11:59 PM | 23 (5.5%) | 7 (1.9%) |
| Total | 415 (100.0%) | 374 (100.0%) |
Housing Occupancy in Church Hill
Occupancy by Ownership in Church Hill
Of the total 808 dwellings in Church Hill, owner-occupied units account for 625 (77.3%), while renter-occupied units make up 183 (22.7%).
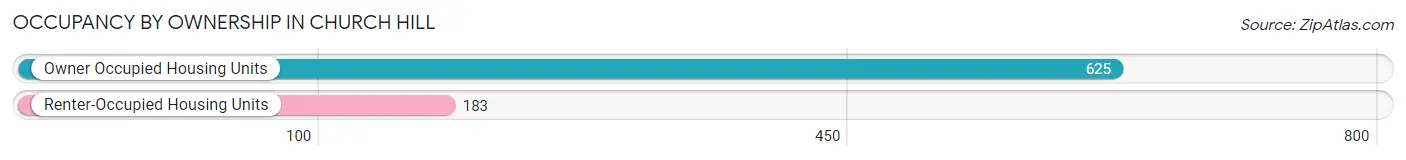
| Occupancy | # Housing Units | % Housing Units |
| Owner Occupied Housing Units | 625 | 77.3% |
| Renter-Occupied Housing Units | 183 | 22.7% |
| Total Occupied Housing Units | 808 | 100.0% |
Occupancy by Household Size in Church Hill
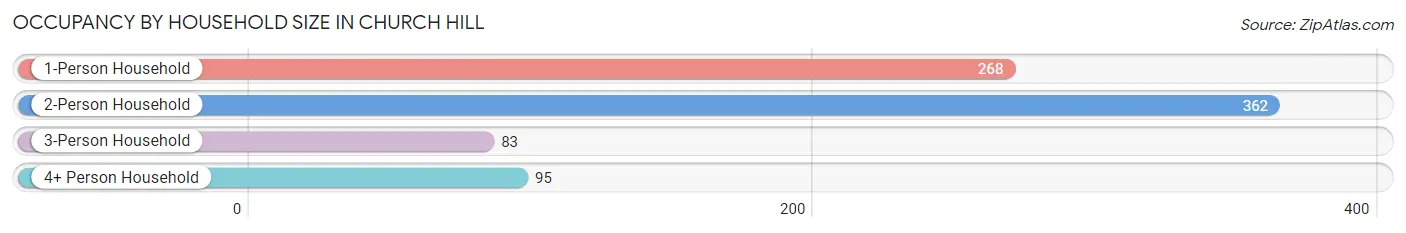
| Household Size | # Housing Units | % Housing Units |
| 1-Person Household | 268 | 33.2% |
| 2-Person Household | 362 | 44.8% |
| 3-Person Household | 83 | 10.3% |
| 4+ Person Household | 95 | 11.8% |
| Total Housing Units | 808 | 100.0% |
Occupancy by Ownership by Household Size in Church Hill
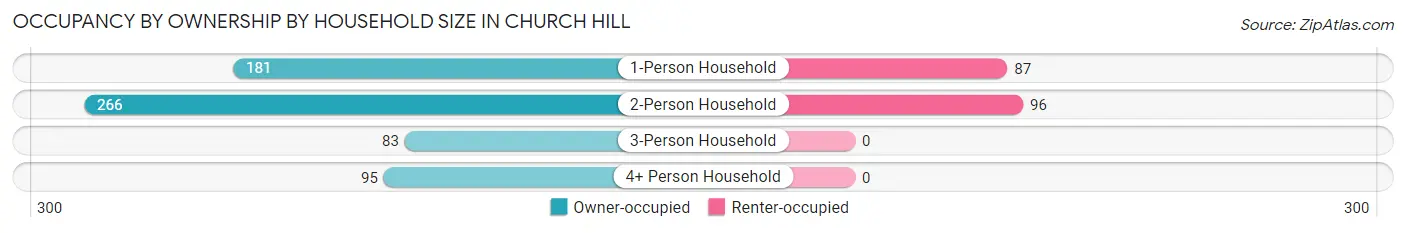
| Household Size | Owner-occupied | Renter-occupied |
| 1-Person Household | 181 (67.5%) | 87 (32.5%) |
| 2-Person Household | 266 (73.5%) | 96 (26.5%) |
| 3-Person Household | 83 (100.0%) | 0 (0.0%) |
| 4+ Person Household | 95 (100.0%) | 0 (0.0%) |
| Total Housing Units | 625 (77.3%) | 183 (22.7%) |
Occupancy by Educational Attainment in Church Hill
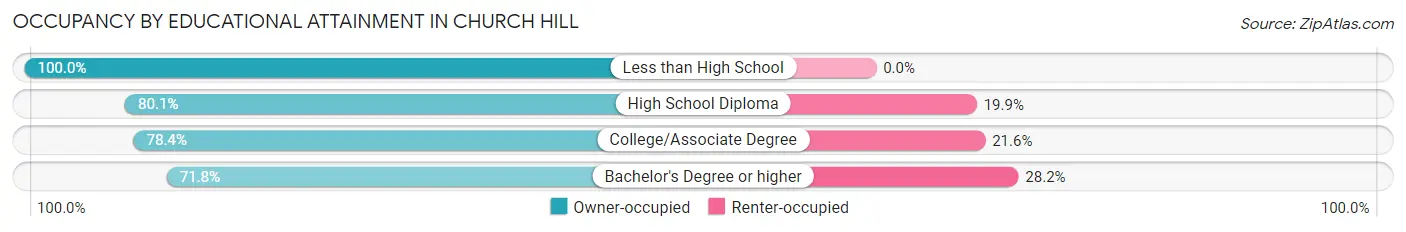
| Household Size | Owner-occupied | Renter-occupied |
| Less than High School | 29 (100.0%) | 0 (0.0%) |
| High School Diploma | 261 (80.1%) | 65 (19.9%) |
| College/Associate Degree | 116 (78.4%) | 32 (21.6%) |
| Bachelor's Degree or higher | 219 (71.8%) | 86 (28.2%) |
Occupancy by Age of Householder in Church Hill
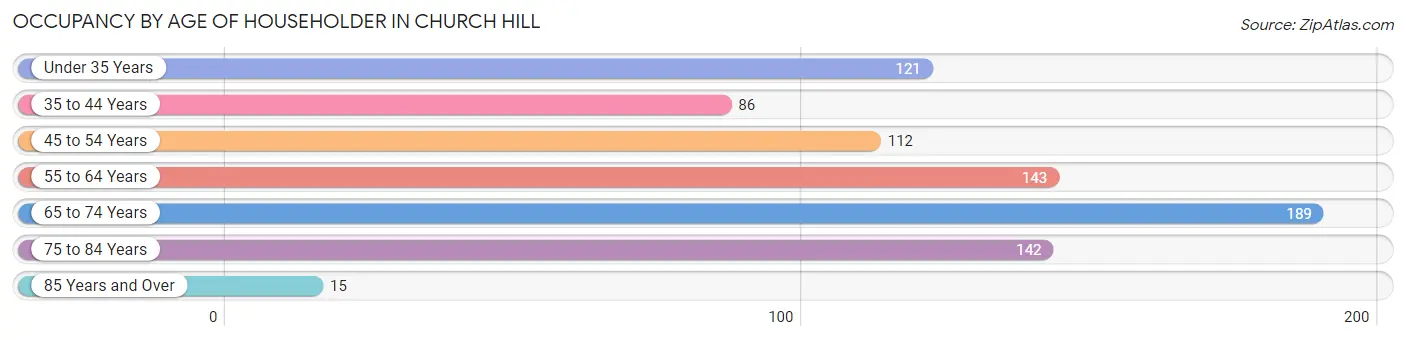
| Age Bracket | # Households | % Households |
| Under 35 Years | 121 | 15.0% |
| 35 to 44 Years | 86 | 10.6% |
| 45 to 54 Years | 112 | 13.9% |
| 55 to 64 Years | 143 | 17.7% |
| 65 to 74 Years | 189 | 23.4% |
| 75 to 84 Years | 142 | 17.6% |
| 85 Years and Over | 15 | 1.9% |
| Total | 808 | 100.0% |
Housing Finances in Church Hill
Median Income by Occupancy in Church Hill
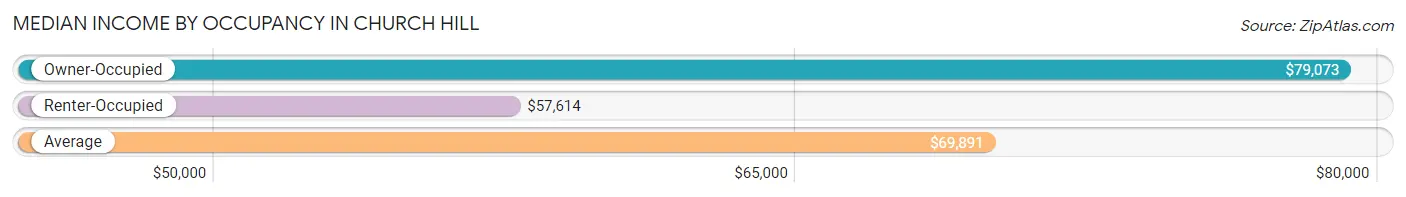
| Occupancy Type | # Households | Median Income |
| Owner-Occupied | 625 (77.3%) | $79,073 |
| Renter-Occupied | 183 (22.7%) | $57,614 |
| Average | 808 (100.0%) | $69,891 |
Occupancy by Householder Income Bracket in Church Hill
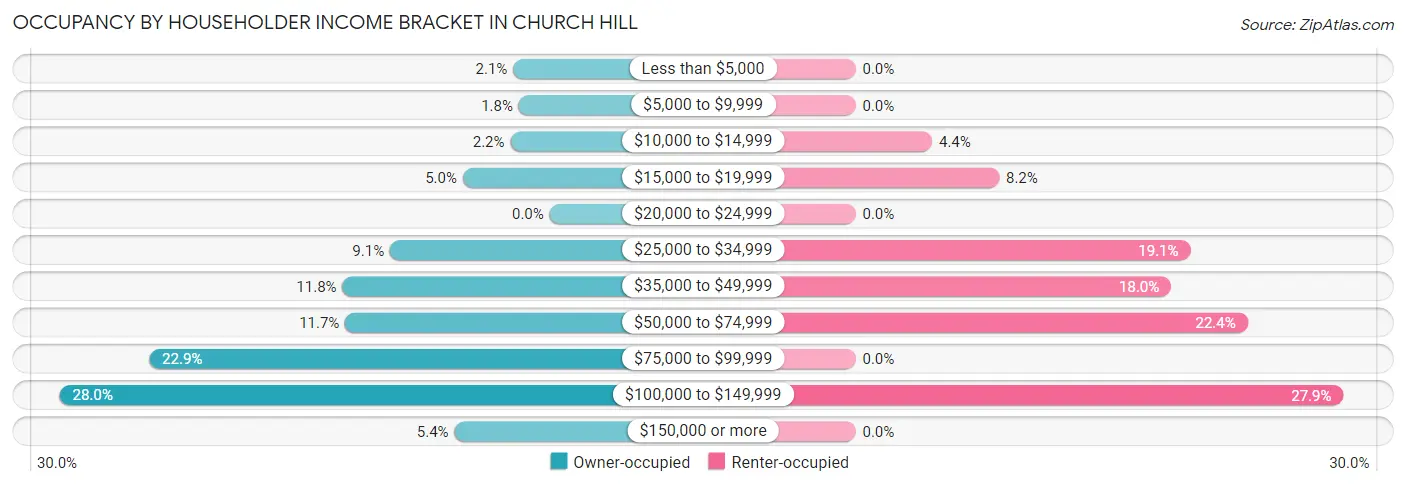
| Income Bracket | Owner-occupied | Renter-occupied |
| Less than $5,000 | 13 (2.1%) | 0 (0.0%) |
| $5,000 to $9,999 | 11 (1.8%) | 0 (0.0%) |
| $10,000 to $14,999 | 14 (2.2%) | 8 (4.4%) |
| $15,000 to $19,999 | 31 (5.0%) | 15 (8.2%) |
| $20,000 to $24,999 | 0 (0.0%) | 0 (0.0%) |
| $25,000 to $34,999 | 57 (9.1%) | 35 (19.1%) |
| $35,000 to $49,999 | 74 (11.8%) | 33 (18.0%) |
| $50,000 to $74,999 | 73 (11.7%) | 41 (22.4%) |
| $75,000 to $99,999 | 143 (22.9%) | 0 (0.0%) |
| $100,000 to $149,999 | 175 (28.0%) | 51 (27.9%) |
| $150,000 or more | 34 (5.4%) | 0 (0.0%) |
| Total | 625 (100.0%) | 183 (100.0%) |
Monthly Housing Cost Tiers in Church Hill
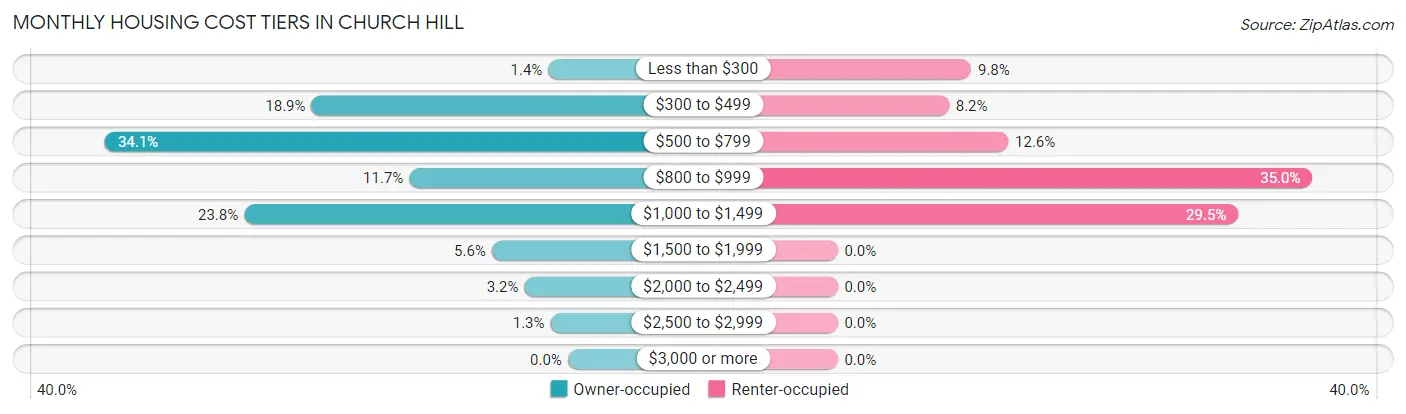
| Monthly Cost | Owner-occupied | Renter-occupied |
| Less than $300 | 9 (1.4%) | 18 (9.8%) |
| $300 to $499 | 118 (18.9%) | 15 (8.2%) |
| $500 to $799 | 213 (34.1%) | 23 (12.6%) |
| $800 to $999 | 73 (11.7%) | 64 (35.0%) |
| $1,000 to $1,499 | 149 (23.8%) | 54 (29.5%) |
| $1,500 to $1,999 | 35 (5.6%) | 0 (0.0%) |
| $2,000 to $2,499 | 20 (3.2%) | 0 (0.0%) |
| $2,500 to $2,999 | 8 (1.3%) | 0 (0.0%) |
| $3,000 or more | 0 (0.0%) | 0 (0.0%) |
| Total | 625 (100.0%) | 183 (100.0%) |
Physical Housing Characteristics in Church Hill
Housing Structures in Church Hill
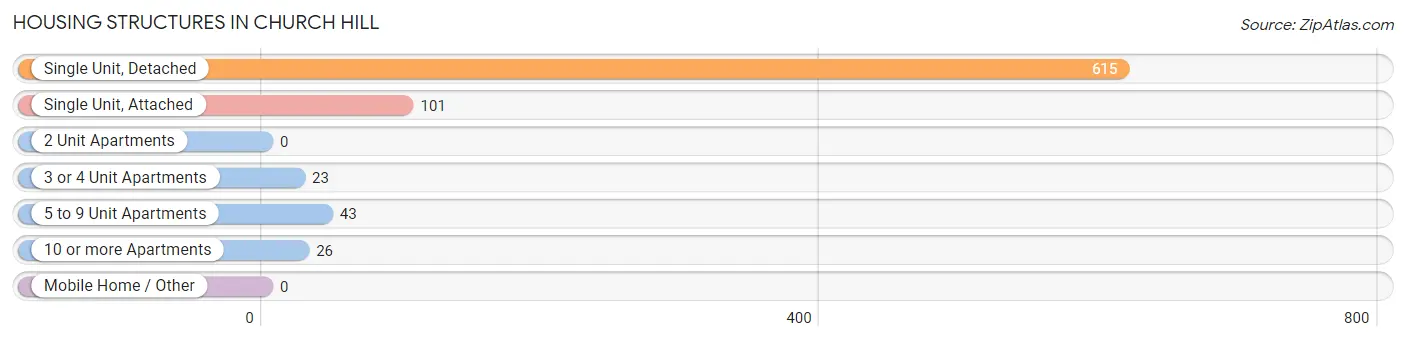
| Structure Type | # Housing Units | % Housing Units |
| Single Unit, Detached | 615 | 76.1% |
| Single Unit, Attached | 101 | 12.5% |
| 2 Unit Apartments | 0 | 0.0% |
| 3 or 4 Unit Apartments | 23 | 2.9% |
| 5 to 9 Unit Apartments | 43 | 5.3% |
| 10 or more Apartments | 26 | 3.2% |
| Mobile Home / Other | 0 | 0.0% |
| Total | 808 | 100.0% |
Housing Structures by Occupancy in Church Hill
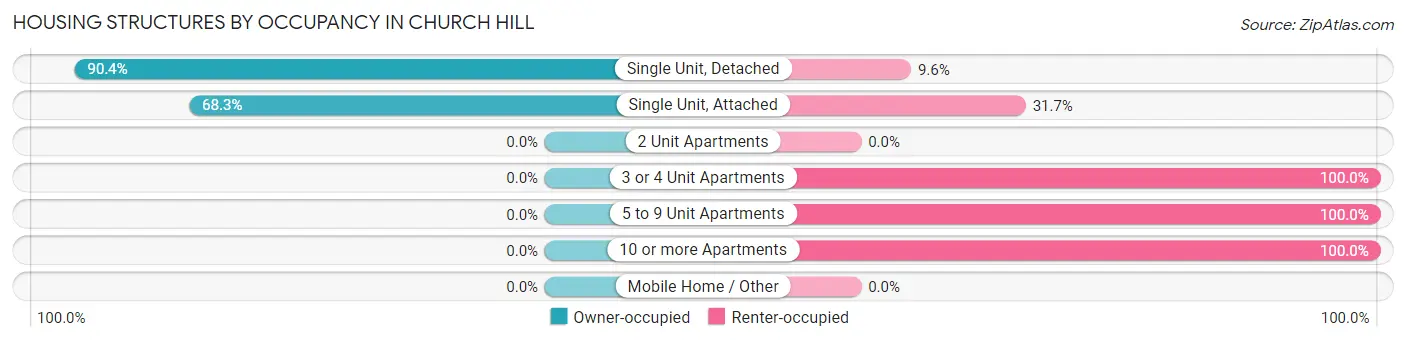
| Structure Type | Owner-occupied | Renter-occupied |
| Single Unit, Detached | 556 (90.4%) | 59 (9.6%) |
| Single Unit, Attached | 69 (68.3%) | 32 (31.7%) |
| 2 Unit Apartments | 0 (0.0%) | 0 (0.0%) |
| 3 or 4 Unit Apartments | 0 (0.0%) | 23 (100.0%) |
| 5 to 9 Unit Apartments | 0 (0.0%) | 43 (100.0%) |
| 10 or more Apartments | 0 (0.0%) | 26 (100.0%) |
| Mobile Home / Other | 0 (0.0%) | 0 (0.0%) |
| Total | 625 (77.3%) | 183 (22.7%) |
Housing Structures by Number of Rooms in Church Hill
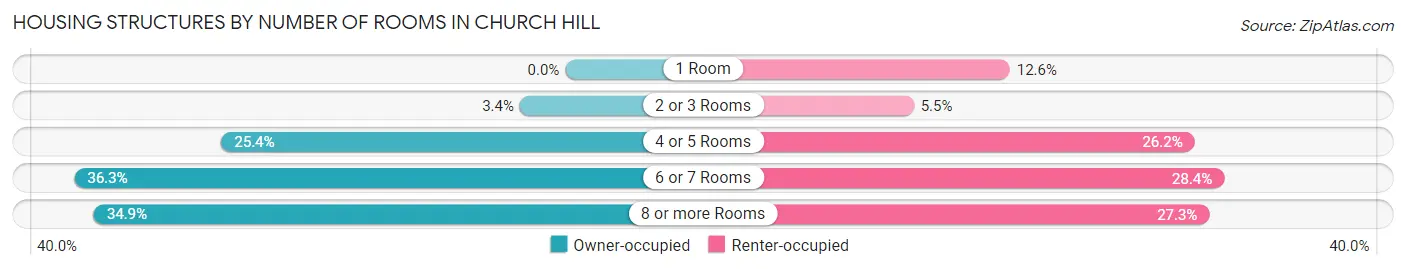
| Number of Rooms | Owner-occupied | Renter-occupied |
| 1 Room | 0 (0.0%) | 23 (12.6%) |
| 2 or 3 Rooms | 21 (3.4%) | 10 (5.5%) |
| 4 or 5 Rooms | 159 (25.4%) | 48 (26.2%) |
| 6 or 7 Rooms | 227 (36.3%) | 52 (28.4%) |
| 8 or more Rooms | 218 (34.9%) | 50 (27.3%) |
| Total | 625 (100.0%) | 183 (100.0%) |
Housing Structure by Heating Type in Church Hill
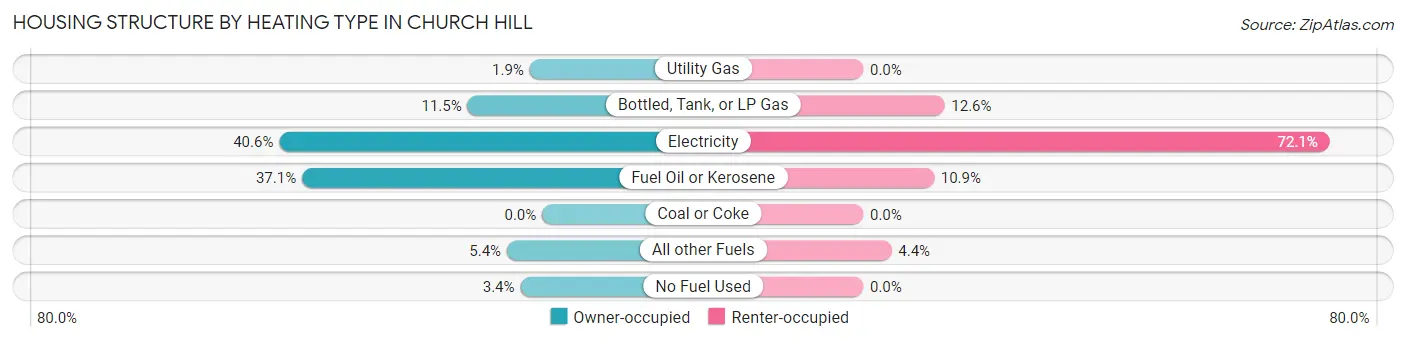
| Heating Type | Owner-occupied | Renter-occupied |
| Utility Gas | 12 (1.9%) | 0 (0.0%) |
| Bottled, Tank, or LP Gas | 72 (11.5%) | 23 (12.6%) |
| Electricity | 254 (40.6%) | 132 (72.1%) |
| Fuel Oil or Kerosene | 232 (37.1%) | 20 (10.9%) |
| Coal or Coke | 0 (0.0%) | 0 (0.0%) |
| All other Fuels | 34 (5.4%) | 8 (4.4%) |
| No Fuel Used | 21 (3.4%) | 0 (0.0%) |
| Total | 625 (100.0%) | 183 (100.0%) |
Household Vehicle Usage in Church Hill
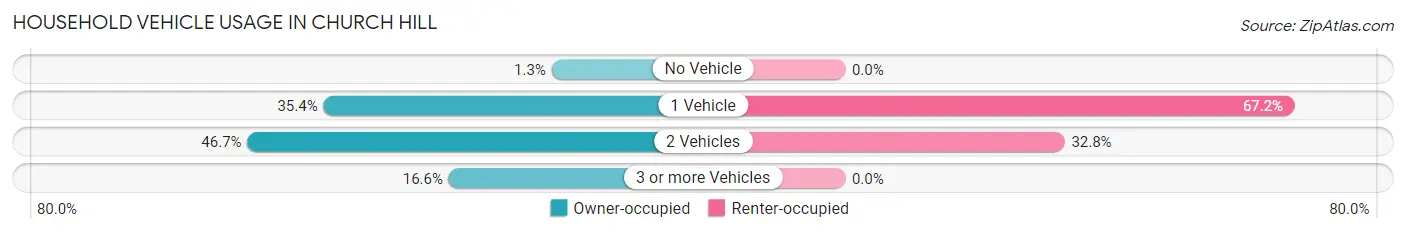
| Vehicles per Household | Owner-occupied | Renter-occupied |
| No Vehicle | 8 (1.3%) | 0 (0.0%) |
| 1 Vehicle | 221 (35.4%) | 123 (67.2%) |
| 2 Vehicles | 292 (46.7%) | 60 (32.8%) |
| 3 or more Vehicles | 104 (16.6%) | 0 (0.0%) |
| Total | 625 (100.0%) | 183 (100.0%) |
Real Estate & Mortgages in Church Hill
Real Estate and Mortgage Overview in Church Hill
| Characteristic | Without Mortgage | With Mortgage |
| Housing Units | 349 | 276 |
| Median Property Value | $174,400 | $158,200 |
| Median Household Income | $77,679 | $12 |
| Monthly Housing Costs | $590 | $0 |
| Real Estate Taxes | $2,575 | $0 |
Property Value by Mortgage Status in Church Hill
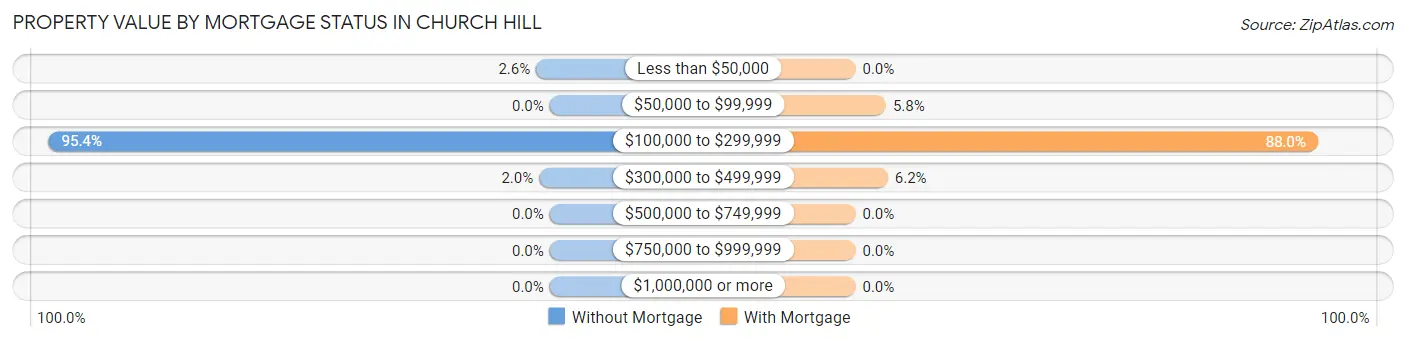
| Property Value | Without Mortgage | With Mortgage |
| Less than $50,000 | 9 (2.6%) | 0 (0.0%) |
| $50,000 to $99,999 | 0 (0.0%) | 16 (5.8%) |
| $100,000 to $299,999 | 333 (95.4%) | 243 (88.0%) |
| $300,000 to $499,999 | 7 (2.0%) | 17 (6.2%) |
| $500,000 to $749,999 | 0 (0.0%) | 0 (0.0%) |
| $750,000 to $999,999 | 0 (0.0%) | 0 (0.0%) |
| $1,000,000 or more | 0 (0.0%) | 0 (0.0%) |
| Total | 349 (100.0%) | 276 (100.0%) |
Household Income by Mortgage Status in Church Hill
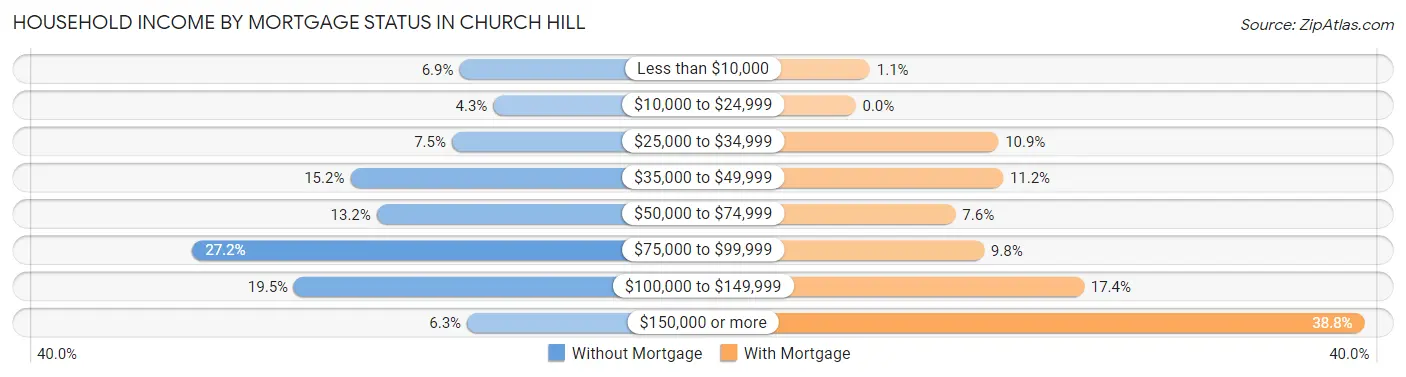
| Household Income | Without Mortgage | With Mortgage |
| Less than $10,000 | 24 (6.9%) | 3 (1.1%) |
| $10,000 to $24,999 | 15 (4.3%) | 0 (0.0%) |
| $25,000 to $34,999 | 26 (7.4%) | 30 (10.9%) |
| $35,000 to $49,999 | 53 (15.2%) | 31 (11.2%) |
| $50,000 to $74,999 | 46 (13.2%) | 21 (7.6%) |
| $75,000 to $99,999 | 95 (27.2%) | 27 (9.8%) |
| $100,000 to $149,999 | 68 (19.5%) | 48 (17.4%) |
| $150,000 or more | 22 (6.3%) | 107 (38.8%) |
| Total | 349 (100.0%) | 276 (100.0%) |
Property Value to Household Income Ratio in Church Hill
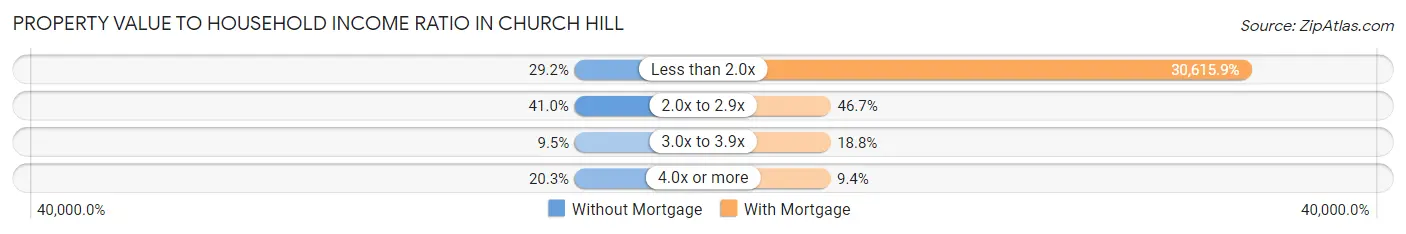
| Value-to-Income Ratio | Without Mortgage | With Mortgage |
| Less than 2.0x | 102 (29.2%) | 84,500 (30,615.9%) |
| 2.0x to 2.9x | 143 (41.0%) | 129 (46.7%) |
| 3.0x to 3.9x | 33 (9.5%) | 52 (18.8%) |
| 4.0x or more | 71 (20.3%) | 26 (9.4%) |
| Total | 349 (100.0%) | 276 (100.0%) |
Real Estate Taxes by Mortgage Status in Church Hill
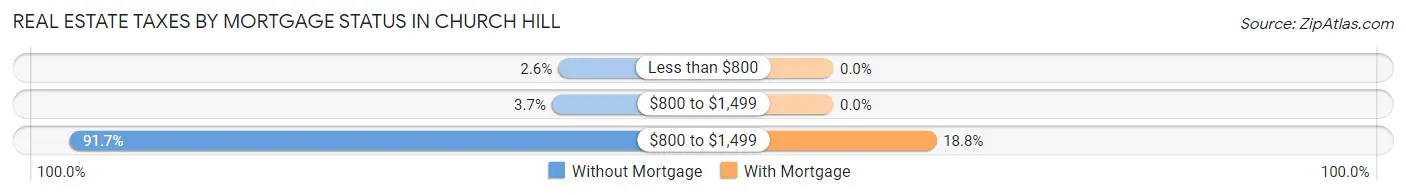
| Property Taxes | Without Mortgage | With Mortgage |
| Less than $800 | 9 (2.6%) | 0 (0.0%) |
| $800 to $1,499 | 13 (3.7%) | 0 (0.0%) |
| $800 to $1,499 | 320 (91.7%) | 52 (18.8%) |
| Total | 349 (100.0%) | 276 (100.0%) |
Health & Disability in Church Hill
Health Insurance Coverage by Age in Church Hill
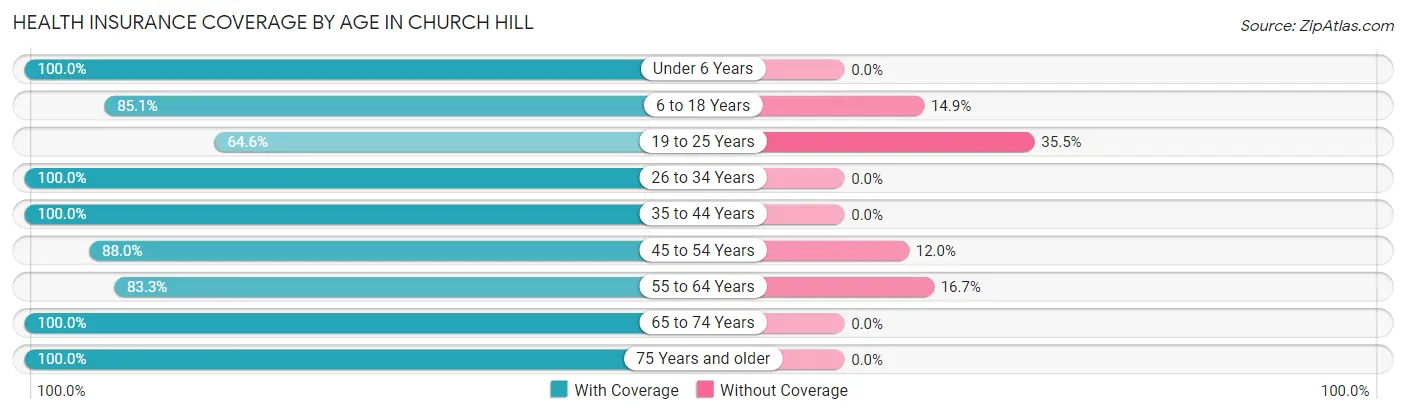
| Age Bracket | With Coverage | Without Coverage |
| Under 6 Years | 43 (100.0%) | 0 (0.0%) |
| 6 to 18 Years | 189 (85.1%) | 33 (14.9%) |
| 19 to 25 Years | 71 (64.5%) | 39 (35.4%) |
| 26 to 34 Years | 130 (100.0%) | 0 (0.0%) |
| 35 to 44 Years | 138 (100.0%) | 0 (0.0%) |
| 45 to 54 Years | 234 (88.0%) | 32 (12.0%) |
| 55 to 64 Years | 170 (83.3%) | 34 (16.7%) |
| 65 to 74 Years | 270 (100.0%) | 0 (0.0%) |
| 75 Years and older | 251 (100.0%) | 0 (0.0%) |
| Total | 1,496 (91.5%) | 138 (8.5%) |
Health Insurance Coverage by Citizenship Status in Church Hill
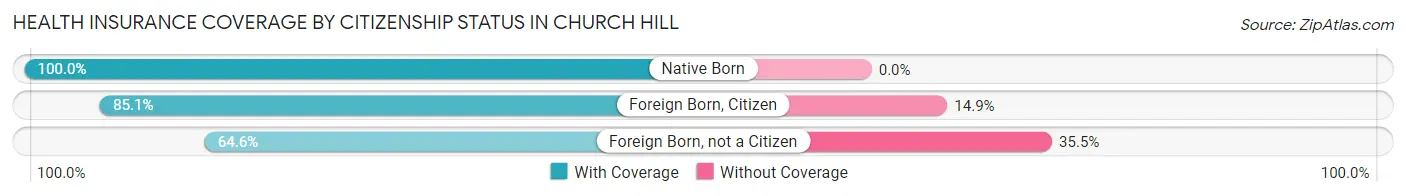
| Citizenship Status | With Coverage | Without Coverage |
| Native Born | 43 (100.0%) | 0 (0.0%) |
| Foreign Born, Citizen | 189 (85.1%) | 33 (14.9%) |
| Foreign Born, not a Citizen | 71 (64.5%) | 39 (35.4%) |
Health Insurance Coverage by Household Income in Church Hill
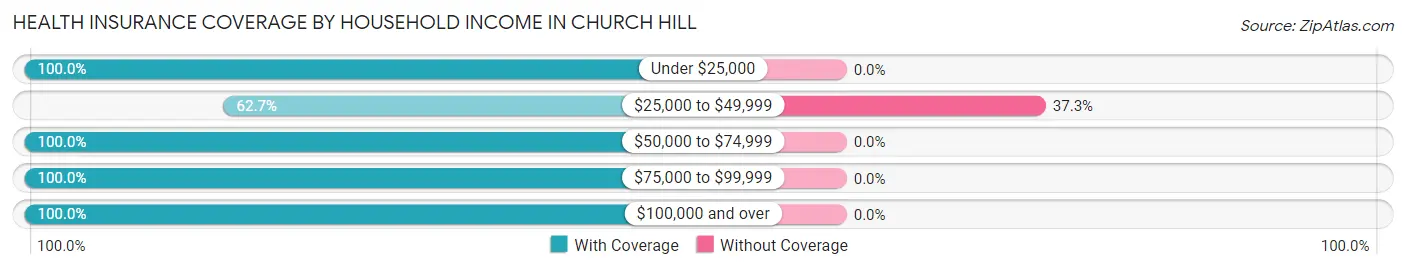
| Household Income | With Coverage | Without Coverage |
| Under $25,000 | 134 (100.0%) | 0 (0.0%) |
| $25,000 to $49,999 | 232 (62.7%) | 138 (37.3%) |
| $50,000 to $74,999 | 218 (100.0%) | 0 (0.0%) |
| $75,000 to $99,999 | 225 (100.0%) | 0 (0.0%) |
| $100,000 and over | 687 (100.0%) | 0 (0.0%) |
Public vs Private Health Insurance Coverage by Age in Church Hill
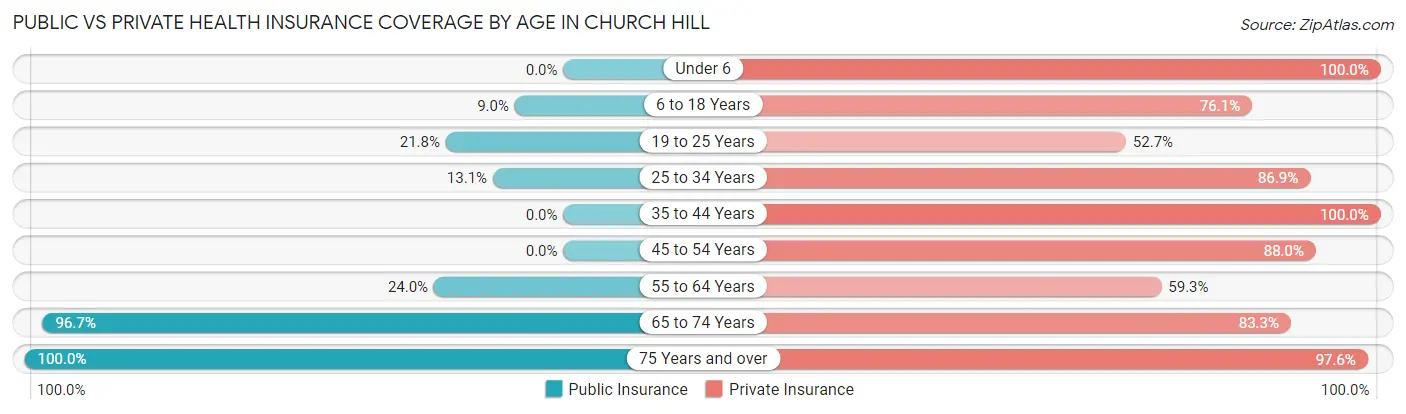
| Age Bracket | Public Insurance | Private Insurance |
| Under 6 | 0 (0.0%) | 43 (100.0%) |
| 6 to 18 Years | 20 (9.0%) | 169 (76.1%) |
| 19 to 25 Years | 24 (21.8%) | 58 (52.7%) |
| 25 to 34 Years | 17 (13.1%) | 113 (86.9%) |
| 35 to 44 Years | 0 (0.0%) | 138 (100.0%) |
| 45 to 54 Years | 0 (0.0%) | 234 (88.0%) |
| 55 to 64 Years | 49 (24.0%) | 121 (59.3%) |
| 65 to 74 Years | 261 (96.7%) | 225 (83.3%) |
| 75 Years and over | 251 (100.0%) | 245 (97.6%) |
| Total | 622 (38.1%) | 1,346 (82.4%) |
Disability Status by Sex by Age in Church Hill
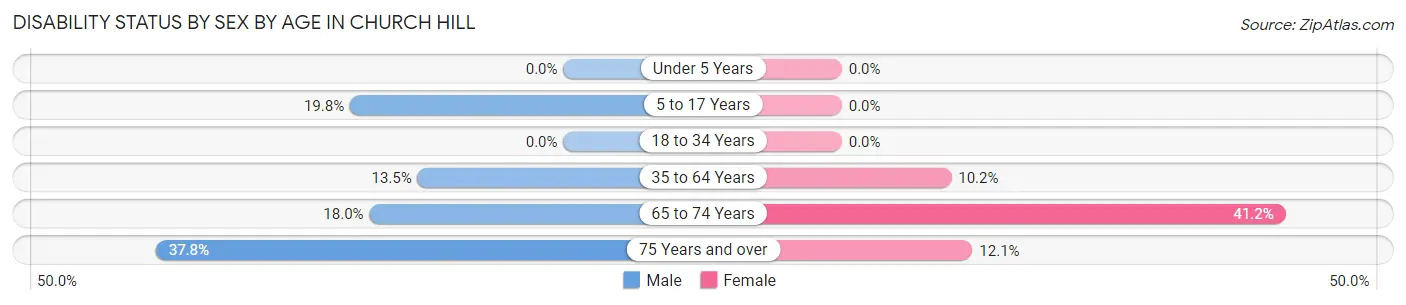
| Age Bracket | Male | Female |
| Under 5 Years | 0 (0.0%) | 0 (0.0%) |
| 5 to 17 Years | 20 (19.8%) | 0 (0.0%) |
| 18 to 34 Years | 0 (0.0%) | 0 (0.0%) |
| 35 to 64 Years | 41 (13.5%) | 31 (10.2%) |
| 65 to 74 Years | 18 (18.0%) | 70 (41.2%) |
| 75 Years and over | 45 (37.8%) | 16 (12.1%) |
Disability Class by Sex by Age in Church Hill
Disability Class: Hearing Difficulty
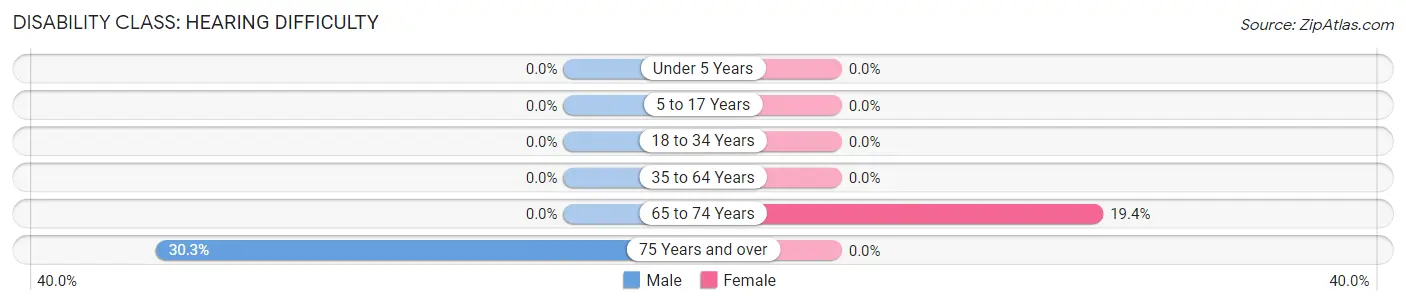
| Age Bracket | Male | Female |
| Under 5 Years | 0 (0.0%) | 0 (0.0%) |
| 5 to 17 Years | 0 (0.0%) | 0 (0.0%) |
| 18 to 34 Years | 0 (0.0%) | 0 (0.0%) |
| 35 to 64 Years | 0 (0.0%) | 0 (0.0%) |
| 65 to 74 Years | 0 (0.0%) | 33 (19.4%) |
| 75 Years and over | 36 (30.2%) | 0 (0.0%) |
Disability Class: Vision Difficulty
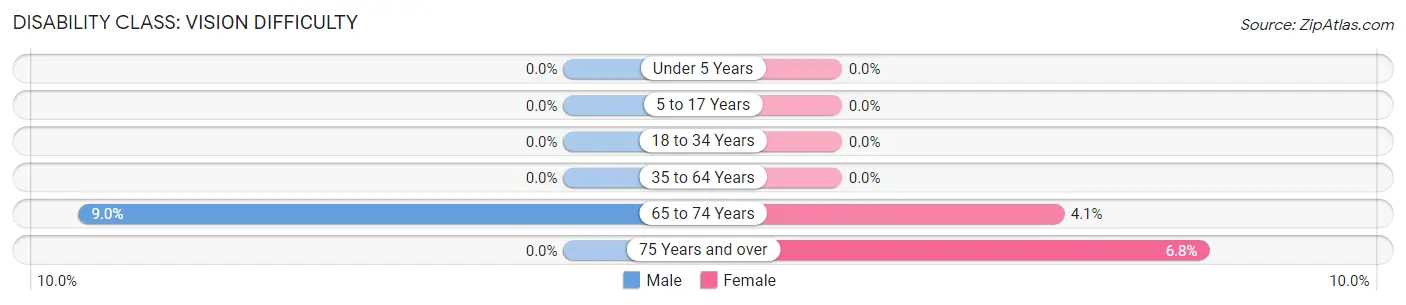
| Age Bracket | Male | Female |
| Under 5 Years | 0 (0.0%) | 0 (0.0%) |
| 5 to 17 Years | 0 (0.0%) | 0 (0.0%) |
| 18 to 34 Years | 0 (0.0%) | 0 (0.0%) |
| 35 to 64 Years | 0 (0.0%) | 0 (0.0%) |
| 65 to 74 Years | 9 (9.0%) | 7 (4.1%) |
| 75 Years and over | 0 (0.0%) | 9 (6.8%) |
Disability Class: Cognitive Difficulty
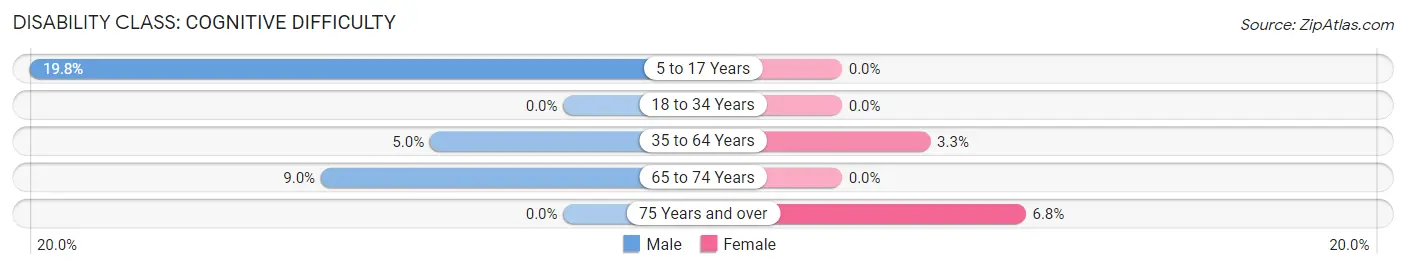
| Age Bracket | Male | Female |
| 5 to 17 Years | 20 (19.8%) | 0 (0.0%) |
| 18 to 34 Years | 0 (0.0%) | 0 (0.0%) |
| 35 to 64 Years | 15 (5.0%) | 10 (3.3%) |
| 65 to 74 Years | 9 (9.0%) | 0 (0.0%) |
| 75 Years and over | 0 (0.0%) | 9 (6.8%) |
Disability Class: Ambulatory Difficulty
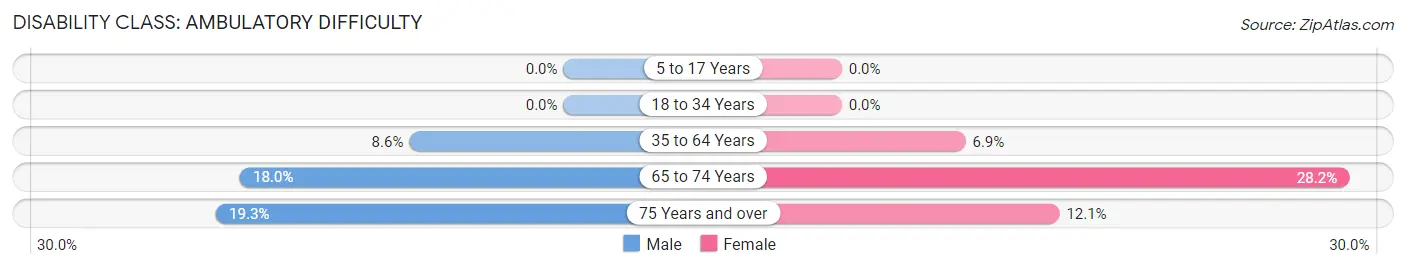
| Age Bracket | Male | Female |
| 5 to 17 Years | 0 (0.0%) | 0 (0.0%) |
| 18 to 34 Years | 0 (0.0%) | 0 (0.0%) |
| 35 to 64 Years | 26 (8.6%) | 21 (6.9%) |
| 65 to 74 Years | 18 (18.0%) | 48 (28.2%) |
| 75 Years and over | 23 (19.3%) | 16 (12.1%) |
Disability Class: Self-Care Difficulty
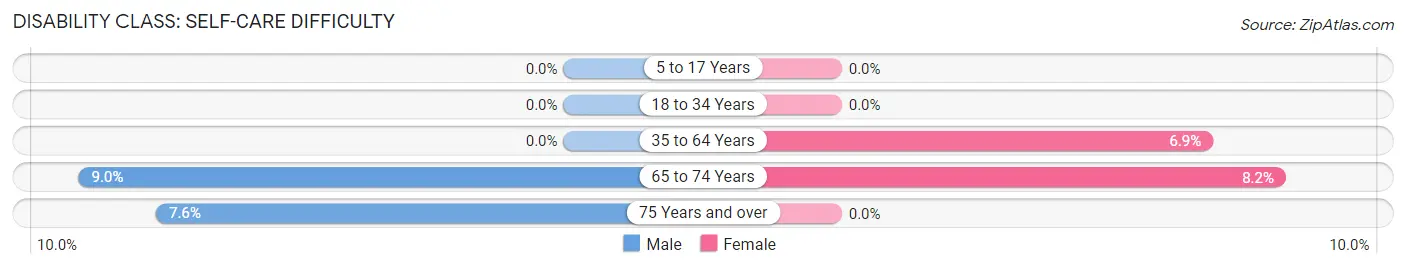
| Age Bracket | Male | Female |
| 5 to 17 Years | 0 (0.0%) | 0 (0.0%) |
| 18 to 34 Years | 0 (0.0%) | 0 (0.0%) |
| 35 to 64 Years | 0 (0.0%) | 21 (6.9%) |
| 65 to 74 Years | 9 (9.0%) | 14 (8.2%) |
| 75 Years and over | 9 (7.6%) | 0 (0.0%) |
Technology Access in Church Hill
Computing Device Access in Church Hill
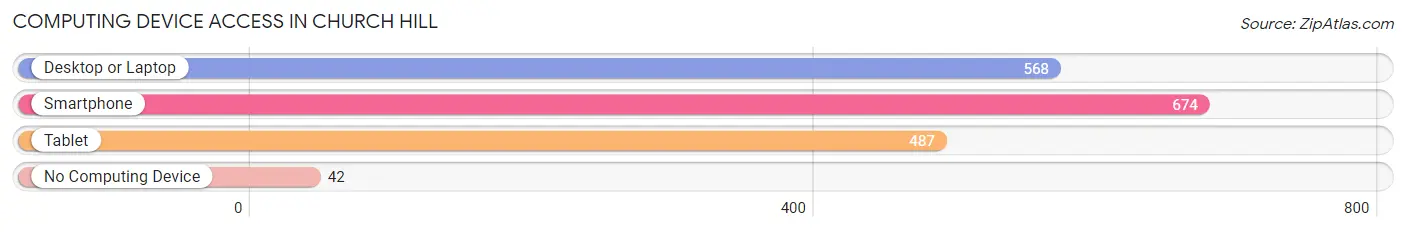
| Device Type | # Households | % Households |
| Desktop or Laptop | 568 | 70.3% |
| Smartphone | 674 | 83.4% |
| Tablet | 487 | 60.3% |
| No Computing Device | 42 | 5.2% |
| Total | 808 | 100.0% |
Internet Access in Church Hill
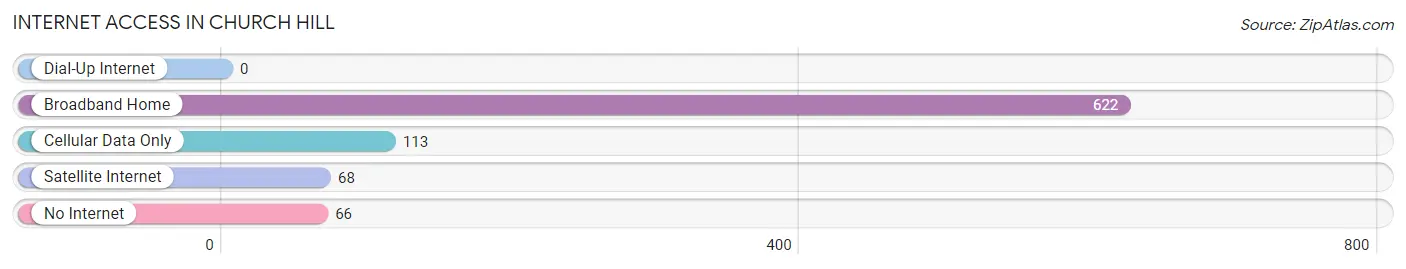
| Internet Type | # Households | % Households |
| Dial-Up Internet | 0 | 0.0% |
| Broadband Home | 622 | 77.0% |
| Cellular Data Only | 113 | 14.0% |
| Satellite Internet | 68 | 8.4% |
| No Internet | 66 | 8.2% |
| Total | 808 | 100.0% |
Church Hill Summary
Hill Church is a small borough located in the state of Pennsylvania, United States. It is situated in the northern part of the state, in the county of Northumberland. The borough is located on the Susquehanna River, and is part of the Coal Region of Pennsylvania. The population of the borough was 1,845 at the 2010 census.
History
The area that is now Hill Church was first settled in the late 1700s by German immigrants. The first settlers were the families of John and Jacob Hill, who established a small village on the banks of the Susquehanna River. The village was named Hill Church after the family’s church, which was located nearby.
The village grew slowly over the years, and by the mid-1800s, it had become a thriving community. The village was home to several businesses, including a grist mill, a saw mill, a blacksmith shop, and a general store. The village also had a post office, a school, and a church.
In 1871, the village was incorporated as a borough. The borough was named Hill Church after the family’s church.
Geography
Hill Church is located at 40°45'17" North, 76°25'45" West (40.754722, -76.429167). According to the United States Census Bureau, the borough has a total area of 0.6 square miles (1.6 km2), all of it land.
The borough is located on the Susquehanna River, and is part of the Coal Region of Pennsylvania. The borough is surrounded by the townships of Upper Augusta, Lower Augusta, and Point Township.
Economy
The economy of Hill Church is largely based on agriculture and tourism. The borough is home to several farms, which produce a variety of crops, including corn, soybeans, hay, and wheat. The borough also has several small businesses, including a general store, a restaurant, and a bed and breakfast.
The borough is also home to several tourist attractions, including the Hill Church Historic District, which is listed on the National Register of Historic Places. The district includes several historic buildings, including the Hill Church Inn, the Hill Church General Store, and the Hill Church Schoolhouse.
Demographics
As of the 2010 census, there were 1,845 people, 745 households, and 486 families residing in the borough. The population density was 3,072.2 people per square mile (1,189.2/km2). There were 809 housing units at an average density of 1,335.3 per square mile (515.7/km2). The racial makeup of the borough was 97.7% White, 0.3% African American, 0.2% Native American, 0.2% Asian, 0.2% from other races, and 1.4% from two or more races. Hispanic or Latino of any race were 1.2% of the population.
There were 745 households, out of which 28.2% had children under the age of 18 living with them, 48.2% were married couples living together, 11.2% had a female householder with no husband present, and 35.2% were non-families. 30.2% of all households were made up of individuals, and 14.2% had someone living alone who was 65 years of age or older. The average household size was 2.45 and the average family size was 3.04.
In the borough, the population was spread out, with 24.2% under the age of 18, 7.2% from 18 to 24, 27.2% from 25 to 44, 24.2% from 45 to 64, and 17.2% who were 65 years of age or older. The median age was 39 years. For every 100 females, there were 94.2 males. For every 100 females age 18 and over, there were 91.2 males.
The median income for a household in the borough was $35,000, and the median income for a family was $41,250. Males had a median income of $30,000 versus $21,250 for females. The per capita income for the borough was $17,845. About 8.2% of families and 10.2% of the population were below the poverty line, including 14.2% of those under age 18 and 8.2% of those age 65 or over.
Common Questions
What is Per Capita Income in Church Hill?
Per Capita income in Church Hill is $37,054.
What is the Median Family Income in Church Hill?
Median Family Income in Church Hill is $86,782.
What is the Median Household income in Church Hill?
Median Household Income in Church Hill is $69,891.
What is Income or Wage Gap in Church Hill?
Income or Wage Gap in Church Hill is 21.2%.
Women in Church Hill earn 78.8 cents for every dollar earned by a man.
What is Inequality or Gini Index in Church Hill?
Inequality or Gini Index in Church Hill is 0.35.
What is the Total Population of Church Hill?
Total Population of Church Hill is 1,634.
What is the Total Male Population of Church Hill?
Total Male Population of Church Hill is 788.
What is the Total Female Population of Church Hill?
Total Female Population of Church Hill is 846.
What is the Ratio of Males per 100 Females in Church Hill?
There are 93.14 Males per 100 Females in Church Hill.
What is the Ratio of Females per 100 Males in Church Hill?
There are 107.36 Females per 100 Males in Church Hill.
What is the Median Population Age in Church Hill?
Median Population Age in Church Hill is 50.3 Years.
What is the Average Family Size in Church Hill
Average Family Size in Church Hill is 2.5 People.
What is the Average Household Size in Church Hill
Average Household Size in Church Hill is 2.0 People.
How Large is the Labor Force in Church Hill?
There are 852 People in the Labor Forcein in Church Hill.
What is the Percentage of People in the Labor Force in Church Hill?
59.8% of People are in the Labor Force in Church Hill.
What is the Unemployment Rate in Church Hill?
Unemployment Rate in Church Hill is 0.9%.