Allenport borough, PA Map & Demographics
Allenport borough Overview
$32,695
PER CAPITA INCOME
$76,150
AVG FAMILY INCOME
$68,750
AVG HOUSEHOLD INCOME
47.4%
WAGE / INCOME GAP [ % ]
52.6¢/ $1
WAGE / INCOME GAP [ $ ]
0.33
INEQUALITY / GINI INDEX
466
TOTAL POPULATION
243
MALE POPULATION
223
FEMALE POPULATION
108.97
MALES / 100 FEMALES
91.77
FEMALES / 100 MALES
50.1
MEDIAN AGE
2.8
AVG FAMILY SIZE
2.1
AVG HOUSEHOLD SIZE
205
LABOR FORCE [ PEOPLE ]
48.3%
PERCENT IN LABOR FORCE
4.4%
UNEMPLOYMENT RATE
Income in Allenport borough
Income Overview in Allenport borough
Per Capita Income in Allenport borough is $32,695, while median incomes of families and households are $76,150 and $68,750 respectively.
| Characteristic | Number | Measure |
| Per Capita Income | 466 | $32,695 |
| Median Family Income | 109 | $76,150 |
| Mean Family Income | 109 | $77,939 |
| Median Household Income | 226 | $68,750 |
| Mean Household Income | 226 | $69,788 |
| Income Deficit | 109 | $0 |
| Wage / Income Gap (%) | 466 | 47.42% |
| Wage / Income Gap ($) | 466 | 52.58¢ per $1 |
| Gini / Inequality Index | 466 | 0.33 |
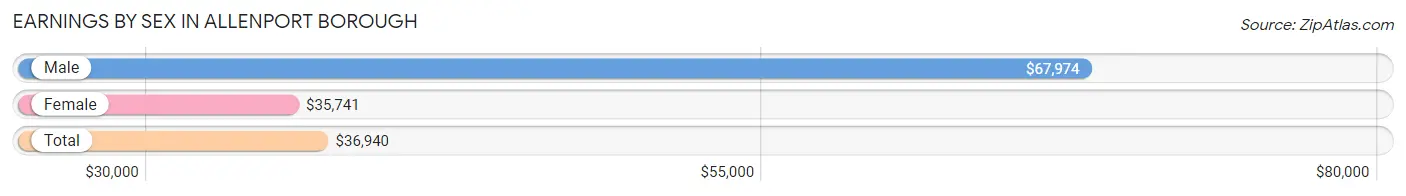
Earnings by Sex in Allenport borough
Average Earnings in Allenport borough are $36,940, $67,974 for men and $35,741 for women, a difference of 47.4%.
| Sex | Number | Average Earnings |
| Male | 105 (52.2%) | $67,974 |
| Female | 96 (47.8%) | $35,741 |
| Total | 201 (100.0%) | $36,940 |
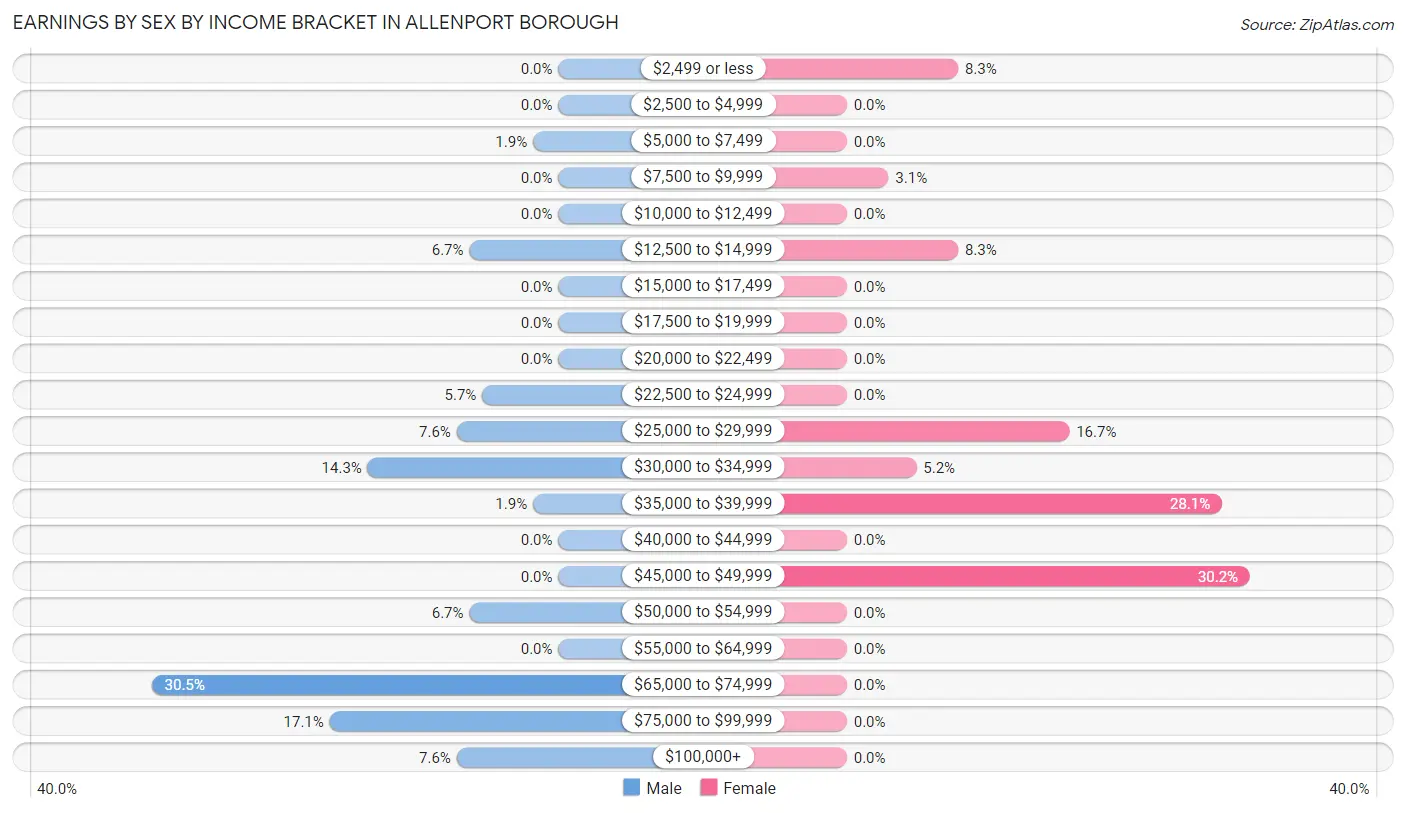
Earnings by Sex by Income Bracket in Allenport borough
The most common earnings brackets in Allenport borough are $65,000 to $74,999 for men (32 | 30.5%) and $45,000 to $49,999 for women (29 | 30.2%).
| Income | Male | Female |
| $2,499 or less | 0 (0.0%) | 8 (8.3%) |
| $2,500 to $4,999 | 0 (0.0%) | 0 (0.0%) |
| $5,000 to $7,499 | 2 (1.9%) | 0 (0.0%) |
| $7,500 to $9,999 | 0 (0.0%) | 3 (3.1%) |
| $10,000 to $12,499 | 0 (0.0%) | 0 (0.0%) |
| $12,500 to $14,999 | 7 (6.7%) | 8 (8.3%) |
| $15,000 to $17,499 | 0 (0.0%) | 0 (0.0%) |
| $17,500 to $19,999 | 0 (0.0%) | 0 (0.0%) |
| $20,000 to $22,499 | 0 (0.0%) | 0 (0.0%) |
| $22,500 to $24,999 | 6 (5.7%) | 0 (0.0%) |
| $25,000 to $29,999 | 8 (7.6%) | 16 (16.7%) |
| $30,000 to $34,999 | 15 (14.3%) | 5 (5.2%) |
| $35,000 to $39,999 | 2 (1.9%) | 27 (28.1%) |
| $40,000 to $44,999 | 0 (0.0%) | 0 (0.0%) |
| $45,000 to $49,999 | 0 (0.0%) | 29 (30.2%) |
| $50,000 to $54,999 | 7 (6.7%) | 0 (0.0%) |
| $55,000 to $64,999 | 0 (0.0%) | 0 (0.0%) |
| $65,000 to $74,999 | 32 (30.5%) | 0 (0.0%) |
| $75,000 to $99,999 | 18 (17.1%) | 0 (0.0%) |
| $100,000+ | 8 (7.6%) | 0 (0.0%) |
| Total | 105 (100.0%) | 96 (100.0%) |
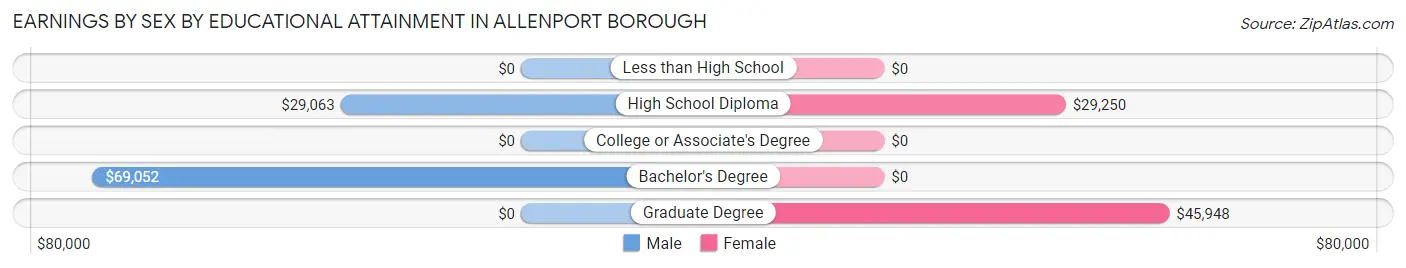
Earnings by Sex by Educational Attainment in Allenport borough
Average earnings in Allenport borough are $67,974 for men and $35,880 for women, a difference of 47.2%. Men with an educational attainment of bachelor's degree enjoy the highest average annual earnings of $69,052, while those with high school diploma education earn the least with $29,063. Women with an educational attainment of graduate degree earn the most with the average annual earnings of $45,948, while those with high school diploma education have the smallest earnings of $29,250.
| Educational Attainment | Male Income | Female Income |
| Less than High School | - | - |
| High School Diploma | $29,063 | $29,250 |
| College or Associate's Degree | - | - |
| Bachelor's Degree | $69,052 | $0 |
| Graduate Degree | - | - |
| Total | $67,974 | $35,880 |
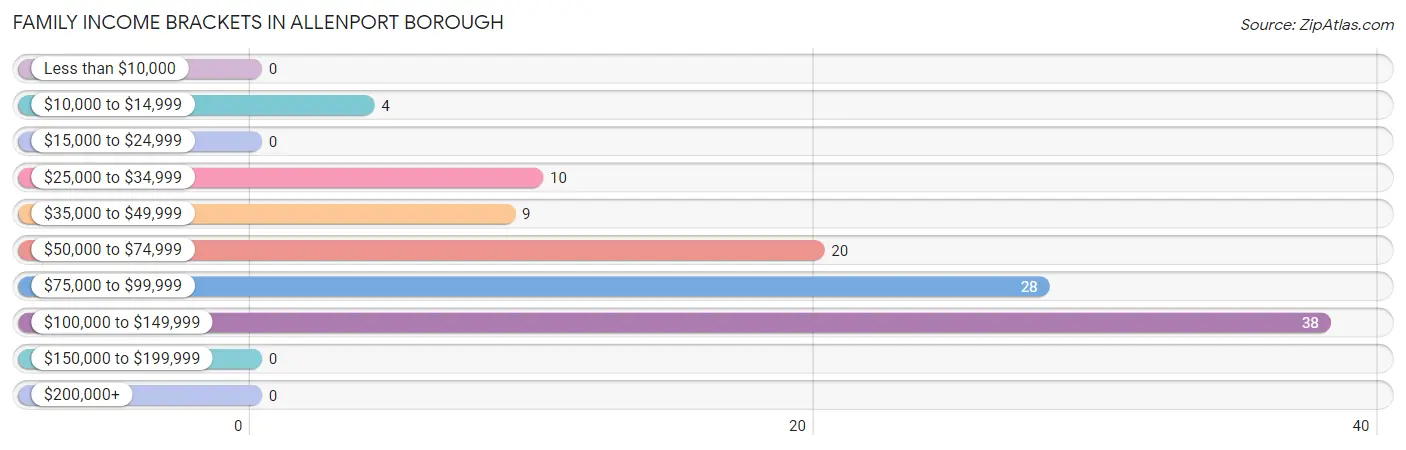
Family Income in Allenport borough
Family Income Brackets in Allenport borough
According to the Allenport borough family income data, there are 38 families falling into the $100,000 to $149,999 income range, which is the most common income bracket and makes up 34.9% of all families.
| Income Bracket | # Families | % Families |
| Less than $10,000 | 0 | 0.0% |
| $10,000 to $14,999 | 4 | 3.7% |
| $15,000 to $24,999 | 0 | 0.0% |
| $25,000 to $34,999 | 10 | 9.2% |
| $35,000 to $49,999 | 9 | 8.3% |
| $50,000 to $74,999 | 20 | 18.3% |
| $75,000 to $99,999 | 28 | 25.7% |
| $100,000 to $149,999 | 38 | 34.9% |
| $150,000 to $199,999 | 0 | 0.0% |
| $200,000+ | 0 | 0.0% |
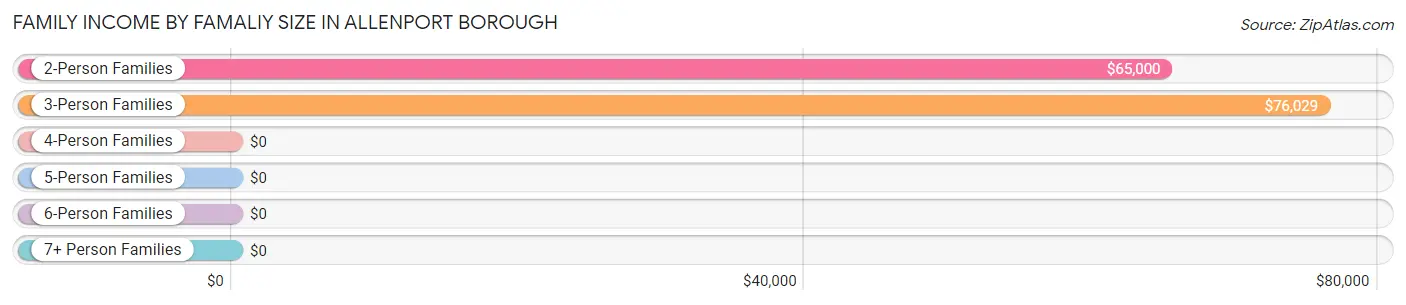
Family Income by Famaliy Size in Allenport borough
3-person families (30 | 27.5%) account for the highest median family income in Allenport borough with $76,029 per family, while 2-person families (56 | 51.4%) have the highest median income of $32,500 per family member.
| Income Bracket | # Families | Median Income |
| 2-Person Families | 56 (51.4%) | $65,000 |
| 3-Person Families | 30 (27.5%) | $76,029 |
| 4-Person Families | 15 (13.8%) | $0 |
| 5-Person Families | 0 (0.0%) | $0 |
| 6-Person Families | 8 (7.3%) | $0 |
| 7+ Person Families | 0 (0.0%) | $0 |
| Total | 109 (100.0%) | $76,150 |
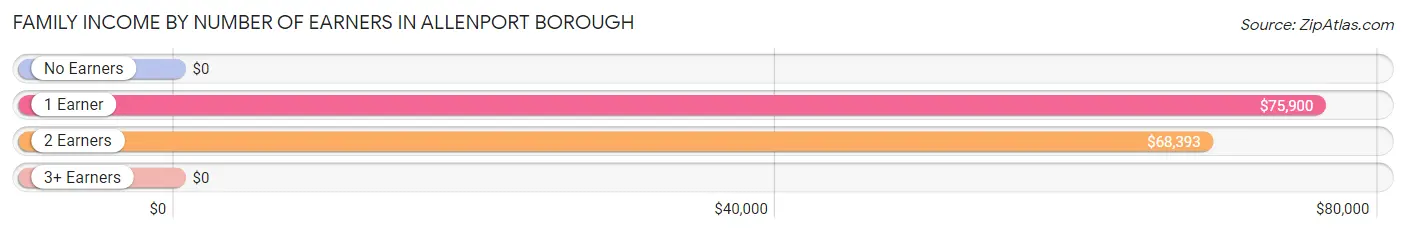
Family Income by Number of Earners in Allenport borough
| Number of Earners | # Families | Median Income |
| No Earners | 37 (33.9%) | $0 |
| 1 Earner | 38 (34.9%) | $75,900 |
| 2 Earners | 19 (17.4%) | $68,393 |
| 3+ Earners | 15 (13.8%) | $0 |
| Total | 109 (100.0%) | $76,150 |
Household Income in Allenport borough
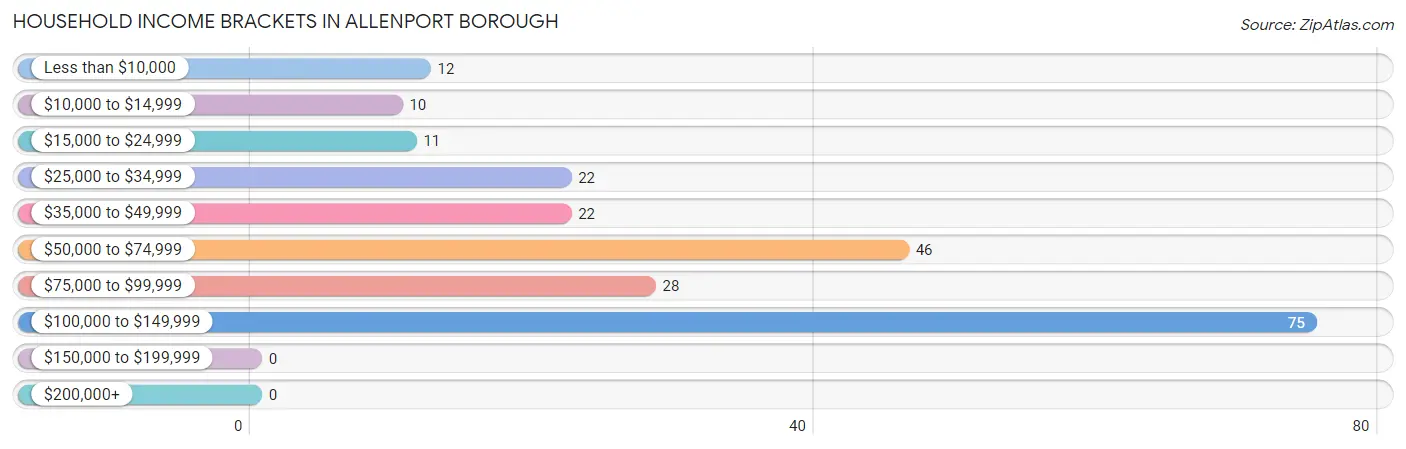
Household Income Brackets in Allenport borough
With 75 households falling in the category, the $100,000 to $149,999 income range is the most frequent in Allenport borough, accounting for 33.2% of all households.
| Income Bracket | # Households | % Households |
| Less than $10,000 | 12 | 5.3% |
| $10,000 to $14,999 | 10 | 4.4% |
| $15,000 to $24,999 | 11 | 4.9% |
| $25,000 to $34,999 | 22 | 9.7% |
| $35,000 to $49,999 | 22 | 9.7% |
| $50,000 to $74,999 | 46 | 20.4% |
| $75,000 to $99,999 | 28 | 12.4% |
| $100,000 to $149,999 | 75 | 33.2% |
| $150,000 to $199,999 | 0 | 0.0% |
| $200,000+ | 0 | 0.0% |
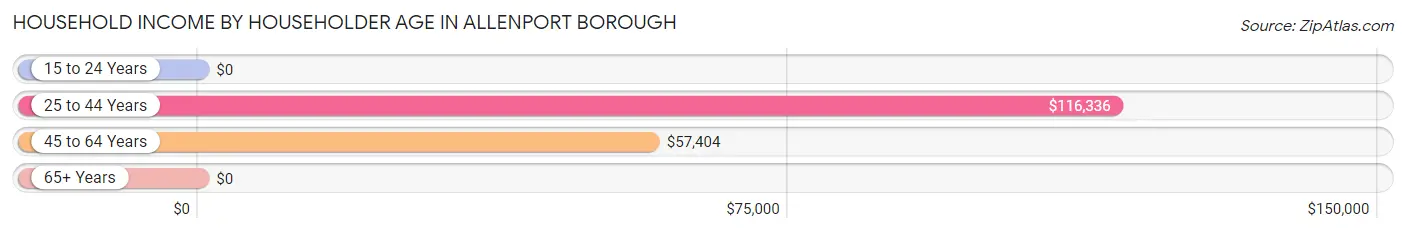
Household Income by Householder Age in Allenport borough
The median household income in Allenport borough is $68,750, with the highest median household income of $116,336 found in the 25 to 44 years age bracket for the primary householder. A total of 49 households (21.7%) fall into this category.
| Income Bracket | # Households | Median Income |
| 15 to 24 Years | 0 (0.0%) | $0 |
| 25 to 44 Years | 49 (21.7%) | $116,336 |
| 45 to 64 Years | 99 (43.8%) | $57,404 |
| 65+ Years | 78 (34.5%) | $0 |
| Total | 226 (100.0%) | $68,750 |
Poverty in Allenport borough
Income Below Poverty by Sex and Age in Allenport borough
With 4.5% poverty level for males and 7.2% for females among the residents of Allenport borough, 12 to 14 year old males and 65 to 74 year old females are the most vulnerable to poverty, with 4 males (100.0%) and 10 females (35.7%) in their respective age groups living below the poverty level.
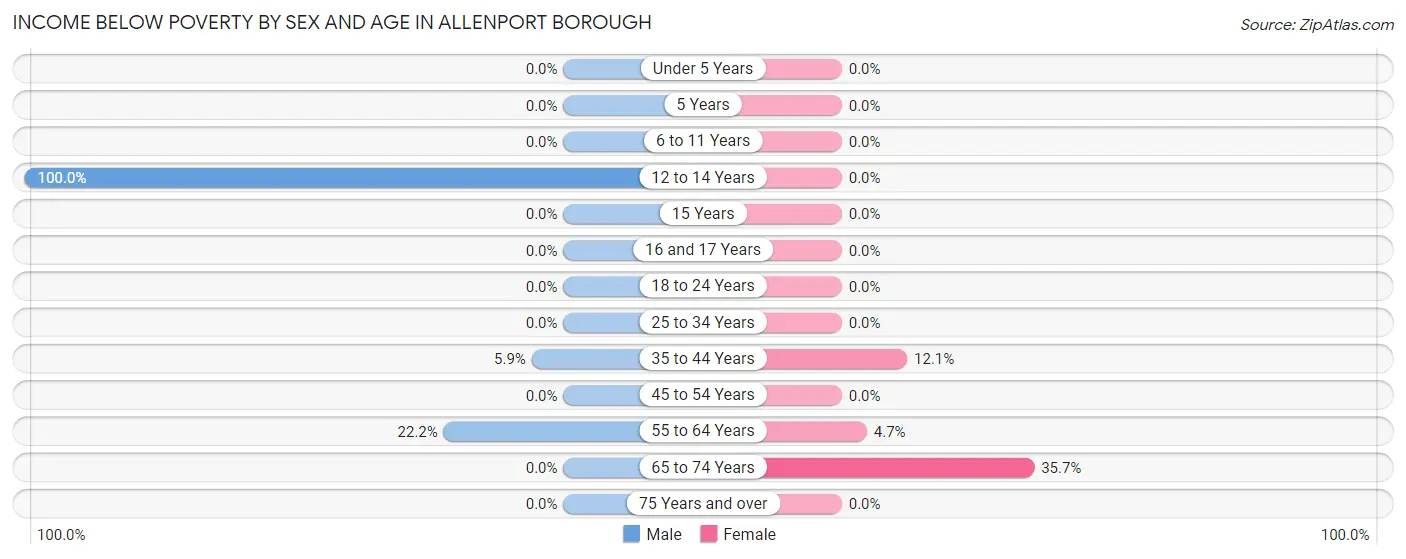
| Age Bracket | Male | Female |
| Under 5 Years | 0 (0.0%) | 0 (0.0%) |
| 5 Years | 0 (0.0%) | 0 (0.0%) |
| 6 to 11 Years | 0 (0.0%) | 0 (0.0%) |
| 12 to 14 Years | 4 (100.0%) | 0 (0.0%) |
| 15 Years | 0 (0.0%) | 0 (0.0%) |
| 16 and 17 Years | 0 (0.0%) | 0 (0.0%) |
| 18 to 24 Years | 0 (0.0%) | 0 (0.0%) |
| 25 to 34 Years | 0 (0.0%) | 0 (0.0%) |
| 35 to 44 Years | 1 (5.9%) | 4 (12.1%) |
| 45 to 54 Years | 0 (0.0%) | 0 (0.0%) |
| 55 to 64 Years | 6 (22.2%) | 2 (4.6%) |
| 65 to 74 Years | 0 (0.0%) | 10 (35.7%) |
| 75 Years and over | 0 (0.0%) | 0 (0.0%) |
| Total | 11 (4.5%) | 16 (7.2%) |
Income Above Poverty by Sex and Age in Allenport borough
According to the poverty statistics in Allenport borough, males aged under 5 years and females aged under 5 years are the age groups that are most secure financially, with 100.0% of males and 100.0% of females in these age groups living above the poverty line.
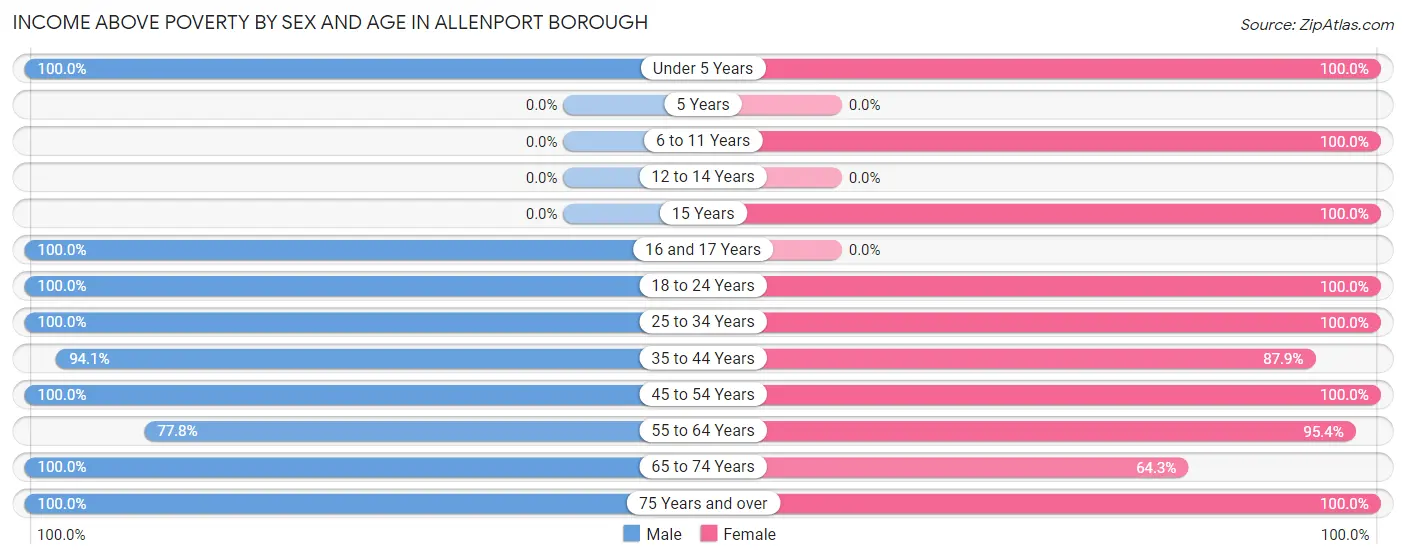
| Age Bracket | Male | Female |
| Under 5 Years | 14 (100.0%) | 5 (100.0%) |
| 5 Years | 0 (0.0%) | 0 (0.0%) |
| 6 to 11 Years | 0 (0.0%) | 7 (100.0%) |
| 12 to 14 Years | 0 (0.0%) | 0 (0.0%) |
| 15 Years | 0 (0.0%) | 11 (100.0%) |
| 16 and 17 Years | 9 (100.0%) | 0 (0.0%) |
| 18 to 24 Years | 23 (100.0%) | 3 (100.0%) |
| 25 to 34 Years | 50 (100.0%) | 18 (100.0%) |
| 35 to 44 Years | 16 (94.1%) | 29 (87.9%) |
| 45 to 54 Years | 34 (100.0%) | 46 (100.0%) |
| 55 to 64 Years | 21 (77.8%) | 41 (95.4%) |
| 65 to 74 Years | 41 (100.0%) | 18 (64.3%) |
| 75 Years and over | 23 (100.0%) | 29 (100.0%) |
| Total | 231 (95.5%) | 207 (92.8%) |
Income Below Poverty Among Married-Couple Families in Allenport borough
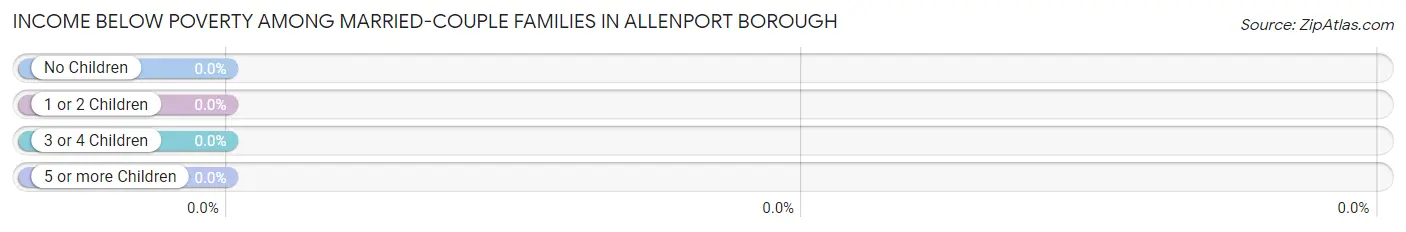
| Children | Above Poverty | Below Poverty |
| No Children | 79 (100.0%) | 0 (0.0%) |
| 1 or 2 Children | 11 (100.0%) | 0 (0.0%) |
| 3 or 4 Children | 8 (100.0%) | 0 (0.0%) |
| 5 or more Children | 0 (0.0%) | 0 (0.0%) |
| Total | 98 (100.0%) | 0 (0.0%) |
Income Below Poverty Among Single-Parent Households in Allenport borough

| Children | Single Father | Single Mother |
| No Children | 0 (0.0%) | 0 (0.0%) |
| 1 or 2 Children | 0 (0.0%) | 4 (100.0%) |
| 3 or 4 Children | 0 (0.0%) | 0 (0.0%) |
| 5 or more Children | 0 (0.0%) | 0 (0.0%) |
| Total | 0 (0.0%) | 4 (44.4%) |
Income Below Poverty Among Married-Couple vs Single-Parent Households in Allenport borough
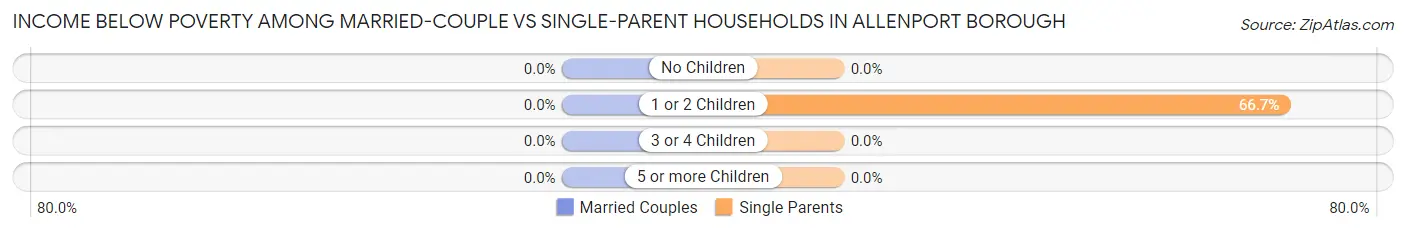
| Children | Married-Couple Families | Single-Parent Households |
| No Children | 0 (0.0%) | 0 (0.0%) |
| 1 or 2 Children | 0 (0.0%) | 4 (66.7%) |
| 3 or 4 Children | 0 (0.0%) | 0 (0.0%) |
| 5 or more Children | 0 (0.0%) | 0 (0.0%) |
| Total | 0 (0.0%) | 4 (36.4%) |
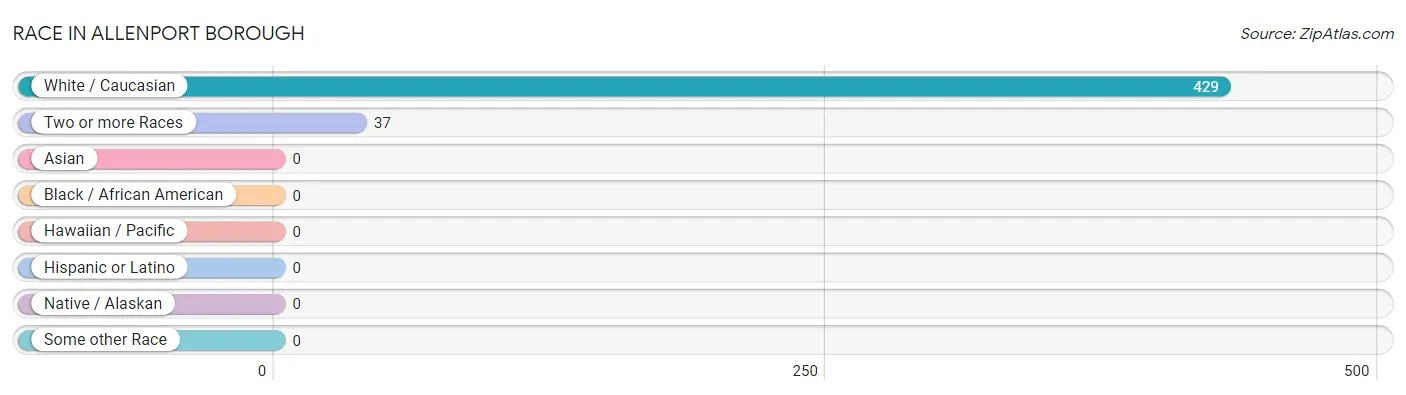
Race in Allenport borough
The most populous races in Allenport borough are White / Caucasian (429 | 92.1%), and Two or more Races (37 | 7.9%).
| Race | # Population | % Population |
| Asian | 0 | 0.0% |
| Black / African American | 0 | 0.0% |
| Hawaiian / Pacific | 0 | 0.0% |
| Hispanic or Latino | 0 | 0.0% |
| Native / Alaskan | 0 | 0.0% |
| White / Caucasian | 429 | 92.1% |
| Two or more Races | 37 | 7.9% |
| Some other Race | 0 | 0.0% |
| Total | 466 | 100.0% |
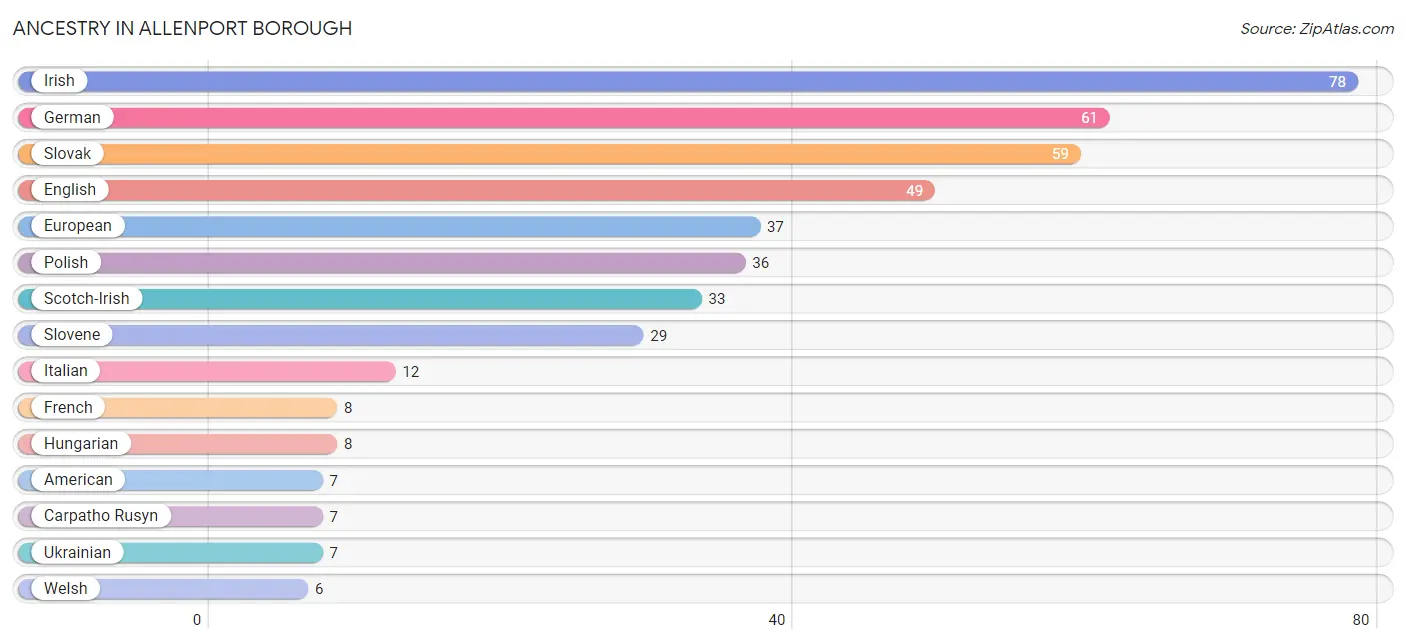
Ancestry in Allenport borough
The most populous ancestries reported in Allenport borough are Irish (78 | 16.7%), German (61 | 13.1%), Slovak (59 | 12.7%), English (49 | 10.5%), and European (37 | 7.9%), together accounting for 61.0% of all Allenport borough residents.
| Ancestry | # Population | % Population |
| American | 7 | 1.5% |
| Carpatho Rusyn | 7 | 1.5% |
| English | 49 | 10.5% |
| European | 37 | 7.9% |
| French | 8 | 1.7% |
| German | 61 | 13.1% |
| Hungarian | 8 | 1.7% |
| Irish | 78 | 16.7% |
| Italian | 12 | 2.6% |
| Polish | 36 | 7.7% |
| Scotch-Irish | 33 | 7.1% |
| Scottish | 3 | 0.6% |
| Serbian | 5 | 1.1% |
| Slovak | 59 | 12.7% |
| Slovene | 29 | 6.2% |
| Ukrainian | 7 | 1.5% |
| Welsh | 6 | 1.3% | View All 17 Rows |
Immigrants in Allenport borough

| Immigration Origin | # Population | % Population | View All 0 Rows |
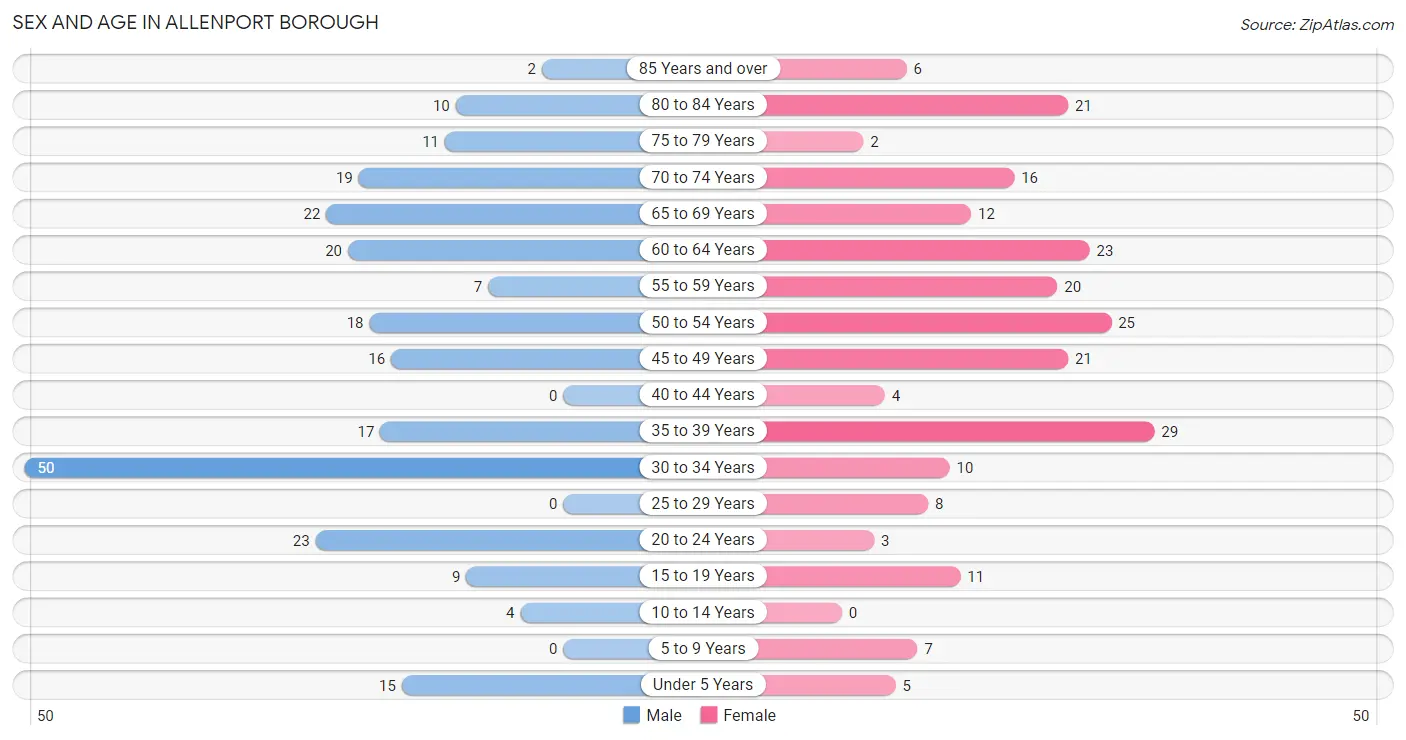
Sex and Age in Allenport borough
Sex and Age in Allenport borough
The most populous age groups in Allenport borough are 30 to 34 Years (50 | 20.6%) for men and 35 to 39 Years (29 | 13.0%) for women.
| Age Bracket | Male | Female |
| Under 5 Years | 15 (6.2%) | 5 (2.2%) |
| 5 to 9 Years | 0 (0.0%) | 7 (3.1%) |
| 10 to 14 Years | 4 (1.7%) | 0 (0.0%) |
| 15 to 19 Years | 9 (3.7%) | 11 (4.9%) |
| 20 to 24 Years | 23 (9.5%) | 3 (1.3%) |
| 25 to 29 Years | 0 (0.0%) | 8 (3.6%) |
| 30 to 34 Years | 50 (20.6%) | 10 (4.5%) |
| 35 to 39 Years | 17 (7.0%) | 29 (13.0%) |
| 40 to 44 Years | 0 (0.0%) | 4 (1.8%) |
| 45 to 49 Years | 16 (6.6%) | 21 (9.4%) |
| 50 to 54 Years | 18 (7.4%) | 25 (11.2%) |
| 55 to 59 Years | 7 (2.9%) | 20 (9.0%) |
| 60 to 64 Years | 20 (8.2%) | 23 (10.3%) |
| 65 to 69 Years | 22 (9.0%) | 12 (5.4%) |
| 70 to 74 Years | 19 (7.8%) | 16 (7.2%) |
| 75 to 79 Years | 11 (4.5%) | 2 (0.9%) |
| 80 to 84 Years | 10 (4.1%) | 21 (9.4%) |
| 85 Years and over | 2 (0.8%) | 6 (2.7%) |
| Total | 243 (100.0%) | 223 (100.0%) |
Families and Households in Allenport borough
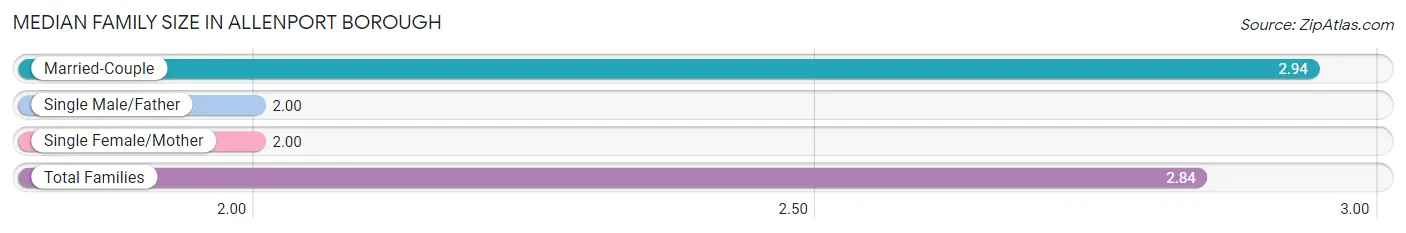
Median Family Size in Allenport borough
The median family size in Allenport borough is 2.84 persons per family, with married-couple families (98 | 89.9%) accounting for the largest median family size of 2.94 persons per family. On the other hand, single male/father families (2 | 1.8%) represent the smallest median family size with 2.00 persons per family.
| Family Type | # Families | Family Size |
| Married-Couple | 98 (89.9%) | 2.94 |
| Single Male/Father | 2 (1.8%) | 2.00 |
| Single Female/Mother | 9 (8.3%) | 2.00 |
| Total Families | 109 (100.0%) | 2.84 |
Median Household Size in Allenport borough
The median household size in Allenport borough is 2.06 persons per household, with married-couple households (98 | 43.4%) accounting for the largest median household size of 2.94 persons per household. non-family households (117 | 51.8%) represent the smallest median household size with 1.32 persons per household.
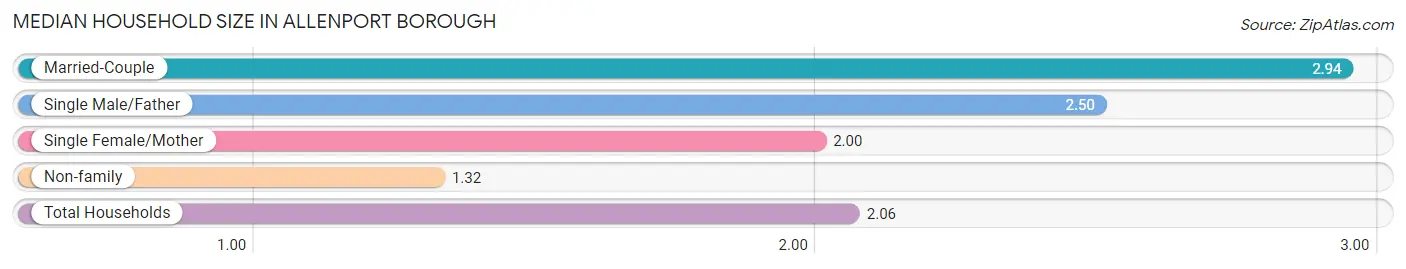
| Household Type | # Households | Household Size |
| Married-Couple | 98 (43.4%) | 2.94 |
| Single Male/Father | 2 (0.9%) | 2.50 |
| Single Female/Mother | 9 (4.0%) | 2.00 |
| Non-family | 117 (51.8%) | 1.32 |
| Total Households | 226 (100.0%) | 2.06 |
Household Size by Marriage Status in Allenport borough
Out of a total of 226 households in Allenport borough, 109 (48.2%) are family households, while 117 (51.8%) are nonfamily households. The most numerous type of family households are 2-person households, comprising 54, and the most common type of nonfamily households are 1-person households, comprising 80.
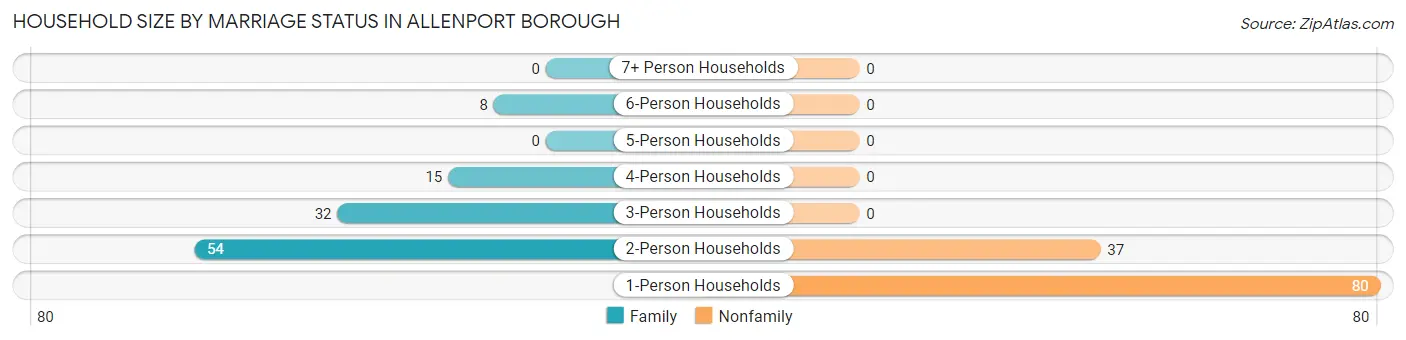
| Household Size | Family Households | Nonfamily Households |
| 1-Person Households | - | 80 (35.4%) |
| 2-Person Households | 54 (23.9%) | 37 (16.4%) |
| 3-Person Households | 32 (14.2%) | 0 (0.0%) |
| 4-Person Households | 15 (6.6%) | 0 (0.0%) |
| 5-Person Households | 0 (0.0%) | 0 (0.0%) |
| 6-Person Households | 8 (3.5%) | 0 (0.0%) |
| 7+ Person Households | 0 (0.0%) | 0 (0.0%) |
| Total | 109 (48.2%) | 117 (51.8%) |
Female Fertility in Allenport borough
Fertility by Age in Allenport borough
Average fertility rate in Allenport borough is 23.0 births per 1,000 women. Women in the age bracket of 20 to 34 years have the highest fertility rate with 95.0 births per 1,000 women. Women in the age bracket of 20 to 34 years acount for 100.0% of all women with births.
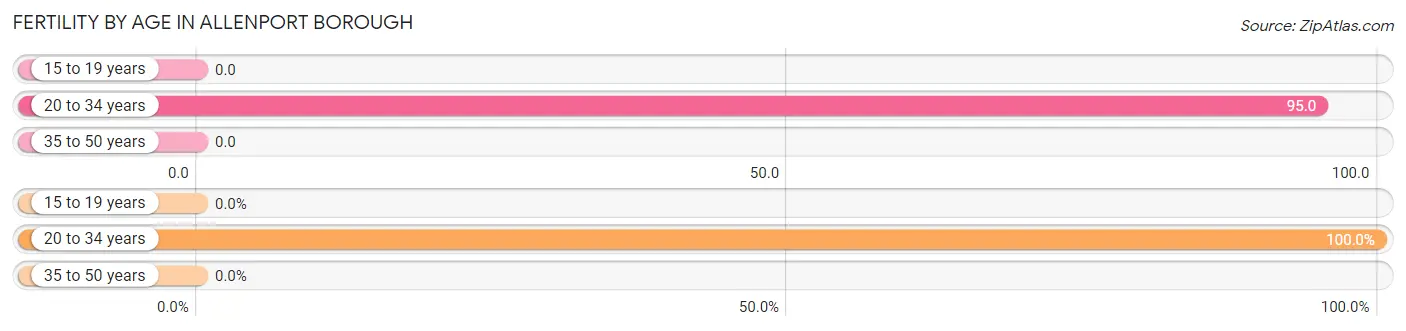
| Age Bracket | Women with Births | Births / 1,000 Women |
| 15 to 19 years | 0 (0.0%) | 0.0 |
| 20 to 34 years | 2 (100.0%) | 95.0 |
| 35 to 50 years | 0 (0.0%) | 0.0 |
| Total | 2 (100.0%) | 23.0 |
Fertility by Age by Marriage Status in Allenport borough
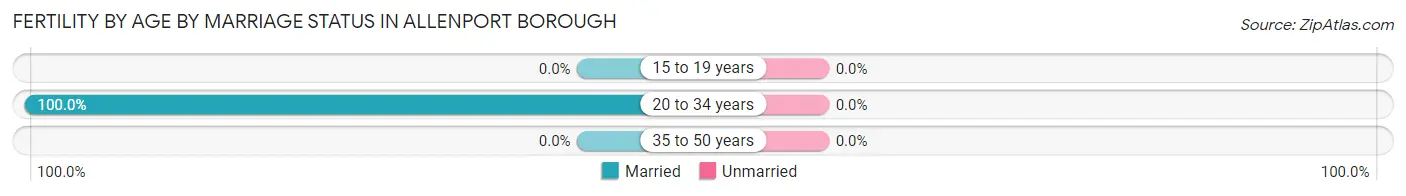
| Age Bracket | Married | Unmarried |
| 15 to 19 years | 0 (0.0%) | 0 (0.0%) |
| 20 to 34 years | 2 (100.0%) | 0 (0.0%) |
| 35 to 50 years | 0 (0.0%) | 0 (0.0%) |
| Total | 2 (100.0%) | 0 (0.0%) |
Fertility by Education in Allenport borough
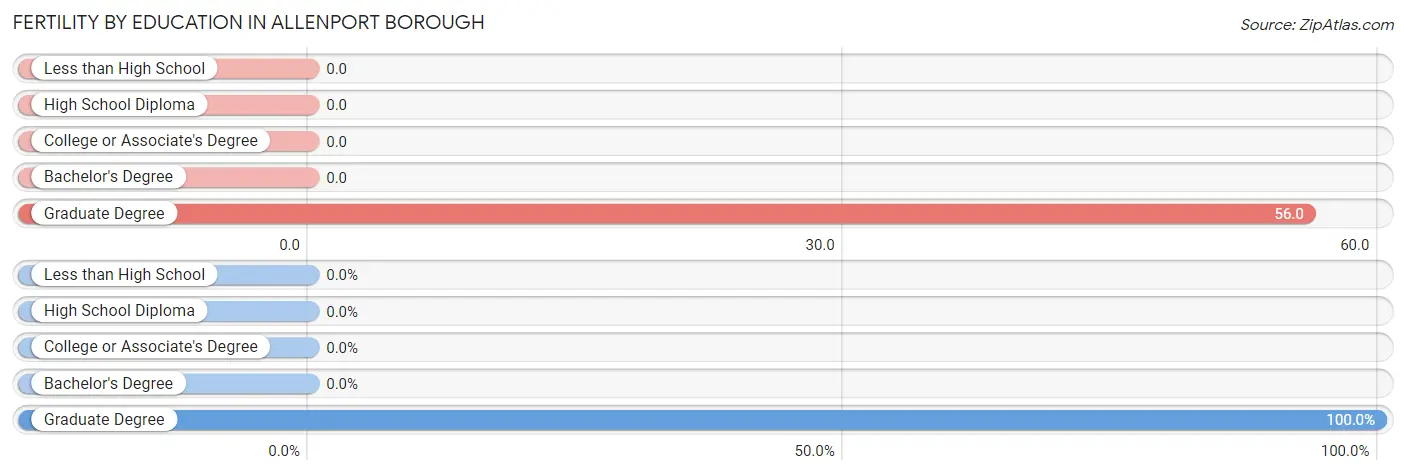
| Educational Attainment | Women with Births | Births / 1,000 Women |
| Less than High School | 0 (0.0%) | 0.0 |
| High School Diploma | 0 (0.0%) | 0.0 |
| College or Associate's Degree | 0 (0.0%) | 0.0 |
| Bachelor's Degree | 0 (0.0%) | 0.0 |
| Graduate Degree | 2 (100.0%) | 56.0 |
| Total | 2 (100.0%) | 23.0 |
Fertility by Education by Marriage Status in Allenport borough
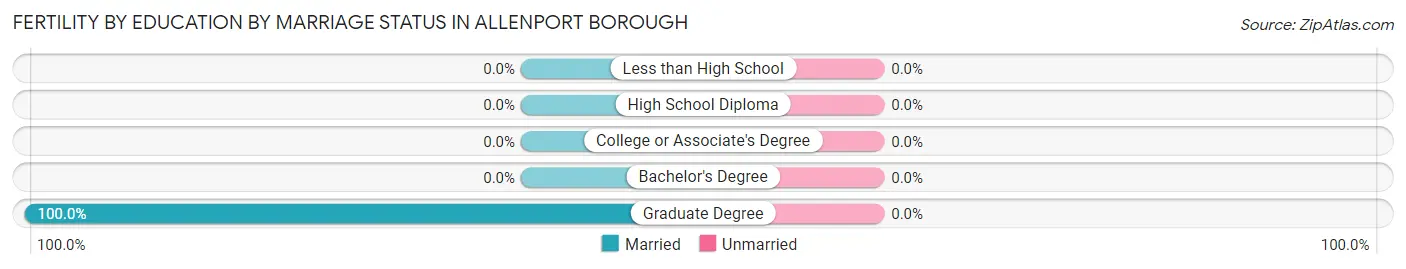
| Educational Attainment | Married | Unmarried |
| Less than High School | 0 (0.0%) | 0 (0.0%) |
| High School Diploma | 0 (0.0%) | 0 (0.0%) |
| College or Associate's Degree | 0 (0.0%) | 0 (0.0%) |
| Bachelor's Degree | 0 (0.0%) | 0 (0.0%) |
| Graduate Degree | 2 (100.0%) | 0 (0.0%) |
| Total | 2 (100.0%) | 0 (0.0%) |
Employment Characteristics in Allenport borough
Employment by Class of Employer in Allenport borough
Among the 196 employed individuals in Allenport borough, private company employees (150 | 76.5%), not-for-profit organizations (39 | 19.9%), and local government employees (4 | 2.0%) make up the most common classes of employment.
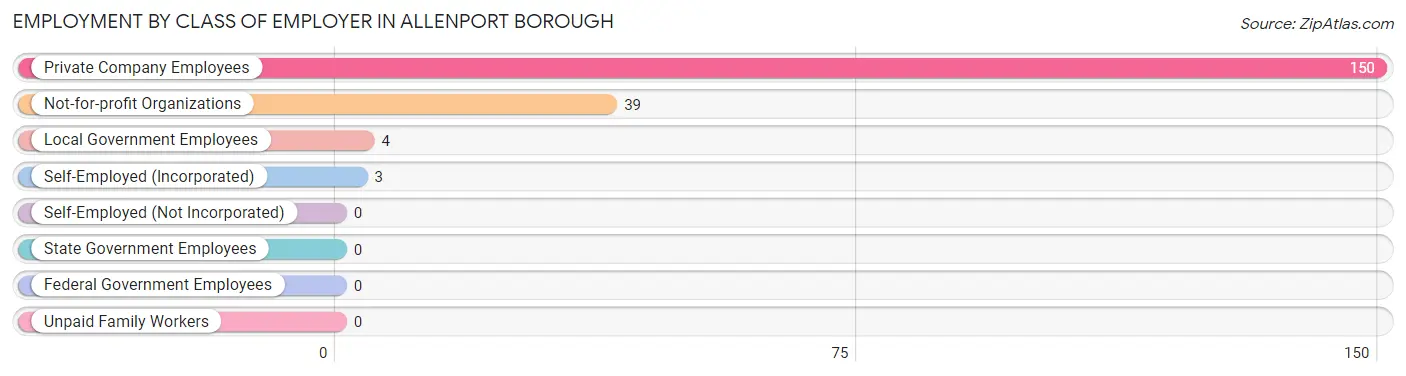
| Employer Class | # Employees | % Employees |
| Private Company Employees | 150 | 76.5% |
| Self-Employed (Incorporated) | 3 | 1.5% |
| Self-Employed (Not Incorporated) | 0 | 0.0% |
| Not-for-profit Organizations | 39 | 19.9% |
| Local Government Employees | 4 | 2.0% |
| State Government Employees | 0 | 0.0% |
| Federal Government Employees | 0 | 0.0% |
| Unpaid Family Workers | 0 | 0.0% |
| Total | 196 | 100.0% |
Employment Status by Age in Allenport borough
According to the labor force statistics for Allenport borough, out of the total population over 16 years of age (424), 48.3% or 205 individuals are in the labor force, with 4.4% or 9 of them unemployed. The age group with the highest labor force participation rate is 25 to 29 years, with 100.0% or 8 individuals in the labor force. Within the labor force, the 30 to 34 years age range has the highest percentage of unemployed individuals, with 8.8% or 5 of them being unemployed.
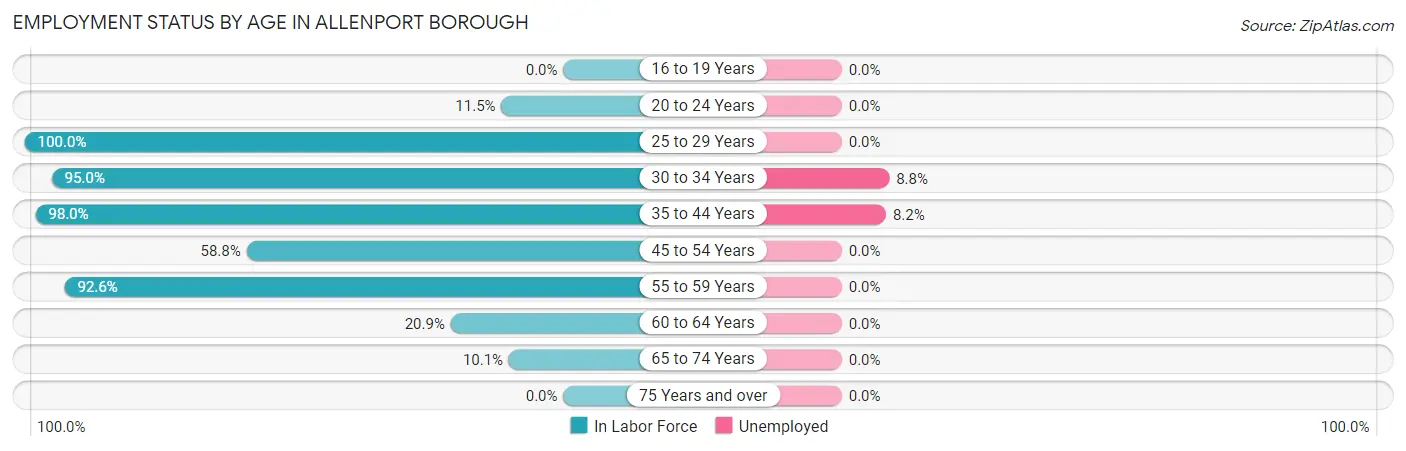
| Age Bracket | In Labor Force | Unemployed |
| 16 to 19 Years | 0 (0.0%) | 0 (0.0%) |
| 20 to 24 Years | 3 (11.5%) | 0 (0.0%) |
| 25 to 29 Years | 8 (100.0%) | 0 (0.0%) |
| 30 to 34 Years | 57 (95.0%) | 5 (8.8%) |
| 35 to 44 Years | 49 (98.0%) | 4 (8.2%) |
| 45 to 54 Years | 47 (58.8%) | 0 (0.0%) |
| 55 to 59 Years | 25 (92.6%) | 0 (0.0%) |
| 60 to 64 Years | 9 (20.9%) | 0 (0.0%) |
| 65 to 74 Years | 7 (10.1%) | 0 (0.0%) |
| 75 Years and over | 0 (0.0%) | 0 (0.0%) |
| Total | 205 (48.3%) | 9 (4.4%) |
Employment Status by Educational Attainment in Allenport borough
According to labor force statistics for Allenport borough, 72.8% of individuals (195) out of the total population between 25 and 64 years of age (268) are in the labor force, with 4.6% or 9 of them being unemployed. The group with the highest labor force participation rate are those with the educational attainment of less than high school, with 90.9% or 10 individuals in the labor force. Within the labor force, individuals with college / associate degree education have the highest percentage of unemployment, with 25.0% or 4 of them being unemployed.

| Educational Attainment | In Labor Force | Unemployed |
| Less than High School | 10 (90.9%) | 0 (0.0%) |
| High School Diploma | 83 (63.8%) | 8 (6.0%) |
| College / Associate Degree | 16 (88.9%) | 4 (25.0%) |
| Bachelor's Degree or higher | 86 (78.9%) | 0 (0.0%) |
| Total | 195 (72.8%) | 12 (4.6%) |
Employment Occupations by Sex in Allenport borough
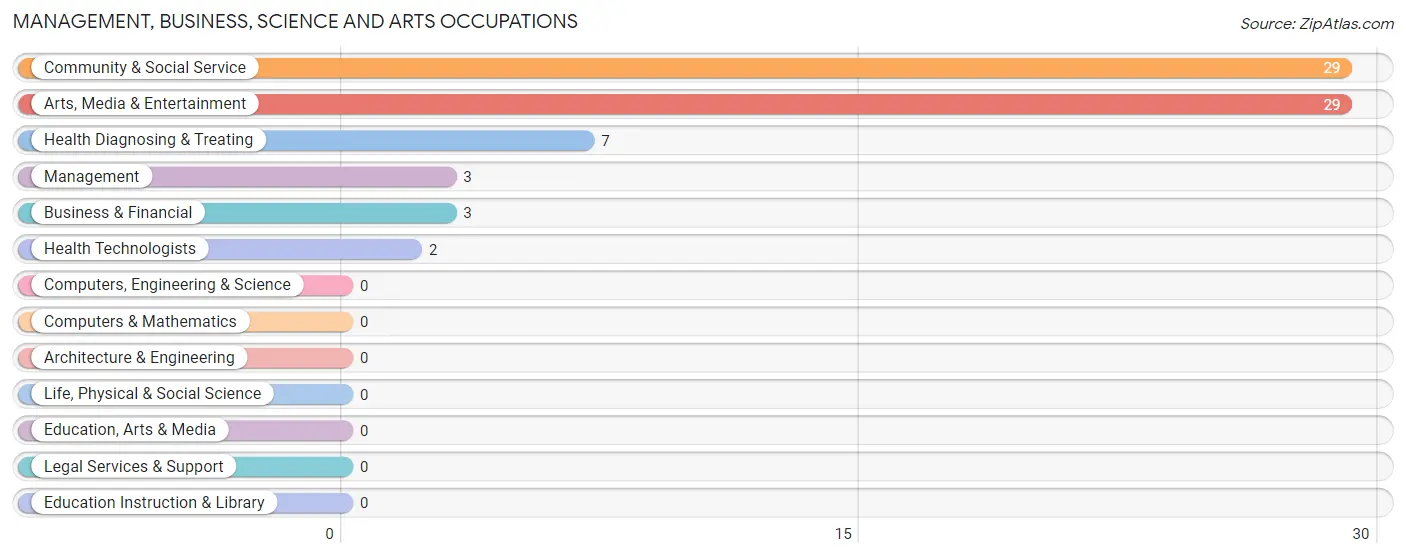
Management, Business, Science and Arts Occupations
The most common Management, Business, Science and Arts occupations in Allenport borough are Community & Social Service (29 | 14.8%), Arts, Media & Entertainment (29 | 14.8%), Health Diagnosing & Treating (7 | 3.6%), Management (3 | 1.5%), and Business & Financial (3 | 1.5%).
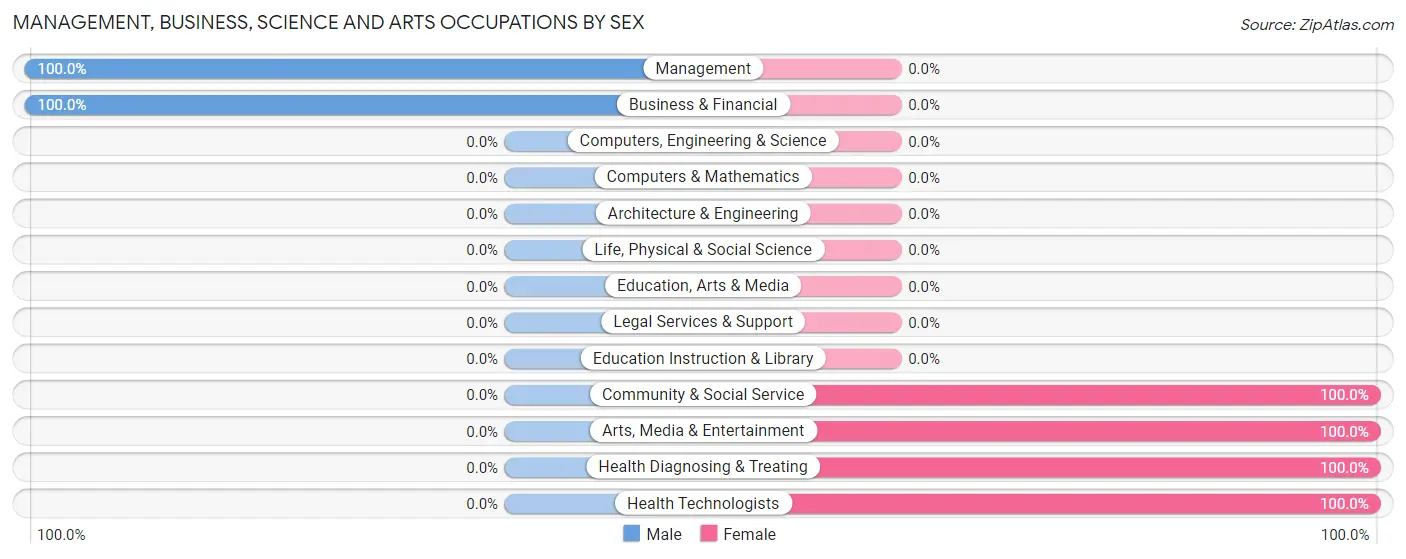
Management, Business, Science and Arts Occupations by Sex
Within the Management, Business, Science and Arts occupations in Allenport borough, the most male-oriented occupations are Management (100.0%), and Business & Financial (100.0%), while the most female-oriented occupations are Community & Social Service (100.0%), Arts, Media & Entertainment (100.0%), and Health Diagnosing & Treating (100.0%).
| Occupation | Male | Female |
| Management | 3 (100.0%) | 0 (0.0%) |
| Business & Financial | 3 (100.0%) | 0 (0.0%) |
| Computers, Engineering & Science | 0 (0.0%) | 0 (0.0%) |
| Computers & Mathematics | 0 (0.0%) | 0 (0.0%) |
| Architecture & Engineering | 0 (0.0%) | 0 (0.0%) |
| Life, Physical & Social Science | 0 (0.0%) | 0 (0.0%) |
| Community & Social Service | 0 (0.0%) | 29 (100.0%) |
| Education, Arts & Media | 0 (0.0%) | 0 (0.0%) |
| Legal Services & Support | 0 (0.0%) | 0 (0.0%) |
| Education Instruction & Library | 0 (0.0%) | 0 (0.0%) |
| Arts, Media & Entertainment | 0 (0.0%) | 29 (100.0%) |
| Health Diagnosing & Treating | 0 (0.0%) | 7 (100.0%) |
| Health Technologists | 0 (0.0%) | 2 (100.0%) |
| Total (Category) | 6 (14.3%) | 36 (85.7%) |
| Total (Overall) | 105 (53.6%) | 91 (46.4%) |
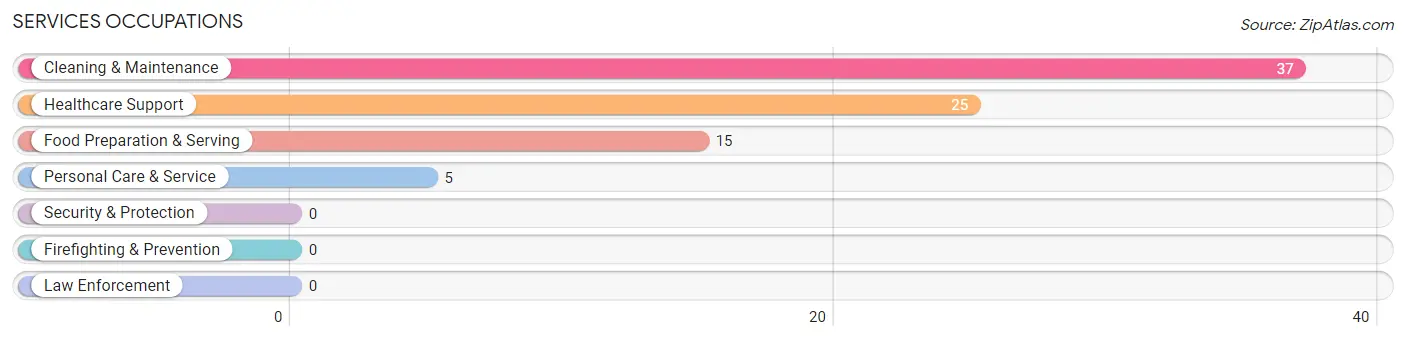
Services Occupations
The most common Services occupations in Allenport borough are Cleaning & Maintenance (37 | 18.9%), Healthcare Support (25 | 12.8%), Food Preparation & Serving (15 | 7.6%), and Personal Care & Service (5 | 2.5%).
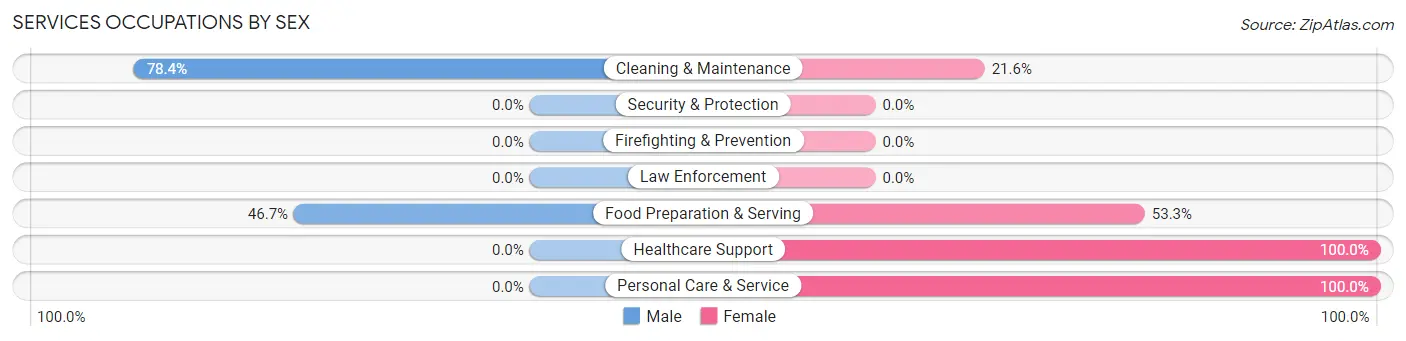
Services Occupations by Sex
Within the Services occupations in Allenport borough, the most male-oriented occupations are Cleaning & Maintenance (78.4%), and Food Preparation & Serving (46.7%), while the most female-oriented occupations are Healthcare Support (100.0%), Personal Care & Service (100.0%), and Food Preparation & Serving (53.3%).
| Occupation | Male | Female |
| Healthcare Support | 0 (0.0%) | 25 (100.0%) |
| Security & Protection | 0 (0.0%) | 0 (0.0%) |
| Firefighting & Prevention | 0 (0.0%) | 0 (0.0%) |
| Law Enforcement | 0 (0.0%) | 0 (0.0%) |
| Food Preparation & Serving | 7 (46.7%) | 8 (53.3%) |
| Cleaning & Maintenance | 29 (78.4%) | 8 (21.6%) |
| Personal Care & Service | 0 (0.0%) | 5 (100.0%) |
| Total (Category) | 36 (43.9%) | 46 (56.1%) |
| Total (Overall) | 105 (53.6%) | 91 (46.4%) |
Sales and Office Occupations
The most common Sales and Office occupations in Allenport borough are Office & Administration (21 | 10.7%), and Sales & Related (9 | 4.6%).
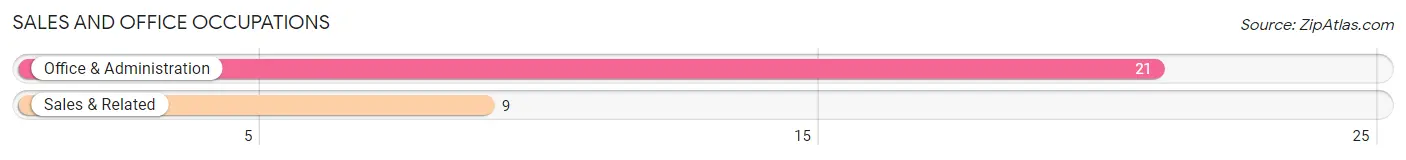
Sales and Office Occupations by Sex

| Occupation | Male | Female |
| Sales & Related | 0 (0.0%) | 9 (100.0%) |
| Office & Administration | 21 (100.0%) | 0 (0.0%) |
| Total (Category) | 21 (70.0%) | 9 (30.0%) |
| Total (Overall) | 105 (53.6%) | 91 (46.4%) |
Natural Resources, Construction and Maintenance Occupations
The most common Natural Resources, Construction and Maintenance occupations in Allenport borough are Installation, Maintenance & Repair (18 | 9.2%), and Construction & Extraction (10 | 5.1%).
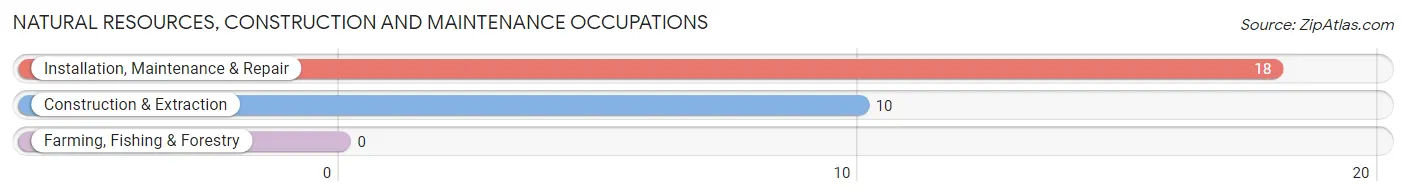
Natural Resources, Construction and Maintenance Occupations by Sex

| Occupation | Male | Female |
| Farming, Fishing & Forestry | 0 (0.0%) | 0 (0.0%) |
| Construction & Extraction | 10 (100.0%) | 0 (0.0%) |
| Installation, Maintenance & Repair | 18 (100.0%) | 0 (0.0%) |
| Total (Category) | 28 (100.0%) | 0 (0.0%) |
| Total (Overall) | 105 (53.6%) | 91 (46.4%) |
Production, Transportation and Moving Occupations
The most common Production, Transportation and Moving occupations in Allenport borough are Material Moving (8 | 4.1%), Transportation (4 | 2.0%), and Production (2 | 1.0%).
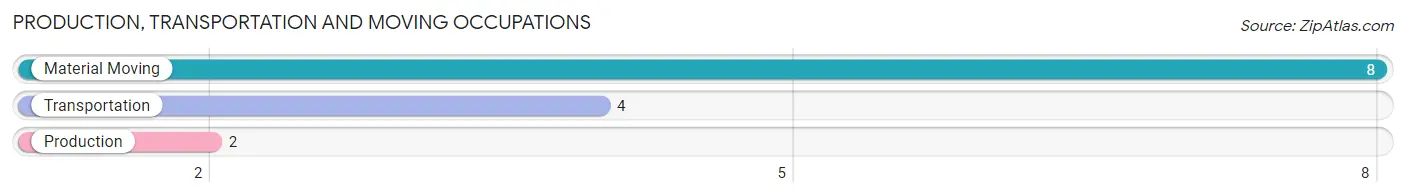
Production, Transportation and Moving Occupations by Sex
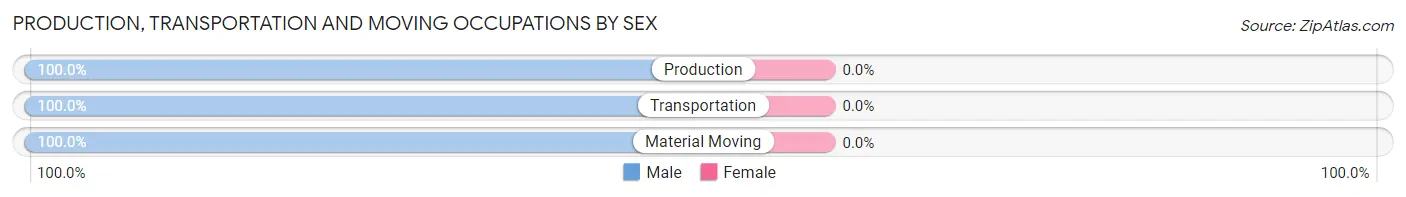
| Occupation | Male | Female |
| Production | 2 (100.0%) | 0 (0.0%) |
| Transportation | 4 (100.0%) | 0 (0.0%) |
| Material Moving | 8 (100.0%) | 0 (0.0%) |
| Total (Category) | 14 (100.0%) | 0 (0.0%) |
| Total (Overall) | 105 (53.6%) | 91 (46.4%) |
Employment Industries by Sex in Allenport borough
Employment Industries in Allenport borough
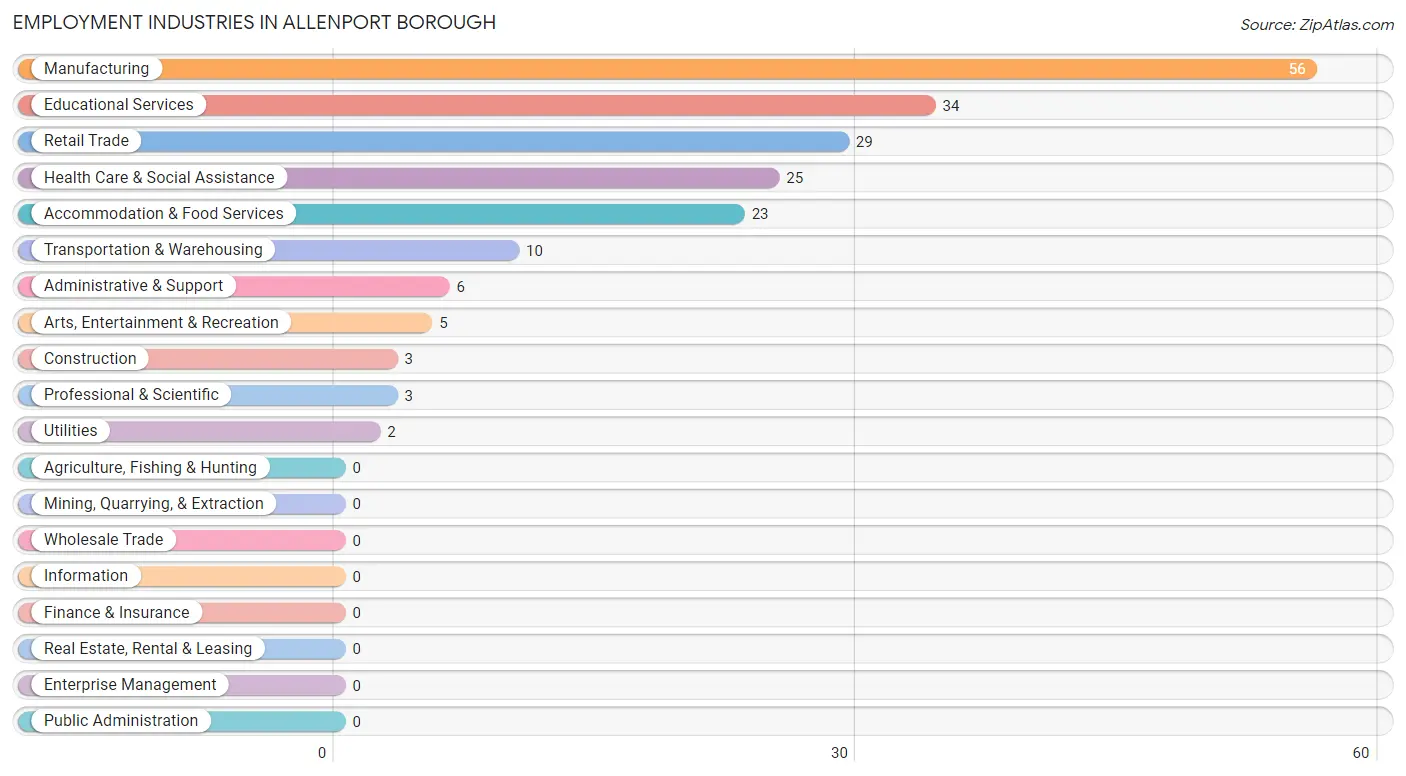
The major employment industries in Allenport borough include Manufacturing (56 | 28.6%), Educational Services (34 | 17.3%), Retail Trade (29 | 14.8%), Health Care & Social Assistance (25 | 12.8%), and Accommodation & Food Services (23 | 11.7%).
Employment Industries by Sex in Allenport borough
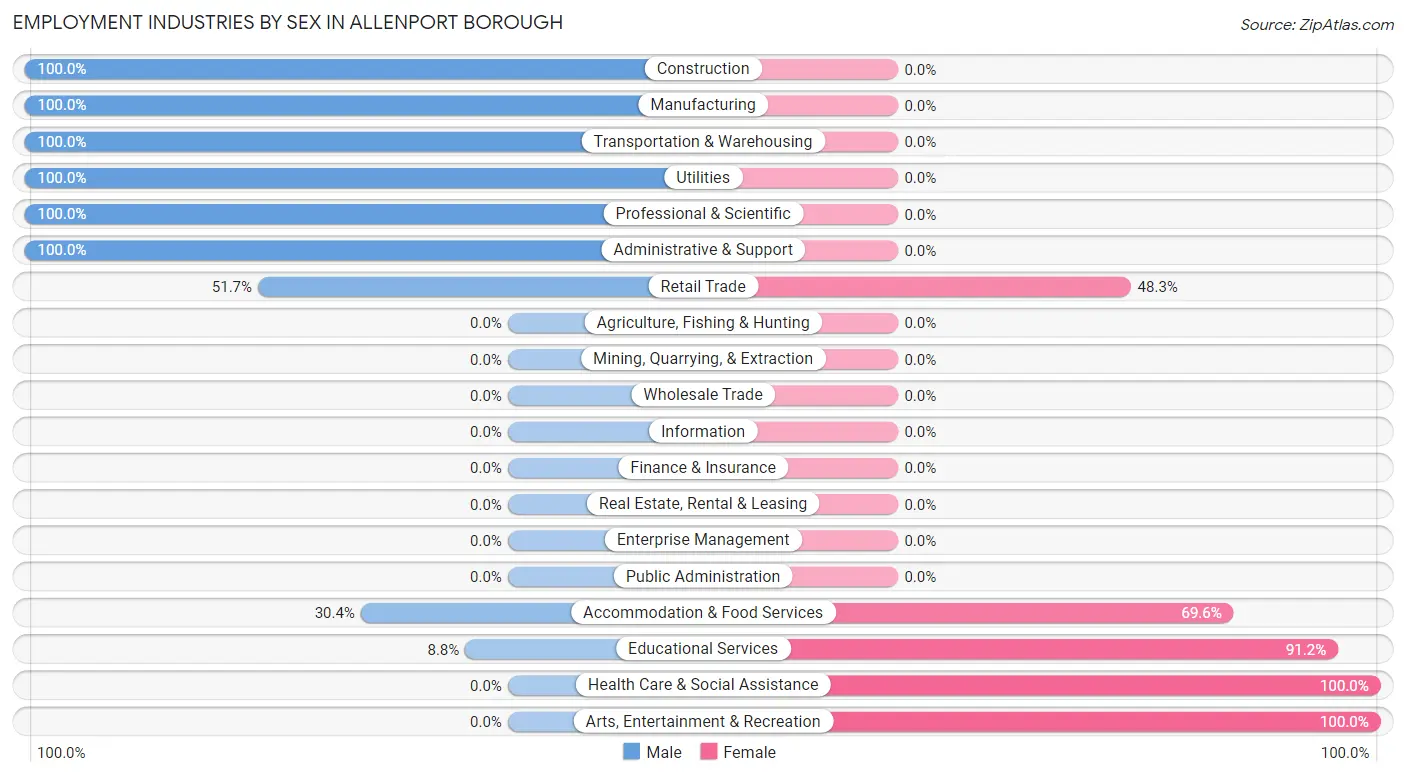
The Allenport borough industries that see more men than women are Construction (100.0%), Manufacturing (100.0%), and Transportation & Warehousing (100.0%), whereas the industries that tend to have a higher number of women are Health Care & Social Assistance (100.0%), Arts, Entertainment & Recreation (100.0%), and Educational Services (91.2%).
| Industry | Male | Female |
| Agriculture, Fishing & Hunting | 0 (0.0%) | 0 (0.0%) |
| Mining, Quarrying, & Extraction | 0 (0.0%) | 0 (0.0%) |
| Construction | 3 (100.0%) | 0 (0.0%) |
| Manufacturing | 56 (100.0%) | 0 (0.0%) |
| Wholesale Trade | 0 (0.0%) | 0 (0.0%) |
| Retail Trade | 15 (51.7%) | 14 (48.3%) |
| Transportation & Warehousing | 10 (100.0%) | 0 (0.0%) |
| Utilities | 2 (100.0%) | 0 (0.0%) |
| Information | 0 (0.0%) | 0 (0.0%) |
| Finance & Insurance | 0 (0.0%) | 0 (0.0%) |
| Real Estate, Rental & Leasing | 0 (0.0%) | 0 (0.0%) |
| Professional & Scientific | 3 (100.0%) | 0 (0.0%) |
| Enterprise Management | 0 (0.0%) | 0 (0.0%) |
| Administrative & Support | 6 (100.0%) | 0 (0.0%) |
| Educational Services | 3 (8.8%) | 31 (91.2%) |
| Health Care & Social Assistance | 0 (0.0%) | 25 (100.0%) |
| Arts, Entertainment & Recreation | 0 (0.0%) | 5 (100.0%) |
| Accommodation & Food Services | 7 (30.4%) | 16 (69.6%) |
| Public Administration | 0 (0.0%) | 0 (0.0%) |
| Total | 105 (53.6%) | 91 (46.4%) |
Education in Allenport borough
School Enrollment in Allenport borough
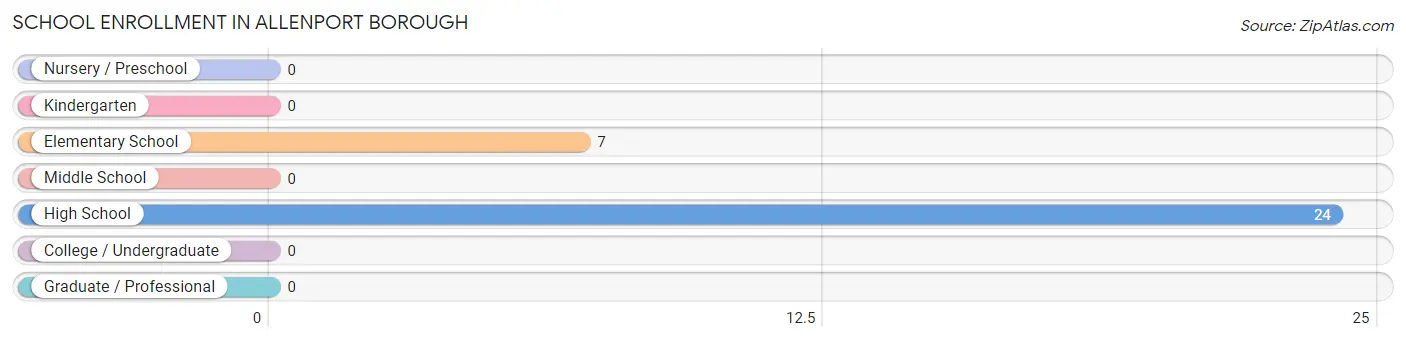
The most common levels of schooling among the 31 students in Allenport borough are high school (24 | 77.4%), and elementary school (7 | 22.6%).
| School Level | # Students | % Students |
| Nursery / Preschool | 0 | 0.0% |
| Kindergarten | 0 | 0.0% |
| Elementary School | 7 | 22.6% |
| Middle School | 0 | 0.0% |
| High School | 24 | 77.4% |
| College / Undergraduate | 0 | 0.0% |
| Graduate / Professional | 0 | 0.0% |
| Total | 31 | 100.0% |
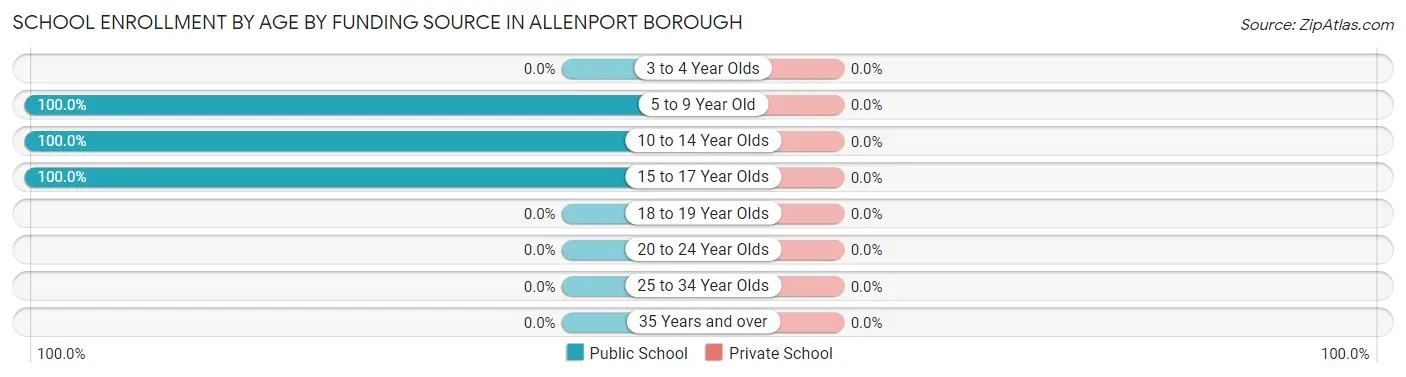
School Enrollment by Age by Funding Source in Allenport borough
| Age Bracket | Public School | Private School |
| 3 to 4 Year Olds | 0 (0.0%) | 0 (0.0%) |
| 5 to 9 Year Old | 7 (100.0%) | 0 (0.0%) |
| 10 to 14 Year Olds | 4 (100.0%) | 0 (0.0%) |
| 15 to 17 Year Olds | 20 (100.0%) | 0 (0.0%) |
| 18 to 19 Year Olds | 0 (0.0%) | 0 (0.0%) |
| 20 to 24 Year Olds | 0 (0.0%) | 0 (0.0%) |
| 25 to 34 Year Olds | 0 (0.0%) | 0 (0.0%) |
| 35 Years and over | 0 (0.0%) | 0 (0.0%) |
| Total | 31 (100.0%) | 0 (0.0%) |
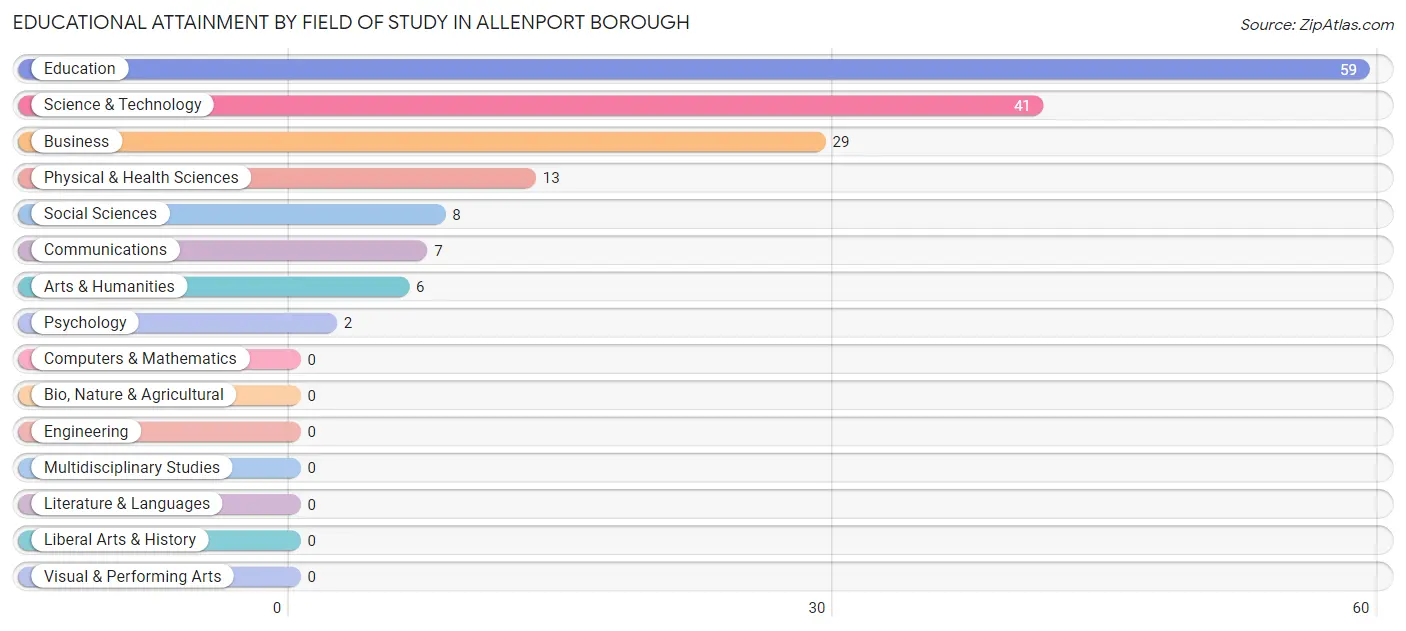
Educational Attainment by Field of Study in Allenport borough
Education (59 | 35.8%), science & technology (41 | 24.8%), business (29 | 17.6%), physical & health sciences (13 | 7.9%), and social sciences (8 | 4.9%) are the most common fields of study among 165 individuals in Allenport borough who have obtained a bachelor's degree or higher.
| Field of Study | # Graduates | % Graduates |
| Computers & Mathematics | 0 | 0.0% |
| Bio, Nature & Agricultural | 0 | 0.0% |
| Physical & Health Sciences | 13 | 7.9% |
| Psychology | 2 | 1.2% |
| Social Sciences | 8 | 4.9% |
| Engineering | 0 | 0.0% |
| Multidisciplinary Studies | 0 | 0.0% |
| Science & Technology | 41 | 24.8% |
| Business | 29 | 17.6% |
| Education | 59 | 35.8% |
| Literature & Languages | 0 | 0.0% |
| Liberal Arts & History | 0 | 0.0% |
| Visual & Performing Arts | 0 | 0.0% |
| Communications | 7 | 4.2% |
| Arts & Humanities | 6 | 3.6% |
| Total | 165 | 100.0% |
Transportation & Commute in Allenport borough
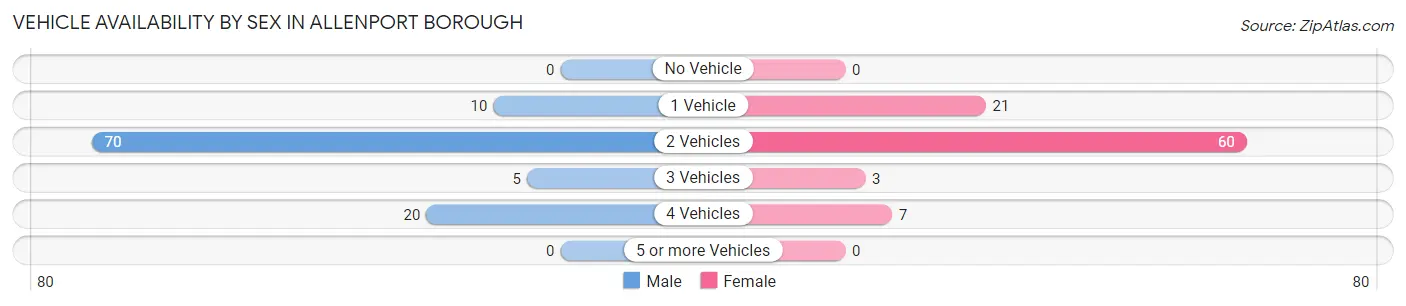
Vehicle Availability by Sex in Allenport borough
The most prevalent vehicle ownership categories in Allenport borough are males with 2 vehicles (70, accounting for 66.7%) and females with 2 vehicles (60, making up 76.9%).
| Vehicles Available | Male | Female |
| No Vehicle | 0 (0.0%) | 0 (0.0%) |
| 1 Vehicle | 10 (9.5%) | 21 (23.1%) |
| 2 Vehicles | 70 (66.7%) | 60 (65.9%) |
| 3 Vehicles | 5 (4.8%) | 3 (3.3%) |
| 4 Vehicles | 20 (19.1%) | 7 (7.7%) |
| 5 or more Vehicles | 0 (0.0%) | 0 (0.0%) |
| Total | 105 (100.0%) | 91 (100.0%) |
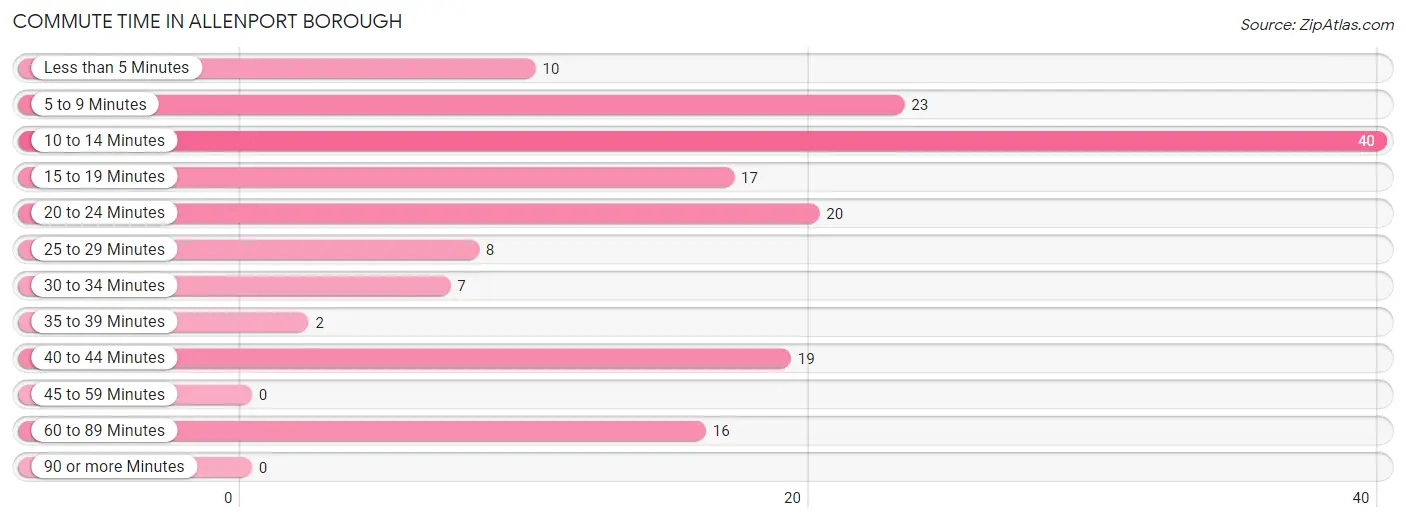
Commute Time in Allenport borough
The most frequently occuring commute durations in Allenport borough are 10 to 14 minutes (40 commuters, 24.7%), 5 to 9 minutes (23 commuters, 14.2%), and 20 to 24 minutes (20 commuters, 12.3%).
| Commute Time | # Commuters | % Commuters |
| Less than 5 Minutes | 10 | 6.2% |
| 5 to 9 Minutes | 23 | 14.2% |
| 10 to 14 Minutes | 40 | 24.7% |
| 15 to 19 Minutes | 17 | 10.5% |
| 20 to 24 Minutes | 20 | 12.3% |
| 25 to 29 Minutes | 8 | 4.9% |
| 30 to 34 Minutes | 7 | 4.3% |
| 35 to 39 Minutes | 2 | 1.2% |
| 40 to 44 Minutes | 19 | 11.7% |
| 45 to 59 Minutes | 0 | 0.0% |
| 60 to 89 Minutes | 16 | 9.9% |
| 90 or more Minutes | 0 | 0.0% |
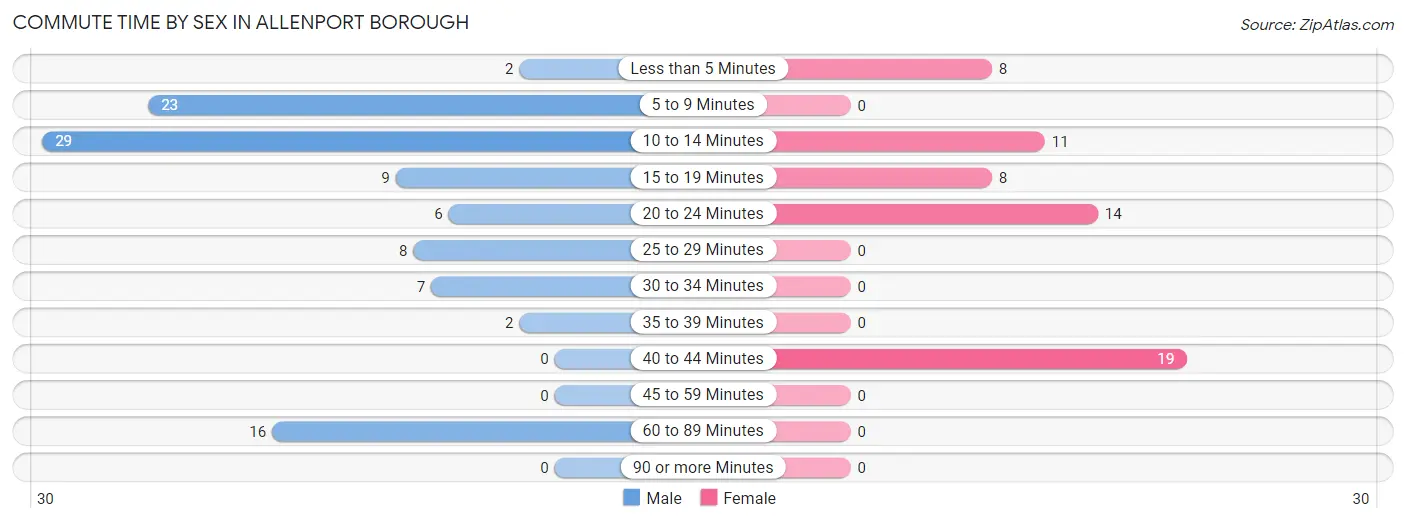
Commute Time by Sex in Allenport borough
The most common commute times in Allenport borough are 10 to 14 minutes (29 commuters, 28.4%) for males and 40 to 44 minutes (19 commuters, 31.7%) for females.
| Commute Time | Male | Female |
| Less than 5 Minutes | 2 (2.0%) | 8 (13.3%) |
| 5 to 9 Minutes | 23 (22.6%) | 0 (0.0%) |
| 10 to 14 Minutes | 29 (28.4%) | 11 (18.3%) |
| 15 to 19 Minutes | 9 (8.8%) | 8 (13.3%) |
| 20 to 24 Minutes | 6 (5.9%) | 14 (23.3%) |
| 25 to 29 Minutes | 8 (7.8%) | 0 (0.0%) |
| 30 to 34 Minutes | 7 (6.9%) | 0 (0.0%) |
| 35 to 39 Minutes | 2 (2.0%) | 0 (0.0%) |
| 40 to 44 Minutes | 0 (0.0%) | 19 (31.7%) |
| 45 to 59 Minutes | 0 (0.0%) | 0 (0.0%) |
| 60 to 89 Minutes | 16 (15.7%) | 0 (0.0%) |
| 90 or more Minutes | 0 (0.0%) | 0 (0.0%) |
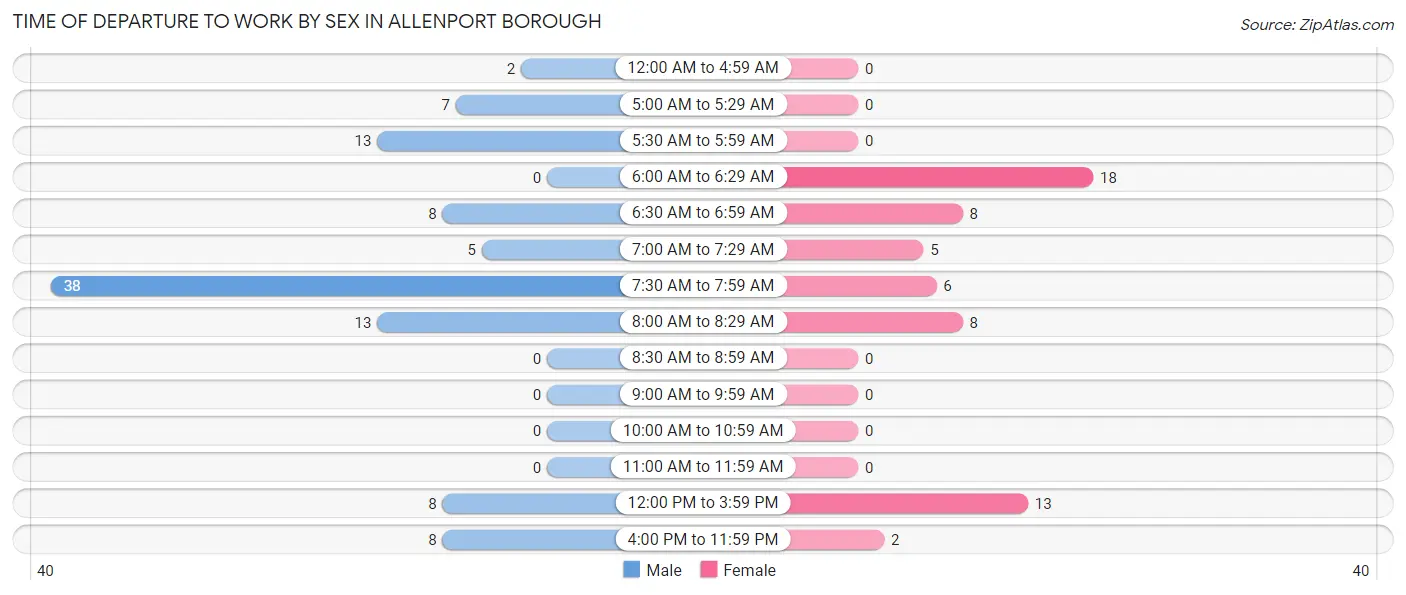
Time of Departure to Work by Sex in Allenport borough
The most frequent times of departure to work in Allenport borough are 7:30 AM to 7:59 AM (38, 37.2%) for males and 6:00 AM to 6:29 AM (18, 30.0%) for females.
| Time of Departure | Male | Female |
| 12:00 AM to 4:59 AM | 2 (2.0%) | 0 (0.0%) |
| 5:00 AM to 5:29 AM | 7 (6.9%) | 0 (0.0%) |
| 5:30 AM to 5:59 AM | 13 (12.8%) | 0 (0.0%) |
| 6:00 AM to 6:29 AM | 0 (0.0%) | 18 (30.0%) |
| 6:30 AM to 6:59 AM | 8 (7.8%) | 8 (13.3%) |
| 7:00 AM to 7:29 AM | 5 (4.9%) | 5 (8.3%) |
| 7:30 AM to 7:59 AM | 38 (37.2%) | 6 (10.0%) |
| 8:00 AM to 8:29 AM | 13 (12.8%) | 8 (13.3%) |
| 8:30 AM to 8:59 AM | 0 (0.0%) | 0 (0.0%) |
| 9:00 AM to 9:59 AM | 0 (0.0%) | 0 (0.0%) |
| 10:00 AM to 10:59 AM | 0 (0.0%) | 0 (0.0%) |
| 11:00 AM to 11:59 AM | 0 (0.0%) | 0 (0.0%) |
| 12:00 PM to 3:59 PM | 8 (7.8%) | 13 (21.7%) |
| 4:00 PM to 11:59 PM | 8 (7.8%) | 2 (3.3%) |
| Total | 102 (100.0%) | 60 (100.0%) |
Housing Occupancy in Allenport borough
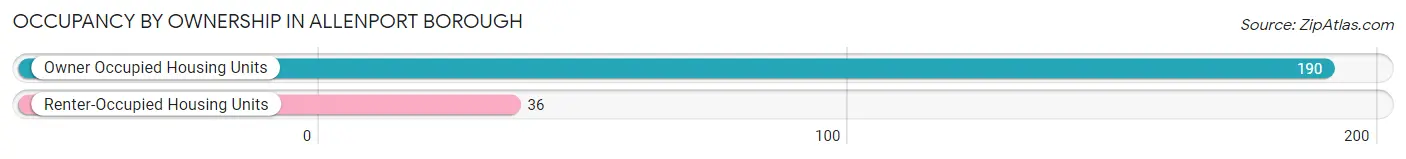
Occupancy by Ownership in Allenport borough
Of the total 226 dwellings in Allenport borough, owner-occupied units account for 190 (84.1%), while renter-occupied units make up 36 (15.9%).
| Occupancy | # Housing Units | % Housing Units |
| Owner Occupied Housing Units | 190 | 84.1% |
| Renter-Occupied Housing Units | 36 | 15.9% |
| Total Occupied Housing Units | 226 | 100.0% |
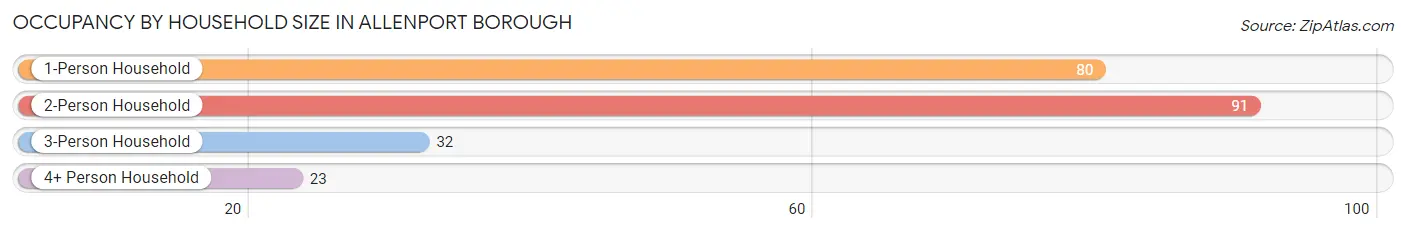
Occupancy by Household Size in Allenport borough
| Household Size | # Housing Units | % Housing Units |
| 1-Person Household | 80 | 35.4% |
| 2-Person Household | 91 | 40.3% |
| 3-Person Household | 32 | 14.2% |
| 4+ Person Household | 23 | 10.2% |
| Total Housing Units | 226 | 100.0% |
Occupancy by Ownership by Household Size in Allenport borough
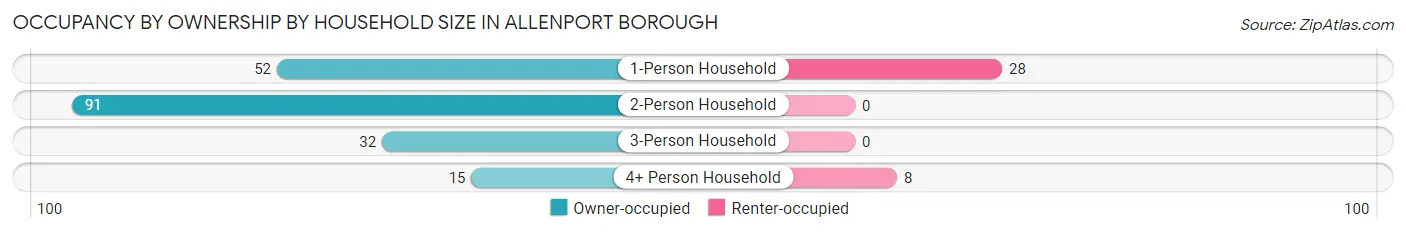
| Household Size | Owner-occupied | Renter-occupied |
| 1-Person Household | 52 (65.0%) | 28 (35.0%) |
| 2-Person Household | 91 (100.0%) | 0 (0.0%) |
| 3-Person Household | 32 (100.0%) | 0 (0.0%) |
| 4+ Person Household | 15 (65.2%) | 8 (34.8%) |
| Total Housing Units | 190 (84.1%) | 36 (15.9%) |
Occupancy by Educational Attainment in Allenport borough
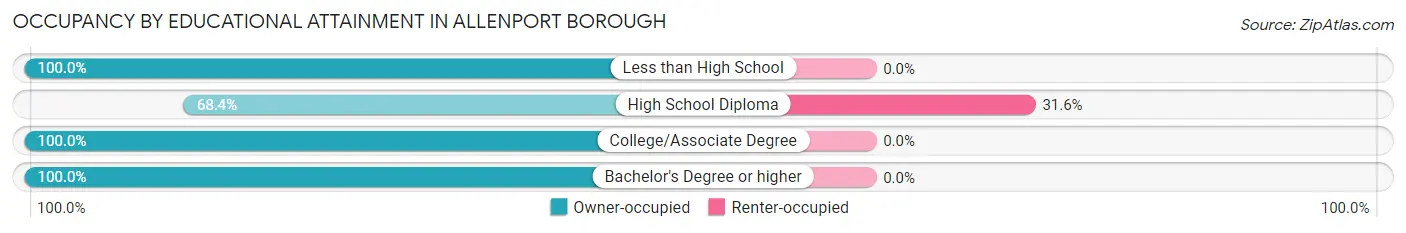
| Household Size | Owner-occupied | Renter-occupied |
| Less than High School | 6 (100.0%) | 0 (0.0%) |
| High School Diploma | 78 (68.4%) | 36 (31.6%) |
| College/Associate Degree | 22 (100.0%) | 0 (0.0%) |
| Bachelor's Degree or higher | 84 (100.0%) | 0 (0.0%) |
Occupancy by Age of Householder in Allenport borough
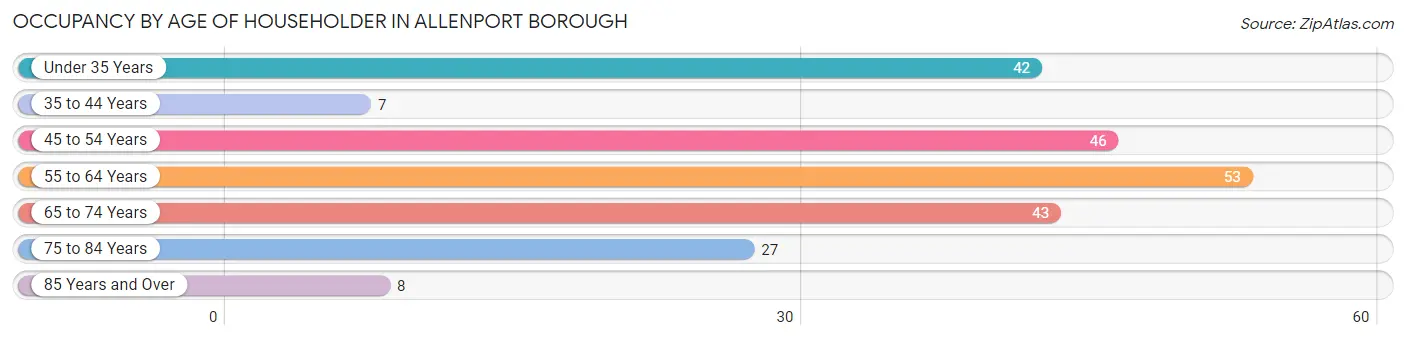
| Age Bracket | # Households | % Households |
| Under 35 Years | 42 | 18.6% |
| 35 to 44 Years | 7 | 3.1% |
| 45 to 54 Years | 46 | 20.3% |
| 55 to 64 Years | 53 | 23.4% |
| 65 to 74 Years | 43 | 19.0% |
| 75 to 84 Years | 27 | 11.9% |
| 85 Years and Over | 8 | 3.5% |
| Total | 226 | 100.0% |
Housing Finances in Allenport borough
Median Income by Occupancy in Allenport borough
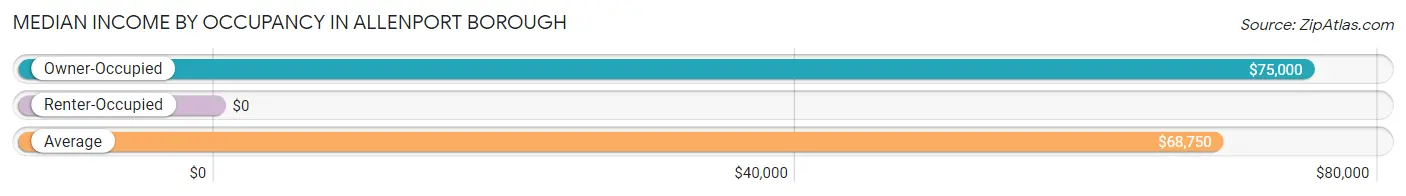
| Occupancy Type | # Households | Median Income |
| Owner-Occupied | 190 (84.1%) | $75,000 |
| Renter-Occupied | 36 (15.9%) | $0 |
| Average | 226 (100.0%) | $68,750 |
Occupancy by Householder Income Bracket in Allenport borough
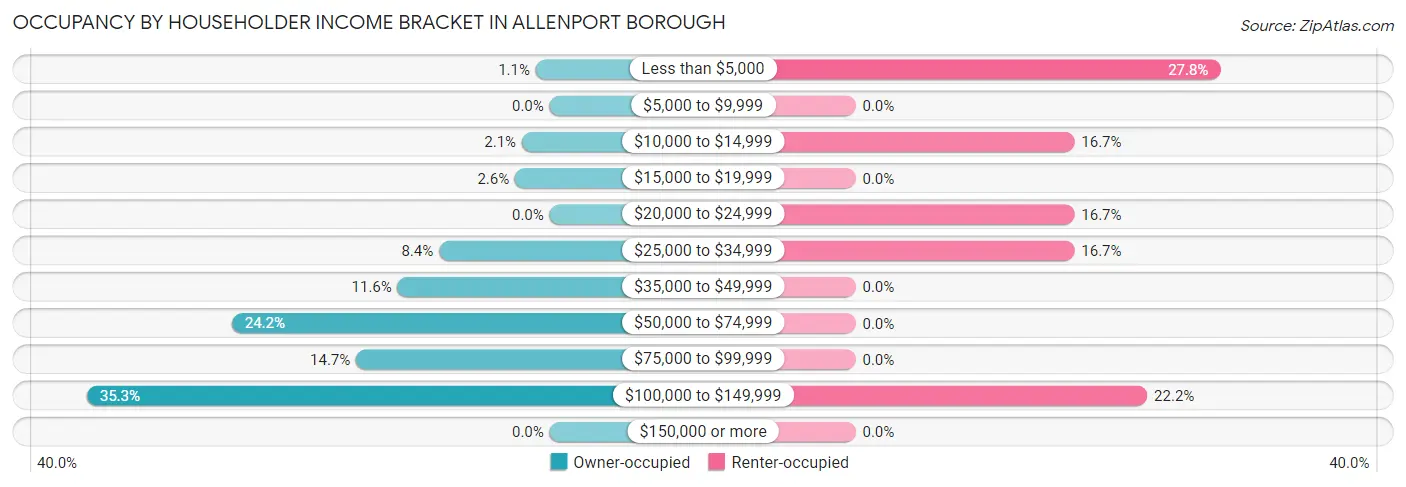
| Income Bracket | Owner-occupied | Renter-occupied |
| Less than $5,000 | 2 (1.1%) | 10 (27.8%) |
| $5,000 to $9,999 | 0 (0.0%) | 0 (0.0%) |
| $10,000 to $14,999 | 4 (2.1%) | 6 (16.7%) |
| $15,000 to $19,999 | 5 (2.6%) | 0 (0.0%) |
| $20,000 to $24,999 | 0 (0.0%) | 6 (16.7%) |
| $25,000 to $34,999 | 16 (8.4%) | 6 (16.7%) |
| $35,000 to $49,999 | 22 (11.6%) | 0 (0.0%) |
| $50,000 to $74,999 | 46 (24.2%) | 0 (0.0%) |
| $75,000 to $99,999 | 28 (14.7%) | 0 (0.0%) |
| $100,000 to $149,999 | 67 (35.3%) | 8 (22.2%) |
| $150,000 or more | 0 (0.0%) | 0 (0.0%) |
| Total | 190 (100.0%) | 36 (100.0%) |
Monthly Housing Cost Tiers in Allenport borough
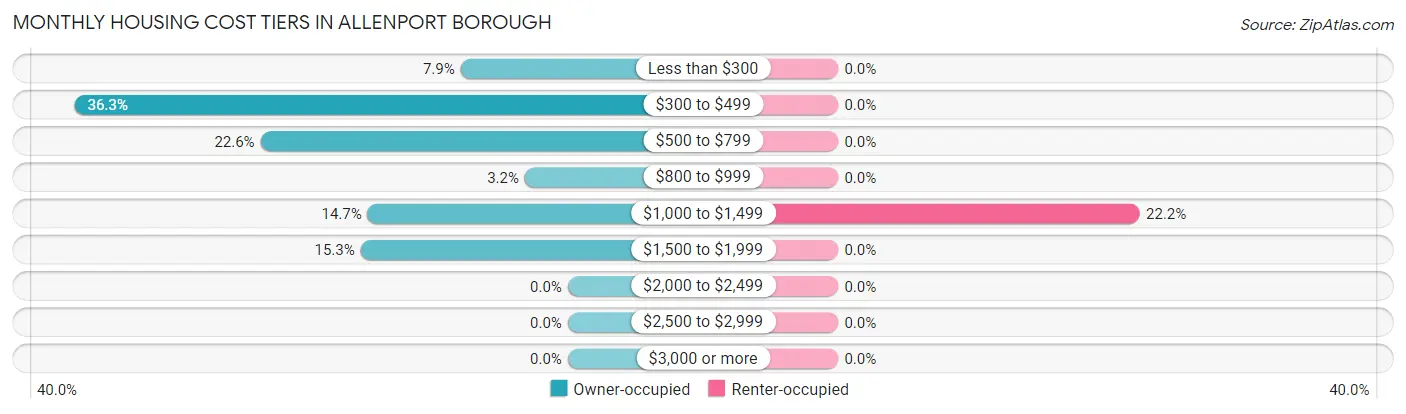
| Monthly Cost | Owner-occupied | Renter-occupied |
| Less than $300 | 15 (7.9%) | 0 (0.0%) |
| $300 to $499 | 69 (36.3%) | 0 (0.0%) |
| $500 to $799 | 43 (22.6%) | 0 (0.0%) |
| $800 to $999 | 6 (3.2%) | 0 (0.0%) |
| $1,000 to $1,499 | 28 (14.7%) | 8 (22.2%) |
| $1,500 to $1,999 | 29 (15.3%) | 0 (0.0%) |
| $2,000 to $2,499 | 0 (0.0%) | 0 (0.0%) |
| $2,500 to $2,999 | 0 (0.0%) | 0 (0.0%) |
| $3,000 or more | 0 (0.0%) | 0 (0.0%) |
| Total | 190 (100.0%) | 36 (100.0%) |
Physical Housing Characteristics in Allenport borough
Housing Structures in Allenport borough
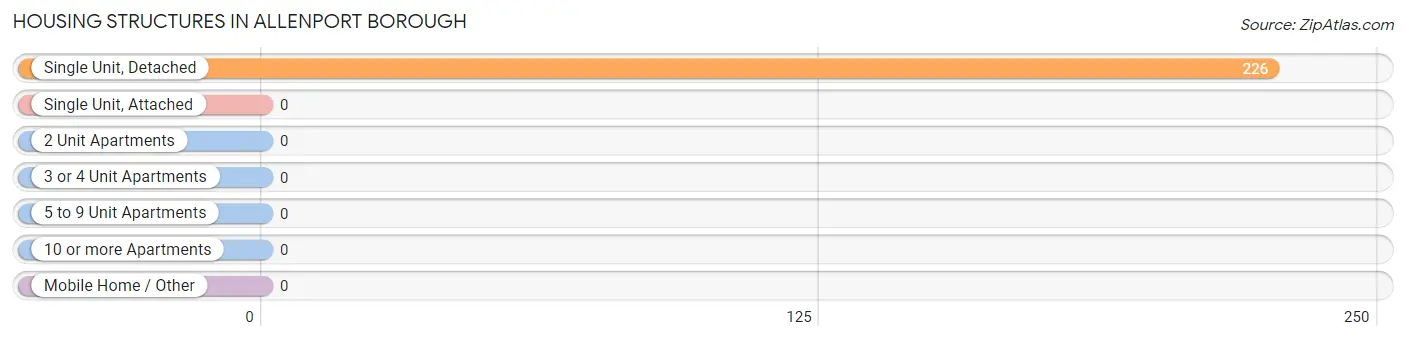
| Structure Type | # Housing Units | % Housing Units |
| Single Unit, Detached | 226 | 100.0% |
| Single Unit, Attached | 0 | 0.0% |
| 2 Unit Apartments | 0 | 0.0% |
| 3 or 4 Unit Apartments | 0 | 0.0% |
| 5 to 9 Unit Apartments | 0 | 0.0% |
| 10 or more Apartments | 0 | 0.0% |
| Mobile Home / Other | 0 | 0.0% |
| Total | 226 | 100.0% |
Housing Structures by Occupancy in Allenport borough
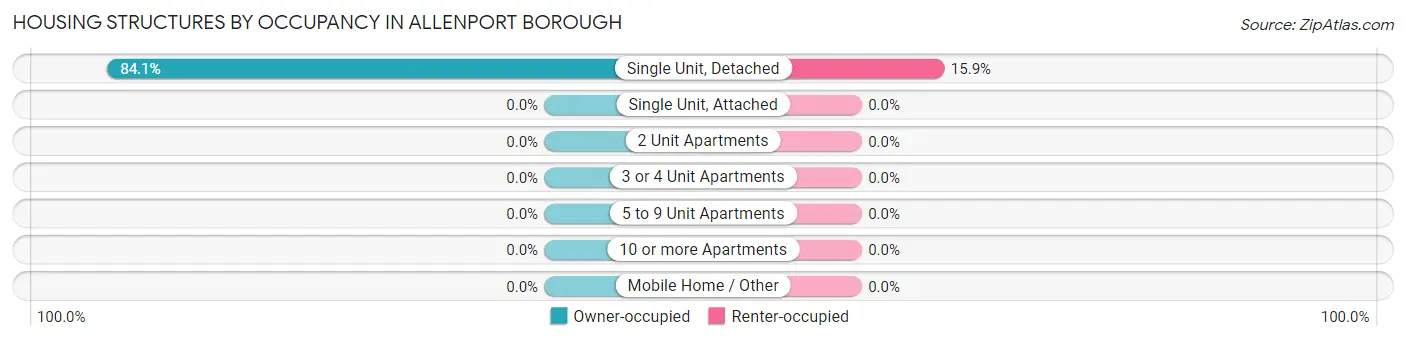
| Structure Type | Owner-occupied | Renter-occupied |
| Single Unit, Detached | 190 (84.1%) | 36 (15.9%) |
| Single Unit, Attached | 0 (0.0%) | 0 (0.0%) |
| 2 Unit Apartments | 0 (0.0%) | 0 (0.0%) |
| 3 or 4 Unit Apartments | 0 (0.0%) | 0 (0.0%) |
| 5 to 9 Unit Apartments | 0 (0.0%) | 0 (0.0%) |
| 10 or more Apartments | 0 (0.0%) | 0 (0.0%) |
| Mobile Home / Other | 0 (0.0%) | 0 (0.0%) |
| Total | 190 (84.1%) | 36 (15.9%) |
Housing Structures by Number of Rooms in Allenport borough
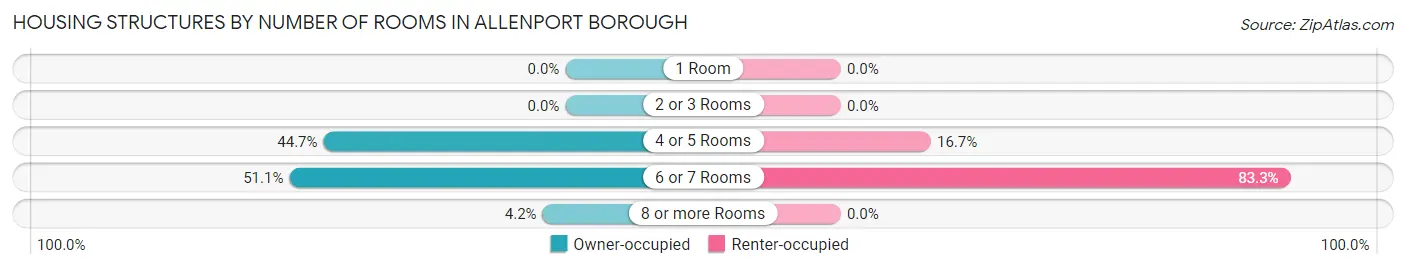
| Number of Rooms | Owner-occupied | Renter-occupied |
| 1 Room | 0 (0.0%) | 0 (0.0%) |
| 2 or 3 Rooms | 0 (0.0%) | 0 (0.0%) |
| 4 or 5 Rooms | 85 (44.7%) | 6 (16.7%) |
| 6 or 7 Rooms | 97 (51.0%) | 30 (83.3%) |
| 8 or more Rooms | 8 (4.2%) | 0 (0.0%) |
| Total | 190 (100.0%) | 36 (100.0%) |
Housing Structure by Heating Type in Allenport borough
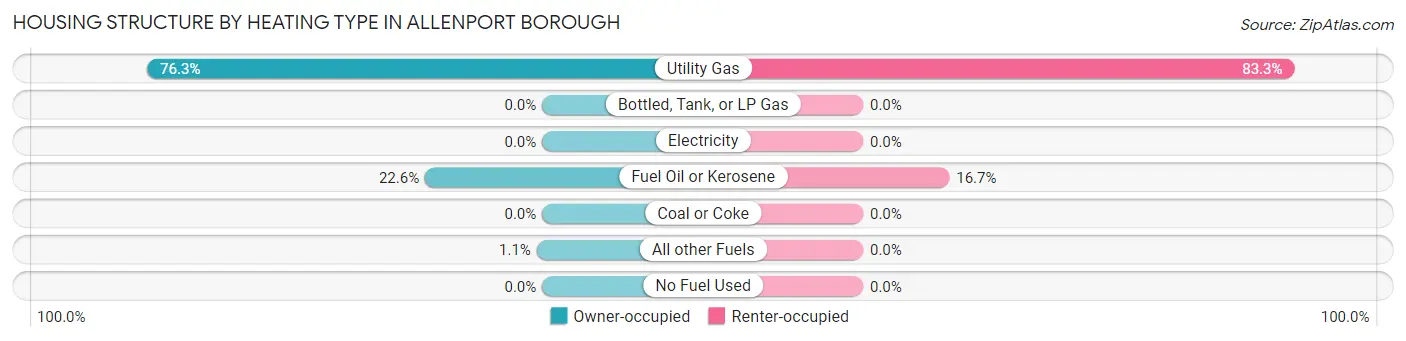
| Heating Type | Owner-occupied | Renter-occupied |
| Utility Gas | 145 (76.3%) | 30 (83.3%) |
| Bottled, Tank, or LP Gas | 0 (0.0%) | 0 (0.0%) |
| Electricity | 0 (0.0%) | 0 (0.0%) |
| Fuel Oil or Kerosene | 43 (22.6%) | 6 (16.7%) |
| Coal or Coke | 0 (0.0%) | 0 (0.0%) |
| All other Fuels | 2 (1.1%) | 0 (0.0%) |
| No Fuel Used | 0 (0.0%) | 0 (0.0%) |
| Total | 190 (100.0%) | 36 (100.0%) |
Household Vehicle Usage in Allenport borough
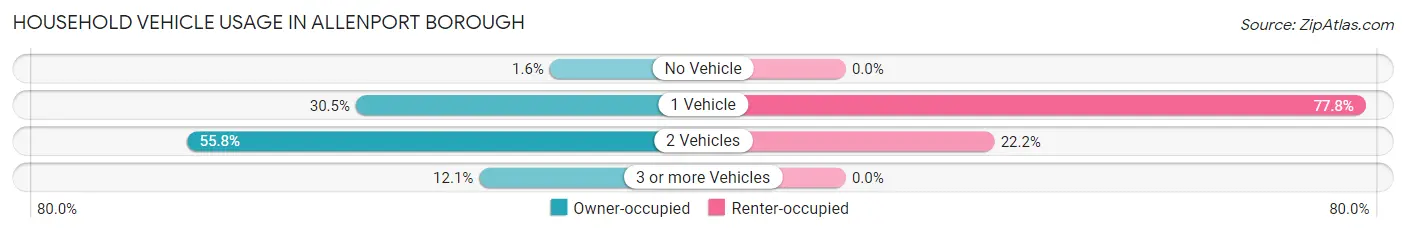
| Vehicles per Household | Owner-occupied | Renter-occupied |
| No Vehicle | 3 (1.6%) | 0 (0.0%) |
| 1 Vehicle | 58 (30.5%) | 28 (77.8%) |
| 2 Vehicles | 106 (55.8%) | 8 (22.2%) |
| 3 or more Vehicles | 23 (12.1%) | 0 (0.0%) |
| Total | 190 (100.0%) | 36 (100.0%) |
Real Estate & Mortgages in Allenport borough
Real Estate and Mortgage Overview in Allenport borough
| Characteristic | Without Mortgage | With Mortgage |
| Housing Units | 109 | 81 |
| Median Property Value | $90,300 | $0 |
| Median Household Income | $57,750 | $0 |
| Monthly Housing Costs | $426 | $0 |
| Real Estate Taxes | $995 | $0 |
Property Value by Mortgage Status in Allenport borough
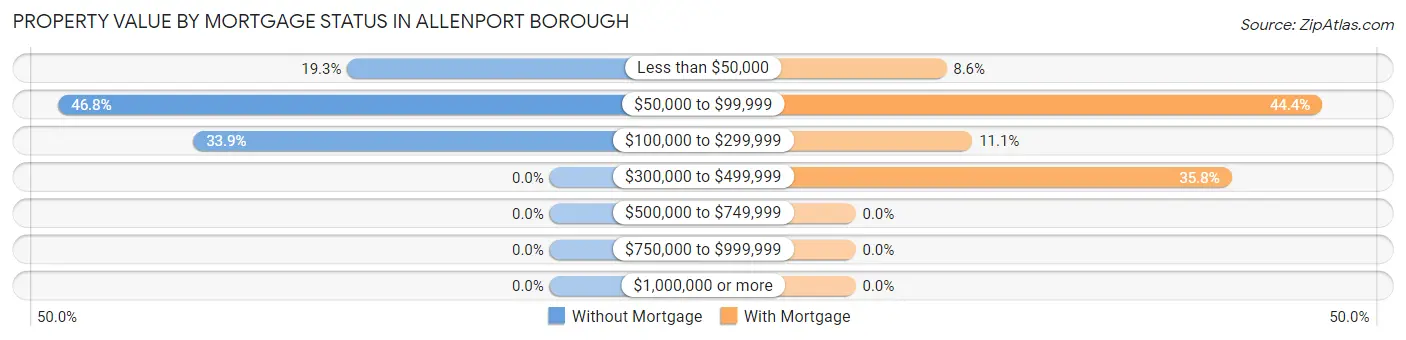
| Property Value | Without Mortgage | With Mortgage |
| Less than $50,000 | 21 (19.3%) | 7 (8.6%) |
| $50,000 to $99,999 | 51 (46.8%) | 36 (44.4%) |
| $100,000 to $299,999 | 37 (33.9%) | 9 (11.1%) |
| $300,000 to $499,999 | 0 (0.0%) | 29 (35.8%) |
| $500,000 to $749,999 | 0 (0.0%) | 0 (0.0%) |
| $750,000 to $999,999 | 0 (0.0%) | 0 (0.0%) |
| $1,000,000 or more | 0 (0.0%) | 0 (0.0%) |
| Total | 109 (100.0%) | 81 (100.0%) |
Household Income by Mortgage Status in Allenport borough
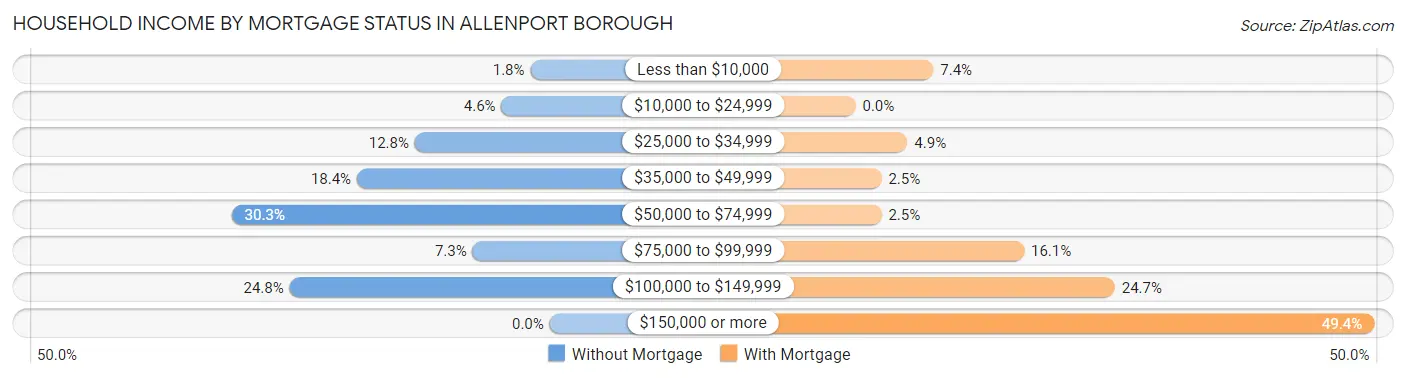
| Household Income | Without Mortgage | With Mortgage |
| Less than $10,000 | 2 (1.8%) | 6 (7.4%) |
| $10,000 to $24,999 | 5 (4.6%) | 0 (0.0%) |
| $25,000 to $34,999 | 14 (12.8%) | 4 (4.9%) |
| $35,000 to $49,999 | 20 (18.3%) | 2 (2.5%) |
| $50,000 to $74,999 | 33 (30.3%) | 2 (2.5%) |
| $75,000 to $99,999 | 8 (7.3%) | 13 (16.1%) |
| $100,000 to $149,999 | 27 (24.8%) | 20 (24.7%) |
| $150,000 or more | 0 (0.0%) | 40 (49.4%) |
| Total | 109 (100.0%) | 81 (100.0%) |
Property Value to Household Income Ratio in Allenport borough
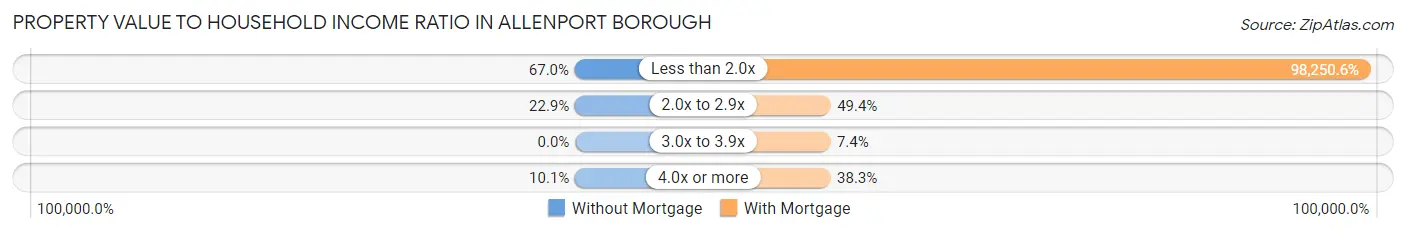
| Value-to-Income Ratio | Without Mortgage | With Mortgage |
| Less than 2.0x | 73 (67.0%) | 79,583 (98,250.6%) |
| 2.0x to 2.9x | 25 (22.9%) | 40 (49.4%) |
| 3.0x to 3.9x | 0 (0.0%) | 6 (7.4%) |
| 4.0x or more | 11 (10.1%) | 31 (38.3%) |
| Total | 109 (100.0%) | 81 (100.0%) |
Real Estate Taxes by Mortgage Status in Allenport borough
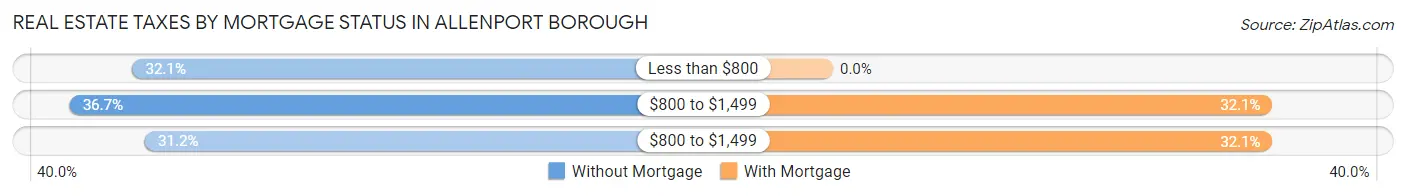
| Property Taxes | Without Mortgage | With Mortgage |
| Less than $800 | 35 (32.1%) | 0 (0.0%) |
| $800 to $1,499 | 40 (36.7%) | 26 (32.1%) |
| $800 to $1,499 | 34 (31.2%) | 26 (32.1%) |
| Total | 109 (100.0%) | 81 (100.0%) |
Health & Disability in Allenport borough
Health Insurance Coverage by Age in Allenport borough
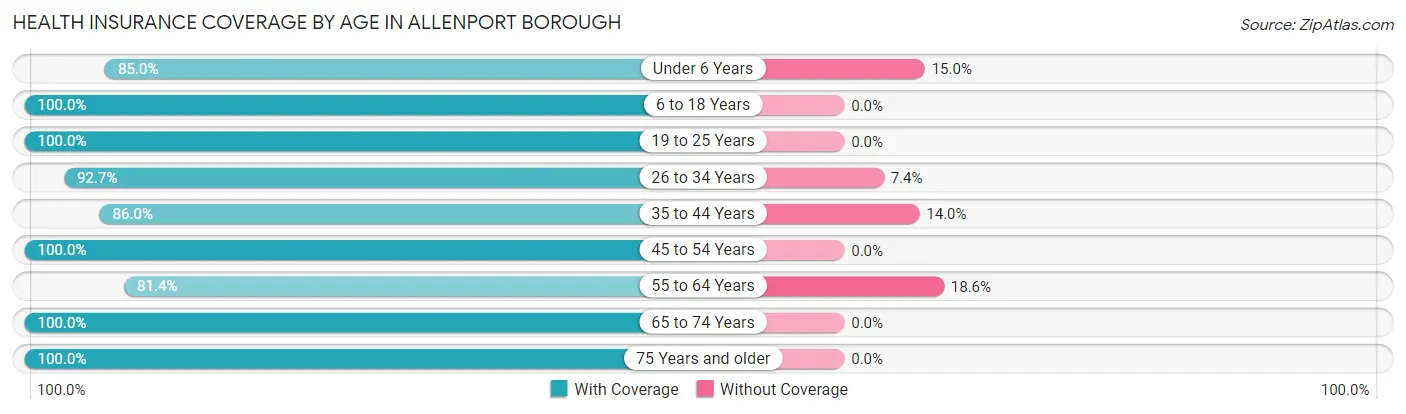
| Age Bracket | With Coverage | Without Coverage |
| Under 6 Years | 17 (85.0%) | 3 (15.0%) |
| 6 to 18 Years | 31 (100.0%) | 0 (0.0%) |
| 19 to 25 Years | 26 (100.0%) | 0 (0.0%) |
| 26 to 34 Years | 63 (92.6%) | 5 (7.3%) |
| 35 to 44 Years | 43 (86.0%) | 7 (14.0%) |
| 45 to 54 Years | 80 (100.0%) | 0 (0.0%) |
| 55 to 64 Years | 57 (81.4%) | 13 (18.6%) |
| 65 to 74 Years | 69 (100.0%) | 0 (0.0%) |
| 75 Years and older | 52 (100.0%) | 0 (0.0%) |
| Total | 438 (94.0%) | 28 (6.0%) |
Health Insurance Coverage by Citizenship Status in Allenport borough

| Citizenship Status | With Coverage | Without Coverage |
| Native Born | 17 (85.0%) | 3 (15.0%) |
| Foreign Born, Citizen | 31 (100.0%) | 0 (0.0%) |
| Foreign Born, not a Citizen | 26 (100.0%) | 0 (0.0%) |
Health Insurance Coverage by Household Income in Allenport borough

| Household Income | With Coverage | Without Coverage |
| Under $25,000 | 37 (100.0%) | 0 (0.0%) |
| $25,000 to $49,999 | 77 (96.3%) | 3 (3.7%) |
| $50,000 to $74,999 | 48 (72.7%) | 18 (27.3%) |
| $75,000 to $99,999 | 92 (100.0%) | 0 (0.0%) |
| $100,000 and over | 184 (96.8%) | 6 (3.2%) |
Public vs Private Health Insurance Coverage by Age in Allenport borough
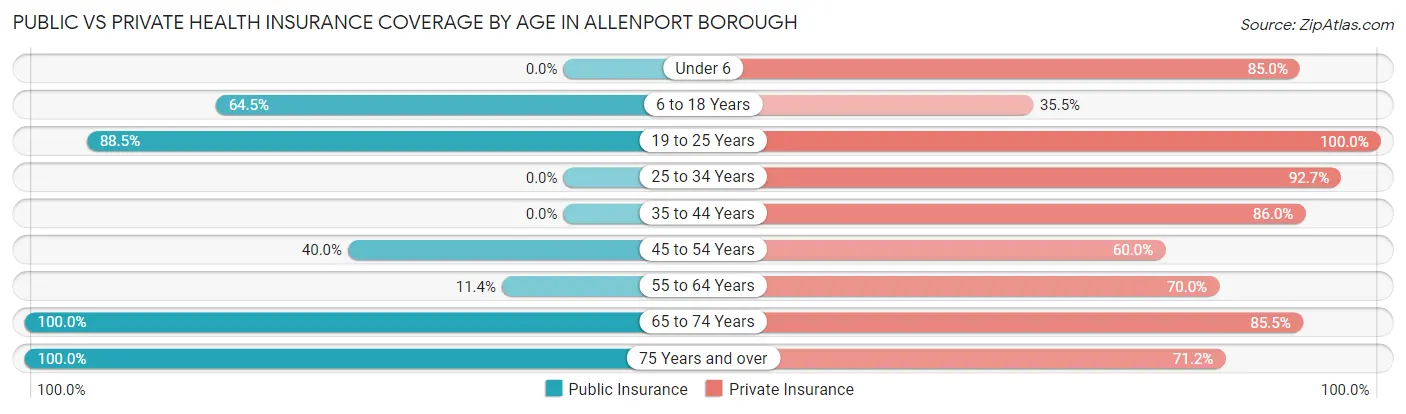
| Age Bracket | Public Insurance | Private Insurance |
| Under 6 | 0 (0.0%) | 17 (85.0%) |
| 6 to 18 Years | 20 (64.5%) | 11 (35.5%) |
| 19 to 25 Years | 23 (88.5%) | 26 (100.0%) |
| 25 to 34 Years | 0 (0.0%) | 63 (92.6%) |
| 35 to 44 Years | 0 (0.0%) | 43 (86.0%) |
| 45 to 54 Years | 32 (40.0%) | 48 (60.0%) |
| 55 to 64 Years | 8 (11.4%) | 49 (70.0%) |
| 65 to 74 Years | 69 (100.0%) | 59 (85.5%) |
| 75 Years and over | 52 (100.0%) | 37 (71.2%) |
| Total | 204 (43.8%) | 353 (75.7%) |
Disability Status by Sex by Age in Allenport borough
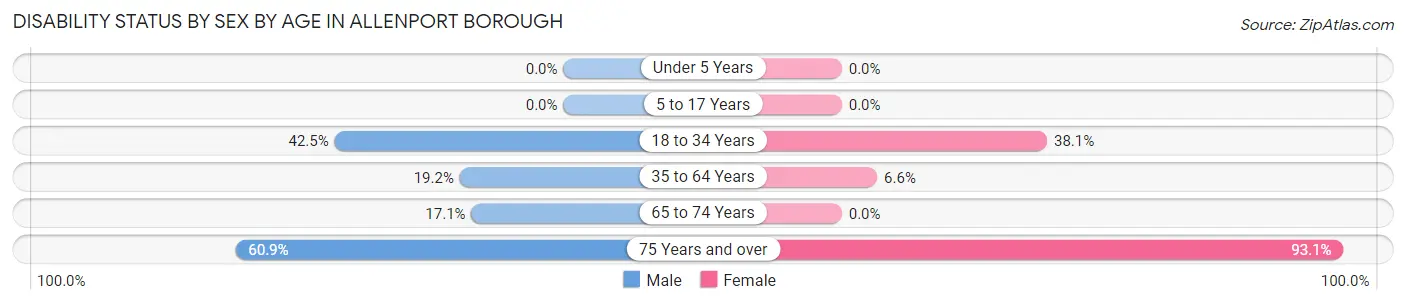
| Age Bracket | Male | Female |
| Under 5 Years | 0 (0.0%) | 0 (0.0%) |
| 5 to 17 Years | 0 (0.0%) | 0 (0.0%) |
| 18 to 34 Years | 31 (42.5%) | 8 (38.1%) |
| 35 to 64 Years | 15 (19.2%) | 8 (6.6%) |
| 65 to 74 Years | 7 (17.1%) | 0 (0.0%) |
| 75 Years and over | 14 (60.9%) | 27 (93.1%) |
Disability Class by Sex by Age in Allenport borough
Disability Class: Hearing Difficulty
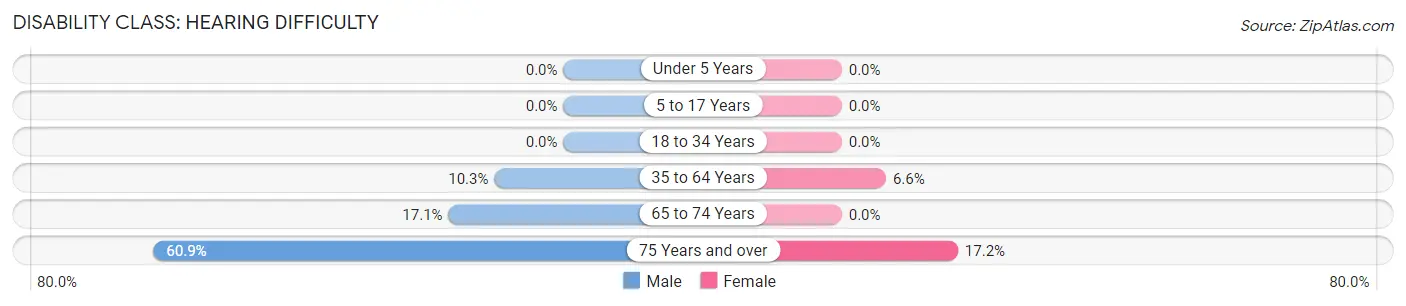
| Age Bracket | Male | Female |
| Under 5 Years | 0 (0.0%) | 0 (0.0%) |
| 5 to 17 Years | 0 (0.0%) | 0 (0.0%) |
| 18 to 34 Years | 0 (0.0%) | 0 (0.0%) |
| 35 to 64 Years | 8 (10.3%) | 8 (6.6%) |
| 65 to 74 Years | 7 (17.1%) | 0 (0.0%) |
| 75 Years and over | 14 (60.9%) | 5 (17.2%) |
Disability Class: Vision Difficulty
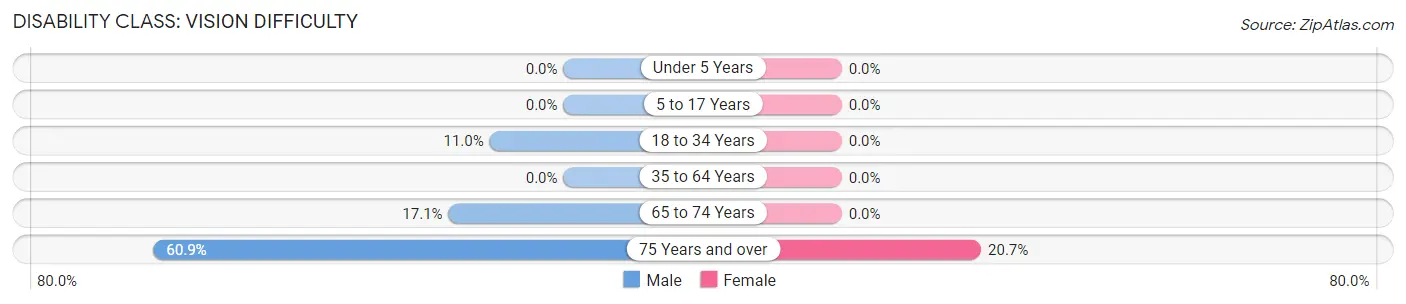
| Age Bracket | Male | Female |
| Under 5 Years | 0 (0.0%) | 0 (0.0%) |
| 5 to 17 Years | 0 (0.0%) | 0 (0.0%) |
| 18 to 34 Years | 8 (11.0%) | 0 (0.0%) |
| 35 to 64 Years | 0 (0.0%) | 0 (0.0%) |
| 65 to 74 Years | 7 (17.1%) | 0 (0.0%) |
| 75 Years and over | 14 (60.9%) | 6 (20.7%) |
Disability Class: Cognitive Difficulty
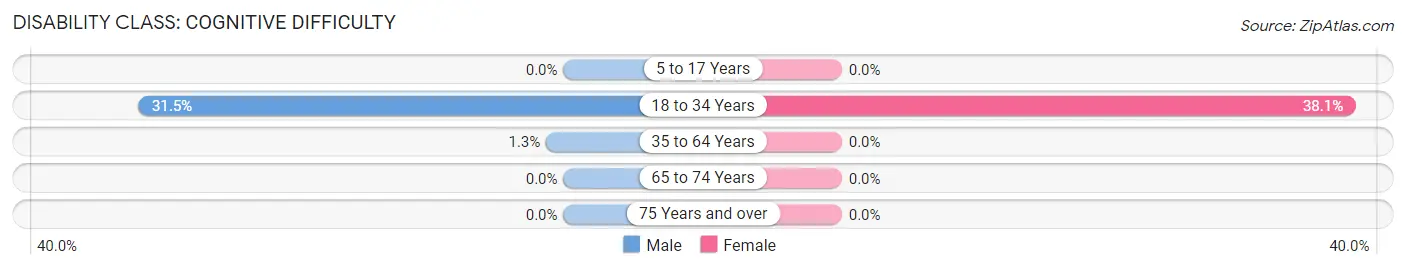
| Age Bracket | Male | Female |
| 5 to 17 Years | 0 (0.0%) | 0 (0.0%) |
| 18 to 34 Years | 23 (31.5%) | 8 (38.1%) |
| 35 to 64 Years | 1 (1.3%) | 0 (0.0%) |
| 65 to 74 Years | 0 (0.0%) | 0 (0.0%) |
| 75 Years and over | 0 (0.0%) | 0 (0.0%) |
Disability Class: Ambulatory Difficulty
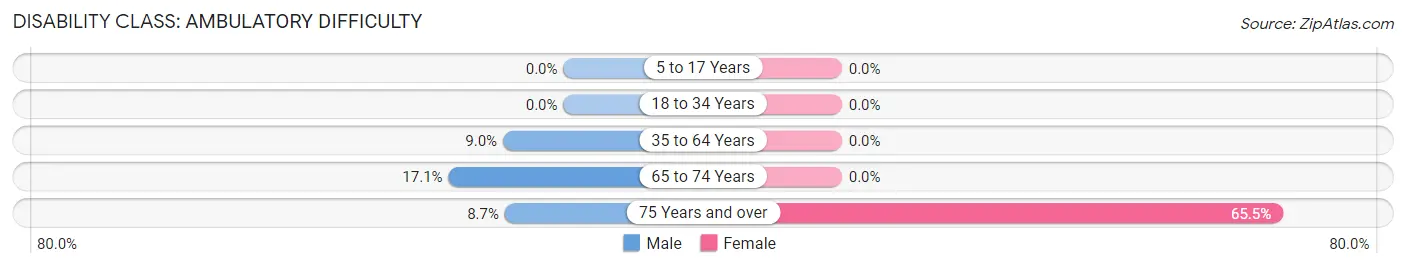
| Age Bracket | Male | Female |
| 5 to 17 Years | 0 (0.0%) | 0 (0.0%) |
| 18 to 34 Years | 0 (0.0%) | 0 (0.0%) |
| 35 to 64 Years | 7 (9.0%) | 0 (0.0%) |
| 65 to 74 Years | 7 (17.1%) | 0 (0.0%) |
| 75 Years and over | 2 (8.7%) | 19 (65.5%) |
Disability Class: Self-Care Difficulty

| Age Bracket | Male | Female |
| 5 to 17 Years | 0 (0.0%) | 0 (0.0%) |
| 18 to 34 Years | 0 (0.0%) | 0 (0.0%) |
| 35 to 64 Years | 1 (1.3%) | 0 (0.0%) |
| 65 to 74 Years | 0 (0.0%) | 0 (0.0%) |
| 75 Years and over | 0 (0.0%) | 0 (0.0%) |
Technology Access in Allenport borough
Computing Device Access in Allenport borough
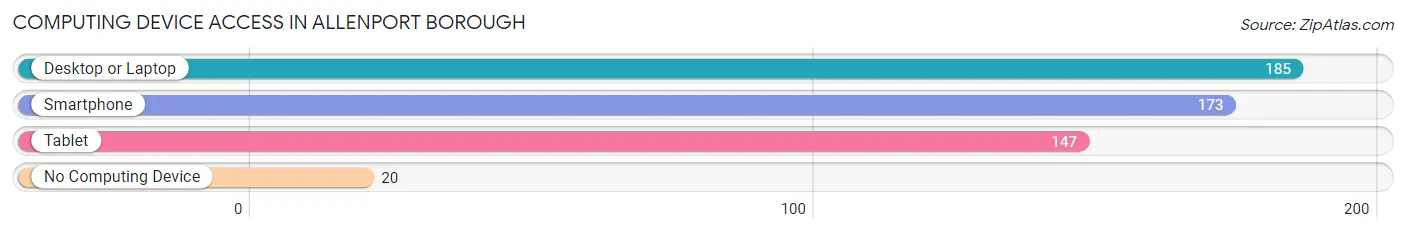
| Device Type | # Households | % Households |
| Desktop or Laptop | 185 | 81.9% |
| Smartphone | 173 | 76.5% |
| Tablet | 147 | 65.0% |
| No Computing Device | 20 | 8.8% |
| Total | 226 | 100.0% |
Internet Access in Allenport borough
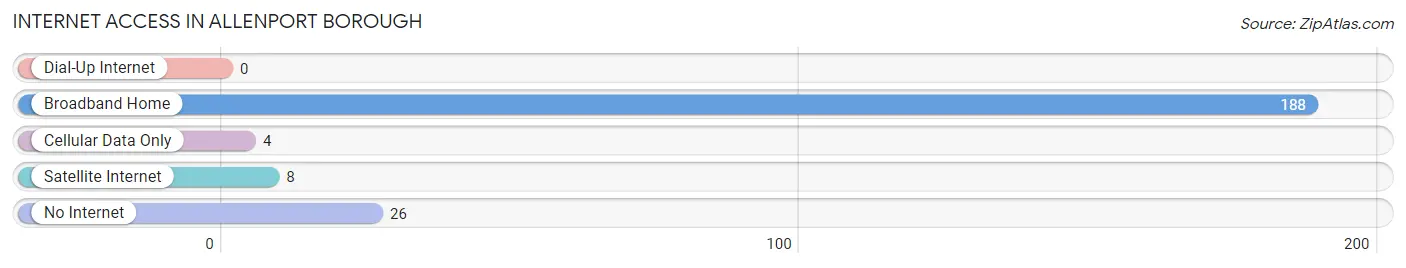
| Internet Type | # Households | % Households |
| Dial-Up Internet | 0 | 0.0% |
| Broadband Home | 188 | 83.2% |
| Cellular Data Only | 4 | 1.8% |
| Satellite Internet | 8 | 3.5% |
| No Internet | 26 | 11.5% |
| Total | 226 | 100.0% |
Allenport borough Summary
Allport Borough is a small borough located in Washington County, Pennsylvania. It is situated in the southwestern corner of the state, just north of the city of Pittsburgh. The borough is bordered by the townships of North Franklin, South Franklin, and East Bethlehem. Allport Borough has a population of approximately 1,000 people and covers an area of 0.6 square miles.
History
Allport Borough was founded in 1876 by a group of settlers from the nearby town of East Bethlehem. The settlers named the borough after the nearby Allport Creek, which was named after a local settler, John Allport. The first post office in the borough was established in 1877.
In the late 19th century, Allport Borough was a thriving industrial center. The borough was home to several coal mines, brickyards, and other industries. The borough also had a thriving agricultural sector, with many farms located in the area.
In the early 20th century, the borough began to decline as the coal industry declined and the population began to move away. By the mid-20th century, the borough had become a quiet, rural community.
Geography
Allport Borough is located in the southwestern corner of Washington County, Pennsylvania. It is situated in the Allegheny Plateau region of the state, just north of the city of Pittsburgh. The borough is bordered by the townships of North Franklin, South Franklin, and East Bethlehem.
The borough is located in a hilly area, with elevations ranging from 1,000 to 1,500 feet above sea level. The borough is located in a humid continental climate zone, with cold winters and hot, humid summers.
Economy
Allport Borough has a small, but diverse economy. The borough is home to several small businesses, including a grocery store, a hardware store, and a few restaurants. The borough also has a few small manufacturing companies, including a furniture manufacturer and a metal fabrication company.
The borough also has a thriving agricultural sector, with several farms located in the area. The farms produce a variety of crops, including corn, soybeans, and hay.
Demographics
As of the 2010 census, Allport Borough had a population of 1,000 people. The racial makeup of the borough was 97.2% White, 0.7% African American, 0.3% Native American, 0.2% Asian, and 1.6% from other races.
The median household income in Allport Borough was $37,500, and the median family income was $45,000. The per capita income in the borough was $18,000. Approximately 10.2% of the population was below the poverty line.
Common Questions
What is Per Capita Income in Allenport borough?
Per Capita income in Allenport borough is $32,695.
What is the Median Family Income in Allenport borough?
Median Family Income in Allenport borough is $76,150.
What is the Median Household income in Allenport borough?
Median Household Income in Allenport borough is $68,750.
What is Income or Wage Gap in Allenport borough?
Income or Wage Gap in Allenport borough is 47.4%.
Women in Allenport borough earn 52.6 cents for every dollar earned by a man.
What is Inequality or Gini Index in Allenport borough?
Inequality or Gini Index in Allenport borough is 0.33.
What is the Total Population of Allenport borough?
Total Population of Allenport borough is 466.
What is the Total Male Population of Allenport borough?
Total Male Population of Allenport borough is 243.
What is the Total Female Population of Allenport borough?
Total Female Population of Allenport borough is 223.
What is the Ratio of Males per 100 Females in Allenport borough?
There are 108.97 Males per 100 Females in Allenport borough.
What is the Ratio of Females per 100 Males in Allenport borough?
There are 91.77 Females per 100 Males in Allenport borough.
What is the Median Population Age in Allenport borough?
Median Population Age in Allenport borough is 50.1 Years.
What is the Average Family Size in Allenport borough
Average Family Size in Allenport borough is 2.8 People.
What is the Average Household Size in Allenport borough
Average Household Size in Allenport borough is 2.1 People.
How Large is the Labor Force in Allenport borough?
There are 205 People in the Labor Forcein in Allenport borough.
What is the Percentage of People in the Labor Force in Allenport borough?
48.3% of People are in the Labor Force in Allenport borough.
What is the Unemployment Rate in Allenport borough?
Unemployment Rate in Allenport borough is 4.4%.