St Clairsville, OH Map & Demographics
St Clairsville Map
St Clairsville Overview
$37,739
PER CAPITA INCOME
$105,102
AVG FAMILY INCOME
$71,732
AVG HOUSEHOLD INCOME
35.0%
WAGE / INCOME GAP [ % ]
65.0¢/ $1
WAGE / INCOME GAP [ $ ]
0.38
INEQUALITY / GINI INDEX
5,085
TOTAL POPULATION
2,635
MALE POPULATION
2,450
FEMALE POPULATION
107.55
MALES / 100 FEMALES
92.98
FEMALES / 100 MALES
48.5
MEDIAN AGE
3.1
AVG FAMILY SIZE
2.4
AVG HOUSEHOLD SIZE
2,489
LABOR FORCE [ PEOPLE ]
58.4%
PERCENT IN LABOR FORCE
2.9%
UNEMPLOYMENT RATE
Income in St Clairsville
Income Overview in St Clairsville
Per Capita Income in St Clairsville is $37,739, while median incomes of families and households are $105,102 and $71,732 respectively.
| Characteristic | Number | Measure |
| Per Capita Income | 5,085 | $37,739 |
| Median Family Income | 1,242 | $105,102 |
| Mean Family Income | 1,242 | $109,507 |
| Median Household Income | 2,067 | $71,732 |
| Mean Household Income | 2,067 | $86,782 |
| Income Deficit | 1,242 | $0 |
| Wage / Income Gap (%) | 5,085 | 34.97% |
| Wage / Income Gap ($) | 5,085 | 65.03¢ per $1 |
| Gini / Inequality Index | 5,085 | 0.38 |
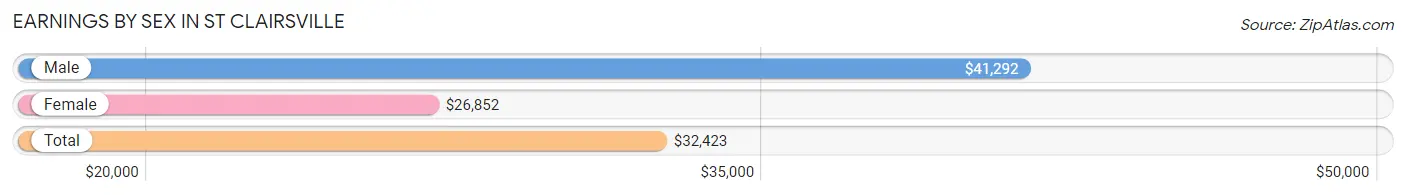
Earnings by Sex in St Clairsville
Average Earnings in St Clairsville are $32,423, $41,292 for men and $26,852 for women, a difference of 35.0%.
| Sex | Number | Average Earnings |
| Male | 1,465 (57.1%) | $41,292 |
| Female | 1,101 (42.9%) | $26,852 |
| Total | 2,566 (100.0%) | $32,423 |
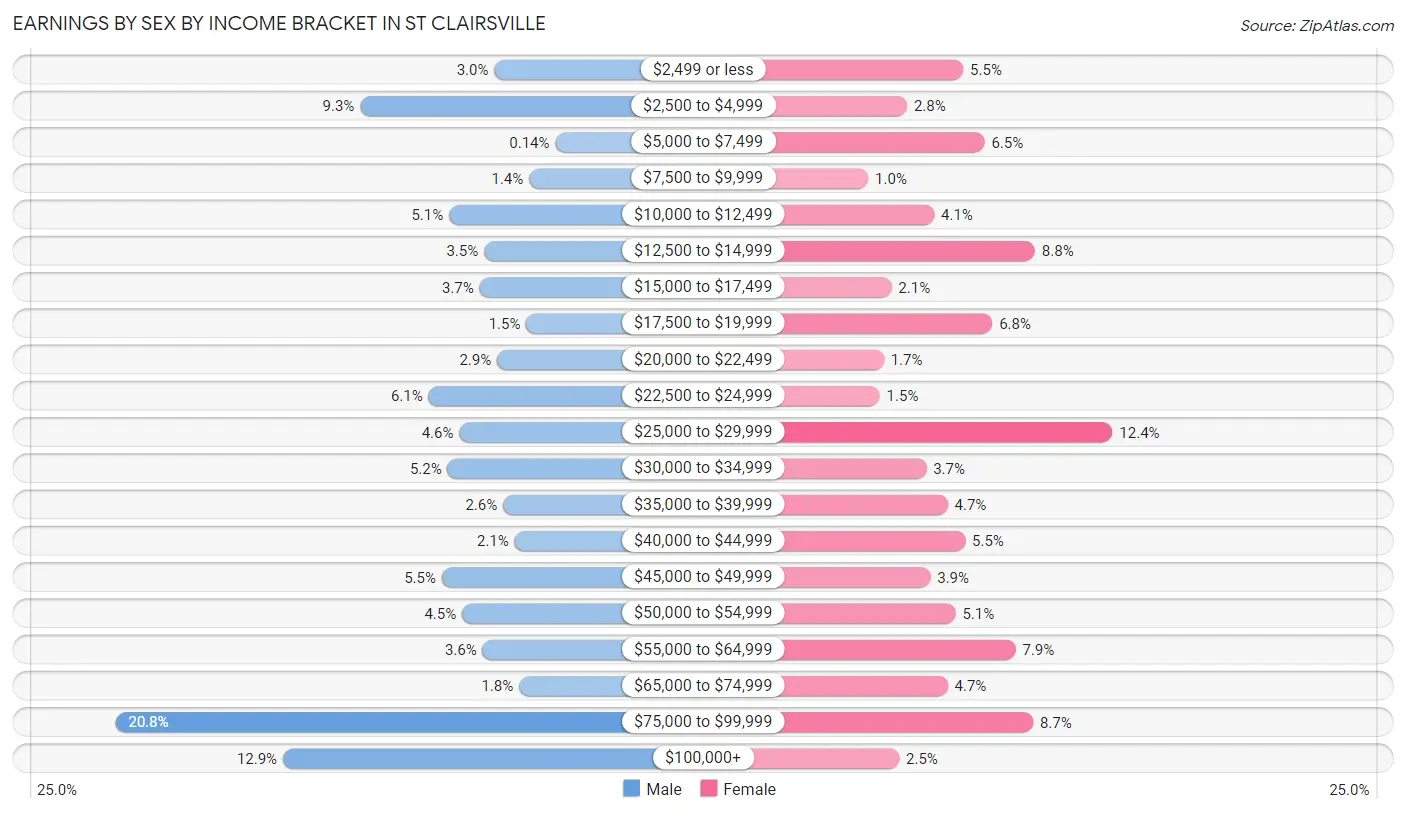
Earnings by Sex by Income Bracket in St Clairsville
The most common earnings brackets in St Clairsville are $75,000 to $99,999 for men (304 | 20.7%) and $25,000 to $29,999 for women (137 | 12.4%).
| Income | Male | Female |
| $2,499 or less | 44 (3.0%) | 60 (5.4%) |
| $2,500 to $4,999 | 136 (9.3%) | 31 (2.8%) |
| $5,000 to $7,499 | 2 (0.1%) | 71 (6.5%) |
| $7,500 to $9,999 | 20 (1.4%) | 11 (1.0%) |
| $10,000 to $12,499 | 75 (5.1%) | 45 (4.1%) |
| $12,500 to $14,999 | 51 (3.5%) | 97 (8.8%) |
| $15,000 to $17,499 | 54 (3.7%) | 23 (2.1%) |
| $17,500 to $19,999 | 22 (1.5%) | 75 (6.8%) |
| $20,000 to $22,499 | 42 (2.9%) | 19 (1.7%) |
| $22,500 to $24,999 | 89 (6.1%) | 17 (1.5%) |
| $25,000 to $29,999 | 68 (4.6%) | 137 (12.4%) |
| $30,000 to $34,999 | 76 (5.2%) | 41 (3.7%) |
| $35,000 to $39,999 | 38 (2.6%) | 52 (4.7%) |
| $40,000 to $44,999 | 30 (2.1%) | 61 (5.5%) |
| $45,000 to $49,999 | 80 (5.5%) | 43 (3.9%) |
| $50,000 to $54,999 | 66 (4.5%) | 56 (5.1%) |
| $55,000 to $64,999 | 52 (3.5%) | 87 (7.9%) |
| $65,000 to $74,999 | 27 (1.8%) | 52 (4.7%) |
| $75,000 to $99,999 | 304 (20.7%) | 96 (8.7%) |
| $100,000+ | 189 (12.9%) | 27 (2.5%) |
| Total | 1,465 (100.0%) | 1,101 (100.0%) |
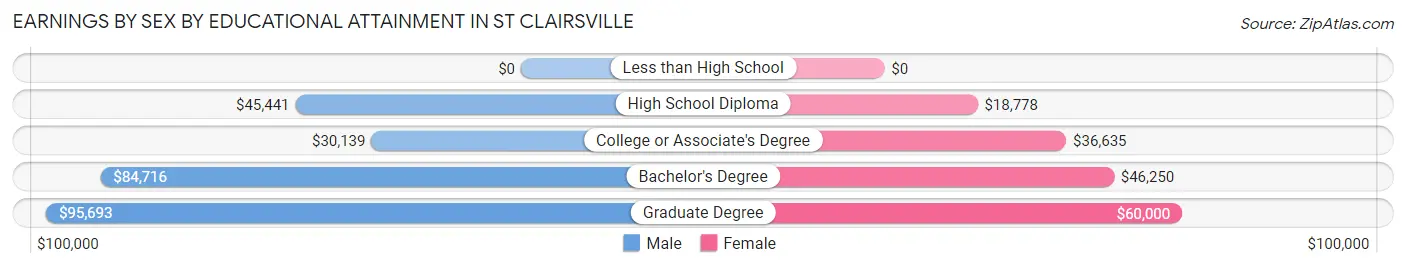
Earnings by Sex by Educational Attainment in St Clairsville
Average earnings in St Clairsville are $51,635 for men and $33,846 for women, a difference of 34.4%. Men with an educational attainment of graduate degree enjoy the highest average annual earnings of $95,693, while those with college or associate's degree education earn the least with $30,139. Women with an educational attainment of graduate degree earn the most with the average annual earnings of $60,000, while those with high school diploma education have the smallest earnings of $18,778.
| Educational Attainment | Male Income | Female Income |
| Less than High School | - | - |
| High School Diploma | $45,441 | $18,778 |
| College or Associate's Degree | $30,139 | $36,635 |
| Bachelor's Degree | $84,716 | $46,250 |
| Graduate Degree | $95,693 | $60,000 |
| Total | $51,635 | $33,846 |
Family Income in St Clairsville
Family Income Brackets in St Clairsville
According to the St Clairsville family income data, there are 424 families falling into the $100,000 to $149,999 income range, which is the most common income bracket and makes up 34.1% of all families.
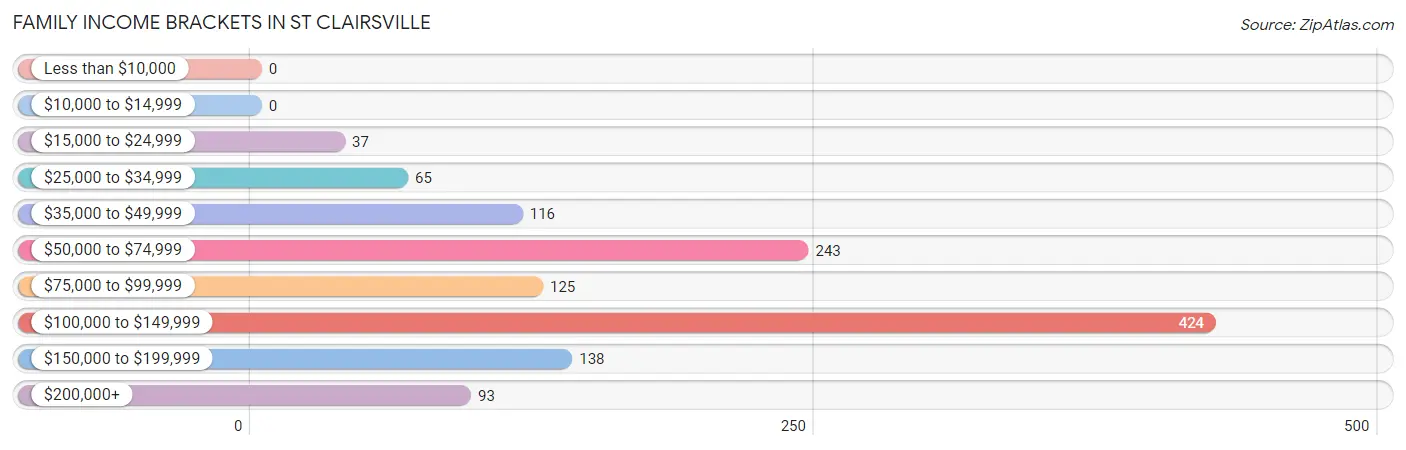
| Income Bracket | # Families | % Families |
| Less than $10,000 | 0 | 0.0% |
| $10,000 to $14,999 | 0 | 0.0% |
| $15,000 to $24,999 | 37 | 3.0% |
| $25,000 to $34,999 | 65 | 5.2% |
| $35,000 to $49,999 | 116 | 9.3% |
| $50,000 to $74,999 | 243 | 19.6% |
| $75,000 to $99,999 | 125 | 10.1% |
| $100,000 to $149,999 | 424 | 34.1% |
| $150,000 to $199,999 | 138 | 11.1% |
| $200,000+ | 93 | 7.5% |
Family Income by Famaliy Size in St Clairsville
5-person families (91 | 7.3%) account for the highest median family income in St Clairsville with $108,775 per family, while 2-person families (726 | 58.5%) have the highest median income of $50,000 per family member.
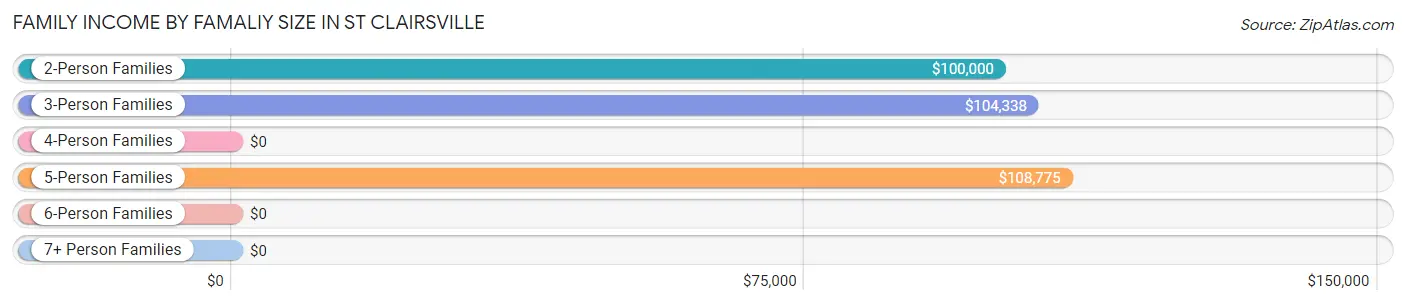
| Income Bracket | # Families | Median Income |
| 2-Person Families | 726 (58.5%) | $100,000 |
| 3-Person Families | 121 (9.7%) | $104,338 |
| 4-Person Families | 272 (21.9%) | $0 |
| 5-Person Families | 91 (7.3%) | $108,775 |
| 6-Person Families | 32 (2.6%) | $0 |
| 7+ Person Families | 0 (0.0%) | $0 |
| Total | 1,242 (100.0%) | $105,102 |
Family Income by Number of Earners in St Clairsville
The median family income in St Clairsville is $105,102, with families comprising 3+ earners (145) having the highest median family income of $139,219, while families with 1 earner (346) have the lowest median family income of $83,864, accounting for 11.7% and 27.9% of families, respectively.
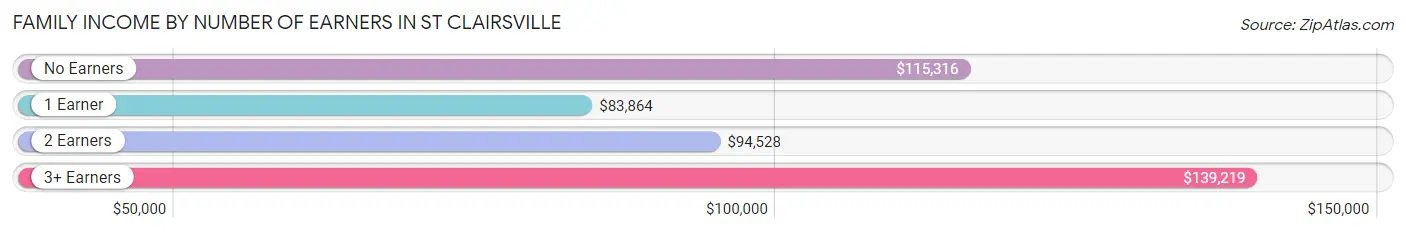
| Number of Earners | # Families | Median Income |
| No Earners | 268 (21.6%) | $115,316 |
| 1 Earner | 346 (27.9%) | $83,864 |
| 2 Earners | 483 (38.9%) | $94,528 |
| 3+ Earners | 145 (11.7%) | $139,219 |
| Total | 1,242 (100.0%) | $105,102 |
Household Income in St Clairsville
Household Income Brackets in St Clairsville
With 521 households falling in the category, the $100,000 to $149,999 income range is the most frequent in St Clairsville, accounting for 25.2% of all households. In contrast, only 27 households (1.3%) fall into the less than $10,000 income bracket, making it the least populous group.
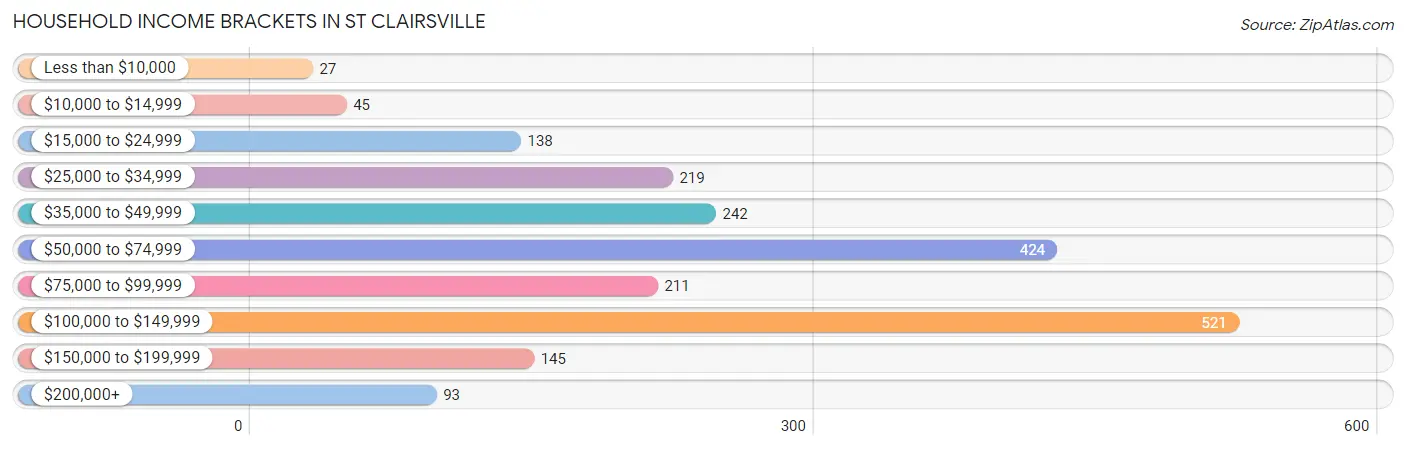
| Income Bracket | # Households | % Households |
| Less than $10,000 | 27 | 1.3% |
| $10,000 to $14,999 | 45 | 2.2% |
| $15,000 to $24,999 | 138 | 6.7% |
| $25,000 to $34,999 | 219 | 10.6% |
| $35,000 to $49,999 | 242 | 11.7% |
| $50,000 to $74,999 | 424 | 20.5% |
| $75,000 to $99,999 | 211 | 10.2% |
| $100,000 to $149,999 | 521 | 25.2% |
| $150,000 to $199,999 | 145 | 7.0% |
| $200,000+ | 93 | 4.5% |
Household Income by Householder Age in St Clairsville
The median household income in St Clairsville is $71,732, with the highest median household income of $83,352 found in the 25 to 44 years age bracket for the primary householder. A total of 505 households (24.4%) fall into this category. Meanwhile, the 65+ years age bracket for the primary householder has the lowest median household income of $51,652, with 775 households (37.5%) in this group.
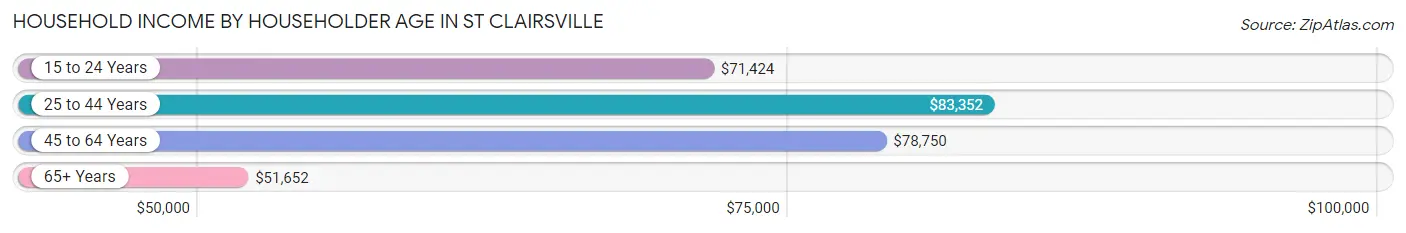
| Income Bracket | # Households | Median Income |
| 15 to 24 Years | 79 (3.8%) | $71,424 |
| 25 to 44 Years | 505 (24.4%) | $83,352 |
| 45 to 64 Years | 708 (34.3%) | $78,750 |
| 65+ Years | 775 (37.5%) | $51,652 |
| Total | 2,067 (100.0%) | $71,732 |
Poverty in St Clairsville
Income Below Poverty by Sex and Age in St Clairsville
With 5.7% poverty level for males and 6.9% for females among the residents of St Clairsville, 5 year old males and 12 to 14 year old females are the most vulnerable to poverty, with 7 males (100.0%) and 26 females (31.7%) in their respective age groups living below the poverty level.
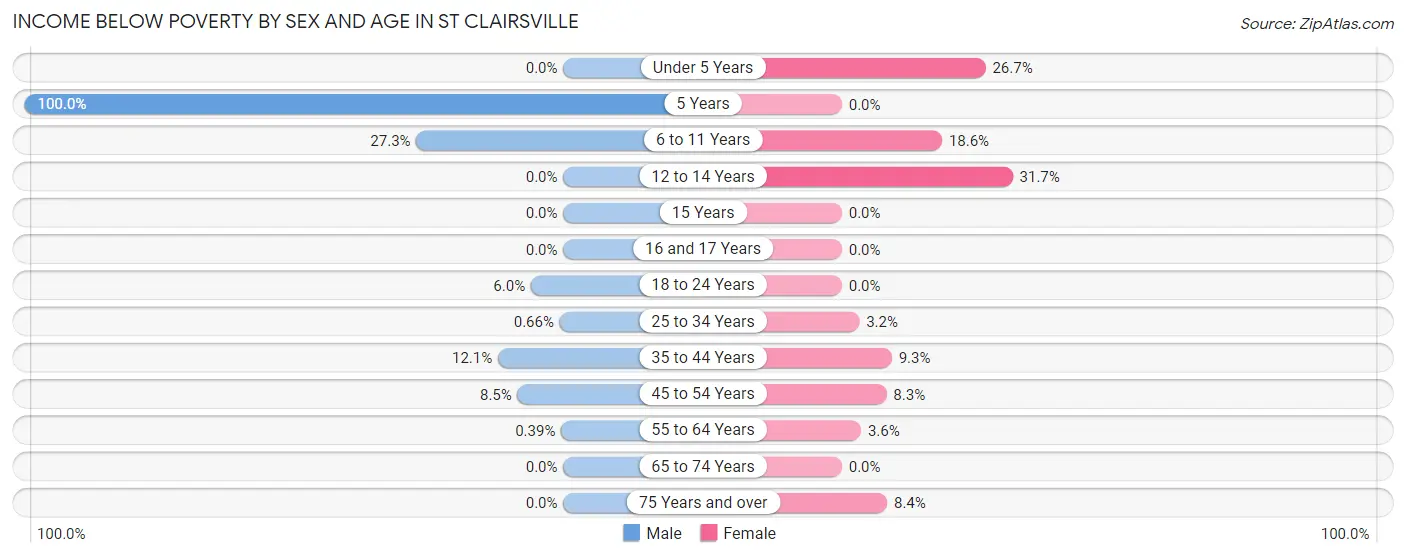
| Age Bracket | Male | Female |
| Under 5 Years | 0 (0.0%) | 8 (26.7%) |
| 5 Years | 7 (100.0%) | 0 (0.0%) |
| 6 to 11 Years | 63 (27.3%) | 29 (18.6%) |
| 12 to 14 Years | 0 (0.0%) | 26 (31.7%) |
| 15 Years | 0 (0.0%) | 0 (0.0%) |
| 16 and 17 Years | 0 (0.0%) | 0 (0.0%) |
| 18 to 24 Years | 20 (6.0%) | 0 (0.0%) |
| 25 to 34 Years | 2 (0.7%) | 7 (3.2%) |
| 35 to 44 Years | 33 (12.1%) | 25 (9.3%) |
| 45 to 54 Years | 22 (8.5%) | 13 (8.3%) |
| 55 to 64 Years | 1 (0.4%) | 16 (3.6%) |
| 65 to 74 Years | 0 (0.0%) | 0 (0.0%) |
| 75 Years and over | 0 (0.0%) | 32 (8.4%) |
| Total | 148 (5.7%) | 156 (6.9%) |
Income Above Poverty by Sex and Age in St Clairsville
According to the poverty statistics in St Clairsville, males aged under 5 years and females aged 15 years are the age groups that are most secure financially, with 100.0% of males and 100.0% of females in these age groups living above the poverty line.
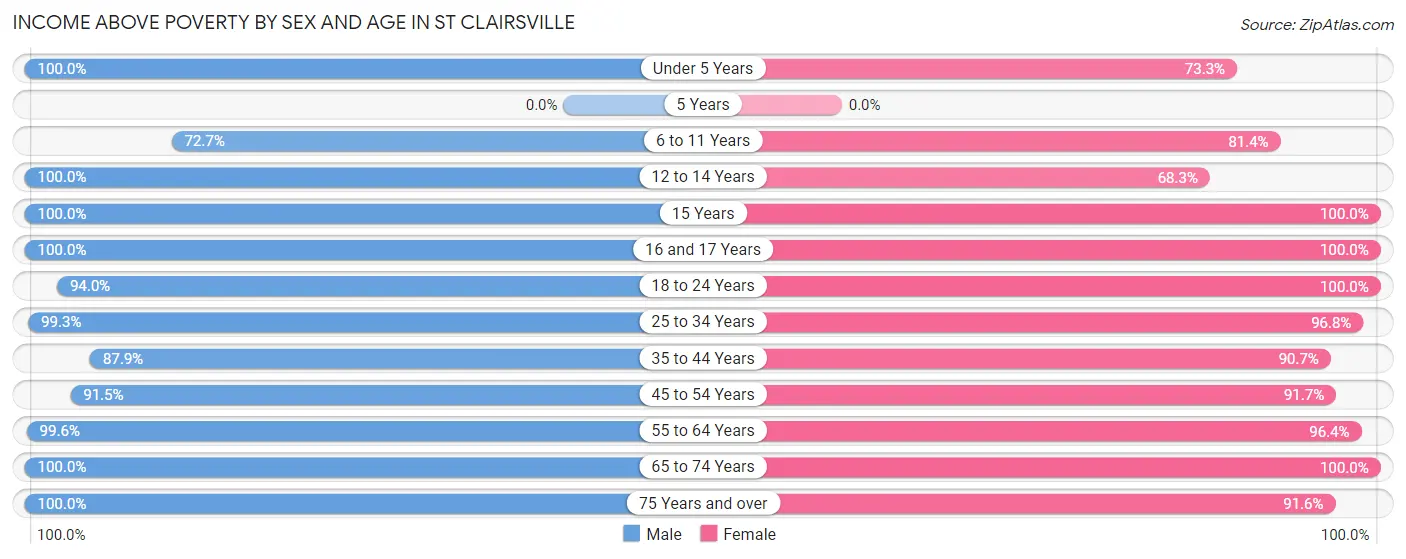
| Age Bracket | Male | Female |
| Under 5 Years | 190 (100.0%) | 22 (73.3%) |
| 5 Years | 0 (0.0%) | 0 (0.0%) |
| 6 to 11 Years | 168 (72.7%) | 127 (81.4%) |
| 12 to 14 Years | 82 (100.0%) | 56 (68.3%) |
| 15 Years | 35 (100.0%) | 10 (100.0%) |
| 16 and 17 Years | 63 (100.0%) | 25 (100.0%) |
| 18 to 24 Years | 313 (94.0%) | 141 (100.0%) |
| 25 to 34 Years | 299 (99.3%) | 210 (96.8%) |
| 35 to 44 Years | 239 (87.9%) | 245 (90.7%) |
| 45 to 54 Years | 237 (91.5%) | 144 (91.7%) |
| 55 to 64 Years | 258 (99.6%) | 434 (96.4%) |
| 65 to 74 Years | 373 (100.0%) | 344 (100.0%) |
| 75 Years and over | 196 (100.0%) | 349 (91.6%) |
| Total | 2,453 (94.3%) | 2,107 (93.1%) |
Income Below Poverty Among Married-Couple Families in St Clairsville
The poverty statistics for married-couple families in St Clairsville show that 2.9% or 31 of the total 1,066 families live below the poverty line. Families with 1 or 2 children have the highest poverty rate of 13.2%, comprising of 25 families. On the other hand, families with no children have the lowest poverty rate of 0.0%, which includes 0 families.
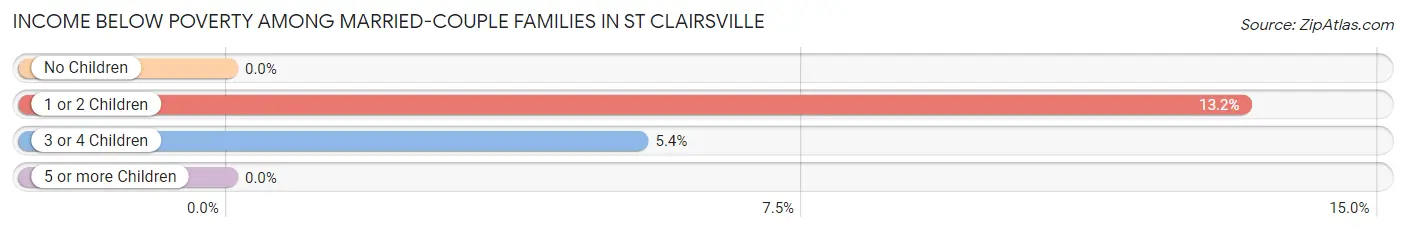
| Children | Above Poverty | Below Poverty |
| No Children | 765 (100.0%) | 0 (0.0%) |
| 1 or 2 Children | 164 (86.8%) | 25 (13.2%) |
| 3 or 4 Children | 106 (94.6%) | 6 (5.4%) |
| 5 or more Children | 0 (0.0%) | 0 (0.0%) |
| Total | 1,035 (97.1%) | 31 (2.9%) |
Income Below Poverty Among Single-Parent Households in St Clairsville
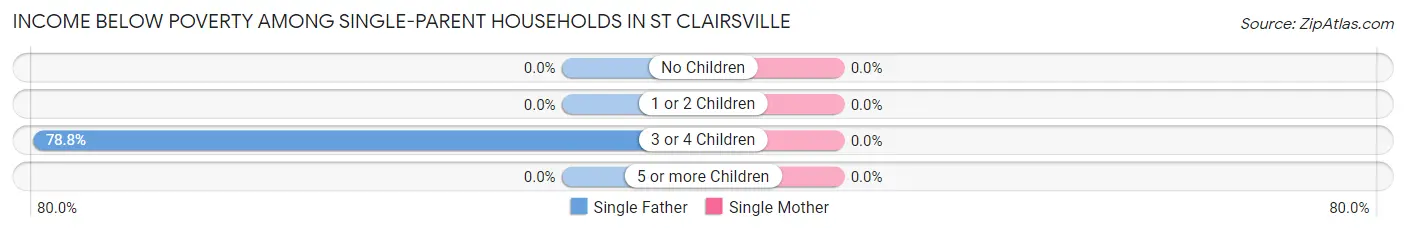
| Children | Single Father | Single Mother |
| No Children | 0 (0.0%) | 0 (0.0%) |
| 1 or 2 Children | 0 (0.0%) | 0 (0.0%) |
| 3 or 4 Children | 26 (78.8%) | 0 (0.0%) |
| 5 or more Children | 0 (0.0%) | 0 (0.0%) |
| Total | 26 (32.5%) | 0 (0.0%) |
Income Below Poverty Among Married-Couple vs Single-Parent Households in St Clairsville
The poverty data for St Clairsville shows that 31 of the married-couple family households (2.9%) and 26 of the single-parent households (14.8%) are living below the poverty level. Within the married-couple family households, those with 1 or 2 children have the highest poverty rate, with 25 households (13.2%) falling below the poverty line. Among the single-parent households, those with 3 or 4 children have the highest poverty rate, with 26 household (78.8%) living below poverty.
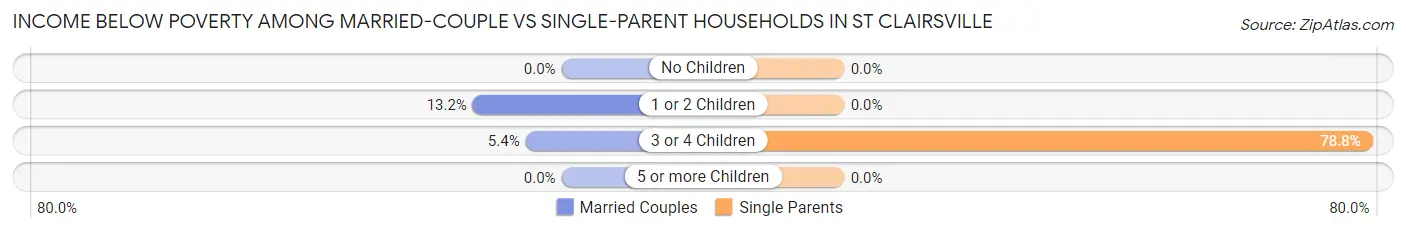
| Children | Married-Couple Families | Single-Parent Households |
| No Children | 0 (0.0%) | 0 (0.0%) |
| 1 or 2 Children | 25 (13.2%) | 0 (0.0%) |
| 3 or 4 Children | 6 (5.4%) | 26 (78.8%) |
| 5 or more Children | 0 (0.0%) | 0 (0.0%) |
| Total | 31 (2.9%) | 26 (14.8%) |
Race in St Clairsville
The most populous races in St Clairsville are White / Caucasian (4,658 | 91.6%), Two or more Races (269 | 5.3%), and Hispanic or Latino (174 | 3.4%).
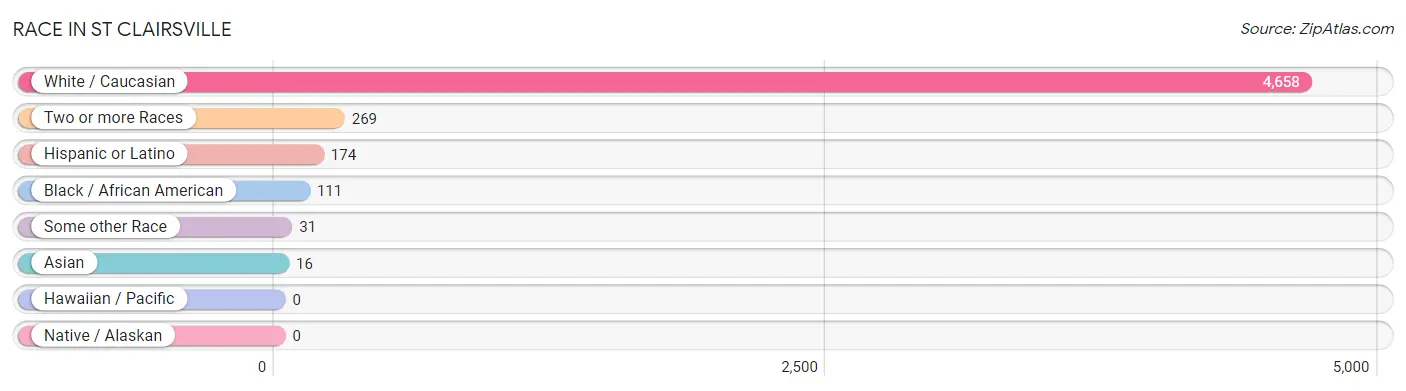
| Race | # Population | % Population |
| Asian | 16 | 0.3% |
| Black / African American | 111 | 2.2% |
| Hawaiian / Pacific | 0 | 0.0% |
| Hispanic or Latino | 174 | 3.4% |
| Native / Alaskan | 0 | 0.0% |
| White / Caucasian | 4,658 | 91.6% |
| Two or more Races | 269 | 5.3% |
| Some other Race | 31 | 0.6% |
| Total | 5,085 | 100.0% |
Ancestry in St Clairsville
The most populous ancestries reported in St Clairsville are German (907 | 17.8%), English (784 | 15.4%), Irish (564 | 11.1%), Italian (403 | 7.9%), and European (393 | 7.7%), together accounting for 60.0% of all St Clairsville residents.
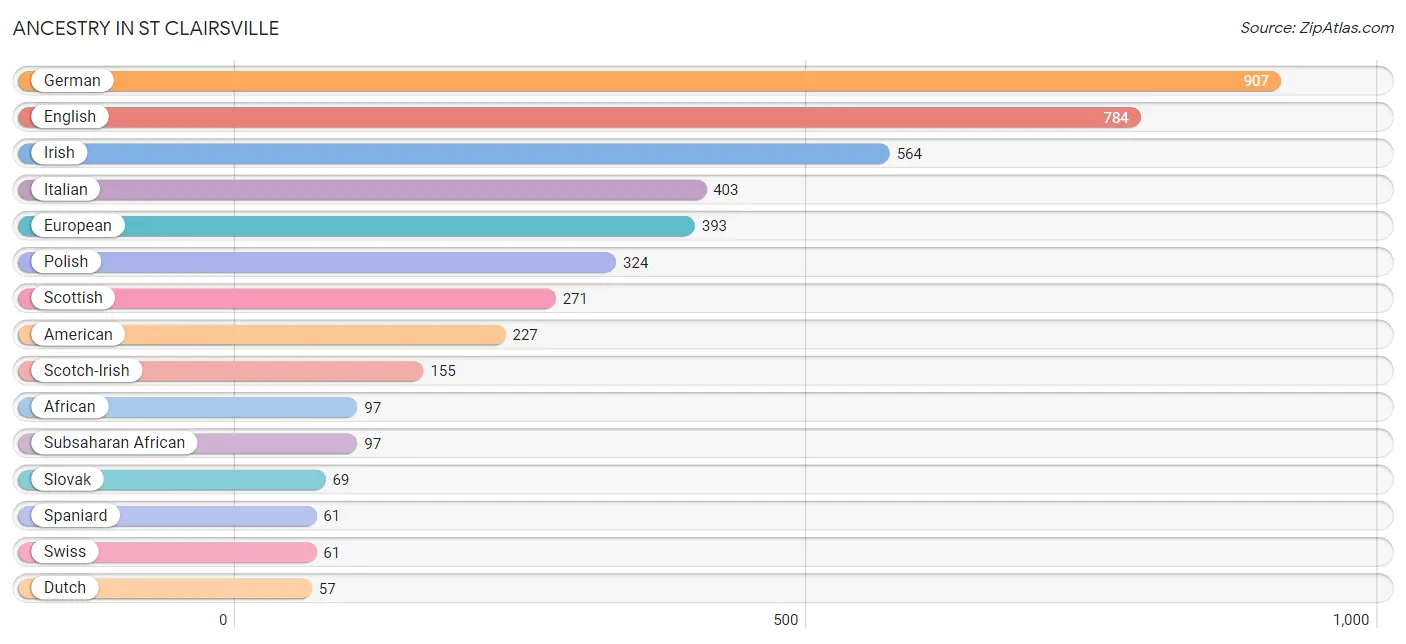
| Ancestry | # Population | % Population |
| African | 97 | 1.9% |
| American | 227 | 4.5% |
| Austrian | 5 | 0.1% |
| British | 5 | 0.1% |
| Croatian | 5 | 0.1% |
| Czech | 44 | 0.9% |
| Dutch | 57 | 1.1% |
| English | 784 | 15.4% |
| European | 393 | 7.7% |
| French | 43 | 0.9% |
| German | 907 | 17.8% |
| Hungarian | 37 | 0.7% |
| Irish | 564 | 11.1% |
| Italian | 403 | 7.9% |
| Korean | 36 | 0.7% |
| Mexican | 19 | 0.4% |
| Norwegian | 23 | 0.4% |
| Polish | 324 | 6.4% |
| Portuguese | 8 | 0.2% |
| Puerto Rican | 34 | 0.7% |
| Russian | 16 | 0.3% |
| Scotch-Irish | 155 | 3.0% |
| Scottish | 271 | 5.3% |
| Serbian | 9 | 0.2% |
| Slavic | 26 | 0.5% |
| Slovak | 69 | 1.4% |
| Spaniard | 61 | 1.2% |
| Spanish | 29 | 0.6% |
| Subsaharan African | 97 | 1.9% |
| Swedish | 10 | 0.2% |
| Swiss | 61 | 1.2% |
| Ukrainian | 24 | 0.5% | View All 32 Rows |
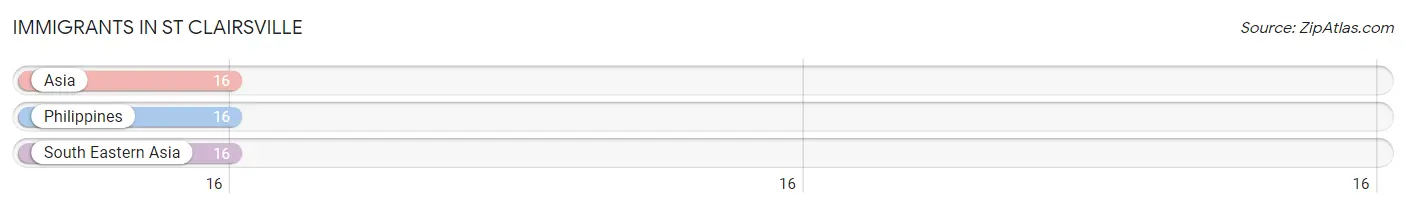
Immigrants in St Clairsville
The most numerous immigrant groups reported in St Clairsville came from Asia (16 | 0.3%), Philippines (16 | 0.3%), and South Eastern Asia (16 | 0.3%), together accounting for 0.9% of all St Clairsville residents.
| Immigration Origin | # Population | % Population |
| Asia | 16 | 0.3% |
| Philippines | 16 | 0.3% |
| South Eastern Asia | 16 | 0.3% | View All 3 Rows |
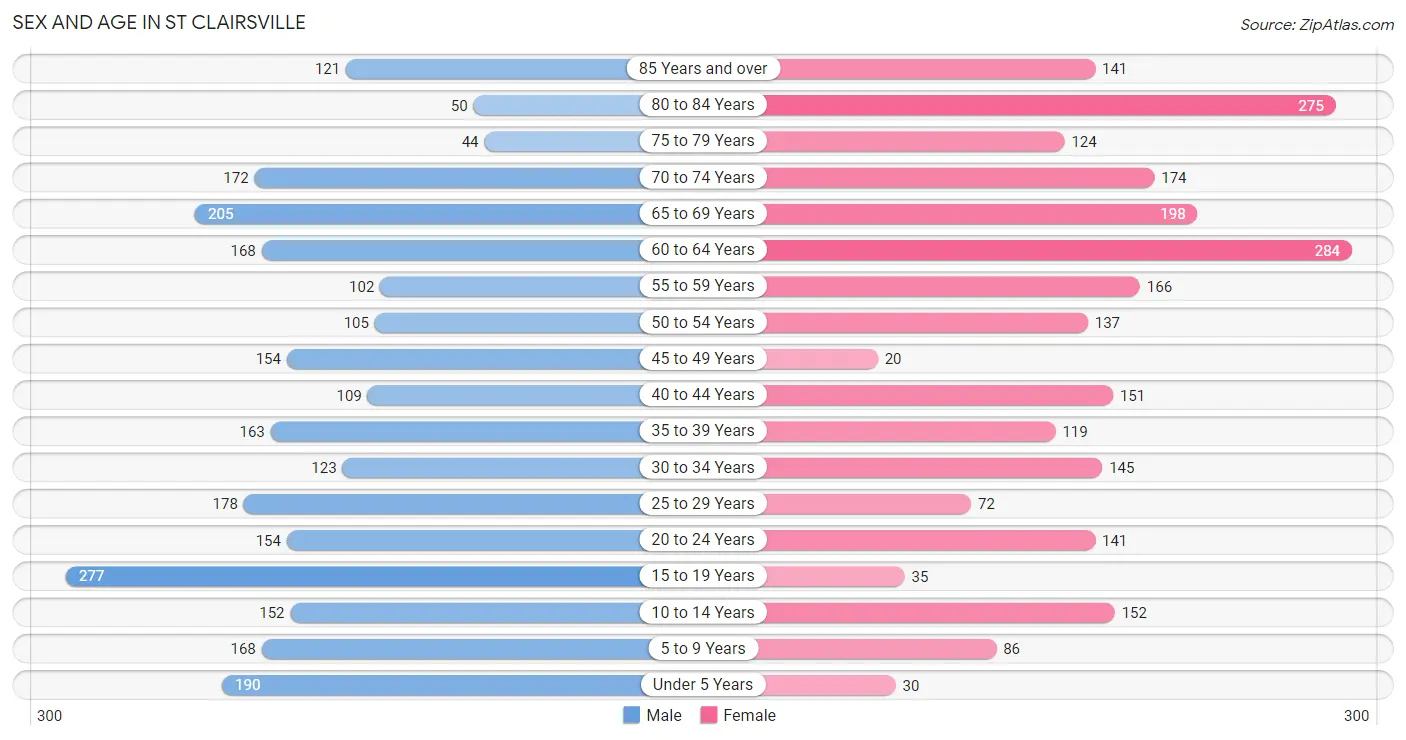
Sex and Age in St Clairsville
Sex and Age in St Clairsville
The most populous age groups in St Clairsville are 15 to 19 Years (277 | 10.5%) for men and 60 to 64 Years (284 | 11.6%) for women.
| Age Bracket | Male | Female |
| Under 5 Years | 190 (7.2%) | 30 (1.2%) |
| 5 to 9 Years | 168 (6.4%) | 86 (3.5%) |
| 10 to 14 Years | 152 (5.8%) | 152 (6.2%) |
| 15 to 19 Years | 277 (10.5%) | 35 (1.4%) |
| 20 to 24 Years | 154 (5.8%) | 141 (5.8%) |
| 25 to 29 Years | 178 (6.8%) | 72 (2.9%) |
| 30 to 34 Years | 123 (4.7%) | 145 (5.9%) |
| 35 to 39 Years | 163 (6.2%) | 119 (4.9%) |
| 40 to 44 Years | 109 (4.1%) | 151 (6.2%) |
| 45 to 49 Years | 154 (5.8%) | 20 (0.8%) |
| 50 to 54 Years | 105 (4.0%) | 137 (5.6%) |
| 55 to 59 Years | 102 (3.9%) | 166 (6.8%) |
| 60 to 64 Years | 168 (6.4%) | 284 (11.6%) |
| 65 to 69 Years | 205 (7.8%) | 198 (8.1%) |
| 70 to 74 Years | 172 (6.5%) | 174 (7.1%) |
| 75 to 79 Years | 44 (1.7%) | 124 (5.1%) |
| 80 to 84 Years | 50 (1.9%) | 275 (11.2%) |
| 85 Years and over | 121 (4.6%) | 141 (5.8%) |
| Total | 2,635 (100.0%) | 2,450 (100.0%) |
Families and Households in St Clairsville
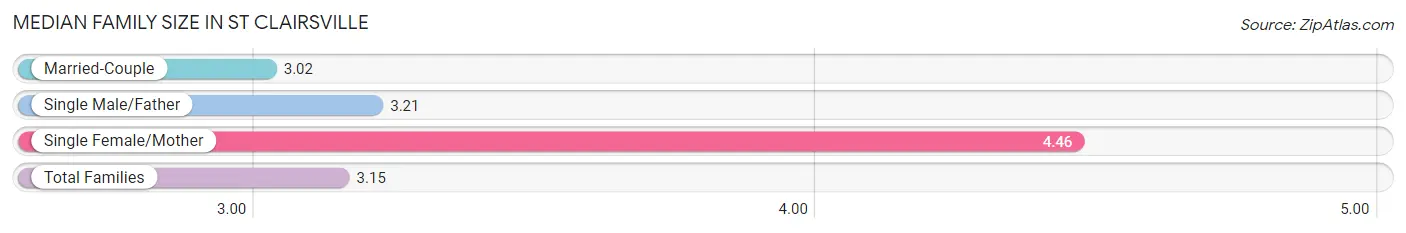
Median Family Size in St Clairsville
The median family size in St Clairsville is 3.15 persons per family, with single female/mother families (96 | 7.7%) accounting for the largest median family size of 4.46 persons per family. On the other hand, married-couple families (1,066 | 85.8%) represent the smallest median family size with 3.02 persons per family.
| Family Type | # Families | Family Size |
| Married-Couple | 1,066 (85.8%) | 3.02 |
| Single Male/Father | 80 (6.4%) | 3.21 |
| Single Female/Mother | 96 (7.7%) | 4.46 |
| Total Families | 1,242 (100.0%) | 3.15 |
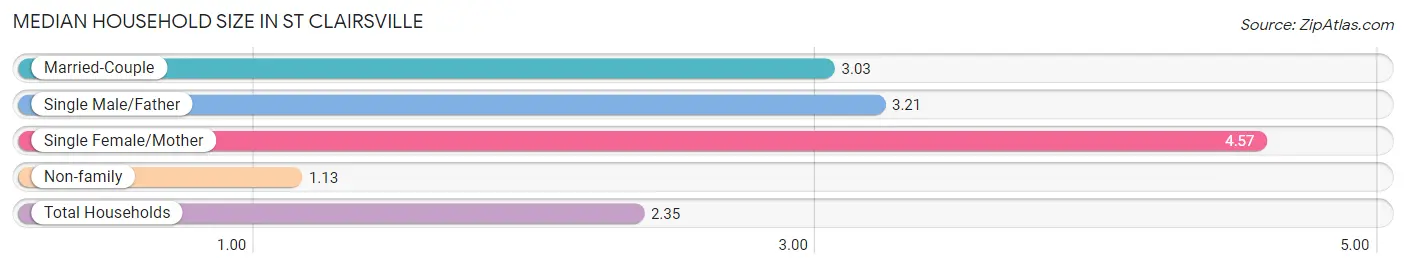
Median Household Size in St Clairsville
The median household size in St Clairsville is 2.35 persons per household, with single female/mother households (96 | 4.6%) accounting for the largest median household size of 4.57 persons per household. non-family households (825 | 39.9%) represent the smallest median household size with 1.13 persons per household.
| Household Type | # Households | Household Size |
| Married-Couple | 1,066 (51.6%) | 3.03 |
| Single Male/Father | 80 (3.9%) | 3.21 |
| Single Female/Mother | 96 (4.6%) | 4.57 |
| Non-family | 825 (39.9%) | 1.13 |
| Total Households | 2,067 (100.0%) | 2.35 |
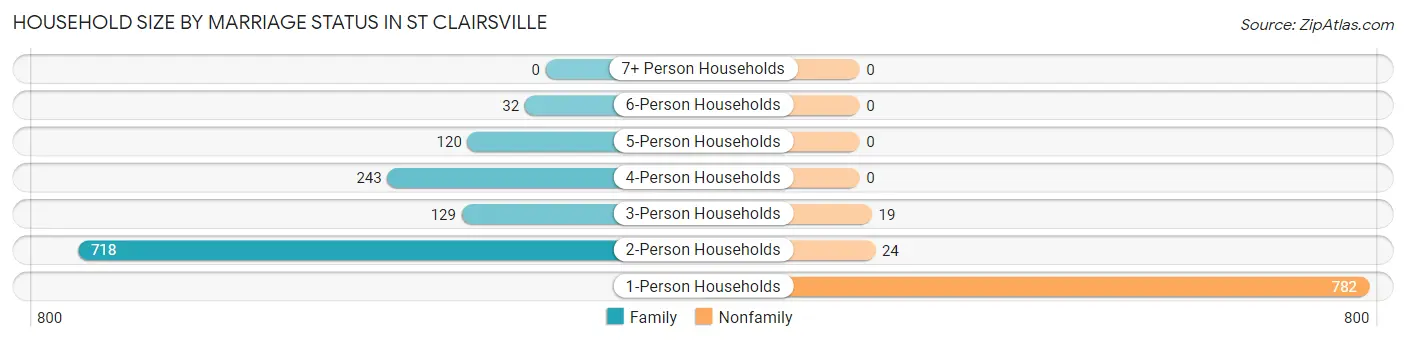
Household Size by Marriage Status in St Clairsville
Out of a total of 2,067 households in St Clairsville, 1,242 (60.1%) are family households, while 825 (39.9%) are nonfamily households. The most numerous type of family households are 2-person households, comprising 718, and the most common type of nonfamily households are 1-person households, comprising 782.
| Household Size | Family Households | Nonfamily Households |
| 1-Person Households | - | 782 (37.8%) |
| 2-Person Households | 718 (34.7%) | 24 (1.2%) |
| 3-Person Households | 129 (6.2%) | 19 (0.9%) |
| 4-Person Households | 243 (11.8%) | 0 (0.0%) |
| 5-Person Households | 120 (5.8%) | 0 (0.0%) |
| 6-Person Households | 32 (1.5%) | 0 (0.0%) |
| 7+ Person Households | 0 (0.0%) | 0 (0.0%) |
| Total | 1,242 (60.1%) | 825 (39.9%) |
Female Fertility in St Clairsville
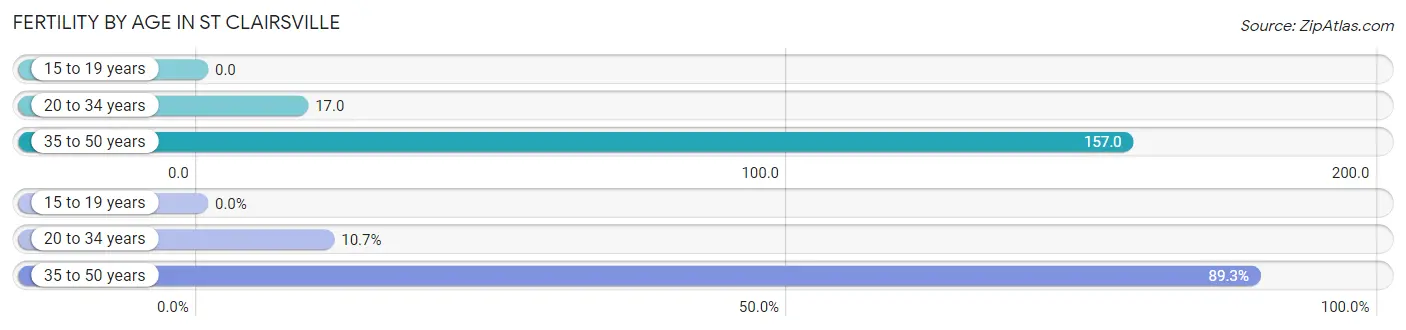
Fertility by Age in St Clairsville
Average fertility rate in St Clairsville is 79.0 births per 1,000 women. Women in the age bracket of 35 to 50 years have the highest fertility rate with 157.0 births per 1,000 women. Women in the age bracket of 35 to 50 years acount for 89.3% of all women with births.
| Age Bracket | Women with Births | Births / 1,000 Women |
| 15 to 19 years | 0 (0.0%) | 0.0 |
| 20 to 34 years | 6 (10.7%) | 17.0 |
| 35 to 50 years | 50 (89.3%) | 157.0 |
| Total | 56 (100.0%) | 79.0 |
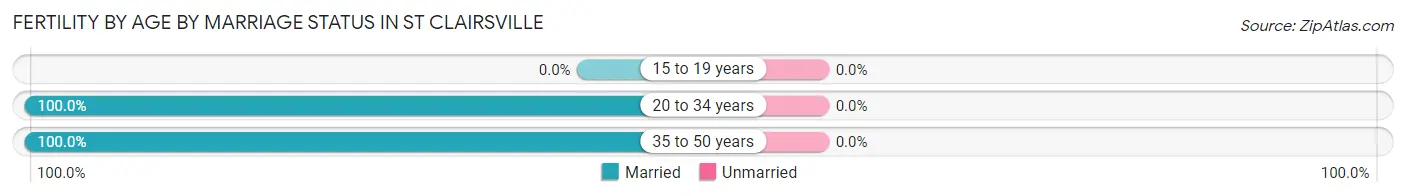
Fertility by Age by Marriage Status in St Clairsville
| Age Bracket | Married | Unmarried |
| 15 to 19 years | 0 (0.0%) | 0 (0.0%) |
| 20 to 34 years | 6 (100.0%) | 0 (0.0%) |
| 35 to 50 years | 50 (100.0%) | 0 (0.0%) |
| Total | 56 (100.0%) | 0 (0.0%) |
Fertility by Education in St Clairsville
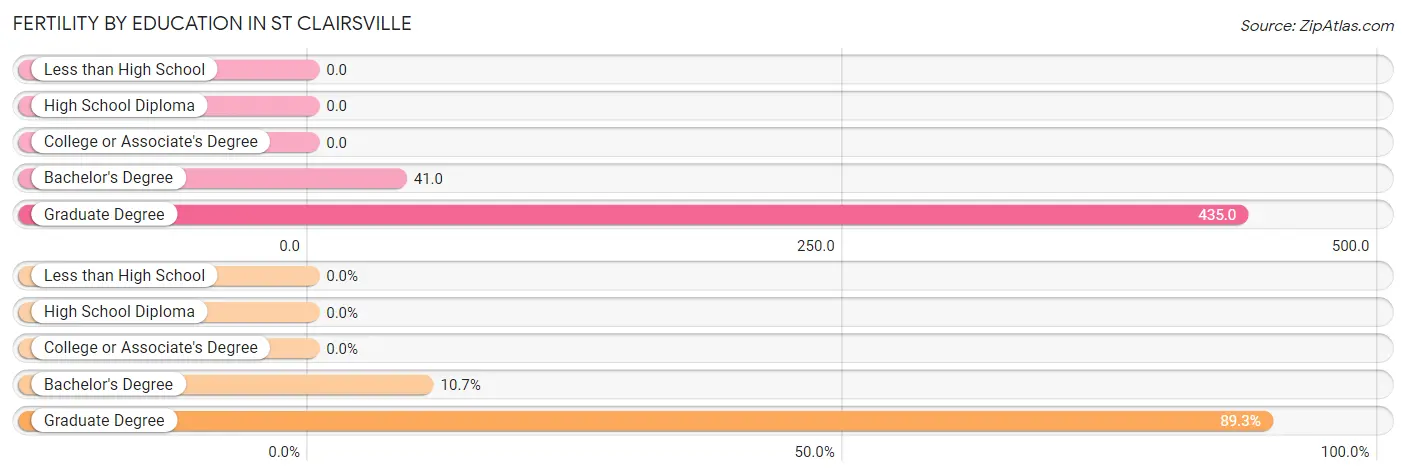
| Educational Attainment | Women with Births | Births / 1,000 Women |
| Less than High School | 0 (0.0%) | 0.0 |
| High School Diploma | 0 (0.0%) | 0.0 |
| College or Associate's Degree | 0 (0.0%) | 0.0 |
| Bachelor's Degree | 6 (10.7%) | 41.0 |
| Graduate Degree | 50 (89.3%) | 435.0 |
| Total | 56 (100.0%) | 79.0 |
Fertility by Education by Marriage Status in St Clairsville
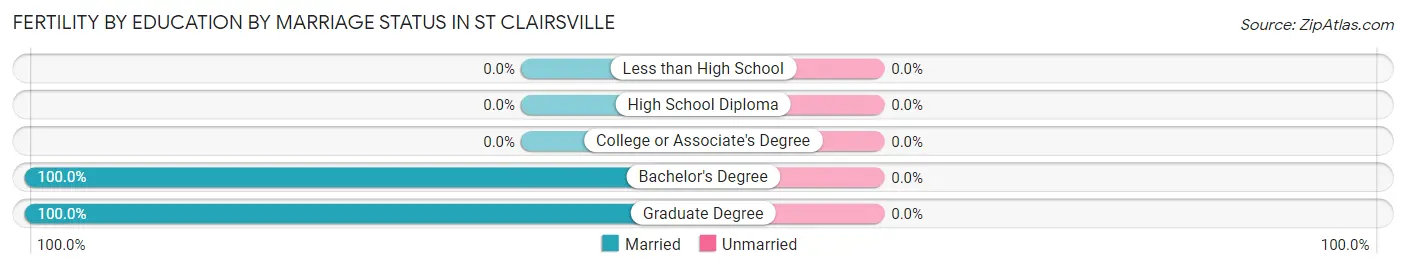
| Educational Attainment | Married | Unmarried |
| Less than High School | 0 (0.0%) | 0 (0.0%) |
| High School Diploma | 0 (0.0%) | 0 (0.0%) |
| College or Associate's Degree | 0 (0.0%) | 0 (0.0%) |
| Bachelor's Degree | 6 (100.0%) | 0 (0.0%) |
| Graduate Degree | 50 (100.0%) | 0 (0.0%) |
| Total | 56 (100.0%) | 0 (0.0%) |
Employment Characteristics in St Clairsville
Employment by Class of Employer in St Clairsville
Among the 2,332 employed individuals in St Clairsville, private company employees (1,769 | 75.9%), local government employees (171 | 7.3%), and not-for-profit organizations (114 | 4.9%) make up the most common classes of employment.
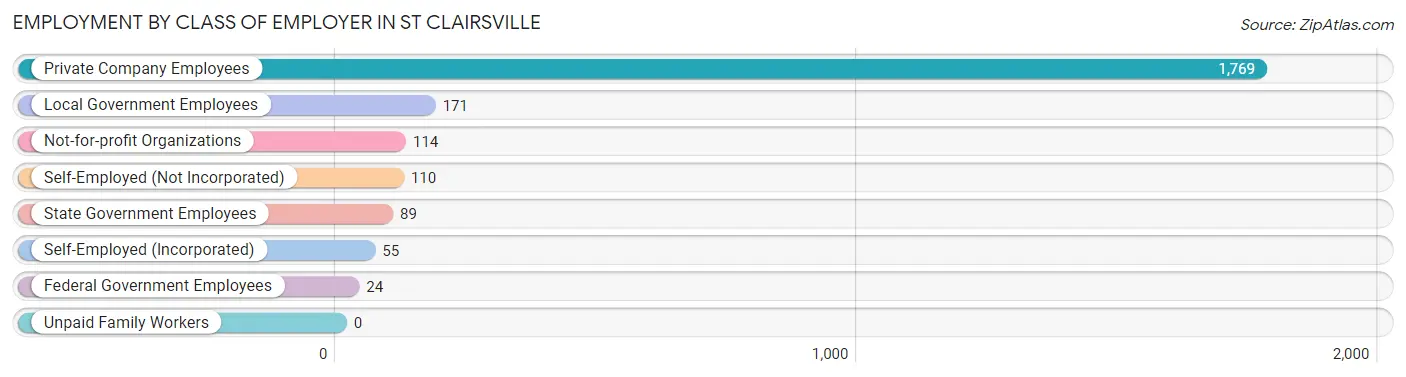
| Employer Class | # Employees | % Employees |
| Private Company Employees | 1,769 | 75.9% |
| Self-Employed (Incorporated) | 55 | 2.4% |
| Self-Employed (Not Incorporated) | 110 | 4.7% |
| Not-for-profit Organizations | 114 | 4.9% |
| Local Government Employees | 171 | 7.3% |
| State Government Employees | 89 | 3.8% |
| Federal Government Employees | 24 | 1.0% |
| Unpaid Family Workers | 0 | 0.0% |
| Total | 2,332 | 100.0% |
Employment Status by Age in St Clairsville
According to the labor force statistics for St Clairsville, out of the total population over 16 years of age (4,262), 58.4% or 2,489 individuals are in the labor force, with 2.9% or 72 of them unemployed. The age group with the highest labor force participation rate is 20 to 24 years, with 100.0% or 295 individuals in the labor force. Within the labor force, the 20 to 24 years age range has the highest percentage of unemployed individuals, with 9.5% or 28 of them being unemployed.
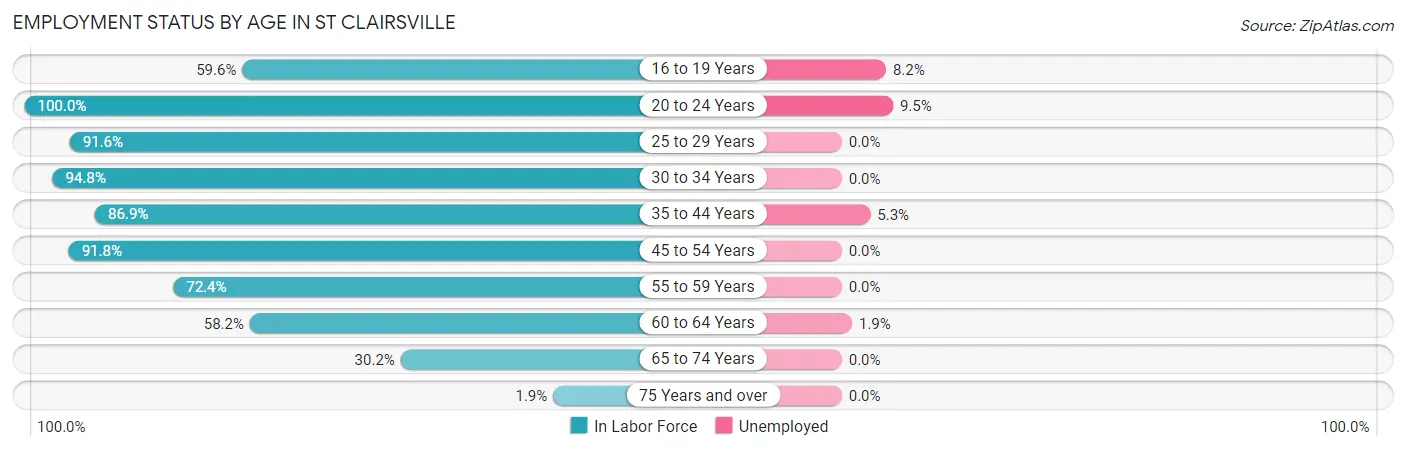
| Age Bracket | In Labor Force | Unemployed |
| 16 to 19 Years | 159 (59.6%) | 13 (8.2%) |
| 20 to 24 Years | 295 (100.0%) | 28 (9.5%) |
| 25 to 29 Years | 229 (91.6%) | 0 (0.0%) |
| 30 to 34 Years | 254 (94.8%) | 0 (0.0%) |
| 35 to 44 Years | 471 (86.9%) | 25 (5.3%) |
| 45 to 54 Years | 382 (91.8%) | 0 (0.0%) |
| 55 to 59 Years | 194 (72.4%) | 0 (0.0%) |
| 60 to 64 Years | 263 (58.2%) | 5 (1.9%) |
| 65 to 74 Years | 226 (30.2%) | 0 (0.0%) |
| 75 Years and over | 14 (1.9%) | 0 (0.0%) |
| Total | 2,489 (58.4%) | 72 (2.9%) |
Employment Status by Educational Attainment in St Clairsville
According to labor force statistics for St Clairsville, 81.6% of individuals (1,792) out of the total population between 25 and 64 years of age (2,196) are in the labor force, with 1.7% or 30 of them being unemployed. The group with the highest labor force participation rate are those with the educational attainment of bachelor's degree or higher, with 91.4% or 845 individuals in the labor force. Within the labor force, individuals with bachelor's degree or higher education have the highest percentage of unemployment, with 3.0% or 25 of them being unemployed.
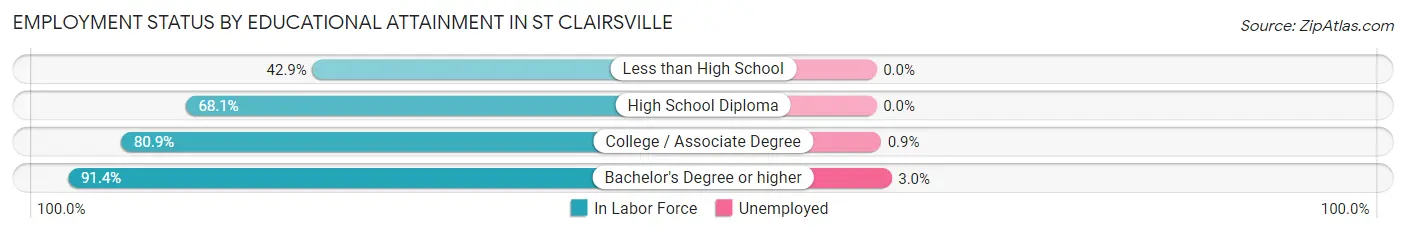
| Educational Attainment | In Labor Force | Unemployed |
| Less than High School | 6 (42.9%) | 0 (0.0%) |
| High School Diploma | 400 (68.1%) | 0 (0.0%) |
| College / Associate Degree | 542 (80.9%) | 6 (0.9%) |
| Bachelor's Degree or higher | 845 (91.4%) | 28 (3.0%) |
| Total | 1,792 (81.6%) | 37 (1.7%) |
Employment Occupations by Sex in St Clairsville
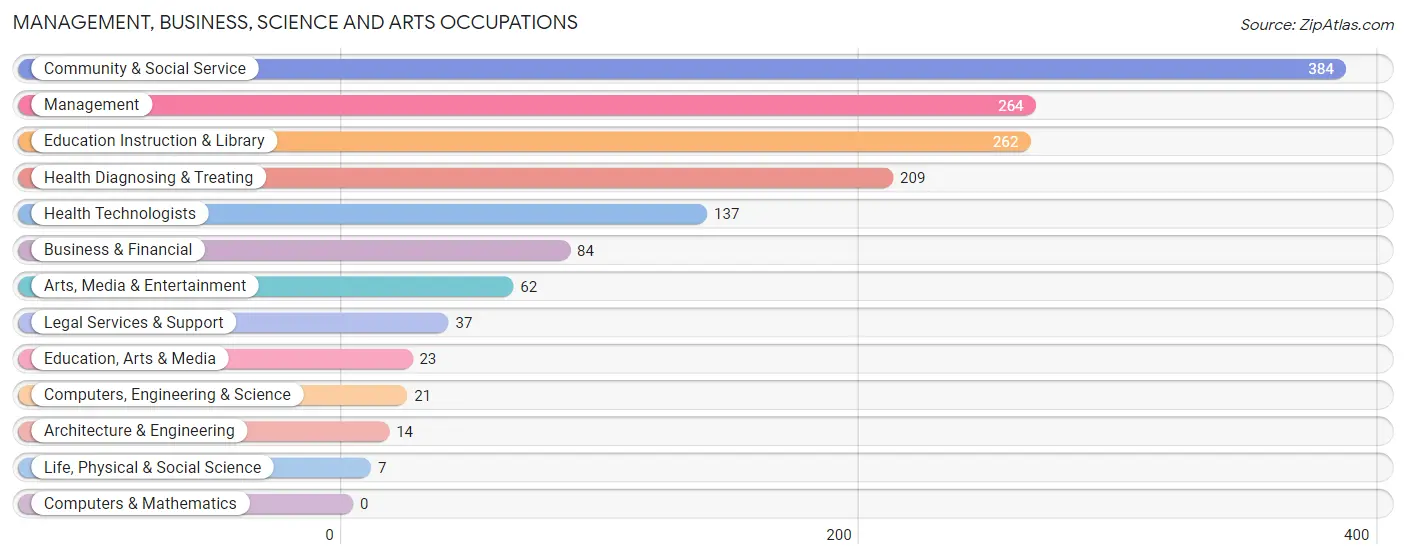
Management, Business, Science and Arts Occupations
The most common Management, Business, Science and Arts occupations in St Clairsville are Community & Social Service (384 | 15.9%), Management (264 | 10.9%), Education Instruction & Library (262 | 10.8%), Health Diagnosing & Treating (209 | 8.6%), and Health Technologists (137 | 5.7%).
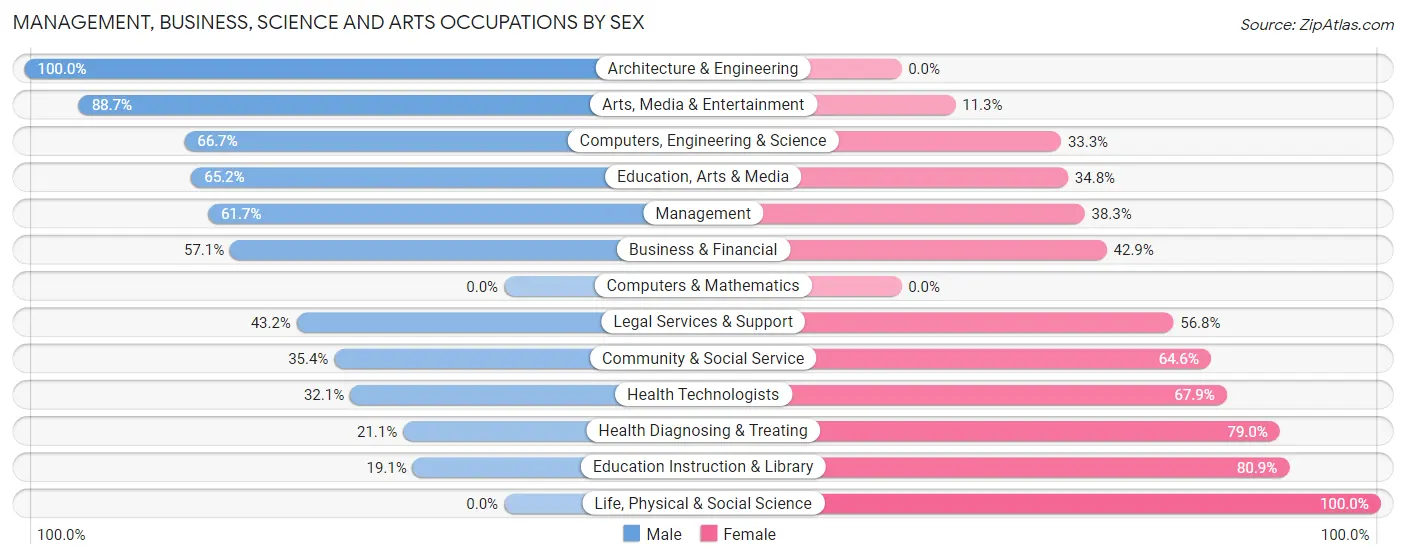
Management, Business, Science and Arts Occupations by Sex
Within the Management, Business, Science and Arts occupations in St Clairsville, the most male-oriented occupations are Architecture & Engineering (100.0%), Arts, Media & Entertainment (88.7%), and Computers, Engineering & Science (66.7%), while the most female-oriented occupations are Life, Physical & Social Science (100.0%), Education Instruction & Library (80.9%), and Health Diagnosing & Treating (78.9%).
| Occupation | Male | Female |
| Management | 163 (61.7%) | 101 (38.3%) |
| Business & Financial | 48 (57.1%) | 36 (42.9%) |
| Computers, Engineering & Science | 14 (66.7%) | 7 (33.3%) |
| Computers & Mathematics | 0 (0.0%) | 0 (0.0%) |
| Architecture & Engineering | 14 (100.0%) | 0 (0.0%) |
| Life, Physical & Social Science | 0 (0.0%) | 7 (100.0%) |
| Community & Social Service | 136 (35.4%) | 248 (64.6%) |
| Education, Arts & Media | 15 (65.2%) | 8 (34.8%) |
| Legal Services & Support | 16 (43.2%) | 21 (56.8%) |
| Education Instruction & Library | 50 (19.1%) | 212 (80.9%) |
| Arts, Media & Entertainment | 55 (88.7%) | 7 (11.3%) |
| Health Diagnosing & Treating | 44 (21.0%) | 165 (78.9%) |
| Health Technologists | 44 (32.1%) | 93 (67.9%) |
| Total (Category) | 405 (42.1%) | 557 (57.9%) |
| Total (Overall) | 1,410 (58.4%) | 1,006 (41.6%) |
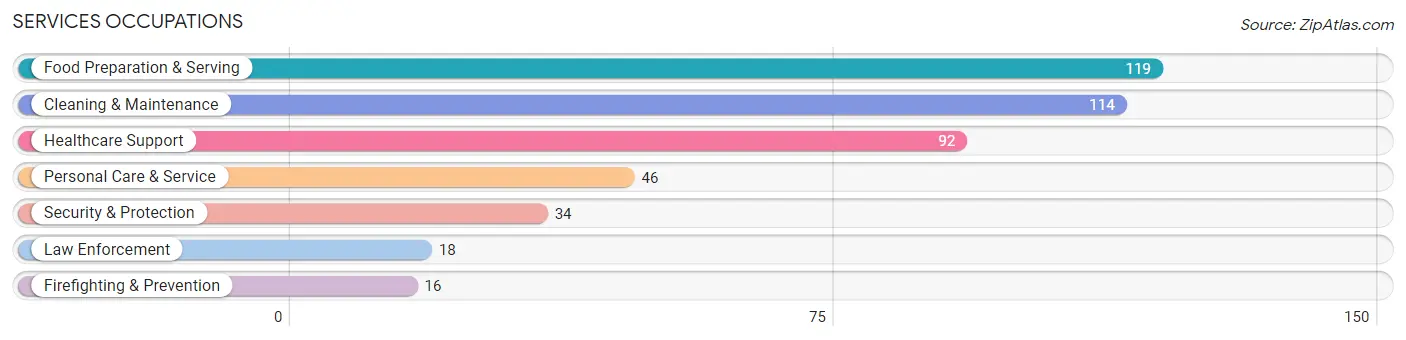
Services Occupations
The most common Services occupations in St Clairsville are Food Preparation & Serving (119 | 4.9%), Cleaning & Maintenance (114 | 4.7%), Healthcare Support (92 | 3.8%), Personal Care & Service (46 | 1.9%), and Security & Protection (34 | 1.4%).
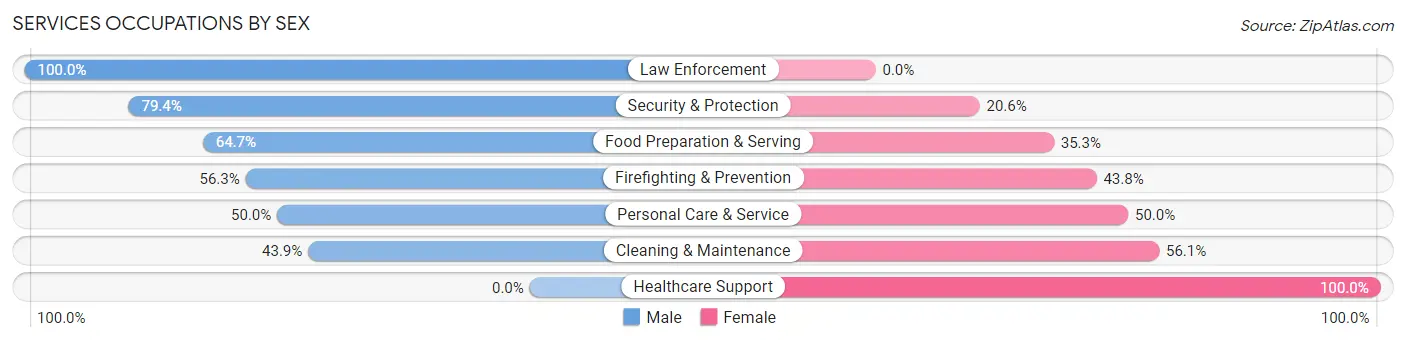
Services Occupations by Sex
Within the Services occupations in St Clairsville, the most male-oriented occupations are Law Enforcement (100.0%), Security & Protection (79.4%), and Food Preparation & Serving (64.7%), while the most female-oriented occupations are Healthcare Support (100.0%), Cleaning & Maintenance (56.1%), and Personal Care & Service (50.0%).
| Occupation | Male | Female |
| Healthcare Support | 0 (0.0%) | 92 (100.0%) |
| Security & Protection | 27 (79.4%) | 7 (20.6%) |
| Firefighting & Prevention | 9 (56.2%) | 7 (43.8%) |
| Law Enforcement | 18 (100.0%) | 0 (0.0%) |
| Food Preparation & Serving | 77 (64.7%) | 42 (35.3%) |
| Cleaning & Maintenance | 50 (43.9%) | 64 (56.1%) |
| Personal Care & Service | 23 (50.0%) | 23 (50.0%) |
| Total (Category) | 177 (43.7%) | 228 (56.3%) |
| Total (Overall) | 1,410 (58.4%) | 1,006 (41.6%) |
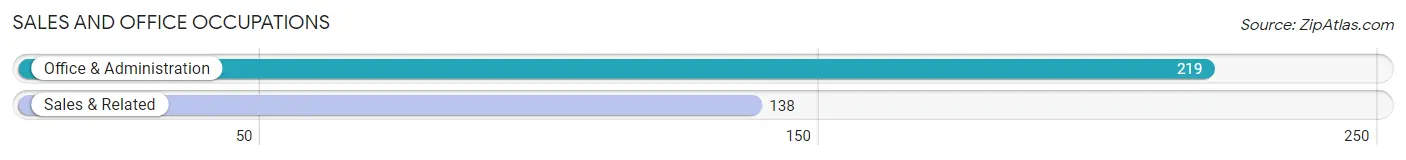
Sales and Office Occupations
The most common Sales and Office occupations in St Clairsville are Office & Administration (219 | 9.1%), and Sales & Related (138 | 5.7%).
Sales and Office Occupations by Sex
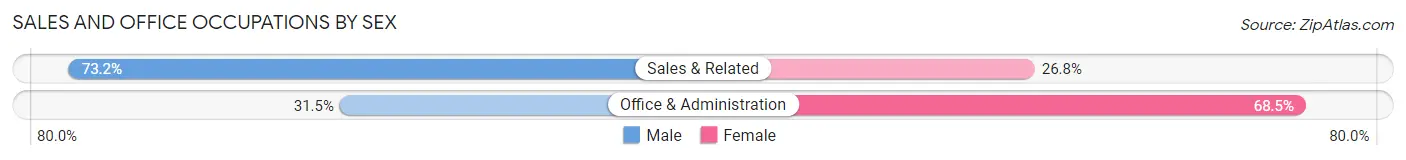
| Occupation | Male | Female |
| Sales & Related | 101 (73.2%) | 37 (26.8%) |
| Office & Administration | 69 (31.5%) | 150 (68.5%) |
| Total (Category) | 170 (47.6%) | 187 (52.4%) |
| Total (Overall) | 1,410 (58.4%) | 1,006 (41.6%) |
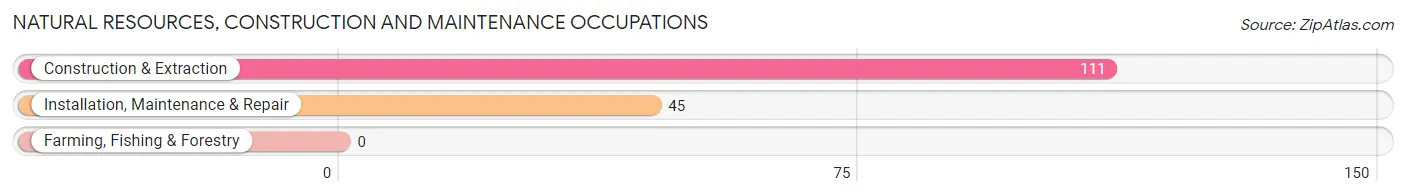
Natural Resources, Construction and Maintenance Occupations
The most common Natural Resources, Construction and Maintenance occupations in St Clairsville are Construction & Extraction (111 | 4.6%), and Installation, Maintenance & Repair (45 | 1.9%).
Natural Resources, Construction and Maintenance Occupations by Sex
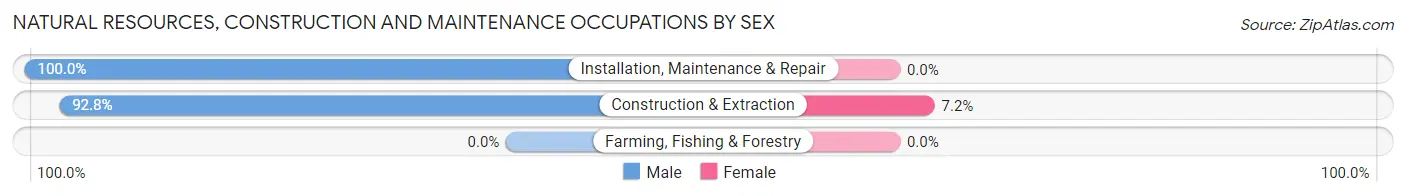
| Occupation | Male | Female |
| Farming, Fishing & Forestry | 0 (0.0%) | 0 (0.0%) |
| Construction & Extraction | 103 (92.8%) | 8 (7.2%) |
| Installation, Maintenance & Repair | 45 (100.0%) | 0 (0.0%) |
| Total (Category) | 148 (94.9%) | 8 (5.1%) |
| Total (Overall) | 1,410 (58.4%) | 1,006 (41.6%) |
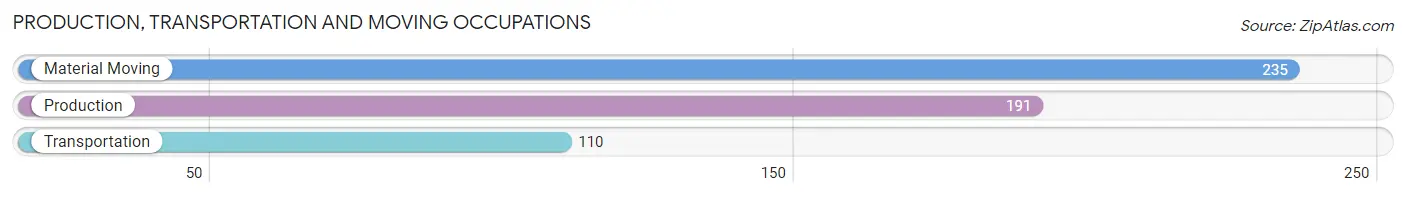
Production, Transportation and Moving Occupations
The most common Production, Transportation and Moving occupations in St Clairsville are Material Moving (235 | 9.7%), Production (191 | 7.9%), and Transportation (110 | 4.5%).
Production, Transportation and Moving Occupations by Sex
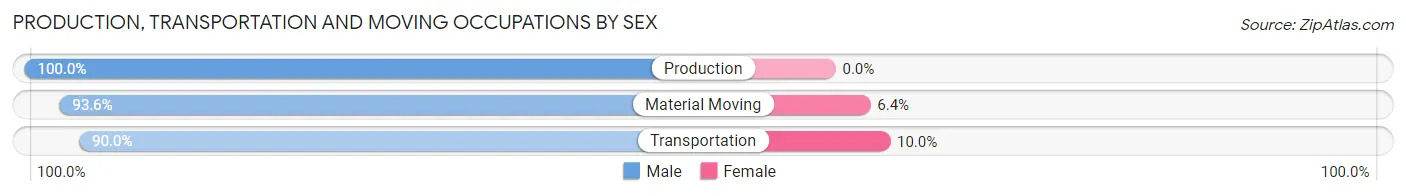
| Occupation | Male | Female |
| Production | 191 (100.0%) | 0 (0.0%) |
| Transportation | 99 (90.0%) | 11 (10.0%) |
| Material Moving | 220 (93.6%) | 15 (6.4%) |
| Total (Category) | 510 (95.2%) | 26 (4.9%) |
| Total (Overall) | 1,410 (58.4%) | 1,006 (41.6%) |
Employment Industries by Sex in St Clairsville
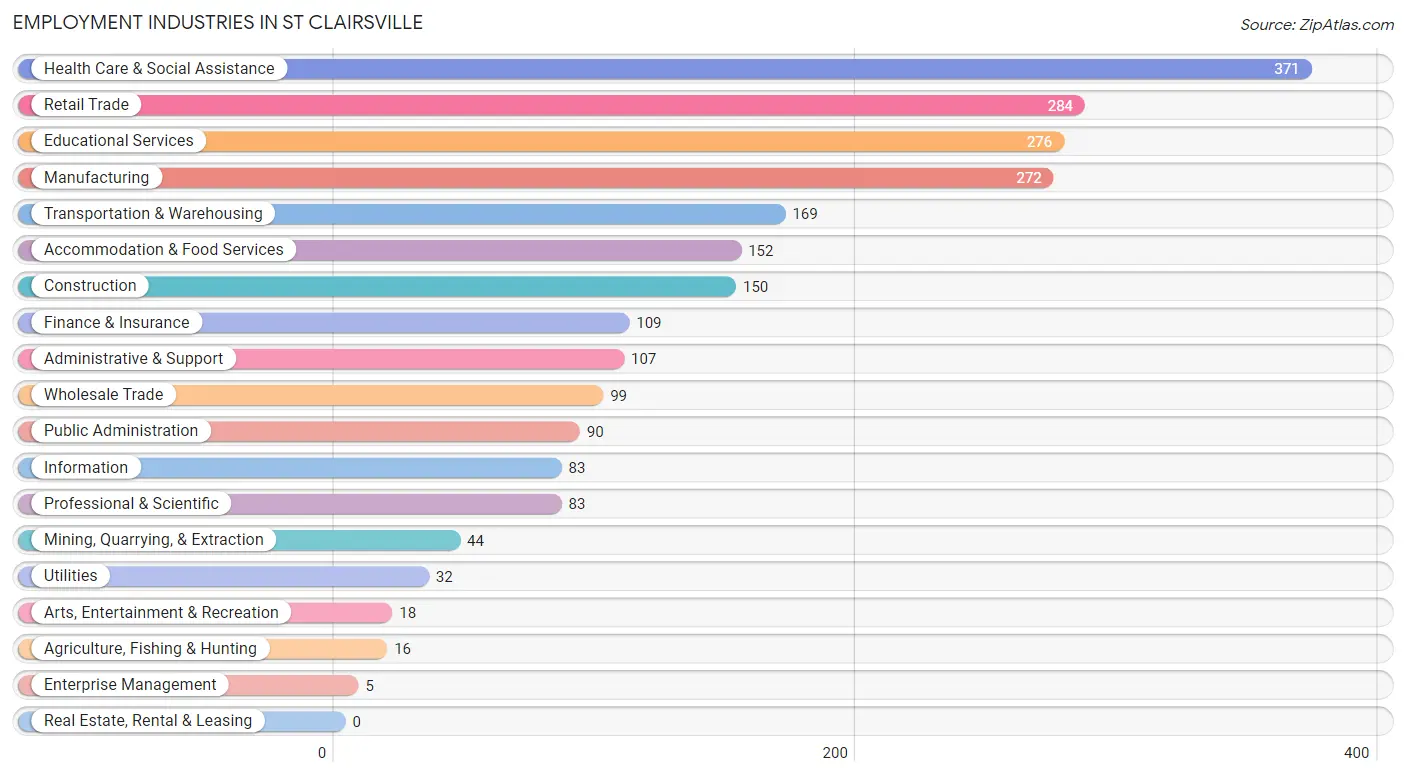
Employment Industries in St Clairsville
The major employment industries in St Clairsville include Health Care & Social Assistance (371 | 15.4%), Retail Trade (284 | 11.7%), Educational Services (276 | 11.4%), Manufacturing (272 | 11.3%), and Transportation & Warehousing (169 | 7.0%).
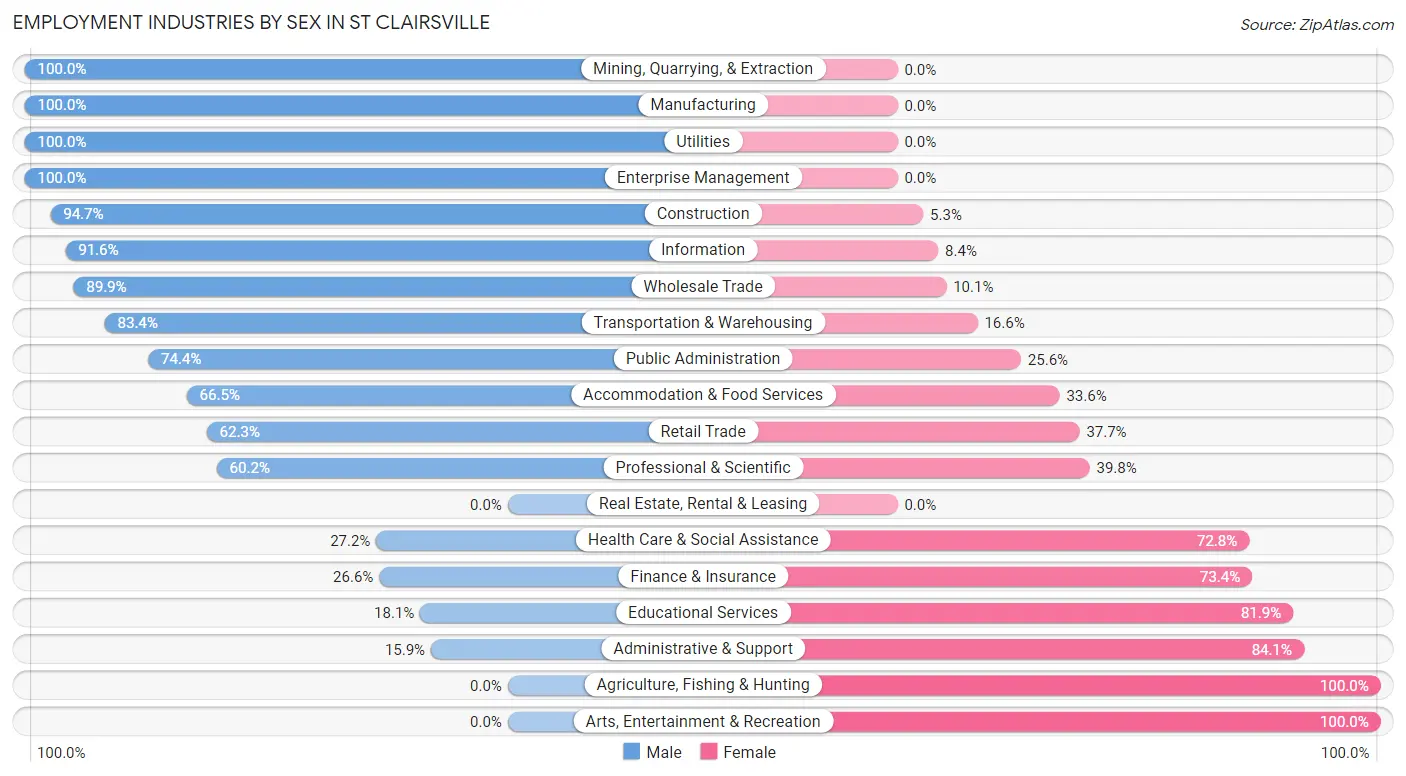
Employment Industries by Sex in St Clairsville
The St Clairsville industries that see more men than women are Mining, Quarrying, & Extraction (100.0%), Manufacturing (100.0%), and Utilities (100.0%), whereas the industries that tend to have a higher number of women are Agriculture, Fishing & Hunting (100.0%), Arts, Entertainment & Recreation (100.0%), and Administrative & Support (84.1%).
| Industry | Male | Female |
| Agriculture, Fishing & Hunting | 0 (0.0%) | 16 (100.0%) |
| Mining, Quarrying, & Extraction | 44 (100.0%) | 0 (0.0%) |
| Construction | 142 (94.7%) | 8 (5.3%) |
| Manufacturing | 272 (100.0%) | 0 (0.0%) |
| Wholesale Trade | 89 (89.9%) | 10 (10.1%) |
| Retail Trade | 177 (62.3%) | 107 (37.7%) |
| Transportation & Warehousing | 141 (83.4%) | 28 (16.6%) |
| Utilities | 32 (100.0%) | 0 (0.0%) |
| Information | 76 (91.6%) | 7 (8.4%) |
| Finance & Insurance | 29 (26.6%) | 80 (73.4%) |
| Real Estate, Rental & Leasing | 0 (0.0%) | 0 (0.0%) |
| Professional & Scientific | 50 (60.2%) | 33 (39.8%) |
| Enterprise Management | 5 (100.0%) | 0 (0.0%) |
| Administrative & Support | 17 (15.9%) | 90 (84.1%) |
| Educational Services | 50 (18.1%) | 226 (81.9%) |
| Health Care & Social Assistance | 101 (27.2%) | 270 (72.8%) |
| Arts, Entertainment & Recreation | 0 (0.0%) | 18 (100.0%) |
| Accommodation & Food Services | 101 (66.4%) | 51 (33.6%) |
| Public Administration | 67 (74.4%) | 23 (25.6%) |
| Total | 1,410 (58.4%) | 1,006 (41.6%) |
Education in St Clairsville
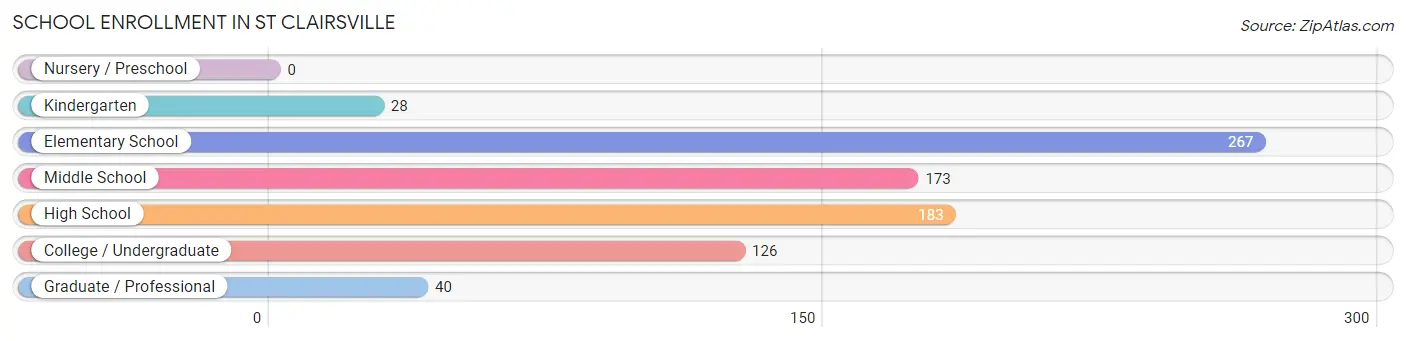
School Enrollment in St Clairsville
The most common levels of schooling among the 817 students in St Clairsville are elementary school (267 | 32.7%), high school (183 | 22.4%), and middle school (173 | 21.2%).
| School Level | # Students | % Students |
| Nursery / Preschool | 0 | 0.0% |
| Kindergarten | 28 | 3.4% |
| Elementary School | 267 | 32.7% |
| Middle School | 173 | 21.2% |
| High School | 183 | 22.4% |
| College / Undergraduate | 126 | 15.4% |
| Graduate / Professional | 40 | 4.9% |
| Total | 817 | 100.0% |
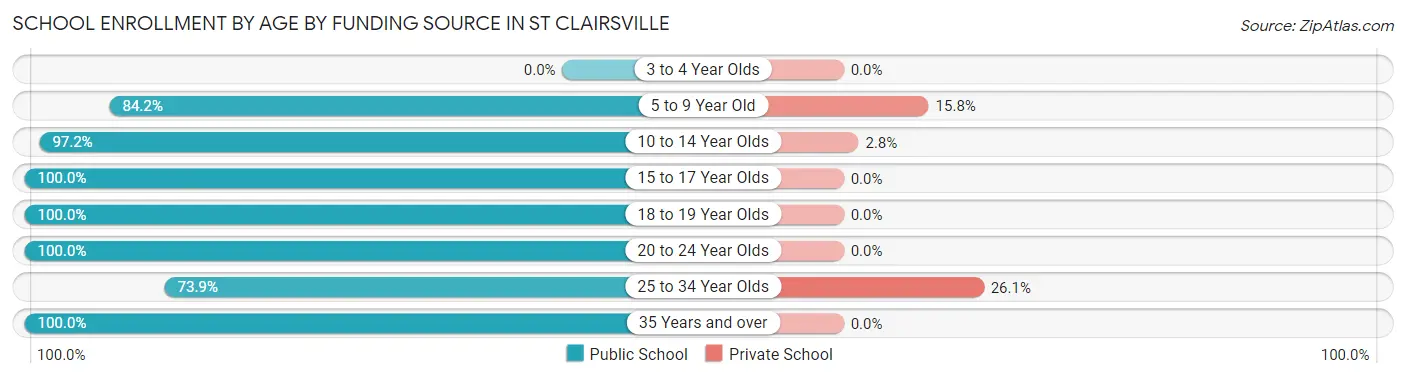
School Enrollment by Age by Funding Source in St Clairsville
Out of a total of 817 students who are enrolled in schools in St Clairsville, 57 (7.0%) attend a private institution, while the remaining 760 (93.0%) are enrolled in public schools. The age group of 25 to 34 year olds has the highest likelihood of being enrolled in private schools, with 12 (26.1% in the age bracket) enrolled. Conversely, the age group of 15 to 17 year olds has the lowest likelihood of being enrolled in a private school, with 128 (100.0% in the age bracket) attending a public institution.
| Age Bracket | Public School | Private School |
| 3 to 4 Year Olds | 0 (0.0%) | 0 (0.0%) |
| 5 to 9 Year Old | 202 (84.2%) | 38 (15.8%) |
| 10 to 14 Year Olds | 246 (97.2%) | 7 (2.8%) |
| 15 to 17 Year Olds | 128 (100.0%) | 0 (0.0%) |
| 18 to 19 Year Olds | 58 (100.0%) | 0 (0.0%) |
| 20 to 24 Year Olds | 46 (100.0%) | 0 (0.0%) |
| 25 to 34 Year Olds | 34 (73.9%) | 12 (26.1%) |
| 35 Years and over | 46 (100.0%) | 0 (0.0%) |
| Total | 760 (93.0%) | 57 (7.0%) |
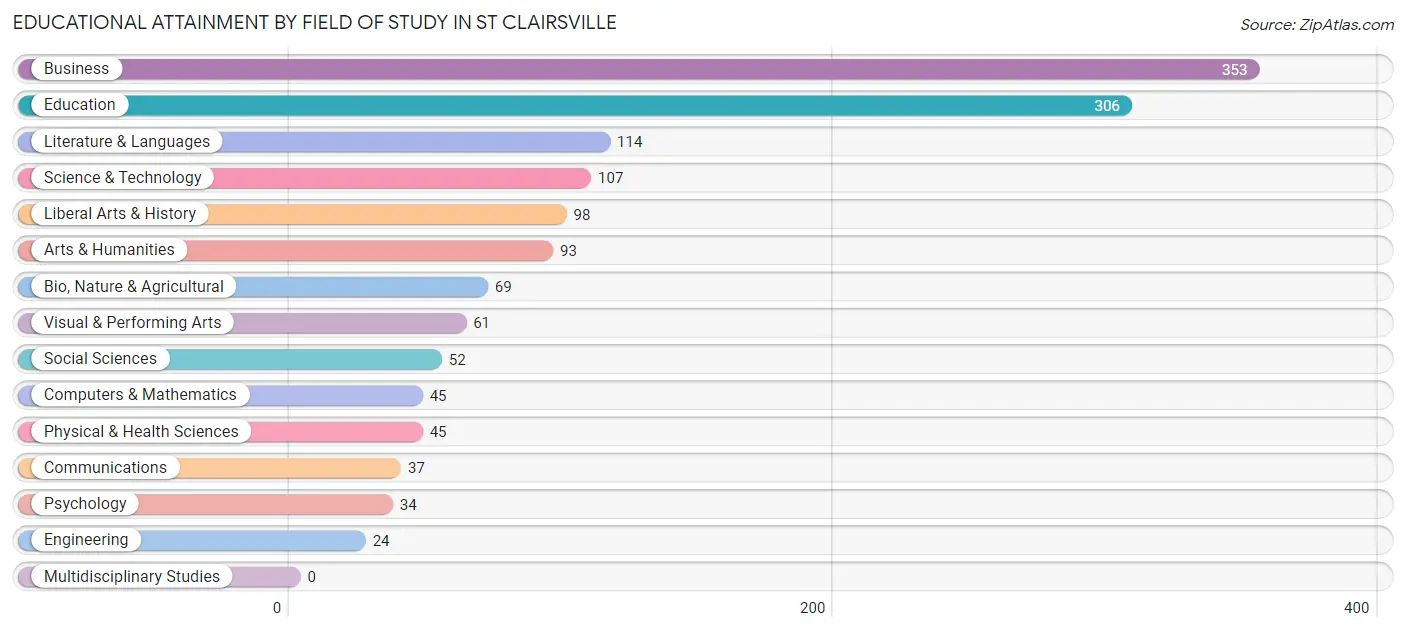
Educational Attainment by Field of Study in St Clairsville
Business (353 | 24.5%), education (306 | 21.3%), literature & languages (114 | 7.9%), science & technology (107 | 7.4%), and liberal arts & history (98 | 6.8%) are the most common fields of study among 1,438 individuals in St Clairsville who have obtained a bachelor's degree or higher.
| Field of Study | # Graduates | % Graduates |
| Computers & Mathematics | 45 | 3.1% |
| Bio, Nature & Agricultural | 69 | 4.8% |
| Physical & Health Sciences | 45 | 3.1% |
| Psychology | 34 | 2.4% |
| Social Sciences | 52 | 3.6% |
| Engineering | 24 | 1.7% |
| Multidisciplinary Studies | 0 | 0.0% |
| Science & Technology | 107 | 7.4% |
| Business | 353 | 24.5% |
| Education | 306 | 21.3% |
| Literature & Languages | 114 | 7.9% |
| Liberal Arts & History | 98 | 6.8% |
| Visual & Performing Arts | 61 | 4.2% |
| Communications | 37 | 2.6% |
| Arts & Humanities | 93 | 6.5% |
| Total | 1,438 | 100.0% |
Transportation & Commute in St Clairsville
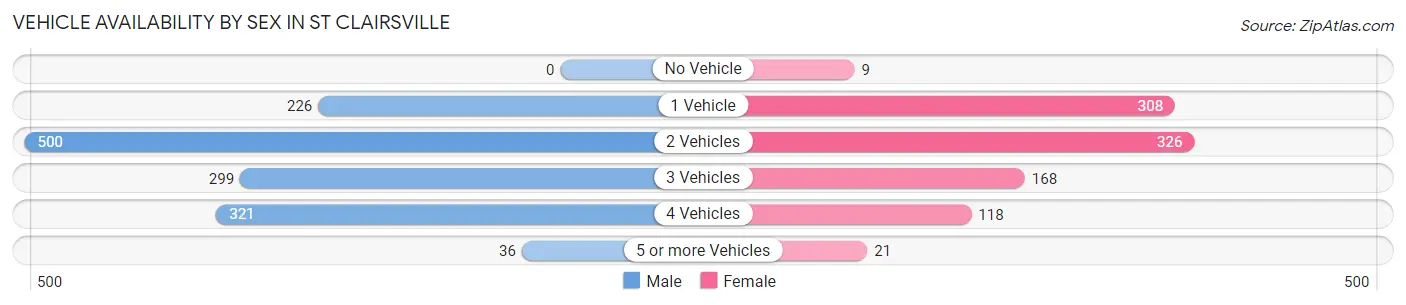
Vehicle Availability by Sex in St Clairsville
The most prevalent vehicle ownership categories in St Clairsville are males with 2 vehicles (500, accounting for 36.2%) and females with 2 vehicles (326, making up 52.6%).
| Vehicles Available | Male | Female |
| No Vehicle | 0 (0.0%) | 9 (0.9%) |
| 1 Vehicle | 226 (16.4%) | 308 (32.4%) |
| 2 Vehicles | 500 (36.2%) | 326 (34.3%) |
| 3 Vehicles | 299 (21.6%) | 168 (17.7%) |
| 4 Vehicles | 321 (23.2%) | 118 (12.4%) |
| 5 or more Vehicles | 36 (2.6%) | 21 (2.2%) |
| Total | 1,382 (100.0%) | 950 (100.0%) |
Commute Time in St Clairsville
The most frequently occuring commute durations in St Clairsville are 20 to 24 minutes (424 commuters, 18.8%), 5 to 9 minutes (418 commuters, 18.6%), and 15 to 19 minutes (374 commuters, 16.6%).
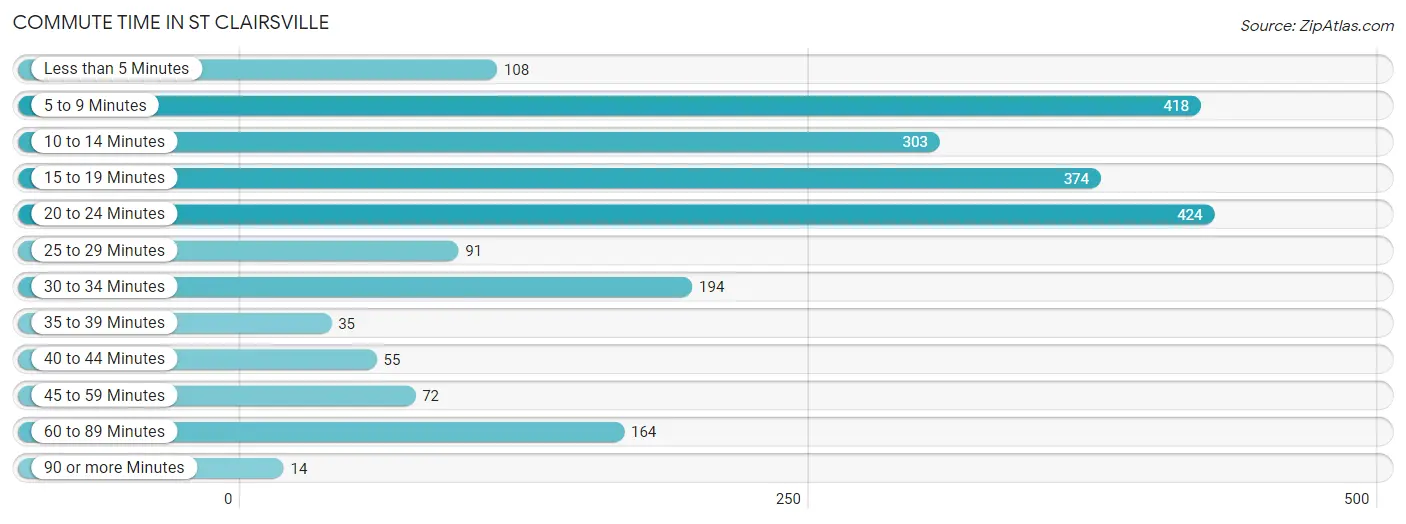
| Commute Time | # Commuters | % Commuters |
| Less than 5 Minutes | 108 | 4.8% |
| 5 to 9 Minutes | 418 | 18.6% |
| 10 to 14 Minutes | 303 | 13.5% |
| 15 to 19 Minutes | 374 | 16.6% |
| 20 to 24 Minutes | 424 | 18.8% |
| 25 to 29 Minutes | 91 | 4.0% |
| 30 to 34 Minutes | 194 | 8.6% |
| 35 to 39 Minutes | 35 | 1.5% |
| 40 to 44 Minutes | 55 | 2.4% |
| 45 to 59 Minutes | 72 | 3.2% |
| 60 to 89 Minutes | 164 | 7.3% |
| 90 or more Minutes | 14 | 0.6% |
Commute Time by Sex in St Clairsville
The most common commute times in St Clairsville are 5 to 9 minutes (256 commuters, 19.0%) for males and 20 to 24 minutes (190 commuters, 21.0%) for females.
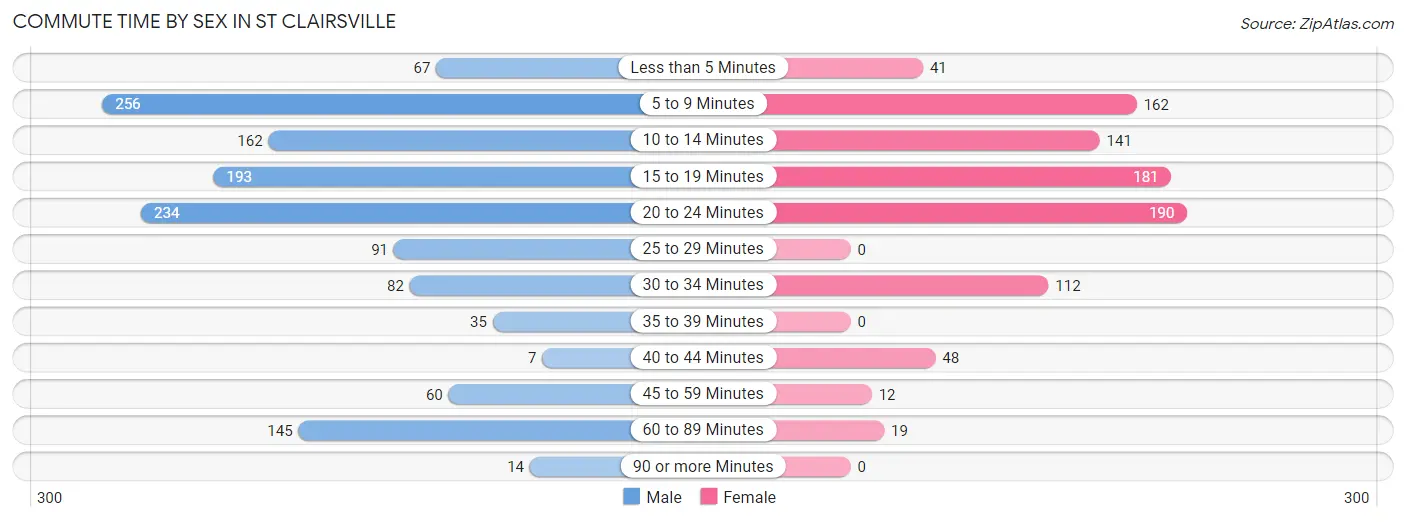
| Commute Time | Male | Female |
| Less than 5 Minutes | 67 (5.0%) | 41 (4.5%) |
| 5 to 9 Minutes | 256 (19.0%) | 162 (17.9%) |
| 10 to 14 Minutes | 162 (12.0%) | 141 (15.6%) |
| 15 to 19 Minutes | 193 (14.3%) | 181 (20.0%) |
| 20 to 24 Minutes | 234 (17.4%) | 190 (21.0%) |
| 25 to 29 Minutes | 91 (6.8%) | 0 (0.0%) |
| 30 to 34 Minutes | 82 (6.1%) | 112 (12.4%) |
| 35 to 39 Minutes | 35 (2.6%) | 0 (0.0%) |
| 40 to 44 Minutes | 7 (0.5%) | 48 (5.3%) |
| 45 to 59 Minutes | 60 (4.5%) | 12 (1.3%) |
| 60 to 89 Minutes | 145 (10.8%) | 19 (2.1%) |
| 90 or more Minutes | 14 (1.0%) | 0 (0.0%) |
Time of Departure to Work by Sex in St Clairsville
The most frequent times of departure to work in St Clairsville are 8:00 AM to 8:29 AM (343, 25.5%) for males and 6:30 AM to 6:59 AM (128, 14.1%) for females.
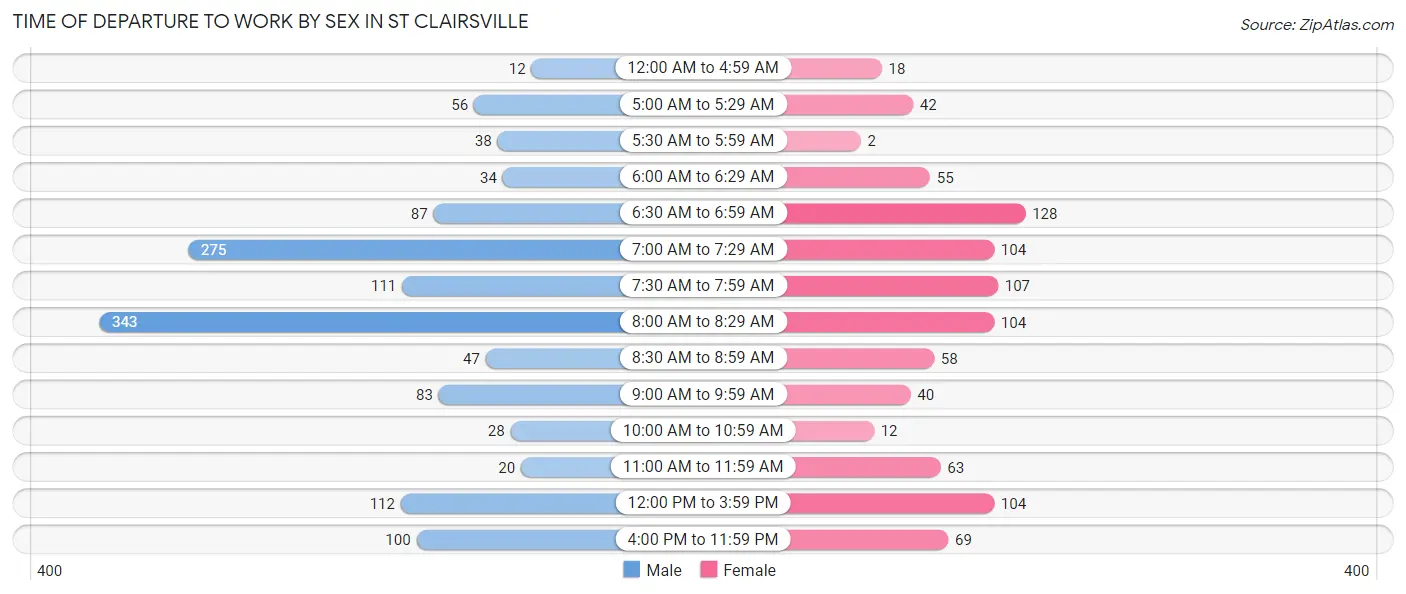
| Time of Departure | Male | Female |
| 12:00 AM to 4:59 AM | 12 (0.9%) | 18 (2.0%) |
| 5:00 AM to 5:29 AM | 56 (4.2%) | 42 (4.6%) |
| 5:30 AM to 5:59 AM | 38 (2.8%) | 2 (0.2%) |
| 6:00 AM to 6:29 AM | 34 (2.5%) | 55 (6.1%) |
| 6:30 AM to 6:59 AM | 87 (6.5%) | 128 (14.1%) |
| 7:00 AM to 7:29 AM | 275 (20.4%) | 104 (11.5%) |
| 7:30 AM to 7:59 AM | 111 (8.3%) | 107 (11.8%) |
| 8:00 AM to 8:29 AM | 343 (25.5%) | 104 (11.5%) |
| 8:30 AM to 8:59 AM | 47 (3.5%) | 58 (6.4%) |
| 9:00 AM to 9:59 AM | 83 (6.2%) | 40 (4.4%) |
| 10:00 AM to 10:59 AM | 28 (2.1%) | 12 (1.3%) |
| 11:00 AM to 11:59 AM | 20 (1.5%) | 63 (7.0%) |
| 12:00 PM to 3:59 PM | 112 (8.3%) | 104 (11.5%) |
| 4:00 PM to 11:59 PM | 100 (7.4%) | 69 (7.6%) |
| Total | 1,346 (100.0%) | 906 (100.0%) |
Housing Occupancy in St Clairsville
Occupancy by Ownership in St Clairsville
Of the total 2,067 dwellings in St Clairsville, owner-occupied units account for 1,470 (71.1%), while renter-occupied units make up 597 (28.9%).
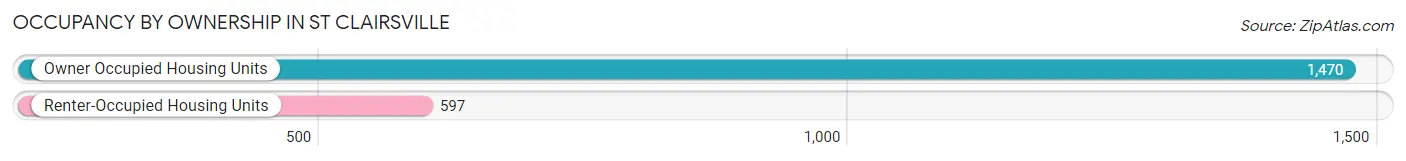
| Occupancy | # Housing Units | % Housing Units |
| Owner Occupied Housing Units | 1,470 | 71.1% |
| Renter-Occupied Housing Units | 597 | 28.9% |
| Total Occupied Housing Units | 2,067 | 100.0% |
Occupancy by Household Size in St Clairsville
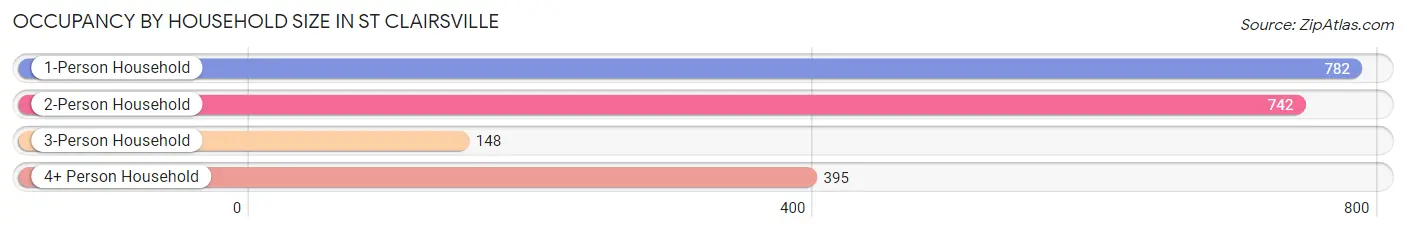
| Household Size | # Housing Units | % Housing Units |
| 1-Person Household | 782 | 37.8% |
| 2-Person Household | 742 | 35.9% |
| 3-Person Household | 148 | 7.2% |
| 4+ Person Household | 395 | 19.1% |
| Total Housing Units | 2,067 | 100.0% |
Occupancy by Ownership by Household Size in St Clairsville
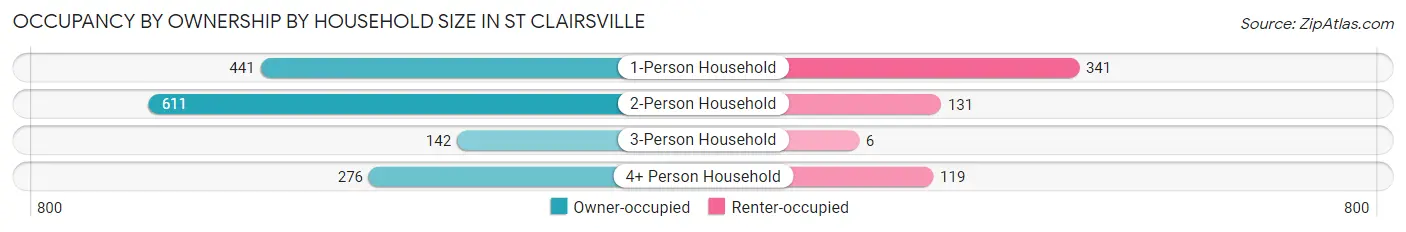
| Household Size | Owner-occupied | Renter-occupied |
| 1-Person Household | 441 (56.4%) | 341 (43.6%) |
| 2-Person Household | 611 (82.4%) | 131 (17.6%) |
| 3-Person Household | 142 (96.0%) | 6 (4.1%) |
| 4+ Person Household | 276 (69.9%) | 119 (30.1%) |
| Total Housing Units | 1,470 (71.1%) | 597 (28.9%) |
Occupancy by Educational Attainment in St Clairsville
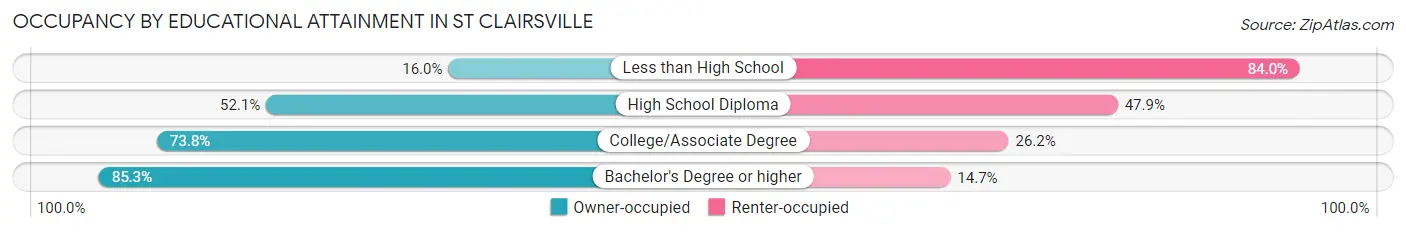
| Household Size | Owner-occupied | Renter-occupied |
| Less than High School | 12 (16.0%) | 63 (84.0%) |
| High School Diploma | 272 (52.1%) | 250 (47.9%) |
| College/Associate Degree | 433 (73.8%) | 154 (26.2%) |
| Bachelor's Degree or higher | 753 (85.3%) | 130 (14.7%) |
Occupancy by Age of Householder in St Clairsville
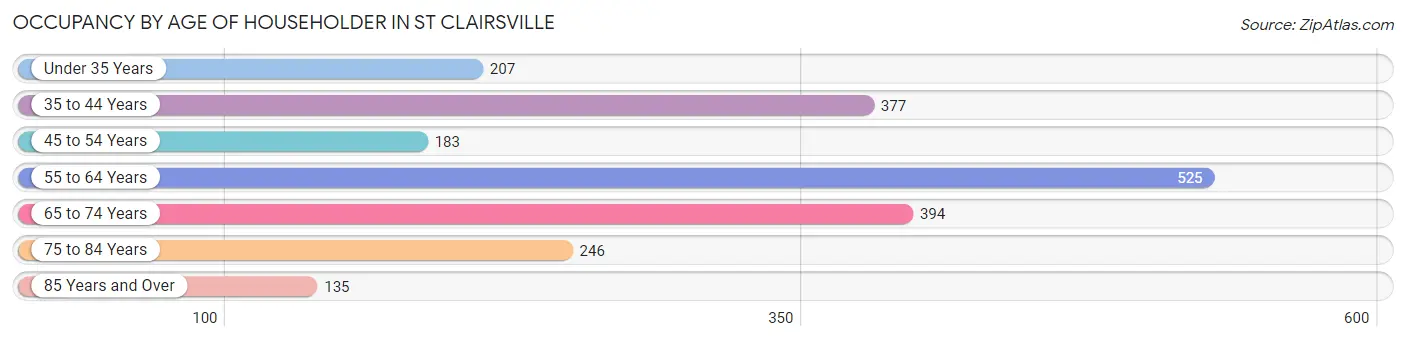
| Age Bracket | # Households | % Households |
| Under 35 Years | 207 | 10.0% |
| 35 to 44 Years | 377 | 18.2% |
| 45 to 54 Years | 183 | 8.8% |
| 55 to 64 Years | 525 | 25.4% |
| 65 to 74 Years | 394 | 19.1% |
| 75 to 84 Years | 246 | 11.9% |
| 85 Years and Over | 135 | 6.5% |
| Total | 2,067 | 100.0% |
Housing Finances in St Clairsville
Median Income by Occupancy in St Clairsville
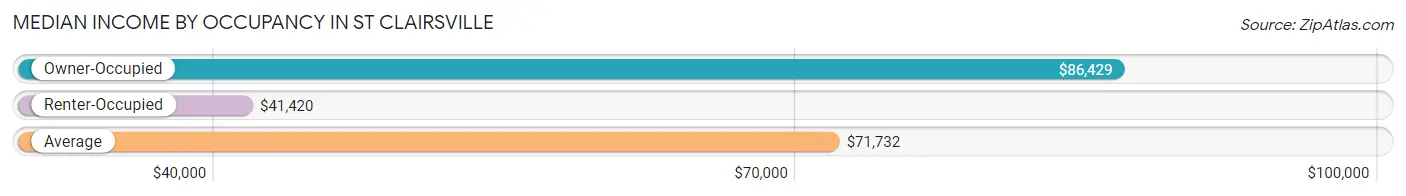
| Occupancy Type | # Households | Median Income |
| Owner-Occupied | 1,470 (71.1%) | $86,429 |
| Renter-Occupied | 597 (28.9%) | $41,420 |
| Average | 2,067 (100.0%) | $71,732 |
Occupancy by Householder Income Bracket in St Clairsville
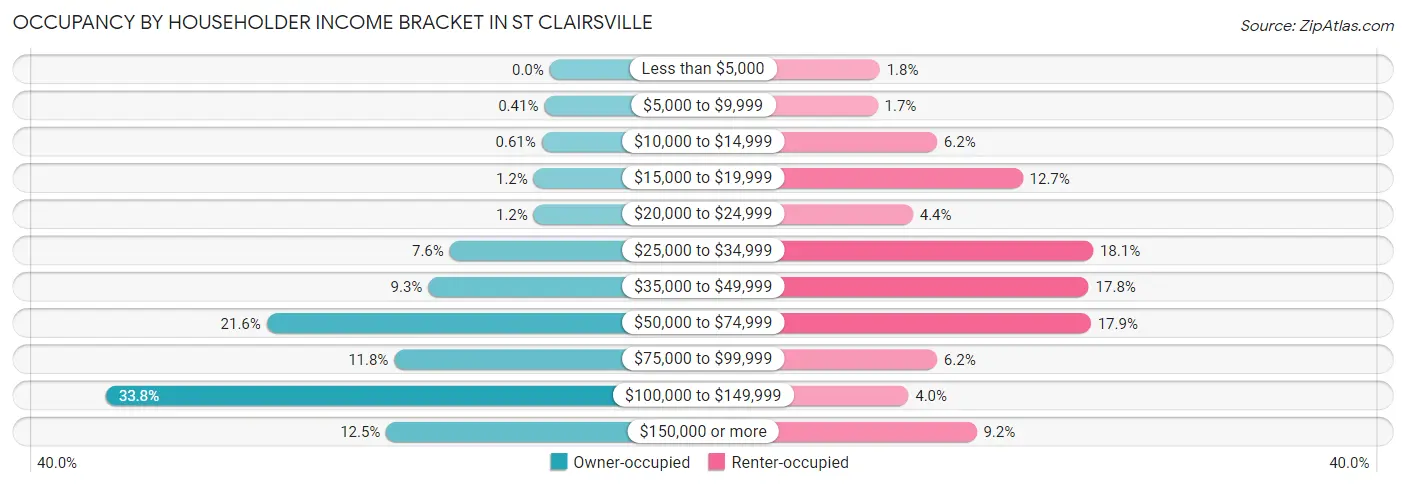
| Income Bracket | Owner-occupied | Renter-occupied |
| Less than $5,000 | 0 (0.0%) | 11 (1.8%) |
| $5,000 to $9,999 | 6 (0.4%) | 10 (1.7%) |
| $10,000 to $14,999 | 9 (0.6%) | 37 (6.2%) |
| $15,000 to $19,999 | 18 (1.2%) | 76 (12.7%) |
| $20,000 to $24,999 | 18 (1.2%) | 26 (4.4%) |
| $25,000 to $34,999 | 112 (7.6%) | 108 (18.1%) |
| $35,000 to $49,999 | 136 (9.2%) | 106 (17.8%) |
| $50,000 to $74,999 | 317 (21.6%) | 107 (17.9%) |
| $75,000 to $99,999 | 174 (11.8%) | 37 (6.2%) |
| $100,000 to $149,999 | 497 (33.8%) | 24 (4.0%) |
| $150,000 or more | 183 (12.4%) | 55 (9.2%) |
| Total | 1,470 (100.0%) | 597 (100.0%) |
Monthly Housing Cost Tiers in St Clairsville
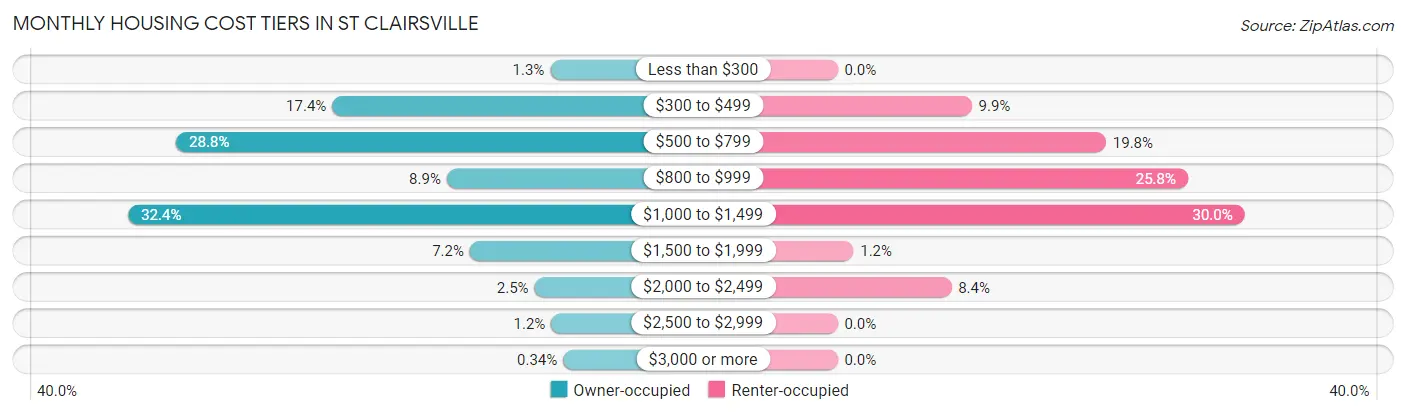
| Monthly Cost | Owner-occupied | Renter-occupied |
| Less than $300 | 19 (1.3%) | 0 (0.0%) |
| $300 to $499 | 255 (17.3%) | 59 (9.9%) |
| $500 to $799 | 424 (28.8%) | 118 (19.8%) |
| $800 to $999 | 131 (8.9%) | 154 (25.8%) |
| $1,000 to $1,499 | 476 (32.4%) | 179 (30.0%) |
| $1,500 to $1,999 | 106 (7.2%) | 7 (1.2%) |
| $2,000 to $2,499 | 36 (2.5%) | 50 (8.4%) |
| $2,500 to $2,999 | 18 (1.2%) | 0 (0.0%) |
| $3,000 or more | 5 (0.3%) | 0 (0.0%) |
| Total | 1,470 (100.0%) | 597 (100.0%) |
Physical Housing Characteristics in St Clairsville
Housing Structures in St Clairsville
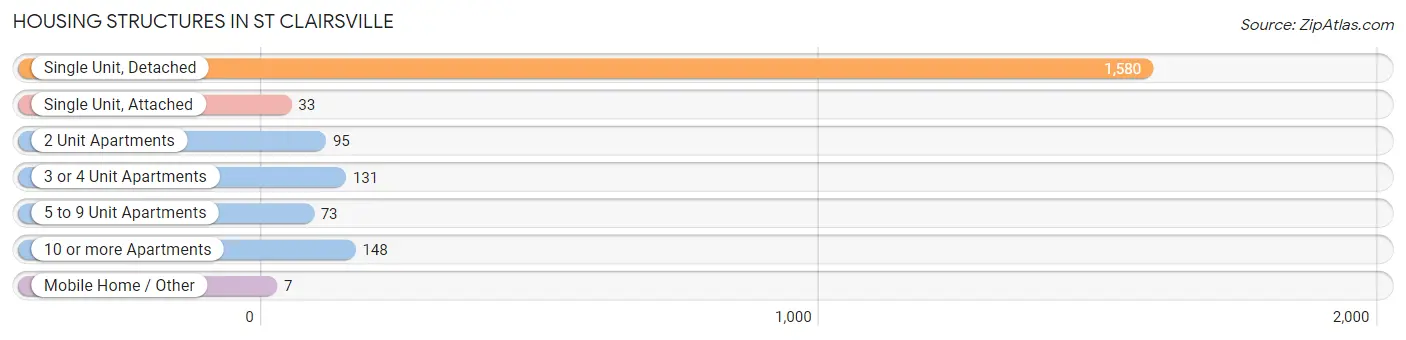
| Structure Type | # Housing Units | % Housing Units |
| Single Unit, Detached | 1,580 | 76.4% |
| Single Unit, Attached | 33 | 1.6% |
| 2 Unit Apartments | 95 | 4.6% |
| 3 or 4 Unit Apartments | 131 | 6.3% |
| 5 to 9 Unit Apartments | 73 | 3.5% |
| 10 or more Apartments | 148 | 7.2% |
| Mobile Home / Other | 7 | 0.3% |
| Total | 2,067 | 100.0% |
Housing Structures by Occupancy in St Clairsville
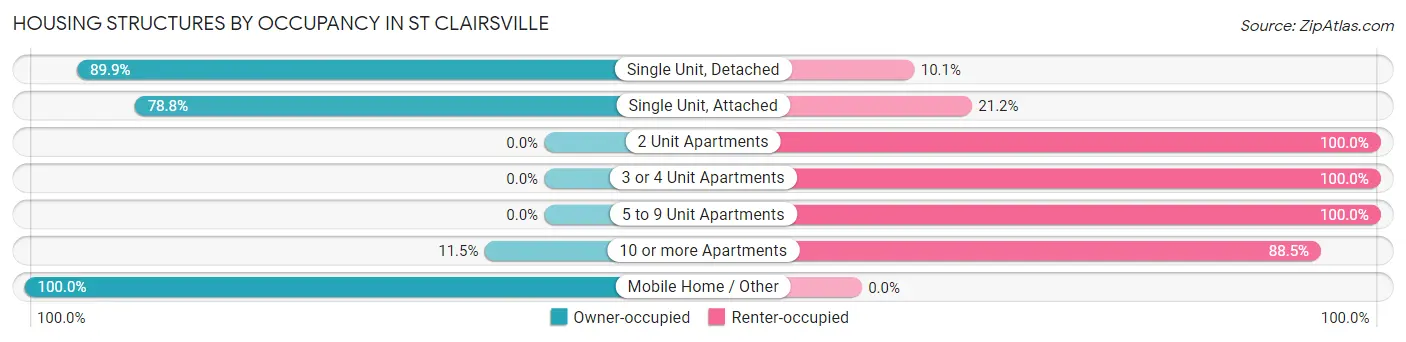
| Structure Type | Owner-occupied | Renter-occupied |
| Single Unit, Detached | 1,420 (89.9%) | 160 (10.1%) |
| Single Unit, Attached | 26 (78.8%) | 7 (21.2%) |
| 2 Unit Apartments | 0 (0.0%) | 95 (100.0%) |
| 3 or 4 Unit Apartments | 0 (0.0%) | 131 (100.0%) |
| 5 to 9 Unit Apartments | 0 (0.0%) | 73 (100.0%) |
| 10 or more Apartments | 17 (11.5%) | 131 (88.5%) |
| Mobile Home / Other | 7 (100.0%) | 0 (0.0%) |
| Total | 1,470 (71.1%) | 597 (28.9%) |
Housing Structures by Number of Rooms in St Clairsville
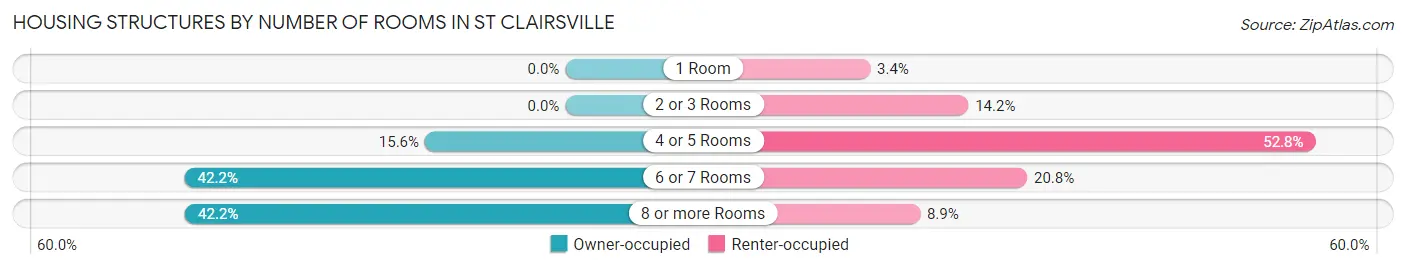
| Number of Rooms | Owner-occupied | Renter-occupied |
| 1 Room | 0 (0.0%) | 20 (3.4%) |
| 2 or 3 Rooms | 0 (0.0%) | 85 (14.2%) |
| 4 or 5 Rooms | 229 (15.6%) | 315 (52.8%) |
| 6 or 7 Rooms | 621 (42.2%) | 124 (20.8%) |
| 8 or more Rooms | 620 (42.2%) | 53 (8.9%) |
| Total | 1,470 (100.0%) | 597 (100.0%) |
Housing Structure by Heating Type in St Clairsville
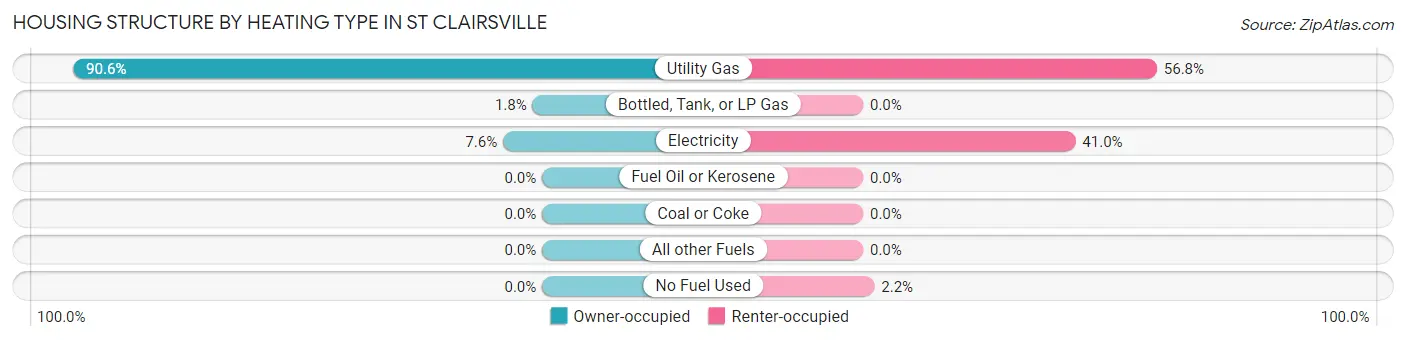
| Heating Type | Owner-occupied | Renter-occupied |
| Utility Gas | 1,332 (90.6%) | 339 (56.8%) |
| Bottled, Tank, or LP Gas | 27 (1.8%) | 0 (0.0%) |
| Electricity | 111 (7.5%) | 245 (41.0%) |
| Fuel Oil or Kerosene | 0 (0.0%) | 0 (0.0%) |
| Coal or Coke | 0 (0.0%) | 0 (0.0%) |
| All other Fuels | 0 (0.0%) | 0 (0.0%) |
| No Fuel Used | 0 (0.0%) | 13 (2.2%) |
| Total | 1,470 (100.0%) | 597 (100.0%) |
Household Vehicle Usage in St Clairsville
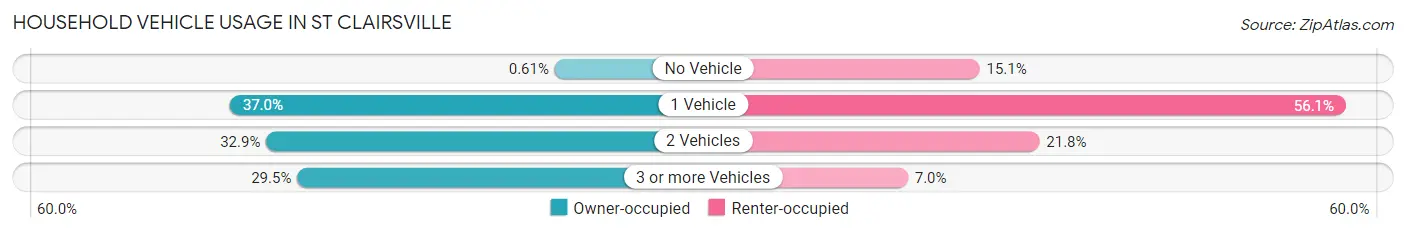
| Vehicles per Household | Owner-occupied | Renter-occupied |
| No Vehicle | 9 (0.6%) | 90 (15.1%) |
| 1 Vehicle | 544 (37.0%) | 335 (56.1%) |
| 2 Vehicles | 484 (32.9%) | 130 (21.8%) |
| 3 or more Vehicles | 433 (29.5%) | 42 (7.0%) |
| Total | 1,470 (100.0%) | 597 (100.0%) |
Real Estate & Mortgages in St Clairsville
Real Estate and Mortgage Overview in St Clairsville
| Characteristic | Without Mortgage | With Mortgage |
| Housing Units | 673 | 797 |
| Median Property Value | $210,200 | $176,700 |
| Median Household Income | $87,734 | $115 |
| Monthly Housing Costs | $531 | $5 |
| Real Estate Taxes | $2,430 | $0 |
Property Value by Mortgage Status in St Clairsville
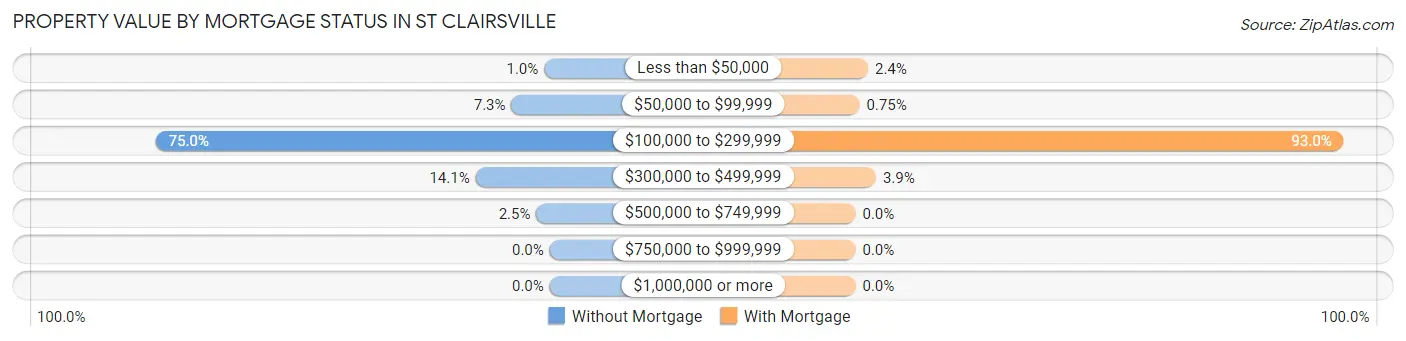
| Property Value | Without Mortgage | With Mortgage |
| Less than $50,000 | 7 (1.0%) | 19 (2.4%) |
| $50,000 to $99,999 | 49 (7.3%) | 6 (0.7%) |
| $100,000 to $299,999 | 505 (75.0%) | 741 (93.0%) |
| $300,000 to $499,999 | 95 (14.1%) | 31 (3.9%) |
| $500,000 to $749,999 | 17 (2.5%) | 0 (0.0%) |
| $750,000 to $999,999 | 0 (0.0%) | 0 (0.0%) |
| $1,000,000 or more | 0 (0.0%) | 0 (0.0%) |
| Total | 673 (100.0%) | 797 (100.0%) |
Household Income by Mortgage Status in St Clairsville
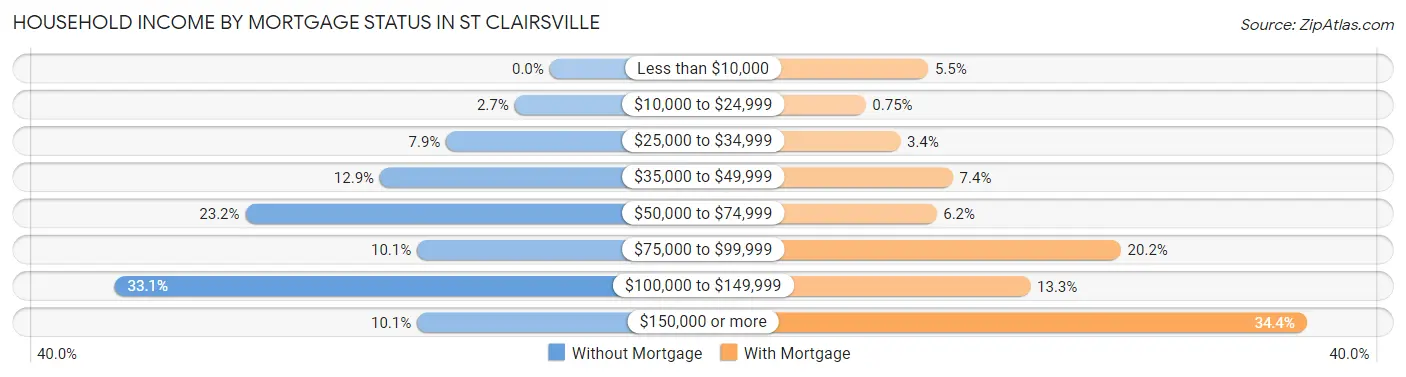
| Household Income | Without Mortgage | With Mortgage |
| Less than $10,000 | 0 (0.0%) | 44 (5.5%) |
| $10,000 to $24,999 | 18 (2.7%) | 6 (0.7%) |
| $25,000 to $34,999 | 53 (7.9%) | 27 (3.4%) |
| $35,000 to $49,999 | 87 (12.9%) | 59 (7.4%) |
| $50,000 to $74,999 | 156 (23.2%) | 49 (6.1%) |
| $75,000 to $99,999 | 68 (10.1%) | 161 (20.2%) |
| $100,000 to $149,999 | 223 (33.1%) | 106 (13.3%) |
| $150,000 or more | 68 (10.1%) | 274 (34.4%) |
| Total | 673 (100.0%) | 797 (100.0%) |
Property Value to Household Income Ratio in St Clairsville
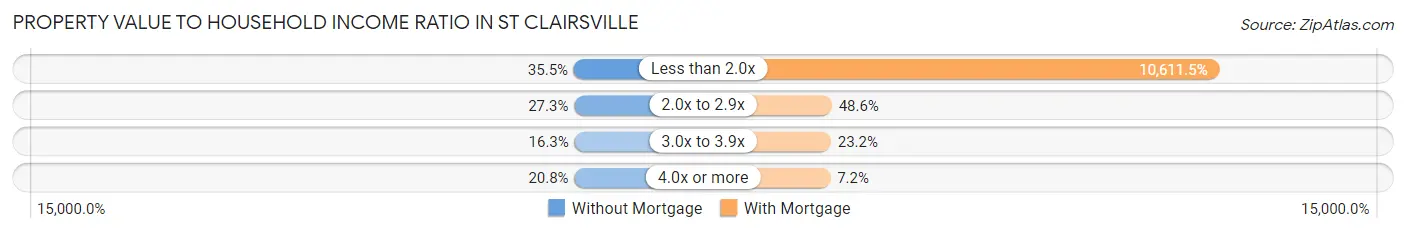
| Value-to-Income Ratio | Without Mortgage | With Mortgage |
| Less than 2.0x | 239 (35.5%) | 84,574 (10,611.5%) |
| 2.0x to 2.9x | 184 (27.3%) | 387 (48.6%) |
| 3.0x to 3.9x | 110 (16.3%) | 185 (23.2%) |
| 4.0x or more | 140 (20.8%) | 57 (7.1%) |
| Total | 673 (100.0%) | 797 (100.0%) |
Real Estate Taxes by Mortgage Status in St Clairsville
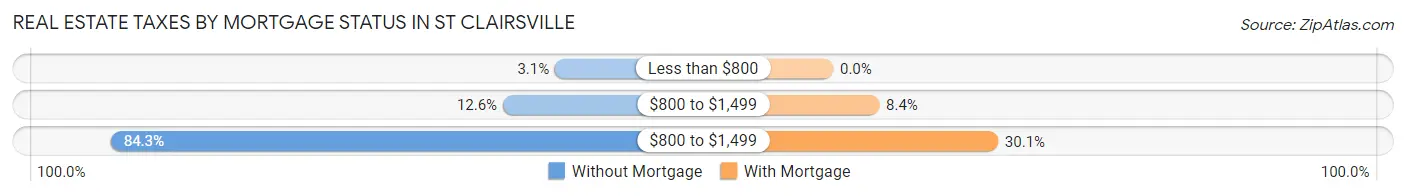
| Property Taxes | Without Mortgage | With Mortgage |
| Less than $800 | 21 (3.1%) | 0 (0.0%) |
| $800 to $1,499 | 85 (12.6%) | 67 (8.4%) |
| $800 to $1,499 | 567 (84.3%) | 240 (30.1%) |
| Total | 673 (100.0%) | 797 (100.0%) |
Health & Disability in St Clairsville
Health Insurance Coverage by Age in St Clairsville
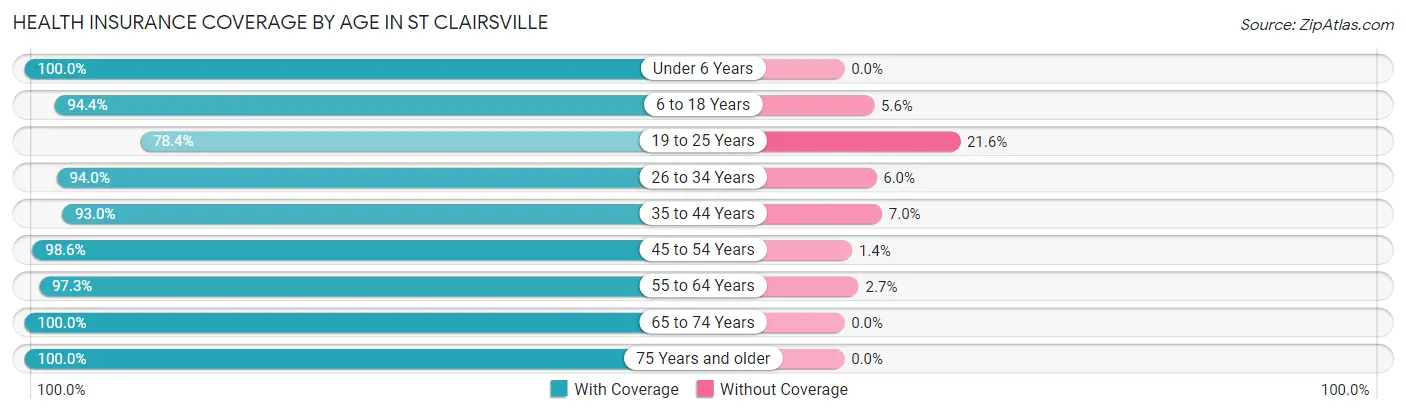
| Age Bracket | With Coverage | Without Coverage |
| Under 6 Years | 227 (100.0%) | 0 (0.0%) |
| 6 to 18 Years | 815 (94.4%) | 48 (5.6%) |
| 19 to 25 Years | 269 (78.4%) | 74 (21.6%) |
| 26 to 34 Years | 442 (94.0%) | 28 (6.0%) |
| 35 to 44 Years | 504 (93.0%) | 38 (7.0%) |
| 45 to 54 Years | 410 (98.6%) | 6 (1.4%) |
| 55 to 64 Years | 690 (97.3%) | 19 (2.7%) |
| 65 to 74 Years | 717 (100.0%) | 0 (0.0%) |
| 75 Years and older | 577 (100.0%) | 0 (0.0%) |
| Total | 4,651 (95.6%) | 213 (4.4%) |
Health Insurance Coverage by Citizenship Status in St Clairsville
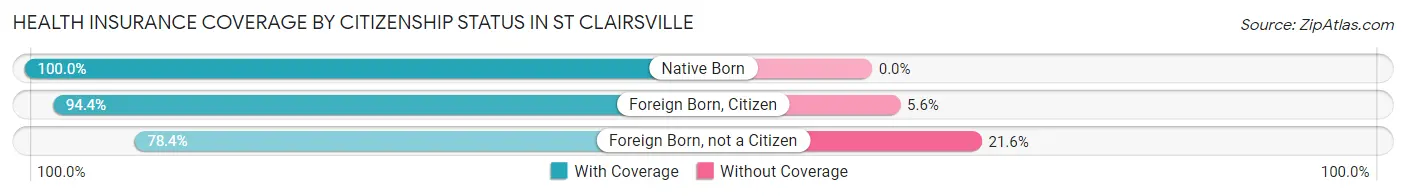
| Citizenship Status | With Coverage | Without Coverage |
| Native Born | 227 (100.0%) | 0 (0.0%) |
| Foreign Born, Citizen | 815 (94.4%) | 48 (5.6%) |
| Foreign Born, not a Citizen | 269 (78.4%) | 74 (21.6%) |
Health Insurance Coverage by Household Income in St Clairsville
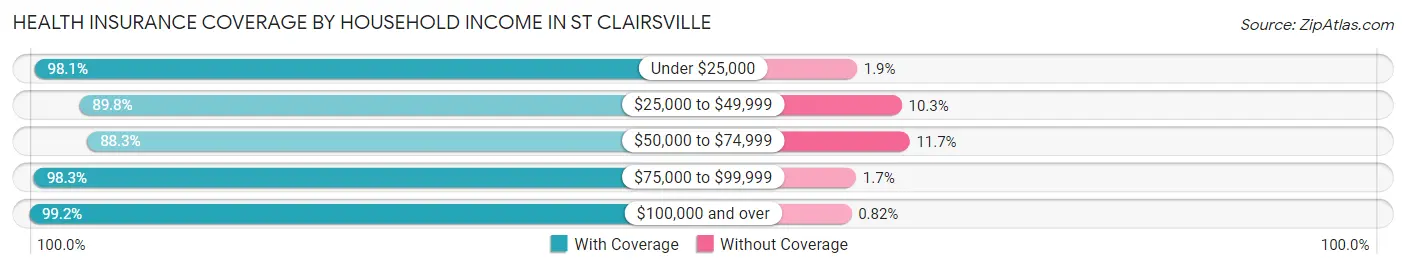
| Household Income | With Coverage | Without Coverage |
| Under $25,000 | 315 (98.1%) | 6 (1.9%) |
| $25,000 to $49,999 | 657 (89.7%) | 75 (10.2%) |
| $50,000 to $74,999 | 782 (88.3%) | 104 (11.7%) |
| $75,000 to $99,999 | 461 (98.3%) | 8 (1.7%) |
| $100,000 and over | 2,428 (99.2%) | 20 (0.8%) |
Public vs Private Health Insurance Coverage by Age in St Clairsville
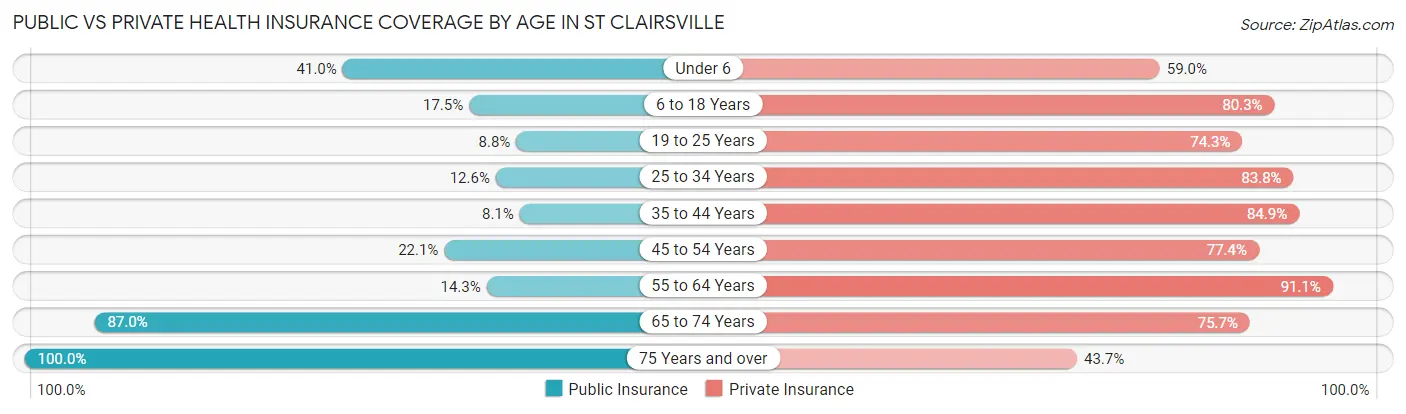
| Age Bracket | Public Insurance | Private Insurance |
| Under 6 | 93 (41.0%) | 134 (59.0%) |
| 6 to 18 Years | 151 (17.5%) | 693 (80.3%) |
| 19 to 25 Years | 30 (8.7%) | 255 (74.3%) |
| 25 to 34 Years | 59 (12.6%) | 394 (83.8%) |
| 35 to 44 Years | 44 (8.1%) | 460 (84.9%) |
| 45 to 54 Years | 92 (22.1%) | 322 (77.4%) |
| 55 to 64 Years | 101 (14.2%) | 646 (91.1%) |
| 65 to 74 Years | 624 (87.0%) | 543 (75.7%) |
| 75 Years and over | 577 (100.0%) | 252 (43.7%) |
| Total | 1,771 (36.4%) | 3,699 (76.0%) |
Disability Status by Sex by Age in St Clairsville
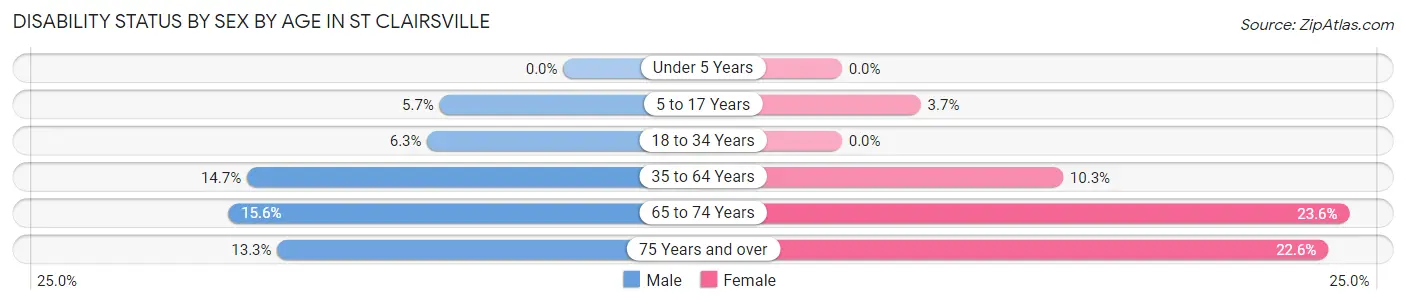
| Age Bracket | Male | Female |
| Under 5 Years | 0 (0.0%) | 0 (0.0%) |
| 5 to 17 Years | 24 (5.7%) | 10 (3.7%) |
| 18 to 34 Years | 40 (6.3%) | 0 (0.0%) |
| 35 to 64 Years | 116 (14.7%) | 90 (10.3%) |
| 65 to 74 Years | 58 (15.5%) | 81 (23.5%) |
| 75 Years and over | 26 (13.3%) | 86 (22.6%) |
Disability Class by Sex by Age in St Clairsville
Disability Class: Hearing Difficulty
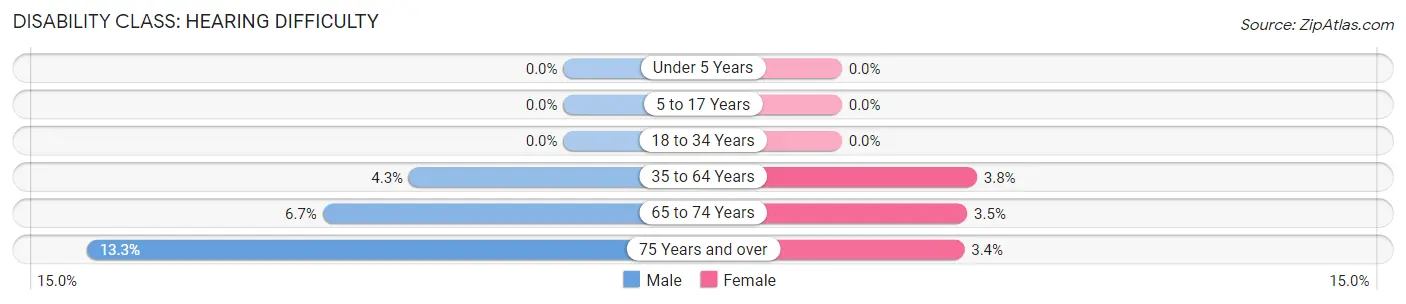
| Age Bracket | Male | Female |
| Under 5 Years | 0 (0.0%) | 0 (0.0%) |
| 5 to 17 Years | 0 (0.0%) | 0 (0.0%) |
| 18 to 34 Years | 0 (0.0%) | 0 (0.0%) |
| 35 to 64 Years | 34 (4.3%) | 33 (3.8%) |
| 65 to 74 Years | 25 (6.7%) | 12 (3.5%) |
| 75 Years and over | 26 (13.3%) | 13 (3.4%) |
Disability Class: Vision Difficulty
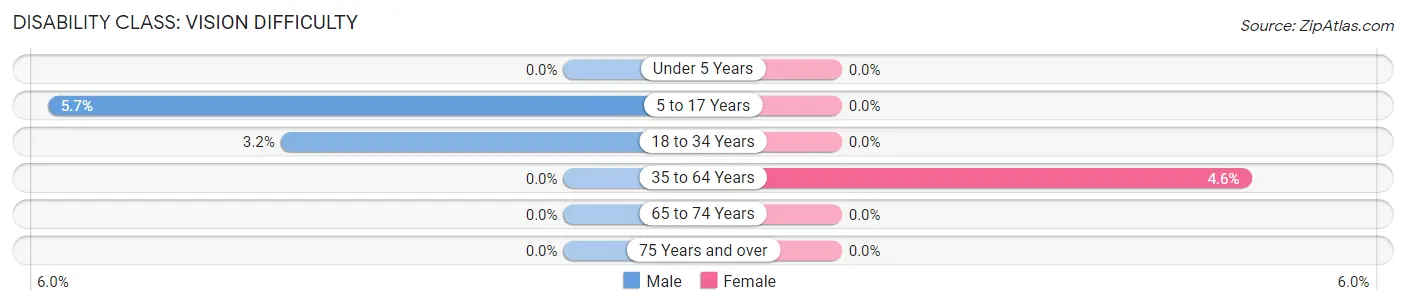
| Age Bracket | Male | Female |
| Under 5 Years | 0 (0.0%) | 0 (0.0%) |
| 5 to 17 Years | 24 (5.7%) | 0 (0.0%) |
| 18 to 34 Years | 20 (3.2%) | 0 (0.0%) |
| 35 to 64 Years | 0 (0.0%) | 40 (4.6%) |
| 65 to 74 Years | 0 (0.0%) | 0 (0.0%) |
| 75 Years and over | 0 (0.0%) | 0 (0.0%) |
Disability Class: Cognitive Difficulty
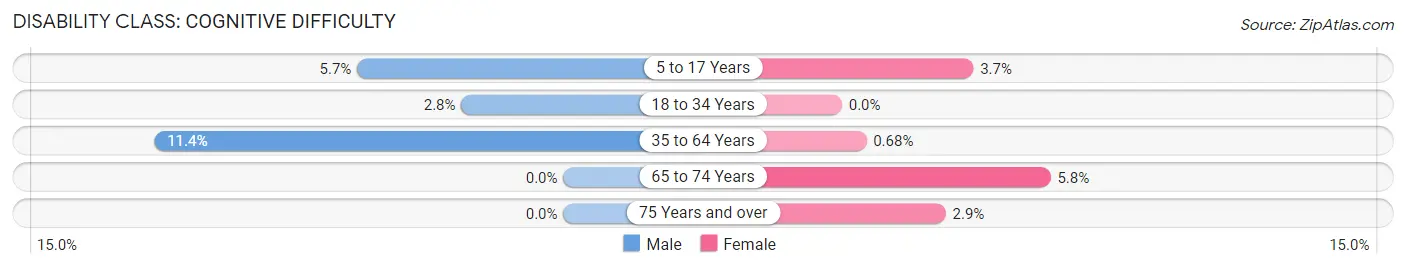
| Age Bracket | Male | Female |
| 5 to 17 Years | 24 (5.7%) | 10 (3.7%) |
| 18 to 34 Years | 18 (2.8%) | 0 (0.0%) |
| 35 to 64 Years | 90 (11.4%) | 6 (0.7%) |
| 65 to 74 Years | 0 (0.0%) | 20 (5.8%) |
| 75 Years and over | 0 (0.0%) | 11 (2.9%) |
Disability Class: Ambulatory Difficulty
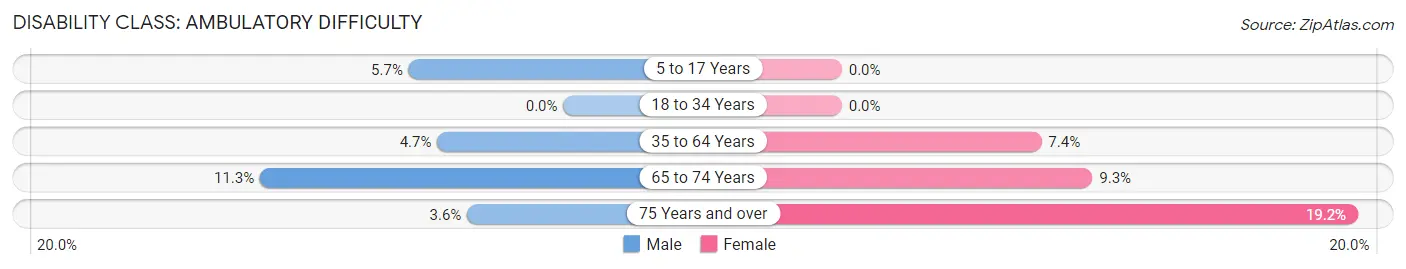
| Age Bracket | Male | Female |
| 5 to 17 Years | 24 (5.7%) | 0 (0.0%) |
| 18 to 34 Years | 0 (0.0%) | 0 (0.0%) |
| 35 to 64 Years | 37 (4.7%) | 65 (7.4%) |
| 65 to 74 Years | 42 (11.3%) | 32 (9.3%) |
| 75 Years and over | 7 (3.6%) | 73 (19.2%) |
Disability Class: Self-Care Difficulty
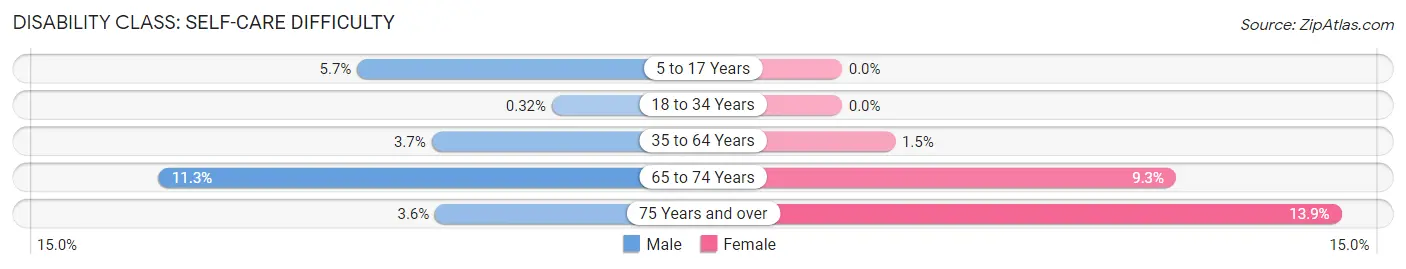
| Age Bracket | Male | Female |
| 5 to 17 Years | 24 (5.7%) | 0 (0.0%) |
| 18 to 34 Years | 2 (0.3%) | 0 (0.0%) |
| 35 to 64 Years | 29 (3.7%) | 13 (1.5%) |
| 65 to 74 Years | 42 (11.3%) | 32 (9.3%) |
| 75 Years and over | 7 (3.6%) | 53 (13.9%) |
Technology Access in St Clairsville
Computing Device Access in St Clairsville
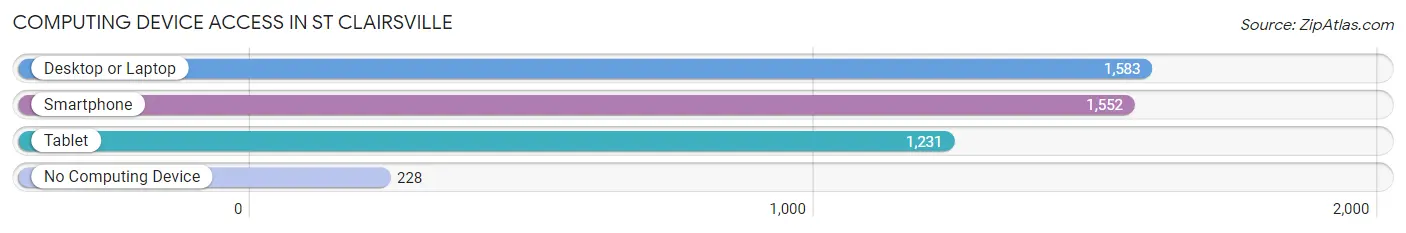
| Device Type | # Households | % Households |
| Desktop or Laptop | 1,583 | 76.6% |
| Smartphone | 1,552 | 75.1% |
| Tablet | 1,231 | 59.6% |
| No Computing Device | 228 | 11.0% |
| Total | 2,067 | 100.0% |
Internet Access in St Clairsville
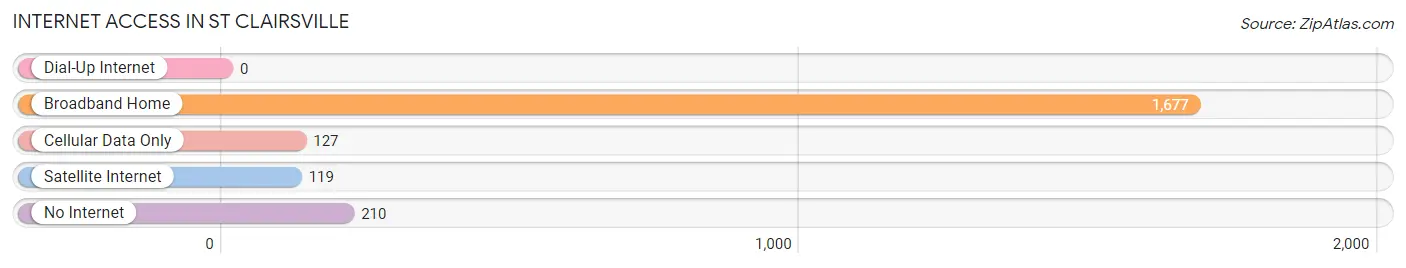
| Internet Type | # Households | % Households |
| Dial-Up Internet | 0 | 0.0% |
| Broadband Home | 1,677 | 81.1% |
| Cellular Data Only | 127 | 6.1% |
| Satellite Internet | 119 | 5.8% |
| No Internet | 210 | 10.2% |
| Total | 2,067 | 100.0% |
St Clairsville Summary
St. Clairsville is a city located in Belmont County, Ohio, United States. It is the county seat of Belmont County and is located along the Ohio River. The population was 5,184 at the 2010 census.
History
St. Clairsville was founded in 1796 by Colonel Samuel Mason, who named it after General Arthur St. Clair, the first governor of the Northwest Territory. The town was laid out in 1797 and incorporated in 1802.
St. Clairsville was an important stop on the National Road, which was the first federally funded highway in the United States. The road was built in the early 19th century to connect the eastern states with the western states. The National Road ran through St. Clairsville until the completion of the Ohio Turnpike in the 1950s.
Geography
St Clairsville is located at 39 54 25 North 81 7 25 West 39 906833 81 123611
According to the United States Census Bureau, the city has a total area of 4.2 square miles (10.8 km2), of which 4.1 square miles (10.6 km2) is land and 0.1 square miles (0.2 km2) is water.
Economy
St. Clairsville is home to several large employers, including the Ohio Valley Mall, Ohio Valley Medical Center, and the Belmont County Courthouse. The city is also home to several small businesses, including restaurants, retail stores, and professional services.
The city is served by the Ohio Valley Regional Airport, which is located just outside of town. The airport offers commercial flights to several major cities in the region.
Demographics
As of the census of 2010, there were 5,184 people, 2,093 households, and 1,364 families residing in the city. The population density was 1,258.3 people per square mile (486.2/km2). There were 2,309 housing units at an average density of 563.3 per square mile (217.7/km2). The racial makeup of the city was 97.2% White, 0.7% African American, 0.2% Native American, 0.4% Asian, 0.2% from other races, and 1.3% from two or more races. Hispanic or Latino of any race were 0.9% of the population.
There were 2,093 households, out of which 28.2% had children under the age of 18 living with them, 47.2% were married couples living together, 13.2% had a female householder with no husband present, and 35.2% were non-families. 30.3% of all households were made up of individuals, and 14.2% had someone living alone who was 65 years of age or older. The average household size was 2.41 and the average family size was 2.99.
In the city, the population was spread out, with 23.2% under the age of 18, 8.2% from 18 to 24, 27.2% from 25 to 44, 24.2% from 45 to 64, and 17.2% who were 65 years of age or older. The median age was 38 years. For every 100 females, there were 91.2 males. For every 100 females age 18 and over, there were 87.3 males.
The median income for a household in the city was $35,938, and the median income for a family was $45,938. Males had a median income of $35,938 versus $25,938 for females. The per capita income for the city was $19,938. About 8.2% of families and 10.2% of the population were below the poverty line, including 14.2% of those under age 18 and 8.2% of those age 65 or over.
Common Questions
What is Per Capita Income in St Clairsville?
Per Capita income in St Clairsville is $37,739.
What is the Median Family Income in St Clairsville?
Median Family Income in St Clairsville is $105,102.
What is the Median Household income in St Clairsville?
Median Household Income in St Clairsville is $71,732.
What is Income or Wage Gap in St Clairsville?
Income or Wage Gap in St Clairsville is 35.0%.
Women in St Clairsville earn 65.0 cents for every dollar earned by a man.
What is Inequality or Gini Index in St Clairsville?
Inequality or Gini Index in St Clairsville is 0.38.
What is the Total Population of St Clairsville?
Total Population of St Clairsville is 5,085.
What is the Total Male Population of St Clairsville?
Total Male Population of St Clairsville is 2,635.
What is the Total Female Population of St Clairsville?
Total Female Population of St Clairsville is 2,450.
What is the Ratio of Males per 100 Females in St Clairsville?
There are 107.55 Males per 100 Females in St Clairsville.
What is the Ratio of Females per 100 Males in St Clairsville?
There are 92.98 Females per 100 Males in St Clairsville.
What is the Median Population Age in St Clairsville?
Median Population Age in St Clairsville is 48.5 Years.
What is the Average Family Size in St Clairsville
Average Family Size in St Clairsville is 3.1 People.
What is the Average Household Size in St Clairsville
Average Household Size in St Clairsville is 2.4 People.
How Large is the Labor Force in St Clairsville?
There are 2,489 People in the Labor Forcein in St Clairsville.
What is the Percentage of People in the Labor Force in St Clairsville?
58.4% of People are in the Labor Force in St Clairsville.
What is the Unemployment Rate in St Clairsville?
Unemployment Rate in St Clairsville is 2.9%.