Poland, OH Map & Demographics
Poland Map
Poland Overview
$43,818
PER CAPITA INCOME
$90,179
AVG FAMILY INCOME
$82,024
AVG HOUSEHOLD INCOME
48.9%
WAGE / INCOME GAP [ % ]
51.1¢/ $1
WAGE / INCOME GAP [ $ ]
0.40
INEQUALITY / GINI INDEX
2,573
TOTAL POPULATION
1,320
MALE POPULATION
1,253
FEMALE POPULATION
105.35
MALES / 100 FEMALES
94.92
FEMALES / 100 MALES
44.2
MEDIAN AGE
2.9
AVG FAMILY SIZE
2.4
AVG HOUSEHOLD SIZE
1,372
LABOR FORCE [ PEOPLE ]
66.0%
PERCENT IN LABOR FORCE
5.5%
UNEMPLOYMENT RATE
Poland Area Codes
Income in Poland
Income Overview in Poland
Per Capita Income in Poland is $43,818, while median incomes of families and households are $90,179 and $82,024 respectively.
| Characteristic | Number | Measure |
| Per Capita Income | 2,573 | $43,818 |
| Median Family Income | 708 | $90,179 |
| Mean Family Income | 708 | $109,715 |
| Median Household Income | 1,090 | $82,024 |
| Mean Household Income | 1,090 | $102,291 |
| Income Deficit | 708 | $0 |
| Wage / Income Gap (%) | 2,573 | 48.88% |
| Wage / Income Gap ($) | 2,573 | 51.12¢ per $1 |
| Gini / Inequality Index | 2,573 | 0.40 |
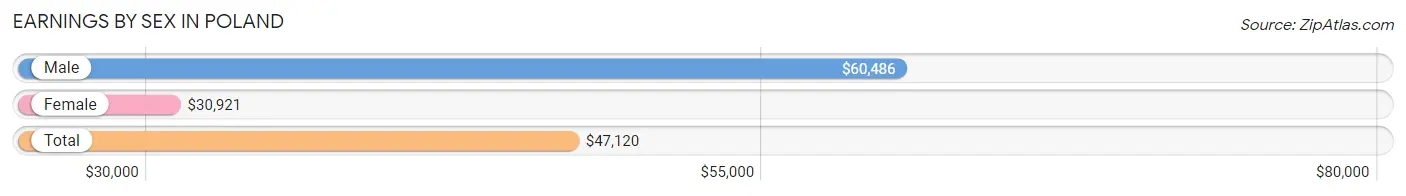
Earnings by Sex in Poland
Average Earnings in Poland are $47,120, $60,486 for men and $30,921 for women, a difference of 48.9%.
| Sex | Number | Average Earnings |
| Male | 783 (52.9%) | $60,486 |
| Female | 696 (47.1%) | $30,921 |
| Total | 1,479 (100.0%) | $47,120 |
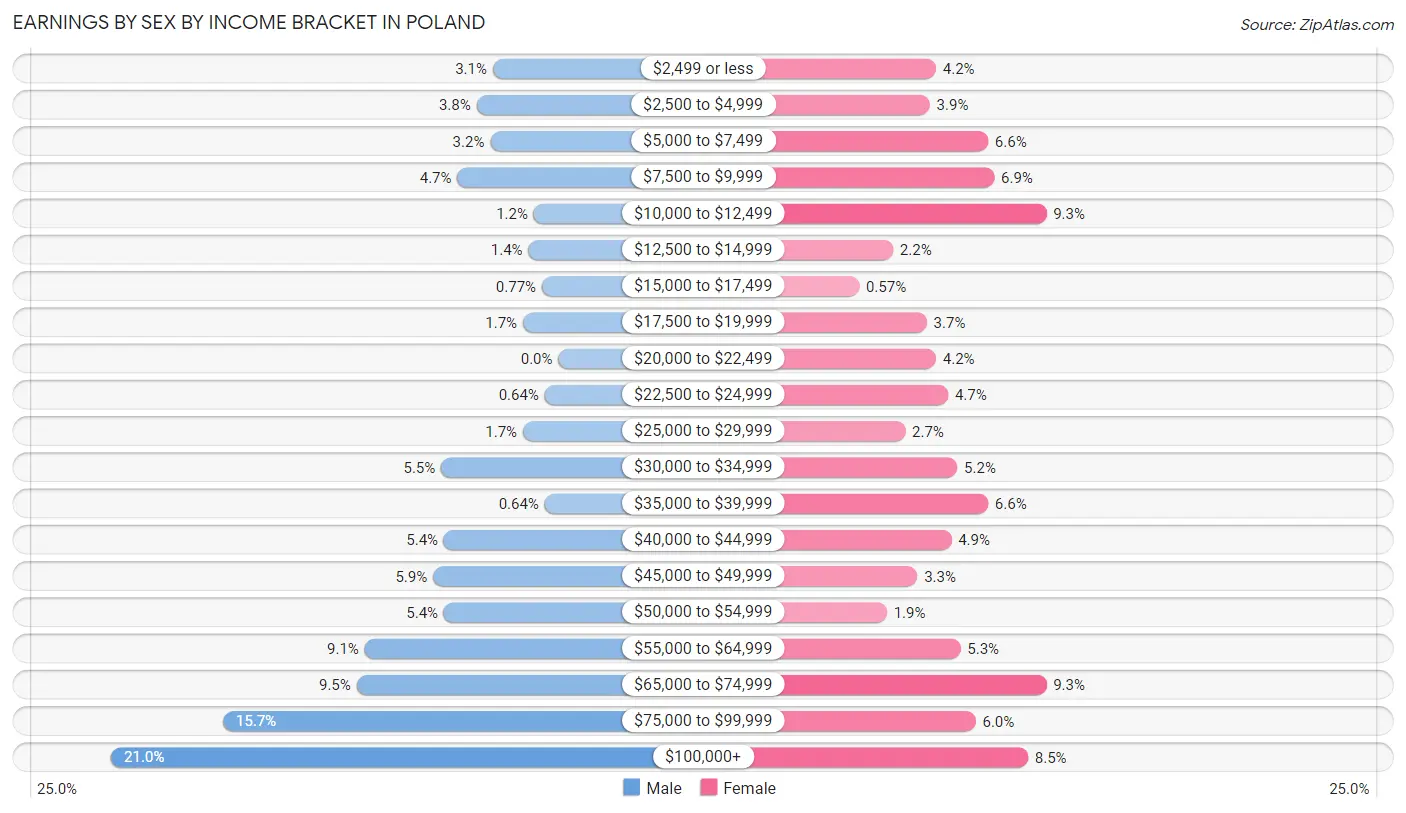
Earnings by Sex by Income Bracket in Poland
The most common earnings brackets in Poland are $100,000+ for men (164 | 20.9%) and $10,000 to $12,499 for women (65 | 9.3%).
| Income | Male | Female |
| $2,499 or less | 24 (3.1%) | 29 (4.2%) |
| $2,500 to $4,999 | 30 (3.8%) | 27 (3.9%) |
| $5,000 to $7,499 | 25 (3.2%) | 46 (6.6%) |
| $7,500 to $9,999 | 37 (4.7%) | 48 (6.9%) |
| $10,000 to $12,499 | 9 (1.1%) | 65 (9.3%) |
| $12,500 to $14,999 | 11 (1.4%) | 15 (2.2%) |
| $15,000 to $17,499 | 6 (0.8%) | 4 (0.6%) |
| $17,500 to $19,999 | 13 (1.7%) | 26 (3.7%) |
| $20,000 to $22,499 | 0 (0.0%) | 29 (4.2%) |
| $22,500 to $24,999 | 5 (0.6%) | 33 (4.7%) |
| $25,000 to $29,999 | 13 (1.7%) | 19 (2.7%) |
| $30,000 to $34,999 | 43 (5.5%) | 36 (5.2%) |
| $35,000 to $39,999 | 5 (0.6%) | 46 (6.6%) |
| $40,000 to $44,999 | 42 (5.4%) | 34 (4.9%) |
| $45,000 to $49,999 | 46 (5.9%) | 23 (3.3%) |
| $50,000 to $54,999 | 42 (5.4%) | 13 (1.9%) |
| $55,000 to $64,999 | 71 (9.1%) | 37 (5.3%) |
| $65,000 to $74,999 | 74 (9.5%) | 65 (9.3%) |
| $75,000 to $99,999 | 123 (15.7%) | 42 (6.0%) |
| $100,000+ | 164 (20.9%) | 59 (8.5%) |
| Total | 783 (100.0%) | 696 (100.0%) |
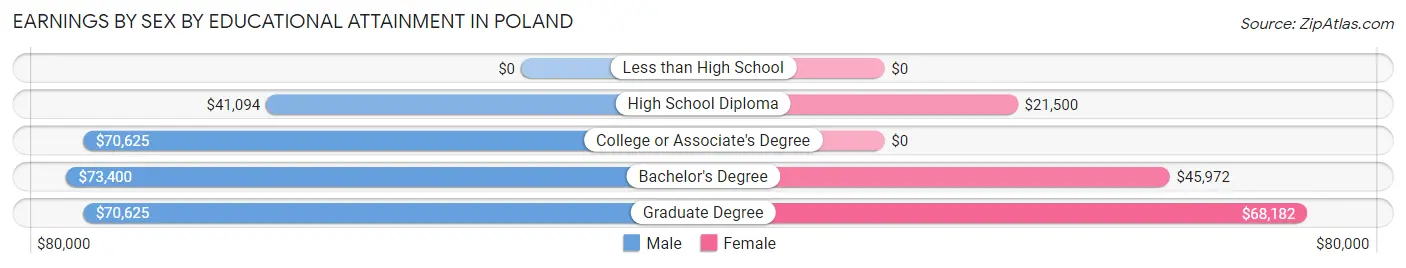
Earnings by Sex by Educational Attainment in Poland
Average earnings in Poland are $67,708 for men and $37,554 for women, a difference of 44.5%. Men with an educational attainment of bachelor's degree enjoy the highest average annual earnings of $73,400, while those with high school diploma education earn the least with $41,094. Women with an educational attainment of graduate degree earn the most with the average annual earnings of $68,182, while those with high school diploma education have the smallest earnings of $21,500.
| Educational Attainment | Male Income | Female Income |
| Less than High School | - | - |
| High School Diploma | $41,094 | $21,500 |
| College or Associate's Degree | $70,625 | $0 |
| Bachelor's Degree | $73,400 | $45,972 |
| Graduate Degree | $70,625 | $68,182 |
| Total | $67,708 | $37,554 |
Family Income in Poland
Family Income Brackets in Poland
According to the Poland family income data, there are 166 families falling into the $100,000 to $149,999 income range, which is the most common income bracket and makes up 23.4% of all families. Conversely, the less than $10,000 income bracket is the least frequent group with only 4 families (0.6%) belonging to this category.
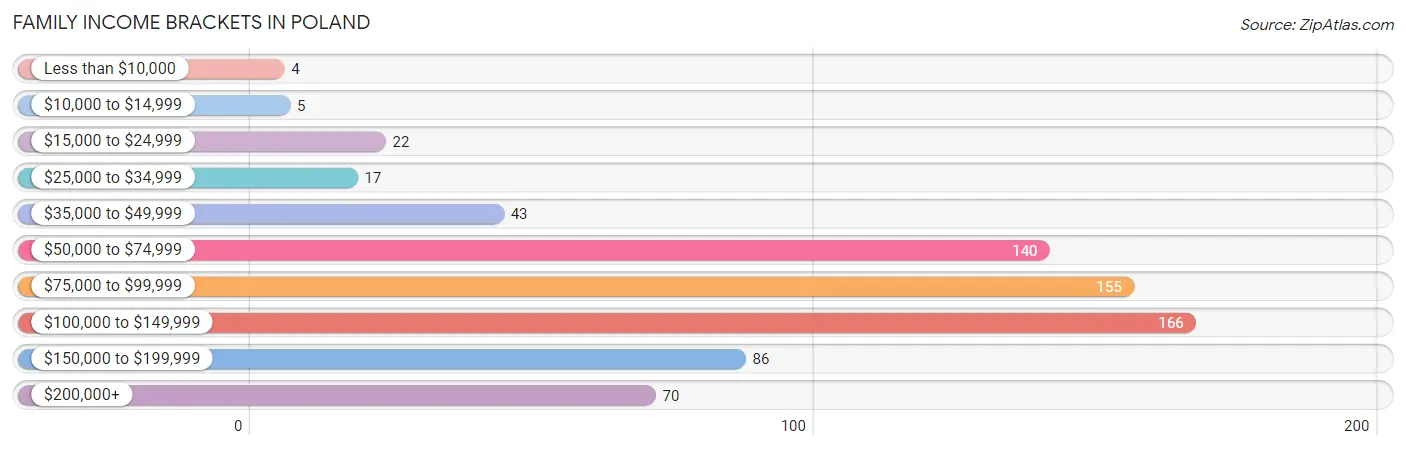
| Income Bracket | # Families | % Families |
| Less than $10,000 | 4 | 0.6% |
| $10,000 to $14,999 | 5 | 0.7% |
| $15,000 to $24,999 | 22 | 3.1% |
| $25,000 to $34,999 | 17 | 2.4% |
| $35,000 to $49,999 | 43 | 6.1% |
| $50,000 to $74,999 | 140 | 19.8% |
| $75,000 to $99,999 | 155 | 21.9% |
| $100,000 to $149,999 | 166 | 23.4% |
| $150,000 to $199,999 | 86 | 12.1% |
| $200,000+ | 70 | 9.9% |
Family Income by Famaliy Size in Poland
6-person families (44 | 6.2%) account for the highest median family income in Poland with $214,167 per family, while 2-person families (389 | 54.9%) have the highest median income of $41,600 per family member.
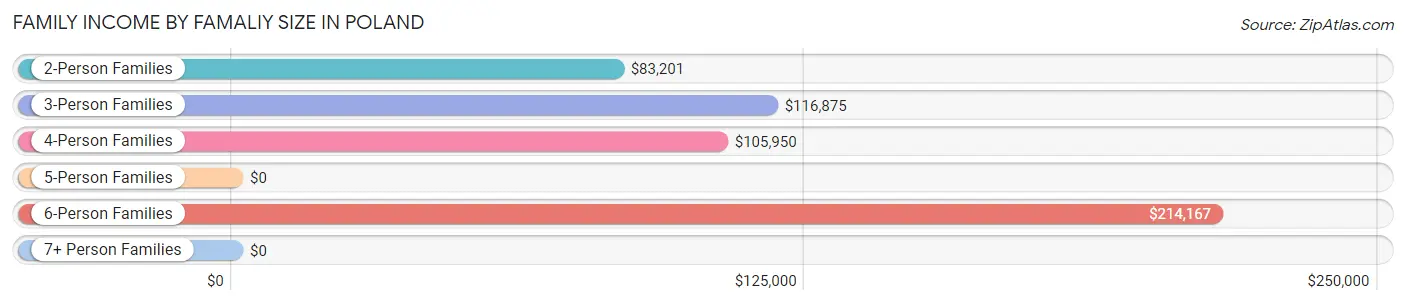
| Income Bracket | # Families | Median Income |
| 2-Person Families | 389 (54.9%) | $83,201 |
| 3-Person Families | 104 (14.7%) | $116,875 |
| 4-Person Families | 151 (21.3%) | $105,950 |
| 5-Person Families | 20 (2.8%) | $0 |
| 6-Person Families | 44 (6.2%) | $214,167 |
| 7+ Person Families | 0 (0.0%) | $0 |
| Total | 708 (100.0%) | $90,179 |
Family Income by Number of Earners in Poland
The median family income in Poland is $90,179, with families comprising 3+ earners (90) having the highest median family income of $139,167, while families with no earners (112) have the lowest median family income of $68,000, accounting for 12.7% and 15.8% of families, respectively.
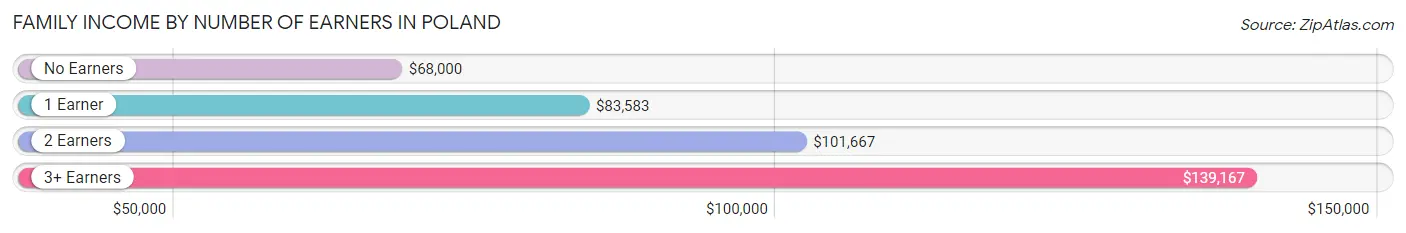
| Number of Earners | # Families | Median Income |
| No Earners | 112 (15.8%) | $68,000 |
| 1 Earner | 204 (28.8%) | $83,583 |
| 2 Earners | 302 (42.7%) | $101,667 |
| 3+ Earners | 90 (12.7%) | $139,167 |
| Total | 708 (100.0%) | $90,179 |
Household Income in Poland
Household Income Brackets in Poland
With 222 households falling in the category, the $100,000 to $149,999 income range is the most frequent in Poland, accounting for 20.4% of all households. In contrast, only 10 households (0.9%) fall into the $10,000 to $14,999 income bracket, making it the least populous group.
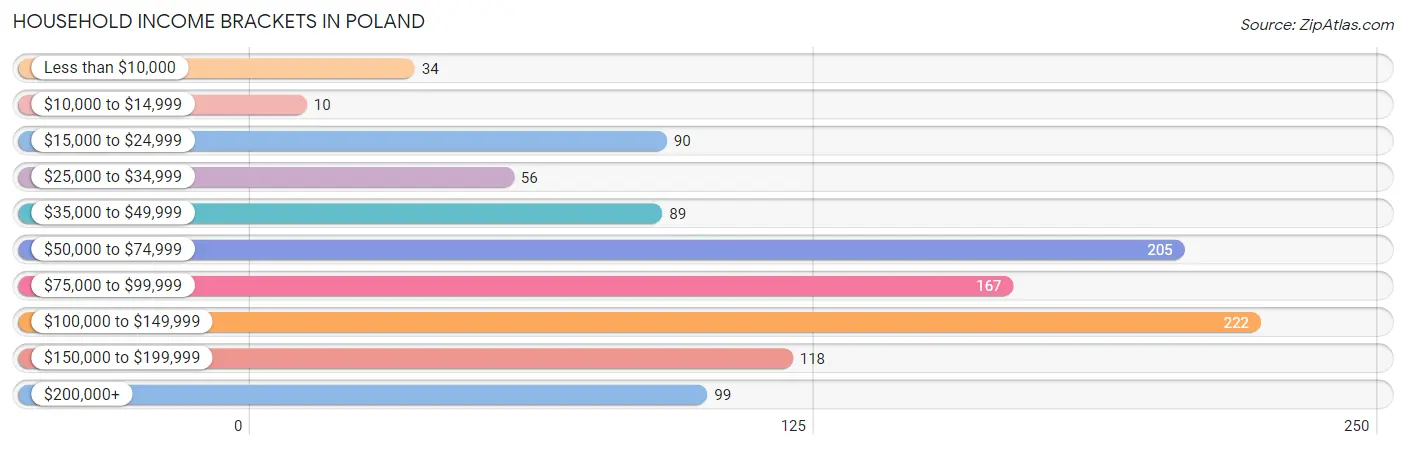
| Income Bracket | # Households | % Households |
| Less than $10,000 | 34 | 3.1% |
| $10,000 to $14,999 | 10 | 0.9% |
| $15,000 to $24,999 | 90 | 8.3% |
| $25,000 to $34,999 | 56 | 5.1% |
| $35,000 to $49,999 | 89 | 8.2% |
| $50,000 to $74,999 | 205 | 18.8% |
| $75,000 to $99,999 | 167 | 15.3% |
| $100,000 to $149,999 | 222 | 20.4% |
| $150,000 to $199,999 | 118 | 10.8% |
| $200,000+ | 99 | 9.1% |
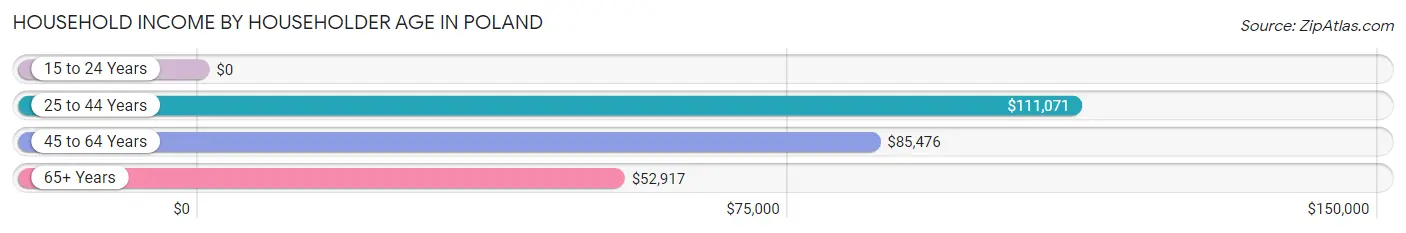
Household Income by Householder Age in Poland
The median household income in Poland is $82,024, with the highest median household income of $111,071 found in the 25 to 44 years age bracket for the primary householder. A total of 348 households (31.9%) fall into this category. Meanwhile, the 15 to 24 years age bracket for the primary householder has the lowest median household income of $0, with 1 households (0.1%) in this group.
| Income Bracket | # Households | Median Income |
| 15 to 24 Years | 1 (0.1%) | $0 |
| 25 to 44 Years | 348 (31.9%) | $111,071 |
| 45 to 64 Years | 412 (37.8%) | $85,476 |
| 65+ Years | 329 (30.2%) | $52,917 |
| Total | 1,090 (100.0%) | $82,024 |
Poverty in Poland
Income Below Poverty by Sex and Age in Poland
With 4.4% poverty level for males and 5.5% for females among the residents of Poland, 15 year old males and 18 to 24 year old females are the most vulnerable to poverty, with 13 males (38.2%) and 12 females (23.1%) in their respective age groups living below the poverty level.
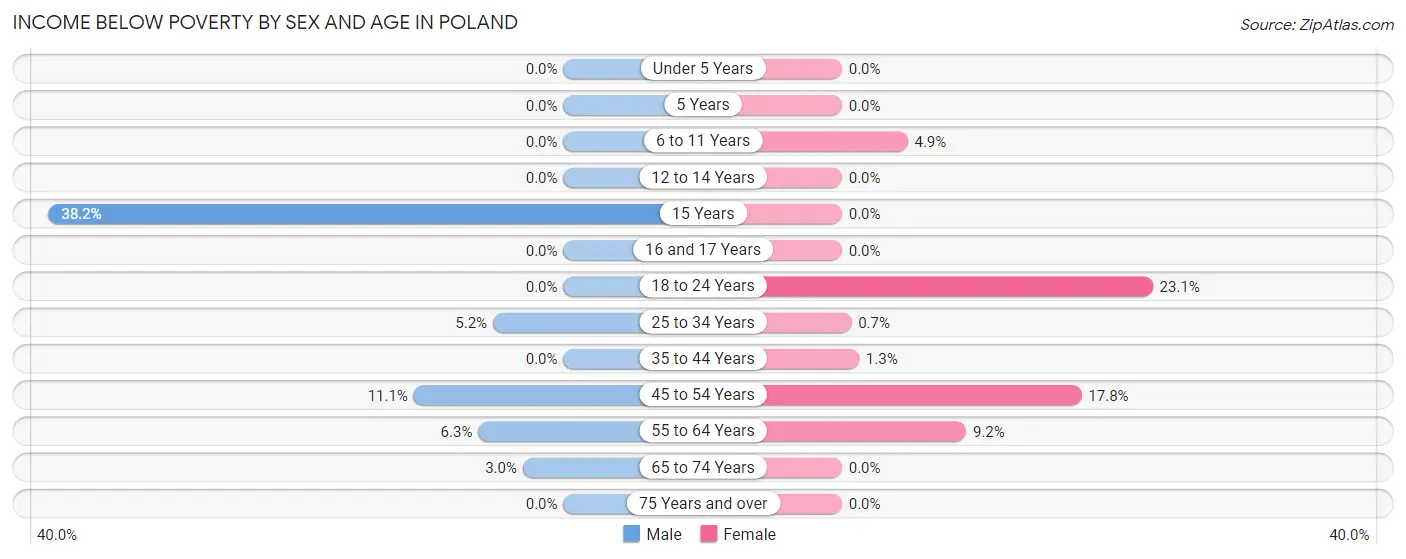
| Age Bracket | Male | Female |
| Under 5 Years | 0 (0.0%) | 0 (0.0%) |
| 5 Years | 0 (0.0%) | 0 (0.0%) |
| 6 to 11 Years | 0 (0.0%) | 4 (4.9%) |
| 12 to 14 Years | 0 (0.0%) | 0 (0.0%) |
| 15 Years | 13 (38.2%) | 0 (0.0%) |
| 16 and 17 Years | 0 (0.0%) | 0 (0.0%) |
| 18 to 24 Years | 0 (0.0%) | 12 (23.1%) |
| 25 to 34 Years | 8 (5.2%) | 1 (0.7%) |
| 35 to 44 Years | 0 (0.0%) | 2 (1.3%) |
| 45 to 54 Years | 21 (11.1%) | 29 (17.8%) |
| 55 to 64 Years | 11 (6.3%) | 19 (9.2%) |
| 65 to 74 Years | 4 (3.0%) | 0 (0.0%) |
| 75 Years and over | 0 (0.0%) | 0 (0.0%) |
| Total | 57 (4.4%) | 67 (5.5%) |
Income Above Poverty by Sex and Age in Poland
According to the poverty statistics in Poland, males aged under 5 years and females aged under 5 years are the age groups that are most secure financially, with 100.0% of males and 100.0% of females in these age groups living above the poverty line.
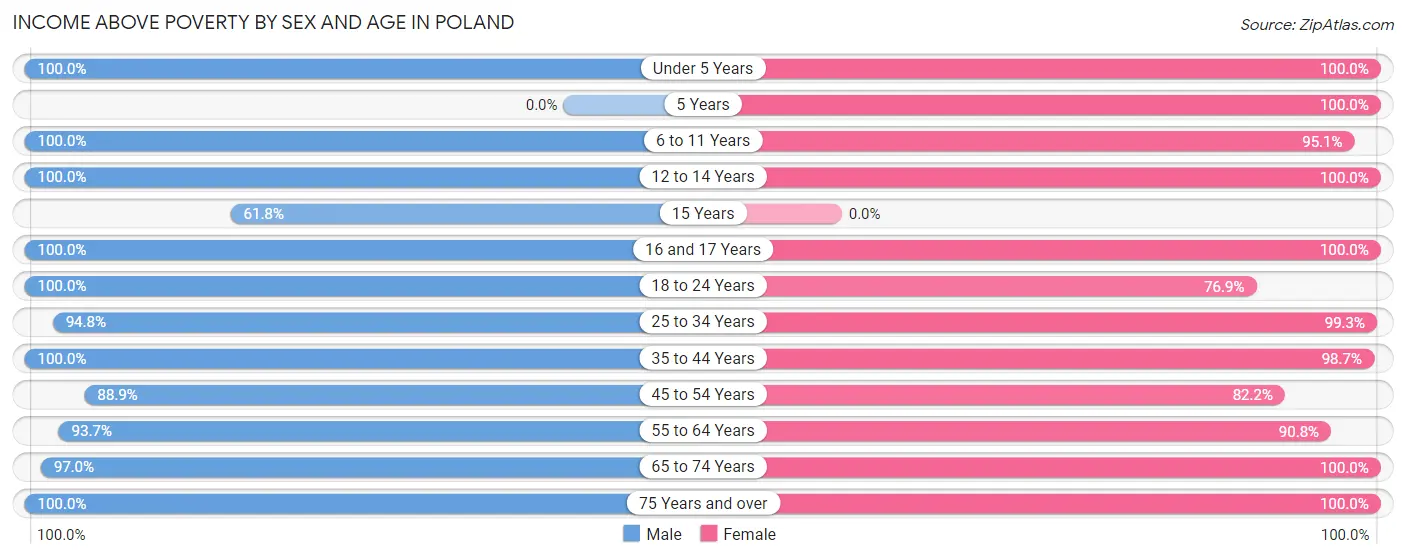
| Age Bracket | Male | Female |
| Under 5 Years | 100 (100.0%) | 59 (100.0%) |
| 5 Years | 0 (0.0%) | 6 (100.0%) |
| 6 to 11 Years | 81 (100.0%) | 78 (95.1%) |
| 12 to 14 Years | 42 (100.0%) | 38 (100.0%) |
| 15 Years | 21 (61.8%) | 0 (0.0%) |
| 16 and 17 Years | 13 (100.0%) | 24 (100.0%) |
| 18 to 24 Years | 88 (100.0%) | 40 (76.9%) |
| 25 to 34 Years | 145 (94.8%) | 142 (99.3%) |
| 35 to 44 Years | 190 (100.0%) | 156 (98.7%) |
| 45 to 54 Years | 168 (88.9%) | 134 (82.2%) |
| 55 to 64 Years | 163 (93.7%) | 187 (90.8%) |
| 65 to 74 Years | 129 (97.0%) | 157 (100.0%) |
| 75 Years and over | 103 (100.0%) | 133 (100.0%) |
| Total | 1,243 (95.6%) | 1,154 (94.5%) |
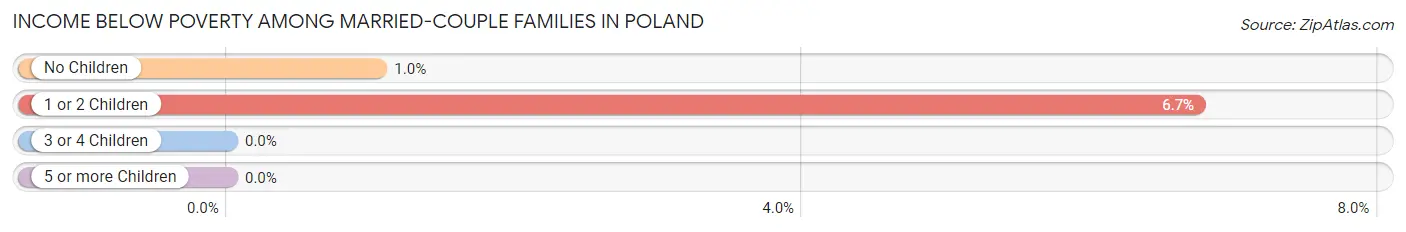
Income Below Poverty Among Married-Couple Families in Poland
The poverty statistics for married-couple families in Poland show that 2.7% or 17 of the total 626 families live below the poverty line. Families with 1 or 2 children have the highest poverty rate of 6.7%, comprising of 13 families. On the other hand, families with 3 or 4 children have the lowest poverty rate of 0.0%, which includes 0 families.
| Children | Above Poverty | Below Poverty |
| No Children | 381 (99.0%) | 4 (1.0%) |
| 1 or 2 Children | 180 (93.3%) | 13 (6.7%) |
| 3 or 4 Children | 48 (100.0%) | 0 (0.0%) |
| 5 or more Children | 0 (0.0%) | 0 (0.0%) |
| Total | 609 (97.3%) | 17 (2.7%) |
Income Below Poverty Among Single-Parent Households in Poland
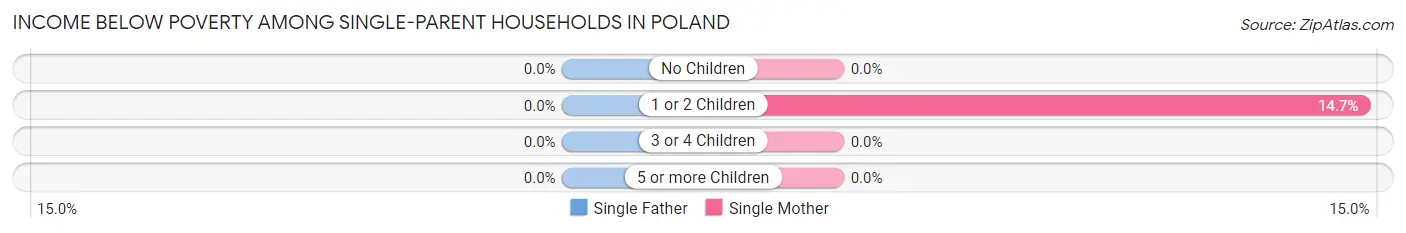
| Children | Single Father | Single Mother |
| No Children | 0 (0.0%) | 0 (0.0%) |
| 1 or 2 Children | 0 (0.0%) | 5 (14.7%) |
| 3 or 4 Children | 0 (0.0%) | 0 (0.0%) |
| 5 or more Children | 0 (0.0%) | 0 (0.0%) |
| Total | 0 (0.0%) | 5 (8.1%) |
Income Below Poverty Among Married-Couple vs Single-Parent Households in Poland
The poverty data for Poland shows that 17 of the married-couple family households (2.7%) and 5 of the single-parent households (6.1%) are living below the poverty level. Within the married-couple family households, those with 1 or 2 children have the highest poverty rate, with 13 households (6.7%) falling below the poverty line. Among the single-parent households, those with 1 or 2 children have the highest poverty rate, with 5 household (10.6%) living below poverty.
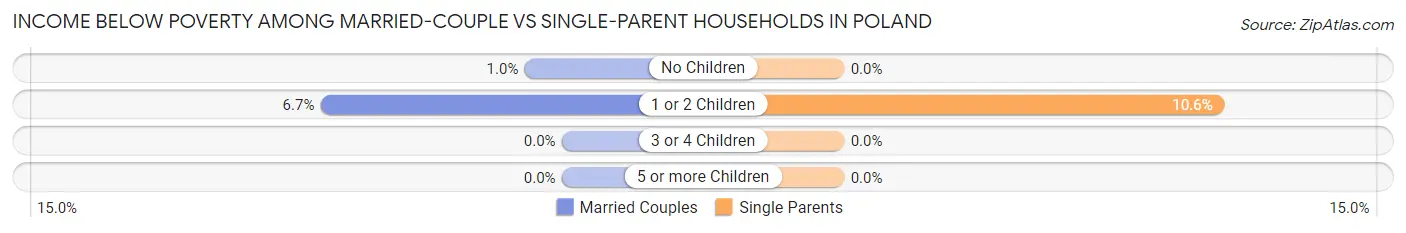
| Children | Married-Couple Families | Single-Parent Households |
| No Children | 4 (1.0%) | 0 (0.0%) |
| 1 or 2 Children | 13 (6.7%) | 5 (10.6%) |
| 3 or 4 Children | 0 (0.0%) | 0 (0.0%) |
| 5 or more Children | 0 (0.0%) | 0 (0.0%) |
| Total | 17 (2.7%) | 5 (6.1%) |
Race in Poland
The most populous races in Poland are White / Caucasian (2,367 | 92.0%), Hispanic or Latino (128 | 5.0%), and Two or more Races (118 | 4.6%).
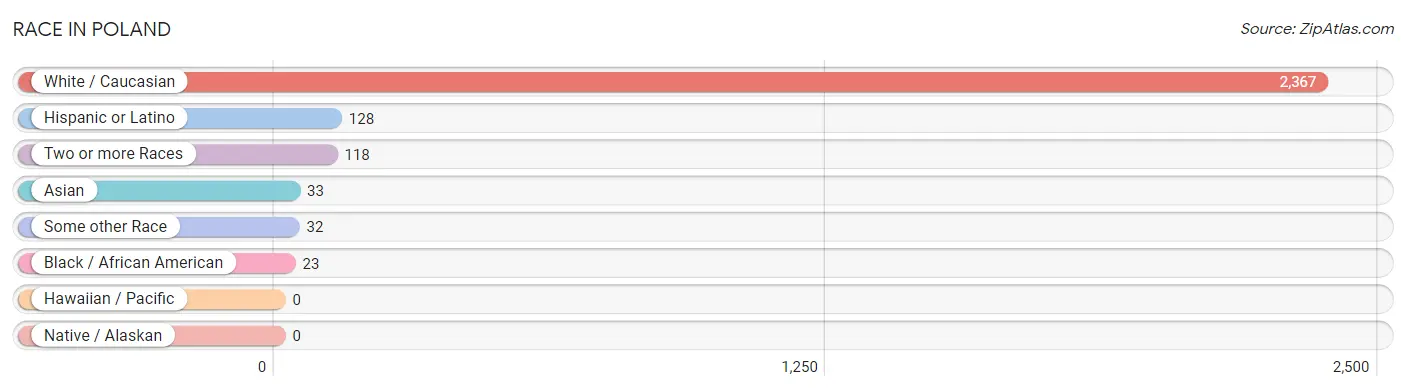
| Race | # Population | % Population |
| Asian | 33 | 1.3% |
| Black / African American | 23 | 0.9% |
| Hawaiian / Pacific | 0 | 0.0% |
| Hispanic or Latino | 128 | 5.0% |
| Native / Alaskan | 0 | 0.0% |
| White / Caucasian | 2,367 | 92.0% |
| Two or more Races | 118 | 4.6% |
| Some other Race | 32 | 1.2% |
| Total | 2,573 | 100.0% |
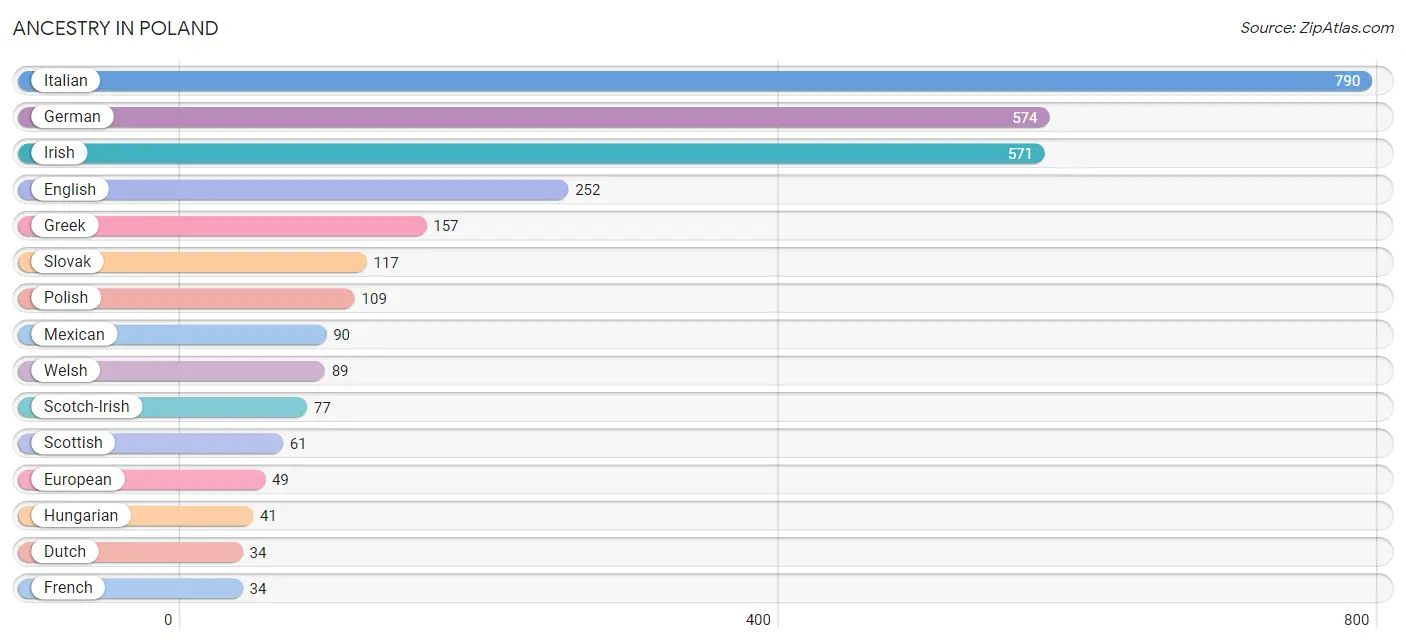
Ancestry in Poland
The most populous ancestries reported in Poland are Italian (790 | 30.7%), German (574 | 22.3%), Irish (571 | 22.2%), English (252 | 9.8%), and Greek (157 | 6.1%), together accounting for 91.1% of all Poland residents.
| Ancestry | # Population | % Population |
| African | 6 | 0.2% |
| American | 33 | 1.3% |
| Arab | 15 | 0.6% |
| Belgian | 11 | 0.4% |
| Burmese | 5 | 0.2% |
| Central American | 18 | 0.7% |
| Cherokee | 4 | 0.2% |
| Croatian | 4 | 0.2% |
| Cuban | 4 | 0.2% |
| Cypriot | 11 | 0.4% |
| Czechoslovakian | 13 | 0.5% |
| Danish | 12 | 0.5% |
| Dutch | 34 | 1.3% |
| Eastern European | 5 | 0.2% |
| English | 252 | 9.8% |
| European | 49 | 1.9% |
| Finnish | 29 | 1.1% |
| French | 34 | 1.3% |
| German | 574 | 22.3% |
| Greek | 157 | 6.1% |
| Guatemalan | 18 | 0.7% |
| Hungarian | 41 | 1.6% |
| Indian (Asian) | 7 | 0.3% |
| Irish | 571 | 22.2% |
| Italian | 790 | 30.7% |
| Korean | 24 | 0.9% |
| Lebanese | 15 | 0.6% |
| Mexican | 90 | 3.5% |
| Norwegian | 5 | 0.2% |
| Pennsylvania German | 4 | 0.2% |
| Polish | 109 | 4.2% |
| Puerto Rican | 2 | 0.1% |
| Russian | 22 | 0.9% |
| Scandinavian | 7 | 0.3% |
| Scotch-Irish | 77 | 3.0% |
| Scottish | 61 | 2.4% |
| Serbian | 4 | 0.2% |
| Slavic | 7 | 0.3% |
| Slovak | 117 | 4.5% |
| Slovene | 3 | 0.1% |
| Spaniard | 14 | 0.5% |
| Subsaharan African | 6 | 0.2% |
| Swedish | 30 | 1.2% |
| Swiss | 2 | 0.1% |
| Thai | 29 | 1.1% |
| Ukrainian | 19 | 0.7% |
| Welsh | 89 | 3.5% | View All 47 Rows |
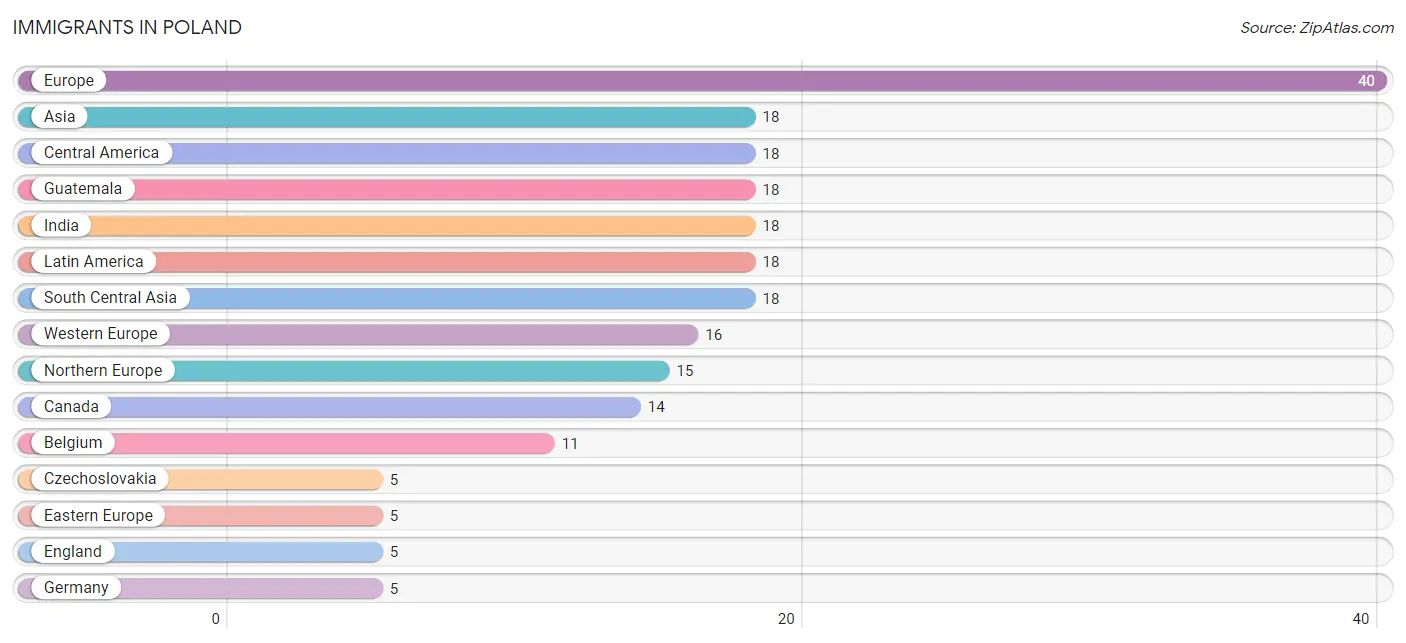
Immigrants in Poland
The most numerous immigrant groups reported in Poland came from Europe (40 | 1.5%), Asia (18 | 0.7%), Central America (18 | 0.7%), Guatemala (18 | 0.7%), and India (18 | 0.7%), together accounting for 4.3% of all Poland residents.
| Immigration Origin | # Population | % Population |
| Asia | 18 | 0.7% |
| Belgium | 11 | 0.4% |
| Canada | 14 | 0.5% |
| Central America | 18 | 0.7% |
| Czechoslovakia | 5 | 0.2% |
| Eastern Europe | 5 | 0.2% |
| England | 5 | 0.2% |
| Europe | 40 | 1.5% |
| Germany | 5 | 0.2% |
| Guatemala | 18 | 0.7% |
| India | 18 | 0.7% |
| Italy | 4 | 0.2% |
| Latin America | 18 | 0.7% |
| Northern Europe | 15 | 0.6% |
| South Central Asia | 18 | 0.7% |
| Southern Europe | 4 | 0.2% |
| Western Europe | 16 | 0.6% | View All 17 Rows |
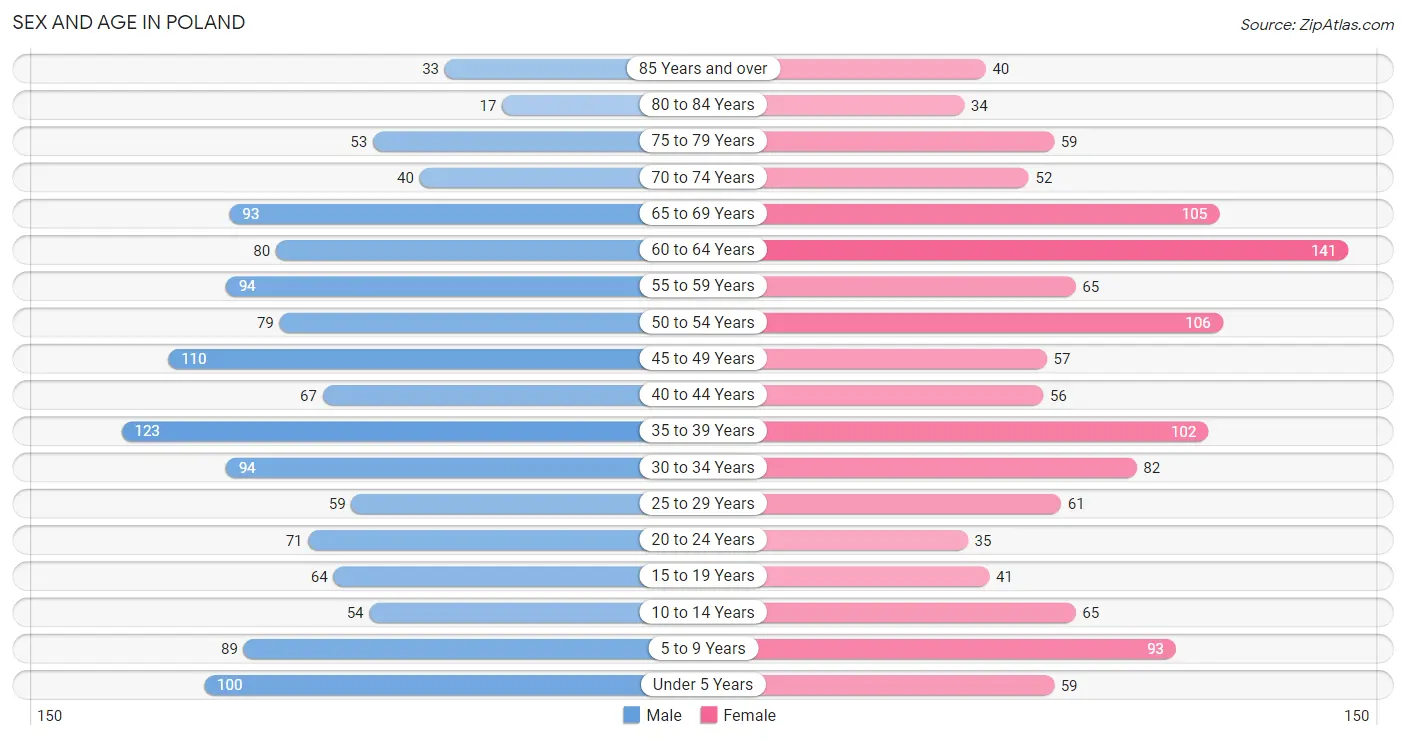
Sex and Age in Poland
Sex and Age in Poland
The most populous age groups in Poland are 35 to 39 Years (123 | 9.3%) for men and 60 to 64 Years (141 | 11.3%) for women.
| Age Bracket | Male | Female |
| Under 5 Years | 100 (7.6%) | 59 (4.7%) |
| 5 to 9 Years | 89 (6.7%) | 93 (7.4%) |
| 10 to 14 Years | 54 (4.1%) | 65 (5.2%) |
| 15 to 19 Years | 64 (4.9%) | 41 (3.3%) |
| 20 to 24 Years | 71 (5.4%) | 35 (2.8%) |
| 25 to 29 Years | 59 (4.5%) | 61 (4.9%) |
| 30 to 34 Years | 94 (7.1%) | 82 (6.5%) |
| 35 to 39 Years | 123 (9.3%) | 102 (8.1%) |
| 40 to 44 Years | 67 (5.1%) | 56 (4.5%) |
| 45 to 49 Years | 110 (8.3%) | 57 (4.5%) |
| 50 to 54 Years | 79 (6.0%) | 106 (8.5%) |
| 55 to 59 Years | 94 (7.1%) | 65 (5.2%) |
| 60 to 64 Years | 80 (6.1%) | 141 (11.3%) |
| 65 to 69 Years | 93 (7.0%) | 105 (8.4%) |
| 70 to 74 Years | 40 (3.0%) | 52 (4.2%) |
| 75 to 79 Years | 53 (4.0%) | 59 (4.7%) |
| 80 to 84 Years | 17 (1.3%) | 34 (2.7%) |
| 85 Years and over | 33 (2.5%) | 40 (3.2%) |
| Total | 1,320 (100.0%) | 1,253 (100.0%) |
Families and Households in Poland
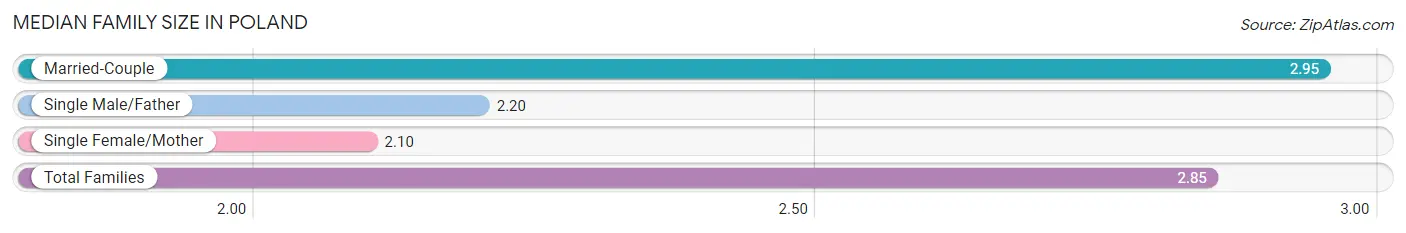
Median Family Size in Poland
The median family size in Poland is 2.85 persons per family, with married-couple families (626 | 88.4%) accounting for the largest median family size of 2.95 persons per family. On the other hand, single female/mother families (62 | 8.8%) represent the smallest median family size with 2.10 persons per family.
| Family Type | # Families | Family Size |
| Married-Couple | 626 (88.4%) | 2.95 |
| Single Male/Father | 20 (2.8%) | 2.20 |
| Single Female/Mother | 62 (8.8%) | 2.10 |
| Total Families | 708 (100.0%) | 2.85 |
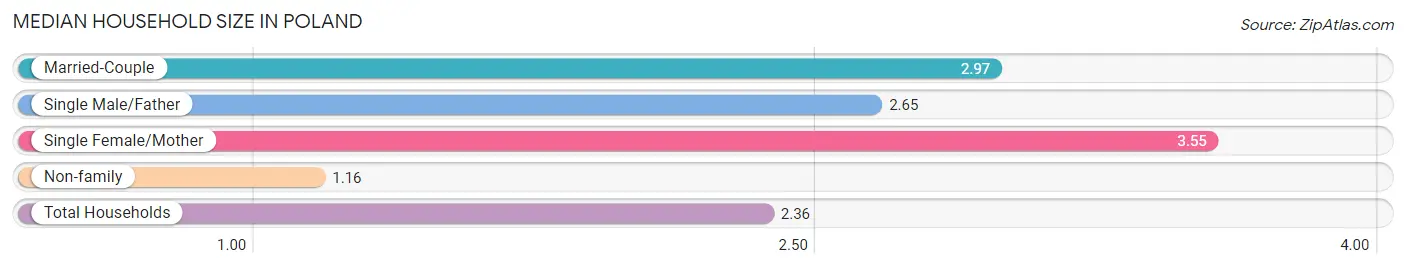
Median Household Size in Poland
The median household size in Poland is 2.36 persons per household, with single female/mother households (62 | 5.7%) accounting for the largest median household size of 3.55 persons per household. non-family households (382 | 35.0%) represent the smallest median household size with 1.16 persons per household.
| Household Type | # Households | Household Size |
| Married-Couple | 626 (57.4%) | 2.97 |
| Single Male/Father | 20 (1.8%) | 2.65 |
| Single Female/Mother | 62 (5.7%) | 3.55 |
| Non-family | 382 (35.0%) | 1.16 |
| Total Households | 1,090 (100.0%) | 2.36 |
Household Size by Marriage Status in Poland
Out of a total of 1,090 households in Poland, 708 (64.9%) are family households, while 382 (35.0%) are nonfamily households. The most numerous type of family households are 2-person households, comprising 353, and the most common type of nonfamily households are 1-person households, comprising 324.
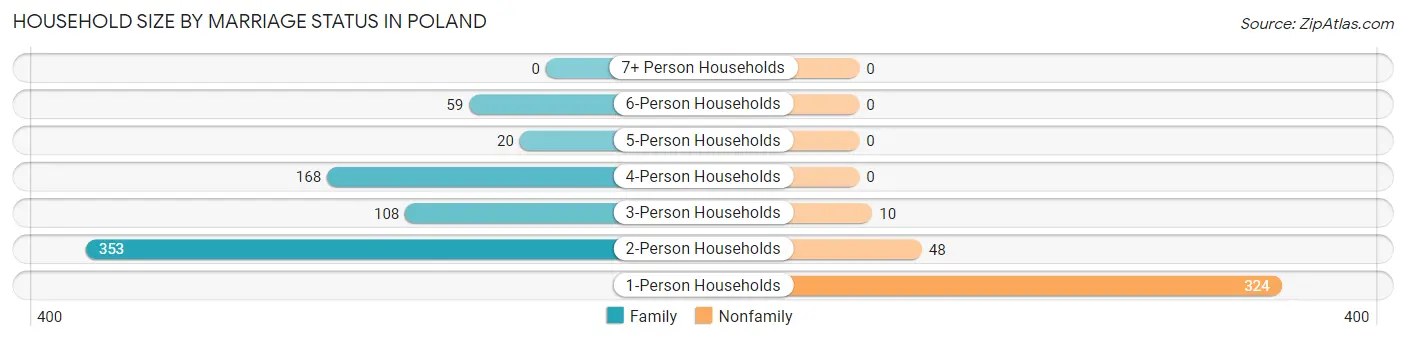
| Household Size | Family Households | Nonfamily Households |
| 1-Person Households | - | 324 (29.7%) |
| 2-Person Households | 353 (32.4%) | 48 (4.4%) |
| 3-Person Households | 108 (9.9%) | 10 (0.9%) |
| 4-Person Households | 168 (15.4%) | 0 (0.0%) |
| 5-Person Households | 20 (1.8%) | 0 (0.0%) |
| 6-Person Households | 59 (5.4%) | 0 (0.0%) |
| 7+ Person Households | 0 (0.0%) | 0 (0.0%) |
| Total | 708 (64.9%) | 382 (35.0%) |
Female Fertility in Poland
Fertility by Age in Poland
Average fertility rate in Poland is 67.0 births per 1,000 women. Women in the age bracket of 35 to 50 years have the highest fertility rate with 85.0 births per 1,000 women. Women in the age bracket of 35 to 50 years acount for 67.7% of all women with births.
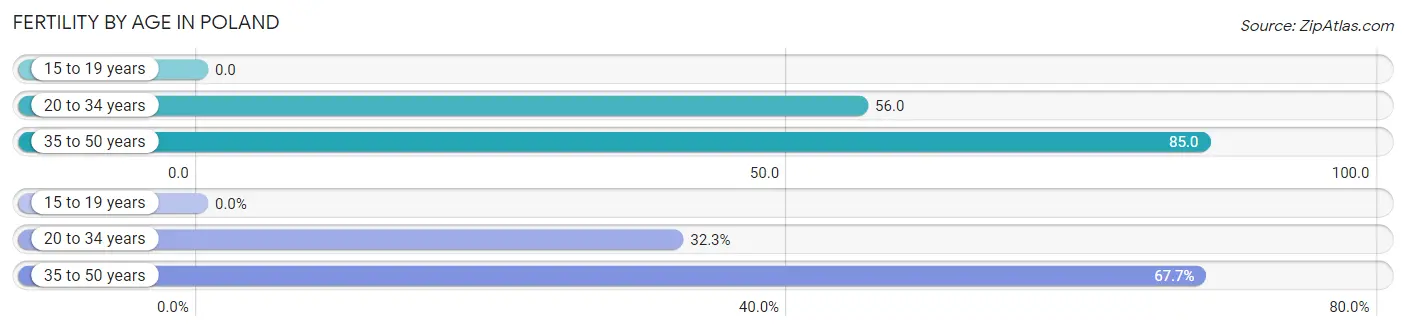
| Age Bracket | Women with Births | Births / 1,000 Women |
| 15 to 19 years | 0 (0.0%) | 0.0 |
| 20 to 34 years | 10 (32.3%) | 56.0 |
| 35 to 50 years | 21 (67.7%) | 85.0 |
| Total | 31 (100.0%) | 67.0 |
Fertility by Age by Marriage Status in Poland
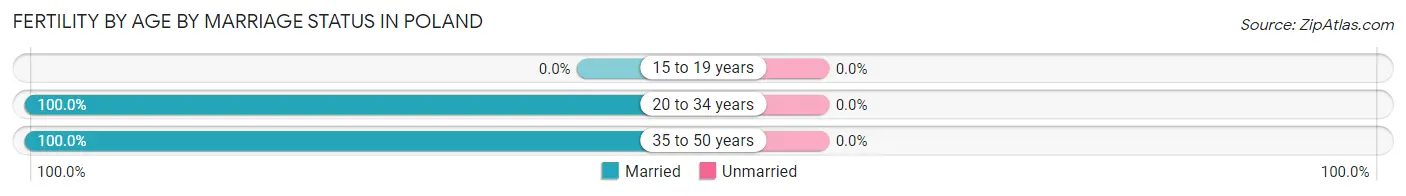
| Age Bracket | Married | Unmarried |
| 15 to 19 years | 0 (0.0%) | 0 (0.0%) |
| 20 to 34 years | 10 (100.0%) | 0 (0.0%) |
| 35 to 50 years | 21 (100.0%) | 0 (0.0%) |
| Total | 31 (100.0%) | 0 (0.0%) |
Fertility by Education in Poland
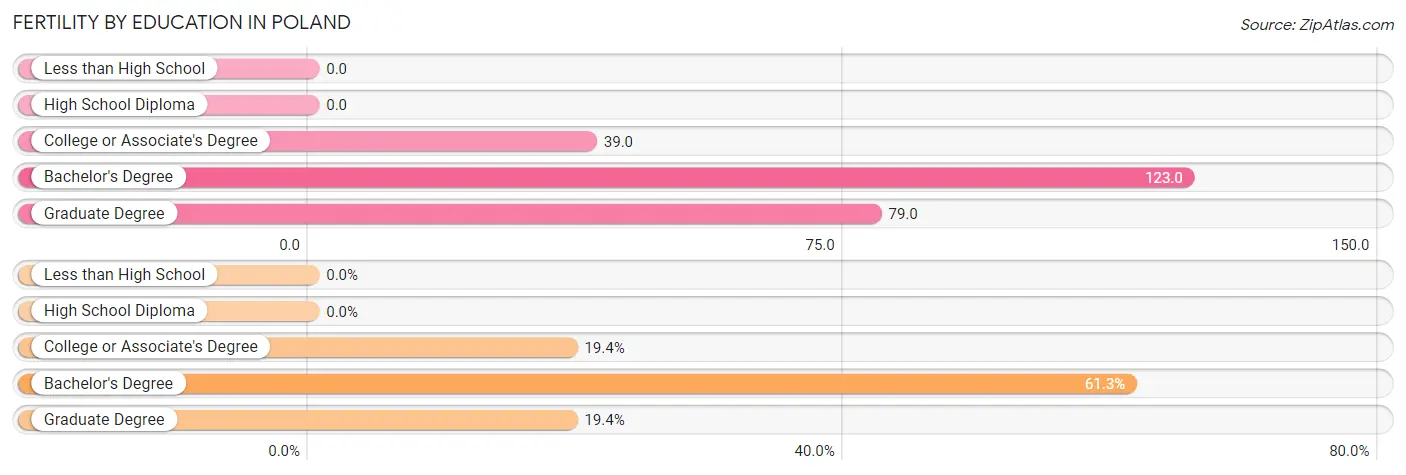
| Educational Attainment | Women with Births | Births / 1,000 Women |
| Less than High School | 0 (0.0%) | 0.0 |
| High School Diploma | 0 (0.0%) | 0.0 |
| College or Associate's Degree | 6 (19.4%) | 39.0 |
| Bachelor's Degree | 19 (61.3%) | 123.0 |
| Graduate Degree | 6 (19.4%) | 79.0 |
| Total | 31 (100.0%) | 67.0 |
Fertility by Education by Marriage Status in Poland
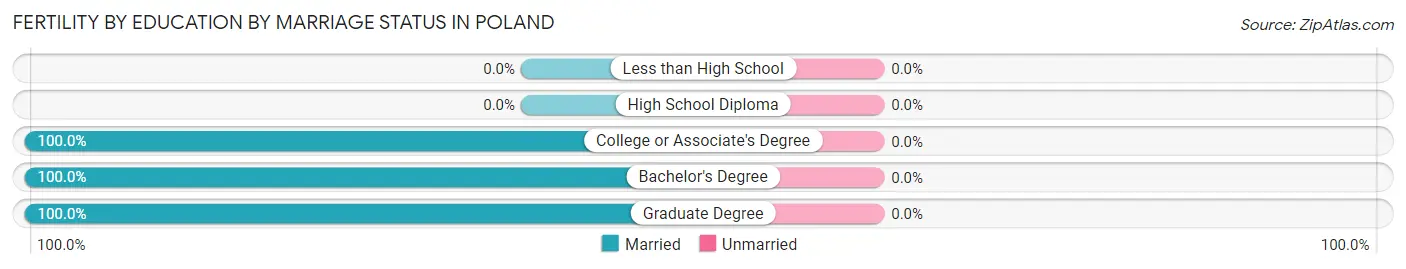
| Educational Attainment | Married | Unmarried |
| Less than High School | 0 (0.0%) | 0 (0.0%) |
| High School Diploma | 0 (0.0%) | 0 (0.0%) |
| College or Associate's Degree | 6 (100.0%) | 0 (0.0%) |
| Bachelor's Degree | 19 (100.0%) | 0 (0.0%) |
| Graduate Degree | 6 (100.0%) | 0 (0.0%) |
| Total | 31 (100.0%) | 0 (0.0%) |
Employment Characteristics in Poland
Employment by Class of Employer in Poland
Among the 1,266 employed individuals in Poland, private company employees (753 | 59.5%), not-for-profit organizations (162 | 12.8%), and self-employed (not incorporated) (141 | 11.1%) make up the most common classes of employment.
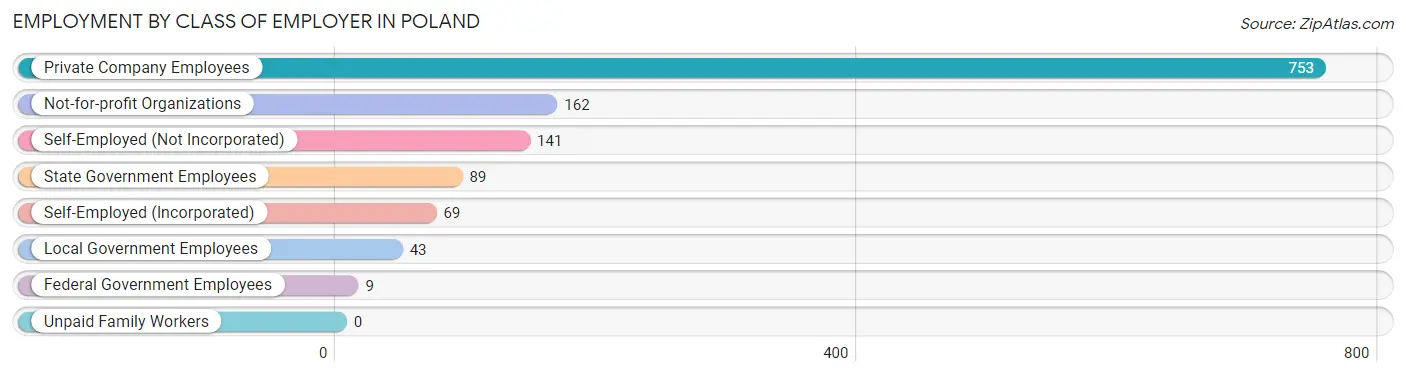
| Employer Class | # Employees | % Employees |
| Private Company Employees | 753 | 59.5% |
| Self-Employed (Incorporated) | 69 | 5.4% |
| Self-Employed (Not Incorporated) | 141 | 11.1% |
| Not-for-profit Organizations | 162 | 12.8% |
| Local Government Employees | 43 | 3.4% |
| State Government Employees | 89 | 7.0% |
| Federal Government Employees | 9 | 0.7% |
| Unpaid Family Workers | 0 | 0.0% |
| Total | 1,266 | 100.0% |
Employment Status by Age in Poland
According to the labor force statistics for Poland, out of the total population over 16 years of age (2,079), 66.0% or 1,372 individuals are in the labor force, with 5.5% or 75 of them unemployed. The age group with the highest labor force participation rate is 25 to 29 years, with 93.3% or 112 individuals in the labor force. Within the labor force, the 75 years and over age range has the highest percentage of unemployed individuals, with 44.4% or 4 of them being unemployed.
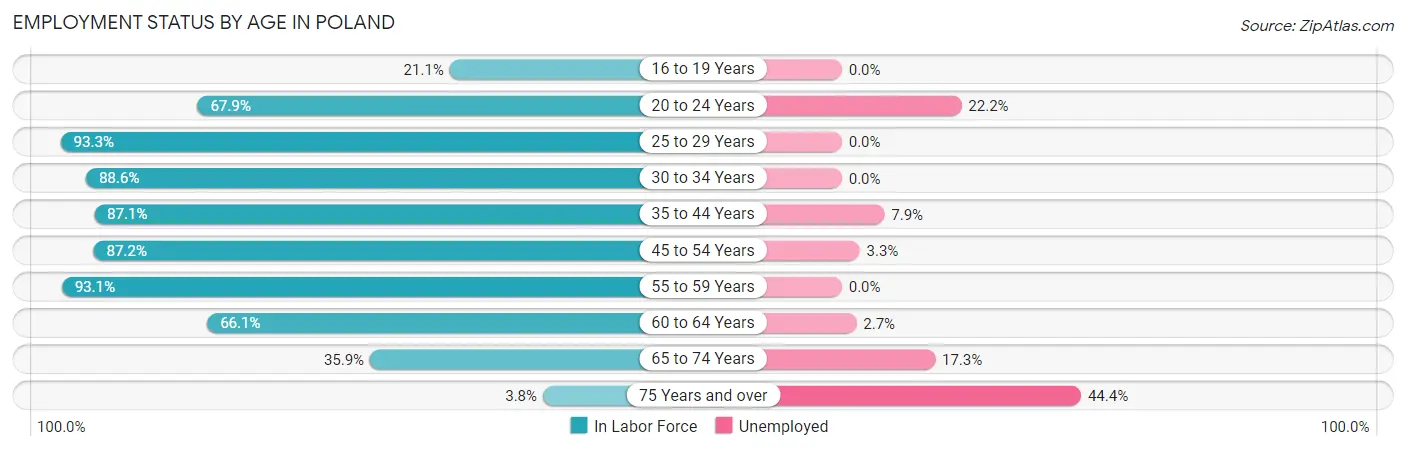
| Age Bracket | In Labor Force | Unemployed |
| 16 to 19 Years | 15 (21.1%) | 0 (0.0%) |
| 20 to 24 Years | 72 (67.9%) | 16 (22.2%) |
| 25 to 29 Years | 112 (93.3%) | 0 (0.0%) |
| 30 to 34 Years | 156 (88.6%) | 0 (0.0%) |
| 35 to 44 Years | 303 (87.1%) | 24 (7.9%) |
| 45 to 54 Years | 307 (87.2%) | 10 (3.3%) |
| 55 to 59 Years | 148 (93.1%) | 0 (0.0%) |
| 60 to 64 Years | 146 (66.1%) | 4 (2.7%) |
| 65 to 74 Years | 104 (35.9%) | 18 (17.3%) |
| 75 Years and over | 9 (3.8%) | 4 (44.4%) |
| Total | 1,372 (66.0%) | 75 (5.5%) |
Employment Status by Educational Attainment in Poland
According to labor force statistics for Poland, 85.2% of individuals (1,172) out of the total population between 25 and 64 years of age (1,376) are in the labor force, with 3.2% or 38 of them being unemployed. The group with the highest labor force participation rate are those with the educational attainment of bachelor's degree or higher, with 92.1% or 614 individuals in the labor force. Within the labor force, individuals with bachelor's degree or higher education have the highest percentage of unemployment, with 4.9% or 30 of them being unemployed.
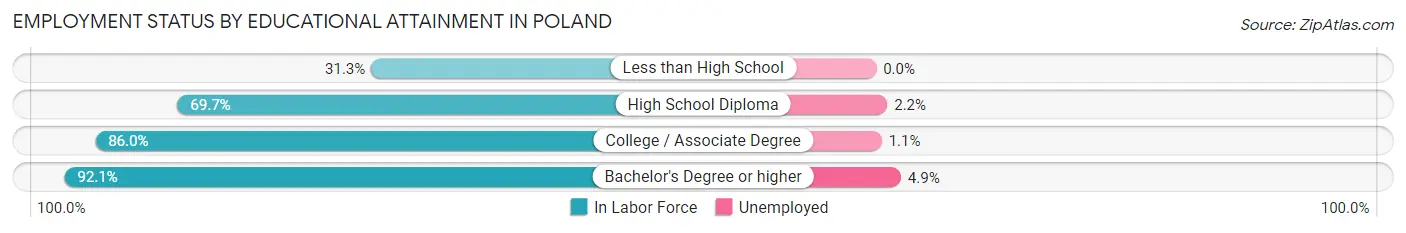
| Educational Attainment | In Labor Force | Unemployed |
| Less than High School | 5 (31.3%) | 0 (0.0%) |
| High School Diploma | 184 (69.7%) | 6 (2.2%) |
| College / Associate Degree | 369 (86.0%) | 5 (1.1%) |
| Bachelor's Degree or higher | 614 (92.1%) | 33 (4.9%) |
| Total | 1,172 (85.2%) | 44 (3.2%) |
Employment Occupations by Sex in Poland
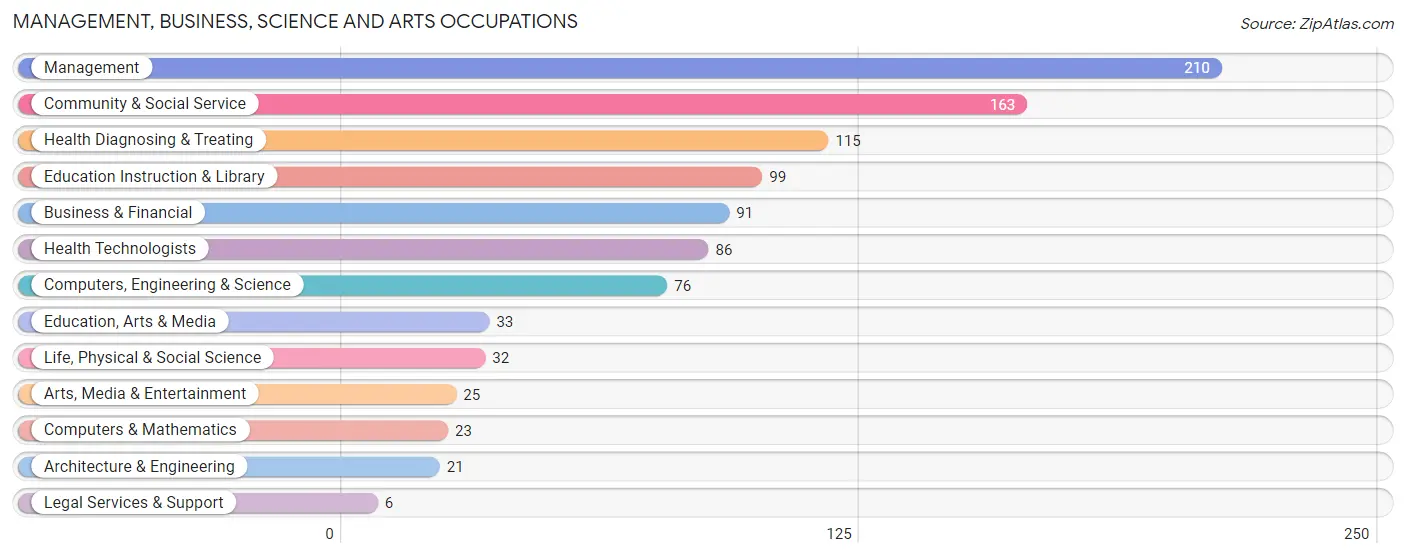
Management, Business, Science and Arts Occupations
The most common Management, Business, Science and Arts occupations in Poland are Management (210 | 16.2%), Community & Social Service (163 | 12.6%), Health Diagnosing & Treating (115 | 8.9%), Education Instruction & Library (99 | 7.6%), and Business & Financial (91 | 7.0%).
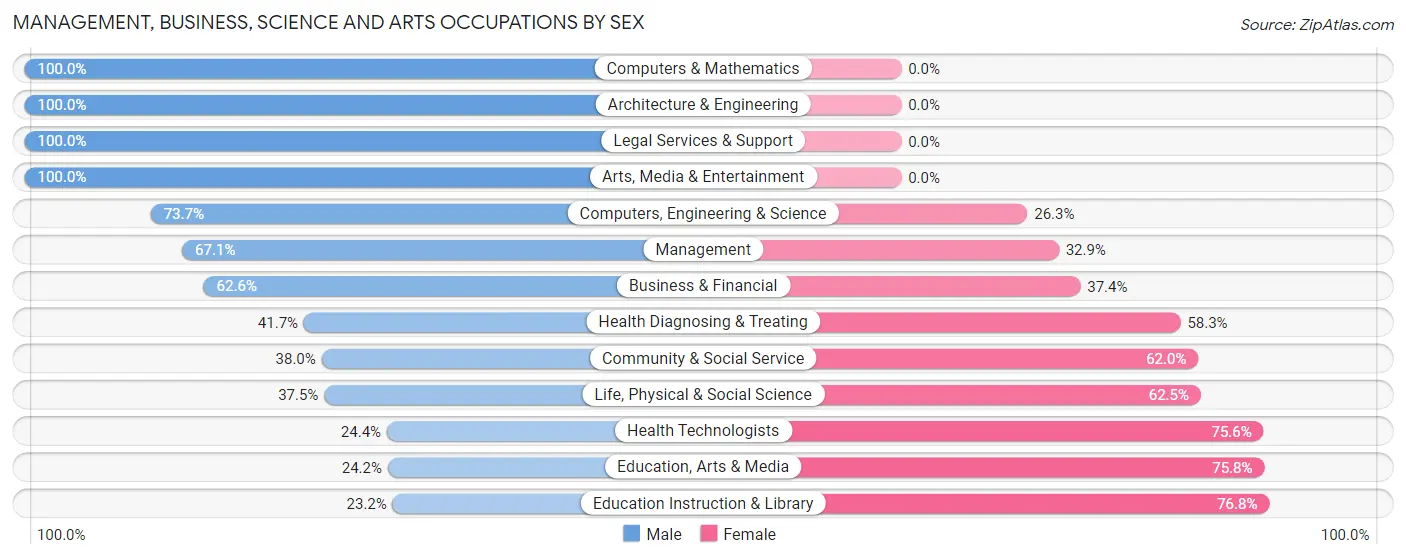
Management, Business, Science and Arts Occupations by Sex
Within the Management, Business, Science and Arts occupations in Poland, the most male-oriented occupations are Computers & Mathematics (100.0%), Architecture & Engineering (100.0%), and Legal Services & Support (100.0%), while the most female-oriented occupations are Education Instruction & Library (76.8%), Education, Arts & Media (75.8%), and Health Technologists (75.6%).
| Occupation | Male | Female |
| Management | 141 (67.1%) | 69 (32.9%) |
| Business & Financial | 57 (62.6%) | 34 (37.4%) |
| Computers, Engineering & Science | 56 (73.7%) | 20 (26.3%) |
| Computers & Mathematics | 23 (100.0%) | 0 (0.0%) |
| Architecture & Engineering | 21 (100.0%) | 0 (0.0%) |
| Life, Physical & Social Science | 12 (37.5%) | 20 (62.5%) |
| Community & Social Service | 62 (38.0%) | 101 (62.0%) |
| Education, Arts & Media | 8 (24.2%) | 25 (75.8%) |
| Legal Services & Support | 6 (100.0%) | 0 (0.0%) |
| Education Instruction & Library | 23 (23.2%) | 76 (76.8%) |
| Arts, Media & Entertainment | 25 (100.0%) | 0 (0.0%) |
| Health Diagnosing & Treating | 48 (41.7%) | 67 (58.3%) |
| Health Technologists | 21 (24.4%) | 65 (75.6%) |
| Total (Category) | 364 (55.6%) | 291 (44.4%) |
| Total (Overall) | 692 (53.4%) | 604 (46.6%) |
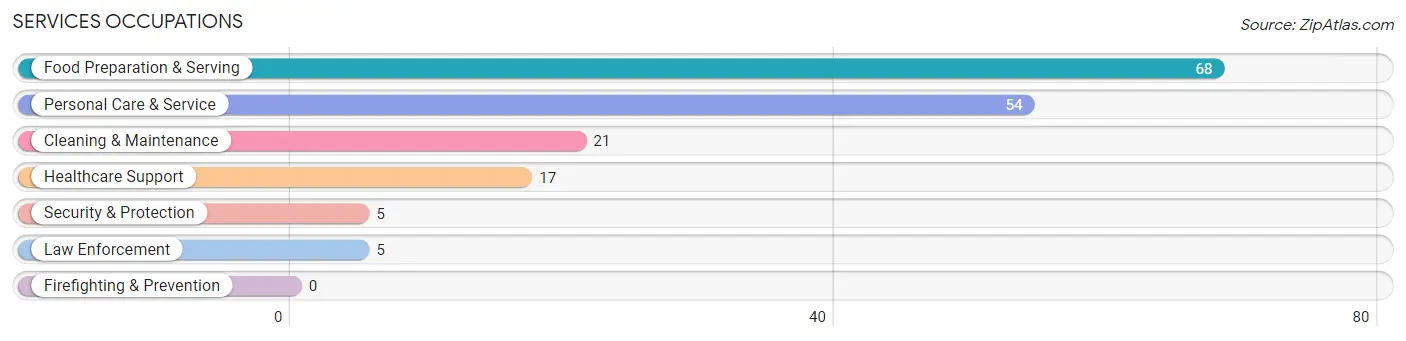
Services Occupations
The most common Services occupations in Poland are Food Preparation & Serving (68 | 5.2%), Personal Care & Service (54 | 4.2%), Cleaning & Maintenance (21 | 1.6%), Healthcare Support (17 | 1.3%), and Security & Protection (5 | 0.4%).
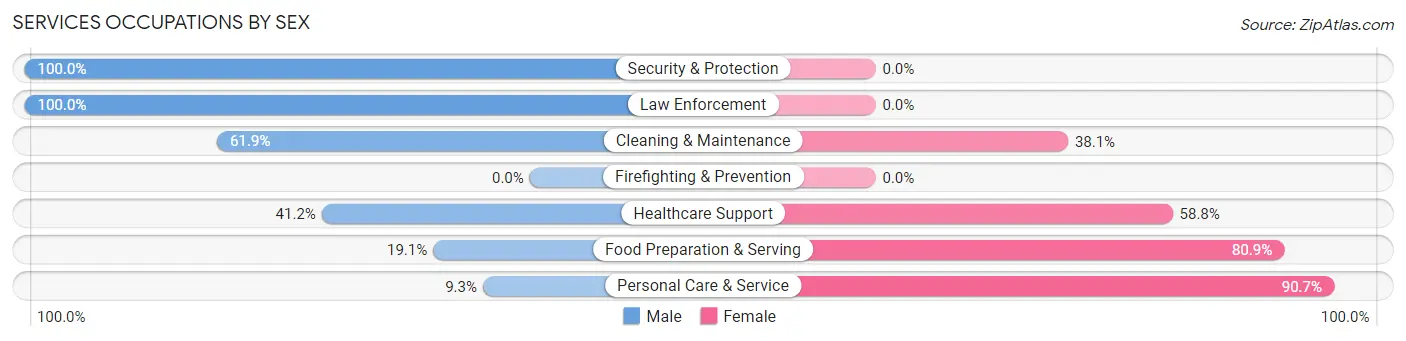
Services Occupations by Sex
Within the Services occupations in Poland, the most male-oriented occupations are Security & Protection (100.0%), Law Enforcement (100.0%), and Cleaning & Maintenance (61.9%), while the most female-oriented occupations are Personal Care & Service (90.7%), Food Preparation & Serving (80.9%), and Healthcare Support (58.8%).
| Occupation | Male | Female |
| Healthcare Support | 7 (41.2%) | 10 (58.8%) |
| Security & Protection | 5 (100.0%) | 0 (0.0%) |
| Firefighting & Prevention | 0 (0.0%) | 0 (0.0%) |
| Law Enforcement | 5 (100.0%) | 0 (0.0%) |
| Food Preparation & Serving | 13 (19.1%) | 55 (80.9%) |
| Cleaning & Maintenance | 13 (61.9%) | 8 (38.1%) |
| Personal Care & Service | 5 (9.3%) | 49 (90.7%) |
| Total (Category) | 43 (26.1%) | 122 (73.9%) |
| Total (Overall) | 692 (53.4%) | 604 (46.6%) |
Sales and Office Occupations
The most common Sales and Office occupations in Poland are Sales & Related (215 | 16.6%), and Office & Administration (106 | 8.2%).

Sales and Office Occupations by Sex

| Occupation | Male | Female |
| Sales & Related | 134 (62.3%) | 81 (37.7%) |
| Office & Administration | 16 (15.1%) | 90 (84.9%) |
| Total (Category) | 150 (46.7%) | 171 (53.3%) |
| Total (Overall) | 692 (53.4%) | 604 (46.6%) |
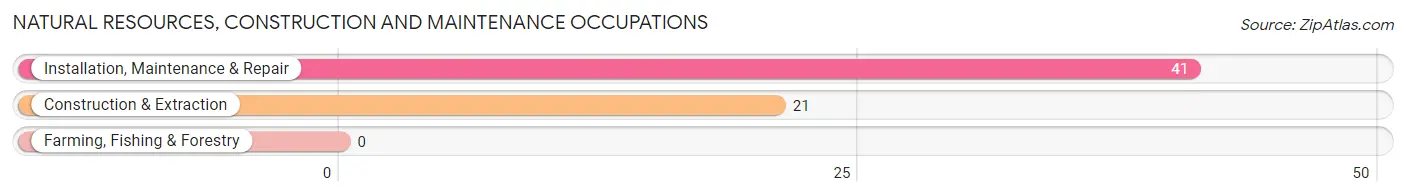
Natural Resources, Construction and Maintenance Occupations
The most common Natural Resources, Construction and Maintenance occupations in Poland are Installation, Maintenance & Repair (41 | 3.2%), and Construction & Extraction (21 | 1.6%).
Natural Resources, Construction and Maintenance Occupations by Sex
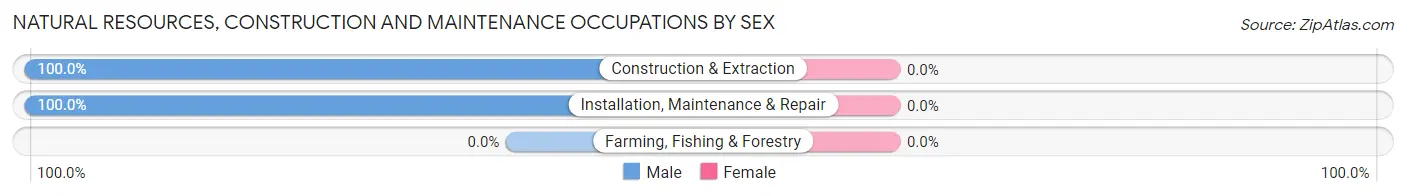
| Occupation | Male | Female |
| Farming, Fishing & Forestry | 0 (0.0%) | 0 (0.0%) |
| Construction & Extraction | 21 (100.0%) | 0 (0.0%) |
| Installation, Maintenance & Repair | 41 (100.0%) | 0 (0.0%) |
| Total (Category) | 62 (100.0%) | 0 (0.0%) |
| Total (Overall) | 692 (53.4%) | 604 (46.6%) |
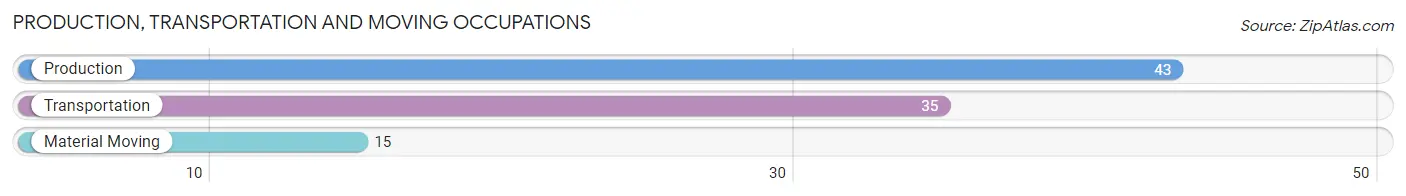
Production, Transportation and Moving Occupations
The most common Production, Transportation and Moving occupations in Poland are Production (43 | 3.3%), Transportation (35 | 2.7%), and Material Moving (15 | 1.2%).
Production, Transportation and Moving Occupations by Sex
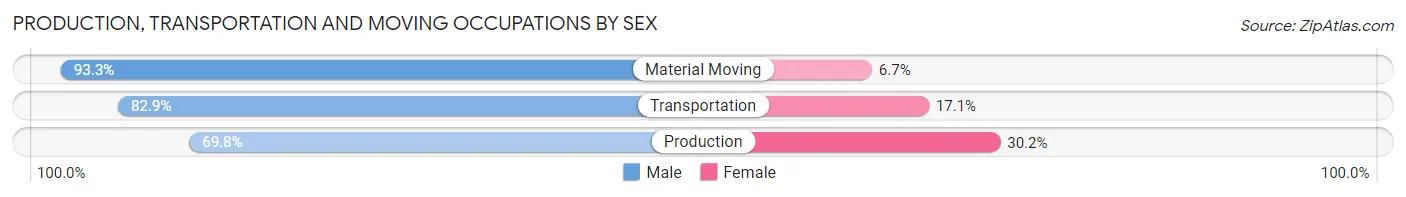
| Occupation | Male | Female |
| Production | 30 (69.8%) | 13 (30.2%) |
| Transportation | 29 (82.9%) | 6 (17.1%) |
| Material Moving | 14 (93.3%) | 1 (6.7%) |
| Total (Category) | 73 (78.5%) | 20 (21.5%) |
| Total (Overall) | 692 (53.4%) | 604 (46.6%) |
Employment Industries by Sex in Poland
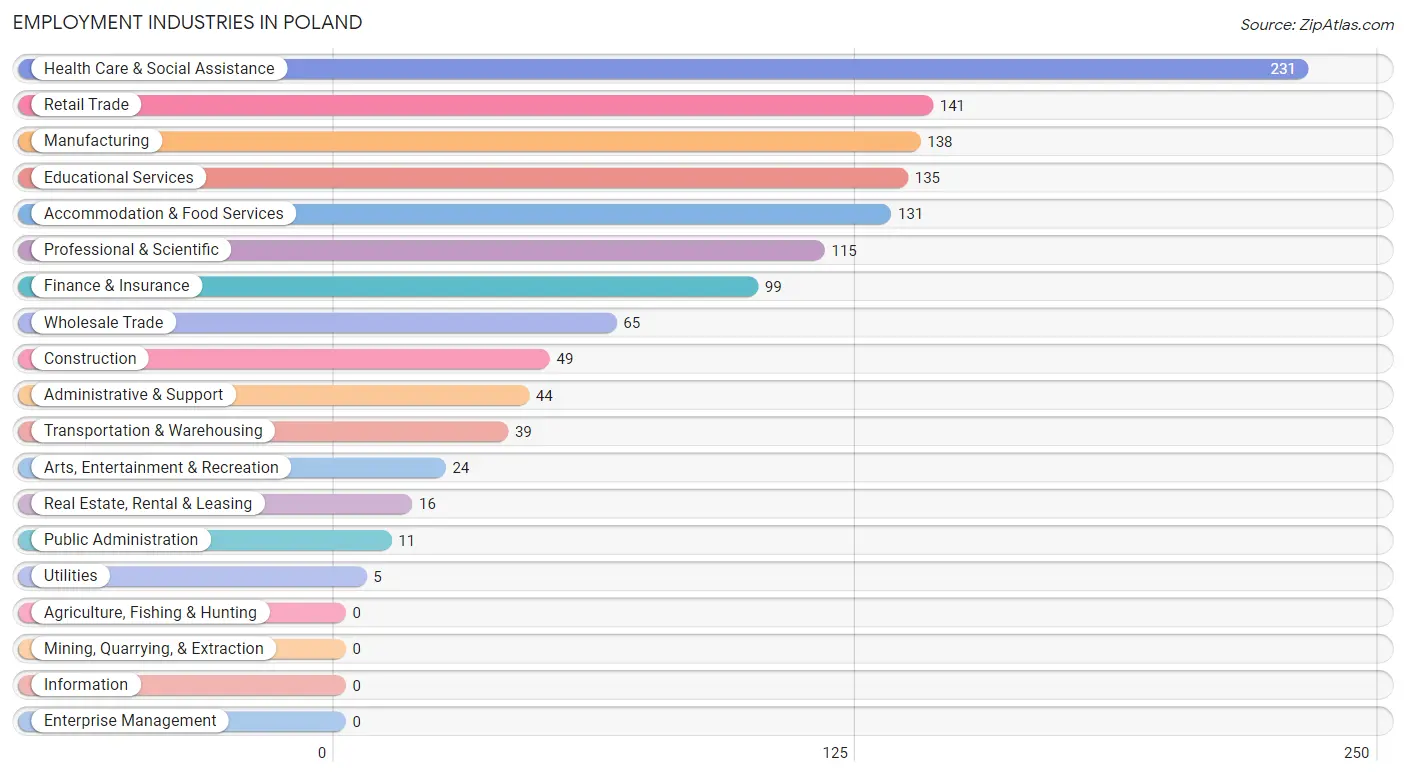
Employment Industries in Poland
The major employment industries in Poland include Health Care & Social Assistance (231 | 17.8%), Retail Trade (141 | 10.9%), Manufacturing (138 | 10.6%), Educational Services (135 | 10.4%), and Accommodation & Food Services (131 | 10.1%).
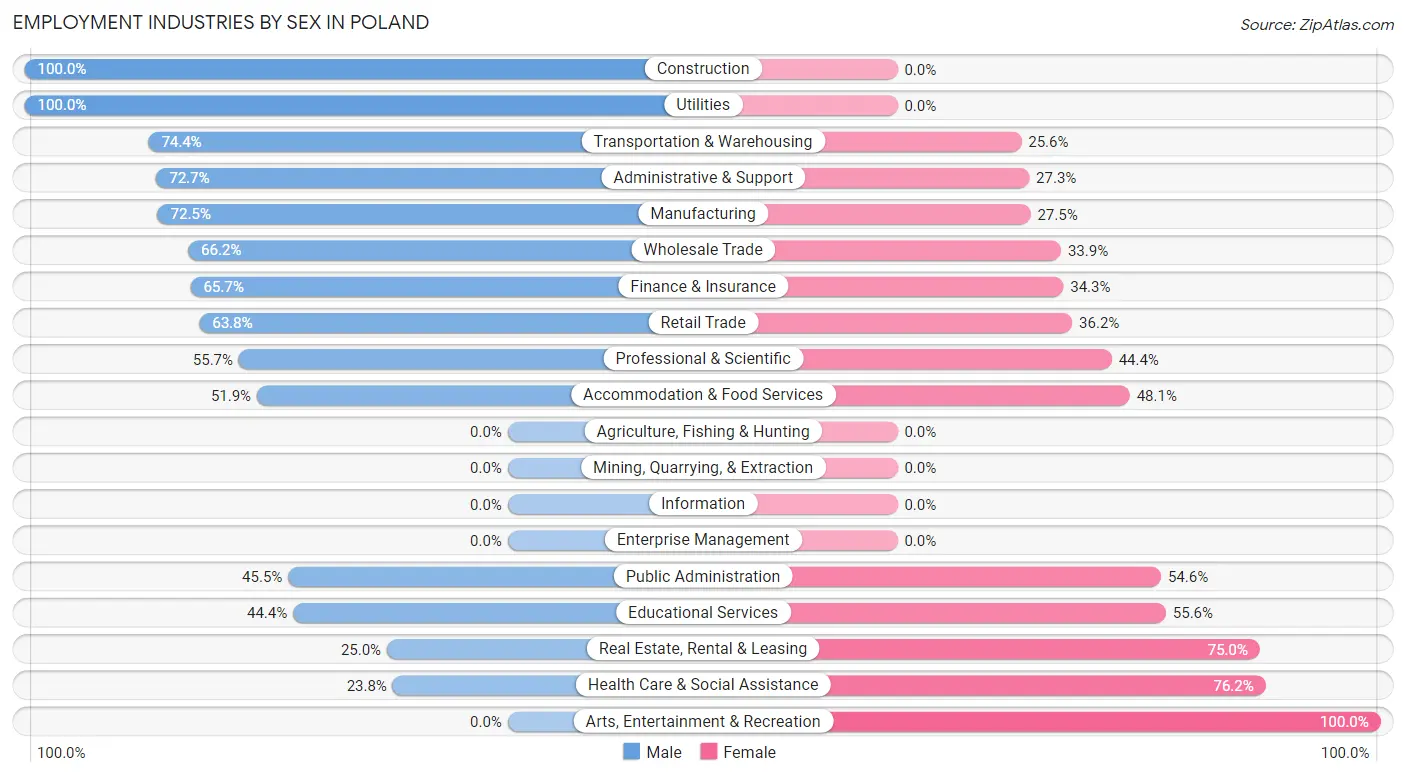
Employment Industries by Sex in Poland
The Poland industries that see more men than women are Construction (100.0%), Utilities (100.0%), and Transportation & Warehousing (74.4%), whereas the industries that tend to have a higher number of women are Arts, Entertainment & Recreation (100.0%), Health Care & Social Assistance (76.2%), and Real Estate, Rental & Leasing (75.0%).
| Industry | Male | Female |
| Agriculture, Fishing & Hunting | 0 (0.0%) | 0 (0.0%) |
| Mining, Quarrying, & Extraction | 0 (0.0%) | 0 (0.0%) |
| Construction | 49 (100.0%) | 0 (0.0%) |
| Manufacturing | 100 (72.5%) | 38 (27.5%) |
| Wholesale Trade | 43 (66.1%) | 22 (33.9%) |
| Retail Trade | 90 (63.8%) | 51 (36.2%) |
| Transportation & Warehousing | 29 (74.4%) | 10 (25.6%) |
| Utilities | 5 (100.0%) | 0 (0.0%) |
| Information | 0 (0.0%) | 0 (0.0%) |
| Finance & Insurance | 65 (65.7%) | 34 (34.3%) |
| Real Estate, Rental & Leasing | 4 (25.0%) | 12 (75.0%) |
| Professional & Scientific | 64 (55.6%) | 51 (44.4%) |
| Enterprise Management | 0 (0.0%) | 0 (0.0%) |
| Administrative & Support | 32 (72.7%) | 12 (27.3%) |
| Educational Services | 60 (44.4%) | 75 (55.6%) |
| Health Care & Social Assistance | 55 (23.8%) | 176 (76.2%) |
| Arts, Entertainment & Recreation | 0 (0.0%) | 24 (100.0%) |
| Accommodation & Food Services | 68 (51.9%) | 63 (48.1%) |
| Public Administration | 5 (45.5%) | 6 (54.5%) |
| Total | 692 (53.4%) | 604 (46.6%) |
Education in Poland
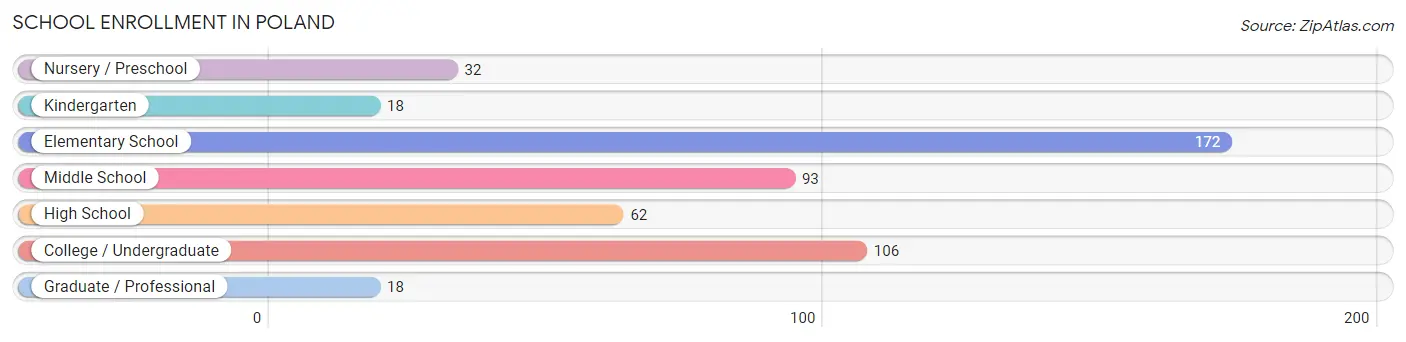
School Enrollment in Poland
The most common levels of schooling among the 501 students in Poland are elementary school (172 | 34.3%), college / undergraduate (106 | 21.2%), and middle school (93 | 18.6%).
| School Level | # Students | % Students |
| Nursery / Preschool | 32 | 6.4% |
| Kindergarten | 18 | 3.6% |
| Elementary School | 172 | 34.3% |
| Middle School | 93 | 18.6% |
| High School | 62 | 12.4% |
| College / Undergraduate | 106 | 21.2% |
| Graduate / Professional | 18 | 3.6% |
| Total | 501 | 100.0% |
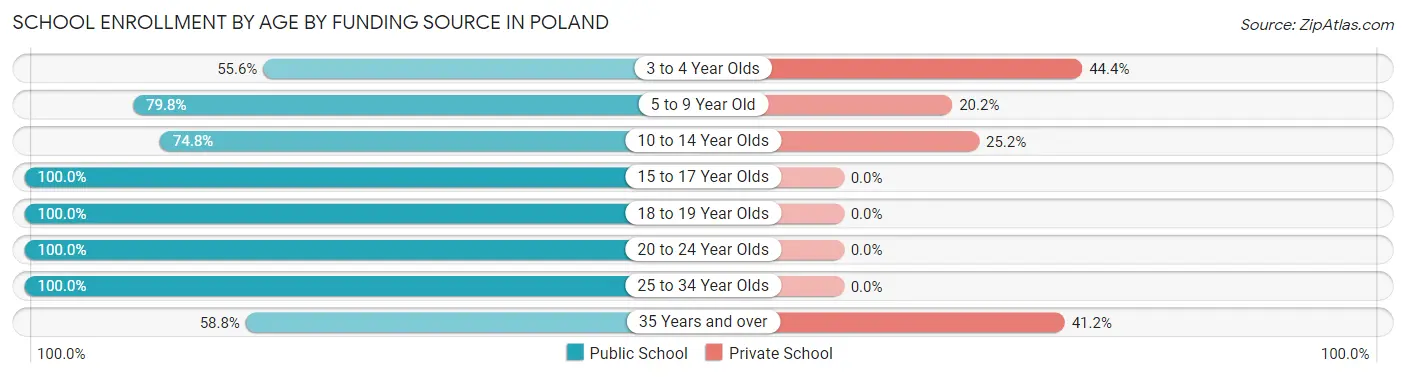
School Enrollment by Age by Funding Source in Poland
Out of a total of 501 students who are enrolled in schools in Poland, 81 (16.2%) attend a private institution, while the remaining 420 (83.8%) are enrolled in public schools. The age group of 3 to 4 year olds has the highest likelihood of being enrolled in private schools, with 8 (44.4% in the age bracket) enrolled. Conversely, the age group of 15 to 17 year olds has the lowest likelihood of being enrolled in a private school, with 55 (100.0% in the age bracket) attending a public institution.
| Age Bracket | Public School | Private School |
| 3 to 4 Year Olds | 10 (55.6%) | 8 (44.4%) |
| 5 to 9 Year Old | 142 (79.8%) | 36 (20.2%) |
| 10 to 14 Year Olds | 89 (74.8%) | 30 (25.2%) |
| 15 to 17 Year Olds | 55 (100.0%) | 0 (0.0%) |
| 18 to 19 Year Olds | 34 (100.0%) | 0 (0.0%) |
| 20 to 24 Year Olds | 64 (100.0%) | 0 (0.0%) |
| 25 to 34 Year Olds | 16 (100.0%) | 0 (0.0%) |
| 35 Years and over | 10 (58.8%) | 7 (41.2%) |
| Total | 420 (83.8%) | 81 (16.2%) |
Educational Attainment by Field of Study in Poland
Business (281 | 31.8%), science & technology (129 | 14.6%), education (108 | 12.2%), liberal arts & history (65 | 7.3%), and bio, nature & agricultural (56 | 6.3%) are the most common fields of study among 885 individuals in Poland who have obtained a bachelor's degree or higher.
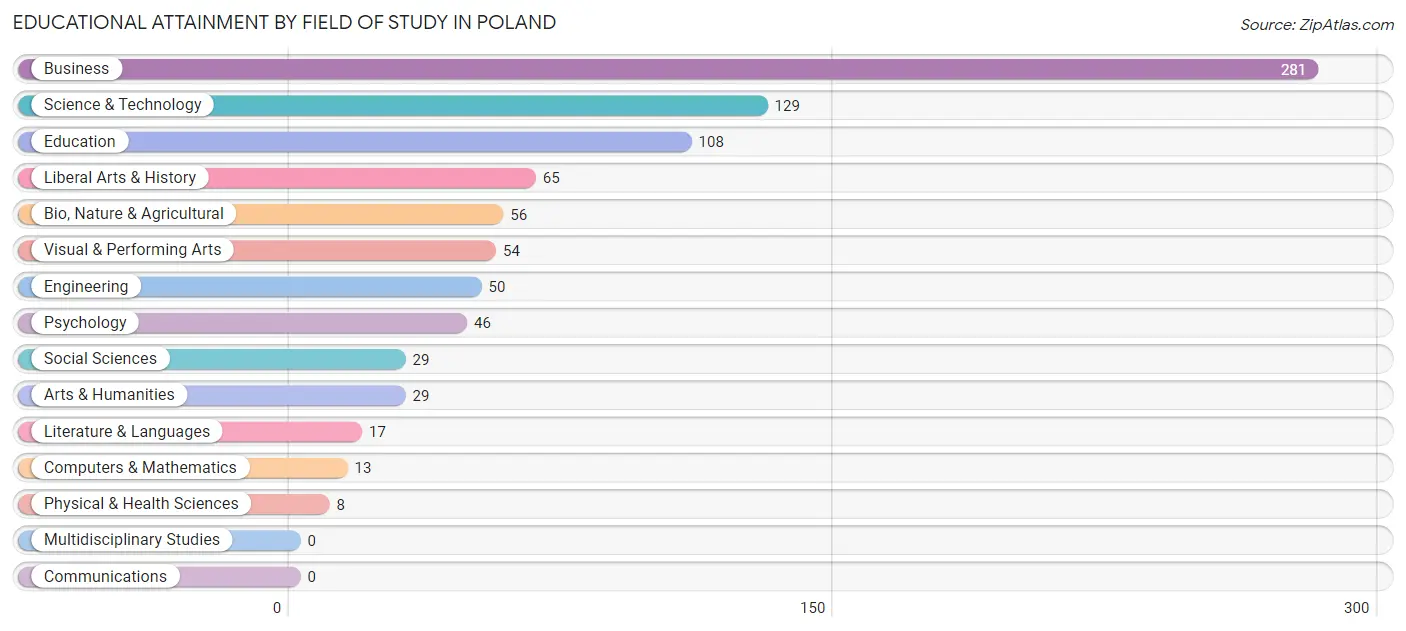
| Field of Study | # Graduates | % Graduates |
| Computers & Mathematics | 13 | 1.5% |
| Bio, Nature & Agricultural | 56 | 6.3% |
| Physical & Health Sciences | 8 | 0.9% |
| Psychology | 46 | 5.2% |
| Social Sciences | 29 | 3.3% |
| Engineering | 50 | 5.7% |
| Multidisciplinary Studies | 0 | 0.0% |
| Science & Technology | 129 | 14.6% |
| Business | 281 | 31.8% |
| Education | 108 | 12.2% |
| Literature & Languages | 17 | 1.9% |
| Liberal Arts & History | 65 | 7.3% |
| Visual & Performing Arts | 54 | 6.1% |
| Communications | 0 | 0.0% |
| Arts & Humanities | 29 | 3.3% |
| Total | 885 | 100.0% |
Transportation & Commute in Poland
Vehicle Availability by Sex in Poland
The most prevalent vehicle ownership categories in Poland are males with 2 vehicles (358, accounting for 51.7%) and females with 2 vehicles (273, making up 62.4%).
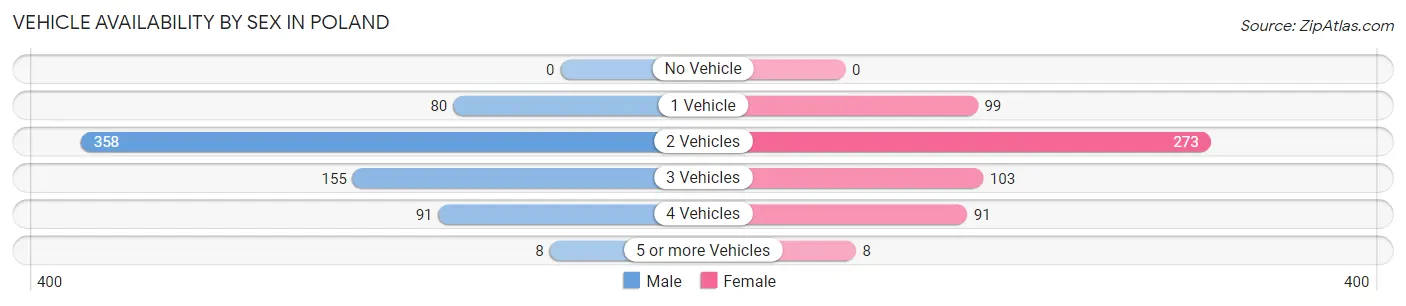
| Vehicles Available | Male | Female |
| No Vehicle | 0 (0.0%) | 0 (0.0%) |
| 1 Vehicle | 80 (11.6%) | 99 (17.2%) |
| 2 Vehicles | 358 (51.7%) | 273 (47.6%) |
| 3 Vehicles | 155 (22.4%) | 103 (17.9%) |
| 4 Vehicles | 91 (13.2%) | 91 (15.9%) |
| 5 or more Vehicles | 8 (1.2%) | 8 (1.4%) |
| Total | 692 (100.0%) | 574 (100.0%) |
Commute Time in Poland
The most frequently occuring commute durations in Poland are 15 to 19 minutes (267 commuters, 24.3%), 10 to 14 minutes (251 commuters, 22.9%), and 5 to 9 minutes (108 commuters, 9.8%).
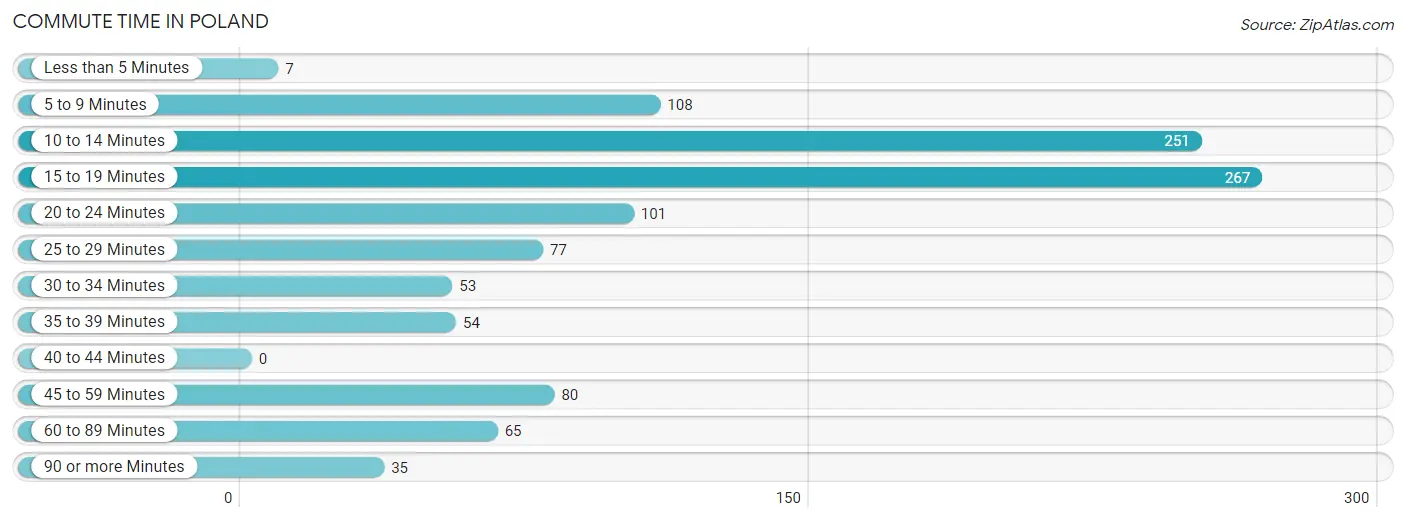
| Commute Time | # Commuters | % Commuters |
| Less than 5 Minutes | 7 | 0.6% |
| 5 to 9 Minutes | 108 | 9.8% |
| 10 to 14 Minutes | 251 | 22.9% |
| 15 to 19 Minutes | 267 | 24.3% |
| 20 to 24 Minutes | 101 | 9.2% |
| 25 to 29 Minutes | 77 | 7.0% |
| 30 to 34 Minutes | 53 | 4.8% |
| 35 to 39 Minutes | 54 | 4.9% |
| 40 to 44 Minutes | 0 | 0.0% |
| 45 to 59 Minutes | 80 | 7.3% |
| 60 to 89 Minutes | 65 | 5.9% |
| 90 or more Minutes | 35 | 3.2% |
Commute Time by Sex in Poland
The most common commute times in Poland are 15 to 19 minutes (154 commuters, 26.2%) for males and 10 to 14 minutes (135 commuters, 26.4%) for females.
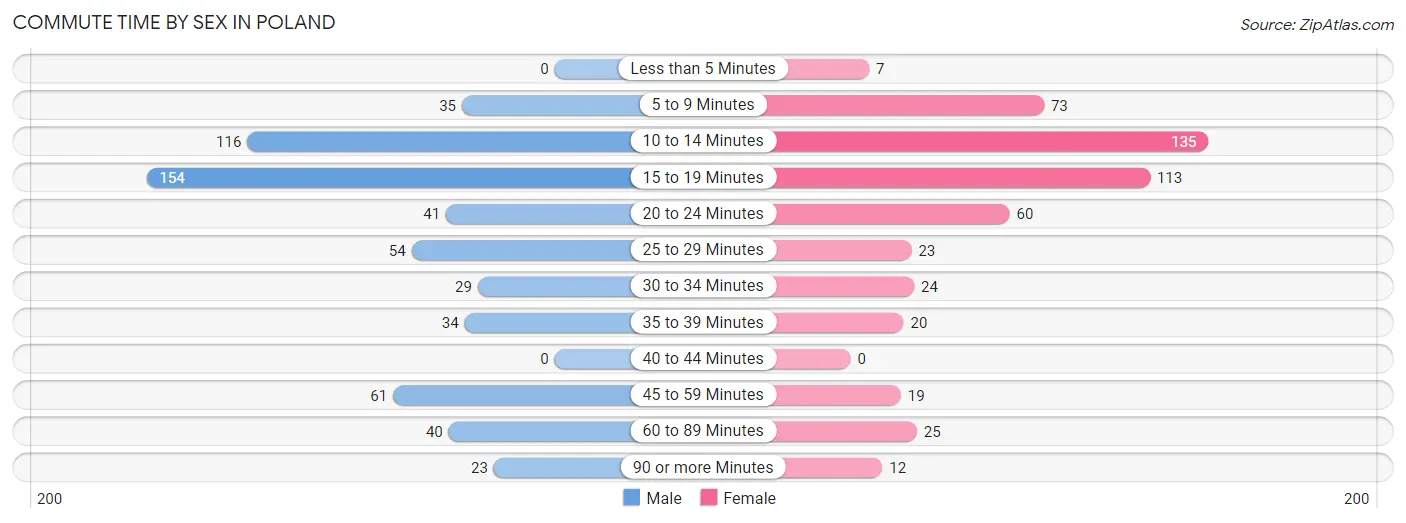
| Commute Time | Male | Female |
| Less than 5 Minutes | 0 (0.0%) | 7 (1.4%) |
| 5 to 9 Minutes | 35 (6.0%) | 73 (14.3%) |
| 10 to 14 Minutes | 116 (19.8%) | 135 (26.4%) |
| 15 to 19 Minutes | 154 (26.2%) | 113 (22.1%) |
| 20 to 24 Minutes | 41 (7.0%) | 60 (11.7%) |
| 25 to 29 Minutes | 54 (9.2%) | 23 (4.5%) |
| 30 to 34 Minutes | 29 (4.9%) | 24 (4.7%) |
| 35 to 39 Minutes | 34 (5.8%) | 20 (3.9%) |
| 40 to 44 Minutes | 0 (0.0%) | 0 (0.0%) |
| 45 to 59 Minutes | 61 (10.4%) | 19 (3.7%) |
| 60 to 89 Minutes | 40 (6.8%) | 25 (4.9%) |
| 90 or more Minutes | 23 (3.9%) | 12 (2.4%) |
Time of Departure to Work by Sex in Poland
The most frequent times of departure to work in Poland are 7:30 AM to 7:59 AM (97, 16.5%) for males and 7:30 AM to 7:59 AM (87, 17.0%) for females.
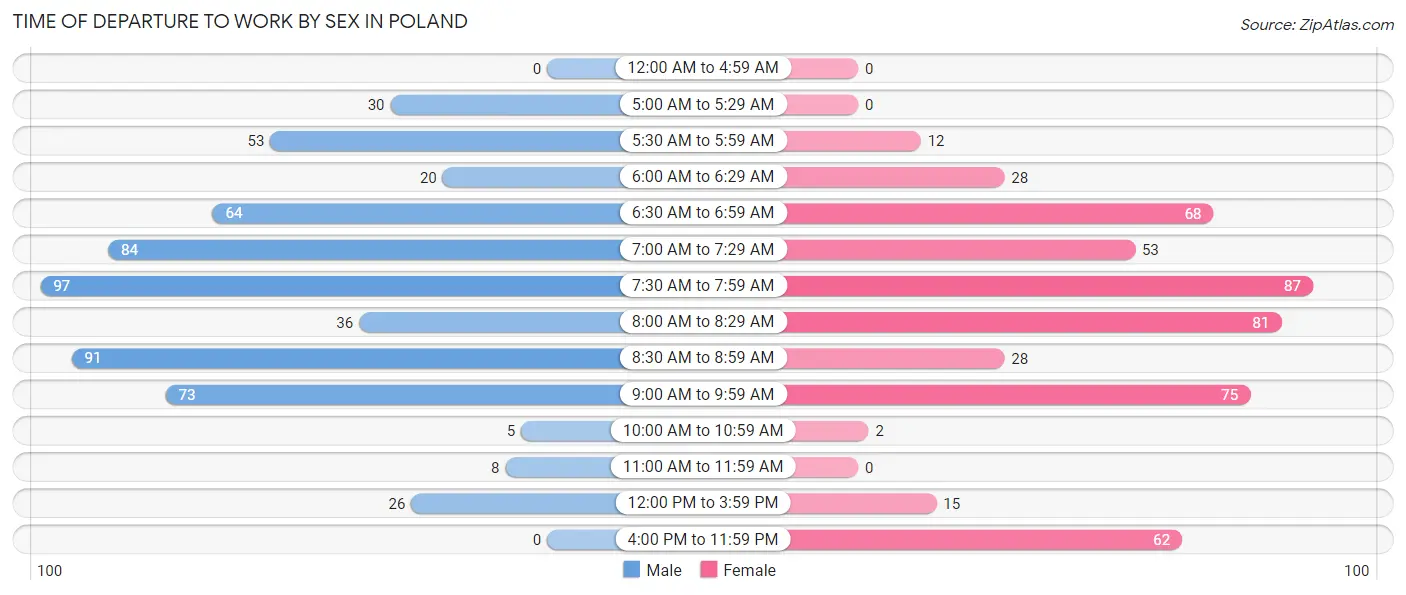
| Time of Departure | Male | Female |
| 12:00 AM to 4:59 AM | 0 (0.0%) | 0 (0.0%) |
| 5:00 AM to 5:29 AM | 30 (5.1%) | 0 (0.0%) |
| 5:30 AM to 5:59 AM | 53 (9.0%) | 12 (2.4%) |
| 6:00 AM to 6:29 AM | 20 (3.4%) | 28 (5.5%) |
| 6:30 AM to 6:59 AM | 64 (10.9%) | 68 (13.3%) |
| 7:00 AM to 7:29 AM | 84 (14.3%) | 53 (10.4%) |
| 7:30 AM to 7:59 AM | 97 (16.5%) | 87 (17.0%) |
| 8:00 AM to 8:29 AM | 36 (6.1%) | 81 (15.9%) |
| 8:30 AM to 8:59 AM | 91 (15.5%) | 28 (5.5%) |
| 9:00 AM to 9:59 AM | 73 (12.4%) | 75 (14.7%) |
| 10:00 AM to 10:59 AM | 5 (0.9%) | 2 (0.4%) |
| 11:00 AM to 11:59 AM | 8 (1.4%) | 0 (0.0%) |
| 12:00 PM to 3:59 PM | 26 (4.4%) | 15 (2.9%) |
| 4:00 PM to 11:59 PM | 0 (0.0%) | 62 (12.1%) |
| Total | 587 (100.0%) | 511 (100.0%) |
Housing Occupancy in Poland
Occupancy by Ownership in Poland
Of the total 1,090 dwellings in Poland, owner-occupied units account for 968 (88.8%), while renter-occupied units make up 122 (11.2%).
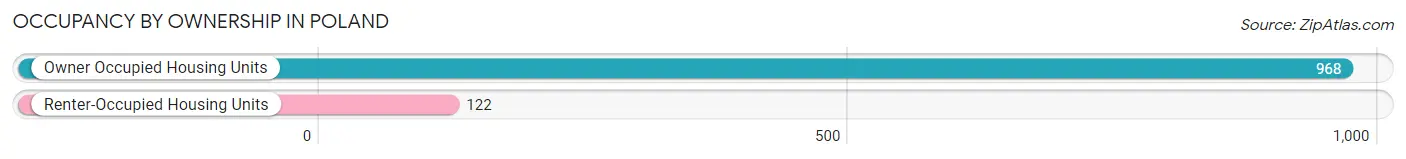
| Occupancy | # Housing Units | % Housing Units |
| Owner Occupied Housing Units | 968 | 88.8% |
| Renter-Occupied Housing Units | 122 | 11.2% |
| Total Occupied Housing Units | 1,090 | 100.0% |
Occupancy by Household Size in Poland
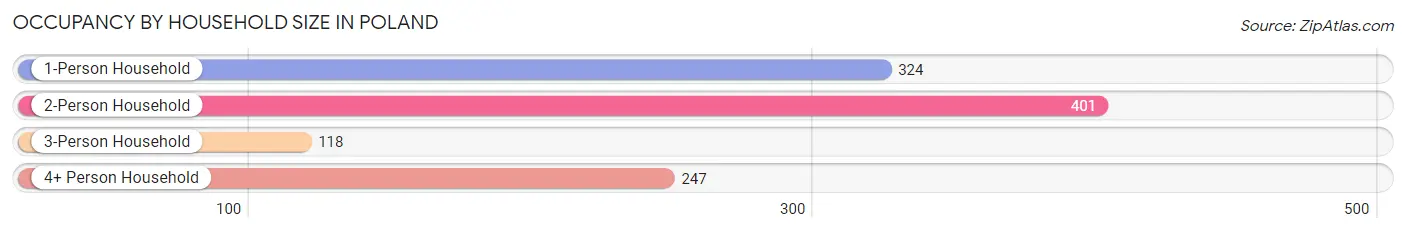
| Household Size | # Housing Units | % Housing Units |
| 1-Person Household | 324 | 29.7% |
| 2-Person Household | 401 | 36.8% |
| 3-Person Household | 118 | 10.8% |
| 4+ Person Household | 247 | 22.7% |
| Total Housing Units | 1,090 | 100.0% |
Occupancy by Ownership by Household Size in Poland
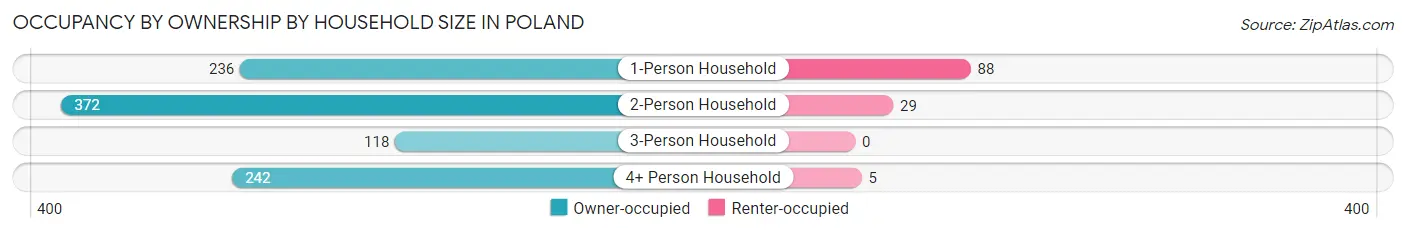
| Household Size | Owner-occupied | Renter-occupied |
| 1-Person Household | 236 (72.8%) | 88 (27.2%) |
| 2-Person Household | 372 (92.8%) | 29 (7.2%) |
| 3-Person Household | 118 (100.0%) | 0 (0.0%) |
| 4+ Person Household | 242 (98.0%) | 5 (2.0%) |
| Total Housing Units | 968 (88.8%) | 122 (11.2%) |
Occupancy by Educational Attainment in Poland
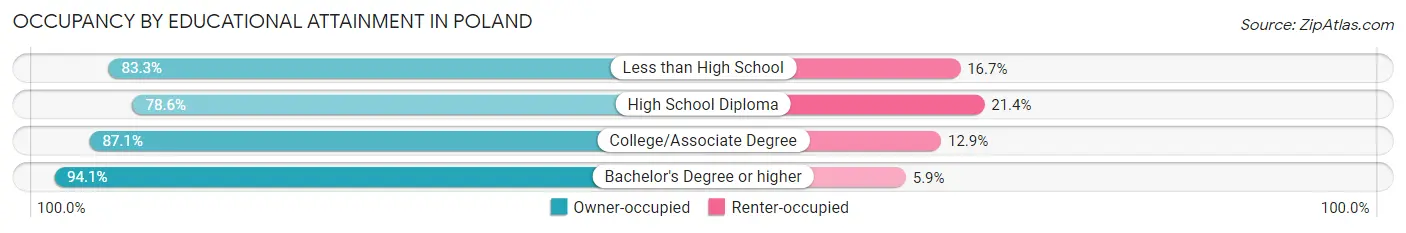
| Household Size | Owner-occupied | Renter-occupied |
| Less than High School | 15 (83.3%) | 3 (16.7%) |
| High School Diploma | 165 (78.6%) | 45 (21.4%) |
| College/Associate Degree | 291 (87.1%) | 43 (12.9%) |
| Bachelor's Degree or higher | 497 (94.1%) | 31 (5.9%) |
Occupancy by Age of Householder in Poland
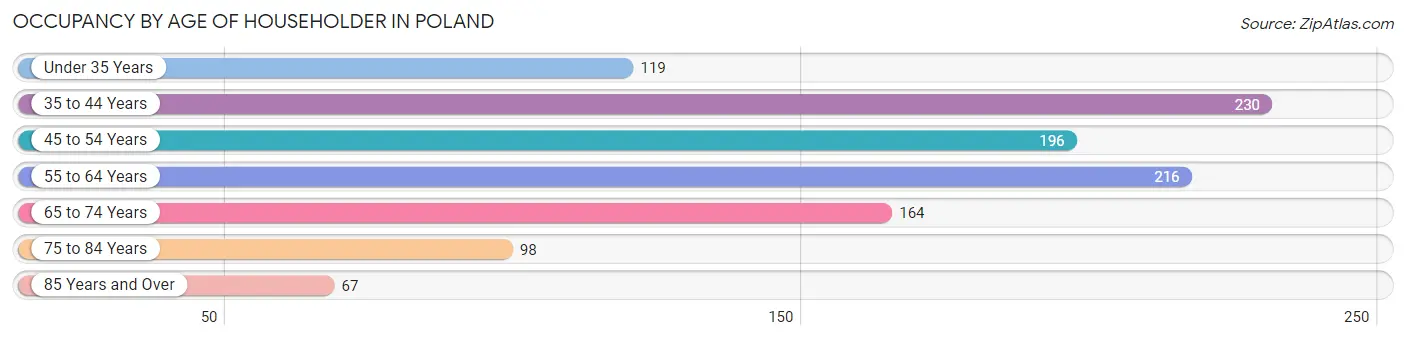
| Age Bracket | # Households | % Households |
| Under 35 Years | 119 | 10.9% |
| 35 to 44 Years | 230 | 21.1% |
| 45 to 54 Years | 196 | 18.0% |
| 55 to 64 Years | 216 | 19.8% |
| 65 to 74 Years | 164 | 15.0% |
| 75 to 84 Years | 98 | 9.0% |
| 85 Years and Over | 67 | 6.1% |
| Total | 1,090 | 100.0% |
Housing Finances in Poland
Median Income by Occupancy in Poland
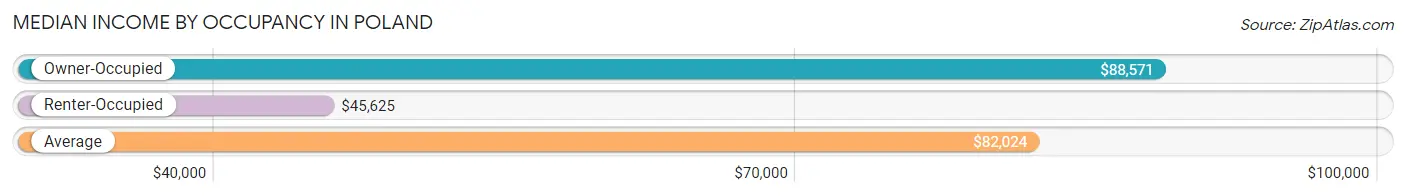
| Occupancy Type | # Households | Median Income |
| Owner-Occupied | 968 (88.8%) | $88,571 |
| Renter-Occupied | 122 (11.2%) | $45,625 |
| Average | 1,090 (100.0%) | $82,024 |
Occupancy by Householder Income Bracket in Poland
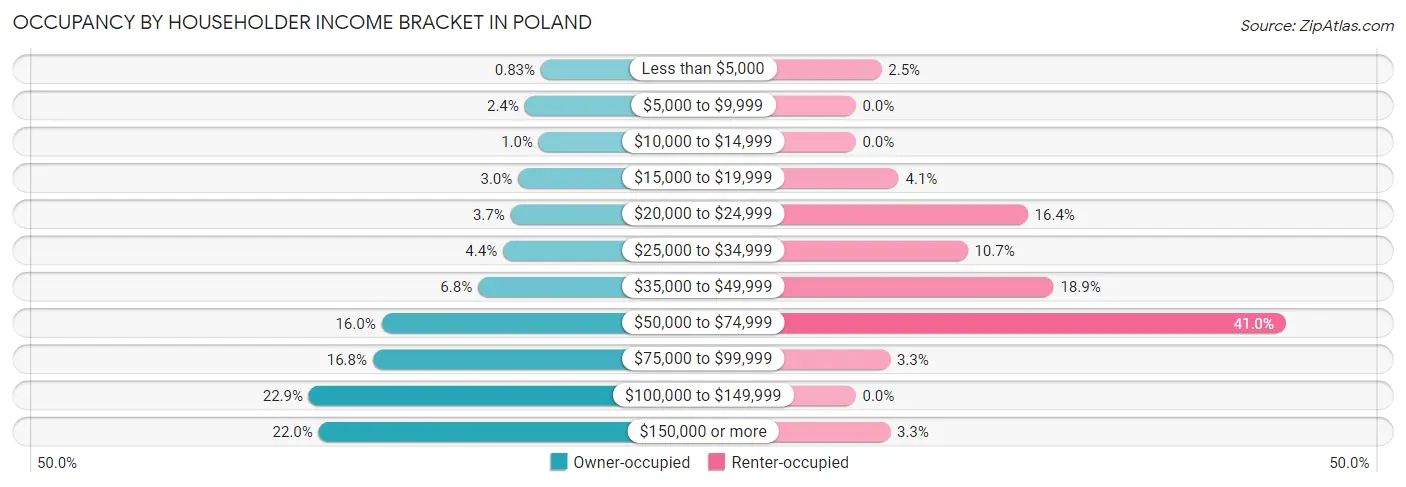
| Income Bracket | Owner-occupied | Renter-occupied |
| Less than $5,000 | 8 (0.8%) | 3 (2.5%) |
| $5,000 to $9,999 | 23 (2.4%) | 0 (0.0%) |
| $10,000 to $14,999 | 10 (1.0%) | 0 (0.0%) |
| $15,000 to $19,999 | 29 (3.0%) | 5 (4.1%) |
| $20,000 to $24,999 | 36 (3.7%) | 20 (16.4%) |
| $25,000 to $34,999 | 43 (4.4%) | 13 (10.7%) |
| $35,000 to $49,999 | 66 (6.8%) | 23 (18.9%) |
| $50,000 to $74,999 | 155 (16.0%) | 50 (41.0%) |
| $75,000 to $99,999 | 163 (16.8%) | 4 (3.3%) |
| $100,000 to $149,999 | 222 (22.9%) | 0 (0.0%) |
| $150,000 or more | 213 (22.0%) | 4 (3.3%) |
| Total | 968 (100.0%) | 122 (100.0%) |
Monthly Housing Cost Tiers in Poland
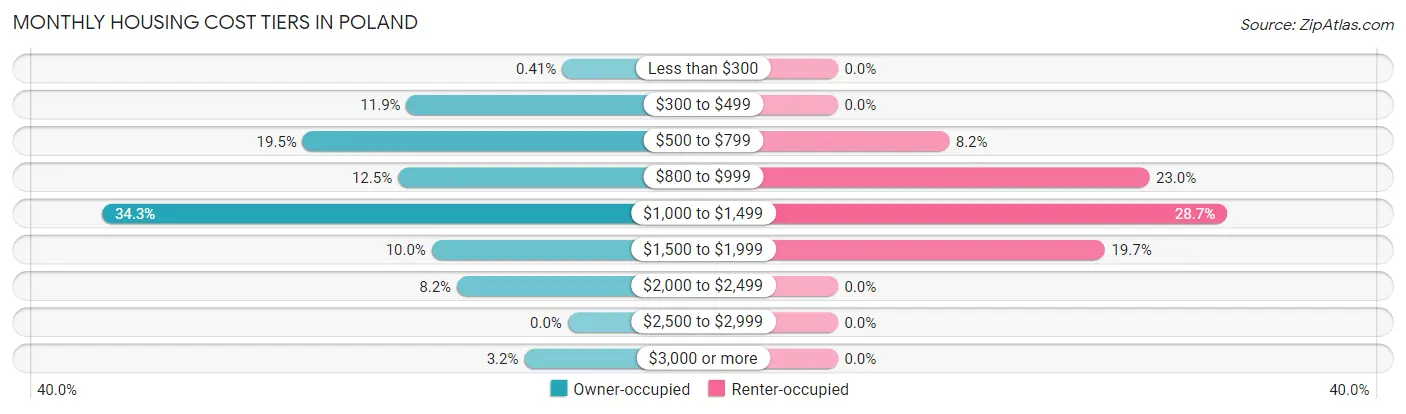
| Monthly Cost | Owner-occupied | Renter-occupied |
| Less than $300 | 4 (0.4%) | 0 (0.0%) |
| $300 to $499 | 115 (11.9%) | 0 (0.0%) |
| $500 to $799 | 189 (19.5%) | 10 (8.2%) |
| $800 to $999 | 121 (12.5%) | 28 (23.0%) |
| $1,000 to $1,499 | 332 (34.3%) | 35 (28.7%) |
| $1,500 to $1,999 | 97 (10.0%) | 24 (19.7%) |
| $2,000 to $2,499 | 79 (8.2%) | 0 (0.0%) |
| $2,500 to $2,999 | 0 (0.0%) | 0 (0.0%) |
| $3,000 or more | 31 (3.2%) | 0 (0.0%) |
| Total | 968 (100.0%) | 122 (100.0%) |
Physical Housing Characteristics in Poland
Housing Structures in Poland
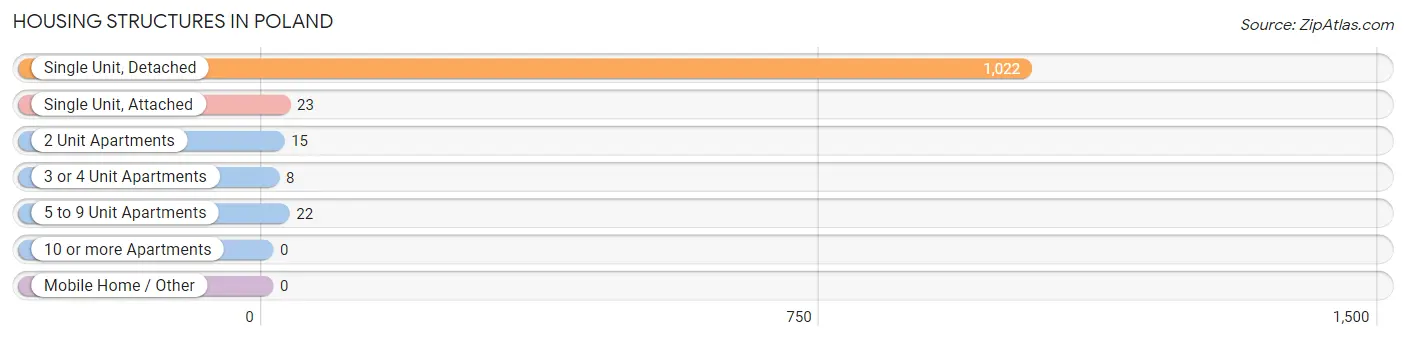
| Structure Type | # Housing Units | % Housing Units |
| Single Unit, Detached | 1,022 | 93.8% |
| Single Unit, Attached | 23 | 2.1% |
| 2 Unit Apartments | 15 | 1.4% |
| 3 or 4 Unit Apartments | 8 | 0.7% |
| 5 to 9 Unit Apartments | 22 | 2.0% |
| 10 or more Apartments | 0 | 0.0% |
| Mobile Home / Other | 0 | 0.0% |
| Total | 1,090 | 100.0% |
Housing Structures by Occupancy in Poland
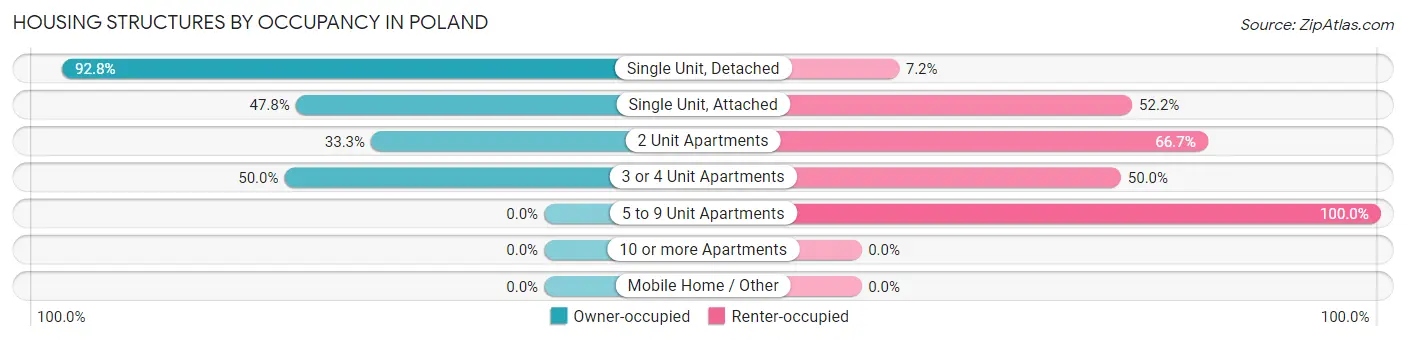
| Structure Type | Owner-occupied | Renter-occupied |
| Single Unit, Detached | 948 (92.8%) | 74 (7.2%) |
| Single Unit, Attached | 11 (47.8%) | 12 (52.2%) |
| 2 Unit Apartments | 5 (33.3%) | 10 (66.7%) |
| 3 or 4 Unit Apartments | 4 (50.0%) | 4 (50.0%) |
| 5 to 9 Unit Apartments | 0 (0.0%) | 22 (100.0%) |
| 10 or more Apartments | 0 (0.0%) | 0 (0.0%) |
| Mobile Home / Other | 0 (0.0%) | 0 (0.0%) |
| Total | 968 (88.8%) | 122 (11.2%) |
Housing Structures by Number of Rooms in Poland
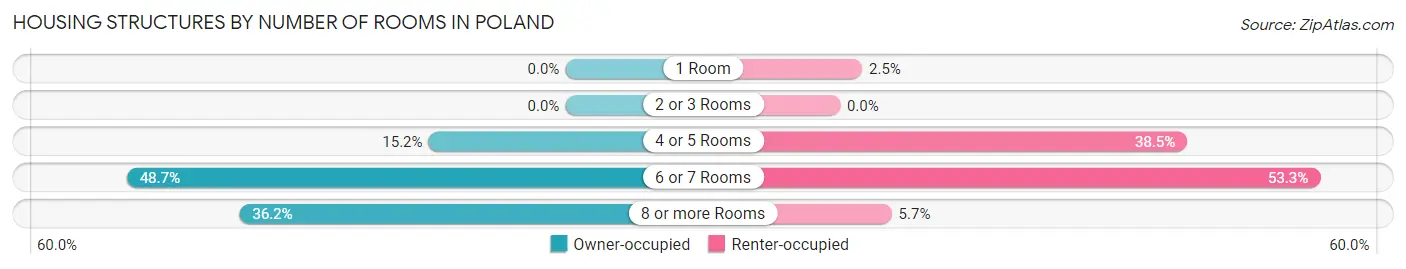
| Number of Rooms | Owner-occupied | Renter-occupied |
| 1 Room | 0 (0.0%) | 3 (2.5%) |
| 2 or 3 Rooms | 0 (0.0%) | 0 (0.0%) |
| 4 or 5 Rooms | 147 (15.2%) | 47 (38.5%) |
| 6 or 7 Rooms | 471 (48.7%) | 65 (53.3%) |
| 8 or more Rooms | 350 (36.2%) | 7 (5.7%) |
| Total | 968 (100.0%) | 122 (100.0%) |
Housing Structure by Heating Type in Poland
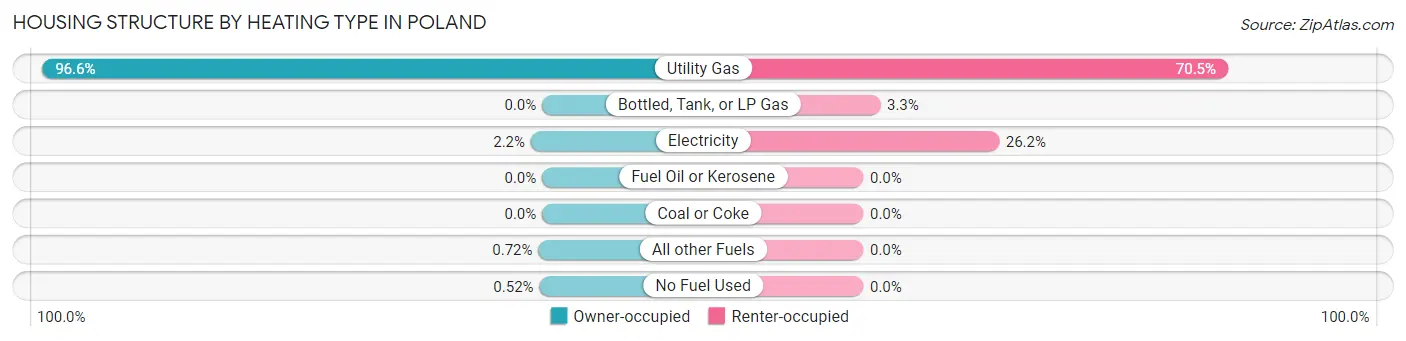
| Heating Type | Owner-occupied | Renter-occupied |
| Utility Gas | 935 (96.6%) | 86 (70.5%) |
| Bottled, Tank, or LP Gas | 0 (0.0%) | 4 (3.3%) |
| Electricity | 21 (2.2%) | 32 (26.2%) |
| Fuel Oil or Kerosene | 0 (0.0%) | 0 (0.0%) |
| Coal or Coke | 0 (0.0%) | 0 (0.0%) |
| All other Fuels | 7 (0.7%) | 0 (0.0%) |
| No Fuel Used | 5 (0.5%) | 0 (0.0%) |
| Total | 968 (100.0%) | 122 (100.0%) |
Household Vehicle Usage in Poland
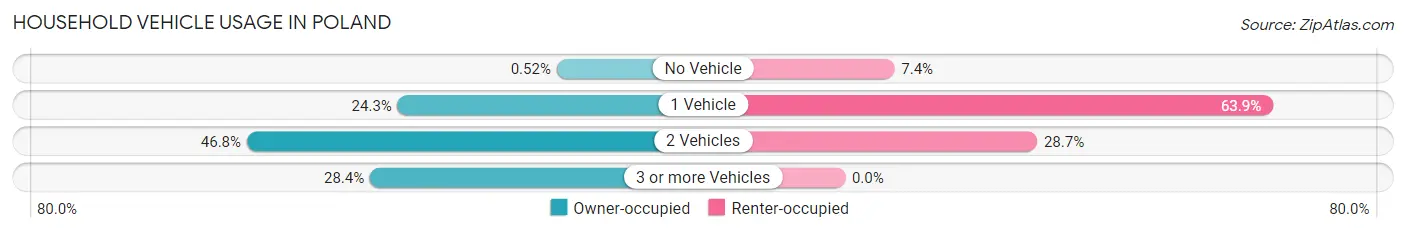
| Vehicles per Household | Owner-occupied | Renter-occupied |
| No Vehicle | 5 (0.5%) | 9 (7.4%) |
| 1 Vehicle | 235 (24.3%) | 78 (63.9%) |
| 2 Vehicles | 453 (46.8%) | 35 (28.7%) |
| 3 or more Vehicles | 275 (28.4%) | 0 (0.0%) |
| Total | 968 (100.0%) | 122 (100.0%) |
Real Estate & Mortgages in Poland
Real Estate and Mortgage Overview in Poland
| Characteristic | Without Mortgage | With Mortgage |
| Housing Units | 321 | 647 |
| Median Property Value | $172,300 | $195,100 |
| Median Household Income | $71,827 | $134 |
| Monthly Housing Costs | $586 | $26 |
| Real Estate Taxes | $2,781 | $0 |
Property Value by Mortgage Status in Poland
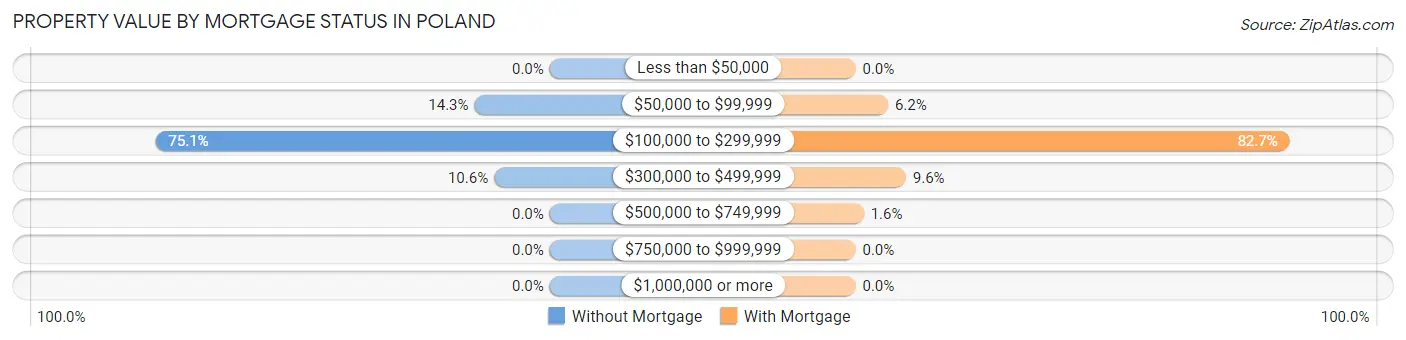
| Property Value | Without Mortgage | With Mortgage |
| Less than $50,000 | 0 (0.0%) | 0 (0.0%) |
| $50,000 to $99,999 | 46 (14.3%) | 40 (6.2%) |
| $100,000 to $299,999 | 241 (75.1%) | 535 (82.7%) |
| $300,000 to $499,999 | 34 (10.6%) | 62 (9.6%) |
| $500,000 to $749,999 | 0 (0.0%) | 10 (1.5%) |
| $750,000 to $999,999 | 0 (0.0%) | 0 (0.0%) |
| $1,000,000 or more | 0 (0.0%) | 0 (0.0%) |
| Total | 321 (100.0%) | 647 (100.0%) |
Household Income by Mortgage Status in Poland
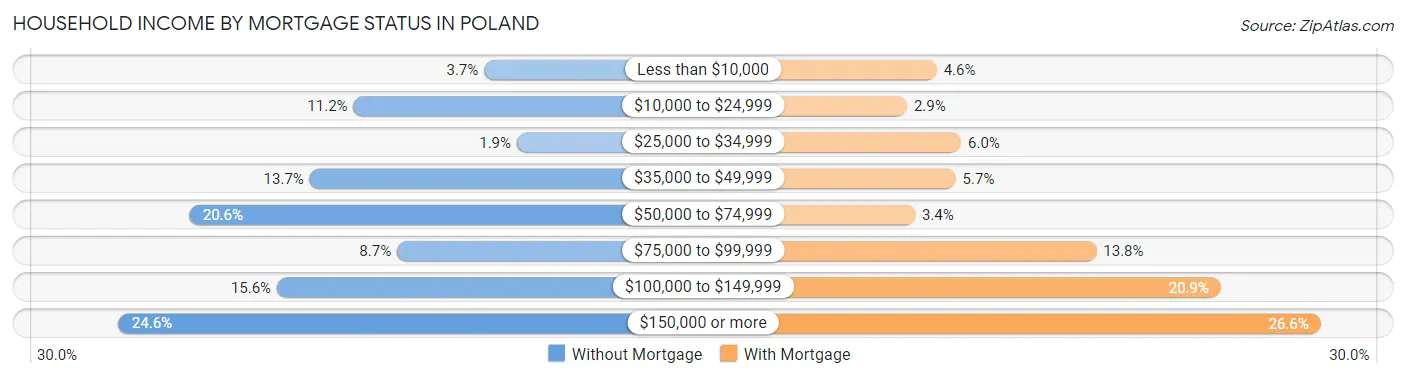
| Household Income | Without Mortgage | With Mortgage |
| Less than $10,000 | 12 (3.7%) | 30 (4.6%) |
| $10,000 to $24,999 | 36 (11.2%) | 19 (2.9%) |
| $25,000 to $34,999 | 6 (1.9%) | 39 (6.0%) |
| $35,000 to $49,999 | 44 (13.7%) | 37 (5.7%) |
| $50,000 to $74,999 | 66 (20.6%) | 22 (3.4%) |
| $75,000 to $99,999 | 28 (8.7%) | 89 (13.8%) |
| $100,000 to $149,999 | 50 (15.6%) | 135 (20.9%) |
| $150,000 or more | 79 (24.6%) | 172 (26.6%) |
| Total | 321 (100.0%) | 647 (100.0%) |
Property Value to Household Income Ratio in Poland
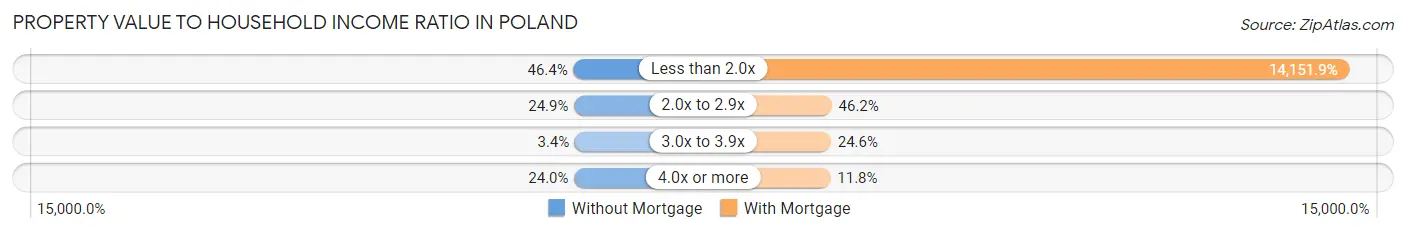
| Value-to-Income Ratio | Without Mortgage | With Mortgage |
| Less than 2.0x | 149 (46.4%) | 91,563 (14,151.9%) |
| 2.0x to 2.9x | 80 (24.9%) | 299 (46.2%) |
| 3.0x to 3.9x | 11 (3.4%) | 159 (24.6%) |
| 4.0x or more | 77 (24.0%) | 76 (11.7%) |
| Total | 321 (100.0%) | 647 (100.0%) |
Real Estate Taxes by Mortgage Status in Poland
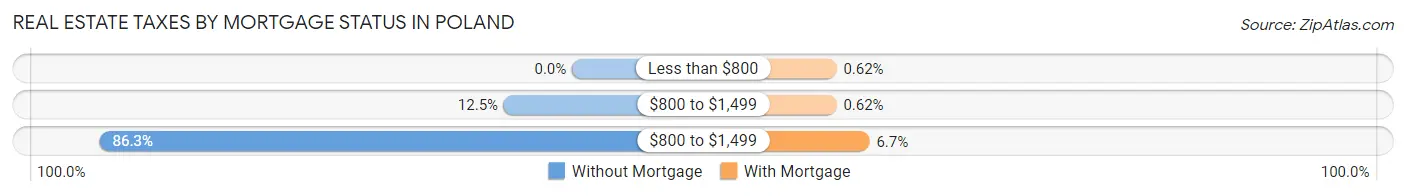
| Property Taxes | Without Mortgage | With Mortgage |
| Less than $800 | 0 (0.0%) | 4 (0.6%) |
| $800 to $1,499 | 40 (12.5%) | 4 (0.6%) |
| $800 to $1,499 | 277 (86.3%) | 43 (6.7%) |
| Total | 321 (100.0%) | 647 (100.0%) |
Health & Disability in Poland
Health Insurance Coverage by Age in Poland
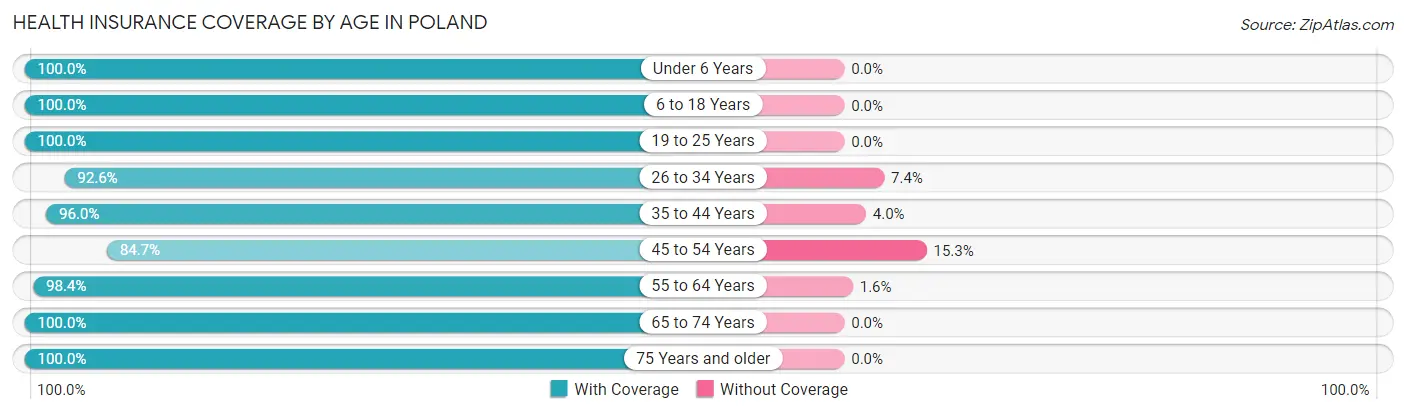
| Age Bracket | With Coverage | Without Coverage |
| Under 6 Years | 165 (100.0%) | 0 (0.0%) |
| 6 to 18 Years | 390 (100.0%) | 0 (0.0%) |
| 19 to 25 Years | 116 (100.0%) | 0 (0.0%) |
| 26 to 34 Years | 274 (92.6%) | 22 (7.4%) |
| 35 to 44 Years | 334 (96.0%) | 14 (4.0%) |
| 45 to 54 Years | 298 (84.7%) | 54 (15.3%) |
| 55 to 64 Years | 374 (98.4%) | 6 (1.6%) |
| 65 to 74 Years | 290 (100.0%) | 0 (0.0%) |
| 75 Years and older | 236 (100.0%) | 0 (0.0%) |
| Total | 2,477 (96.3%) | 96 (3.7%) |
Health Insurance Coverage by Citizenship Status in Poland
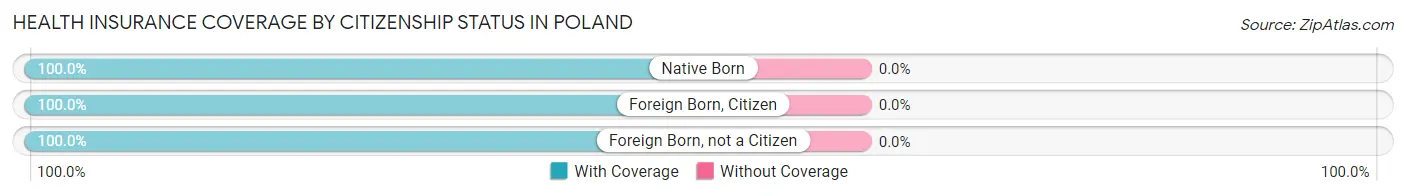
| Citizenship Status | With Coverage | Without Coverage |
| Native Born | 165 (100.0%) | 0 (0.0%) |
| Foreign Born, Citizen | 390 (100.0%) | 0 (0.0%) |
| Foreign Born, not a Citizen | 116 (100.0%) | 0 (0.0%) |
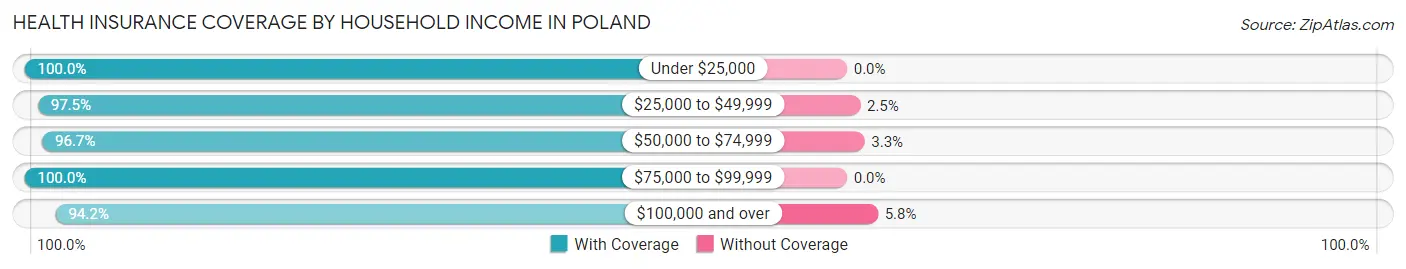
Health Insurance Coverage by Household Income in Poland
| Household Income | With Coverage | Without Coverage |
| Under $25,000 | 190 (100.0%) | 0 (0.0%) |
| $25,000 to $49,999 | 236 (97.5%) | 6 (2.5%) |
| $50,000 to $74,999 | 382 (96.7%) | 13 (3.3%) |
| $75,000 to $99,999 | 416 (100.0%) | 0 (0.0%) |
| $100,000 and over | 1,253 (94.2%) | 77 (5.8%) |
Public vs Private Health Insurance Coverage by Age in Poland
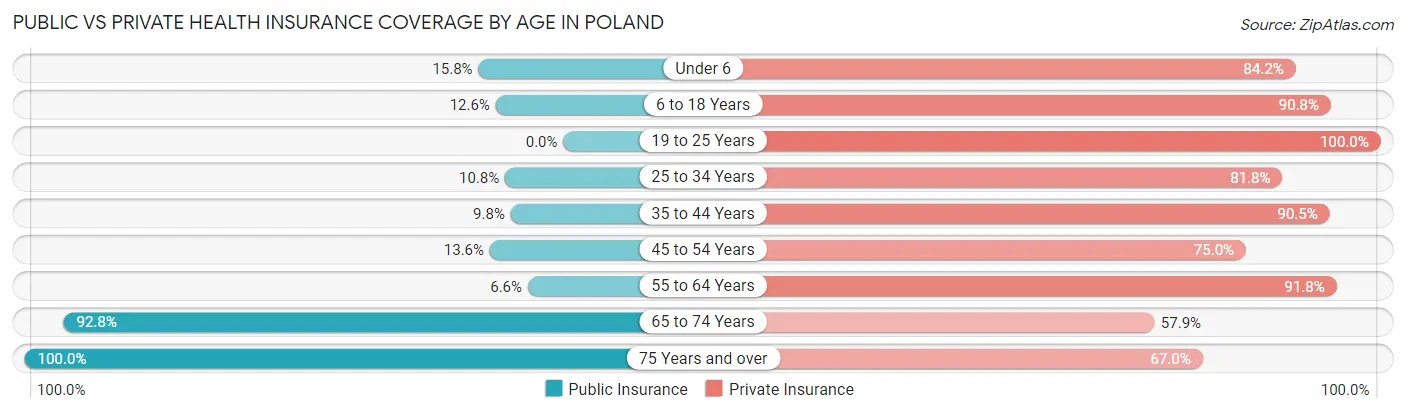
| Age Bracket | Public Insurance | Private Insurance |
| Under 6 | 26 (15.8%) | 139 (84.2%) |
| 6 to 18 Years | 49 (12.6%) | 354 (90.8%) |
| 19 to 25 Years | 0 (0.0%) | 116 (100.0%) |
| 25 to 34 Years | 32 (10.8%) | 242 (81.8%) |
| 35 to 44 Years | 34 (9.8%) | 315 (90.5%) |
| 45 to 54 Years | 48 (13.6%) | 264 (75.0%) |
| 55 to 64 Years | 25 (6.6%) | 349 (91.8%) |
| 65 to 74 Years | 269 (92.8%) | 168 (57.9%) |
| 75 Years and over | 236 (100.0%) | 158 (66.9%) |
| Total | 719 (27.9%) | 2,105 (81.8%) |
Disability Status by Sex by Age in Poland
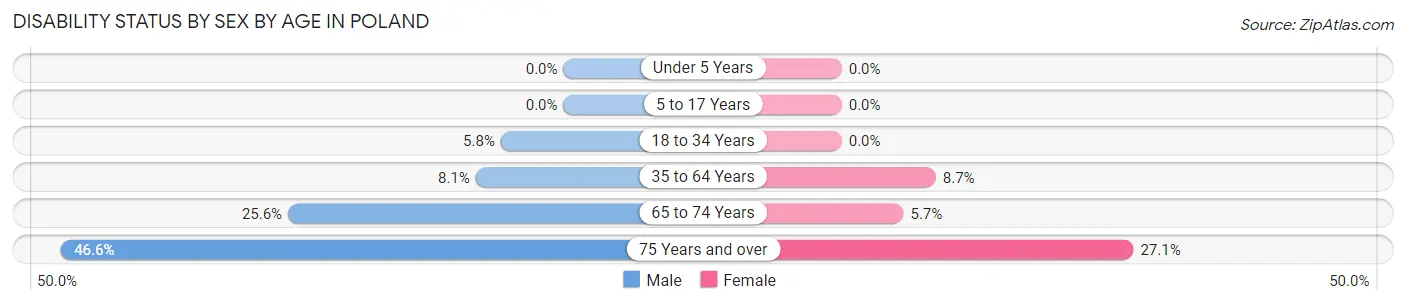
| Age Bracket | Male | Female |
| Under 5 Years | 0 (0.0%) | 0 (0.0%) |
| 5 to 17 Years | 0 (0.0%) | 0 (0.0%) |
| 18 to 34 Years | 14 (5.8%) | 0 (0.0%) |
| 35 to 64 Years | 45 (8.1%) | 46 (8.7%) |
| 65 to 74 Years | 34 (25.6%) | 9 (5.7%) |
| 75 Years and over | 48 (46.6%) | 36 (27.1%) |
Disability Class by Sex by Age in Poland
Disability Class: Hearing Difficulty
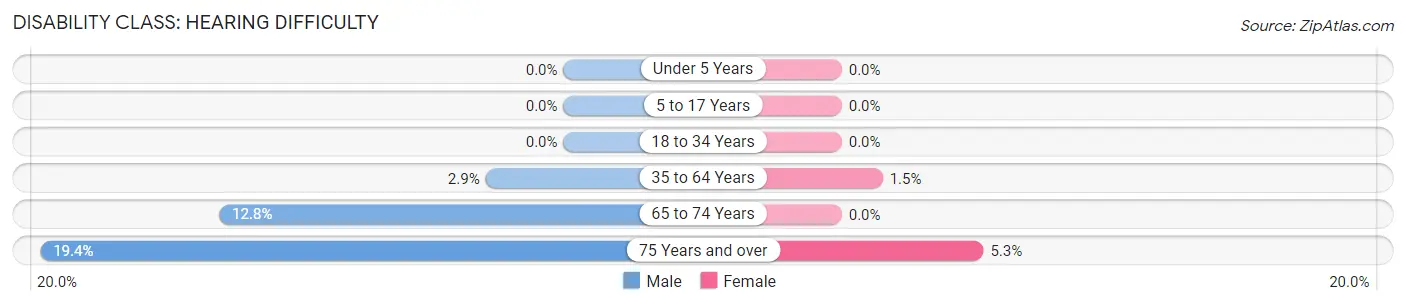
| Age Bracket | Male | Female |
| Under 5 Years | 0 (0.0%) | 0 (0.0%) |
| 5 to 17 Years | 0 (0.0%) | 0 (0.0%) |
| 18 to 34 Years | 0 (0.0%) | 0 (0.0%) |
| 35 to 64 Years | 16 (2.9%) | 8 (1.5%) |
| 65 to 74 Years | 17 (12.8%) | 0 (0.0%) |
| 75 Years and over | 20 (19.4%) | 7 (5.3%) |
Disability Class: Vision Difficulty
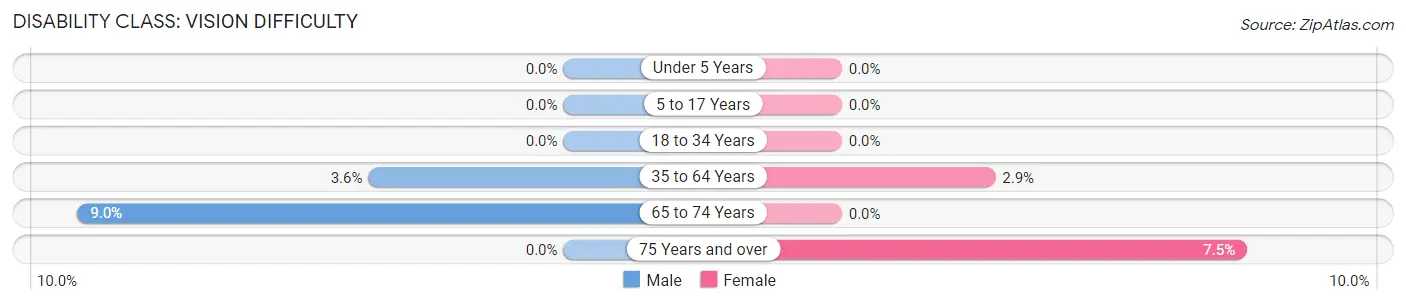
| Age Bracket | Male | Female |
| Under 5 Years | 0 (0.0%) | 0 (0.0%) |
| 5 to 17 Years | 0 (0.0%) | 0 (0.0%) |
| 18 to 34 Years | 0 (0.0%) | 0 (0.0%) |
| 35 to 64 Years | 20 (3.6%) | 15 (2.9%) |
| 65 to 74 Years | 12 (9.0%) | 0 (0.0%) |
| 75 Years and over | 0 (0.0%) | 10 (7.5%) |
Disability Class: Cognitive Difficulty
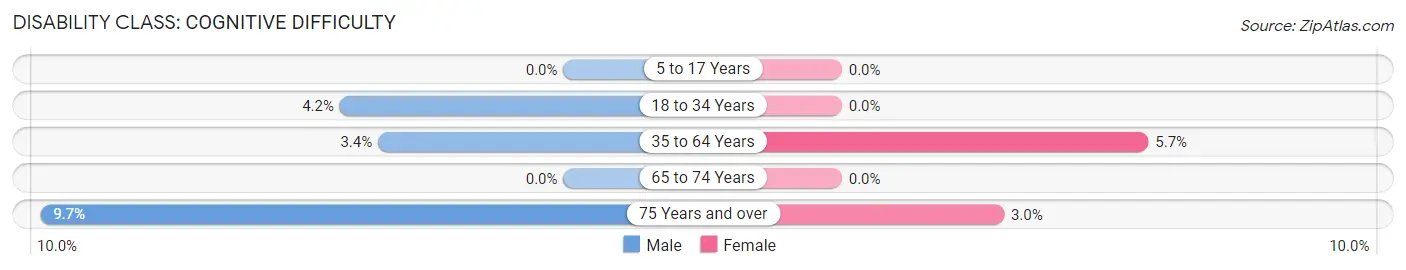
| Age Bracket | Male | Female |
| 5 to 17 Years | 0 (0.0%) | 0 (0.0%) |
| 18 to 34 Years | 10 (4.2%) | 0 (0.0%) |
| 35 to 64 Years | 19 (3.4%) | 30 (5.7%) |
| 65 to 74 Years | 0 (0.0%) | 0 (0.0%) |
| 75 Years and over | 10 (9.7%) | 4 (3.0%) |
Disability Class: Ambulatory Difficulty
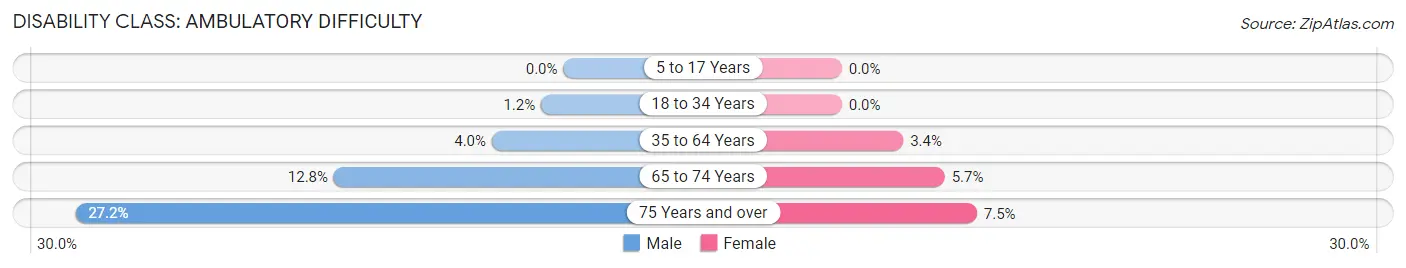
| Age Bracket | Male | Female |
| 5 to 17 Years | 0 (0.0%) | 0 (0.0%) |
| 18 to 34 Years | 3 (1.2%) | 0 (0.0%) |
| 35 to 64 Years | 22 (4.0%) | 18 (3.4%) |
| 65 to 74 Years | 17 (12.8%) | 9 (5.7%) |
| 75 Years and over | 28 (27.2%) | 10 (7.5%) |
Disability Class: Self-Care Difficulty
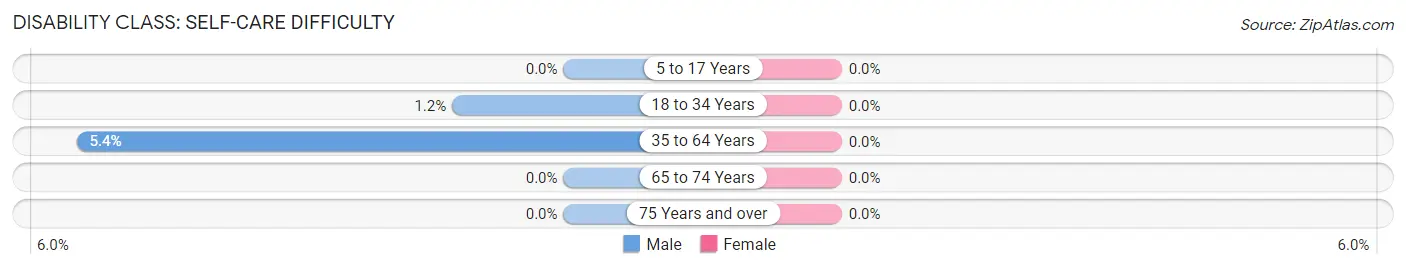
| Age Bracket | Male | Female |
| 5 to 17 Years | 0 (0.0%) | 0 (0.0%) |
| 18 to 34 Years | 3 (1.2%) | 0 (0.0%) |
| 35 to 64 Years | 30 (5.4%) | 0 (0.0%) |
| 65 to 74 Years | 0 (0.0%) | 0 (0.0%) |
| 75 Years and over | 0 (0.0%) | 0 (0.0%) |
Technology Access in Poland
Computing Device Access in Poland
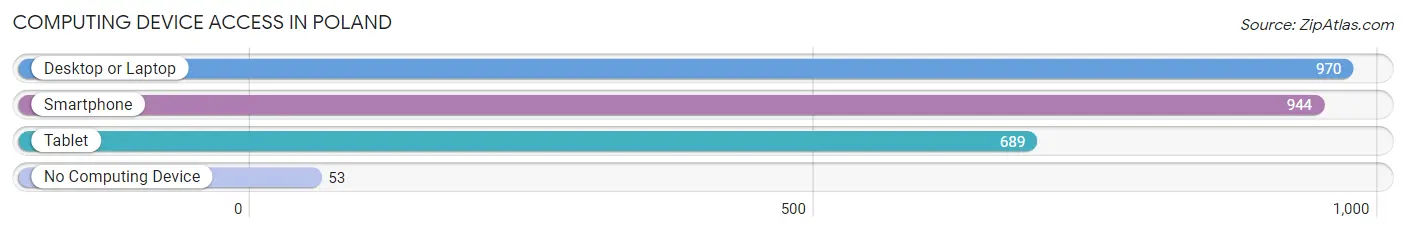
| Device Type | # Households | % Households |
| Desktop or Laptop | 970 | 89.0% |
| Smartphone | 944 | 86.6% |
| Tablet | 689 | 63.2% |
| No Computing Device | 53 | 4.9% |
| Total | 1,090 | 100.0% |
Internet Access in Poland
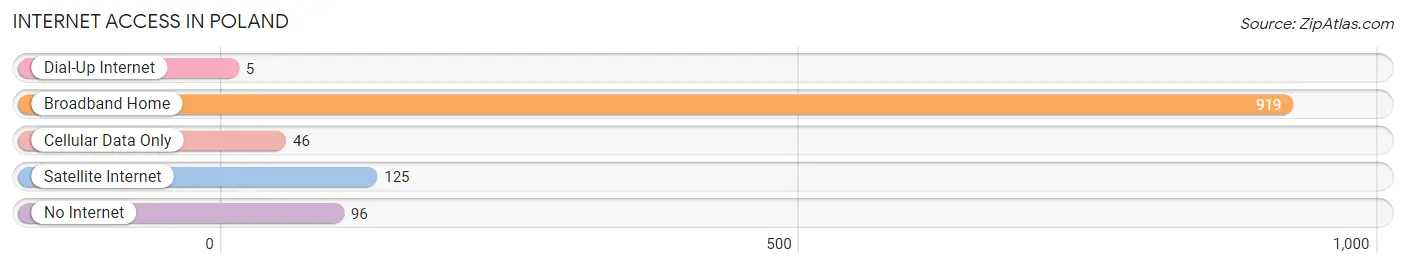
| Internet Type | # Households | % Households |
| Dial-Up Internet | 5 | 0.5% |
| Broadband Home | 919 | 84.3% |
| Cellular Data Only | 46 | 4.2% |
| Satellite Internet | 125 | 11.5% |
| No Internet | 96 | 8.8% |
| Total | 1,090 | 100.0% |
Poland Summary
Poland, Ohio is a small village located in Mahoning County, Ohio. It is situated in the northeast corner of the state, just south of Youngstown. The village has a population of 3,743 as of the 2010 census.
History
Poland was founded in 1802 by a group of settlers from Connecticut. The village was named after the country of Poland, which was a popular name for towns in the area at the time. The first settlers were mostly farmers, and the village grew slowly over the years. In 1845, the village was incorporated and the first post office was established.
In the late 19th century, the village began to grow rapidly. The railroad was built through the village in 1876, and the village became a popular stop for travelers. The village also became a center for manufacturing, with several factories being built in the area.
Geography
Poland is located in the northeast corner of Ohio, just south of Youngstown. The village is situated on the Mahoning River, which flows through the village. The village is surrounded by rolling hills and farmland. The climate in the area is generally mild, with hot summers and cold winters.
Economy
The economy of Poland is largely based on manufacturing and agriculture. The village is home to several factories, including a steel mill and a paper mill. Agriculture is also an important part of the economy, with many farms located in the area.
Demographics
As of the 2010 census, the population of Poland was 3,743. The population is mostly white (94.3%), with small percentages of African American (2.2%), Asian (1.2%), and Hispanic (1.3%) residents. The median household income is $45,945, and the median home value is $127,400.
Conclusion
Poland, Ohio is a small village located in Mahoning County, Ohio. It was founded in 1802 by a group of settlers from Connecticut and has grown slowly over the years. The village is situated on the Mahoning River and is surrounded by rolling hills and farmland. The economy of Poland is largely based on manufacturing and agriculture, and the population is mostly white.
Common Questions
What is Per Capita Income in Poland?
Per Capita income in Poland is $43,818.
What is the Median Family Income in Poland?
Median Family Income in Poland is $90,179.
What is the Median Household income in Poland?
Median Household Income in Poland is $82,024.
What is Income or Wage Gap in Poland?
Income or Wage Gap in Poland is 48.9%.
Women in Poland earn 51.1 cents for every dollar earned by a man.
What is Inequality or Gini Index in Poland?
Inequality or Gini Index in Poland is 0.40.
What is the Total Population of Poland?
Total Population of Poland is 2,573.
What is the Total Male Population of Poland?
Total Male Population of Poland is 1,320.
What is the Total Female Population of Poland?
Total Female Population of Poland is 1,253.
What is the Ratio of Males per 100 Females in Poland?
There are 105.35 Males per 100 Females in Poland.
What is the Ratio of Females per 100 Males in Poland?
There are 94.92 Females per 100 Males in Poland.
What is the Median Population Age in Poland?
Median Population Age in Poland is 44.2 Years.
What is the Average Family Size in Poland
Average Family Size in Poland is 2.9 People.
What is the Average Household Size in Poland
Average Household Size in Poland is 2.4 People.
How Large is the Labor Force in Poland?
There are 1,372 People in the Labor Forcein in Poland.
What is the Percentage of People in the Labor Force in Poland?
66.0% of People are in the Labor Force in Poland.
What is the Unemployment Rate in Poland?
Unemployment Rate in Poland is 5.5%.