Monroe, OH Map & Demographics
Monroe Map
Monroe Overview
$38,178
PER CAPITA INCOME
$106,481
AVG FAMILY INCOME
$100,100
AVG HOUSEHOLD INCOME
39.4%
WAGE / INCOME GAP [ % ]
60.6¢/ $1
WAGE / INCOME GAP [ $ ]
0.30
INEQUALITY / GINI INDEX
15,202
TOTAL POPULATION
7,532
MALE POPULATION
7,670
FEMALE POPULATION
98.20
MALES / 100 FEMALES
101.83
FEMALES / 100 MALES
36.0
MEDIAN AGE
3.1
AVG FAMILY SIZE
2.8
AVG HOUSEHOLD SIZE
8,282
LABOR FORCE [ PEOPLE ]
72.3%
PERCENT IN LABOR FORCE
2.3%
UNEMPLOYMENT RATE
Monroe Zip Codes
Monroe Area Codes
Income in Monroe
Income Overview in Monroe
Per Capita Income in Monroe is $38,178, while median incomes of families and households are $106,481 and $100,100 respectively.
| Characteristic | Number | Measure |
| Per Capita Income | 15,202 | $38,178 |
| Median Family Income | 4,174 | $106,481 |
| Mean Family Income | 4,174 | $119,578 |
| Median Household Income | 5,333 | $100,100 |
| Mean Household Income | 5,333 | $108,563 |
| Income Deficit | 4,174 | $0 |
| Wage / Income Gap (%) | 15,202 | 39.39% |
| Wage / Income Gap ($) | 15,202 | 60.61¢ per $1 |
| Gini / Inequality Index | 15,202 | 0.30 |
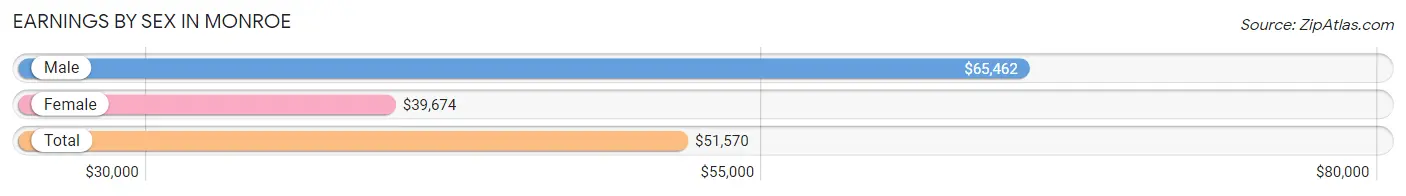
Earnings by Sex in Monroe
Average Earnings in Monroe are $51,570, $65,462 for men and $39,674 for women, a difference of 39.4%.
| Sex | Number | Average Earnings |
| Male | 4,463 (52.9%) | $65,462 |
| Female | 3,972 (47.1%) | $39,674 |
| Total | 8,435 (100.0%) | $51,570 |
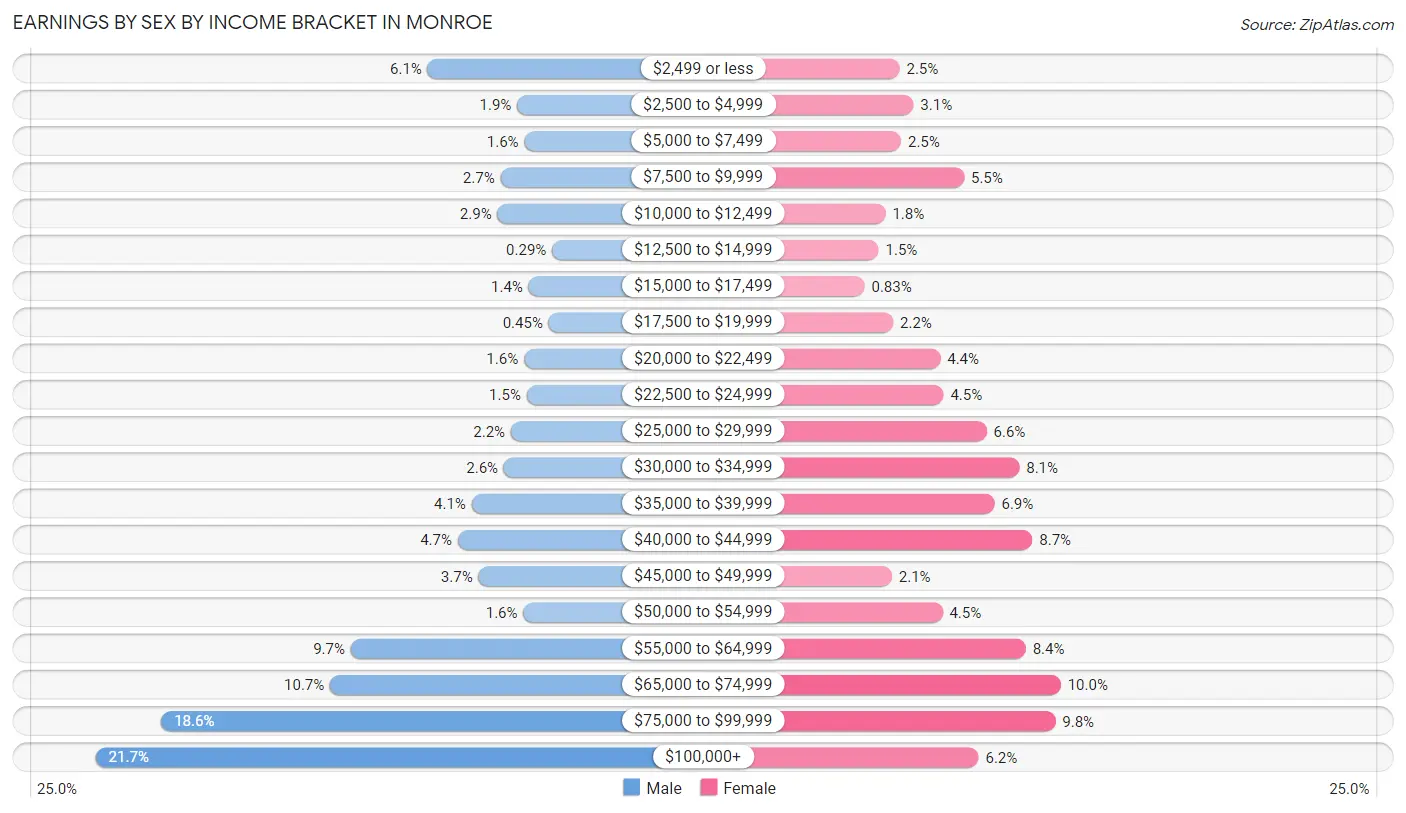
Earnings by Sex by Income Bracket in Monroe
The most common earnings brackets in Monroe are $100,000+ for men (967 | 21.7%) and $65,000 to $74,999 for women (398 | 10.0%).
| Income | Male | Female |
| $2,499 or less | 273 (6.1%) | 98 (2.5%) |
| $2,500 to $4,999 | 86 (1.9%) | 124 (3.1%) |
| $5,000 to $7,499 | 71 (1.6%) | 101 (2.5%) |
| $7,500 to $9,999 | 121 (2.7%) | 218 (5.5%) |
| $10,000 to $12,499 | 127 (2.9%) | 72 (1.8%) |
| $12,500 to $14,999 | 13 (0.3%) | 59 (1.5%) |
| $15,000 to $17,499 | 62 (1.4%) | 33 (0.8%) |
| $17,500 to $19,999 | 20 (0.4%) | 86 (2.2%) |
| $20,000 to $22,499 | 72 (1.6%) | 174 (4.4%) |
| $22,500 to $24,999 | 66 (1.5%) | 180 (4.5%) |
| $25,000 to $29,999 | 99 (2.2%) | 260 (6.6%) |
| $30,000 to $34,999 | 114 (2.5%) | 321 (8.1%) |
| $35,000 to $39,999 | 181 (4.1%) | 275 (6.9%) |
| $40,000 to $44,999 | 210 (4.7%) | 345 (8.7%) |
| $45,000 to $49,999 | 167 (3.7%) | 84 (2.1%) |
| $50,000 to $54,999 | 73 (1.6%) | 178 (4.5%) |
| $55,000 to $64,999 | 434 (9.7%) | 333 (8.4%) |
| $65,000 to $74,999 | 477 (10.7%) | 398 (10.0%) |
| $75,000 to $99,999 | 830 (18.6%) | 388 (9.8%) |
| $100,000+ | 967 (21.7%) | 245 (6.2%) |
| Total | 4,463 (100.0%) | 3,972 (100.0%) |
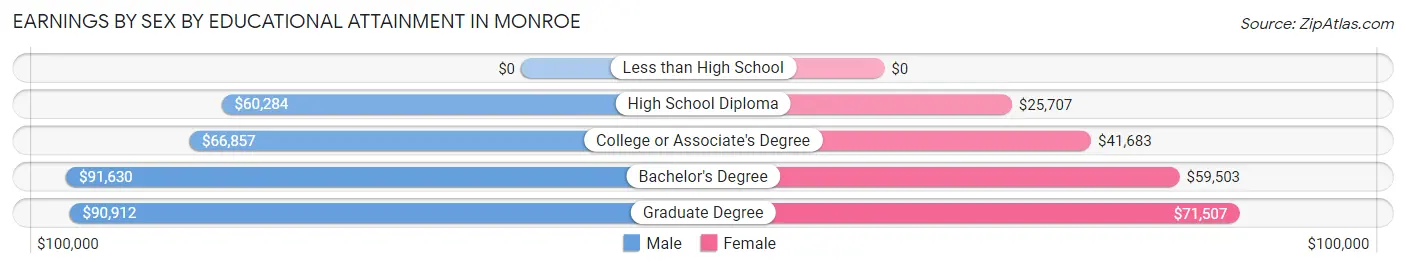
Earnings by Sex by Educational Attainment in Monroe
Average earnings in Monroe are $72,736 for men and $44,548 for women, a difference of 38.8%. Men with an educational attainment of bachelor's degree enjoy the highest average annual earnings of $91,630, while those with high school diploma education earn the least with $60,284. Women with an educational attainment of graduate degree earn the most with the average annual earnings of $71,507, while those with high school diploma education have the smallest earnings of $25,707.
| Educational Attainment | Male Income | Female Income |
| Less than High School | - | - |
| High School Diploma | $60,284 | $25,707 |
| College or Associate's Degree | $66,857 | $41,683 |
| Bachelor's Degree | $91,630 | $59,503 |
| Graduate Degree | $90,912 | $71,507 |
| Total | $72,736 | $44,548 |
Family Income in Monroe
Family Income Brackets in Monroe
According to the Monroe family income data, there are 1,286 families falling into the $100,000 to $149,999 income range, which is the most common income bracket and makes up 30.8% of all families.
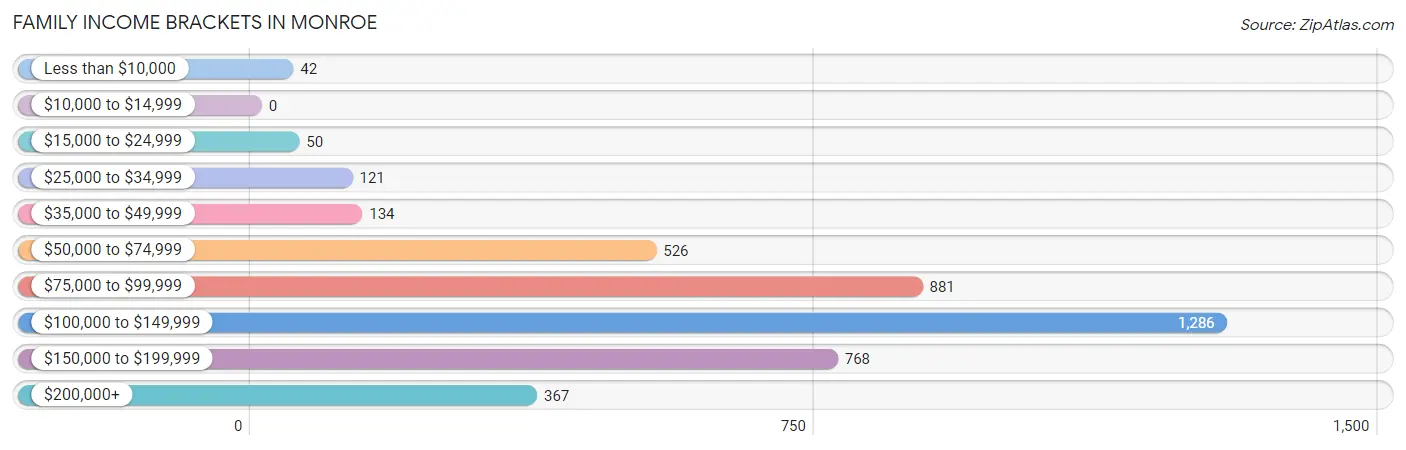
| Income Bracket | # Families | % Families |
| Less than $10,000 | 42 | 1.0% |
| $10,000 to $14,999 | 0 | 0.0% |
| $15,000 to $24,999 | 50 | 1.2% |
| $25,000 to $34,999 | 121 | 2.9% |
| $35,000 to $49,999 | 134 | 3.2% |
| $50,000 to $74,999 | 526 | 12.6% |
| $75,000 to $99,999 | 881 | 21.1% |
| $100,000 to $149,999 | 1,286 | 30.8% |
| $150,000 to $199,999 | 768 | 18.4% |
| $200,000+ | 367 | 8.8% |
Family Income by Famaliy Size in Monroe
6-person families (55 | 1.3%) account for the highest median family income in Monroe with $173,750 per family, while 2-person families (1,833 | 43.9%) have the highest median income of $48,974 per family member.
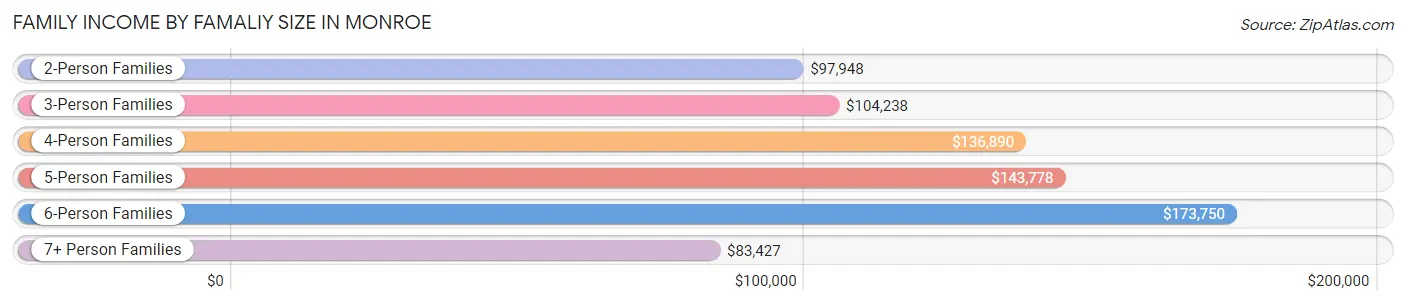
| Income Bracket | # Families | Median Income |
| 2-Person Families | 1,833 (43.9%) | $97,948 |
| 3-Person Families | 900 (21.6%) | $104,238 |
| 4-Person Families | 965 (23.1%) | $136,890 |
| 5-Person Families | 346 (8.3%) | $143,778 |
| 6-Person Families | 55 (1.3%) | $173,750 |
| 7+ Person Families | 75 (1.8%) | $83,427 |
| Total | 4,174 (100.0%) | $106,481 |
Family Income by Number of Earners in Monroe
The median family income in Monroe is $106,481, with families comprising 3+ earners (575) having the highest median family income of $165,270, while families with no earners (395) have the lowest median family income of $65,125, accounting for 13.8% and 9.5% of families, respectively.
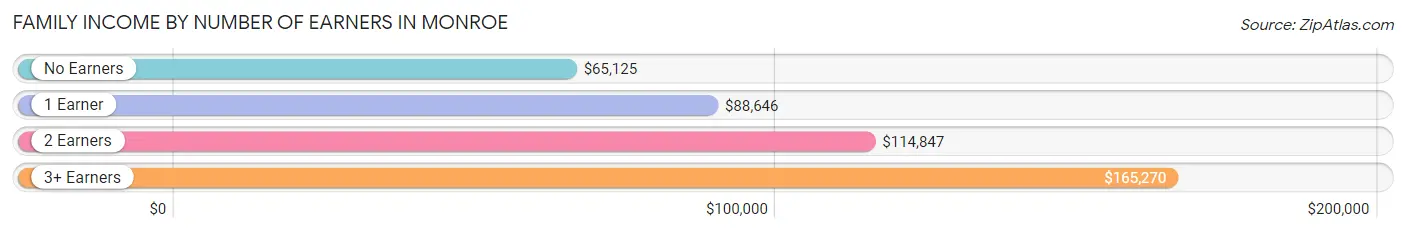
| Number of Earners | # Families | Median Income |
| No Earners | 395 (9.5%) | $65,125 |
| 1 Earner | 902 (21.6%) | $88,646 |
| 2 Earners | 2,302 (55.1%) | $114,847 |
| 3+ Earners | 575 (13.8%) | $165,270 |
| Total | 4,174 (100.0%) | $106,481 |
Household Income in Monroe
Household Income Brackets in Monroe
With 1,509 households falling in the category, the $100,000 to $149,999 income range is the most frequent in Monroe, accounting for 28.3% of all households. In contrast, only 21 households (0.4%) fall into the $10,000 to $14,999 income bracket, making it the least populous group.
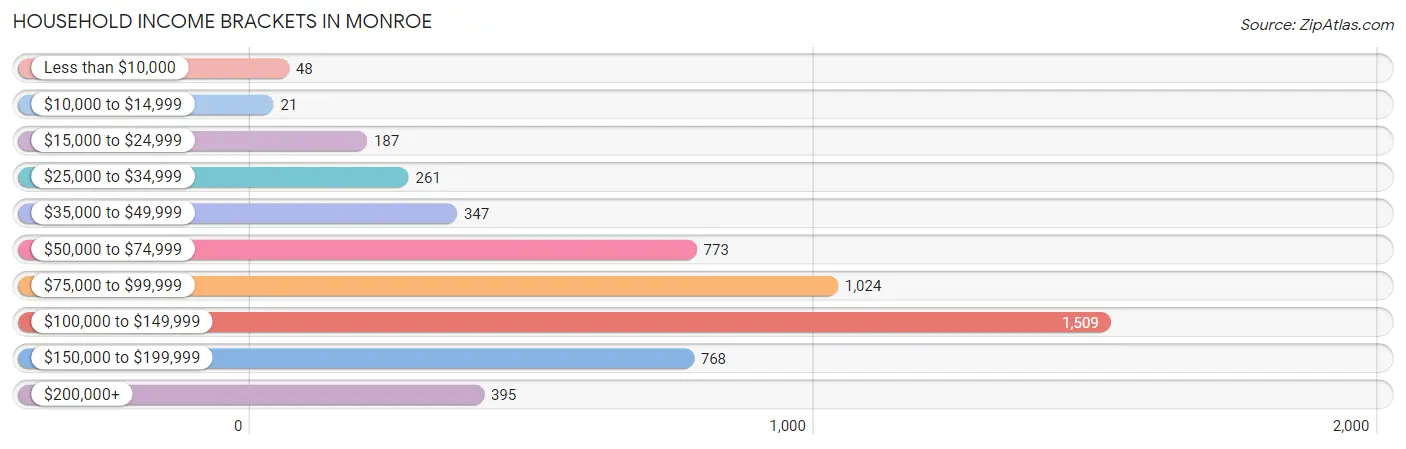
| Income Bracket | # Households | % Households |
| Less than $10,000 | 48 | 0.9% |
| $10,000 to $14,999 | 21 | 0.4% |
| $15,000 to $24,999 | 187 | 3.5% |
| $25,000 to $34,999 | 261 | 4.9% |
| $35,000 to $49,999 | 347 | 6.5% |
| $50,000 to $74,999 | 773 | 14.5% |
| $75,000 to $99,999 | 1,024 | 19.2% |
| $100,000 to $149,999 | 1,509 | 28.3% |
| $150,000 to $199,999 | 768 | 14.4% |
| $200,000+ | 395 | 7.4% |
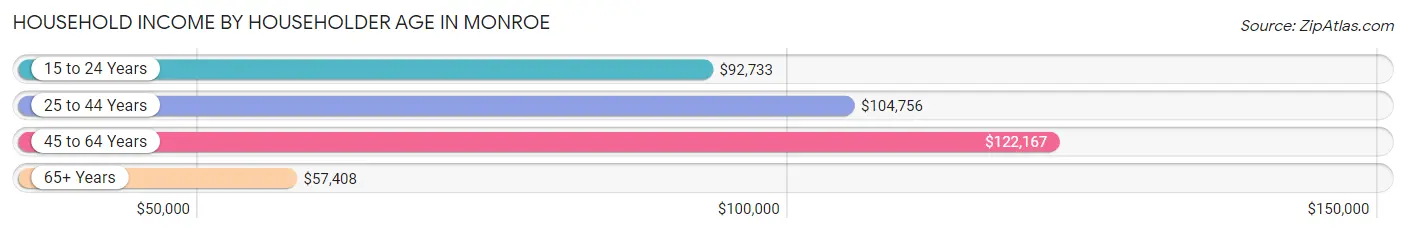
Household Income by Householder Age in Monroe
The median household income in Monroe is $100,100, with the highest median household income of $122,167 found in the 45 to 64 years age bracket for the primary householder. A total of 2,168 households (40.6%) fall into this category. Meanwhile, the 65+ years age bracket for the primary householder has the lowest median household income of $57,408, with 1,259 households (23.6%) in this group.
| Income Bracket | # Households | Median Income |
| 15 to 24 Years | 190 (3.6%) | $92,733 |
| 25 to 44 Years | 1,716 (32.2%) | $104,756 |
| 45 to 64 Years | 2,168 (40.6%) | $122,167 |
| 65+ Years | 1,259 (23.6%) | $57,408 |
| Total | 5,333 (100.0%) | $100,100 |
Poverty in Monroe
Income Below Poverty by Sex and Age in Monroe
With 4.3% poverty level for males and 3.1% for females among the residents of Monroe, under 5 year old males and under 5 year old females are the most vulnerable to poverty, with 58 males (13.9%) and 48 females (6.8%) in their respective age groups living below the poverty level.
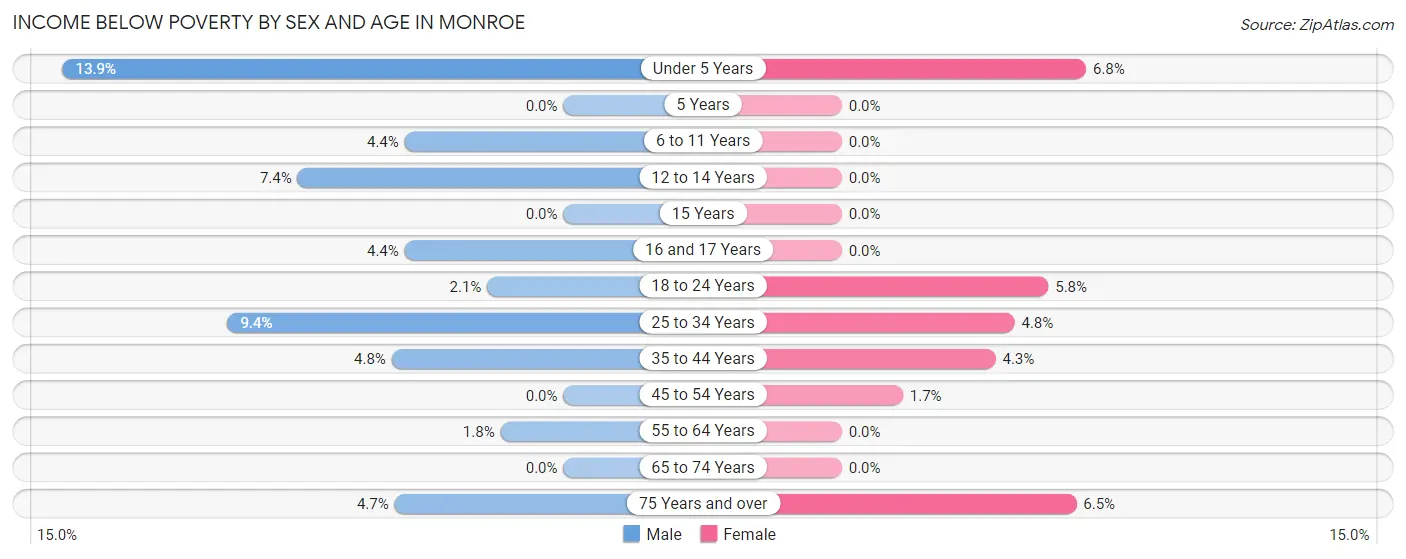
| Age Bracket | Male | Female |
| Under 5 Years | 58 (13.9%) | 48 (6.8%) |
| 5 Years | 0 (0.0%) | 0 (0.0%) |
| 6 to 11 Years | 29 (4.4%) | 0 (0.0%) |
| 12 to 14 Years | 29 (7.4%) | 0 (0.0%) |
| 15 Years | 0 (0.0%) | 0 (0.0%) |
| 16 and 17 Years | 20 (4.4%) | 0 (0.0%) |
| 18 to 24 Years | 13 (2.1%) | 38 (5.8%) |
| 25 to 34 Years | 88 (9.3%) | 42 (4.8%) |
| 35 to 44 Years | 50 (4.8%) | 42 (4.3%) |
| 45 to 54 Years | 0 (0.0%) | 18 (1.7%) |
| 55 to 64 Years | 12 (1.8%) | 0 (0.0%) |
| 65 to 74 Years | 0 (0.0%) | 0 (0.0%) |
| 75 Years and over | 19 (4.7%) | 41 (6.5%) |
| Total | 318 (4.3%) | 229 (3.1%) |
Income Above Poverty by Sex and Age in Monroe
According to the poverty statistics in Monroe, males aged 5 years and females aged 5 years are the age groups that are most secure financially, with 100.0% of males and 100.0% of females in these age groups living above the poverty line.
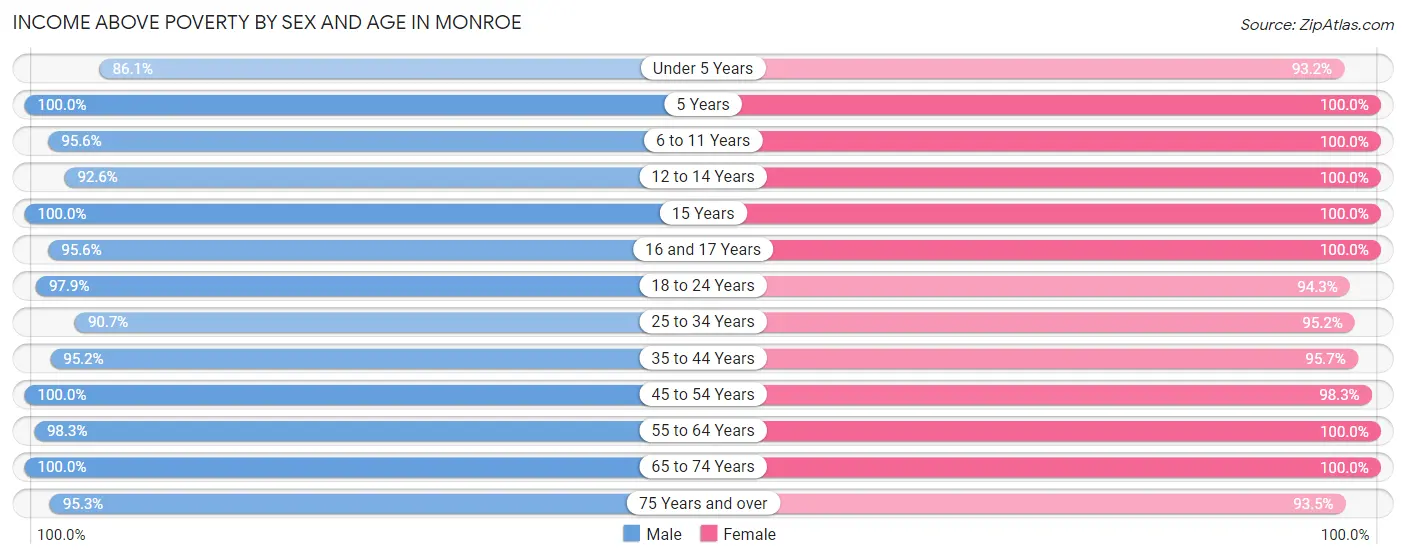
| Age Bracket | Male | Female |
| Under 5 Years | 358 (86.1%) | 658 (93.2%) |
| 5 Years | 59 (100.0%) | 85 (100.0%) |
| 6 to 11 Years | 627 (95.6%) | 551 (100.0%) |
| 12 to 14 Years | 363 (92.6%) | 349 (100.0%) |
| 15 Years | 277 (100.0%) | 119 (100.0%) |
| 16 and 17 Years | 433 (95.6%) | 165 (100.0%) |
| 18 to 24 Years | 600 (97.9%) | 623 (94.3%) |
| 25 to 34 Years | 853 (90.6%) | 832 (95.2%) |
| 35 to 44 Years | 997 (95.2%) | 940 (95.7%) |
| 45 to 54 Years | 1,054 (100.0%) | 1,039 (98.3%) |
| 55 to 64 Years | 672 (98.3%) | 670 (100.0%) |
| 65 to 74 Years | 423 (100.0%) | 625 (100.0%) |
| 75 Years and over | 385 (95.3%) | 587 (93.5%) |
| Total | 7,101 (95.7%) | 7,243 (96.9%) |
Income Below Poverty Among Married-Couple Families in Monroe
The poverty statistics for married-couple families in Monroe show that 1.5% or 51 of the total 3,509 families live below the poverty line. Families with 1 or 2 children have the highest poverty rate of 1.9%, comprising of 24 families. On the other hand, families with 3 or 4 children have the lowest poverty rate of 0.0%, which includes 0 families.
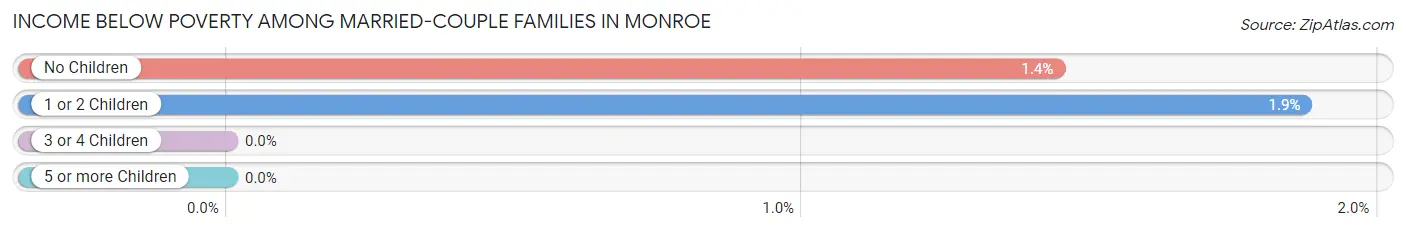
| Children | Above Poverty | Below Poverty |
| No Children | 1,849 (98.6%) | 27 (1.4%) |
| 1 or 2 Children | 1,257 (98.1%) | 24 (1.9%) |
| 3 or 4 Children | 295 (100.0%) | 0 (0.0%) |
| 5 or more Children | 57 (100.0%) | 0 (0.0%) |
| Total | 3,458 (98.6%) | 51 (1.5%) |
Income Below Poverty Among Single-Parent Households in Monroe
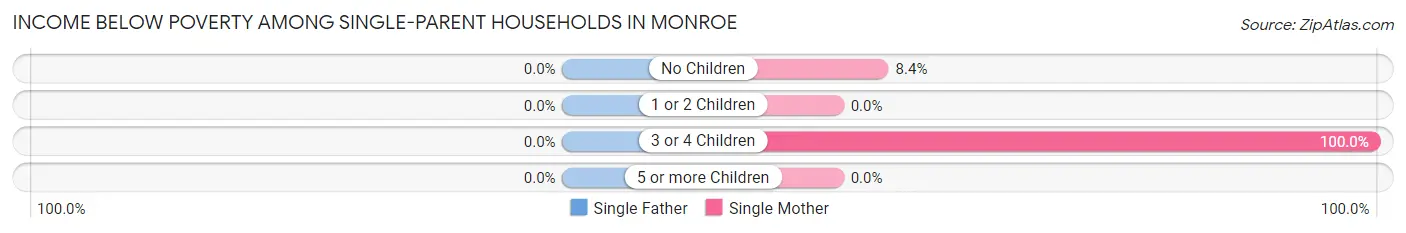
| Children | Single Father | Single Mother |
| No Children | 0 (0.0%) | 15 (8.4%) |
| 1 or 2 Children | 0 (0.0%) | 0 (0.0%) |
| 3 or 4 Children | 0 (0.0%) | 29 (100.0%) |
| 5 or more Children | 0 (0.0%) | 0 (0.0%) |
| Total | 0 (0.0%) | 44 (8.3%) |
Income Below Poverty Among Married-Couple vs Single-Parent Households in Monroe
The poverty data for Monroe shows that 51 of the married-couple family households (1.5%) and 44 of the single-parent households (6.6%) are living below the poverty level. Within the married-couple family households, those with 1 or 2 children have the highest poverty rate, with 24 households (1.9%) falling below the poverty line. Among the single-parent households, those with 3 or 4 children have the highest poverty rate, with 29 household (72.5%) living below poverty.
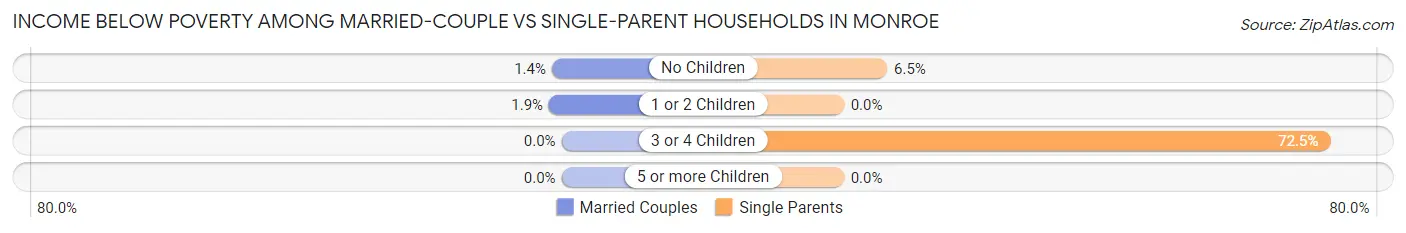
| Children | Married-Couple Families | Single-Parent Households |
| No Children | 27 (1.4%) | 15 (6.5%) |
| 1 or 2 Children | 24 (1.9%) | 0 (0.0%) |
| 3 or 4 Children | 0 (0.0%) | 29 (72.5%) |
| 5 or more Children | 0 (0.0%) | 0 (0.0%) |
| Total | 51 (1.5%) | 44 (6.6%) |
Race in Monroe
The most populous races in Monroe are White / Caucasian (13,007 | 85.6%), Two or more Races (1,013 | 6.7%), and Hispanic or Latino (883 | 5.8%).
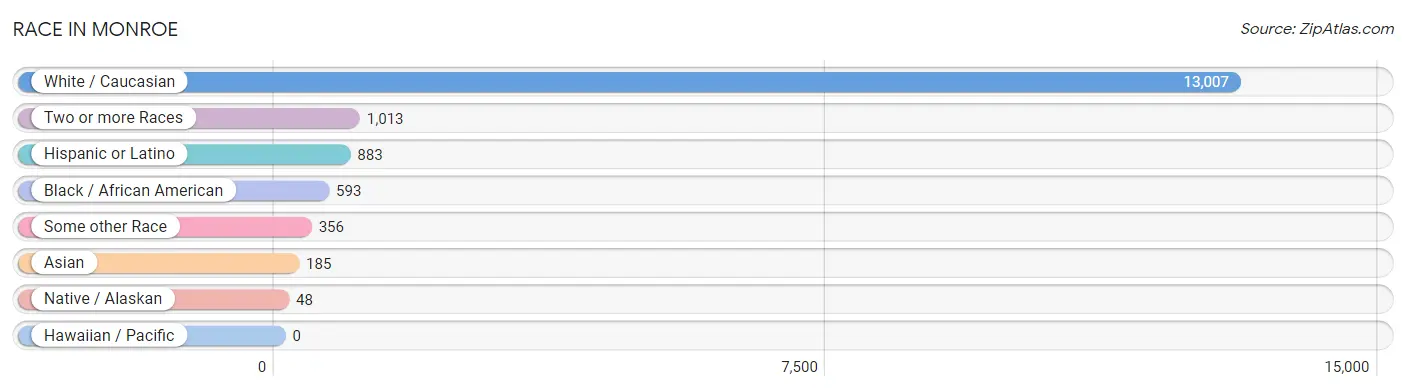
| Race | # Population | % Population |
| Asian | 185 | 1.2% |
| Black / African American | 593 | 3.9% |
| Hawaiian / Pacific | 0 | 0.0% |
| Hispanic or Latino | 883 | 5.8% |
| Native / Alaskan | 48 | 0.3% |
| White / Caucasian | 13,007 | 85.6% |
| Two or more Races | 1,013 | 6.7% |
| Some other Race | 356 | 2.3% |
| Total | 15,202 | 100.0% |
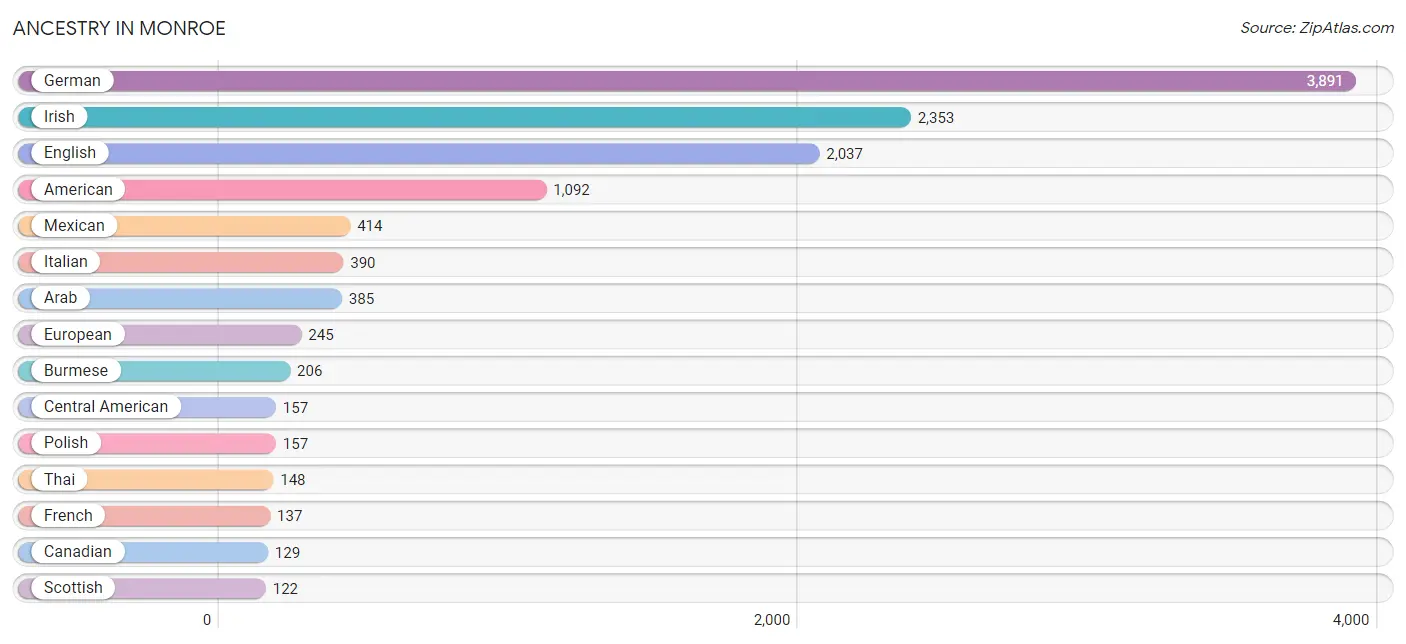
Ancestry in Monroe
The most populous ancestries reported in Monroe are German (3,891 | 25.6%), Irish (2,353 | 15.5%), English (2,037 | 13.4%), American (1,092 | 7.2%), and Mexican (414 | 2.7%), together accounting for 64.4% of all Monroe residents.
| Ancestry | # Population | % Population |
| American | 1,092 | 7.2% |
| Arab | 385 | 2.5% |
| Belgian | 14 | 0.1% |
| British | 45 | 0.3% |
| Burmese | 206 | 1.4% |
| Canadian | 129 | 0.9% |
| Central American | 157 | 1.0% |
| Cherokee | 30 | 0.2% |
| Colombian | 11 | 0.1% |
| Cuban | 87 | 0.6% |
| Czech | 15 | 0.1% |
| Czechoslovakian | 36 | 0.2% |
| Danish | 18 | 0.1% |
| Dutch | 110 | 0.7% |
| Eastern European | 56 | 0.4% |
| English | 2,037 | 13.4% |
| European | 245 | 1.6% |
| French | 137 | 0.9% |
| French Canadian | 71 | 0.5% |
| German | 3,891 | 25.6% |
| Guatemalan | 79 | 0.5% |
| Hungarian | 46 | 0.3% |
| Icelander | 23 | 0.2% |
| Indian (Asian) | 91 | 0.6% |
| Irish | 2,353 | 15.5% |
| Iroquois | 5 | 0.0% |
| Israeli | 16 | 0.1% |
| Italian | 390 | 2.6% |
| Korean | 102 | 0.7% |
| Malaysian | 37 | 0.2% |
| Mexican | 414 | 2.7% |
| Native Hawaiian | 75 | 0.5% |
| Norwegian | 12 | 0.1% |
| Panamanian | 78 | 0.5% |
| Polish | 157 | 1.0% |
| Puerto Rican | 114 | 0.7% |
| Russian | 15 | 0.1% |
| Scotch-Irish | 114 | 0.7% |
| Scottish | 122 | 0.8% |
| Slovak | 37 | 0.2% |
| South American | 11 | 0.1% |
| Spaniard | 25 | 0.2% |
| Spanish | 75 | 0.5% |
| Swedish | 4 | 0.0% |
| Thai | 148 | 1.0% |
| Welsh | 90 | 0.6% |
| West Indian | 11 | 0.1% | View All 47 Rows |
Immigrants in Monroe
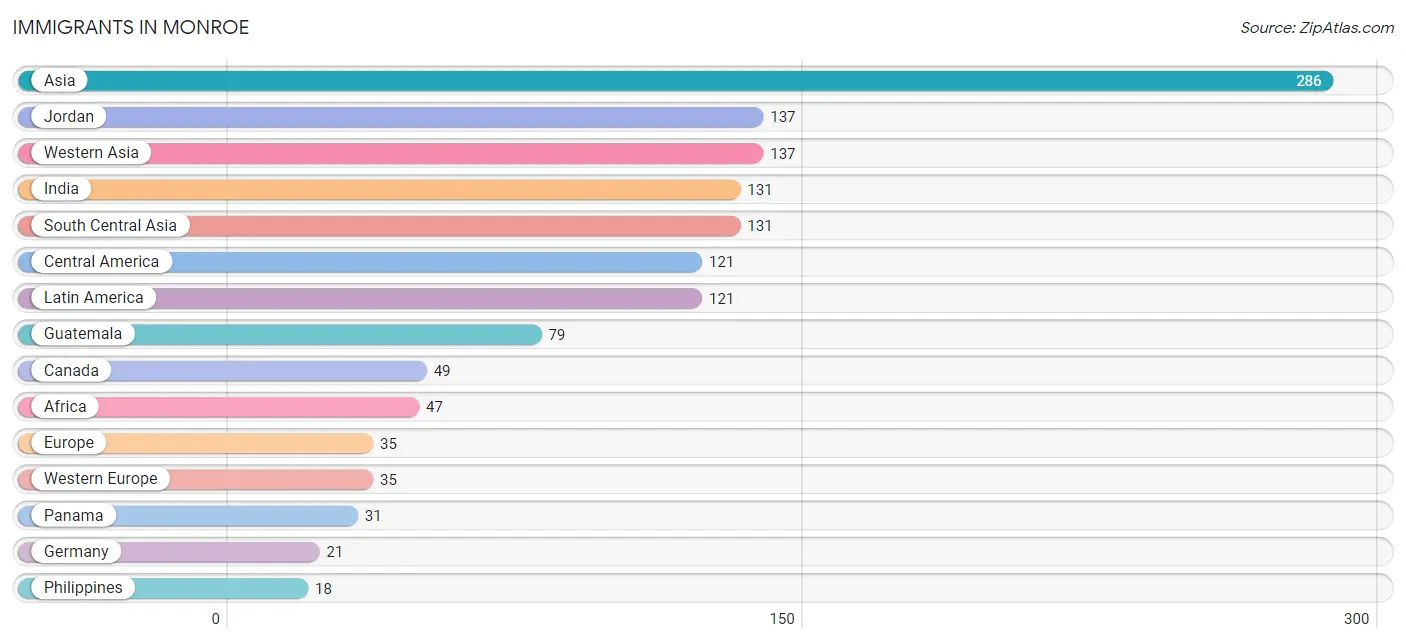
The most numerous immigrant groups reported in Monroe came from Asia (286 | 1.9%), Jordan (137 | 0.9%), Western Asia (137 | 0.9%), India (131 | 0.9%), and South Central Asia (131 | 0.9%), together accounting for 5.4% of all Monroe residents.
| Immigration Origin | # Population | % Population |
| Africa | 47 | 0.3% |
| Asia | 286 | 1.9% |
| Belgium | 14 | 0.1% |
| Canada | 49 | 0.3% |
| Central America | 121 | 0.8% |
| Europe | 35 | 0.2% |
| Germany | 21 | 0.1% |
| Guatemala | 79 | 0.5% |
| India | 131 | 0.9% |
| Jordan | 137 | 0.9% |
| Latin America | 121 | 0.8% |
| Mexico | 11 | 0.1% |
| Panama | 31 | 0.2% |
| Philippines | 18 | 0.1% |
| South Central Asia | 131 | 0.9% |
| South Eastern Asia | 18 | 0.1% |
| Western Asia | 137 | 0.9% |
| Western Europe | 35 | 0.2% | View All 18 Rows |
Sex and Age in Monroe
Sex and Age in Monroe
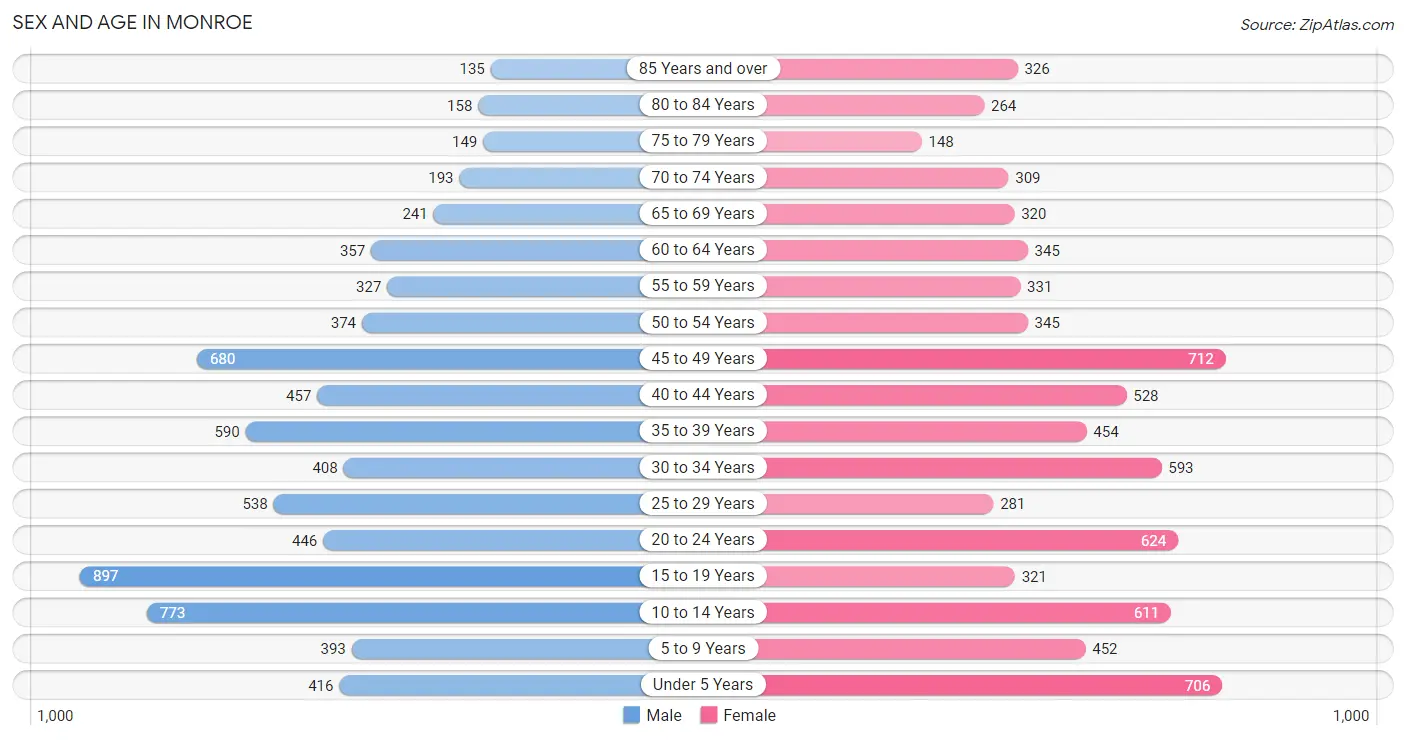
The most populous age groups in Monroe are 15 to 19 Years (897 | 11.9%) for men and 45 to 49 Years (712 | 9.3%) for women.
| Age Bracket | Male | Female |
| Under 5 Years | 416 (5.5%) | 706 (9.2%) |
| 5 to 9 Years | 393 (5.2%) | 452 (5.9%) |
| 10 to 14 Years | 773 (10.3%) | 611 (8.0%) |
| 15 to 19 Years | 897 (11.9%) | 321 (4.2%) |
| 20 to 24 Years | 446 (5.9%) | 624 (8.1%) |
| 25 to 29 Years | 538 (7.1%) | 281 (3.7%) |
| 30 to 34 Years | 408 (5.4%) | 593 (7.7%) |
| 35 to 39 Years | 590 (7.8%) | 454 (5.9%) |
| 40 to 44 Years | 457 (6.1%) | 528 (6.9%) |
| 45 to 49 Years | 680 (9.0%) | 712 (9.3%) |
| 50 to 54 Years | 374 (5.0%) | 345 (4.5%) |
| 55 to 59 Years | 327 (4.3%) | 331 (4.3%) |
| 60 to 64 Years | 357 (4.7%) | 345 (4.5%) |
| 65 to 69 Years | 241 (3.2%) | 320 (4.2%) |
| 70 to 74 Years | 193 (2.6%) | 309 (4.0%) |
| 75 to 79 Years | 149 (2.0%) | 148 (1.9%) |
| 80 to 84 Years | 158 (2.1%) | 264 (3.4%) |
| 85 Years and over | 135 (1.8%) | 326 (4.3%) |
| Total | 7,532 (100.0%) | 7,670 (100.0%) |
Families and Households in Monroe
Median Family Size in Monroe
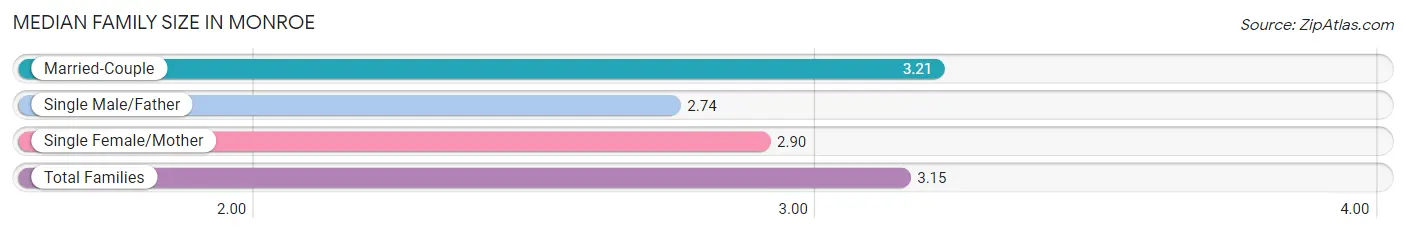
The median family size in Monroe is 3.15 persons per family, with married-couple families (3,509 | 84.1%) accounting for the largest median family size of 3.21 persons per family. On the other hand, single male/father families (136 | 3.3%) represent the smallest median family size with 2.74 persons per family.
| Family Type | # Families | Family Size |
| Married-Couple | 3,509 (84.1%) | 3.21 |
| Single Male/Father | 136 (3.3%) | 2.74 |
| Single Female/Mother | 529 (12.7%) | 2.90 |
| Total Families | 4,174 (100.0%) | 3.15 |
Median Household Size in Monroe
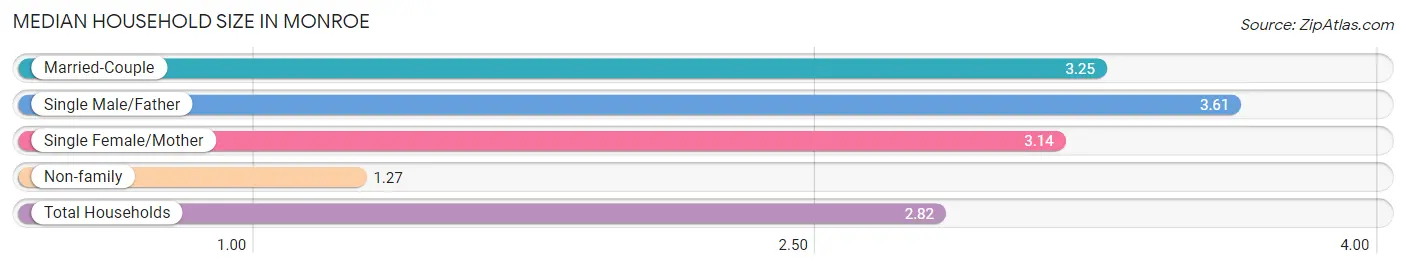
The median household size in Monroe is 2.82 persons per household, with single male/father households (136 | 2.5%) accounting for the largest median household size of 3.61 persons per household. non-family households (1,159 | 21.7%) represent the smallest median household size with 1.27 persons per household.
| Household Type | # Households | Household Size |
| Married-Couple | 3,509 (65.8%) | 3.25 |
| Single Male/Father | 136 (2.5%) | 3.61 |
| Single Female/Mother | 529 (9.9%) | 3.14 |
| Non-family | 1,159 (21.7%) | 1.27 |
| Total Households | 5,333 (100.0%) | 2.82 |
Household Size by Marriage Status in Monroe
Out of a total of 5,333 households in Monroe, 4,174 (78.3%) are family households, while 1,159 (21.7%) are nonfamily households. The most numerous type of family households are 2-person households, comprising 1,696, and the most common type of nonfamily households are 1-person households, comprising 1,008.
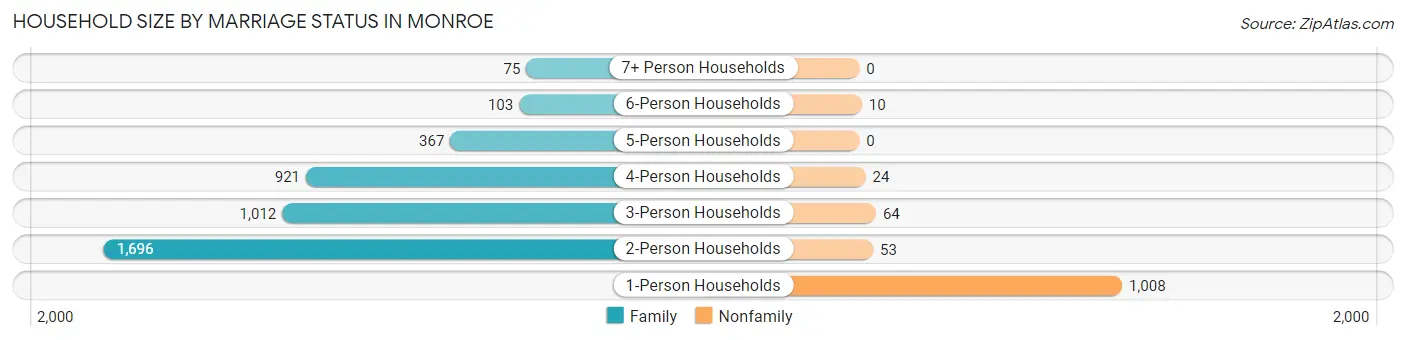
| Household Size | Family Households | Nonfamily Households |
| 1-Person Households | - | 1,008 (18.9%) |
| 2-Person Households | 1,696 (31.8%) | 53 (1.0%) |
| 3-Person Households | 1,012 (19.0%) | 64 (1.2%) |
| 4-Person Households | 921 (17.3%) | 24 (0.4%) |
| 5-Person Households | 367 (6.9%) | 0 (0.0%) |
| 6-Person Households | 103 (1.9%) | 10 (0.2%) |
| 7+ Person Households | 75 (1.4%) | 0 (0.0%) |
| Total | 4,174 (78.3%) | 1,159 (21.7%) |
Female Fertility in Monroe
Fertility by Age in Monroe
Average fertility rate in Monroe is 71.0 births per 1,000 women. Women in the age bracket of 20 to 34 years have the highest fertility rate with 91.0 births per 1,000 women. Women in the age bracket of 20 to 34 years acount for 54.4% of all women with births.
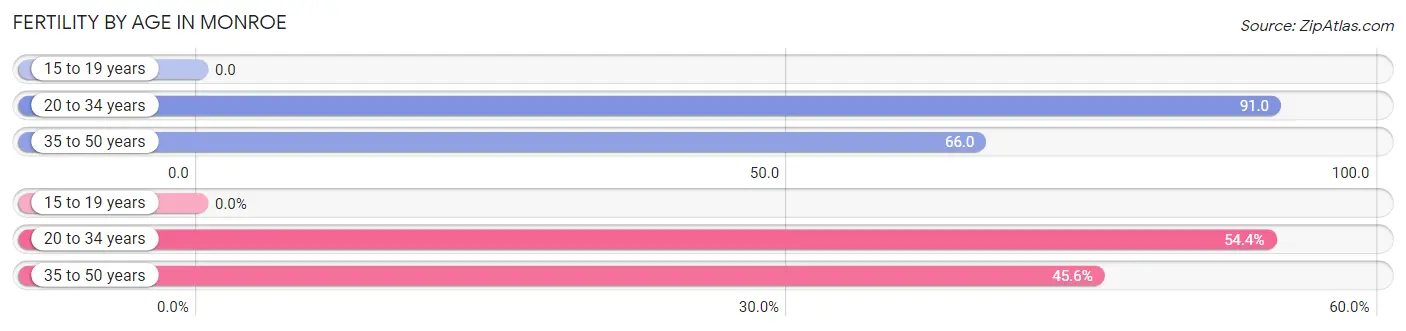
| Age Bracket | Women with Births | Births / 1,000 Women |
| 15 to 19 years | 0 (0.0%) | 0.0 |
| 20 to 34 years | 137 (54.4%) | 91.0 |
| 35 to 50 years | 115 (45.6%) | 66.0 |
| Total | 252 (100.0%) | 71.0 |
Fertility by Age by Marriage Status in Monroe
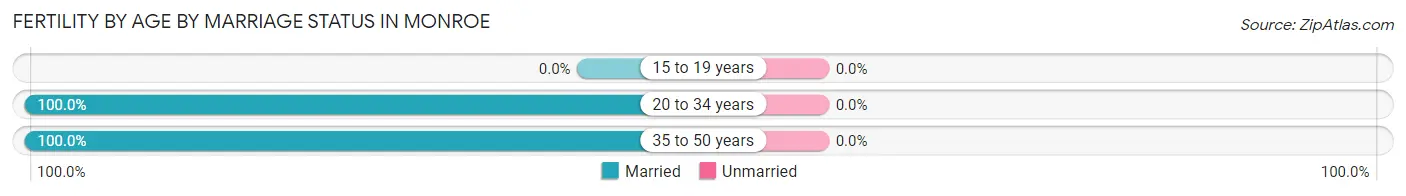
| Age Bracket | Married | Unmarried |
| 15 to 19 years | 0 (0.0%) | 0 (0.0%) |
| 20 to 34 years | 137 (100.0%) | 0 (0.0%) |
| 35 to 50 years | 115 (100.0%) | 0 (0.0%) |
| Total | 252 (100.0%) | 0 (0.0%) |
Fertility by Education in Monroe
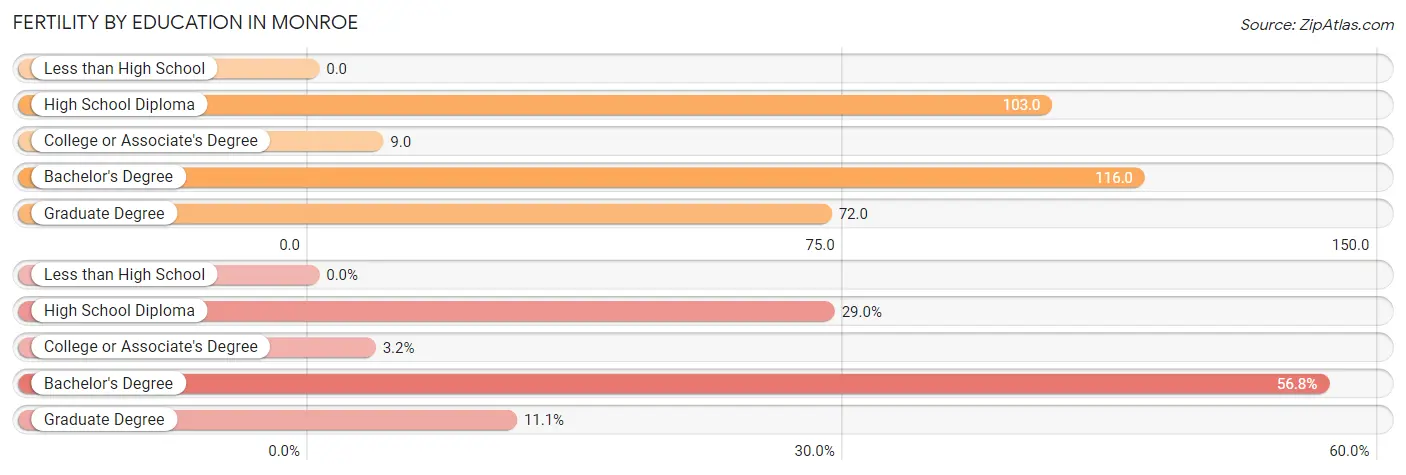
| Educational Attainment | Women with Births | Births / 1,000 Women |
| Less than High School | 0 (0.0%) | 0.0 |
| High School Diploma | 73 (29.0%) | 103.0 |
| College or Associate's Degree | 8 (3.2%) | 9.0 |
| Bachelor's Degree | 143 (56.8%) | 116.0 |
| Graduate Degree | 28 (11.1%) | 72.0 |
| Total | 252 (100.0%) | 71.0 |
Fertility by Education by Marriage Status in Monroe
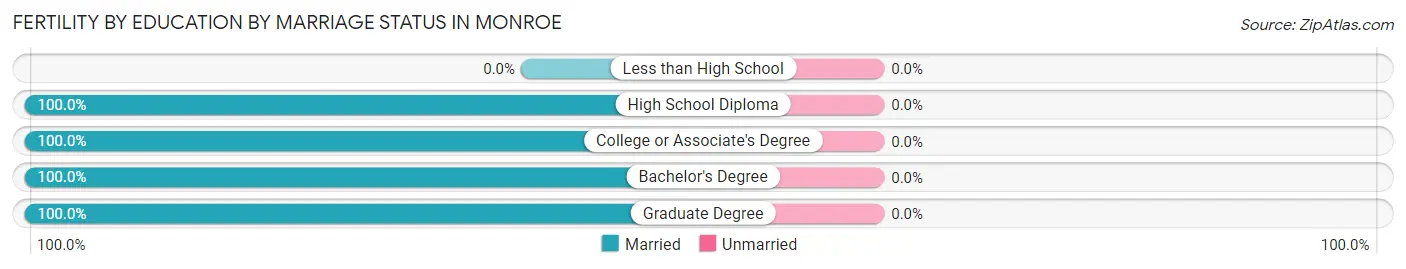
| Educational Attainment | Married | Unmarried |
| Less than High School | 0 (0.0%) | 0 (0.0%) |
| High School Diploma | 73 (100.0%) | 0 (0.0%) |
| College or Associate's Degree | 8 (100.0%) | 0 (0.0%) |
| Bachelor's Degree | 143 (100.0%) | 0 (0.0%) |
| Graduate Degree | 28 (100.0%) | 0 (0.0%) |
| Total | 252 (100.0%) | 0 (0.0%) |
Employment Characteristics in Monroe
Employment by Class of Employer in Monroe
Among the 7,981 employed individuals in Monroe, private company employees (5,753 | 72.1%), local government employees (866 | 10.8%), and not-for-profit organizations (571 | 7.1%) make up the most common classes of employment.
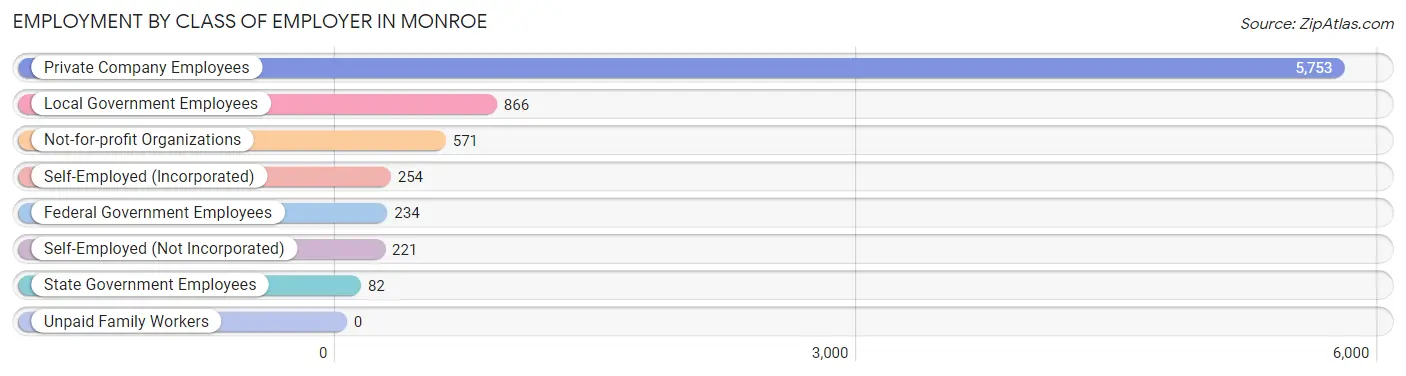
| Employer Class | # Employees | % Employees |
| Private Company Employees | 5,753 | 72.1% |
| Self-Employed (Incorporated) | 254 | 3.2% |
| Self-Employed (Not Incorporated) | 221 | 2.8% |
| Not-for-profit Organizations | 571 | 7.1% |
| Local Government Employees | 866 | 10.8% |
| State Government Employees | 82 | 1.0% |
| Federal Government Employees | 234 | 2.9% |
| Unpaid Family Workers | 0 | 0.0% |
| Total | 7,981 | 100.0% |
Employment Status by Age in Monroe
According to the labor force statistics for Monroe, out of the total population over 16 years of age (11,455), 72.3% or 8,282 individuals are in the labor force, with 2.3% or 190 of them unemployed. The age group with the highest labor force participation rate is 20 to 24 years, with 95.1% or 1,018 individuals in the labor force. Within the labor force, the 30 to 34 years age range has the highest percentage of unemployed individuals, with 6.5% or 56 of them being unemployed.
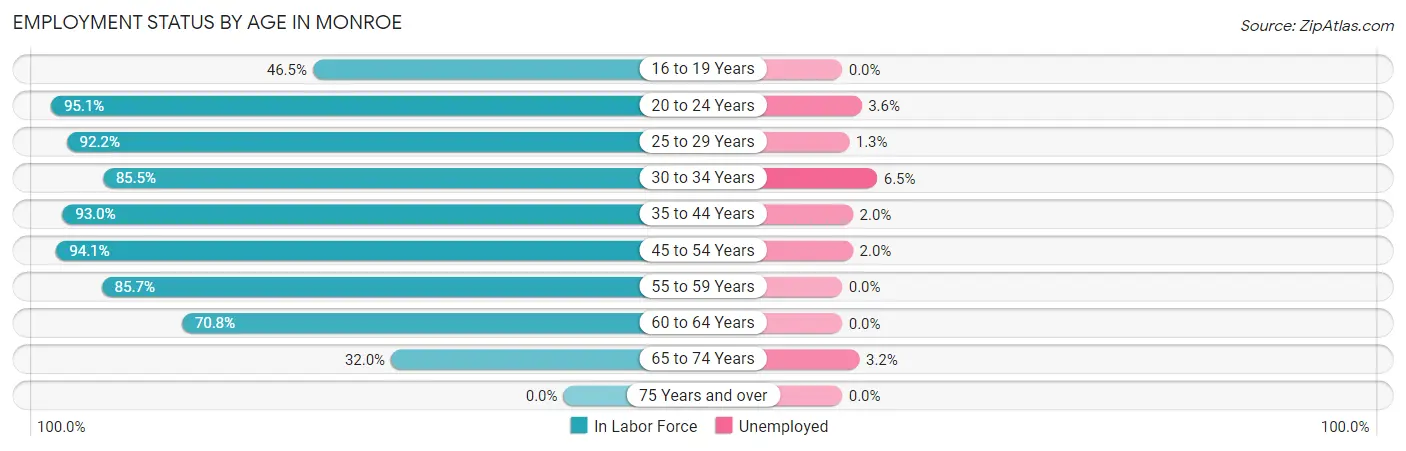
| Age Bracket | In Labor Force | Unemployed |
| 16 to 19 Years | 382 (46.5%) | 0 (0.0%) |
| 20 to 24 Years | 1,018 (95.1%) | 37 (3.6%) |
| 25 to 29 Years | 755 (92.2%) | 10 (1.3%) |
| 30 to 34 Years | 856 (85.5%) | 56 (6.5%) |
| 35 to 44 Years | 1,887 (93.0%) | 38 (2.0%) |
| 45 to 54 Years | 1,986 (94.1%) | 40 (2.0%) |
| 55 to 59 Years | 564 (85.7%) | 0 (0.0%) |
| 60 to 64 Years | 497 (70.8%) | 0 (0.0%) |
| 65 to 74 Years | 340 (32.0%) | 11 (3.2%) |
| 75 Years and over | 0 (0.0%) | 0 (0.0%) |
| Total | 8,282 (72.3%) | 190 (2.3%) |
Employment Status by Educational Attainment in Monroe
According to labor force statistics for Monroe, 89.4% of individuals (6,544) out of the total population between 25 and 64 years of age (7,320) are in the labor force, with 2.2% or 144 of them being unemployed. The group with the highest labor force participation rate are those with the educational attainment of bachelor's degree or higher, with 91.8% or 2,922 individuals in the labor force. Within the labor force, individuals with high school diploma education have the highest percentage of unemployment, with 3.3% or 40 of them being unemployed.
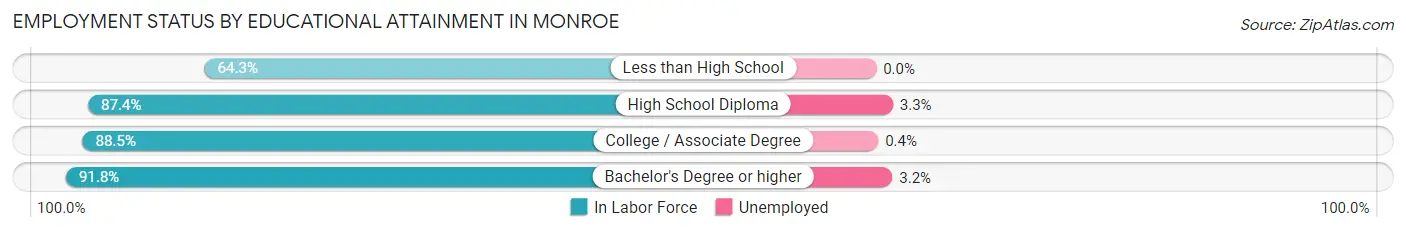
| Educational Attainment | In Labor Force | Unemployed |
| Less than High School | 63 (64.3%) | 0 (0.0%) |
| High School Diploma | 1,225 (87.4%) | 46 (3.3%) |
| College / Associate Degree | 2,334 (88.5%) | 11 (0.4%) |
| Bachelor's Degree or higher | 2,922 (91.8%) | 102 (3.2%) |
| Total | 6,544 (89.4%) | 161 (2.2%) |
Employment Occupations by Sex in Monroe
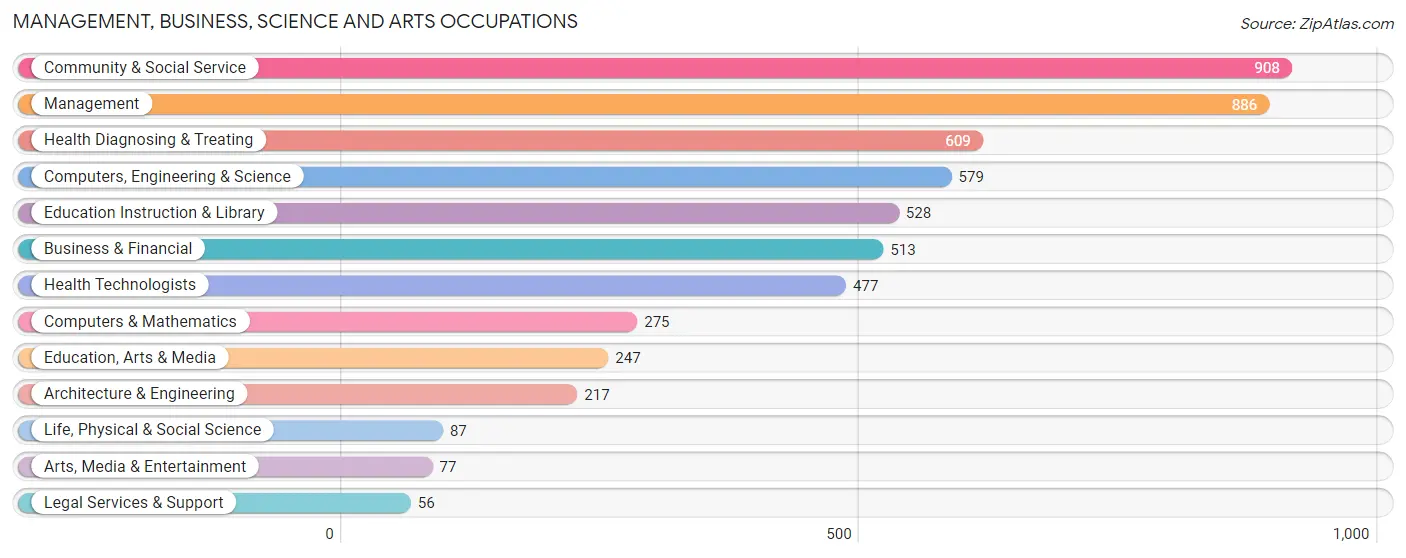
Management, Business, Science and Arts Occupations
The most common Management, Business, Science and Arts occupations in Monroe are Community & Social Service (908 | 11.3%), Management (886 | 11.0%), Health Diagnosing & Treating (609 | 7.5%), Computers, Engineering & Science (579 | 7.2%), and Education Instruction & Library (528 | 6.5%).
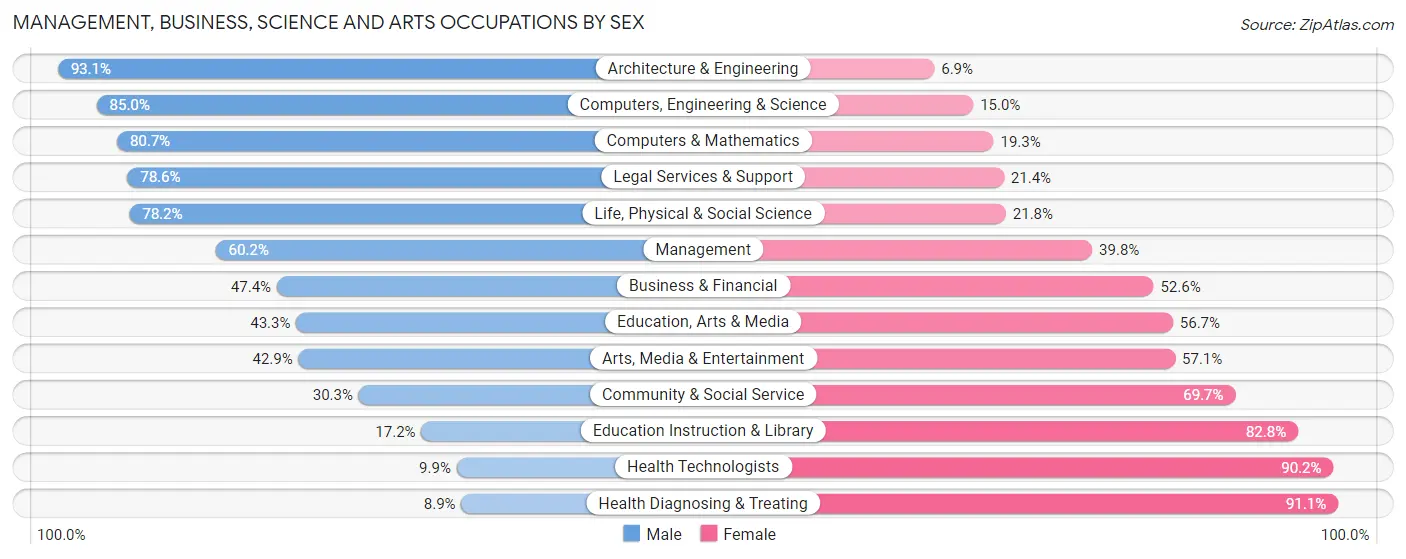
Management, Business, Science and Arts Occupations by Sex
Within the Management, Business, Science and Arts occupations in Monroe, the most male-oriented occupations are Architecture & Engineering (93.1%), Computers, Engineering & Science (85.0%), and Computers & Mathematics (80.7%), while the most female-oriented occupations are Health Diagnosing & Treating (91.1%), Health Technologists (90.1%), and Education Instruction & Library (82.8%).
| Occupation | Male | Female |
| Management | 533 (60.2%) | 353 (39.8%) |
| Business & Financial | 243 (47.4%) | 270 (52.6%) |
| Computers, Engineering & Science | 492 (85.0%) | 87 (15.0%) |
| Computers & Mathematics | 222 (80.7%) | 53 (19.3%) |
| Architecture & Engineering | 202 (93.1%) | 15 (6.9%) |
| Life, Physical & Social Science | 68 (78.2%) | 19 (21.8%) |
| Community & Social Service | 275 (30.3%) | 633 (69.7%) |
| Education, Arts & Media | 107 (43.3%) | 140 (56.7%) |
| Legal Services & Support | 44 (78.6%) | 12 (21.4%) |
| Education Instruction & Library | 91 (17.2%) | 437 (82.8%) |
| Arts, Media & Entertainment | 33 (42.9%) | 44 (57.1%) |
| Health Diagnosing & Treating | 54 (8.9%) | 555 (91.1%) |
| Health Technologists | 47 (9.9%) | 430 (90.1%) |
| Total (Category) | 1,597 (45.7%) | 1,898 (54.3%) |
| Total (Overall) | 4,286 (53.1%) | 3,782 (46.9%) |
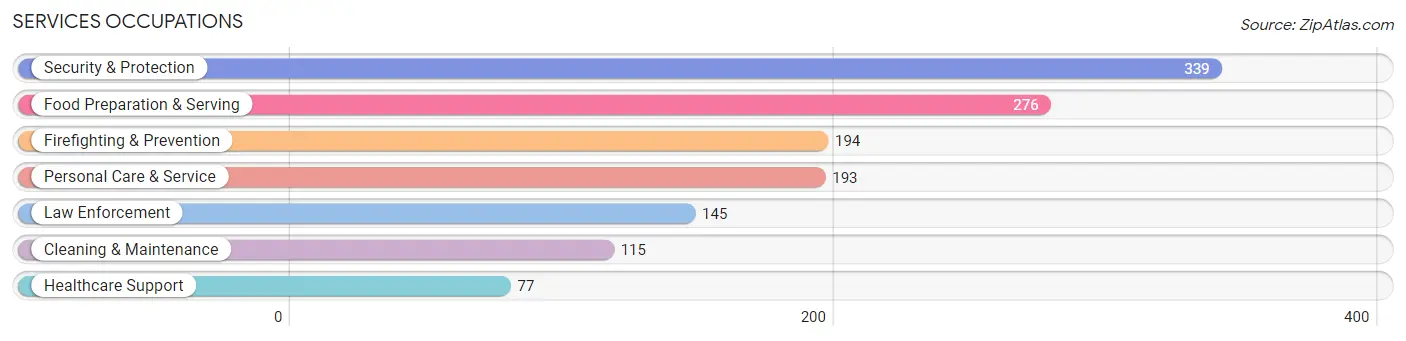
Services Occupations
The most common Services occupations in Monroe are Security & Protection (339 | 4.2%), Food Preparation & Serving (276 | 3.4%), Firefighting & Prevention (194 | 2.4%), Personal Care & Service (193 | 2.4%), and Law Enforcement (145 | 1.8%).
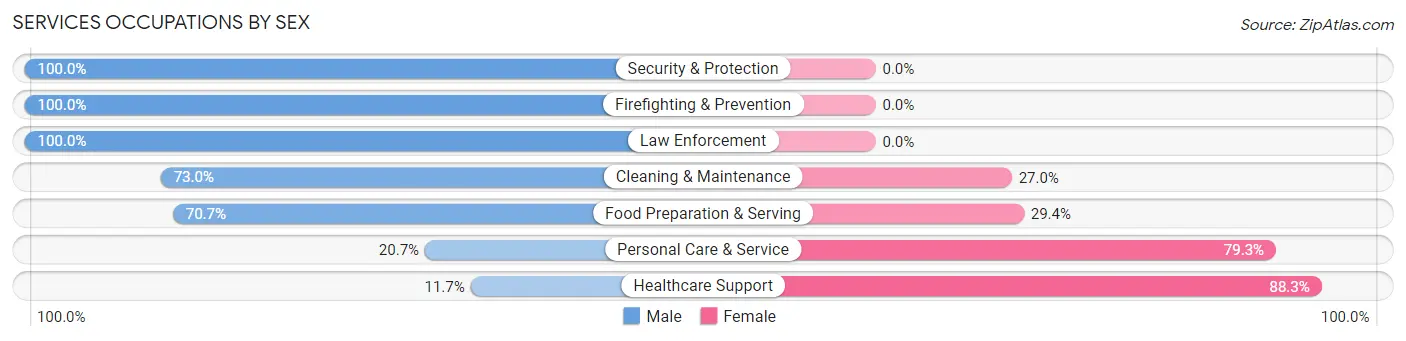
Services Occupations by Sex
Within the Services occupations in Monroe, the most male-oriented occupations are Security & Protection (100.0%), Firefighting & Prevention (100.0%), and Law Enforcement (100.0%), while the most female-oriented occupations are Healthcare Support (88.3%), Personal Care & Service (79.3%), and Food Preparation & Serving (29.3%).
| Occupation | Male | Female |
| Healthcare Support | 9 (11.7%) | 68 (88.3%) |
| Security & Protection | 339 (100.0%) | 0 (0.0%) |
| Firefighting & Prevention | 194 (100.0%) | 0 (0.0%) |
| Law Enforcement | 145 (100.0%) | 0 (0.0%) |
| Food Preparation & Serving | 195 (70.7%) | 81 (29.3%) |
| Cleaning & Maintenance | 84 (73.0%) | 31 (27.0%) |
| Personal Care & Service | 40 (20.7%) | 153 (79.3%) |
| Total (Category) | 667 (66.7%) | 333 (33.3%) |
| Total (Overall) | 4,286 (53.1%) | 3,782 (46.9%) |
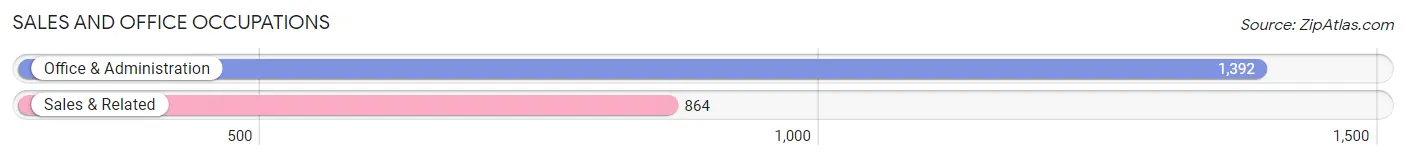
Sales and Office Occupations
The most common Sales and Office occupations in Monroe are Office & Administration (1,392 | 17.2%), and Sales & Related (864 | 10.7%).
Sales and Office Occupations by Sex
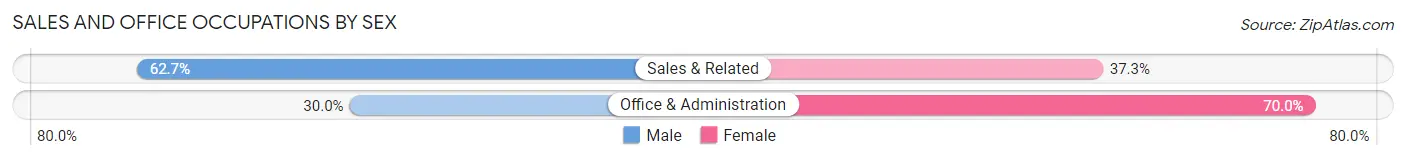
| Occupation | Male | Female |
| Sales & Related | 542 (62.7%) | 322 (37.3%) |
| Office & Administration | 418 (30.0%) | 974 (70.0%) |
| Total (Category) | 960 (42.5%) | 1,296 (57.5%) |
| Total (Overall) | 4,286 (53.1%) | 3,782 (46.9%) |
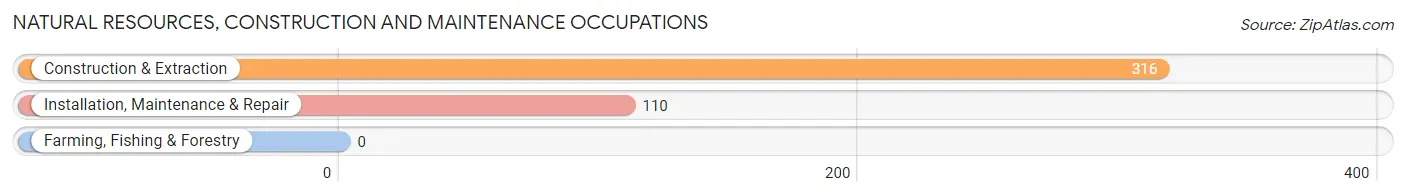
Natural Resources, Construction and Maintenance Occupations
The most common Natural Resources, Construction and Maintenance occupations in Monroe are Construction & Extraction (316 | 3.9%), and Installation, Maintenance & Repair (110 | 1.4%).
Natural Resources, Construction and Maintenance Occupations by Sex
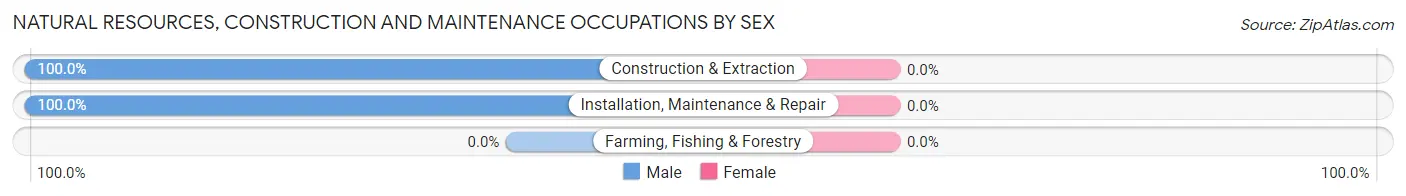
| Occupation | Male | Female |
| Farming, Fishing & Forestry | 0 (0.0%) | 0 (0.0%) |
| Construction & Extraction | 316 (100.0%) | 0 (0.0%) |
| Installation, Maintenance & Repair | 110 (100.0%) | 0 (0.0%) |
| Total (Category) | 426 (100.0%) | 0 (0.0%) |
| Total (Overall) | 4,286 (53.1%) | 3,782 (46.9%) |
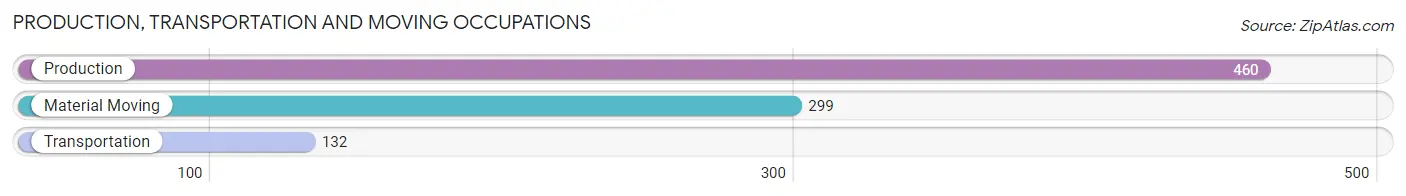
Production, Transportation and Moving Occupations
The most common Production, Transportation and Moving occupations in Monroe are Production (460 | 5.7%), Material Moving (299 | 3.7%), and Transportation (132 | 1.6%).
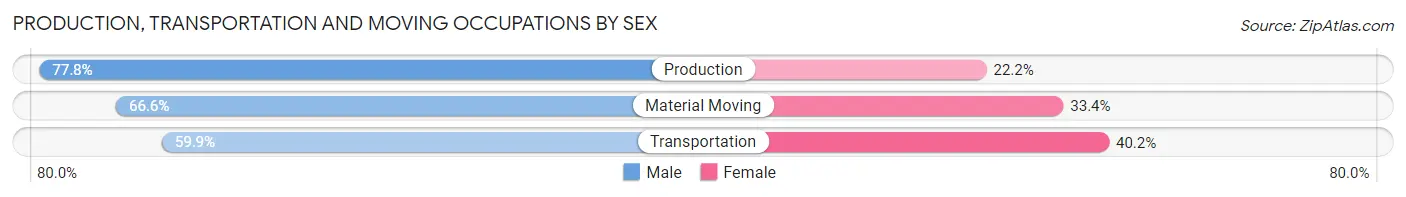
Production, Transportation and Moving Occupations by Sex
| Occupation | Male | Female |
| Production | 358 (77.8%) | 102 (22.2%) |
| Transportation | 79 (59.9%) | 53 (40.2%) |
| Material Moving | 199 (66.6%) | 100 (33.4%) |
| Total (Category) | 636 (71.4%) | 255 (28.6%) |
| Total (Overall) | 4,286 (53.1%) | 3,782 (46.9%) |
Employment Industries by Sex in Monroe
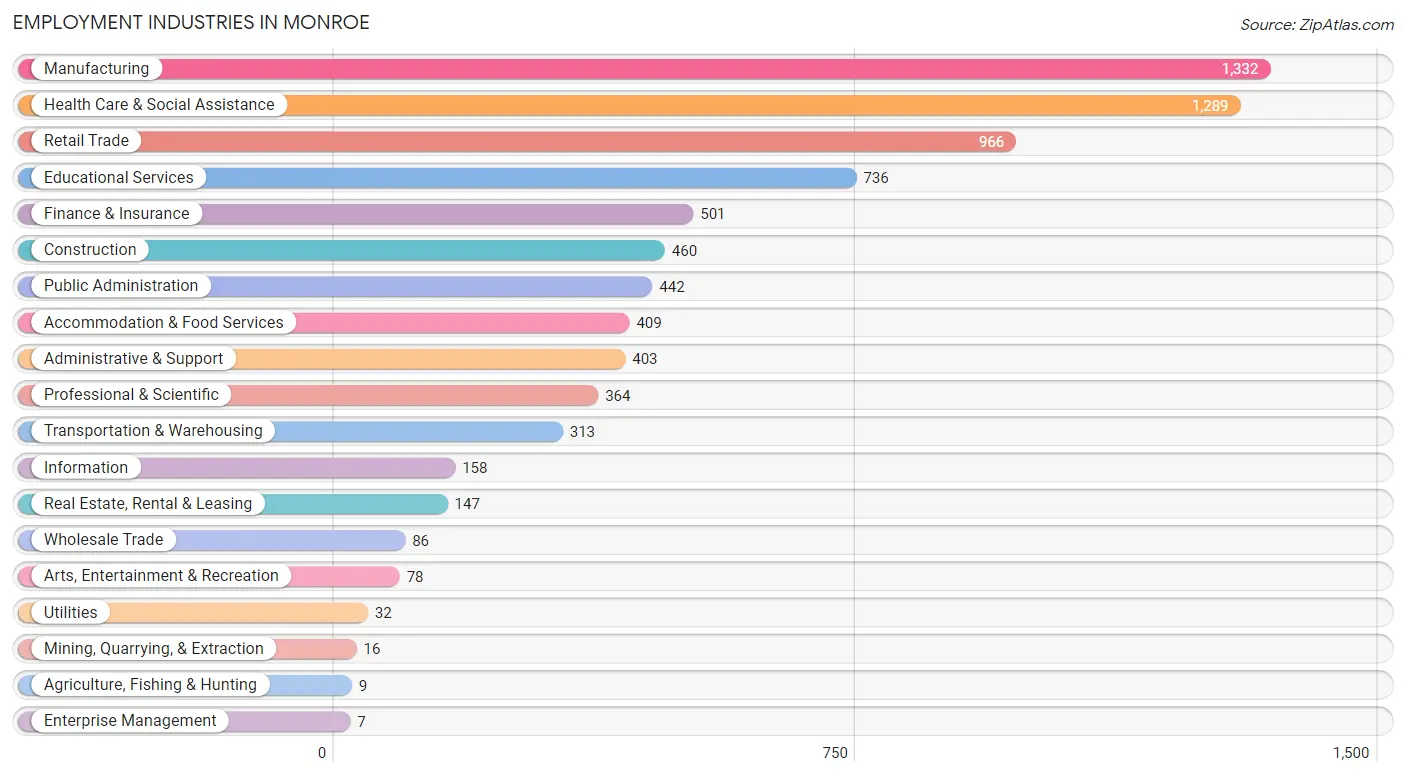
Employment Industries in Monroe
The major employment industries in Monroe include Manufacturing (1,332 | 16.5%), Health Care & Social Assistance (1,289 | 16.0%), Retail Trade (966 | 12.0%), Educational Services (736 | 9.1%), and Finance & Insurance (501 | 6.2%).
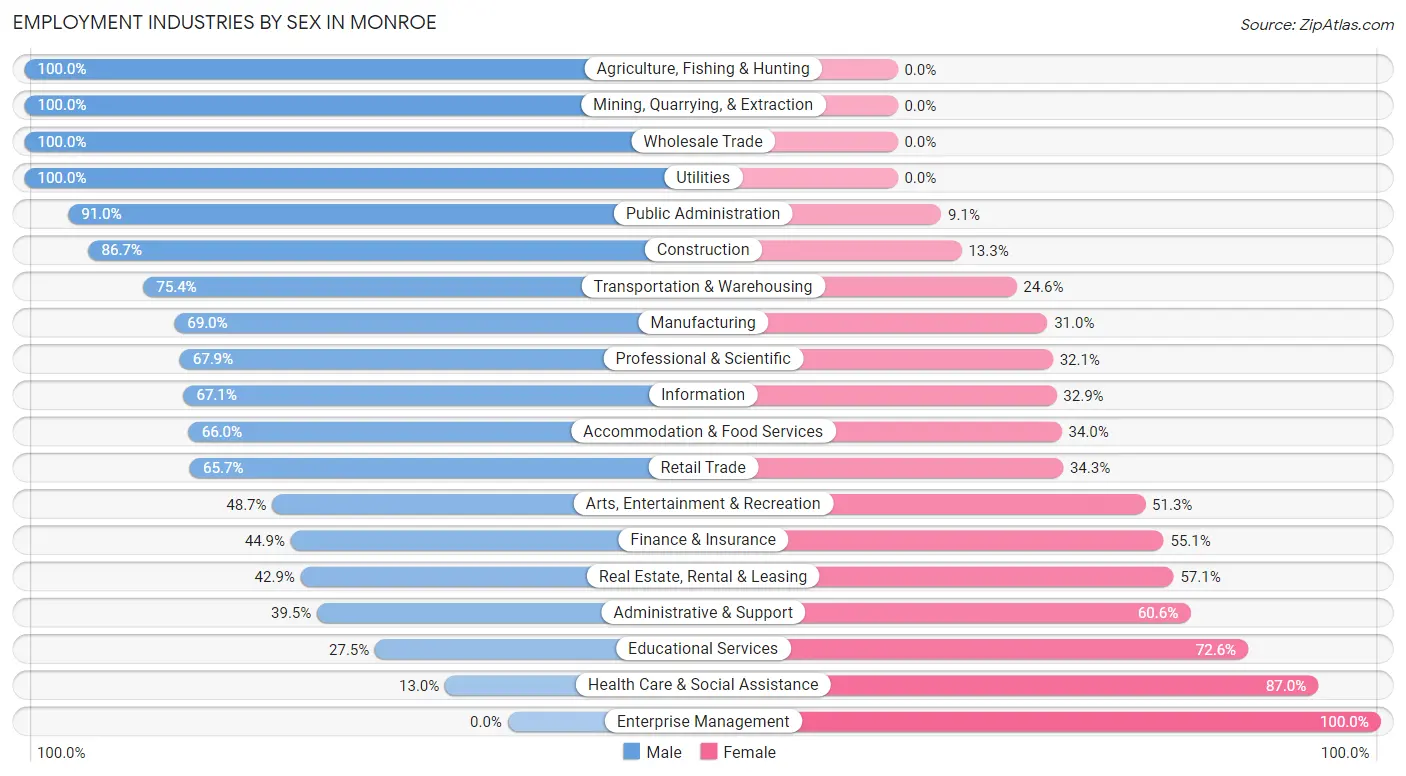
Employment Industries by Sex in Monroe
The Monroe industries that see more men than women are Agriculture, Fishing & Hunting (100.0%), Mining, Quarrying, & Extraction (100.0%), and Wholesale Trade (100.0%), whereas the industries that tend to have a higher number of women are Enterprise Management (100.0%), Health Care & Social Assistance (87.0%), and Educational Services (72.6%).
| Industry | Male | Female |
| Agriculture, Fishing & Hunting | 9 (100.0%) | 0 (0.0%) |
| Mining, Quarrying, & Extraction | 16 (100.0%) | 0 (0.0%) |
| Construction | 399 (86.7%) | 61 (13.3%) |
| Manufacturing | 919 (69.0%) | 413 (31.0%) |
| Wholesale Trade | 86 (100.0%) | 0 (0.0%) |
| Retail Trade | 635 (65.7%) | 331 (34.3%) |
| Transportation & Warehousing | 236 (75.4%) | 77 (24.6%) |
| Utilities | 32 (100.0%) | 0 (0.0%) |
| Information | 106 (67.1%) | 52 (32.9%) |
| Finance & Insurance | 225 (44.9%) | 276 (55.1%) |
| Real Estate, Rental & Leasing | 63 (42.9%) | 84 (57.1%) |
| Professional & Scientific | 247 (67.9%) | 117 (32.1%) |
| Enterprise Management | 0 (0.0%) | 7 (100.0%) |
| Administrative & Support | 159 (39.5%) | 244 (60.6%) |
| Educational Services | 202 (27.5%) | 534 (72.6%) |
| Health Care & Social Assistance | 167 (13.0%) | 1,122 (87.0%) |
| Arts, Entertainment & Recreation | 38 (48.7%) | 40 (51.3%) |
| Accommodation & Food Services | 270 (66.0%) | 139 (34.0%) |
| Public Administration | 402 (90.9%) | 40 (9.0%) |
| Total | 4,286 (53.1%) | 3,782 (46.9%) |
Education in Monroe
School Enrollment in Monroe
The most common levels of schooling among the 4,277 students in Monroe are high school (1,159 | 27.1%), middle school (1,044 | 24.4%), and elementary school (678 | 15.9%).
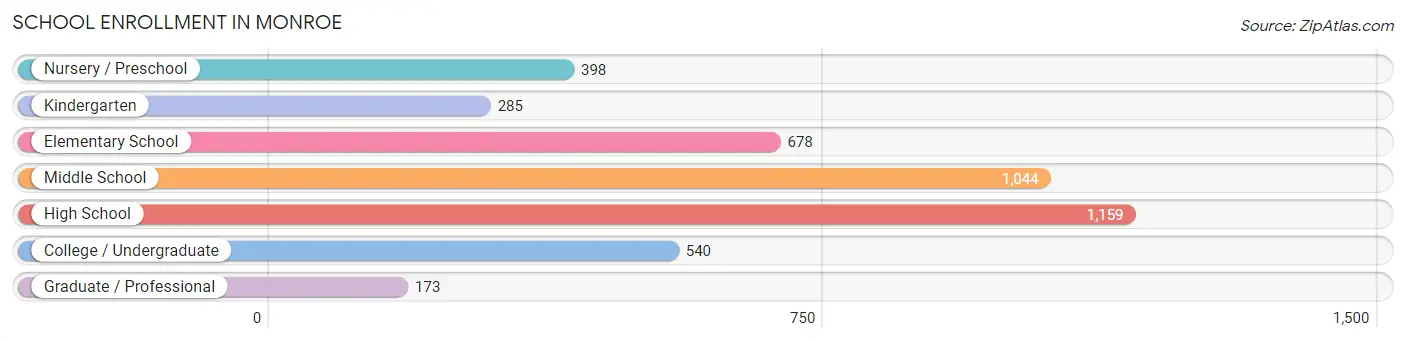
| School Level | # Students | % Students |
| Nursery / Preschool | 398 | 9.3% |
| Kindergarten | 285 | 6.7% |
| Elementary School | 678 | 15.9% |
| Middle School | 1,044 | 24.4% |
| High School | 1,159 | 27.1% |
| College / Undergraduate | 540 | 12.6% |
| Graduate / Professional | 173 | 4.0% |
| Total | 4,277 | 100.0% |
School Enrollment by Age by Funding Source in Monroe
Out of a total of 4,277 students who are enrolled in schools in Monroe, 680 (15.9%) attend a private institution, while the remaining 3,597 (84.1%) are enrolled in public schools. The age group of 3 to 4 year olds has the highest likelihood of being enrolled in private schools, with 206 (61.9% in the age bracket) enrolled. Conversely, the age group of 15 to 17 year olds has the lowest likelihood of being enrolled in a private school, with 925 (93.8% in the age bracket) attending a public institution.
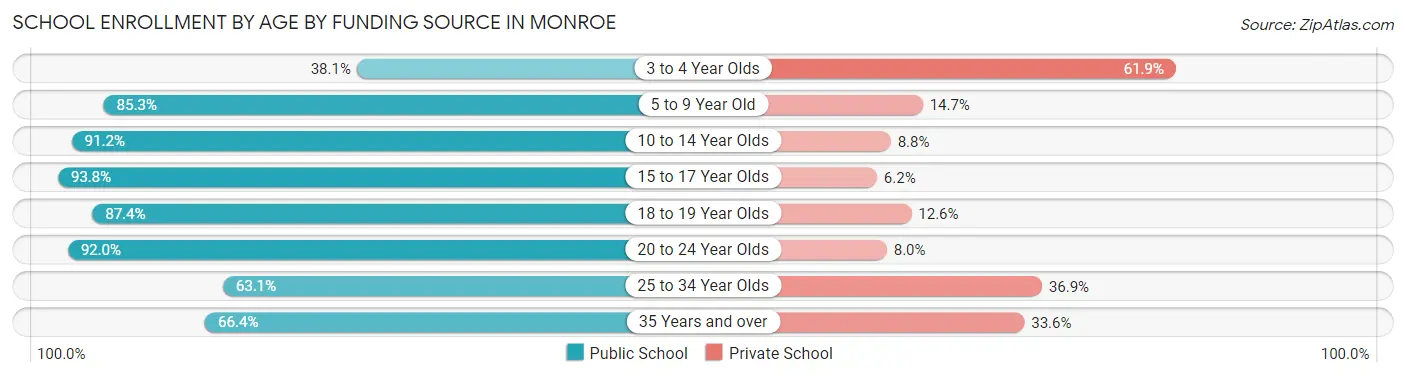
| Age Bracket | Public School | Private School |
| 3 to 4 Year Olds | 127 (38.1%) | 206 (61.9%) |
| 5 to 9 Year Old | 707 (85.3%) | 122 (14.7%) |
| 10 to 14 Year Olds | 1,248 (91.2%) | 120 (8.8%) |
| 15 to 17 Year Olds | 925 (93.8%) | 61 (6.2%) |
| 18 to 19 Year Olds | 104 (87.4%) | 15 (12.6%) |
| 20 to 24 Year Olds | 229 (92.0%) | 20 (8.0%) |
| 25 to 34 Year Olds | 111 (63.1%) | 65 (36.9%) |
| 35 Years and over | 144 (66.4%) | 73 (33.6%) |
| Total | 3,597 (84.1%) | 680 (15.9%) |
Educational Attainment by Field of Study in Monroe
Education (649 | 16.5%), science & technology (643 | 16.4%), business (568 | 14.5%), psychology (329 | 8.4%), and engineering (324 | 8.3%) are the most common fields of study among 3,927 individuals in Monroe who have obtained a bachelor's degree or higher.
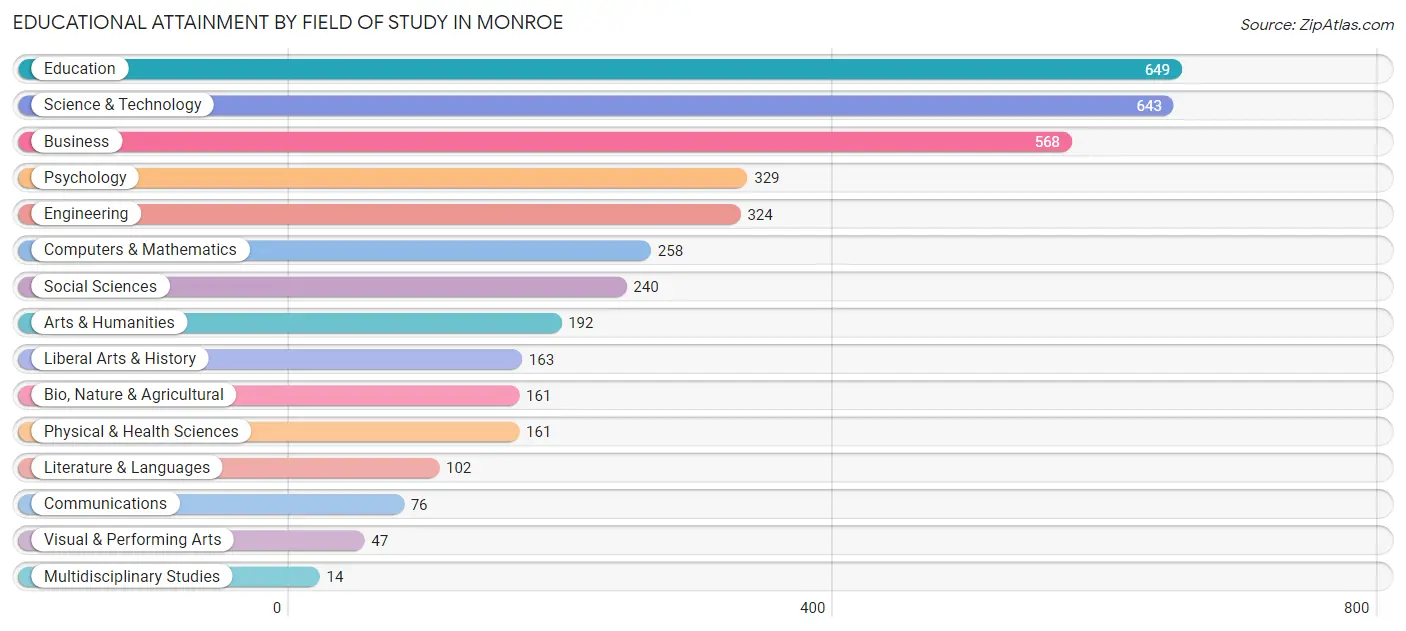
| Field of Study | # Graduates | % Graduates |
| Computers & Mathematics | 258 | 6.6% |
| Bio, Nature & Agricultural | 161 | 4.1% |
| Physical & Health Sciences | 161 | 4.1% |
| Psychology | 329 | 8.4% |
| Social Sciences | 240 | 6.1% |
| Engineering | 324 | 8.3% |
| Multidisciplinary Studies | 14 | 0.4% |
| Science & Technology | 643 | 16.4% |
| Business | 568 | 14.5% |
| Education | 649 | 16.5% |
| Literature & Languages | 102 | 2.6% |
| Liberal Arts & History | 163 | 4.2% |
| Visual & Performing Arts | 47 | 1.2% |
| Communications | 76 | 1.9% |
| Arts & Humanities | 192 | 4.9% |
| Total | 3,927 | 100.0% |
Transportation & Commute in Monroe
Vehicle Availability by Sex in Monroe
The most prevalent vehicle ownership categories in Monroe are males with 2 vehicles (2,114, accounting for 49.4%) and females with 2 vehicles (1,853, making up 57.1%).
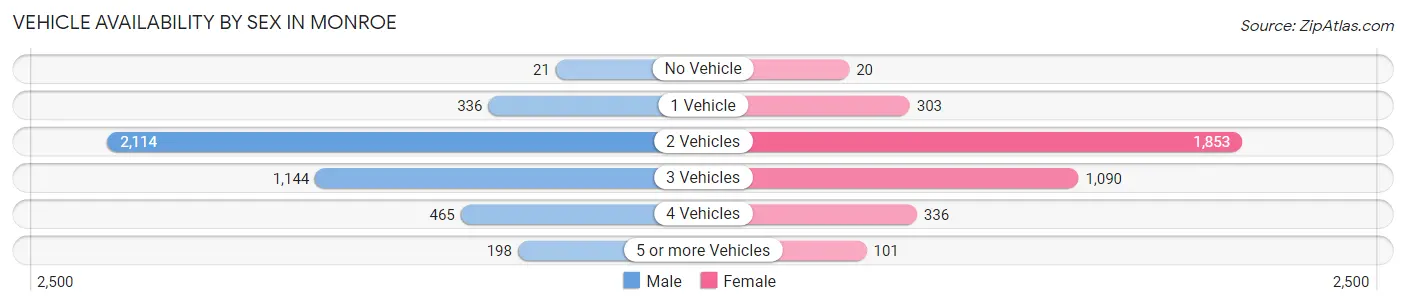
| Vehicles Available | Male | Female |
| No Vehicle | 21 (0.5%) | 20 (0.5%) |
| 1 Vehicle | 336 (7.9%) | 303 (8.2%) |
| 2 Vehicles | 2,114 (49.4%) | 1,853 (50.0%) |
| 3 Vehicles | 1,144 (26.7%) | 1,090 (29.4%) |
| 4 Vehicles | 465 (10.9%) | 336 (9.1%) |
| 5 or more Vehicles | 198 (4.6%) | 101 (2.7%) |
| Total | 4,278 (100.0%) | 3,703 (100.0%) |
Commute Time in Monroe
The most frequently occuring commute durations in Monroe are 20 to 24 minutes (1,147 commuters, 16.6%), 30 to 34 minutes (1,083 commuters, 15.7%), and 15 to 19 minutes (996 commuters, 14.4%).
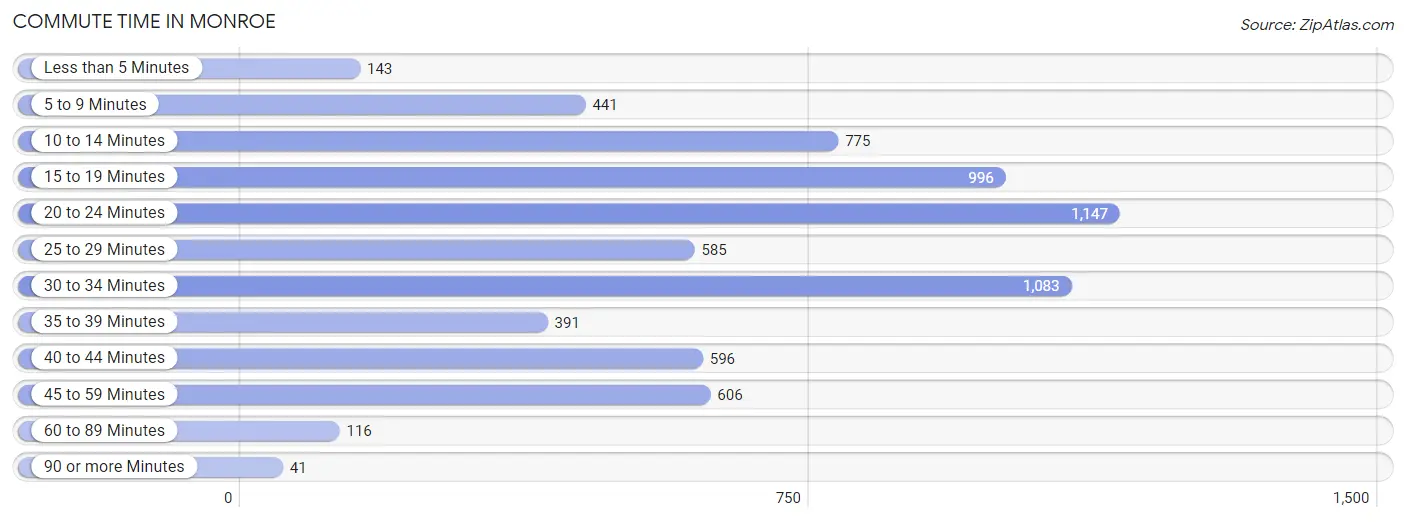
| Commute Time | # Commuters | % Commuters |
| Less than 5 Minutes | 143 | 2.1% |
| 5 to 9 Minutes | 441 | 6.4% |
| 10 to 14 Minutes | 775 | 11.2% |
| 15 to 19 Minutes | 996 | 14.4% |
| 20 to 24 Minutes | 1,147 | 16.6% |
| 25 to 29 Minutes | 585 | 8.5% |
| 30 to 34 Minutes | 1,083 | 15.7% |
| 35 to 39 Minutes | 391 | 5.7% |
| 40 to 44 Minutes | 596 | 8.6% |
| 45 to 59 Minutes | 606 | 8.8% |
| 60 to 89 Minutes | 116 | 1.7% |
| 90 or more Minutes | 41 | 0.6% |
Commute Time by Sex in Monroe
The most common commute times in Monroe are 30 to 34 minutes (639 commuters, 16.6%) for males and 20 to 24 minutes (614 commuters, 20.0%) for females.
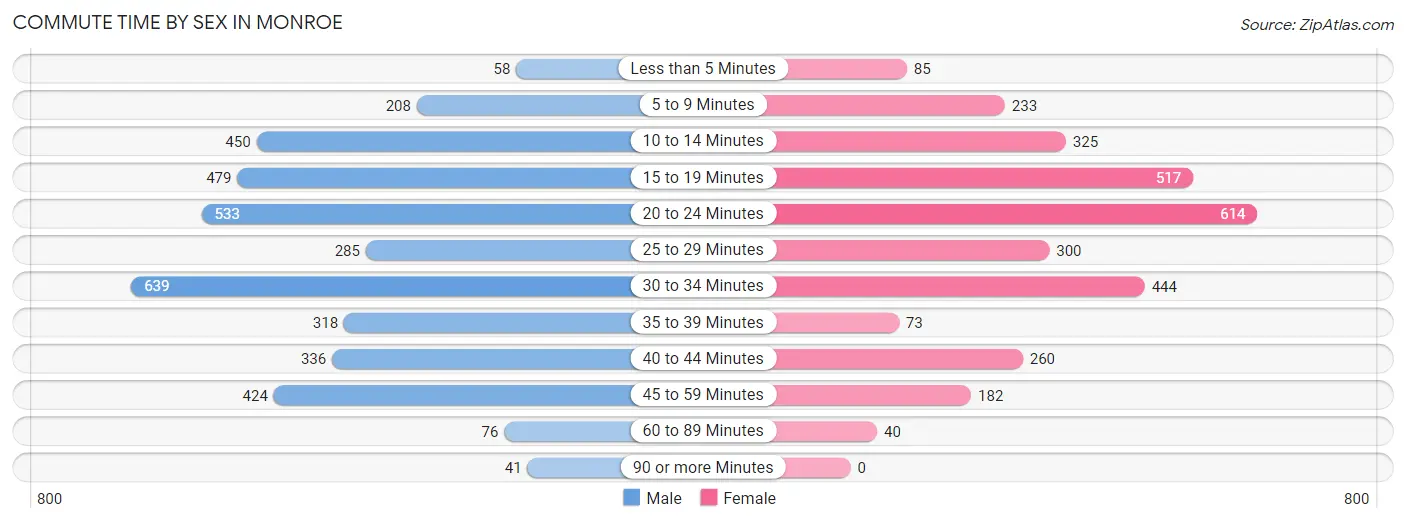
| Commute Time | Male | Female |
| Less than 5 Minutes | 58 (1.5%) | 85 (2.8%) |
| 5 to 9 Minutes | 208 (5.4%) | 233 (7.6%) |
| 10 to 14 Minutes | 450 (11.7%) | 325 (10.6%) |
| 15 to 19 Minutes | 479 (12.4%) | 517 (16.8%) |
| 20 to 24 Minutes | 533 (13.9%) | 614 (20.0%) |
| 25 to 29 Minutes | 285 (7.4%) | 300 (9.8%) |
| 30 to 34 Minutes | 639 (16.6%) | 444 (14.4%) |
| 35 to 39 Minutes | 318 (8.3%) | 73 (2.4%) |
| 40 to 44 Minutes | 336 (8.7%) | 260 (8.5%) |
| 45 to 59 Minutes | 424 (11.0%) | 182 (5.9%) |
| 60 to 89 Minutes | 76 (2.0%) | 40 (1.3%) |
| 90 or more Minutes | 41 (1.1%) | 0 (0.0%) |
Time of Departure to Work by Sex in Monroe
The most frequent times of departure to work in Monroe are 8:00 AM to 8:29 AM (602, 15.7%) for males and 7:00 AM to 7:29 AM (546, 17.8%) for females.
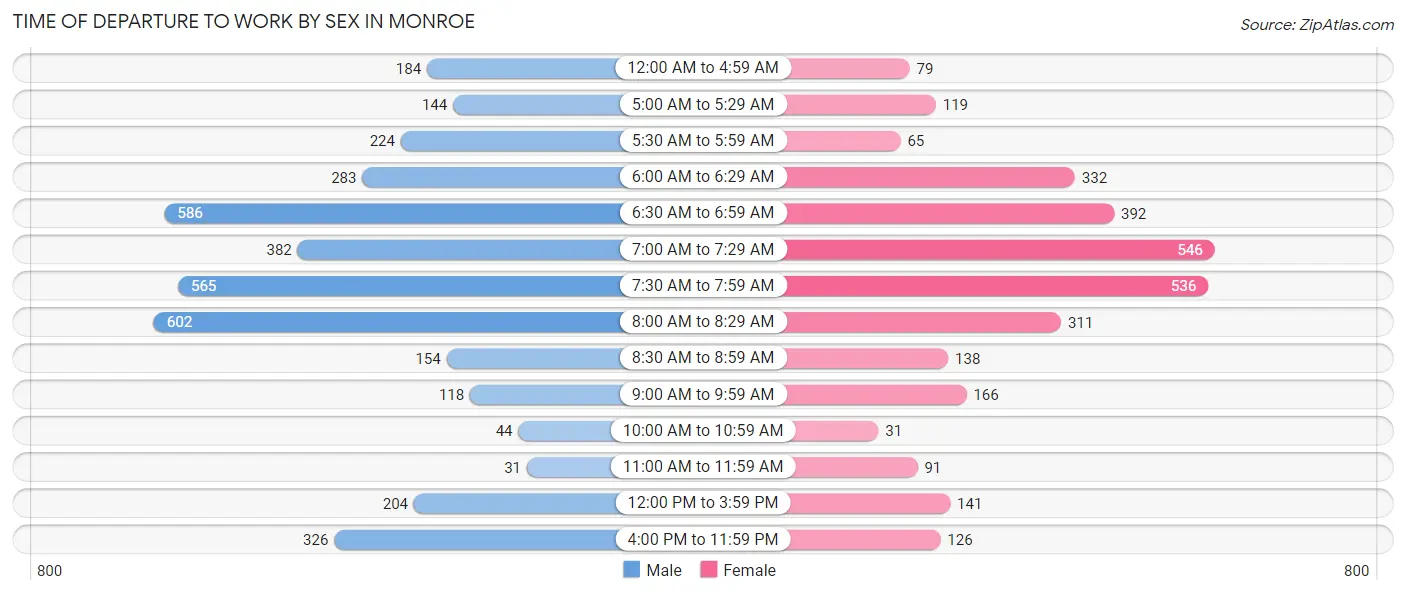
| Time of Departure | Male | Female |
| 12:00 AM to 4:59 AM | 184 (4.8%) | 79 (2.6%) |
| 5:00 AM to 5:29 AM | 144 (3.7%) | 119 (3.9%) |
| 5:30 AM to 5:59 AM | 224 (5.8%) | 65 (2.1%) |
| 6:00 AM to 6:29 AM | 283 (7.4%) | 332 (10.8%) |
| 6:30 AM to 6:59 AM | 586 (15.2%) | 392 (12.8%) |
| 7:00 AM to 7:29 AM | 382 (9.9%) | 546 (17.8%) |
| 7:30 AM to 7:59 AM | 565 (14.7%) | 536 (17.4%) |
| 8:00 AM to 8:29 AM | 602 (15.7%) | 311 (10.1%) |
| 8:30 AM to 8:59 AM | 154 (4.0%) | 138 (4.5%) |
| 9:00 AM to 9:59 AM | 118 (3.1%) | 166 (5.4%) |
| 10:00 AM to 10:59 AM | 44 (1.1%) | 31 (1.0%) |
| 11:00 AM to 11:59 AM | 31 (0.8%) | 91 (3.0%) |
| 12:00 PM to 3:59 PM | 204 (5.3%) | 141 (4.6%) |
| 4:00 PM to 11:59 PM | 326 (8.5%) | 126 (4.1%) |
| Total | 3,847 (100.0%) | 3,073 (100.0%) |
Housing Occupancy in Monroe
Occupancy by Ownership in Monroe
Of the total 5,333 dwellings in Monroe, owner-occupied units account for 4,210 (78.9%), while renter-occupied units make up 1,123 (21.1%).
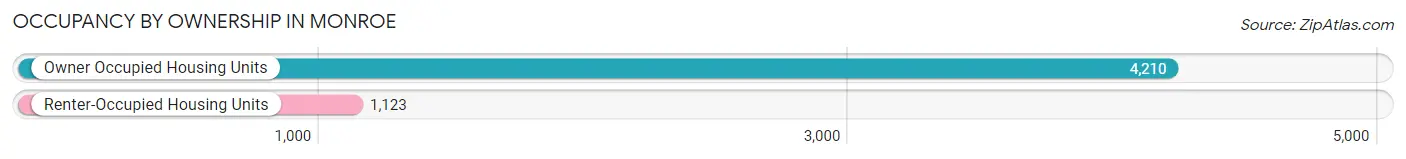
| Occupancy | # Housing Units | % Housing Units |
| Owner Occupied Housing Units | 4,210 | 78.9% |
| Renter-Occupied Housing Units | 1,123 | 21.1% |
| Total Occupied Housing Units | 5,333 | 100.0% |
Occupancy by Household Size in Monroe
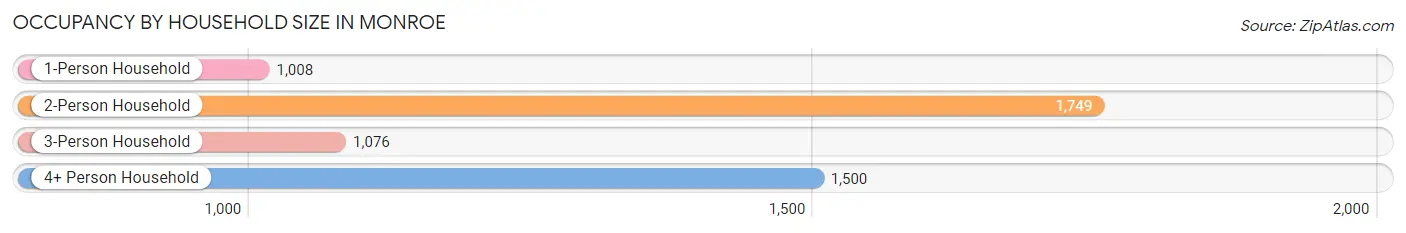
| Household Size | # Housing Units | % Housing Units |
| 1-Person Household | 1,008 | 18.9% |
| 2-Person Household | 1,749 | 32.8% |
| 3-Person Household | 1,076 | 20.2% |
| 4+ Person Household | 1,500 | 28.1% |
| Total Housing Units | 5,333 | 100.0% |
Occupancy by Ownership by Household Size in Monroe
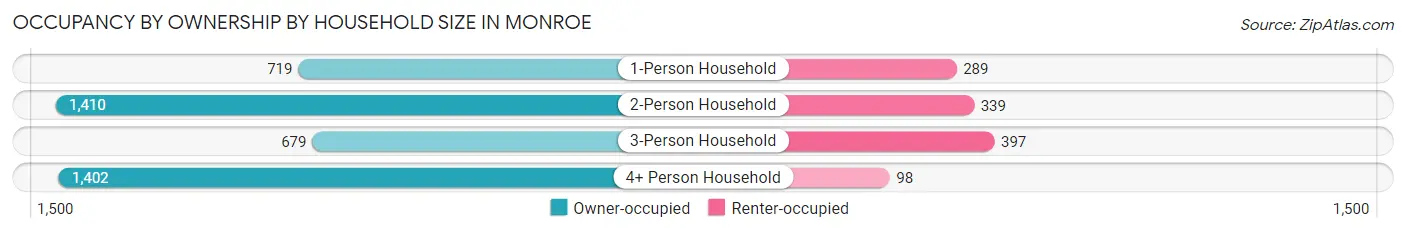
| Household Size | Owner-occupied | Renter-occupied |
| 1-Person Household | 719 (71.3%) | 289 (28.7%) |
| 2-Person Household | 1,410 (80.6%) | 339 (19.4%) |
| 3-Person Household | 679 (63.1%) | 397 (36.9%) |
| 4+ Person Household | 1,402 (93.5%) | 98 (6.5%) |
| Total Housing Units | 4,210 (78.9%) | 1,123 (21.1%) |
Occupancy by Educational Attainment in Monroe
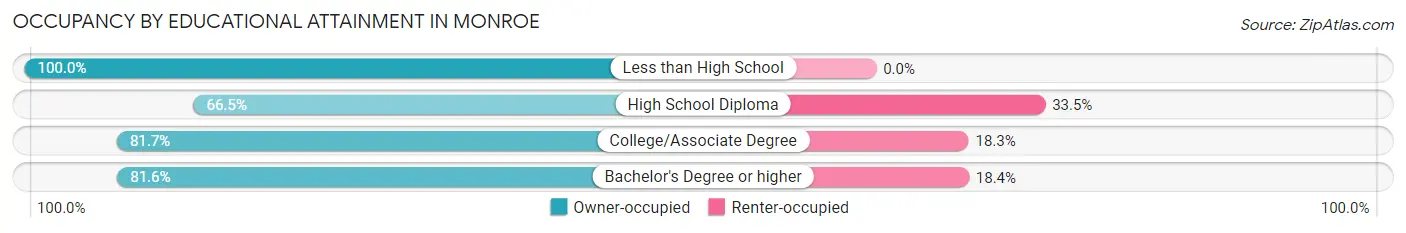
| Household Size | Owner-occupied | Renter-occupied |
| Less than High School | 128 (100.0%) | 0 (0.0%) |
| High School Diploma | 736 (66.5%) | 371 (33.5%) |
| College/Associate Degree | 1,645 (81.7%) | 369 (18.3%) |
| Bachelor's Degree or higher | 1,701 (81.6%) | 383 (18.4%) |
Occupancy by Age of Householder in Monroe
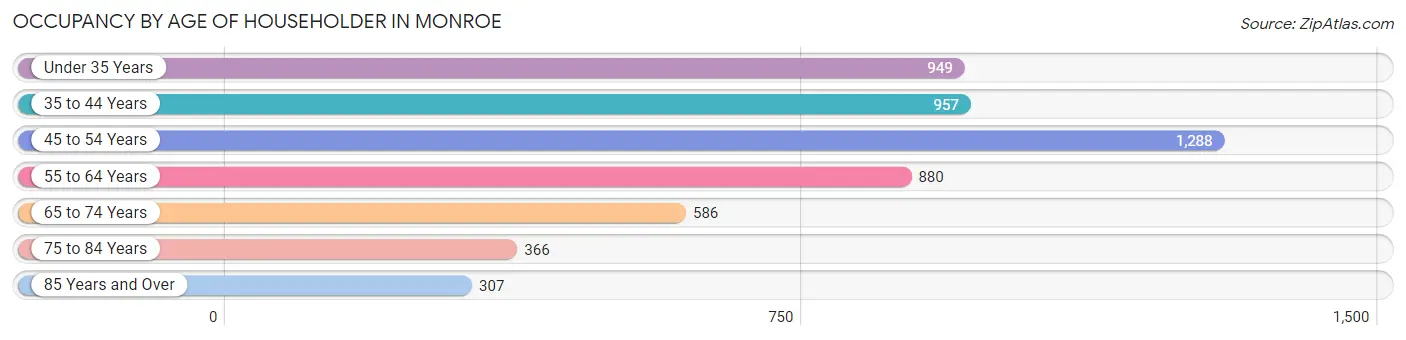
| Age Bracket | # Households | % Households |
| Under 35 Years | 949 | 17.8% |
| 35 to 44 Years | 957 | 17.9% |
| 45 to 54 Years | 1,288 | 24.1% |
| 55 to 64 Years | 880 | 16.5% |
| 65 to 74 Years | 586 | 11.0% |
| 75 to 84 Years | 366 | 6.9% |
| 85 Years and Over | 307 | 5.8% |
| Total | 5,333 | 100.0% |
Housing Finances in Monroe
Median Income by Occupancy in Monroe
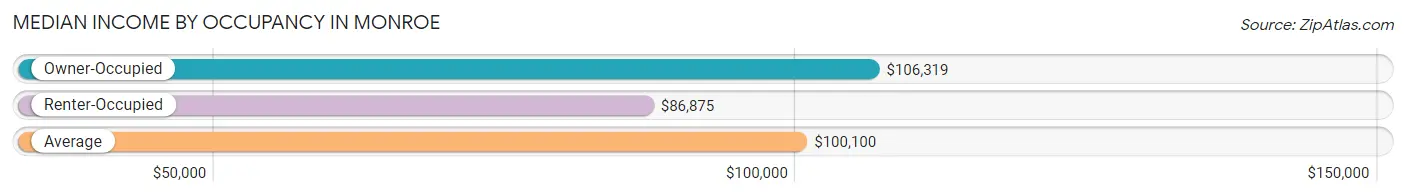
| Occupancy Type | # Households | Median Income |
| Owner-Occupied | 4,210 (78.9%) | $106,319 |
| Renter-Occupied | 1,123 (21.1%) | $86,875 |
| Average | 5,333 (100.0%) | $100,100 |
Occupancy by Householder Income Bracket in Monroe
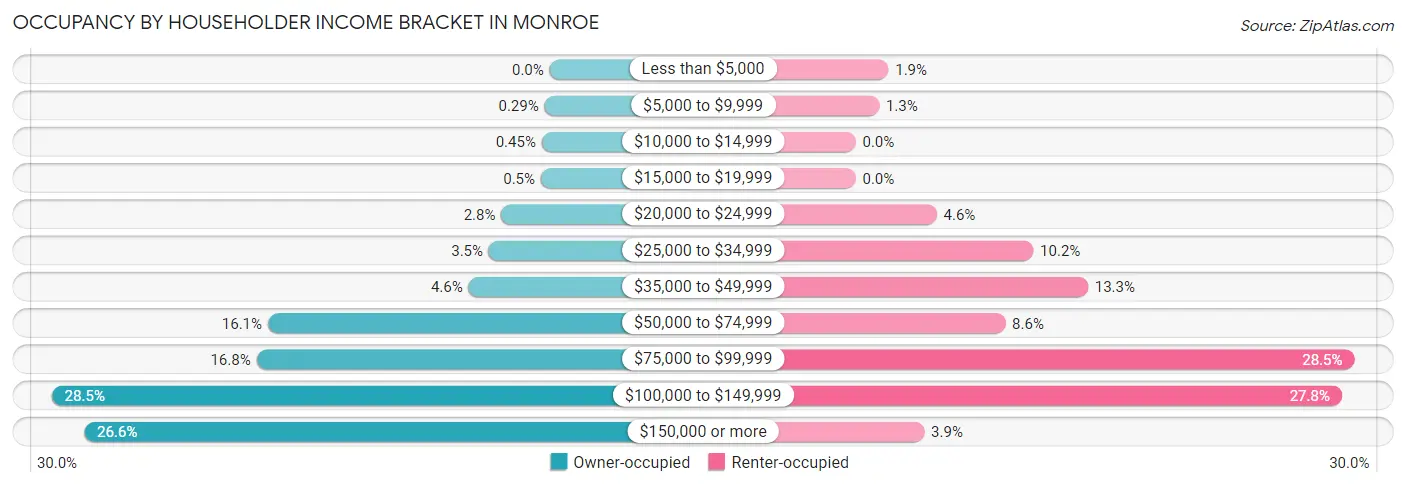
| Income Bracket | Owner-occupied | Renter-occupied |
| Less than $5,000 | 0 (0.0%) | 21 (1.9%) |
| $5,000 to $9,999 | 12 (0.3%) | 15 (1.3%) |
| $10,000 to $14,999 | 19 (0.4%) | 0 (0.0%) |
| $15,000 to $19,999 | 21 (0.5%) | 0 (0.0%) |
| $20,000 to $24,999 | 116 (2.8%) | 52 (4.6%) |
| $25,000 to $34,999 | 146 (3.5%) | 114 (10.2%) |
| $35,000 to $49,999 | 195 (4.6%) | 149 (13.3%) |
| $50,000 to $74,999 | 678 (16.1%) | 96 (8.6%) |
| $75,000 to $99,999 | 705 (16.8%) | 320 (28.5%) |
| $100,000 to $149,999 | 1,198 (28.5%) | 312 (27.8%) |
| $150,000 or more | 1,120 (26.6%) | 44 (3.9%) |
| Total | 4,210 (100.0%) | 1,123 (100.0%) |
Monthly Housing Cost Tiers in Monroe
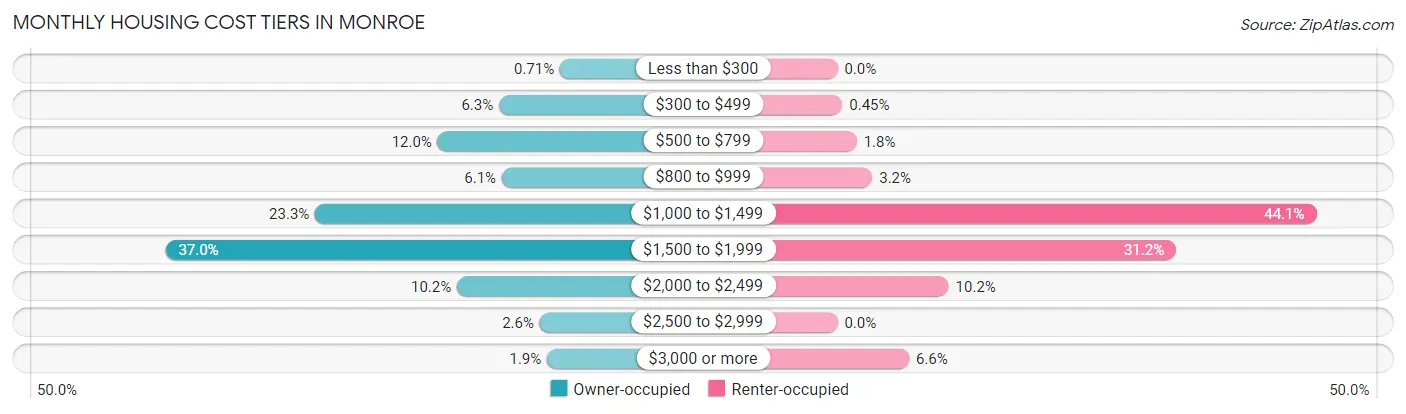
| Monthly Cost | Owner-occupied | Renter-occupied |
| Less than $300 | 30 (0.7%) | 0 (0.0%) |
| $300 to $499 | 266 (6.3%) | 5 (0.4%) |
| $500 to $799 | 504 (12.0%) | 20 (1.8%) |
| $800 to $999 | 255 (6.1%) | 36 (3.2%) |
| $1,000 to $1,499 | 979 (23.3%) | 495 (44.1%) |
| $1,500 to $1,999 | 1,559 (37.0%) | 350 (31.2%) |
| $2,000 to $2,499 | 429 (10.2%) | 115 (10.2%) |
| $2,500 to $2,999 | 108 (2.6%) | 0 (0.0%) |
| $3,000 or more | 80 (1.9%) | 74 (6.6%) |
| Total | 4,210 (100.0%) | 1,123 (100.0%) |
Physical Housing Characteristics in Monroe
Housing Structures in Monroe
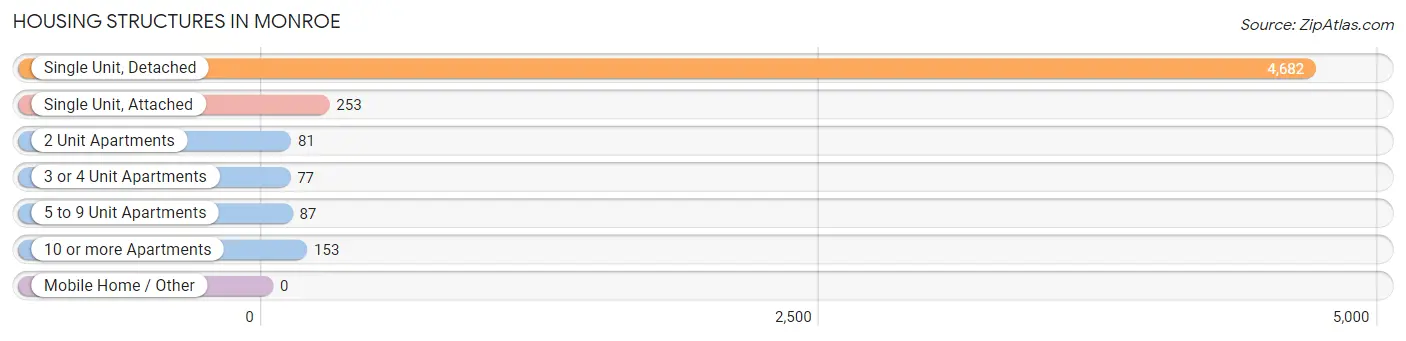
| Structure Type | # Housing Units | % Housing Units |
| Single Unit, Detached | 4,682 | 87.8% |
| Single Unit, Attached | 253 | 4.7% |
| 2 Unit Apartments | 81 | 1.5% |
| 3 or 4 Unit Apartments | 77 | 1.4% |
| 5 to 9 Unit Apartments | 87 | 1.6% |
| 10 or more Apartments | 153 | 2.9% |
| Mobile Home / Other | 0 | 0.0% |
| Total | 5,333 | 100.0% |
Housing Structures by Occupancy in Monroe
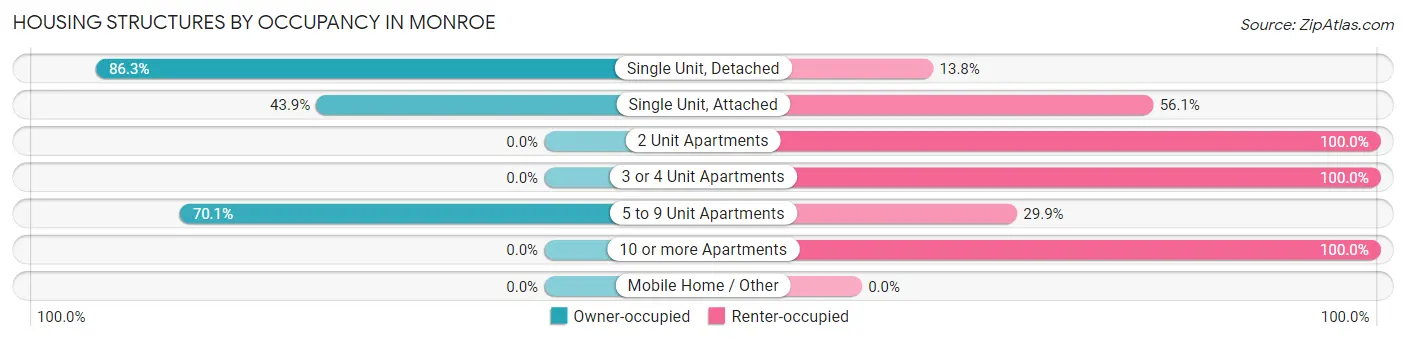
| Structure Type | Owner-occupied | Renter-occupied |
| Single Unit, Detached | 4,038 (86.3%) | 644 (13.8%) |
| Single Unit, Attached | 111 (43.9%) | 142 (56.1%) |
| 2 Unit Apartments | 0 (0.0%) | 81 (100.0%) |
| 3 or 4 Unit Apartments | 0 (0.0%) | 77 (100.0%) |
| 5 to 9 Unit Apartments | 61 (70.1%) | 26 (29.9%) |
| 10 or more Apartments | 0 (0.0%) | 153 (100.0%) |
| Mobile Home / Other | 0 (0.0%) | 0 (0.0%) |
| Total | 4,210 (78.9%) | 1,123 (21.1%) |
Housing Structures by Number of Rooms in Monroe
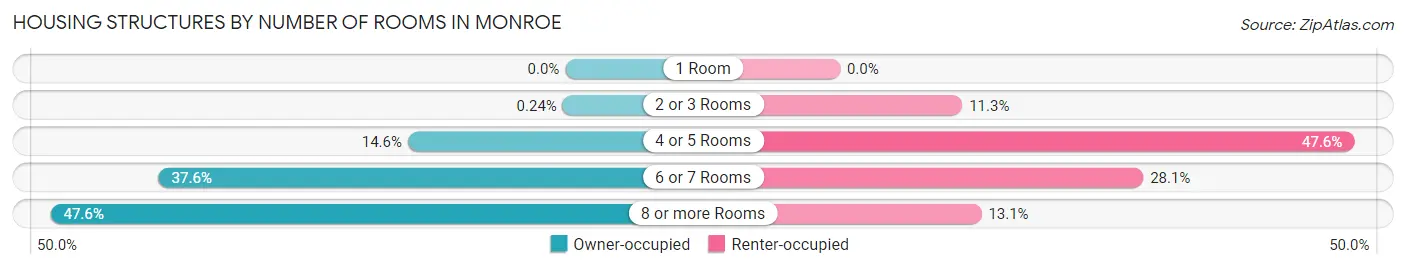
| Number of Rooms | Owner-occupied | Renter-occupied |
| 1 Room | 0 (0.0%) | 0 (0.0%) |
| 2 or 3 Rooms | 10 (0.2%) | 127 (11.3%) |
| 4 or 5 Rooms | 613 (14.6%) | 534 (47.5%) |
| 6 or 7 Rooms | 1,583 (37.6%) | 315 (28.1%) |
| 8 or more Rooms | 2,004 (47.6%) | 147 (13.1%) |
| Total | 4,210 (100.0%) | 1,123 (100.0%) |
Housing Structure by Heating Type in Monroe
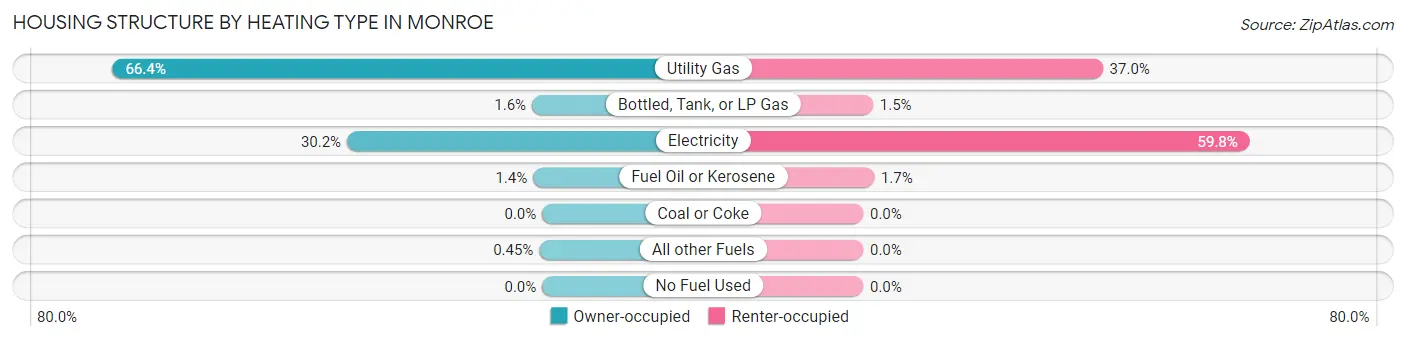
| Heating Type | Owner-occupied | Renter-occupied |
| Utility Gas | 2,796 (66.4%) | 416 (37.0%) |
| Bottled, Tank, or LP Gas | 66 (1.6%) | 17 (1.5%) |
| Electricity | 1,270 (30.2%) | 671 (59.8%) |
| Fuel Oil or Kerosene | 59 (1.4%) | 19 (1.7%) |
| Coal or Coke | 0 (0.0%) | 0 (0.0%) |
| All other Fuels | 19 (0.4%) | 0 (0.0%) |
| No Fuel Used | 0 (0.0%) | 0 (0.0%) |
| Total | 4,210 (100.0%) | 1,123 (100.0%) |
Household Vehicle Usage in Monroe
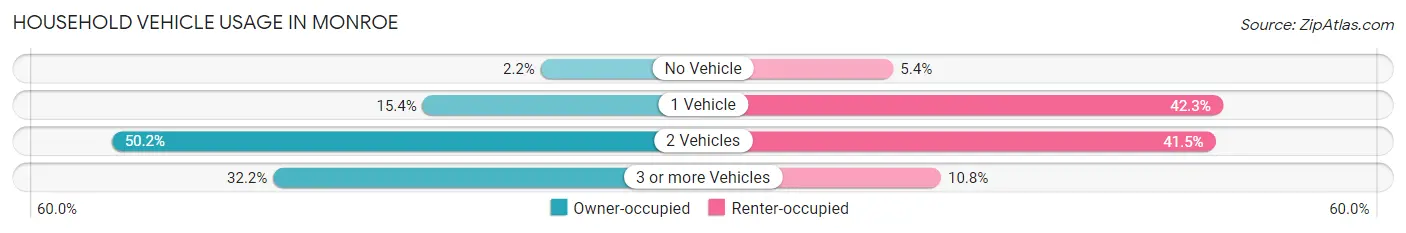
| Vehicles per Household | Owner-occupied | Renter-occupied |
| No Vehicle | 92 (2.2%) | 61 (5.4%) |
| 1 Vehicle | 649 (15.4%) | 475 (42.3%) |
| 2 Vehicles | 2,115 (50.2%) | 466 (41.5%) |
| 3 or more Vehicles | 1,354 (32.2%) | 121 (10.8%) |
| Total | 4,210 (100.0%) | 1,123 (100.0%) |
Real Estate & Mortgages in Monroe
Real Estate and Mortgage Overview in Monroe
| Characteristic | Without Mortgage | With Mortgage |
| Housing Units | 872 | 3,338 |
| Median Property Value | $226,200 | $246,600 |
| Median Household Income | $64,375 | $963 |
| Monthly Housing Costs | $600 | $80 |
| Real Estate Taxes | $3,088 | $40 |
Property Value by Mortgage Status in Monroe
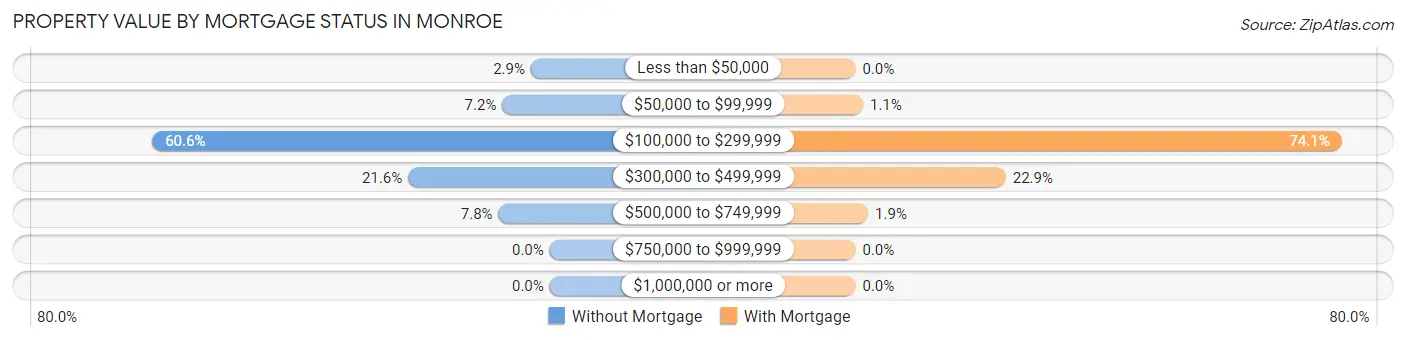
| Property Value | Without Mortgage | With Mortgage |
| Less than $50,000 | 25 (2.9%) | 0 (0.0%) |
| $50,000 to $99,999 | 63 (7.2%) | 38 (1.1%) |
| $100,000 to $299,999 | 528 (60.6%) | 2,472 (74.1%) |
| $300,000 to $499,999 | 188 (21.6%) | 764 (22.9%) |
| $500,000 to $749,999 | 68 (7.8%) | 64 (1.9%) |
| $750,000 to $999,999 | 0 (0.0%) | 0 (0.0%) |
| $1,000,000 or more | 0 (0.0%) | 0 (0.0%) |
| Total | 872 (100.0%) | 3,338 (100.0%) |
Household Income by Mortgage Status in Monroe
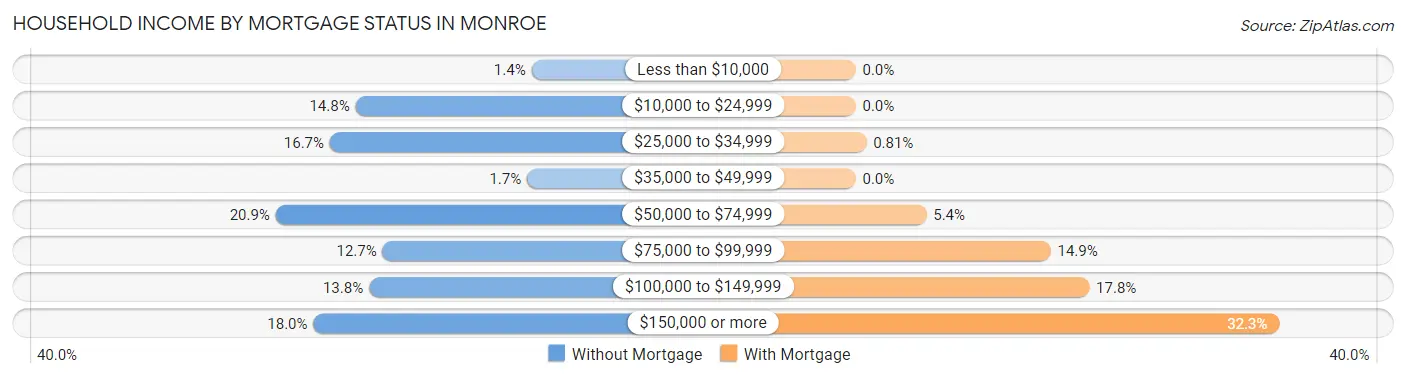
| Household Income | Without Mortgage | With Mortgage |
| Less than $10,000 | 12 (1.4%) | 0 (0.0%) |
| $10,000 to $24,999 | 129 (14.8%) | 0 (0.0%) |
| $25,000 to $34,999 | 146 (16.7%) | 27 (0.8%) |
| $35,000 to $49,999 | 15 (1.7%) | 0 (0.0%) |
| $50,000 to $74,999 | 182 (20.9%) | 180 (5.4%) |
| $75,000 to $99,999 | 111 (12.7%) | 496 (14.9%) |
| $100,000 to $149,999 | 120 (13.8%) | 594 (17.8%) |
| $150,000 or more | 157 (18.0%) | 1,078 (32.3%) |
| Total | 872 (100.0%) | 3,338 (100.0%) |
Property Value to Household Income Ratio in Monroe
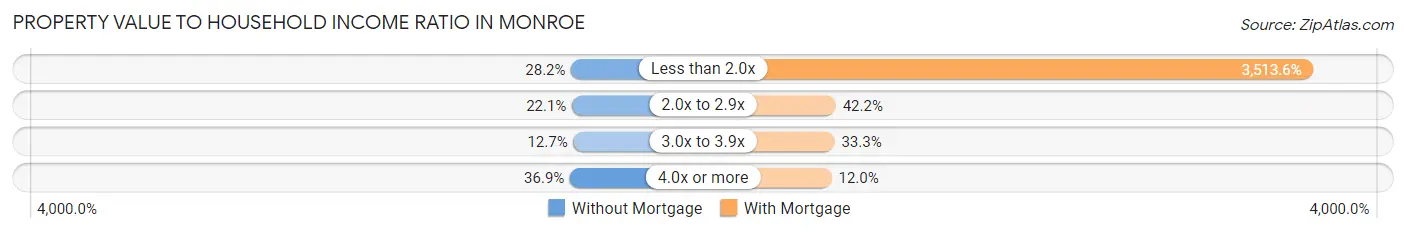
| Value-to-Income Ratio | Without Mortgage | With Mortgage |
| Less than 2.0x | 246 (28.2%) | 117,283 (3,513.6%) |
| 2.0x to 2.9x | 193 (22.1%) | 1,408 (42.2%) |
| 3.0x to 3.9x | 111 (12.7%) | 1,110 (33.3%) |
| 4.0x or more | 322 (36.9%) | 400 (12.0%) |
| Total | 872 (100.0%) | 3,338 (100.0%) |
Real Estate Taxes by Mortgage Status in Monroe
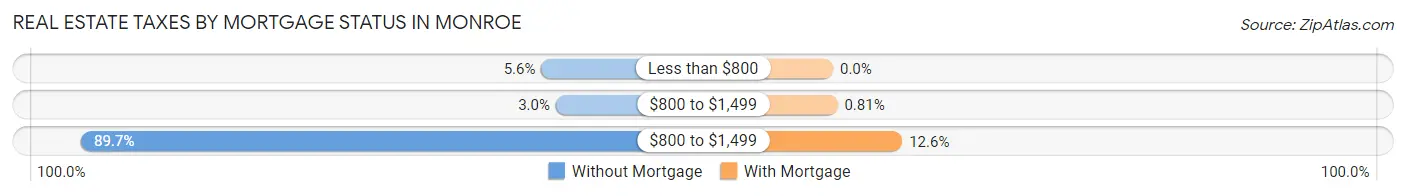
| Property Taxes | Without Mortgage | With Mortgage |
| Less than $800 | 49 (5.6%) | 0 (0.0%) |
| $800 to $1,499 | 26 (3.0%) | 27 (0.8%) |
| $800 to $1,499 | 782 (89.7%) | 422 (12.6%) |
| Total | 872 (100.0%) | 3,338 (100.0%) |
Health & Disability in Monroe
Health Insurance Coverage by Age in Monroe
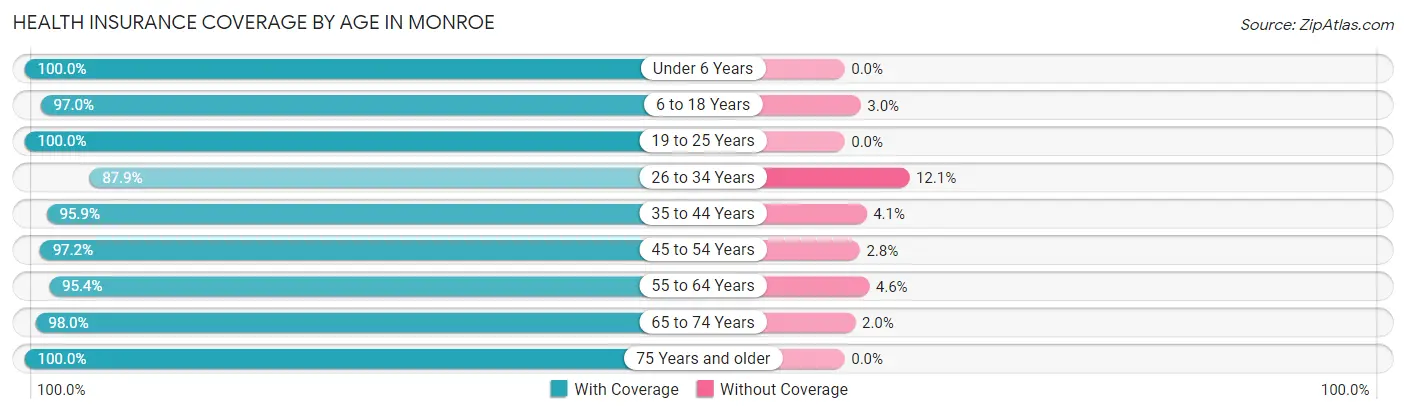
| Age Bracket | With Coverage | Without Coverage |
| Under 6 Years | 1,266 (100.0%) | 0 (0.0%) |
| 6 to 18 Years | 3,136 (97.0%) | 97 (3.0%) |
| 19 to 25 Years | 1,214 (100.0%) | 0 (0.0%) |
| 26 to 34 Years | 1,531 (87.9%) | 210 (12.1%) |
| 35 to 44 Years | 1,946 (95.9%) | 83 (4.1%) |
| 45 to 54 Years | 2,027 (97.2%) | 59 (2.8%) |
| 55 to 64 Years | 1,292 (95.4%) | 62 (4.6%) |
| 65 to 74 Years | 1,027 (98.0%) | 21 (2.0%) |
| 75 Years and older | 1,032 (100.0%) | 0 (0.0%) |
| Total | 14,471 (96.5%) | 532 (3.5%) |
Health Insurance Coverage by Citizenship Status in Monroe
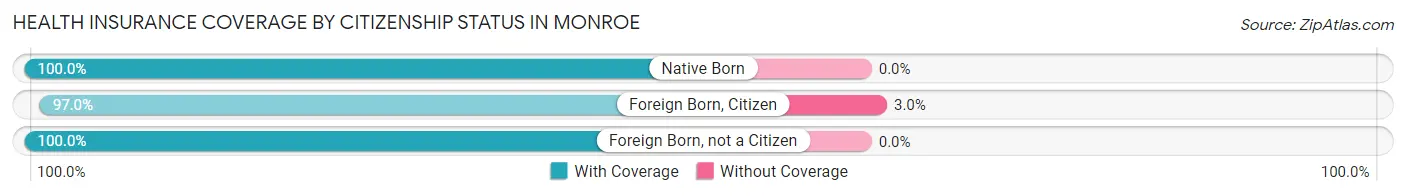
| Citizenship Status | With Coverage | Without Coverage |
| Native Born | 1,266 (100.0%) | 0 (0.0%) |
| Foreign Born, Citizen | 3,136 (97.0%) | 97 (3.0%) |
| Foreign Born, not a Citizen | 1,214 (100.0%) | 0 (0.0%) |
Health Insurance Coverage by Household Income in Monroe
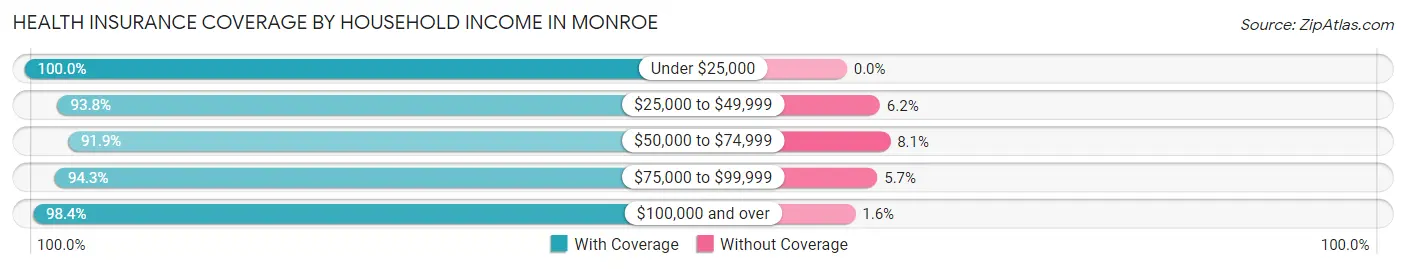
| Household Income | With Coverage | Without Coverage |
| Under $25,000 | 297 (100.0%) | 0 (0.0%) |
| $25,000 to $49,999 | 998 (93.8%) | 66 (6.2%) |
| $50,000 to $74,999 | 1,560 (91.9%) | 138 (8.1%) |
| $75,000 to $99,999 | 3,135 (94.3%) | 190 (5.7%) |
| $100,000 and over | 8,466 (98.4%) | 138 (1.6%) |
Public vs Private Health Insurance Coverage by Age in Monroe
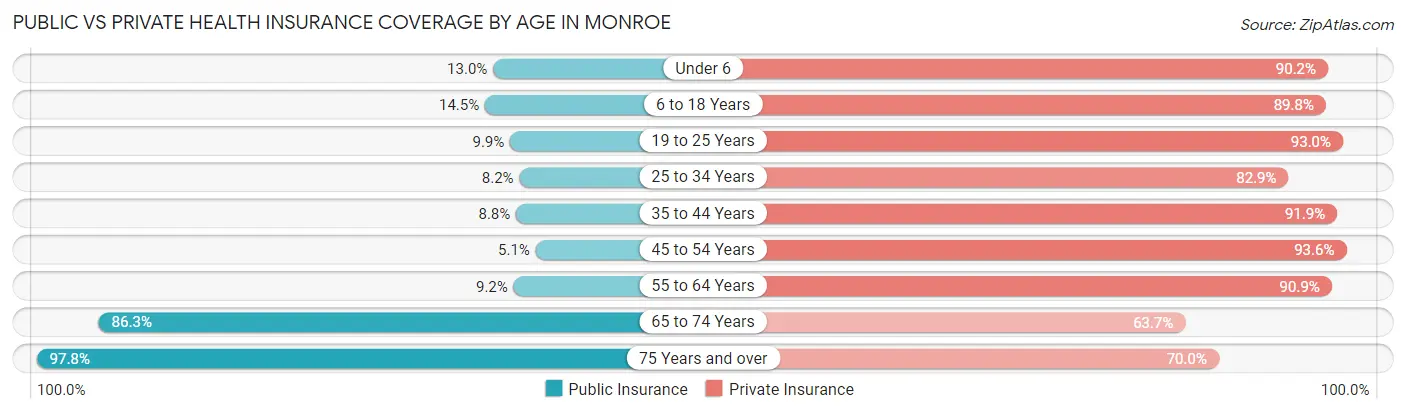
| Age Bracket | Public Insurance | Private Insurance |
| Under 6 | 165 (13.0%) | 1,142 (90.2%) |
| 6 to 18 Years | 470 (14.5%) | 2,904 (89.8%) |
| 19 to 25 Years | 120 (9.9%) | 1,129 (93.0%) |
| 25 to 34 Years | 142 (8.2%) | 1,443 (82.9%) |
| 35 to 44 Years | 178 (8.8%) | 1,865 (91.9%) |
| 45 to 54 Years | 107 (5.1%) | 1,953 (93.6%) |
| 55 to 64 Years | 125 (9.2%) | 1,231 (90.9%) |
| 65 to 74 Years | 904 (86.3%) | 668 (63.7%) |
| 75 Years and over | 1,009 (97.8%) | 722 (70.0%) |
| Total | 3,220 (21.5%) | 13,057 (87.0%) |
Disability Status by Sex by Age in Monroe
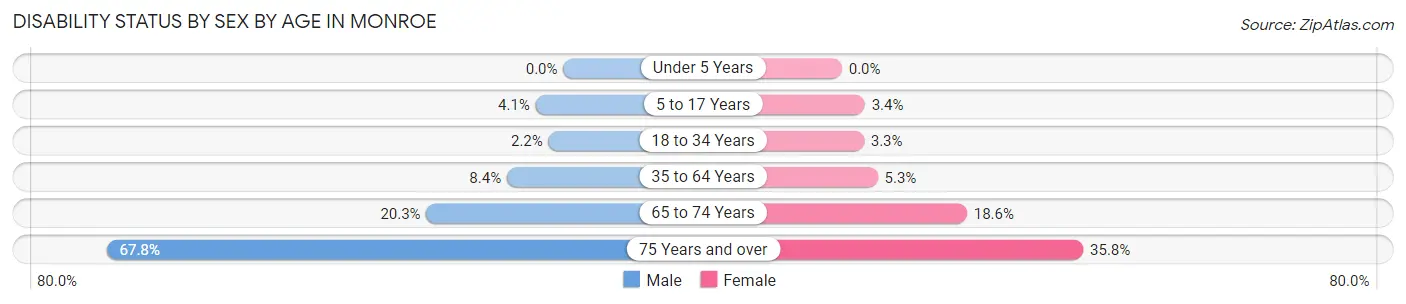
| Age Bracket | Male | Female |
| Under 5 Years | 0 (0.0%) | 0 (0.0%) |
| 5 to 17 Years | 78 (4.1%) | 46 (3.4%) |
| 18 to 34 Years | 34 (2.2%) | 50 (3.3%) |
| 35 to 64 Years | 231 (8.4%) | 144 (5.3%) |
| 65 to 74 Years | 86 (20.3%) | 116 (18.6%) |
| 75 Years and over | 274 (67.8%) | 225 (35.8%) |
Disability Class by Sex by Age in Monroe
Disability Class: Hearing Difficulty
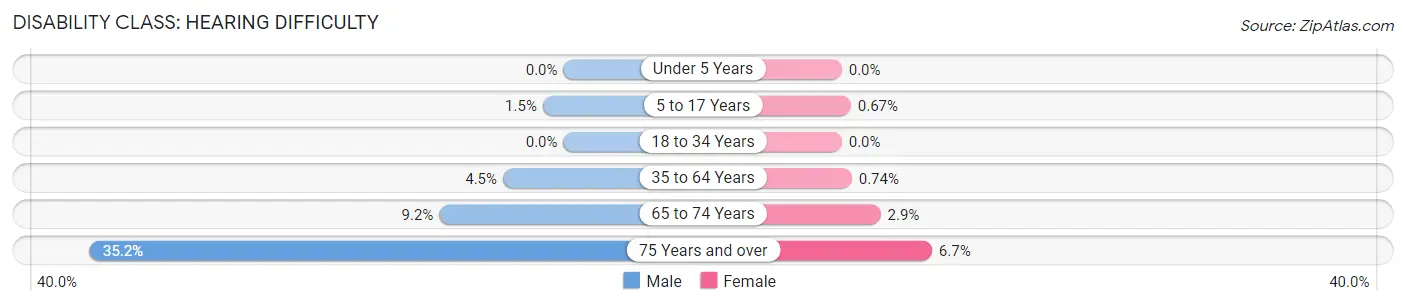
| Age Bracket | Male | Female |
| Under 5 Years | 0 (0.0%) | 0 (0.0%) |
| 5 to 17 Years | 29 (1.5%) | 9 (0.7%) |
| 18 to 34 Years | 0 (0.0%) | 0 (0.0%) |
| 35 to 64 Years | 124 (4.5%) | 20 (0.7%) |
| 65 to 74 Years | 39 (9.2%) | 18 (2.9%) |
| 75 Years and over | 142 (35.1%) | 42 (6.7%) |
Disability Class: Vision Difficulty
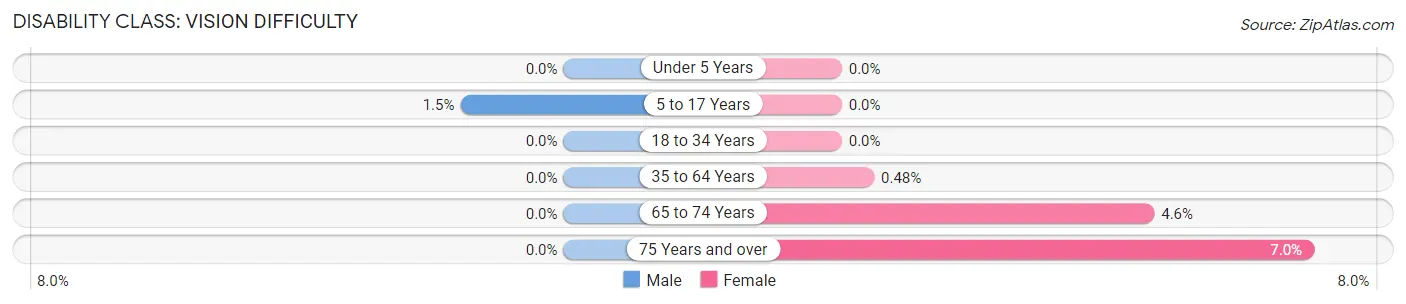
| Age Bracket | Male | Female |
| Under 5 Years | 0 (0.0%) | 0 (0.0%) |
| 5 to 17 Years | 29 (1.5%) | 0 (0.0%) |
| 18 to 34 Years | 0 (0.0%) | 0 (0.0%) |
| 35 to 64 Years | 0 (0.0%) | 13 (0.5%) |
| 65 to 74 Years | 0 (0.0%) | 29 (4.6%) |
| 75 Years and over | 0 (0.0%) | 44 (7.0%) |
Disability Class: Cognitive Difficulty
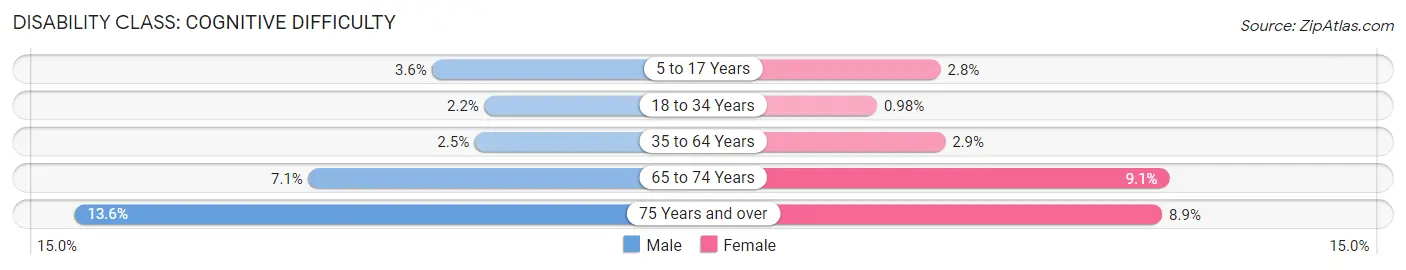
| Age Bracket | Male | Female |
| 5 to 17 Years | 69 (3.6%) | 37 (2.8%) |
| 18 to 34 Years | 34 (2.2%) | 15 (1.0%) |
| 35 to 64 Years | 68 (2.5%) | 78 (2.9%) |
| 65 to 74 Years | 30 (7.1%) | 57 (9.1%) |
| 75 Years and over | 55 (13.6%) | 56 (8.9%) |
Disability Class: Ambulatory Difficulty
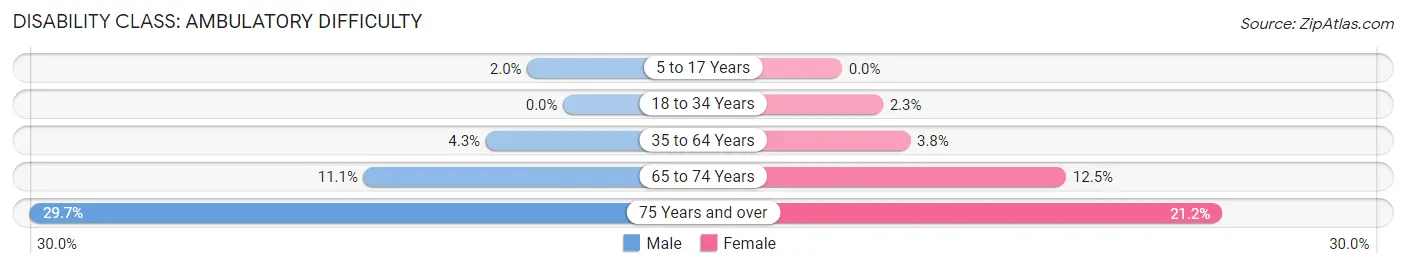
| Age Bracket | Male | Female |
| 5 to 17 Years | 38 (2.0%) | 0 (0.0%) |
| 18 to 34 Years | 0 (0.0%) | 35 (2.3%) |
| 35 to 64 Years | 119 (4.3%) | 103 (3.8%) |
| 65 to 74 Years | 47 (11.1%) | 78 (12.5%) |
| 75 Years and over | 120 (29.7%) | 133 (21.2%) |
Disability Class: Self-Care Difficulty
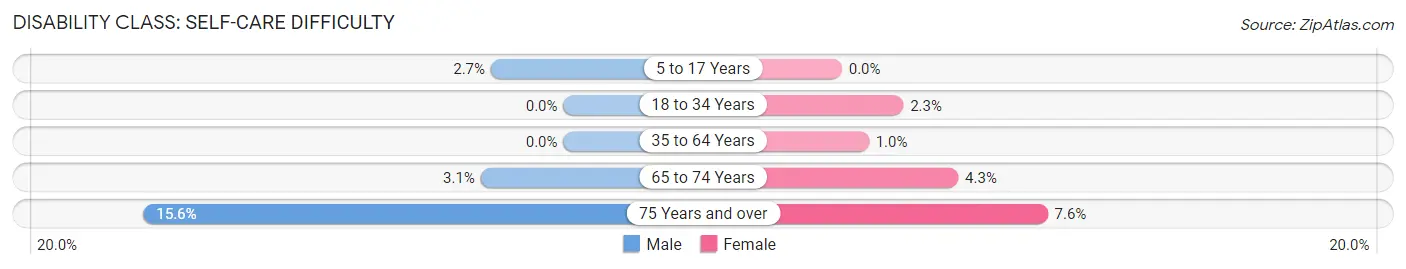
| Age Bracket | Male | Female |
| 5 to 17 Years | 51 (2.7%) | 0 (0.0%) |
| 18 to 34 Years | 0 (0.0%) | 35 (2.3%) |
| 35 to 64 Years | 0 (0.0%) | 27 (1.0%) |
| 65 to 74 Years | 13 (3.1%) | 27 (4.3%) |
| 75 Years and over | 63 (15.6%) | 48 (7.6%) |
Technology Access in Monroe
Computing Device Access in Monroe
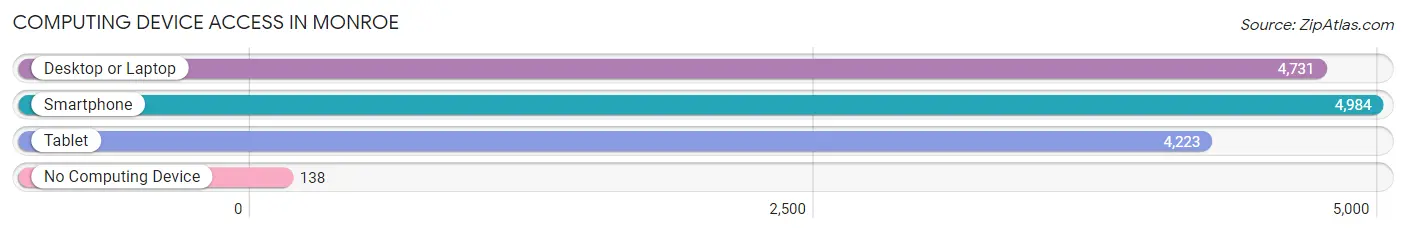
| Device Type | # Households | % Households |
| Desktop or Laptop | 4,731 | 88.7% |
| Smartphone | 4,984 | 93.5% |
| Tablet | 4,223 | 79.2% |
| No Computing Device | 138 | 2.6% |
| Total | 5,333 | 100.0% |
Internet Access in Monroe
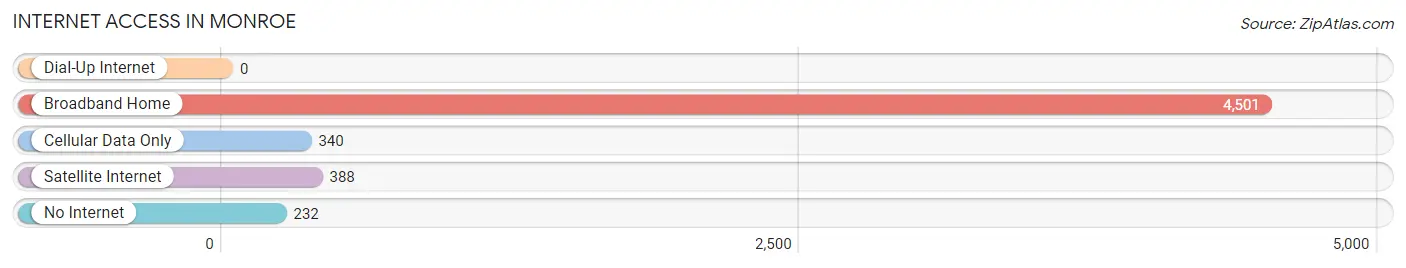
| Internet Type | # Households | % Households |
| Dial-Up Internet | 0 | 0.0% |
| Broadband Home | 4,501 | 84.4% |
| Cellular Data Only | 340 | 6.4% |
| Satellite Internet | 388 | 7.3% |
| No Internet | 232 | 4.3% |
| Total | 5,333 | 100.0% |
Monroe Summary
Monroe, Ohio is a small city located in Butler County, Ohio, United States. It is situated on the Great Miami River, approximately 25 miles north of Cincinnati. The city has a population of approximately 10,000 people and is part of the Cincinnati metropolitan area.
History
Monroe was founded in 1817 by William and Mary Monroe, who were among the first settlers in the area. The city was named after the Monroes, who were originally from Virginia. The city was incorporated in 1845 and has since grown to become a thriving community.
The city has a rich history, with many historic buildings and sites. The Monroe Historical Society was founded in 1887 and is dedicated to preserving the city's history. The society has a museum and library, which are open to the public.
Geography
Monroe is located in Butler County, Ohio, approximately 25 miles north of Cincinnati. The city is situated on the Great Miami River and is surrounded by rolling hills and farmland. The city has a total area of 4.3 square miles, with a population density of 2,400 people per square mile.
Economy
Monroe's economy is largely based on manufacturing and agriculture. The city is home to several large manufacturing companies, including the Monroe Manufacturing Company, which produces automotive parts. The city also has a thriving agricultural sector, with many farms located in the surrounding area.
The city also has a vibrant retail sector, with many shops and restaurants located in the downtown area. The city is also home to several large employers, including the Monroe Community College and the Monroe County Hospital.
Demographics
As of the 2010 census, Monroe had a population of 10,068 people. The racial makeup of the city was 94.3% White, 1.7% African American, 0.3% Native American, 0.7% Asian, 0.1% Pacific Islander, 1.2% from other races, and 1.9% from two or more races. Hispanic or Latino of any race were 3.2% of the population.
Monroe is a diverse city, with a variety of religious and cultural backgrounds. The city is home to a large Catholic population, as well as a variety of Protestant denominations. The city also has a large Jewish population, with several synagogues located in the city.
Monroe is a vibrant and growing city, with a strong economy and a diverse population. The city is home to many historic sites and buildings, as well as a variety of shops and restaurants. The city is also home to several large employers, making it an attractive place to live and work.
Common Questions
What is Per Capita Income in Monroe?
Per Capita income in Monroe is $38,178.
What is the Median Family Income in Monroe?
Median Family Income in Monroe is $106,481.
What is the Median Household income in Monroe?
Median Household Income in Monroe is $100,100.
What is Income or Wage Gap in Monroe?
Income or Wage Gap in Monroe is 39.4%.
Women in Monroe earn 60.6 cents for every dollar earned by a man.
What is Inequality or Gini Index in Monroe?
Inequality or Gini Index in Monroe is 0.30.
What is the Total Population of Monroe?
Total Population of Monroe is 15,202.
What is the Total Male Population of Monroe?
Total Male Population of Monroe is 7,532.
What is the Total Female Population of Monroe?
Total Female Population of Monroe is 7,670.
What is the Ratio of Males per 100 Females in Monroe?
There are 98.20 Males per 100 Females in Monroe.
What is the Ratio of Females per 100 Males in Monroe?
There are 101.83 Females per 100 Males in Monroe.
What is the Median Population Age in Monroe?
Median Population Age in Monroe is 36.0 Years.
What is the Average Family Size in Monroe
Average Family Size in Monroe is 3.1 People.
What is the Average Household Size in Monroe
Average Household Size in Monroe is 2.8 People.
How Large is the Labor Force in Monroe?
There are 8,282 People in the Labor Forcein in Monroe.
What is the Percentage of People in the Labor Force in Monroe?
72.3% of People are in the Labor Force in Monroe.
What is the Unemployment Rate in Monroe?
Unemployment Rate in Monroe is 2.3%.