Hiram, OH Map & Demographics
Hiram Map
Hiram Overview
$24,178
PER CAPITA INCOME
$95,625
AVG FAMILY INCOME
$90,772
AVG HOUSEHOLD INCOME
13.5%
WAGE / INCOME GAP [ % ]
86.5¢/ $1
WAGE / INCOME GAP [ $ ]
0.44
INEQUALITY / GINI INDEX
1,264
TOTAL POPULATION
557
MALE POPULATION
707
FEMALE POPULATION
78.78
MALES / 100 FEMALES
126.93
FEMALES / 100 MALES
20.7
MEDIAN AGE
3.5
AVG FAMILY SIZE
2.8
AVG HOUSEHOLD SIZE
645
LABOR FORCE [ PEOPLE ]
56.1%
PERCENT IN LABOR FORCE
8.1%
UNEMPLOYMENT RATE
Hiram Zip Codes
Income in Hiram
Income Overview in Hiram
Per Capita Income in Hiram is $24,178, while median incomes of families and households are $95,625 and $90,772 respectively.
| Characteristic | Number | Measure |
| Per Capita Income | 1,264 | $24,178 |
| Median Family Income | 139 | $95,625 |
| Mean Family Income | 139 | $138,229 |
| Median Household Income | 213 | $90,772 |
| Mean Household Income | 213 | $110,688 |
| Income Deficit | 139 | $0 |
| Wage / Income Gap (%) | 1,264 | 13.54% |
| Wage / Income Gap ($) | 1,264 | 86.46¢ per $1 |
| Gini / Inequality Index | 1,264 | 0.44 |
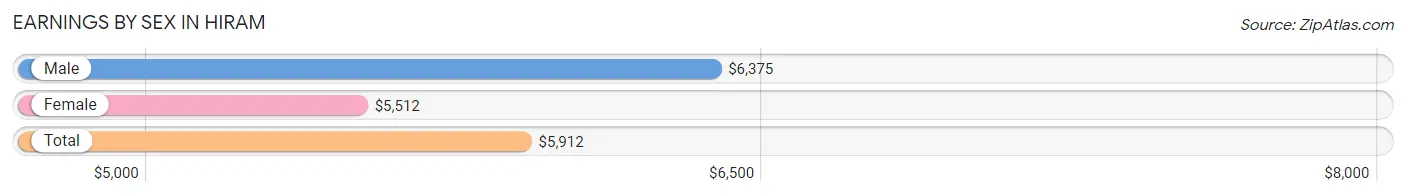
Earnings by Sex in Hiram
Average Earnings in Hiram are $5,912, $6,375 for men and $5,512 for women, a difference of 13.5%.
| Sex | Number | Average Earnings |
| Male | 431 (45.7%) | $6,375 |
| Female | 512 (54.3%) | $5,512 |
| Total | 943 (100.0%) | $5,912 |
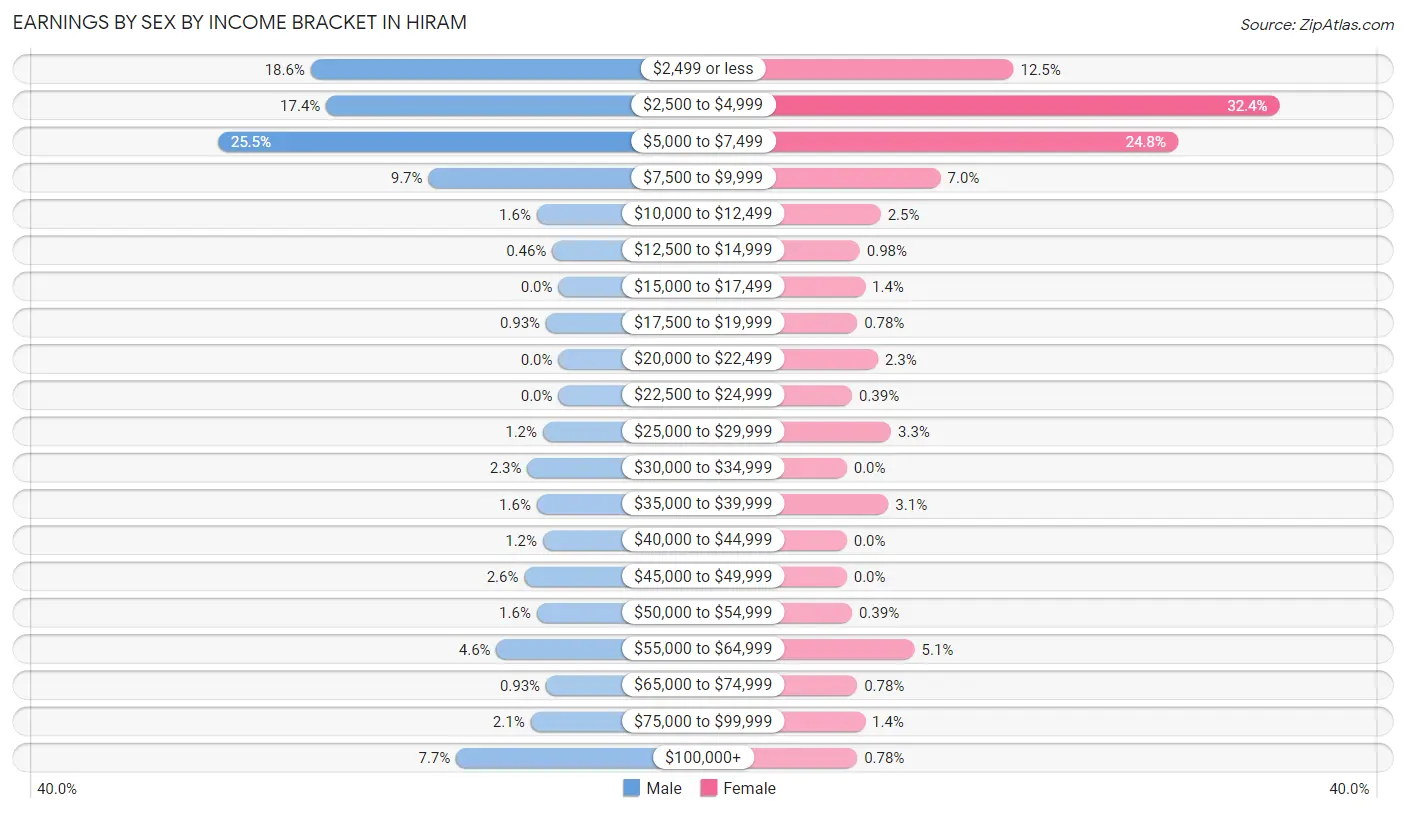
Earnings by Sex by Income Bracket in Hiram
The most common earnings brackets in Hiram are $5,000 to $7,499 for men (110 | 25.5%) and $2,500 to $4,999 for women (166 | 32.4%).
| Income | Male | Female |
| $2,499 or less | 80 (18.6%) | 64 (12.5%) |
| $2,500 to $4,999 | 75 (17.4%) | 166 (32.4%) |
| $5,000 to $7,499 | 110 (25.5%) | 127 (24.8%) |
| $7,500 to $9,999 | 42 (9.7%) | 36 (7.0%) |
| $10,000 to $12,499 | 7 (1.6%) | 13 (2.5%) |
| $12,500 to $14,999 | 2 (0.5%) | 5 (1.0%) |
| $15,000 to $17,499 | 0 (0.0%) | 7 (1.4%) |
| $17,500 to $19,999 | 4 (0.9%) | 4 (0.8%) |
| $20,000 to $22,499 | 0 (0.0%) | 12 (2.3%) |
| $22,500 to $24,999 | 0 (0.0%) | 2 (0.4%) |
| $25,000 to $29,999 | 5 (1.2%) | 17 (3.3%) |
| $30,000 to $34,999 | 10 (2.3%) | 0 (0.0%) |
| $35,000 to $39,999 | 7 (1.6%) | 16 (3.1%) |
| $40,000 to $44,999 | 5 (1.2%) | 0 (0.0%) |
| $45,000 to $49,999 | 11 (2.5%) | 0 (0.0%) |
| $50,000 to $54,999 | 7 (1.6%) | 2 (0.4%) |
| $55,000 to $64,999 | 20 (4.6%) | 26 (5.1%) |
| $65,000 to $74,999 | 4 (0.9%) | 4 (0.8%) |
| $75,000 to $99,999 | 9 (2.1%) | 7 (1.4%) |
| $100,000+ | 33 (7.7%) | 4 (0.8%) |
| Total | 431 (100.0%) | 512 (100.0%) |
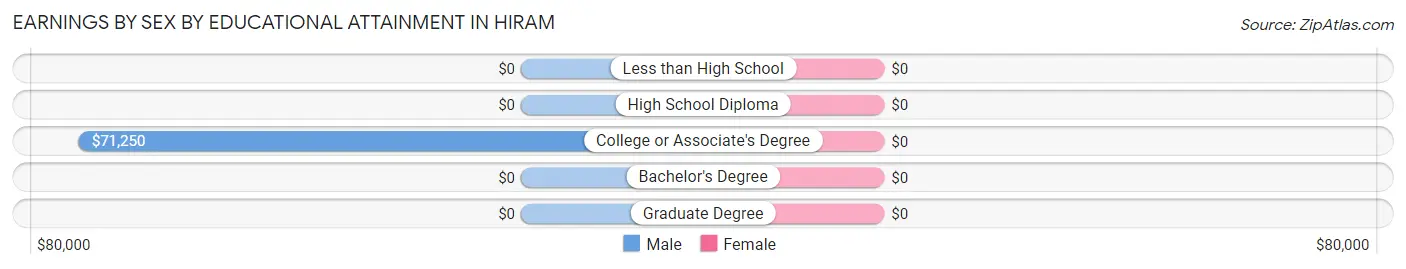
Earnings by Sex by Educational Attainment in Hiram
| Educational Attainment | Male Income | Female Income |
| Less than High School | - | - |
| High School Diploma | - | - |
| College or Associate's Degree | $71,250 | $0 |
| Bachelor's Degree | - | - |
| Graduate Degree | - | - |
| Total | $39,821 | $26,250 |
Family Income in Hiram
Family Income Brackets in Hiram
According to the Hiram family income data, there are 54 families falling into the $75,000 to $99,999 income range, which is the most common income bracket and makes up 38.9% of all families.
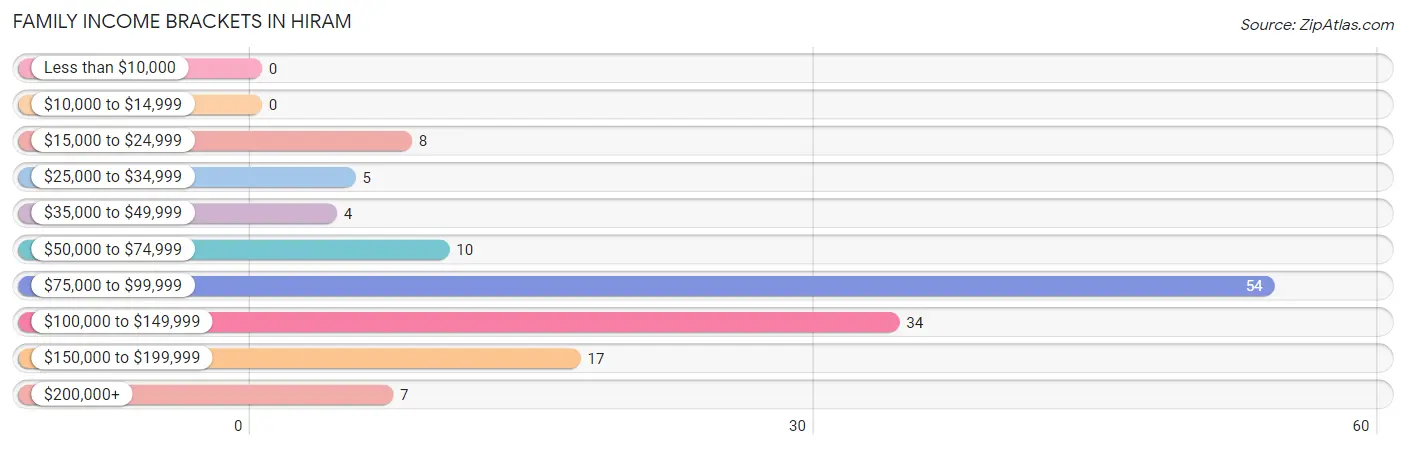
| Income Bracket | # Families | % Families |
| Less than $10,000 | 0 | 0.0% |
| $10,000 to $14,999 | 0 | 0.0% |
| $15,000 to $24,999 | 8 | 5.8% |
| $25,000 to $34,999 | 5 | 3.6% |
| $35,000 to $49,999 | 4 | 2.9% |
| $50,000 to $74,999 | 10 | 7.2% |
| $75,000 to $99,999 | 54 | 38.8% |
| $100,000 to $149,999 | 34 | 24.5% |
| $150,000 to $199,999 | 17 | 12.2% |
| $200,000+ | 7 | 5.0% |
Family Income by Famaliy Size in Hiram
3-person families (35 | 25.2%) account for the highest median family income in Hiram with $153,125 per family, while 3-person families (35 | 25.2%) have the highest median income of $51,042 per family member.
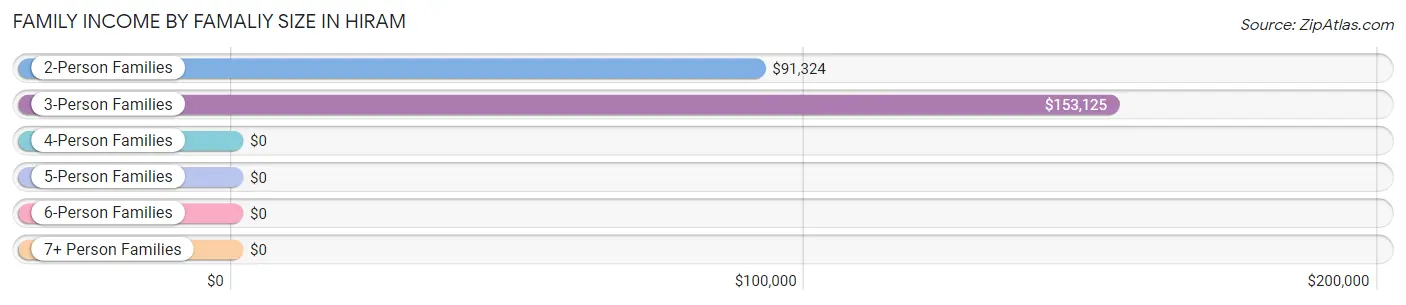
| Income Bracket | # Families | Median Income |
| 2-Person Families | 78 (56.1%) | $91,324 |
| 3-Person Families | 35 (25.2%) | $153,125 |
| 4-Person Families | 7 (5.0%) | $0 |
| 5-Person Families | 3 (2.2%) | $0 |
| 6-Person Families | 0 (0.0%) | $0 |
| 7+ Person Families | 16 (11.5%) | $0 |
| Total | 139 (100.0%) | $95,625 |
Family Income by Number of Earners in Hiram
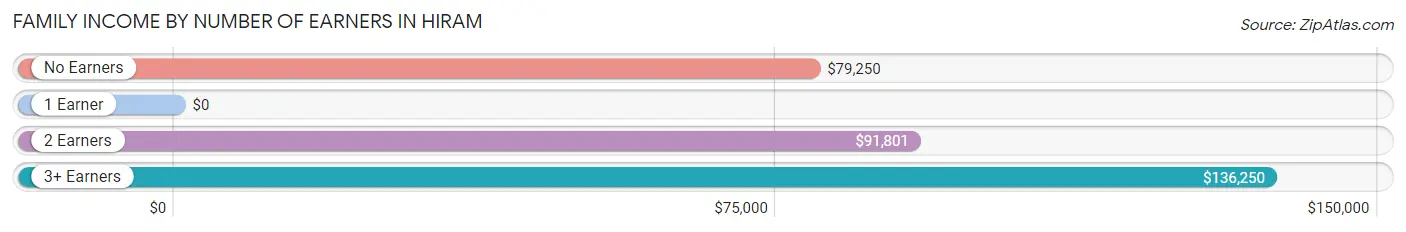
| Number of Earners | # Families | Median Income |
| No Earners | 9 (6.5%) | $79,250 |
| 1 Earner | 31 (22.3%) | $0 |
| 2 Earners | 67 (48.2%) | $91,801 |
| 3+ Earners | 32 (23.0%) | $136,250 |
| Total | 139 (100.0%) | $95,625 |
Household Income in Hiram
Household Income Brackets in Hiram
With 63 households falling in the category, the $75,000 to $99,999 income range is the most frequent in Hiram, accounting for 29.6% of all households. In contrast, only 4 households (1.9%) fall into the $10,000 to $14,999 income bracket, making it the least populous group.
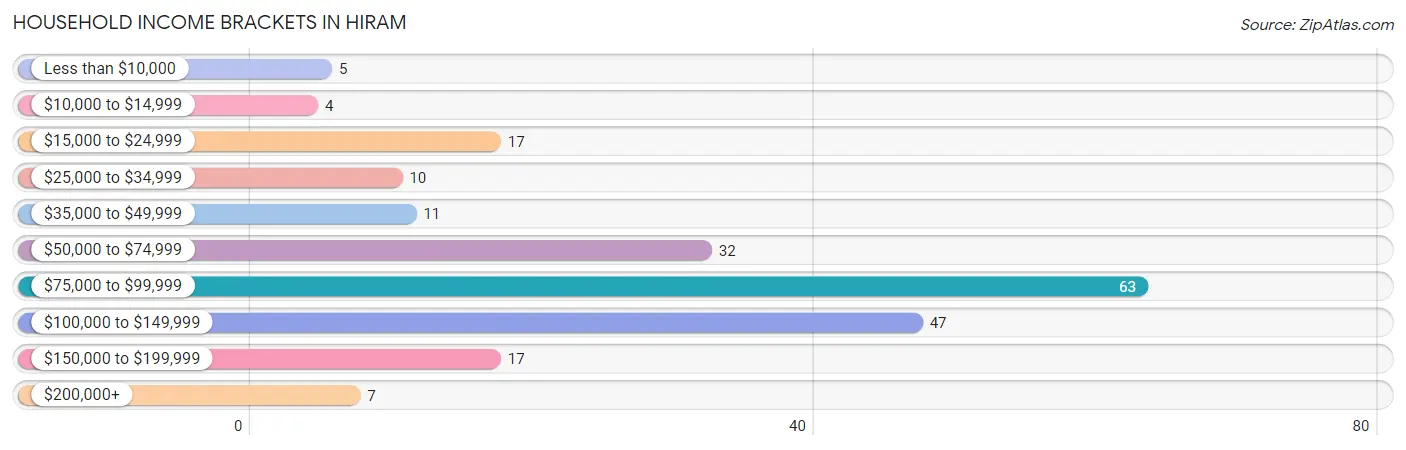
| Income Bracket | # Households | % Households |
| Less than $10,000 | 5 | 2.3% |
| $10,000 to $14,999 | 4 | 1.9% |
| $15,000 to $24,999 | 17 | 8.0% |
| $25,000 to $34,999 | 10 | 4.7% |
| $35,000 to $49,999 | 11 | 5.2% |
| $50,000 to $74,999 | 32 | 15.0% |
| $75,000 to $99,999 | 63 | 29.6% |
| $100,000 to $149,999 | 47 | 22.1% |
| $150,000 to $199,999 | 17 | 8.0% |
| $200,000+ | 7 | 3.3% |
Household Income by Householder Age in Hiram
The median household income in Hiram is $90,772, with the highest median household income of $123,750 found in the 25 to 44 years age bracket for the primary householder. A total of 62 households (29.1%) fall into this category.
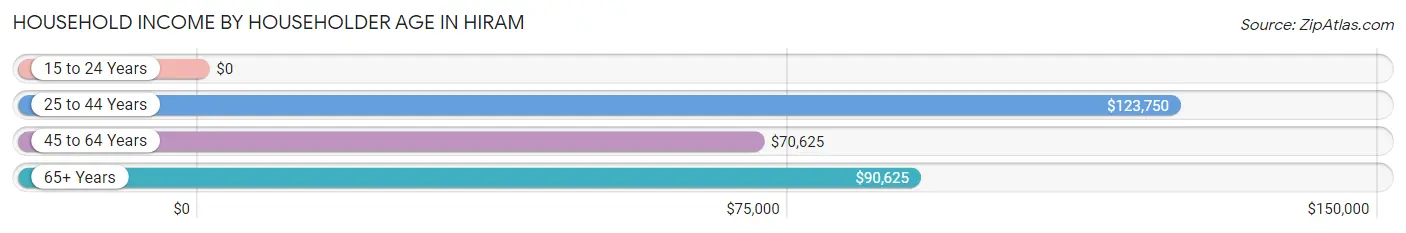
| Income Bracket | # Households | Median Income |
| 15 to 24 Years | 0 (0.0%) | $0 |
| 25 to 44 Years | 62 (29.1%) | $123,750 |
| 45 to 64 Years | 64 (30.0%) | $70,625 |
| 65+ Years | 87 (40.8%) | $90,625 |
| Total | 213 (100.0%) | $90,772 |
Poverty in Hiram
Income Below Poverty by Sex and Age in Hiram
With 13.0% poverty level for males and 2.5% for females among the residents of Hiram, 25 to 34 year old males and 25 to 34 year old females are the most vulnerable to poverty, with 22 males (45.8%) and 4 females (22.2%) in their respective age groups living below the poverty level.
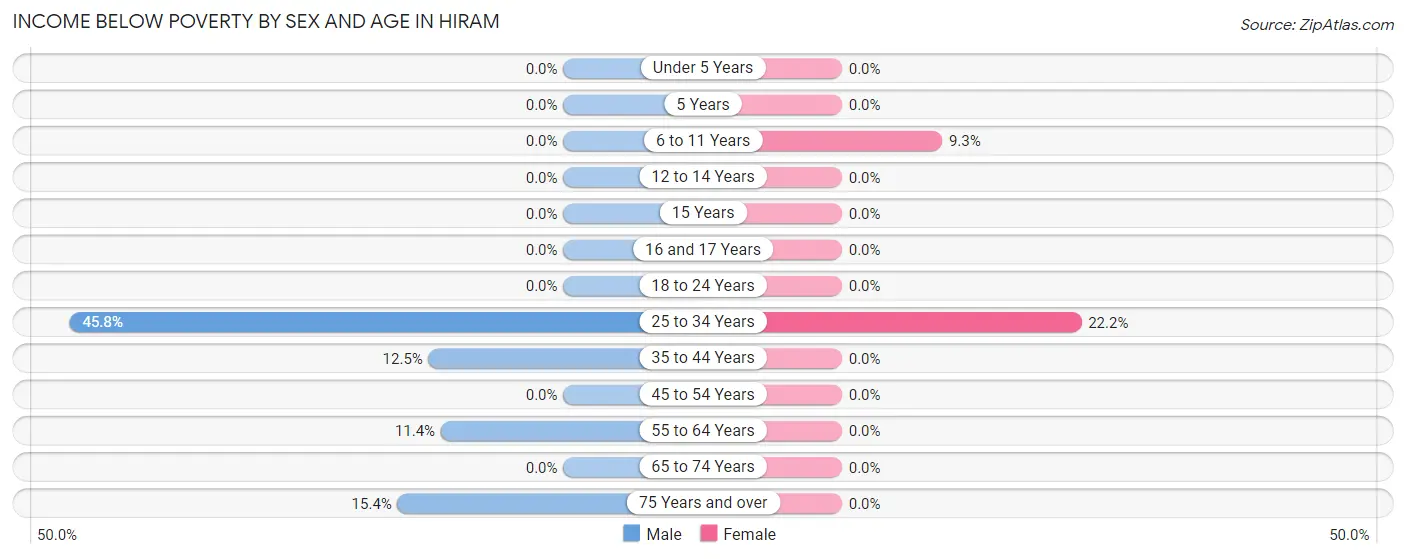
| Age Bracket | Male | Female |
| Under 5 Years | 0 (0.0%) | 0 (0.0%) |
| 5 Years | 0 (0.0%) | 0 (0.0%) |
| 6 to 11 Years | 0 (0.0%) | 4 (9.3%) |
| 12 to 14 Years | 0 (0.0%) | 0 (0.0%) |
| 15 Years | 0 (0.0%) | 0 (0.0%) |
| 16 and 17 Years | 0 (0.0%) | 0 (0.0%) |
| 18 to 24 Years | 0 (0.0%) | 0 (0.0%) |
| 25 to 34 Years | 22 (45.8%) | 4 (22.2%) |
| 35 to 44 Years | 6 (12.5%) | 0 (0.0%) |
| 45 to 54 Years | 0 (0.0%) | 0 (0.0%) |
| 55 to 64 Years | 5 (11.4%) | 0 (0.0%) |
| 65 to 74 Years | 0 (0.0%) | 0 (0.0%) |
| 75 Years and over | 4 (15.4%) | 0 (0.0%) |
| Total | 37 (13.0%) | 8 (2.5%) |
Income Above Poverty by Sex and Age in Hiram
According to the poverty statistics in Hiram, males aged under 5 years and females aged under 5 years are the age groups that are most secure financially, with 100.0% of males and 100.0% of females in these age groups living above the poverty line.
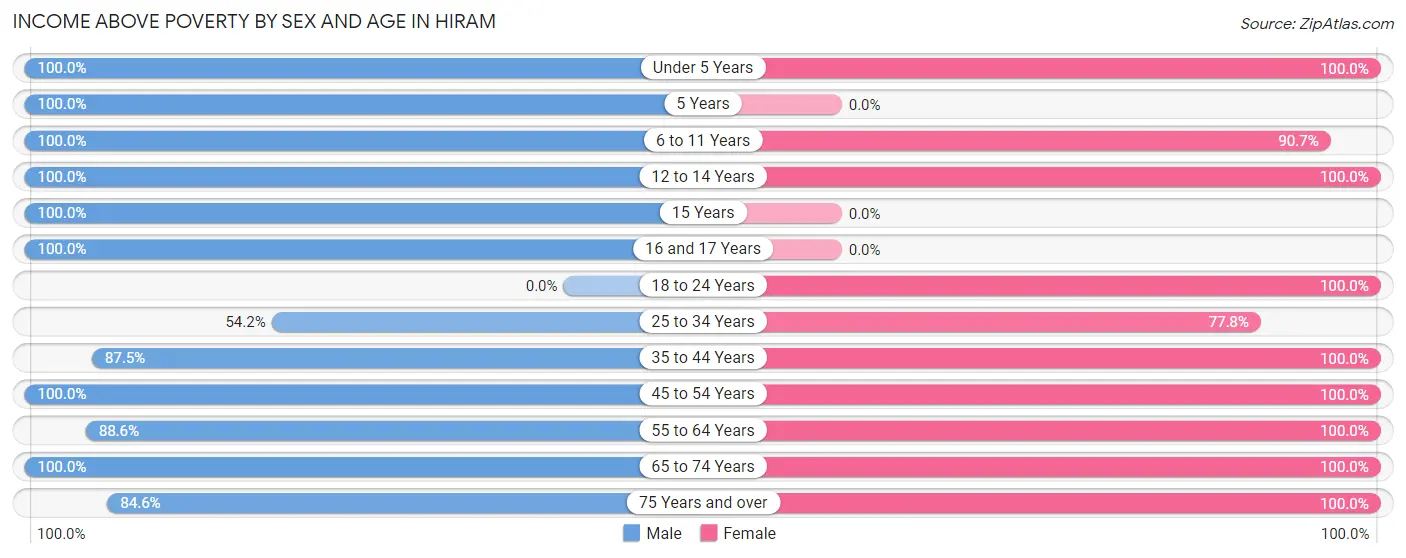
| Age Bracket | Male | Female |
| Under 5 Years | 8 (100.0%) | 14 (100.0%) |
| 5 Years | 4 (100.0%) | 0 (0.0%) |
| 6 to 11 Years | 8 (100.0%) | 39 (90.7%) |
| 12 to 14 Years | 8 (100.0%) | 15 (100.0%) |
| 15 Years | 15 (100.0%) | 0 (0.0%) |
| 16 and 17 Years | 17 (100.0%) | 0 (0.0%) |
| 18 to 24 Years | 0 (0.0%) | 49 (100.0%) |
| 25 to 34 Years | 26 (54.2%) | 14 (77.8%) |
| 35 to 44 Years | 42 (87.5%) | 29 (100.0%) |
| 45 to 54 Years | 22 (100.0%) | 40 (100.0%) |
| 55 to 64 Years | 39 (88.6%) | 28 (100.0%) |
| 65 to 74 Years | 36 (100.0%) | 43 (100.0%) |
| 75 Years and over | 22 (84.6%) | 38 (100.0%) |
| Total | 247 (87.0%) | 309 (97.5%) |
Income Below Poverty Among Married-Couple Families in Hiram
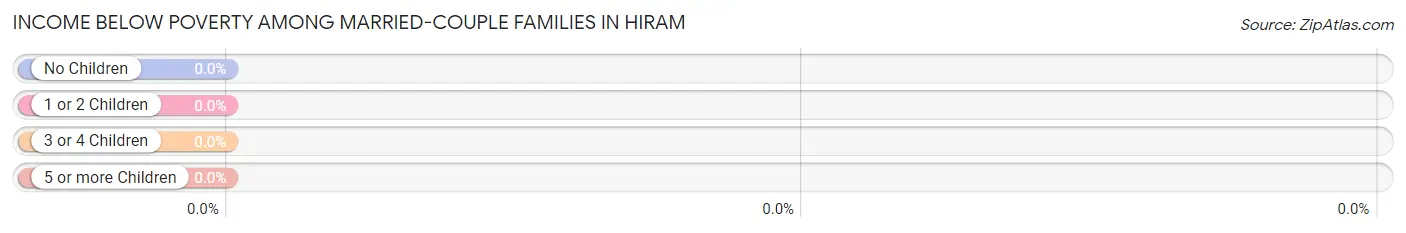
| Children | Above Poverty | Below Poverty |
| No Children | 91 (100.0%) | 0 (0.0%) |
| 1 or 2 Children | 4 (100.0%) | 0 (0.0%) |
| 3 or 4 Children | 3 (100.0%) | 0 (0.0%) |
| 5 or more Children | 16 (100.0%) | 0 (0.0%) |
| Total | 114 (100.0%) | 0 (0.0%) |
Income Below Poverty Among Single-Parent Households in Hiram
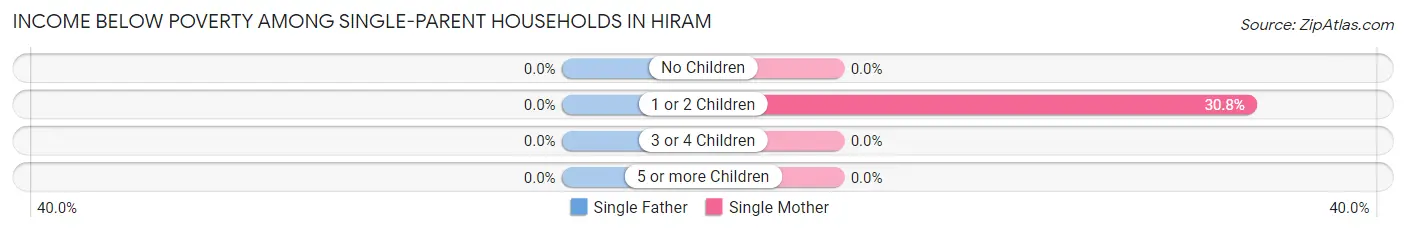
| Children | Single Father | Single Mother |
| No Children | 0 (0.0%) | 0 (0.0%) |
| 1 or 2 Children | 0 (0.0%) | 4 (30.8%) |
| 3 or 4 Children | 0 (0.0%) | 0 (0.0%) |
| 5 or more Children | 0 (0.0%) | 0 (0.0%) |
| Total | 0 (0.0%) | 4 (21.0%) |
Income Below Poverty Among Married-Couple vs Single-Parent Households in Hiram
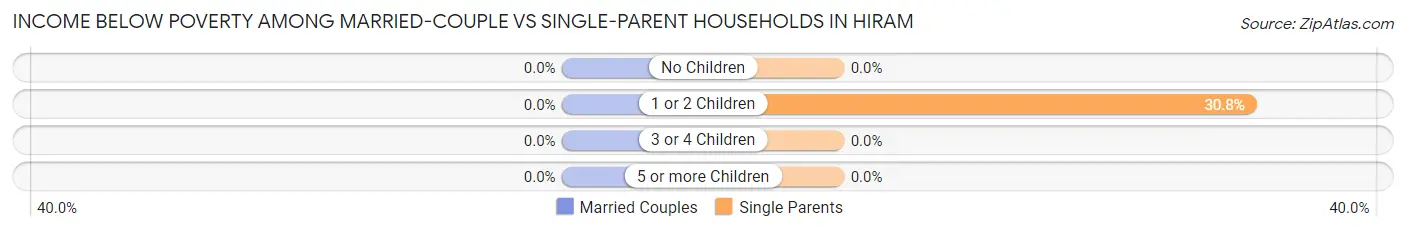
| Children | Married-Couple Families | Single-Parent Households |
| No Children | 0 (0.0%) | 0 (0.0%) |
| 1 or 2 Children | 0 (0.0%) | 4 (30.8%) |
| 3 or 4 Children | 0 (0.0%) | 0 (0.0%) |
| 5 or more Children | 0 (0.0%) | 0 (0.0%) |
| Total | 0 (0.0%) | 4 (16.0%) |
Race in Hiram
The most populous races in Hiram are White / Caucasian (1,042 | 82.4%), Black / African American (163 | 12.9%), and Hispanic or Latino (41 | 3.2%).
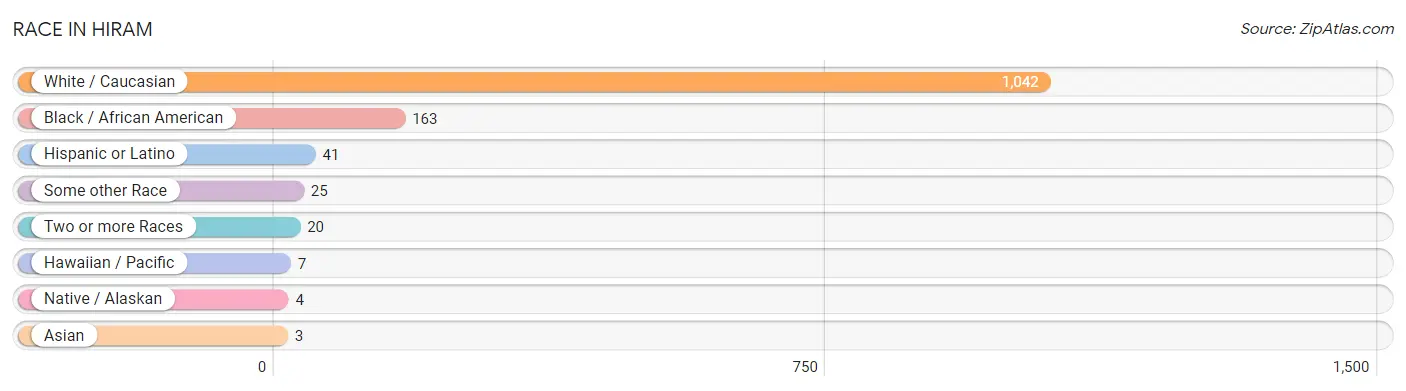
| Race | # Population | % Population |
| Asian | 3 | 0.2% |
| Black / African American | 163 | 12.9% |
| Hawaiian / Pacific | 7 | 0.5% |
| Hispanic or Latino | 41 | 3.2% |
| Native / Alaskan | 4 | 0.3% |
| White / Caucasian | 1,042 | 82.4% |
| Two or more Races | 20 | 1.6% |
| Some other Race | 25 | 2.0% |
| Total | 1,264 | 100.0% |
Ancestry in Hiram
The most populous ancestries reported in Hiram are German (303 | 24.0%), Irish (238 | 18.8%), American (137 | 10.8%), Italian (127 | 10.1%), and English (84 | 6.7%), together accounting for 70.3% of all Hiram residents.
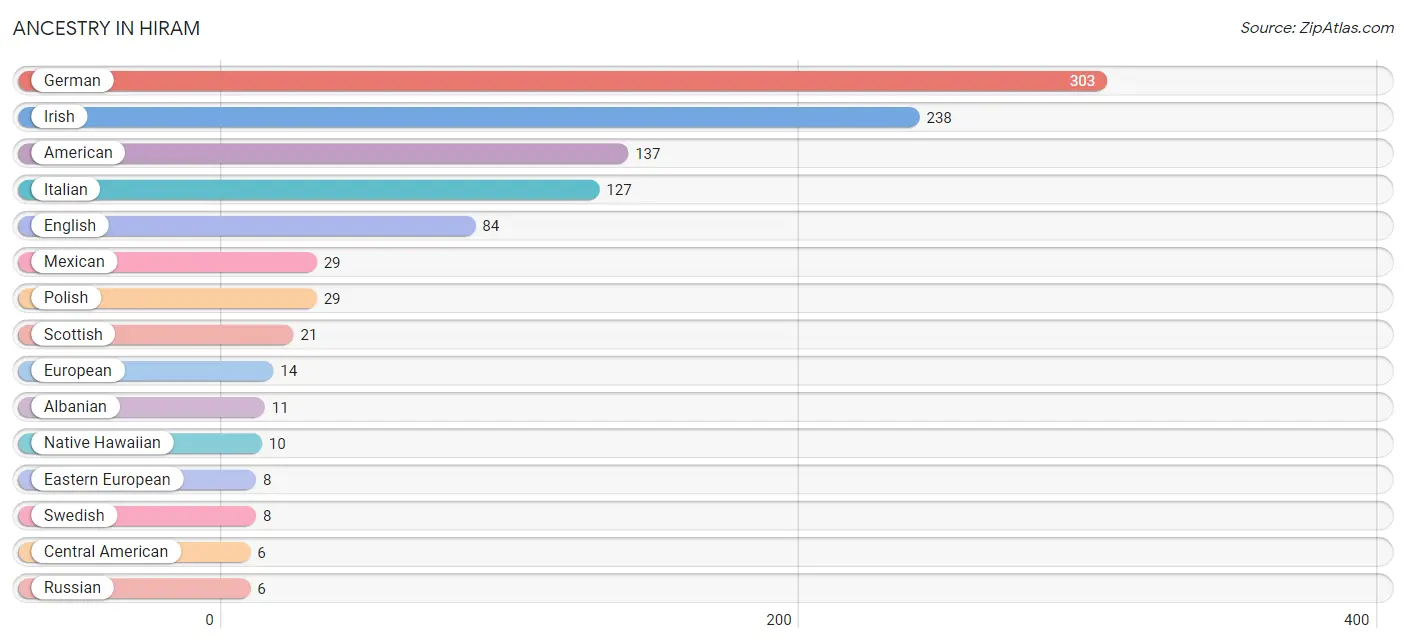
| Ancestry | # Population | % Population |
| Albanian | 11 | 0.9% |
| American | 137 | 10.8% |
| Central American | 6 | 0.5% |
| Cherokee | 4 | 0.3% |
| Costa Rican | 3 | 0.2% |
| Czechoslovakian | 4 | 0.3% |
| Dominican | 2 | 0.2% |
| Eastern European | 8 | 0.6% |
| English | 84 | 6.7% |
| European | 14 | 1.1% |
| Finnish | 2 | 0.2% |
| French Canadian | 3 | 0.2% |
| German | 303 | 24.0% |
| Hungarian | 3 | 0.2% |
| Irish | 238 | 18.8% |
| Italian | 127 | 10.1% |
| Jamaican | 4 | 0.3% |
| Korean | 3 | 0.2% |
| Lithuanian | 4 | 0.3% |
| Mexican | 29 | 2.3% |
| Native Hawaiian | 10 | 0.8% |
| Norwegian | 3 | 0.2% |
| Panamanian | 3 | 0.2% |
| Polish | 29 | 2.3% |
| Russian | 6 | 0.5% |
| Scotch-Irish | 6 | 0.5% |
| Scottish | 21 | 1.7% |
| Slovak | 2 | 0.2% |
| Slovene | 4 | 0.3% |
| Swedish | 8 | 0.6% |
| Ukrainian | 1 | 0.1% |
| Welsh | 5 | 0.4% | View All 32 Rows |
Immigrants in Hiram

| Immigration Origin | # Population | % Population | View All 0 Rows |
Sex and Age in Hiram
Sex and Age in Hiram
The most populous age groups in Hiram are 15 to 19 Years (207 | 37.2%) for men and 15 to 19 Years (234 | 33.1%) for women.
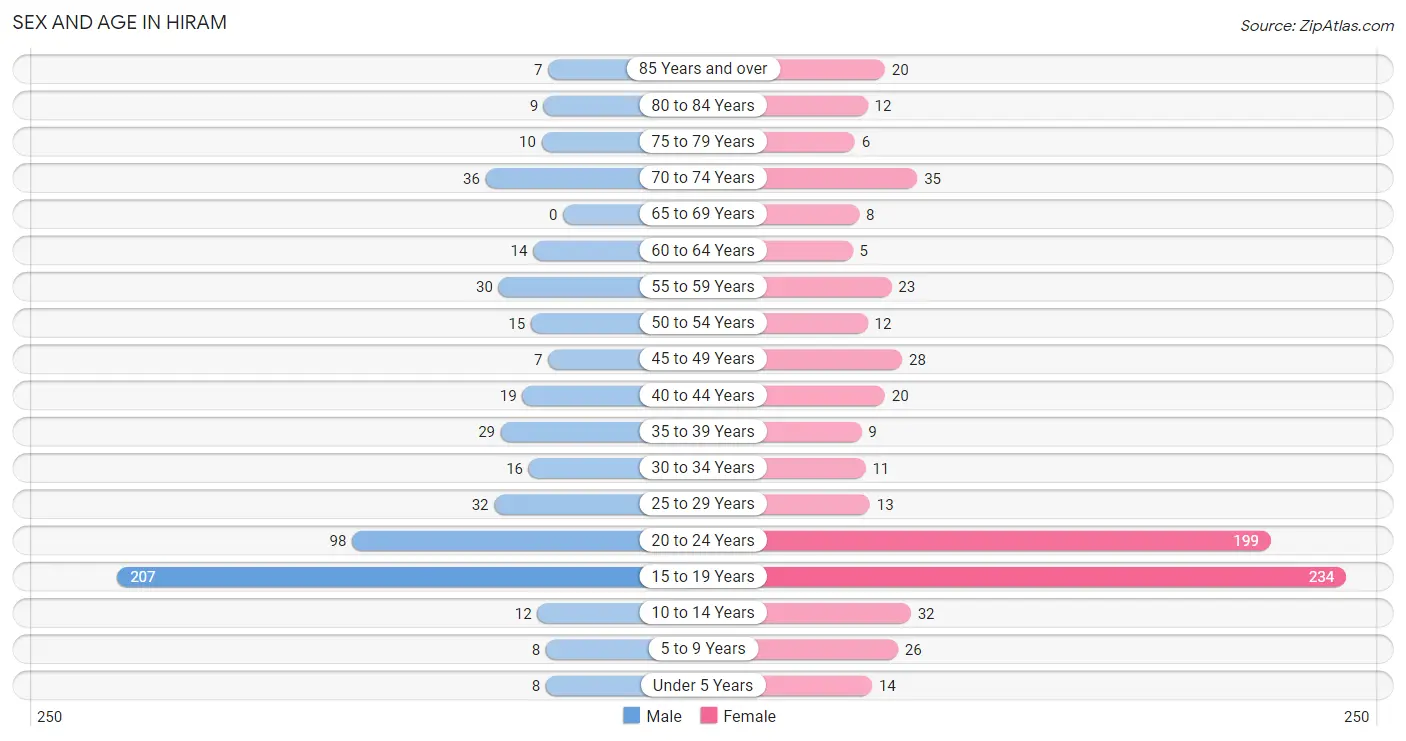
| Age Bracket | Male | Female |
| Under 5 Years | 8 (1.4%) | 14 (2.0%) |
| 5 to 9 Years | 8 (1.4%) | 26 (3.7%) |
| 10 to 14 Years | 12 (2.1%) | 32 (4.5%) |
| 15 to 19 Years | 207 (37.2%) | 234 (33.1%) |
| 20 to 24 Years | 98 (17.6%) | 199 (28.1%) |
| 25 to 29 Years | 32 (5.8%) | 13 (1.8%) |
| 30 to 34 Years | 16 (2.9%) | 11 (1.6%) |
| 35 to 39 Years | 29 (5.2%) | 9 (1.3%) |
| 40 to 44 Years | 19 (3.4%) | 20 (2.8%) |
| 45 to 49 Years | 7 (1.3%) | 28 (4.0%) |
| 50 to 54 Years | 15 (2.7%) | 12 (1.7%) |
| 55 to 59 Years | 30 (5.4%) | 23 (3.3%) |
| 60 to 64 Years | 14 (2.5%) | 5 (0.7%) |
| 65 to 69 Years | 0 (0.0%) | 8 (1.1%) |
| 70 to 74 Years | 36 (6.5%) | 35 (5.0%) |
| 75 to 79 Years | 10 (1.8%) | 6 (0.9%) |
| 80 to 84 Years | 9 (1.6%) | 12 (1.7%) |
| 85 Years and over | 7 (1.3%) | 20 (2.8%) |
| Total | 557 (100.0%) | 707 (100.0%) |
Families and Households in Hiram
Median Family Size in Hiram
The median family size in Hiram is 3.45 persons per family, with single female/mother families (19 | 13.7%) accounting for the largest median family size of 3.79 persons per family. On the other hand, single male/father families (6 | 4.3%) represent the smallest median family size with 2.17 persons per family.
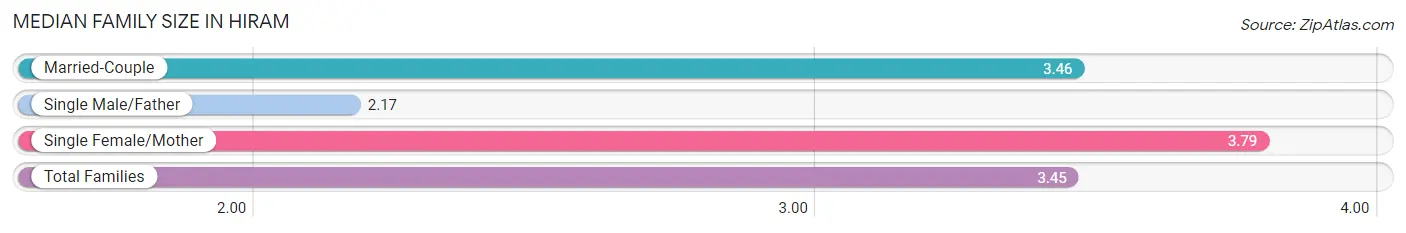
| Family Type | # Families | Family Size |
| Married-Couple | 114 (82.0%) | 3.46 |
| Single Male/Father | 6 (4.3%) | 2.17 |
| Single Female/Mother | 19 (13.7%) | 3.79 |
| Total Families | 139 (100.0%) | 3.45 |
Median Household Size in Hiram
The median household size in Hiram is 2.82 persons per household, with single female/mother households (19 | 8.9%) accounting for the largest median household size of 4.26 persons per household. non-family households (74 | 34.7%) represent the smallest median household size with 1.53 persons per household.
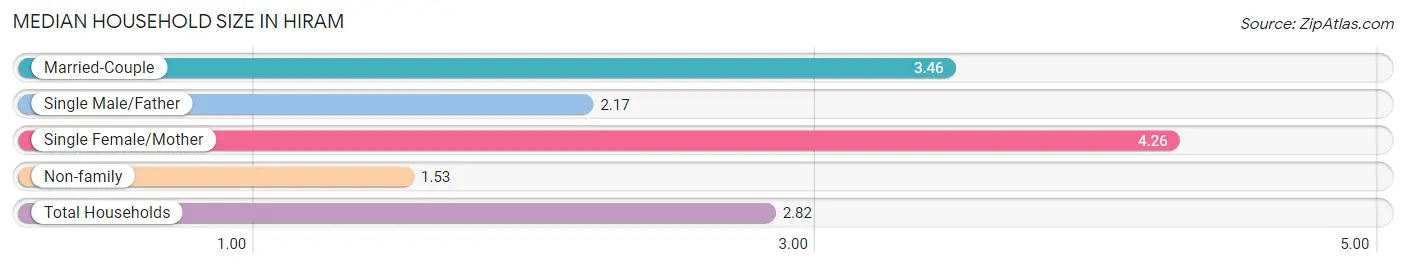
| Household Type | # Households | Household Size |
| Married-Couple | 114 (53.5%) | 3.46 |
| Single Male/Father | 6 (2.8%) | 2.17 |
| Single Female/Mother | 19 (8.9%) | 4.26 |
| Non-family | 74 (34.7%) | 1.53 |
| Total Households | 213 (100.0%) | 2.82 |
Household Size by Marriage Status in Hiram
Out of a total of 213 households in Hiram, 139 (65.3%) are family households, while 74 (34.7%) are nonfamily households. The most numerous type of family households are 2-person households, comprising 74, and the most common type of nonfamily households are 1-person households, comprising 59.
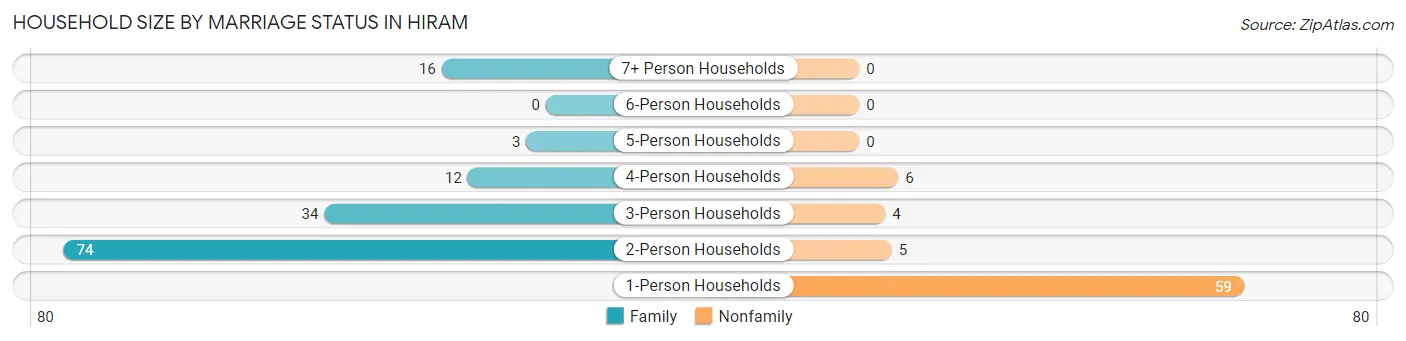
| Household Size | Family Households | Nonfamily Households |
| 1-Person Households | - | 59 (27.7%) |
| 2-Person Households | 74 (34.7%) | 5 (2.4%) |
| 3-Person Households | 34 (16.0%) | 4 (1.9%) |
| 4-Person Households | 12 (5.6%) | 6 (2.8%) |
| 5-Person Households | 3 (1.4%) | 0 (0.0%) |
| 6-Person Households | 0 (0.0%) | 0 (0.0%) |
| 7+ Person Households | 16 (7.5%) | 0 (0.0%) |
| Total | 139 (65.3%) | 74 (34.7%) |
Female Fertility in Hiram
Fertility by Age in Hiram
Average fertility rate in Hiram is 6.0 births per 1,000 women. Women in the age bracket of 20 to 34 years have the highest fertility rate with 13.0 births per 1,000 women. Women in the age bracket of 20 to 34 years acount for 100.0% of all women with births.
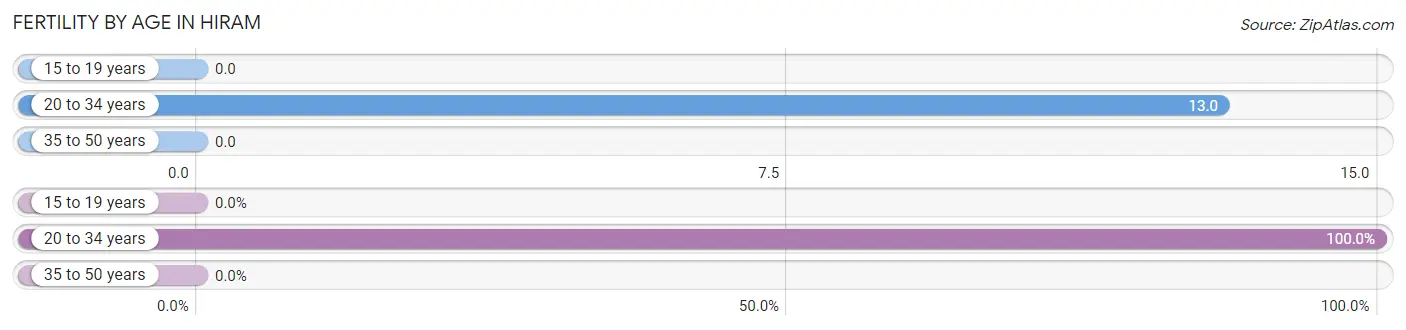
| Age Bracket | Women with Births | Births / 1,000 Women |
| 15 to 19 years | 0 (0.0%) | 0.0 |
| 20 to 34 years | 3 (100.0%) | 13.0 |
| 35 to 50 years | 0 (0.0%) | 0.0 |
| Total | 3 (100.0%) | 6.0 |
Fertility by Age by Marriage Status in Hiram
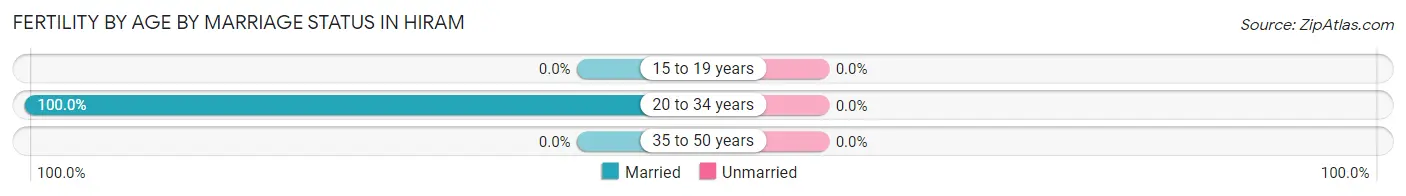
| Age Bracket | Married | Unmarried |
| 15 to 19 years | 0 (0.0%) | 0 (0.0%) |
| 20 to 34 years | 3 (100.0%) | 0 (0.0%) |
| 35 to 50 years | 0 (0.0%) | 0 (0.0%) |
| Total | 3 (100.0%) | 0 (0.0%) |
Fertility by Education in Hiram
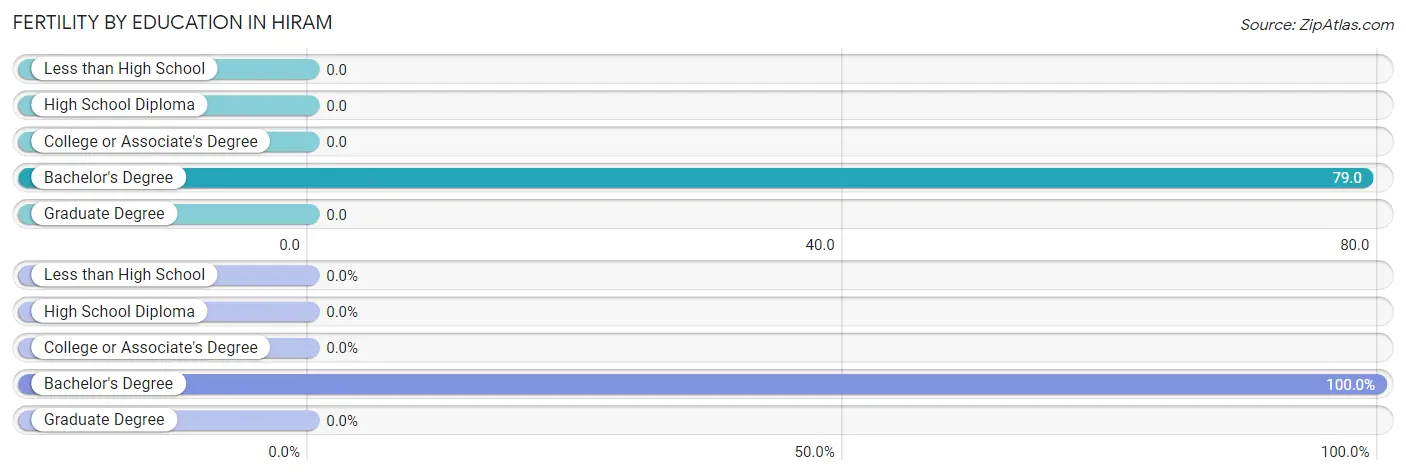
| Educational Attainment | Women with Births | Births / 1,000 Women |
| Less than High School | 0 (0.0%) | 0.0 |
| High School Diploma | 0 (0.0%) | 0.0 |
| College or Associate's Degree | 0 (0.0%) | 0.0 |
| Bachelor's Degree | 3 (100.0%) | 79.0 |
| Graduate Degree | 0 (0.0%) | 0.0 |
| Total | 3 (100.0%) | 6.0 |
Fertility by Education by Marriage Status in Hiram
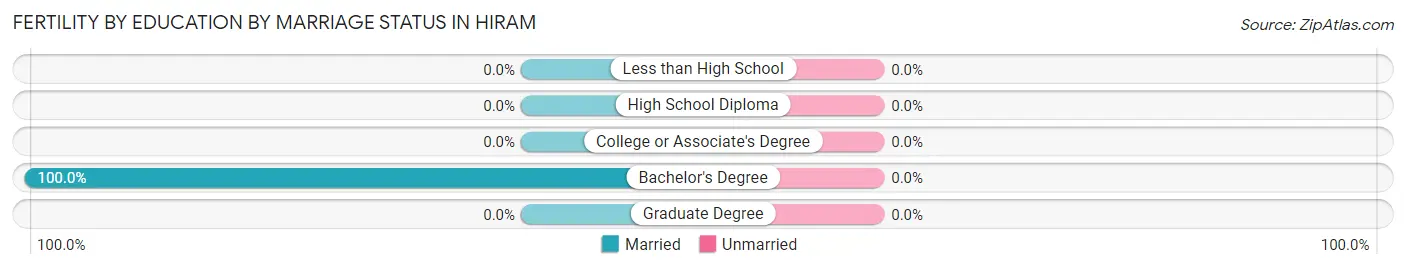
| Educational Attainment | Married | Unmarried |
| Less than High School | 0 (0.0%) | 0 (0.0%) |
| High School Diploma | 0 (0.0%) | 0 (0.0%) |
| College or Associate's Degree | 0 (0.0%) | 0 (0.0%) |
| Bachelor's Degree | 3 (100.0%) | 0 (0.0%) |
| Graduate Degree | 0 (0.0%) | 0 (0.0%) |
| Total | 3 (100.0%) | 0 (0.0%) |
Employment Characteristics in Hiram
Employment by Class of Employer in Hiram
Among the 533 employed individuals in Hiram, private company employees (370 | 69.4%), local government employees (53 | 9.9%), and not-for-profit organizations (47 | 8.8%) make up the most common classes of employment.
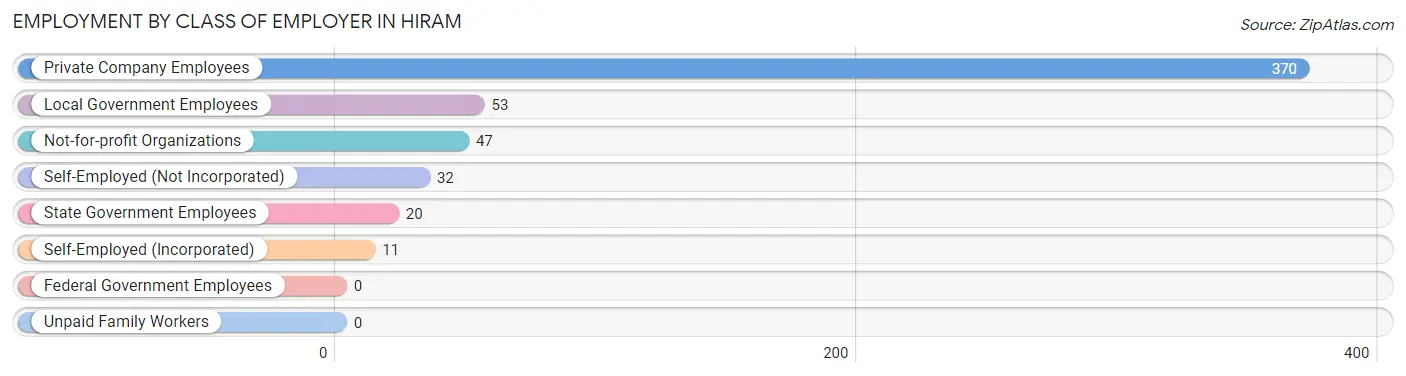
| Employer Class | # Employees | % Employees |
| Private Company Employees | 370 | 69.4% |
| Self-Employed (Incorporated) | 11 | 2.1% |
| Self-Employed (Not Incorporated) | 32 | 6.0% |
| Not-for-profit Organizations | 47 | 8.8% |
| Local Government Employees | 53 | 9.9% |
| State Government Employees | 20 | 3.7% |
| Federal Government Employees | 0 | 0.0% |
| Unpaid Family Workers | 0 | 0.0% |
| Total | 533 | 100.0% |
Employment Status by Age in Hiram
According to the labor force statistics for Hiram, out of the total population over 16 years of age (1,149), 56.1% or 645 individuals are in the labor force, with 8.1% or 52 of them unemployed. The age group with the highest labor force participation rate is 25 to 29 years, with 100.0% or 45 individuals in the labor force. Within the labor force, the 60 to 64 years age range has the highest percentage of unemployed individuals, with 35.7% or 5 of them being unemployed.
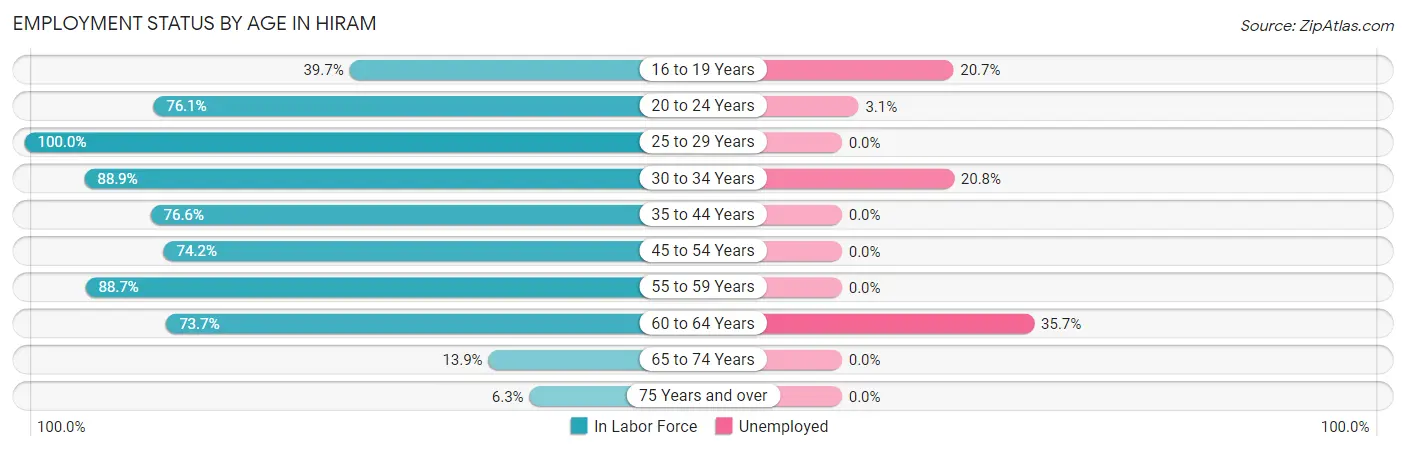
| Age Bracket | In Labor Force | Unemployed |
| 16 to 19 Years | 169 (39.7%) | 35 (20.7%) |
| 20 to 24 Years | 226 (76.1%) | 7 (3.1%) |
| 25 to 29 Years | 45 (100.0%) | 0 (0.0%) |
| 30 to 34 Years | 24 (88.9%) | 5 (20.8%) |
| 35 to 44 Years | 59 (76.6%) | 0 (0.0%) |
| 45 to 54 Years | 46 (74.2%) | 0 (0.0%) |
| 55 to 59 Years | 47 (88.7%) | 0 (0.0%) |
| 60 to 64 Years | 14 (73.7%) | 5 (35.7%) |
| 65 to 74 Years | 11 (13.9%) | 0 (0.0%) |
| 75 Years and over | 4 (6.3%) | 0 (0.0%) |
| Total | 645 (56.1%) | 52 (8.1%) |
Employment Status by Educational Attainment in Hiram
According to labor force statistics for Hiram, 83.0% of individuals (235) out of the total population between 25 and 64 years of age (283) are in the labor force, with 4.3% or 10 of them being unemployed. The group with the highest labor force participation rate are those with the educational attainment of bachelor's degree or higher, with 96.2% or 127 individuals in the labor force. Within the labor force, individuals with high school diploma education have the highest percentage of unemployment, with 17.5% or 10 of them being unemployed.
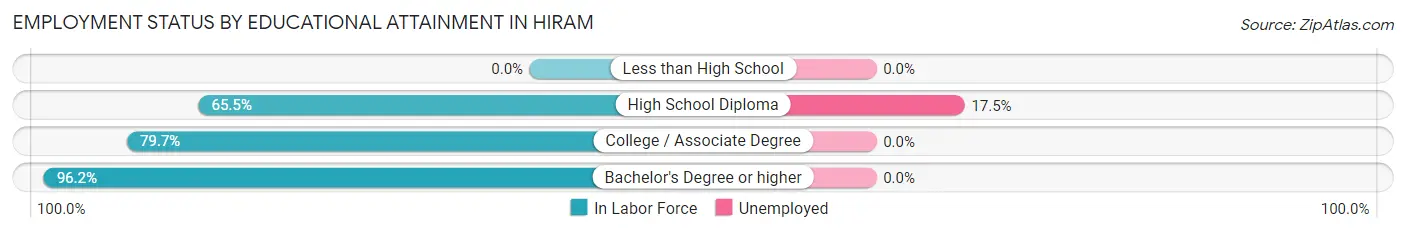
| Educational Attainment | In Labor Force | Unemployed |
| Less than High School | 0 (0.0%) | 0 (0.0%) |
| High School Diploma | 57 (65.5%) | 15 (17.5%) |
| College / Associate Degree | 51 (79.7%) | 0 (0.0%) |
| Bachelor's Degree or higher | 127 (96.2%) | 0 (0.0%) |
| Total | 235 (83.0%) | 12 (4.3%) |
Employment Occupations by Sex in Hiram
Management, Business, Science and Arts Occupations
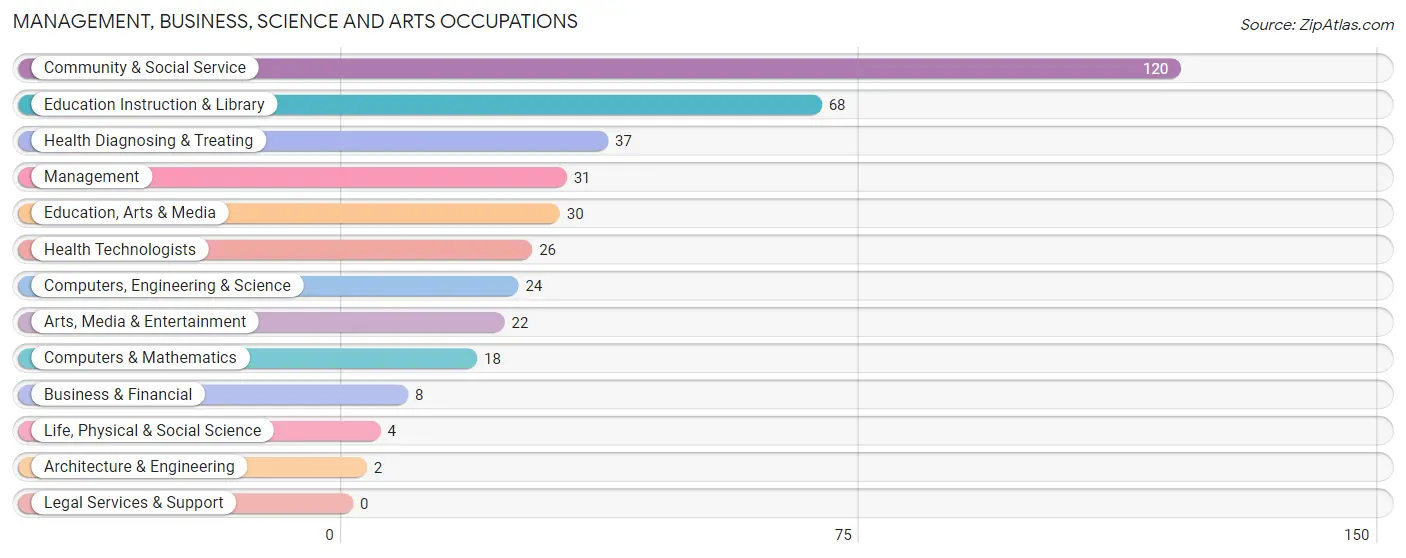
The most common Management, Business, Science and Arts occupations in Hiram are Community & Social Service (120 | 20.2%), Education Instruction & Library (68 | 11.5%), Health Diagnosing & Treating (37 | 6.2%), Management (31 | 5.2%), and Education, Arts & Media (30 | 5.1%).
Management, Business, Science and Arts Occupations by Sex
Within the Management, Business, Science and Arts occupations in Hiram, the most male-oriented occupations are Life, Physical & Social Science (100.0%), Arts, Media & Entertainment (100.0%), and Education Instruction & Library (55.9%), while the most female-oriented occupations are Business & Financial (100.0%), Architecture & Engineering (100.0%), and Education, Arts & Media (96.7%).
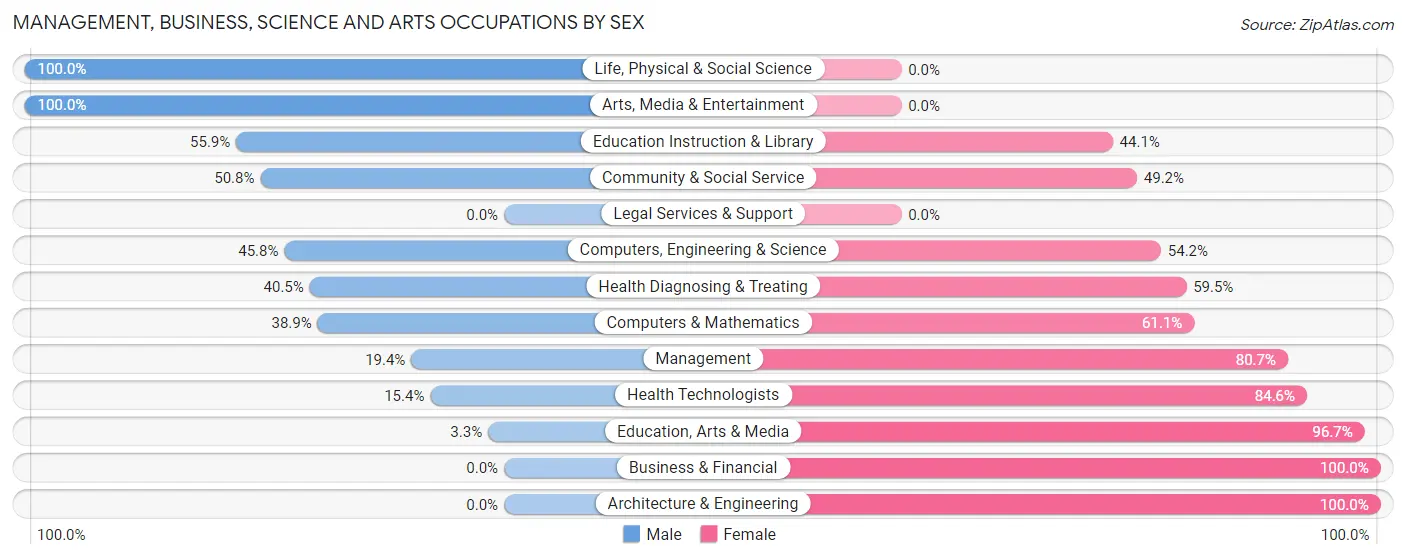
| Occupation | Male | Female |
| Management | 6 (19.4%) | 25 (80.6%) |
| Business & Financial | 0 (0.0%) | 8 (100.0%) |
| Computers, Engineering & Science | 11 (45.8%) | 13 (54.2%) |
| Computers & Mathematics | 7 (38.9%) | 11 (61.1%) |
| Architecture & Engineering | 0 (0.0%) | 2 (100.0%) |
| Life, Physical & Social Science | 4 (100.0%) | 0 (0.0%) |
| Community & Social Service | 61 (50.8%) | 59 (49.2%) |
| Education, Arts & Media | 1 (3.3%) | 29 (96.7%) |
| Legal Services & Support | 0 (0.0%) | 0 (0.0%) |
| Education Instruction & Library | 38 (55.9%) | 30 (44.1%) |
| Arts, Media & Entertainment | 22 (100.0%) | 0 (0.0%) |
| Health Diagnosing & Treating | 15 (40.5%) | 22 (59.5%) |
| Health Technologists | 4 (15.4%) | 22 (84.6%) |
| Total (Category) | 93 (42.3%) | 127 (57.7%) |
| Total (Overall) | 242 (40.8%) | 351 (59.2%) |
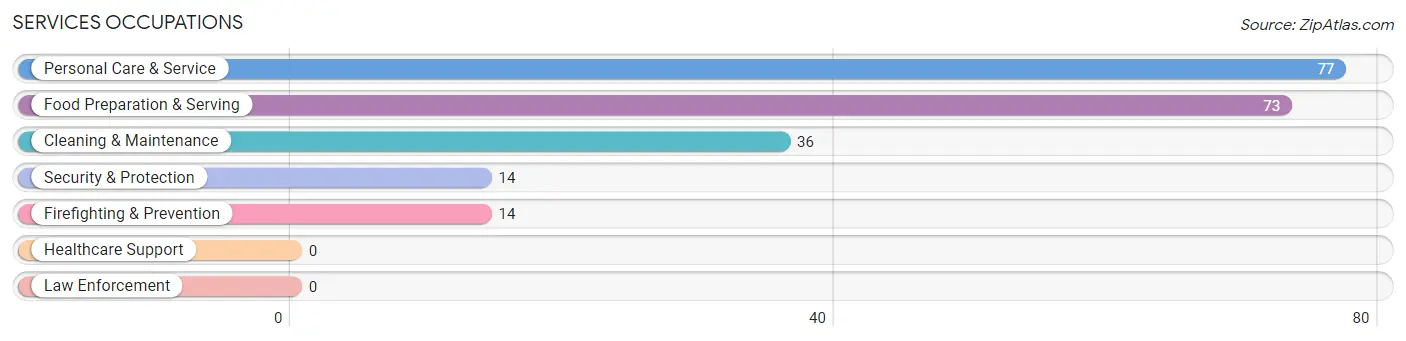
Services Occupations
The most common Services occupations in Hiram are Personal Care & Service (77 | 13.0%), Food Preparation & Serving (73 | 12.3%), Cleaning & Maintenance (36 | 6.1%), Security & Protection (14 | 2.4%), and Firefighting & Prevention (14 | 2.4%).
Services Occupations by Sex
Within the Services occupations in Hiram, the most male-oriented occupations are Cleaning & Maintenance (100.0%), Security & Protection (92.9%), and Firefighting & Prevention (92.9%), while the most female-oriented occupations are Food Preparation & Serving (80.8%), Personal Care & Service (79.2%), and Security & Protection (7.1%).
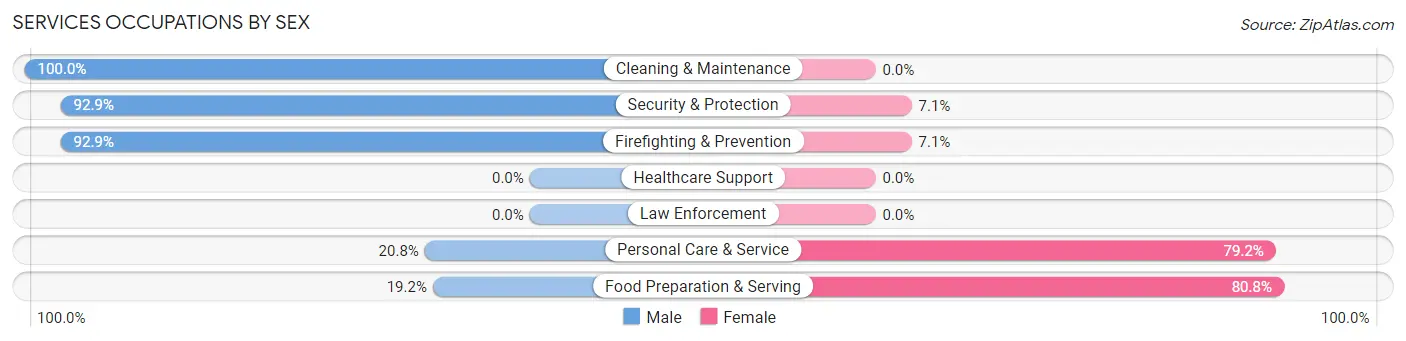
| Occupation | Male | Female |
| Healthcare Support | 0 (0.0%) | 0 (0.0%) |
| Security & Protection | 13 (92.9%) | 1 (7.1%) |
| Firefighting & Prevention | 13 (92.9%) | 1 (7.1%) |
| Law Enforcement | 0 (0.0%) | 0 (0.0%) |
| Food Preparation & Serving | 14 (19.2%) | 59 (80.8%) |
| Cleaning & Maintenance | 36 (100.0%) | 0 (0.0%) |
| Personal Care & Service | 16 (20.8%) | 61 (79.2%) |
| Total (Category) | 79 (39.5%) | 121 (60.5%) |
| Total (Overall) | 242 (40.8%) | 351 (59.2%) |
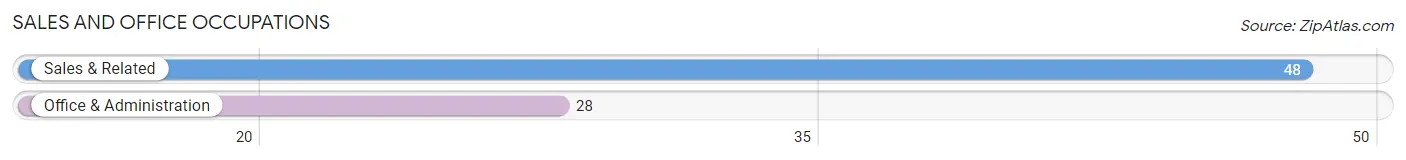
Sales and Office Occupations
The most common Sales and Office occupations in Hiram are Sales & Related (48 | 8.1%), and Office & Administration (28 | 4.7%).
Sales and Office Occupations by Sex
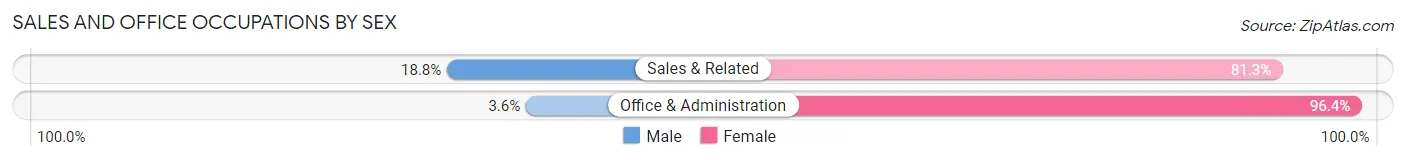
| Occupation | Male | Female |
| Sales & Related | 9 (18.8%) | 39 (81.2%) |
| Office & Administration | 1 (3.6%) | 27 (96.4%) |
| Total (Category) | 10 (13.2%) | 66 (86.8%) |
| Total (Overall) | 242 (40.8%) | 351 (59.2%) |
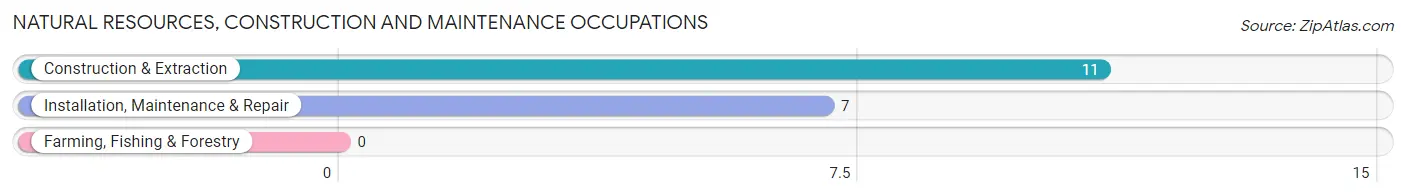
Natural Resources, Construction and Maintenance Occupations
The most common Natural Resources, Construction and Maintenance occupations in Hiram are Construction & Extraction (11 | 1.8%), and Installation, Maintenance & Repair (7 | 1.2%).
Natural Resources, Construction and Maintenance Occupations by Sex
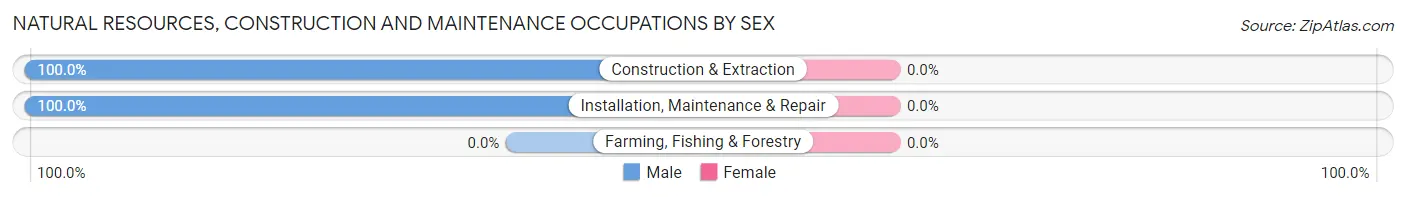
| Occupation | Male | Female |
| Farming, Fishing & Forestry | 0 (0.0%) | 0 (0.0%) |
| Construction & Extraction | 11 (100.0%) | 0 (0.0%) |
| Installation, Maintenance & Repair | 7 (100.0%) | 0 (0.0%) |
| Total (Category) | 18 (100.0%) | 0 (0.0%) |
| Total (Overall) | 242 (40.8%) | 351 (59.2%) |
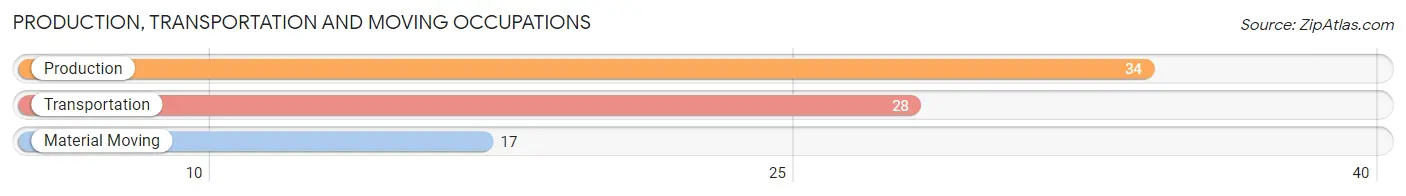
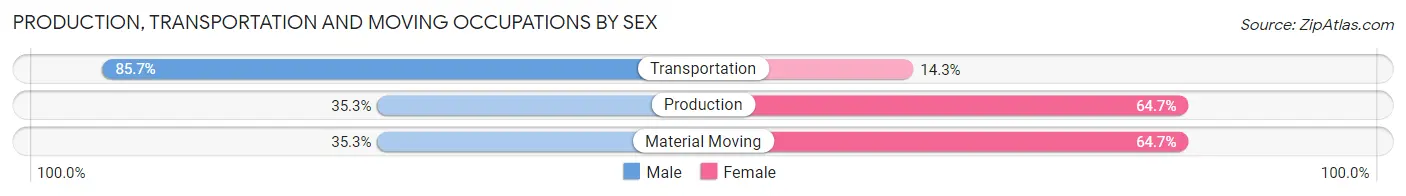
Production, Transportation and Moving Occupations
The most common Production, Transportation and Moving occupations in Hiram are Production (34 | 5.7%), Transportation (28 | 4.7%), and Material Moving (17 | 2.9%).
Production, Transportation and Moving Occupations by Sex
| Occupation | Male | Female |
| Production | 12 (35.3%) | 22 (64.7%) |
| Transportation | 24 (85.7%) | 4 (14.3%) |
| Material Moving | 6 (35.3%) | 11 (64.7%) |
| Total (Category) | 42 (53.2%) | 37 (46.8%) |
| Total (Overall) | 242 (40.8%) | 351 (59.2%) |
Employment Industries by Sex in Hiram
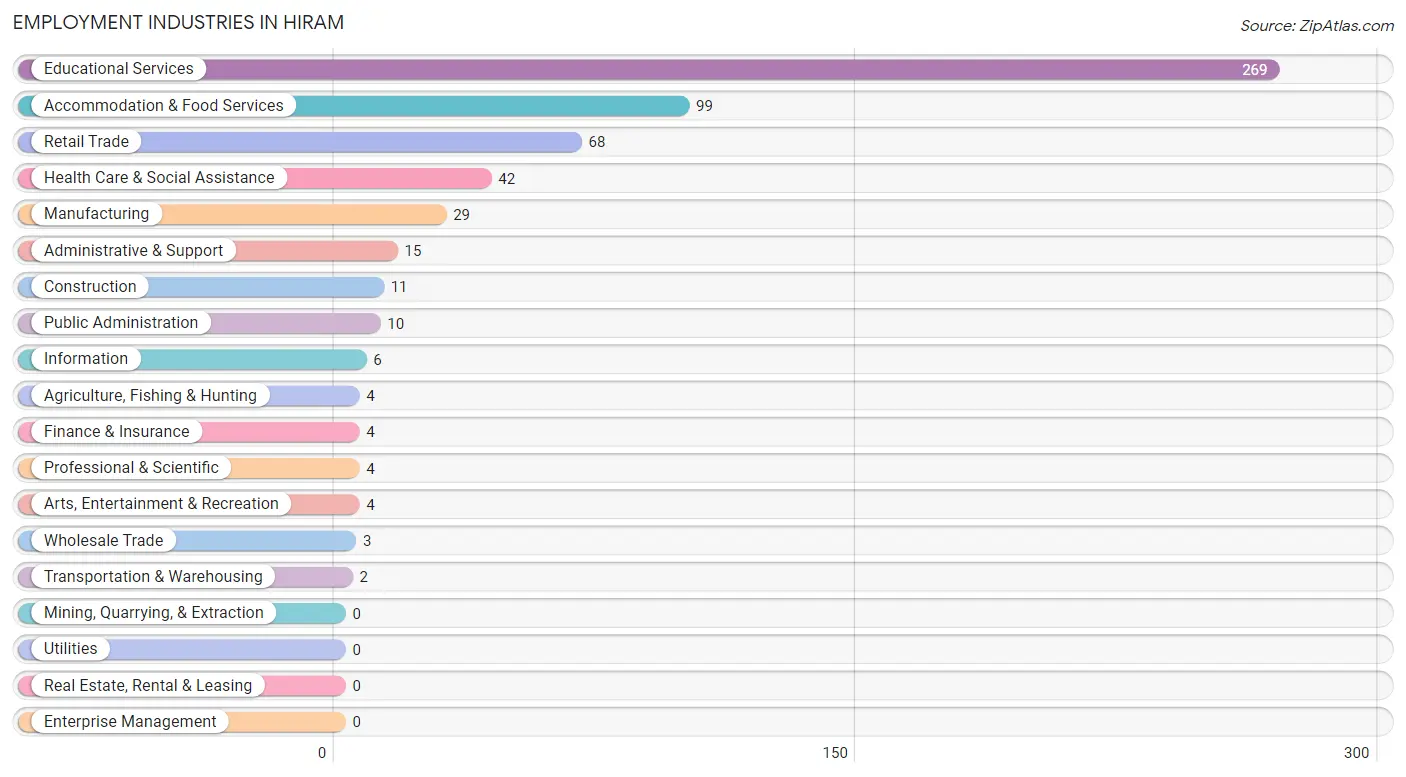
Employment Industries in Hiram
The major employment industries in Hiram include Educational Services (269 | 45.4%), Accommodation & Food Services (99 | 16.7%), Retail Trade (68 | 11.5%), Health Care & Social Assistance (42 | 7.1%), and Manufacturing (29 | 4.9%).
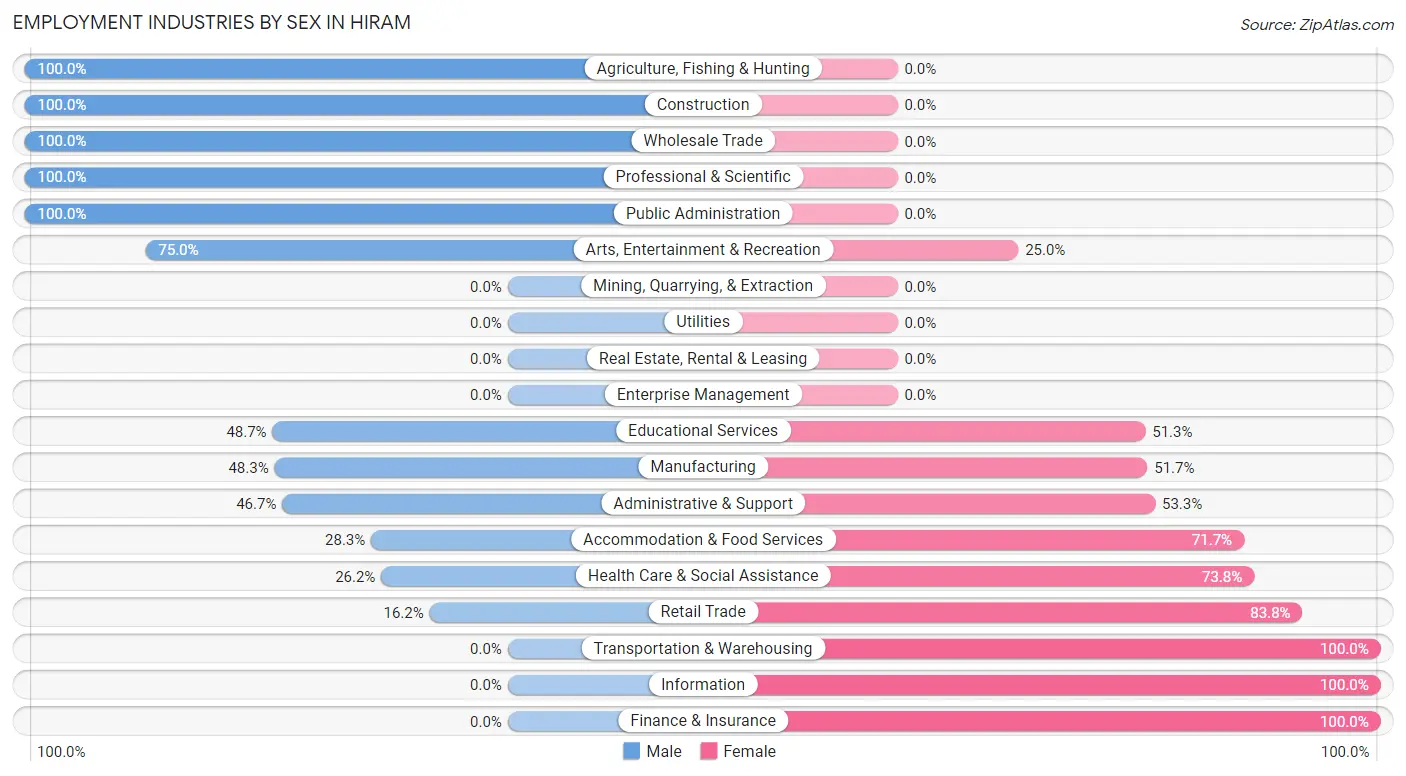
Employment Industries by Sex in Hiram
The Hiram industries that see more men than women are Agriculture, Fishing & Hunting (100.0%), Construction (100.0%), and Wholesale Trade (100.0%), whereas the industries that tend to have a higher number of women are Transportation & Warehousing (100.0%), Information (100.0%), and Finance & Insurance (100.0%).
| Industry | Male | Female |
| Agriculture, Fishing & Hunting | 4 (100.0%) | 0 (0.0%) |
| Mining, Quarrying, & Extraction | 0 (0.0%) | 0 (0.0%) |
| Construction | 11 (100.0%) | 0 (0.0%) |
| Manufacturing | 14 (48.3%) | 15 (51.7%) |
| Wholesale Trade | 3 (100.0%) | 0 (0.0%) |
| Retail Trade | 11 (16.2%) | 57 (83.8%) |
| Transportation & Warehousing | 0 (0.0%) | 2 (100.0%) |
| Utilities | 0 (0.0%) | 0 (0.0%) |
| Information | 0 (0.0%) | 6 (100.0%) |
| Finance & Insurance | 0 (0.0%) | 4 (100.0%) |
| Real Estate, Rental & Leasing | 0 (0.0%) | 0 (0.0%) |
| Professional & Scientific | 4 (100.0%) | 0 (0.0%) |
| Enterprise Management | 0 (0.0%) | 0 (0.0%) |
| Administrative & Support | 7 (46.7%) | 8 (53.3%) |
| Educational Services | 131 (48.7%) | 138 (51.3%) |
| Health Care & Social Assistance | 11 (26.2%) | 31 (73.8%) |
| Arts, Entertainment & Recreation | 3 (75.0%) | 1 (25.0%) |
| Accommodation & Food Services | 28 (28.3%) | 71 (71.7%) |
| Public Administration | 10 (100.0%) | 0 (0.0%) |
| Total | 242 (40.8%) | 351 (59.2%) |
Education in Hiram
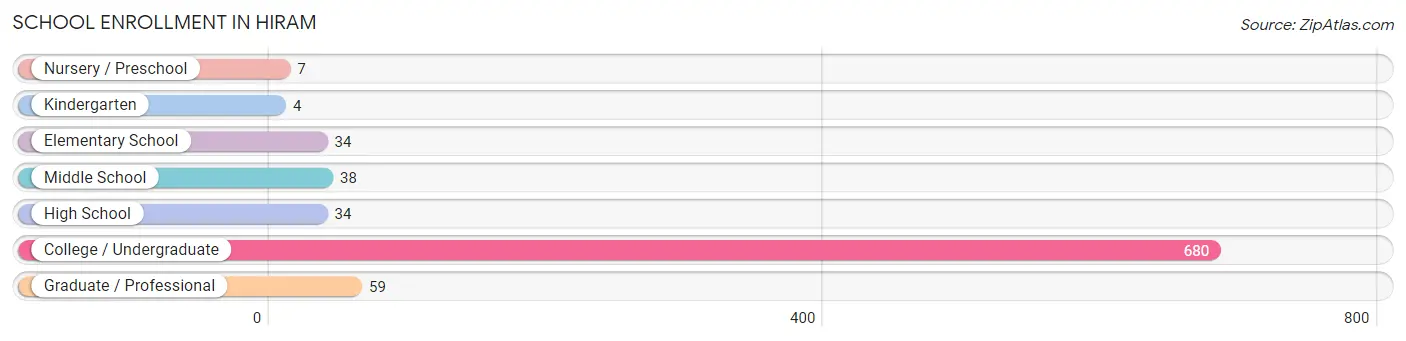
School Enrollment in Hiram
The most common levels of schooling among the 856 students in Hiram are college / undergraduate (680 | 79.4%), graduate / professional (59 | 6.9%), and middle school (38 | 4.4%).
| School Level | # Students | % Students |
| Nursery / Preschool | 7 | 0.8% |
| Kindergarten | 4 | 0.5% |
| Elementary School | 34 | 4.0% |
| Middle School | 38 | 4.4% |
| High School | 34 | 4.0% |
| College / Undergraduate | 680 | 79.4% |
| Graduate / Professional | 59 | 6.9% |
| Total | 856 | 100.0% |
School Enrollment by Age by Funding Source in Hiram
Out of a total of 856 students who are enrolled in schools in Hiram, 286 (33.4%) attend a private institution, while the remaining 570 (66.6%) are enrolled in public schools. The age group of 35 years and over has the highest likelihood of being enrolled in private schools, with 12 (100.0% in the age bracket) enrolled. Conversely, the age group of 15 to 17 year olds has the lowest likelihood of being enrolled in a private school, with 32 (100.0% in the age bracket) attending a public institution.
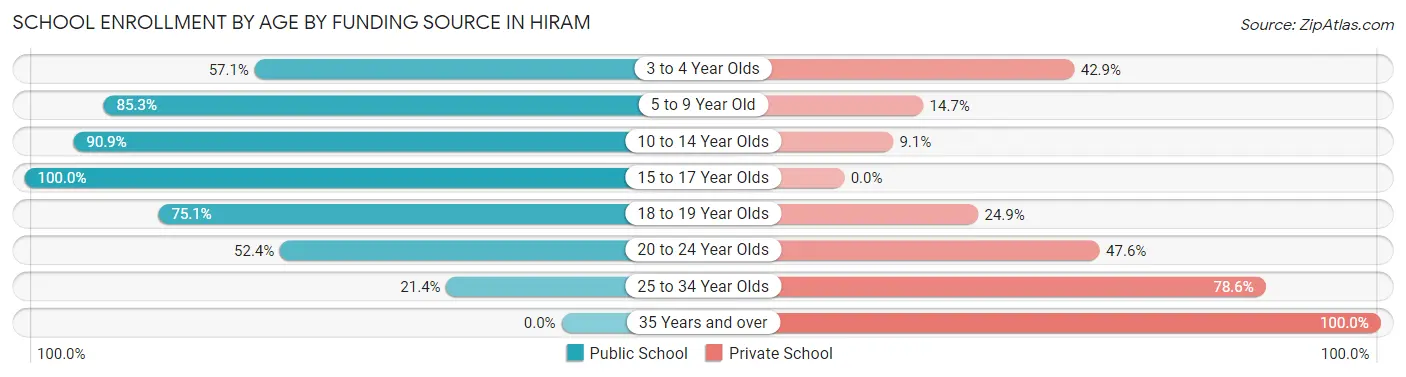
| Age Bracket | Public School | Private School |
| 3 to 4 Year Olds | 4 (57.1%) | 3 (42.9%) |
| 5 to 9 Year Old | 29 (85.3%) | 5 (14.7%) |
| 10 to 14 Year Olds | 40 (90.9%) | 4 (9.1%) |
| 15 to 17 Year Olds | 32 (100.0%) | 0 (0.0%) |
| 18 to 19 Year Olds | 307 (75.1%) | 102 (24.9%) |
| 20 to 24 Year Olds | 152 (52.4%) | 138 (47.6%) |
| 25 to 34 Year Olds | 6 (21.4%) | 22 (78.6%) |
| 35 Years and over | 0 (0.0%) | 12 (100.0%) |
| Total | 570 (66.6%) | 286 (33.4%) |
Educational Attainment by Field of Study in Hiram
Visual & performing arts (79 | 33.5%), business (34 | 14.4%), education (27 | 11.4%), bio, nature & agricultural (19 | 8.1%), and liberal arts & history (15 | 6.4%) are the most common fields of study among 236 individuals in Hiram who have obtained a bachelor's degree or higher.
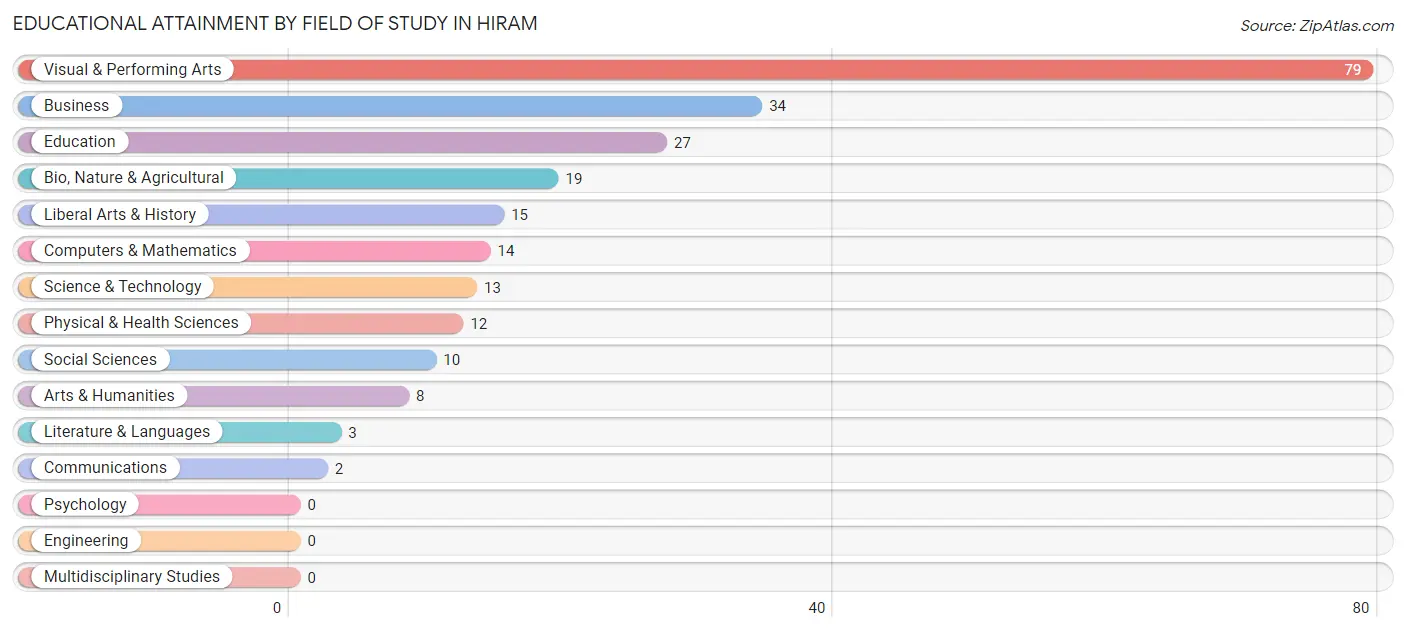
| Field of Study | # Graduates | % Graduates |
| Computers & Mathematics | 14 | 5.9% |
| Bio, Nature & Agricultural | 19 | 8.1% |
| Physical & Health Sciences | 12 | 5.1% |
| Psychology | 0 | 0.0% |
| Social Sciences | 10 | 4.2% |
| Engineering | 0 | 0.0% |
| Multidisciplinary Studies | 0 | 0.0% |
| Science & Technology | 13 | 5.5% |
| Business | 34 | 14.4% |
| Education | 27 | 11.4% |
| Literature & Languages | 3 | 1.3% |
| Liberal Arts & History | 15 | 6.4% |
| Visual & Performing Arts | 79 | 33.5% |
| Communications | 2 | 0.9% |
| Arts & Humanities | 8 | 3.4% |
| Total | 236 | 100.0% |
Transportation & Commute in Hiram
Vehicle Availability by Sex in Hiram
The most prevalent vehicle ownership categories in Hiram are males with 2 vehicles (65, accounting for 41.7%) and females with 2 vehicles (89, making up 48.9%).
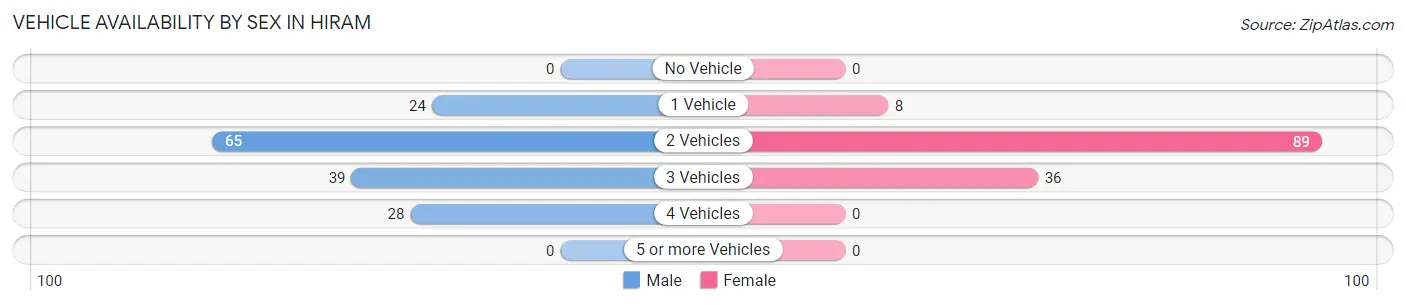
| Vehicles Available | Male | Female |
| No Vehicle | 0 (0.0%) | 0 (0.0%) |
| 1 Vehicle | 24 (15.4%) | 8 (6.0%) |
| 2 Vehicles | 65 (41.7%) | 89 (66.9%) |
| 3 Vehicles | 39 (25.0%) | 36 (27.1%) |
| 4 Vehicles | 28 (17.9%) | 0 (0.0%) |
| 5 or more Vehicles | 0 (0.0%) | 0 (0.0%) |
| Total | 156 (100.0%) | 133 (100.0%) |
Commute Time in Hiram
The most frequently occuring commute durations in Hiram are less than 5 minutes (104 commuters, 26.7%), 5 to 9 minutes (83 commuters, 21.3%), and 20 to 24 minutes (55 commuters, 14.1%).
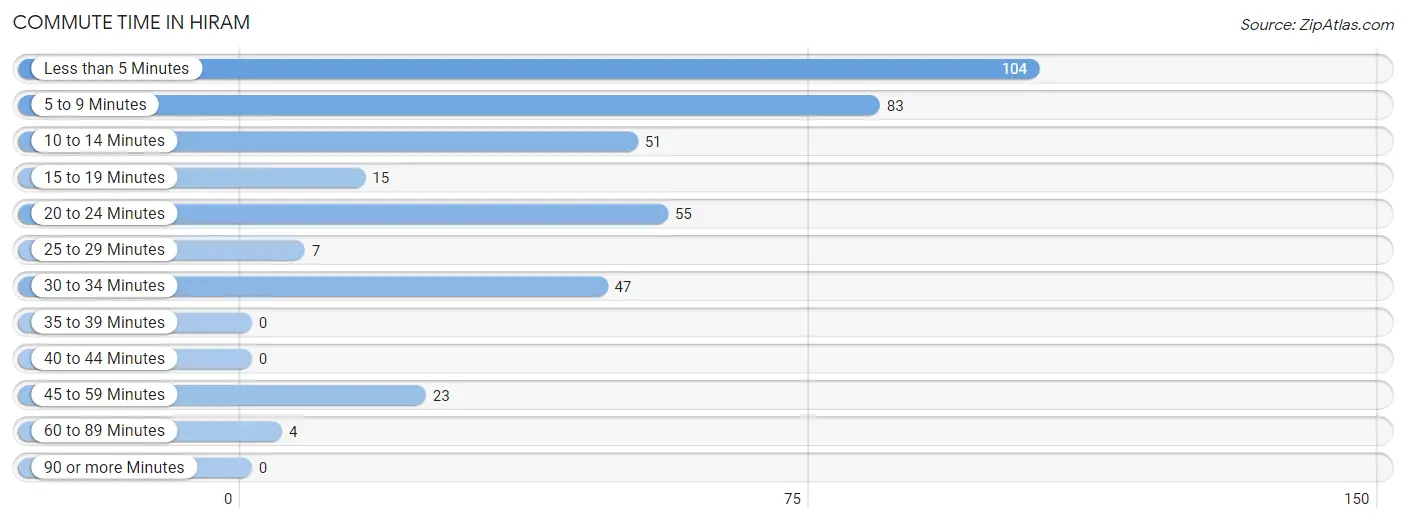
| Commute Time | # Commuters | % Commuters |
| Less than 5 Minutes | 104 | 26.7% |
| 5 to 9 Minutes | 83 | 21.3% |
| 10 to 14 Minutes | 51 | 13.1% |
| 15 to 19 Minutes | 15 | 3.9% |
| 20 to 24 Minutes | 55 | 14.1% |
| 25 to 29 Minutes | 7 | 1.8% |
| 30 to 34 Minutes | 47 | 12.1% |
| 35 to 39 Minutes | 0 | 0.0% |
| 40 to 44 Minutes | 0 | 0.0% |
| 45 to 59 Minutes | 23 | 5.9% |
| 60 to 89 Minutes | 4 | 1.0% |
| 90 or more Minutes | 0 | 0.0% |
Commute Time by Sex in Hiram
The most common commute times in Hiram are less than 5 minutes (95 commuters, 51.1%) for males and 5 to 9 minutes (63 commuters, 31.0%) for females.
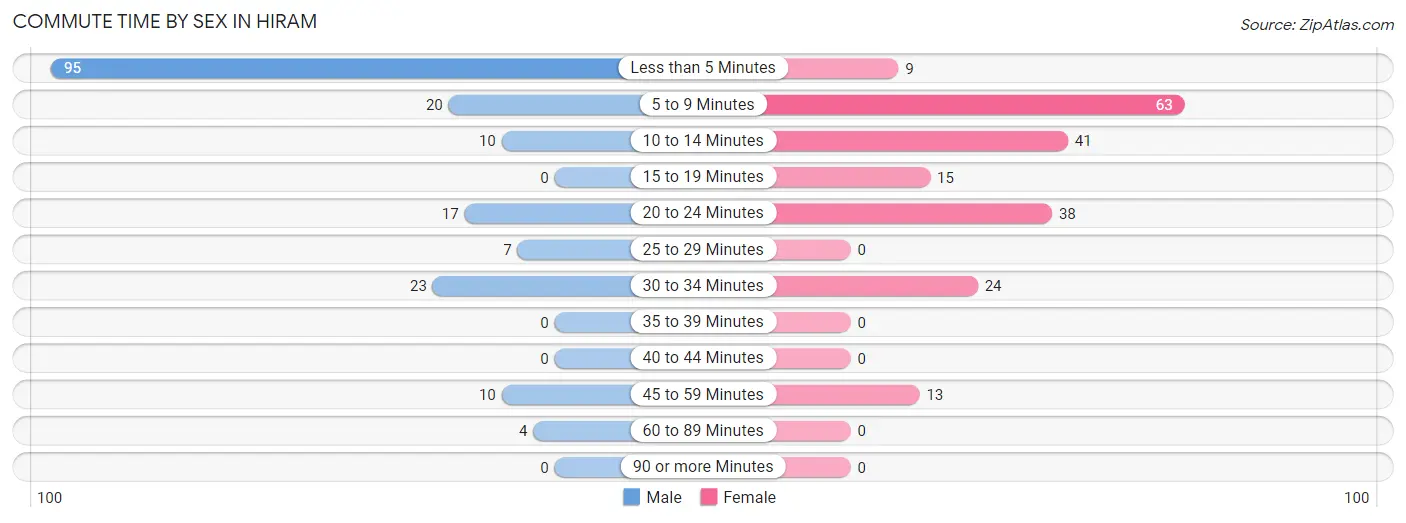
| Commute Time | Male | Female |
| Less than 5 Minutes | 95 (51.1%) | 9 (4.4%) |
| 5 to 9 Minutes | 20 (10.7%) | 63 (31.0%) |
| 10 to 14 Minutes | 10 (5.4%) | 41 (20.2%) |
| 15 to 19 Minutes | 0 (0.0%) | 15 (7.4%) |
| 20 to 24 Minutes | 17 (9.1%) | 38 (18.7%) |
| 25 to 29 Minutes | 7 (3.8%) | 0 (0.0%) |
| 30 to 34 Minutes | 23 (12.4%) | 24 (11.8%) |
| 35 to 39 Minutes | 0 (0.0%) | 0 (0.0%) |
| 40 to 44 Minutes | 0 (0.0%) | 0 (0.0%) |
| 45 to 59 Minutes | 10 (5.4%) | 13 (6.4%) |
| 60 to 89 Minutes | 4 (2.1%) | 0 (0.0%) |
| 90 or more Minutes | 0 (0.0%) | 0 (0.0%) |
Time of Departure to Work by Sex in Hiram
The most frequent times of departure to work in Hiram are 4:00 PM to 11:59 PM (47, 25.3%) for males and 12:00 PM to 3:59 PM (76, 37.4%) for females.
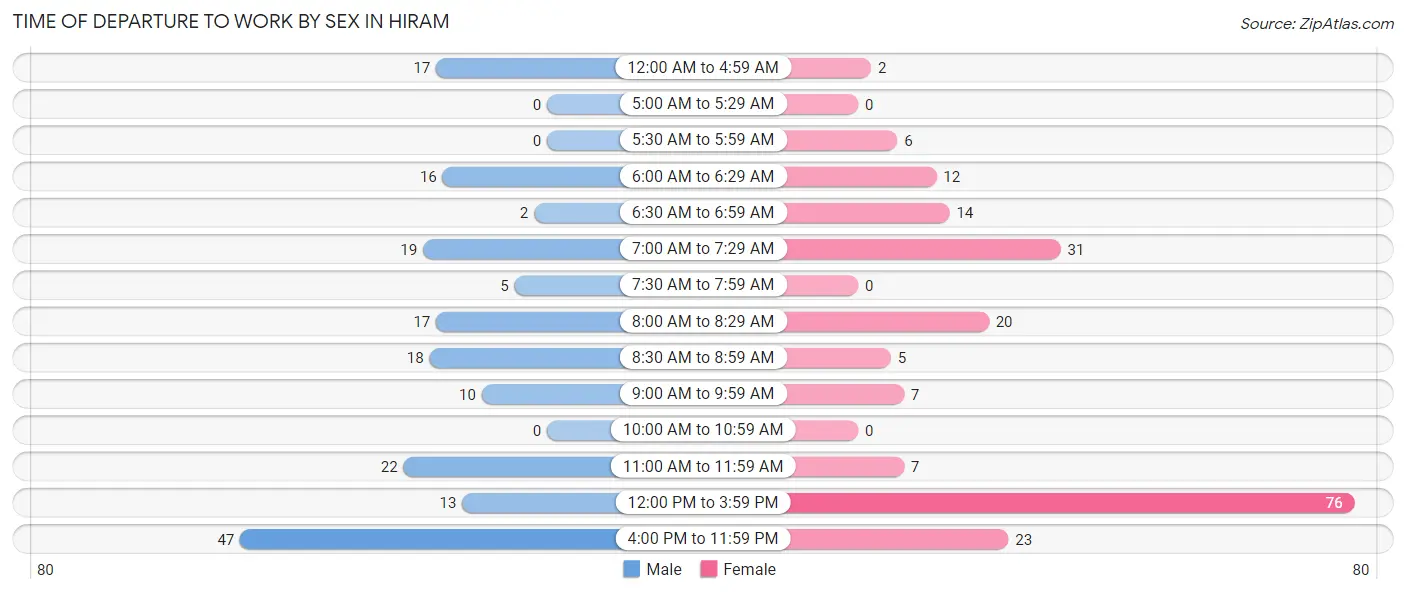
| Time of Departure | Male | Female |
| 12:00 AM to 4:59 AM | 17 (9.1%) | 2 (1.0%) |
| 5:00 AM to 5:29 AM | 0 (0.0%) | 0 (0.0%) |
| 5:30 AM to 5:59 AM | 0 (0.0%) | 6 (3.0%) |
| 6:00 AM to 6:29 AM | 16 (8.6%) | 12 (5.9%) |
| 6:30 AM to 6:59 AM | 2 (1.1%) | 14 (6.9%) |
| 7:00 AM to 7:29 AM | 19 (10.2%) | 31 (15.3%) |
| 7:30 AM to 7:59 AM | 5 (2.7%) | 0 (0.0%) |
| 8:00 AM to 8:29 AM | 17 (9.1%) | 20 (9.9%) |
| 8:30 AM to 8:59 AM | 18 (9.7%) | 5 (2.5%) |
| 9:00 AM to 9:59 AM | 10 (5.4%) | 7 (3.5%) |
| 10:00 AM to 10:59 AM | 0 (0.0%) | 0 (0.0%) |
| 11:00 AM to 11:59 AM | 22 (11.8%) | 7 (3.5%) |
| 12:00 PM to 3:59 PM | 13 (7.0%) | 76 (37.4%) |
| 4:00 PM to 11:59 PM | 47 (25.3%) | 23 (11.3%) |
| Total | 186 (100.0%) | 203 (100.0%) |
Housing Occupancy in Hiram
Occupancy by Ownership in Hiram
Of the total 213 dwellings in Hiram, owner-occupied units account for 139 (65.3%), while renter-occupied units make up 74 (34.7%).
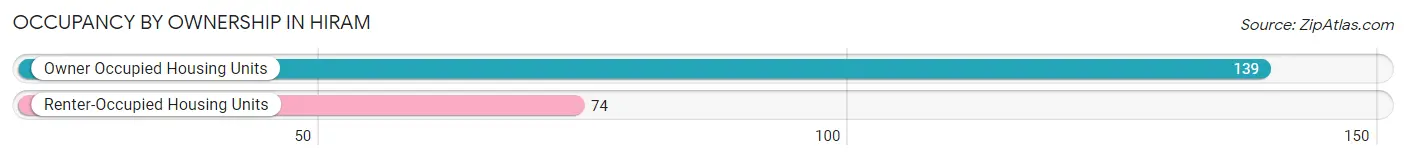
| Occupancy | # Housing Units | % Housing Units |
| Owner Occupied Housing Units | 139 | 65.3% |
| Renter-Occupied Housing Units | 74 | 34.7% |
| Total Occupied Housing Units | 213 | 100.0% |
Occupancy by Household Size in Hiram
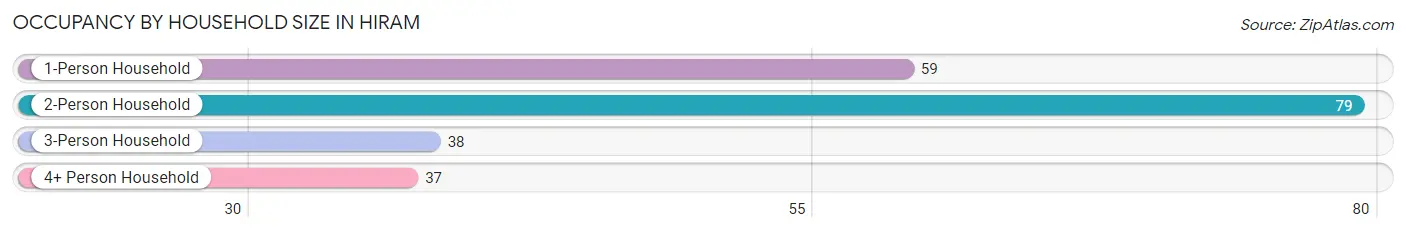
| Household Size | # Housing Units | % Housing Units |
| 1-Person Household | 59 | 27.7% |
| 2-Person Household | 79 | 37.1% |
| 3-Person Household | 38 | 17.8% |
| 4+ Person Household | 37 | 17.4% |
| Total Housing Units | 213 | 100.0% |
Occupancy by Ownership by Household Size in Hiram
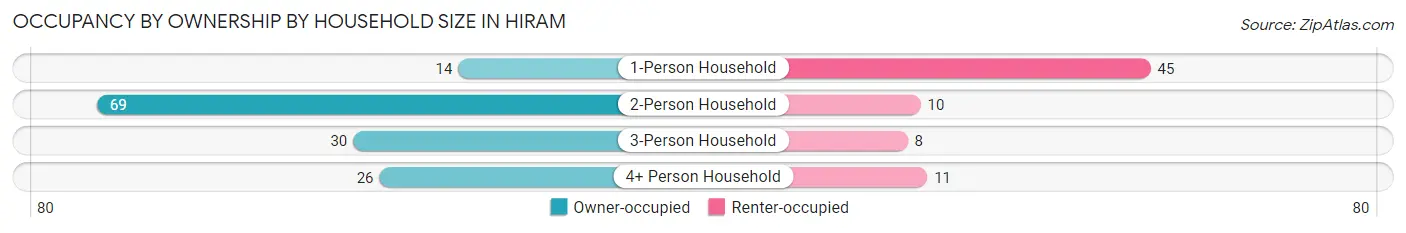
| Household Size | Owner-occupied | Renter-occupied |
| 1-Person Household | 14 (23.7%) | 45 (76.3%) |
| 2-Person Household | 69 (87.3%) | 10 (12.7%) |
| 3-Person Household | 30 (78.9%) | 8 (21.0%) |
| 4+ Person Household | 26 (70.3%) | 11 (29.7%) |
| Total Housing Units | 139 (65.3%) | 74 (34.7%) |
Occupancy by Educational Attainment in Hiram
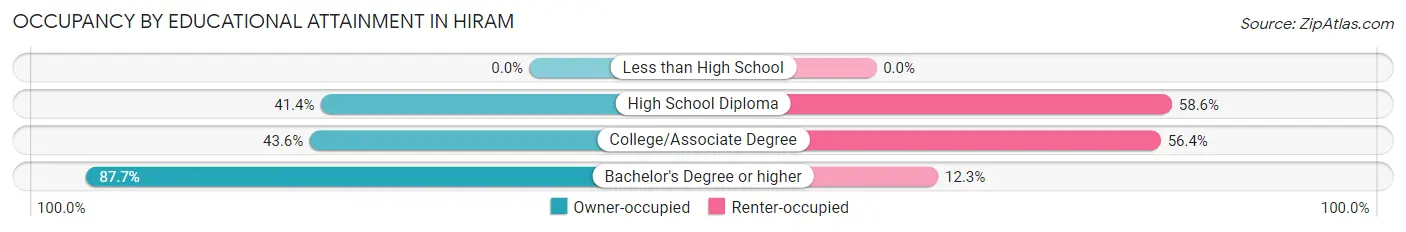
| Household Size | Owner-occupied | Renter-occupied |
| Less than High School | 0 (0.0%) | 0 (0.0%) |
| High School Diploma | 12 (41.4%) | 17 (58.6%) |
| College/Associate Degree | 34 (43.6%) | 44 (56.4%) |
| Bachelor's Degree or higher | 93 (87.7%) | 13 (12.3%) |
Occupancy by Age of Householder in Hiram
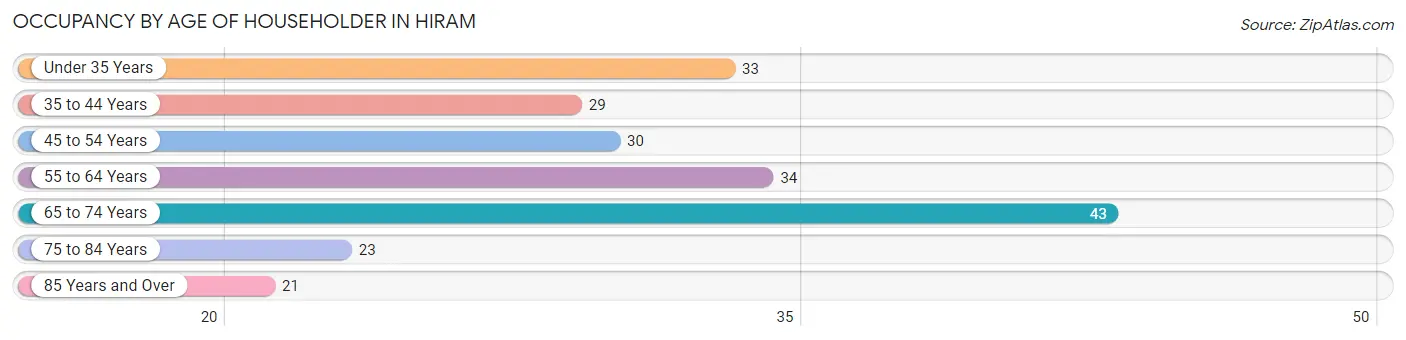
| Age Bracket | # Households | % Households |
| Under 35 Years | 33 | 15.5% |
| 35 to 44 Years | 29 | 13.6% |
| 45 to 54 Years | 30 | 14.1% |
| 55 to 64 Years | 34 | 16.0% |
| 65 to 74 Years | 43 | 20.2% |
| 75 to 84 Years | 23 | 10.8% |
| 85 Years and Over | 21 | 9.9% |
| Total | 213 | 100.0% |
Housing Finances in Hiram
Median Income by Occupancy in Hiram
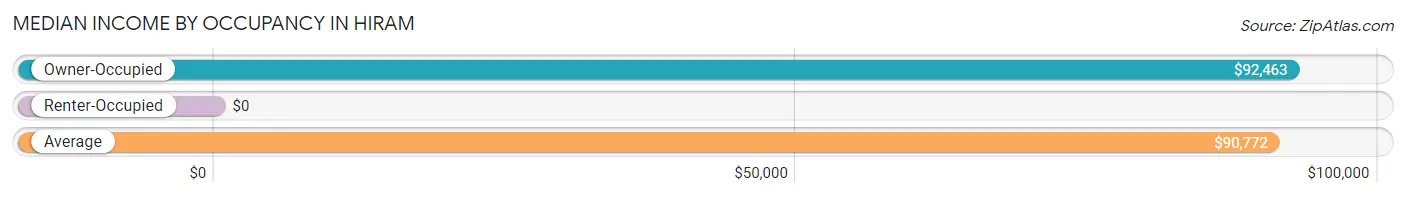
| Occupancy Type | # Households | Median Income |
| Owner-Occupied | 139 (65.3%) | $92,463 |
| Renter-Occupied | 74 (34.7%) | $0 |
| Average | 213 (100.0%) | $90,772 |
Occupancy by Householder Income Bracket in Hiram
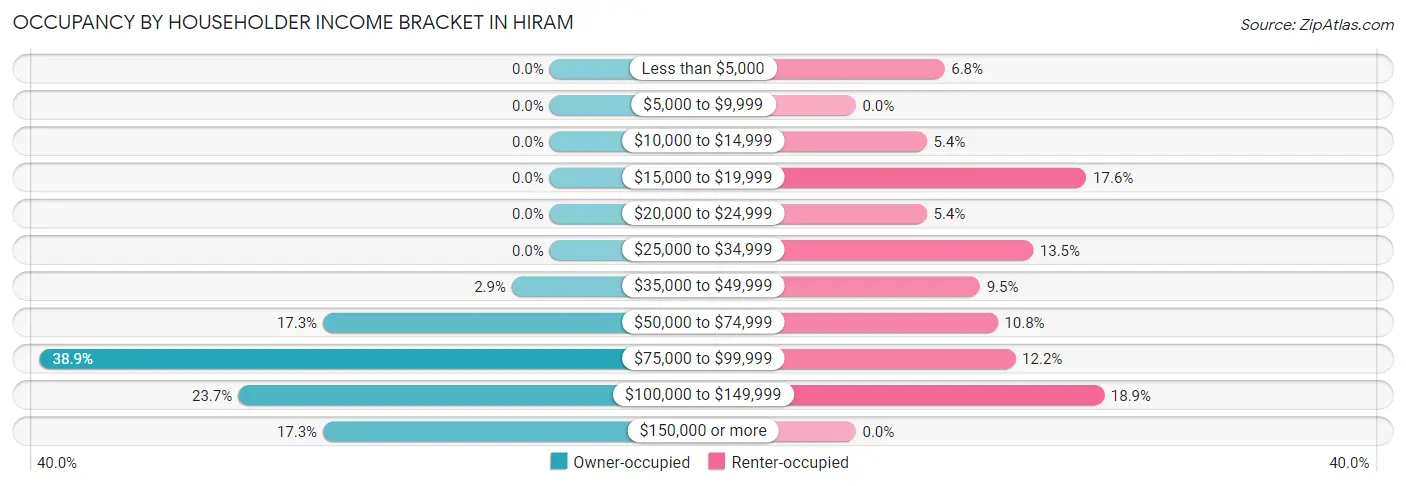
| Income Bracket | Owner-occupied | Renter-occupied |
| Less than $5,000 | 0 (0.0%) | 5 (6.8%) |
| $5,000 to $9,999 | 0 (0.0%) | 0 (0.0%) |
| $10,000 to $14,999 | 0 (0.0%) | 4 (5.4%) |
| $15,000 to $19,999 | 0 (0.0%) | 13 (17.6%) |
| $20,000 to $24,999 | 0 (0.0%) | 4 (5.4%) |
| $25,000 to $34,999 | 0 (0.0%) | 10 (13.5%) |
| $35,000 to $49,999 | 4 (2.9%) | 7 (9.5%) |
| $50,000 to $74,999 | 24 (17.3%) | 8 (10.8%) |
| $75,000 to $99,999 | 54 (38.9%) | 9 (12.2%) |
| $100,000 to $149,999 | 33 (23.7%) | 14 (18.9%) |
| $150,000 or more | 24 (17.3%) | 0 (0.0%) |
| Total | 139 (100.0%) | 74 (100.0%) |
Monthly Housing Cost Tiers in Hiram
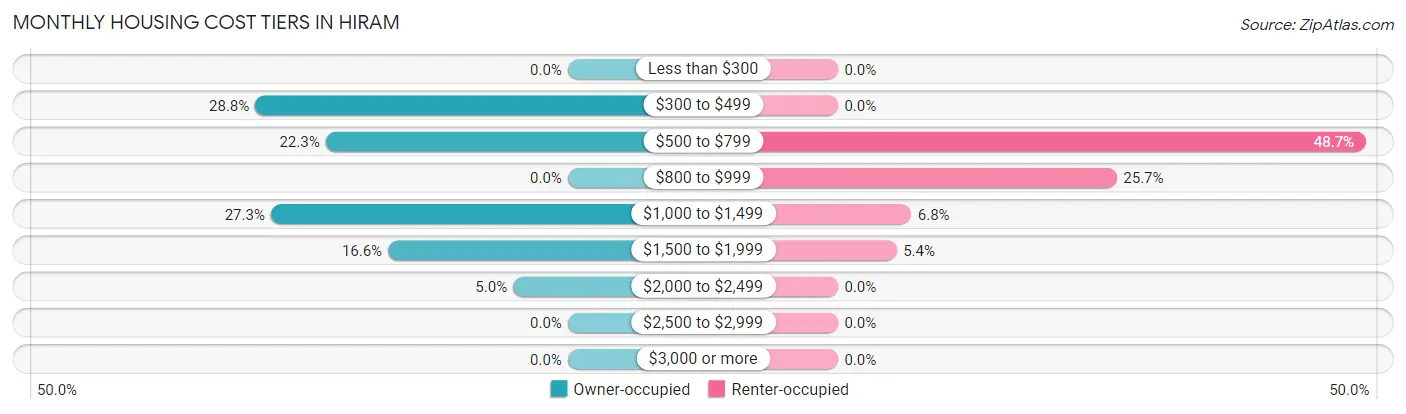
| Monthly Cost | Owner-occupied | Renter-occupied |
| Less than $300 | 0 (0.0%) | 0 (0.0%) |
| $300 to $499 | 40 (28.8%) | 0 (0.0%) |
| $500 to $799 | 31 (22.3%) | 36 (48.6%) |
| $800 to $999 | 0 (0.0%) | 19 (25.7%) |
| $1,000 to $1,499 | 38 (27.3%) | 5 (6.8%) |
| $1,500 to $1,999 | 23 (16.6%) | 4 (5.4%) |
| $2,000 to $2,499 | 7 (5.0%) | 0 (0.0%) |
| $2,500 to $2,999 | 0 (0.0%) | 0 (0.0%) |
| $3,000 or more | 0 (0.0%) | 0 (0.0%) |
| Total | 139 (100.0%) | 74 (100.0%) |
Physical Housing Characteristics in Hiram
Housing Structures in Hiram
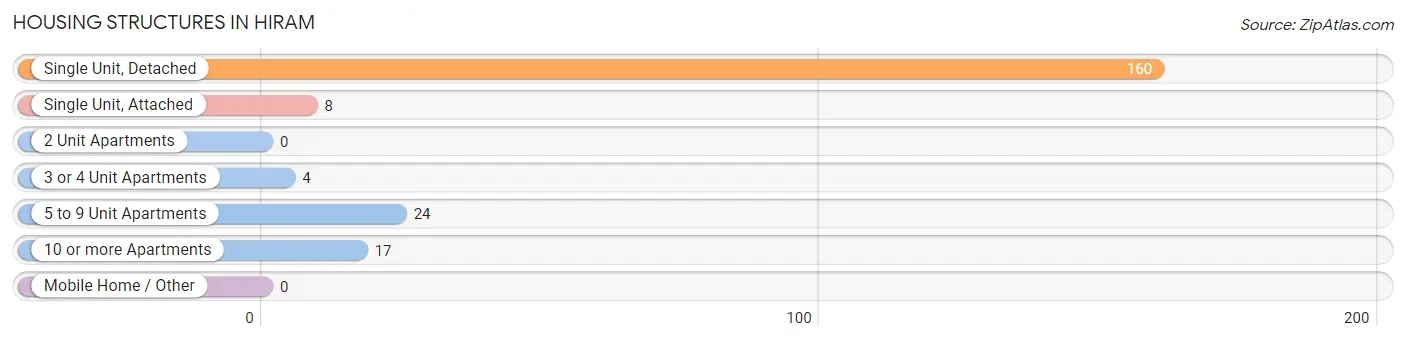
| Structure Type | # Housing Units | % Housing Units |
| Single Unit, Detached | 160 | 75.1% |
| Single Unit, Attached | 8 | 3.8% |
| 2 Unit Apartments | 0 | 0.0% |
| 3 or 4 Unit Apartments | 4 | 1.9% |
| 5 to 9 Unit Apartments | 24 | 11.3% |
| 10 or more Apartments | 17 | 8.0% |
| Mobile Home / Other | 0 | 0.0% |
| Total | 213 | 100.0% |
Housing Structures by Occupancy in Hiram
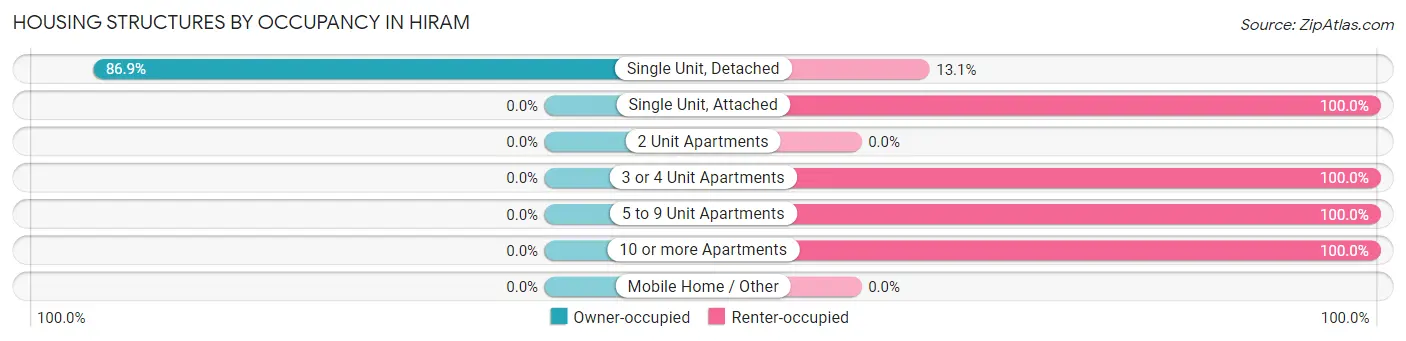
| Structure Type | Owner-occupied | Renter-occupied |
| Single Unit, Detached | 139 (86.9%) | 21 (13.1%) |
| Single Unit, Attached | 0 (0.0%) | 8 (100.0%) |
| 2 Unit Apartments | 0 (0.0%) | 0 (0.0%) |
| 3 or 4 Unit Apartments | 0 (0.0%) | 4 (100.0%) |
| 5 to 9 Unit Apartments | 0 (0.0%) | 24 (100.0%) |
| 10 or more Apartments | 0 (0.0%) | 17 (100.0%) |
| Mobile Home / Other | 0 (0.0%) | 0 (0.0%) |
| Total | 139 (65.3%) | 74 (34.7%) |
Housing Structures by Number of Rooms in Hiram
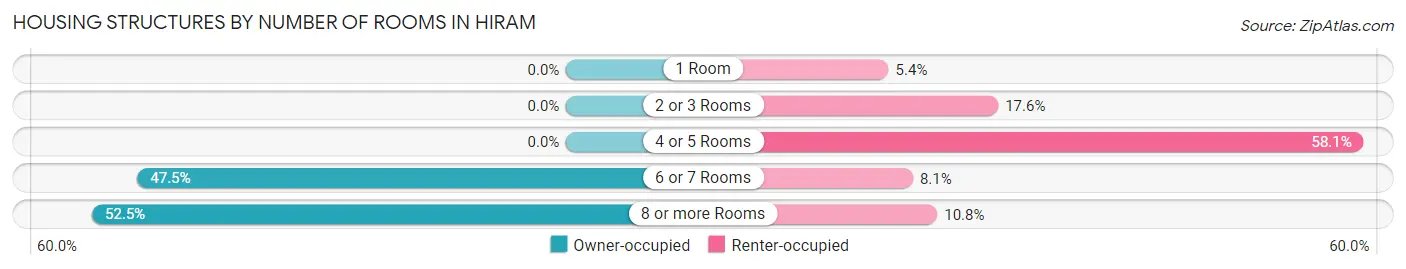
| Number of Rooms | Owner-occupied | Renter-occupied |
| 1 Room | 0 (0.0%) | 4 (5.4%) |
| 2 or 3 Rooms | 0 (0.0%) | 13 (17.6%) |
| 4 or 5 Rooms | 0 (0.0%) | 43 (58.1%) |
| 6 or 7 Rooms | 66 (47.5%) | 6 (8.1%) |
| 8 or more Rooms | 73 (52.5%) | 8 (10.8%) |
| Total | 139 (100.0%) | 74 (100.0%) |
Housing Structure by Heating Type in Hiram
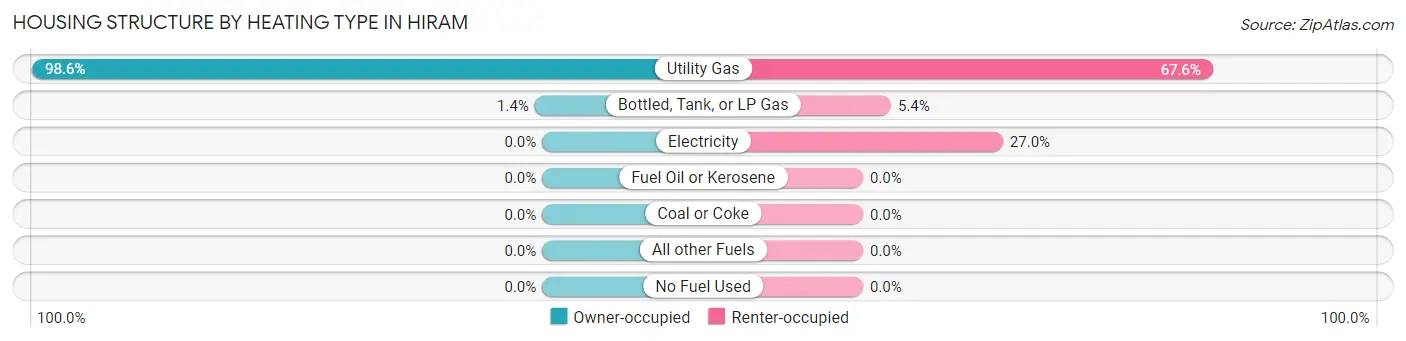
| Heating Type | Owner-occupied | Renter-occupied |
| Utility Gas | 137 (98.6%) | 50 (67.6%) |
| Bottled, Tank, or LP Gas | 2 (1.4%) | 4 (5.4%) |
| Electricity | 0 (0.0%) | 20 (27.0%) |
| Fuel Oil or Kerosene | 0 (0.0%) | 0 (0.0%) |
| Coal or Coke | 0 (0.0%) | 0 (0.0%) |
| All other Fuels | 0 (0.0%) | 0 (0.0%) |
| No Fuel Used | 0 (0.0%) | 0 (0.0%) |
| Total | 139 (100.0%) | 74 (100.0%) |
Household Vehicle Usage in Hiram
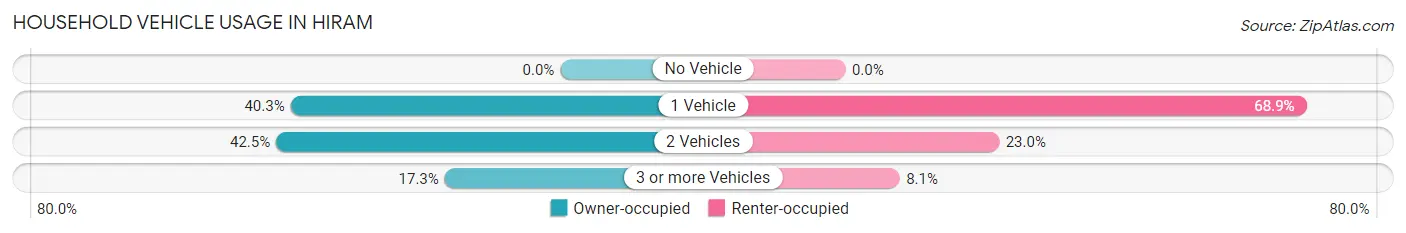
| Vehicles per Household | Owner-occupied | Renter-occupied |
| No Vehicle | 0 (0.0%) | 0 (0.0%) |
| 1 Vehicle | 56 (40.3%) | 51 (68.9%) |
| 2 Vehicles | 59 (42.4%) | 17 (23.0%) |
| 3 or more Vehicles | 24 (17.3%) | 6 (8.1%) |
| Total | 139 (100.0%) | 74 (100.0%) |
Real Estate & Mortgages in Hiram
Real Estate and Mortgage Overview in Hiram
| Characteristic | Without Mortgage | With Mortgage |
| Housing Units | 73 | 66 |
| Median Property Value | $232,000 | $212,000 |
| Median Household Income | $91,287 | $15 |
| Monthly Housing Costs | $491 | $0 |
| Real Estate Taxes | $1,945 | $0 |
Property Value by Mortgage Status in Hiram
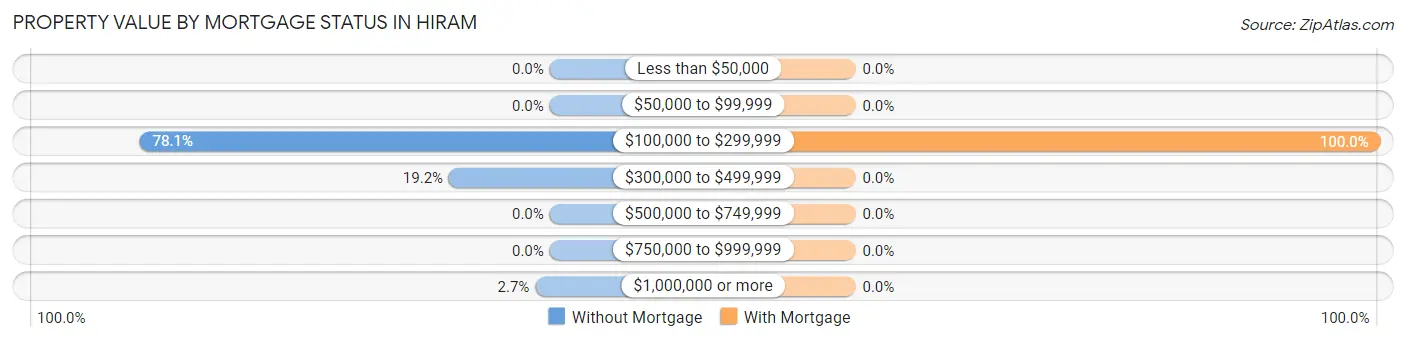
| Property Value | Without Mortgage | With Mortgage |
| Less than $50,000 | 0 (0.0%) | 0 (0.0%) |
| $50,000 to $99,999 | 0 (0.0%) | 0 (0.0%) |
| $100,000 to $299,999 | 57 (78.1%) | 66 (100.0%) |
| $300,000 to $499,999 | 14 (19.2%) | 0 (0.0%) |
| $500,000 to $749,999 | 0 (0.0%) | 0 (0.0%) |
| $750,000 to $999,999 | 0 (0.0%) | 0 (0.0%) |
| $1,000,000 or more | 2 (2.7%) | 0 (0.0%) |
| Total | 73 (100.0%) | 66 (100.0%) |
Household Income by Mortgage Status in Hiram
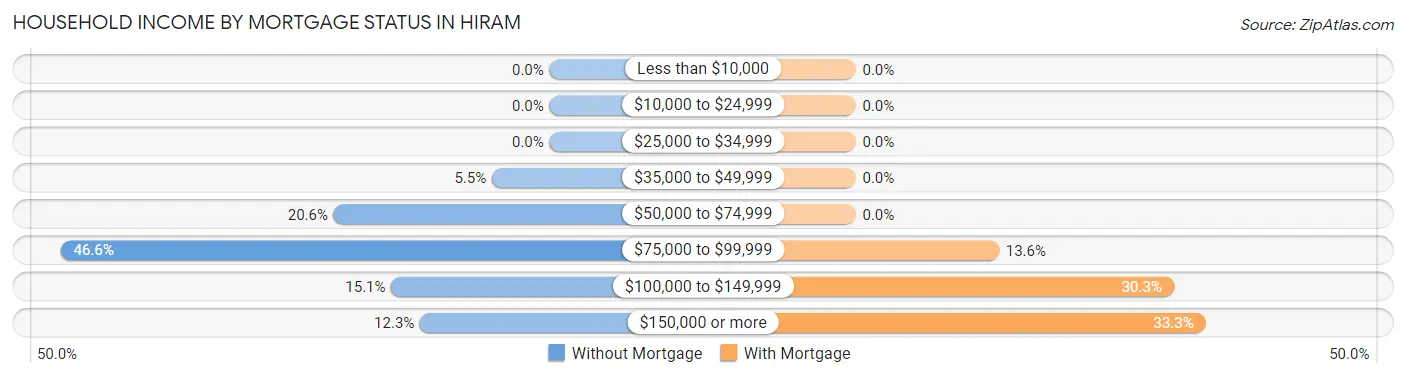
| Household Income | Without Mortgage | With Mortgage |
| Less than $10,000 | 0 (0.0%) | 0 (0.0%) |
| $10,000 to $24,999 | 0 (0.0%) | 0 (0.0%) |
| $25,000 to $34,999 | 0 (0.0%) | 0 (0.0%) |
| $35,000 to $49,999 | 4 (5.5%) | 0 (0.0%) |
| $50,000 to $74,999 | 15 (20.5%) | 0 (0.0%) |
| $75,000 to $99,999 | 34 (46.6%) | 9 (13.6%) |
| $100,000 to $149,999 | 11 (15.1%) | 20 (30.3%) |
| $150,000 or more | 9 (12.3%) | 22 (33.3%) |
| Total | 73 (100.0%) | 66 (100.0%) |
Property Value to Household Income Ratio in Hiram
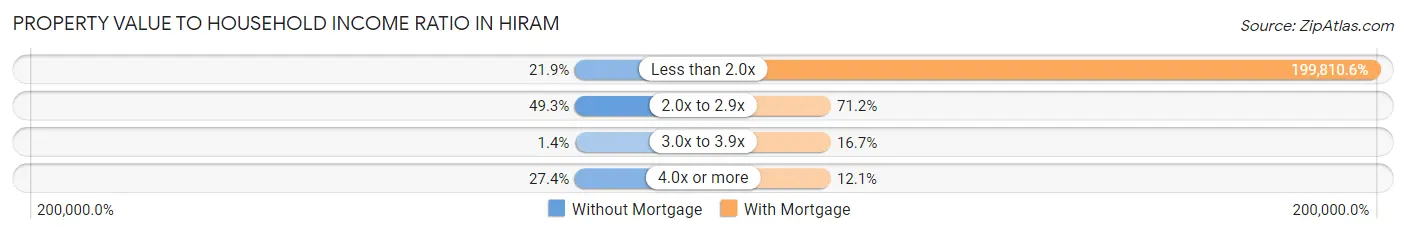
| Value-to-Income Ratio | Without Mortgage | With Mortgage |
| Less than 2.0x | 16 (21.9%) | 131,875 (199,810.6%) |
| 2.0x to 2.9x | 36 (49.3%) | 47 (71.2%) |
| 3.0x to 3.9x | 1 (1.4%) | 11 (16.7%) |
| 4.0x or more | 20 (27.4%) | 8 (12.1%) |
| Total | 73 (100.0%) | 66 (100.0%) |
Real Estate Taxes by Mortgage Status in Hiram
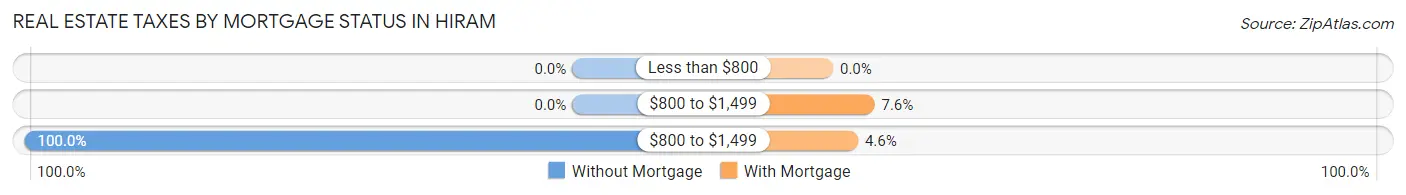
| Property Taxes | Without Mortgage | With Mortgage |
| Less than $800 | 0 (0.0%) | 0 (0.0%) |
| $800 to $1,499 | 0 (0.0%) | 5 (7.6%) |
| $800 to $1,499 | 73 (100.0%) | 3 (4.5%) |
| Total | 73 (100.0%) | 66 (100.0%) |
Health & Disability in Hiram
Health Insurance Coverage by Age in Hiram
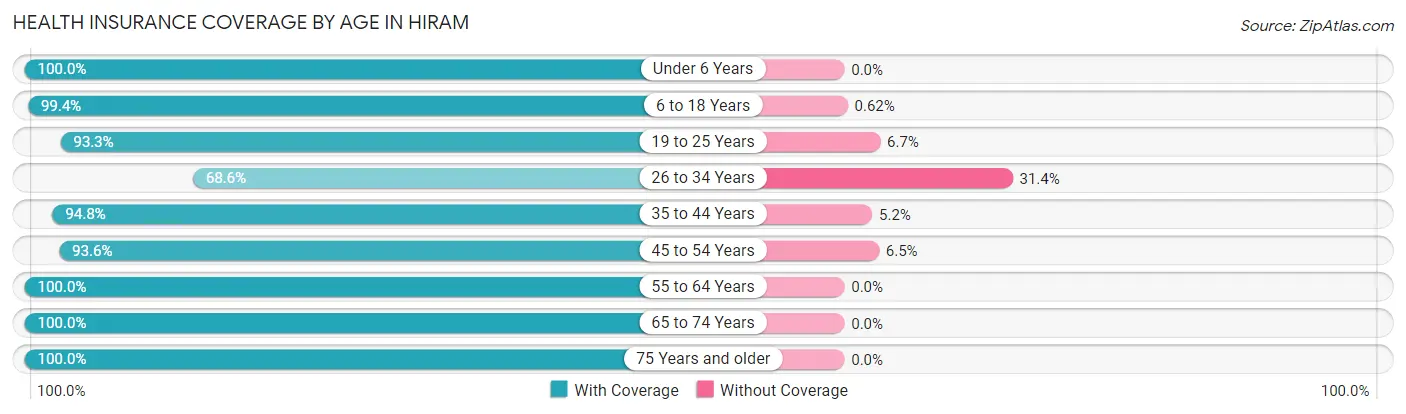
| Age Bracket | With Coverage | Without Coverage |
| Under 6 Years | 26 (100.0%) | 0 (0.0%) |
| 6 to 18 Years | 321 (99.4%) | 2 (0.6%) |
| 19 to 25 Years | 476 (93.3%) | 34 (6.7%) |
| 26 to 34 Years | 35 (68.6%) | 16 (31.4%) |
| 35 to 44 Years | 73 (94.8%) | 4 (5.2%) |
| 45 to 54 Years | 58 (93.5%) | 4 (6.5%) |
| 55 to 64 Years | 72 (100.0%) | 0 (0.0%) |
| 65 to 74 Years | 79 (100.0%) | 0 (0.0%) |
| 75 Years and older | 64 (100.0%) | 0 (0.0%) |
| Total | 1,204 (95.3%) | 60 (4.8%) |
Health Insurance Coverage by Citizenship Status in Hiram
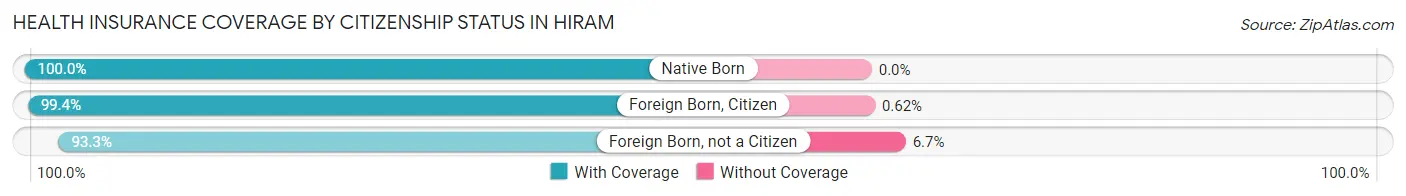
| Citizenship Status | With Coverage | Without Coverage |
| Native Born | 26 (100.0%) | 0 (0.0%) |
| Foreign Born, Citizen | 321 (99.4%) | 2 (0.6%) |
| Foreign Born, not a Citizen | 476 (93.3%) | 34 (6.7%) |
Health Insurance Coverage by Household Income in Hiram
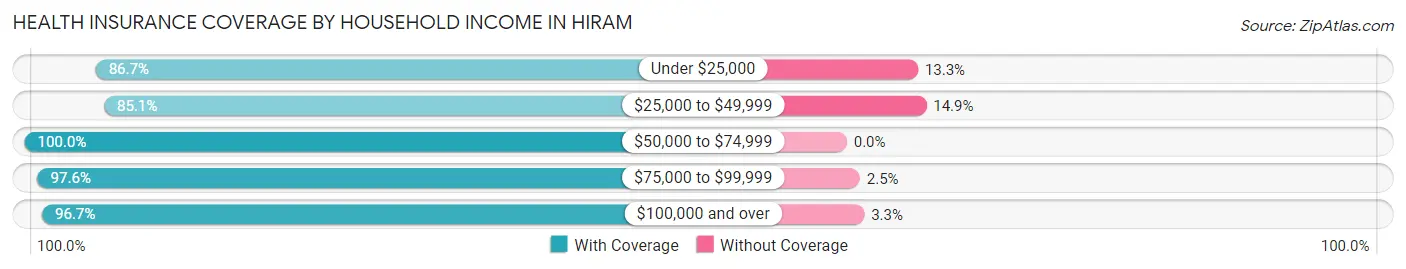
| Household Income | With Coverage | Without Coverage |
| Under $25,000 | 26 (86.7%) | 4 (13.3%) |
| $25,000 to $49,999 | 40 (85.1%) | 7 (14.9%) |
| $50,000 to $74,999 | 86 (100.0%) | 0 (0.0%) |
| $75,000 to $99,999 | 159 (97.6%) | 4 (2.5%) |
| $100,000 and over | 266 (96.7%) | 9 (3.3%) |
Public vs Private Health Insurance Coverage by Age in Hiram
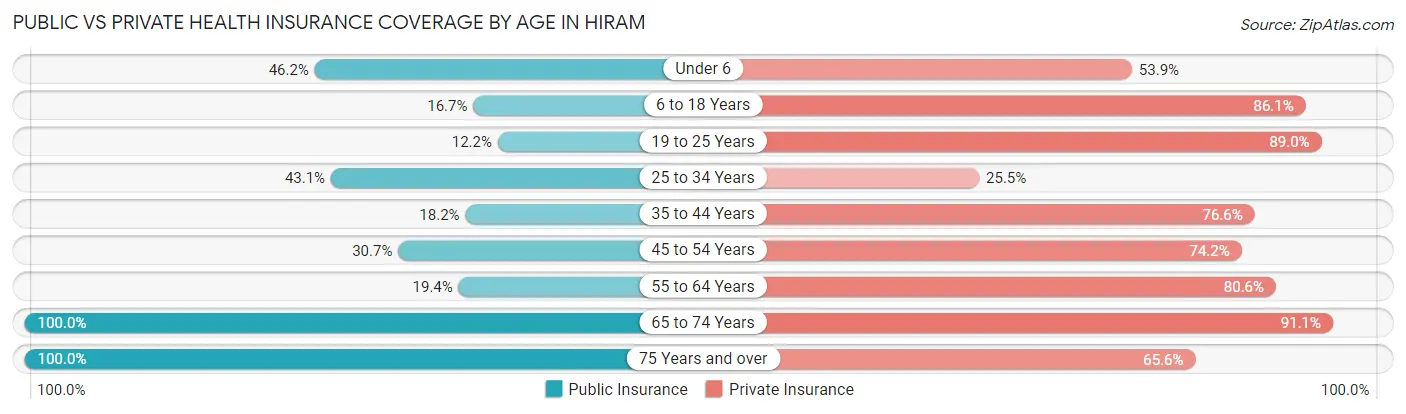
| Age Bracket | Public Insurance | Private Insurance |
| Under 6 | 12 (46.2%) | 14 (53.8%) |
| 6 to 18 Years | 54 (16.7%) | 278 (86.1%) |
| 19 to 25 Years | 62 (12.2%) | 454 (89.0%) |
| 25 to 34 Years | 22 (43.1%) | 13 (25.5%) |
| 35 to 44 Years | 14 (18.2%) | 59 (76.6%) |
| 45 to 54 Years | 19 (30.6%) | 46 (74.2%) |
| 55 to 64 Years | 14 (19.4%) | 58 (80.6%) |
| 65 to 74 Years | 79 (100.0%) | 72 (91.1%) |
| 75 Years and over | 64 (100.0%) | 42 (65.6%) |
| Total | 340 (26.9%) | 1,036 (82.0%) |
Disability Status by Sex by Age in Hiram
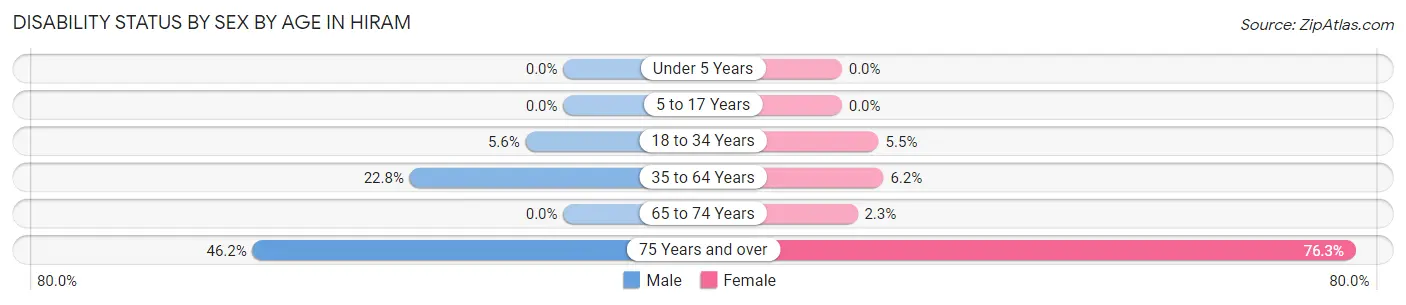
| Age Bracket | Male | Female |
| Under 5 Years | 0 (0.0%) | 0 (0.0%) |
| 5 to 17 Years | 0 (0.0%) | 0 (0.0%) |
| 18 to 34 Years | 18 (5.6%) | 25 (5.5%) |
| 35 to 64 Years | 26 (22.8%) | 6 (6.2%) |
| 65 to 74 Years | 0 (0.0%) | 1 (2.3%) |
| 75 Years and over | 12 (46.2%) | 29 (76.3%) |
Disability Class by Sex by Age in Hiram
Disability Class: Hearing Difficulty
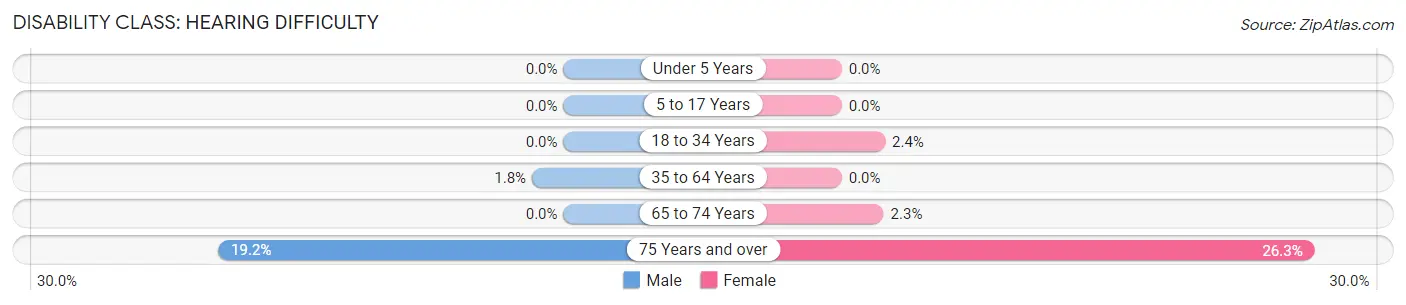
| Age Bracket | Male | Female |
| Under 5 Years | 0 (0.0%) | 0 (0.0%) |
| 5 to 17 Years | 0 (0.0%) | 0 (0.0%) |
| 18 to 34 Years | 0 (0.0%) | 11 (2.4%) |
| 35 to 64 Years | 2 (1.8%) | 0 (0.0%) |
| 65 to 74 Years | 0 (0.0%) | 1 (2.3%) |
| 75 Years and over | 5 (19.2%) | 10 (26.3%) |
Disability Class: Vision Difficulty
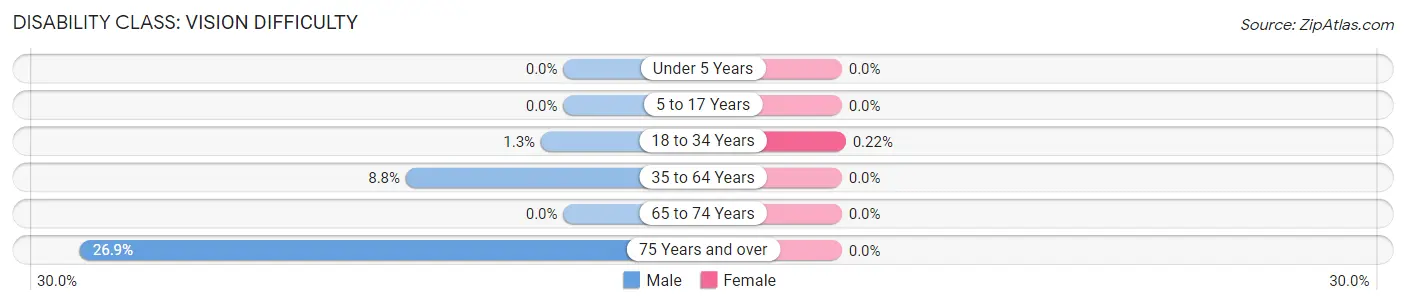
| Age Bracket | Male | Female |
| Under 5 Years | 0 (0.0%) | 0 (0.0%) |
| 5 to 17 Years | 0 (0.0%) | 0 (0.0%) |
| 18 to 34 Years | 4 (1.3%) | 1 (0.2%) |
| 35 to 64 Years | 10 (8.8%) | 0 (0.0%) |
| 65 to 74 Years | 0 (0.0%) | 0 (0.0%) |
| 75 Years and over | 7 (26.9%) | 0 (0.0%) |
Disability Class: Cognitive Difficulty
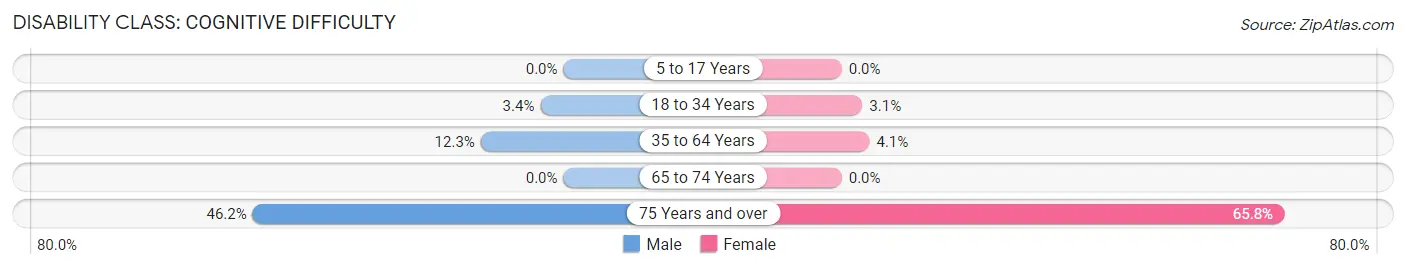
| Age Bracket | Male | Female |
| 5 to 17 Years | 0 (0.0%) | 0 (0.0%) |
| 18 to 34 Years | 11 (3.4%) | 14 (3.1%) |
| 35 to 64 Years | 14 (12.3%) | 4 (4.1%) |
| 65 to 74 Years | 0 (0.0%) | 0 (0.0%) |
| 75 Years and over | 12 (46.2%) | 25 (65.8%) |
Disability Class: Ambulatory Difficulty
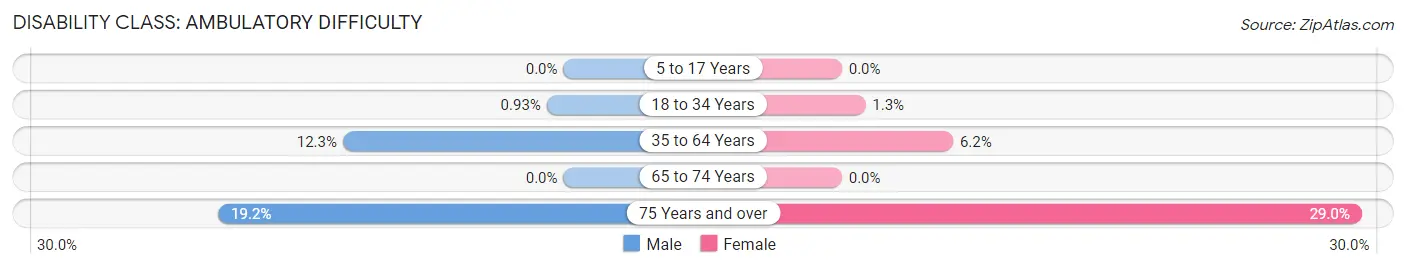
| Age Bracket | Male | Female |
| 5 to 17 Years | 0 (0.0%) | 0 (0.0%) |
| 18 to 34 Years | 3 (0.9%) | 6 (1.3%) |
| 35 to 64 Years | 14 (12.3%) | 6 (6.2%) |
| 65 to 74 Years | 0 (0.0%) | 0 (0.0%) |
| 75 Years and over | 5 (19.2%) | 11 (28.9%) |
Disability Class: Self-Care Difficulty
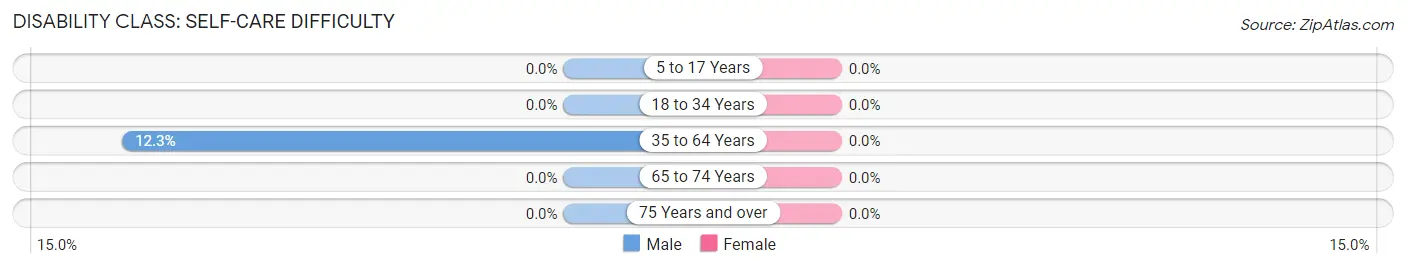
| Age Bracket | Male | Female |
| 5 to 17 Years | 0 (0.0%) | 0 (0.0%) |
| 18 to 34 Years | 0 (0.0%) | 0 (0.0%) |
| 35 to 64 Years | 14 (12.3%) | 0 (0.0%) |
| 65 to 74 Years | 0 (0.0%) | 0 (0.0%) |
| 75 Years and over | 0 (0.0%) | 0 (0.0%) |
Technology Access in Hiram
Computing Device Access in Hiram
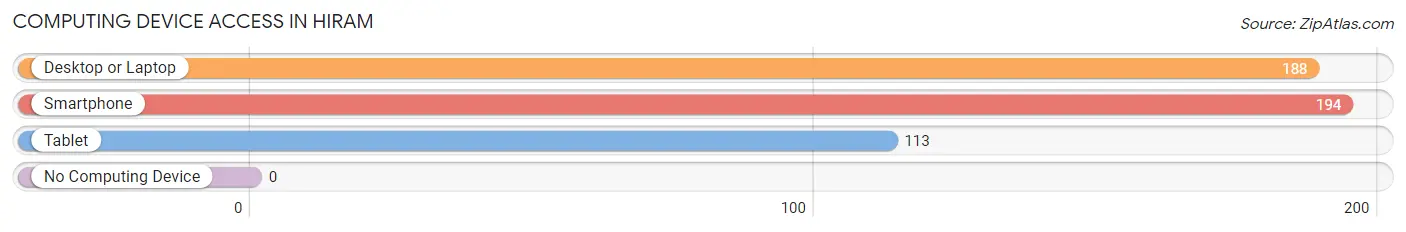
| Device Type | # Households | % Households |
| Desktop or Laptop | 188 | 88.3% |
| Smartphone | 194 | 91.1% |
| Tablet | 113 | 53.0% |
| No Computing Device | 0 | 0.0% |
| Total | 213 | 100.0% |
Internet Access in Hiram
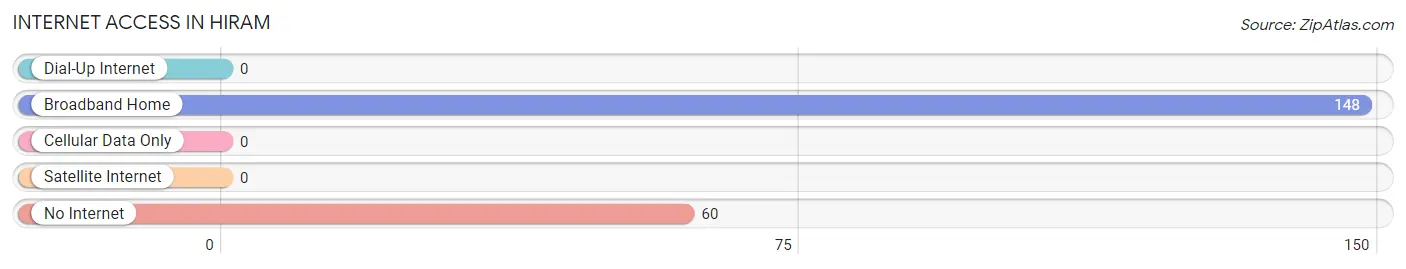
| Internet Type | # Households | % Households |
| Dial-Up Internet | 0 | 0.0% |
| Broadband Home | 148 | 69.5% |
| Cellular Data Only | 0 | 0.0% |
| Satellite Internet | 0 | 0.0% |
| No Internet | 60 | 28.2% |
| Total | 213 | 100.0% |
Hiram Summary
Hiram is a small village located in Portage County, Ohio. It is situated in the northeast corner of the county, approximately 30 miles southeast of Cleveland. The village has a population of approximately 1,500 people and covers an area of 1.2 square miles.
Hiram was founded in 1810 by a group of settlers from Connecticut. The village was named after the biblical figure, Hiram Abiff, who was a master craftsman and builder of the Temple of Solomon. The village was originally a farming community, but it soon developed into a small industrial center. The village was home to several factories, including a paper mill, a sawmill, and a gristmill.
The economy of Hiram is largely based on agriculture and manufacturing. The village is home to several farms, which produce a variety of crops, including corn, soybeans, wheat, and hay. The village also has several small manufacturing businesses, which produce a variety of products, including furniture, clothing, and automotive parts.
The demographics of Hiram are largely white, with a small percentage of African Americans and Hispanics. The median household income is approximately $45,000, and the median home value is approximately $150,000. The village has a low unemployment rate, and the majority of the population is employed in either agriculture or manufacturing.
Hiram is served by the Portage County School District, which includes two elementary schools, one middle school, and one high school. The village also has several churches, a library, and a post office. The village is home to several parks, including a community park, a nature preserve, and a golf course.
Hiram is a small village with a rich history and a strong sense of community. The village is home to a variety of businesses and industries, and it is a great place to live and work. The village is a great place to raise a family, and it offers a variety of recreational activities for all ages.
Common Questions
What is Per Capita Income in Hiram?
Per Capita income in Hiram is $24,178.
What is the Median Family Income in Hiram?
Median Family Income in Hiram is $95,625.
What is the Median Household income in Hiram?
Median Household Income in Hiram is $90,772.
What is Income or Wage Gap in Hiram?
Income or Wage Gap in Hiram is 13.5%.
Women in Hiram earn 86.5 cents for every dollar earned by a man.
What is Inequality or Gini Index in Hiram?
Inequality or Gini Index in Hiram is 0.44.
What is the Total Population of Hiram?
Total Population of Hiram is 1,264.
What is the Total Male Population of Hiram?
Total Male Population of Hiram is 557.
What is the Total Female Population of Hiram?
Total Female Population of Hiram is 707.
What is the Ratio of Males per 100 Females in Hiram?
There are 78.78 Males per 100 Females in Hiram.
What is the Ratio of Females per 100 Males in Hiram?
There are 126.93 Females per 100 Males in Hiram.
What is the Median Population Age in Hiram?
Median Population Age in Hiram is 20.7 Years.
What is the Average Family Size in Hiram
Average Family Size in Hiram is 3.5 People.
What is the Average Household Size in Hiram
Average Household Size in Hiram is 2.8 People.
How Large is the Labor Force in Hiram?
There are 645 People in the Labor Forcein in Hiram.
What is the Percentage of People in the Labor Force in Hiram?
56.1% of People are in the Labor Force in Hiram.
What is the Unemployment Rate in Hiram?
Unemployment Rate in Hiram is 8.1%.