Midway, OH Map & Demographics
Midway Map
Midway Overview
$24,103
PER CAPITA INCOME
$59,531
AVG FAMILY INCOME
$57,500
AVG HOUSEHOLD INCOME
45.2%
WAGE / INCOME GAP [ % ]
54.8¢/ $1
WAGE / INCOME GAP [ $ ]
0.35
INEQUALITY / GINI INDEX
257
TOTAL POPULATION
125
MALE POPULATION
132
FEMALE POPULATION
94.70
MALES / 100 FEMALES
105.60
FEMALES / 100 MALES
34.7
MEDIAN AGE
3.0
AVG FAMILY SIZE
2.7
AVG HOUSEHOLD SIZE
113
LABOR FORCE [ PEOPLE ]
60.8%
PERCENT IN LABOR FORCE
Income in Midway
Income Overview in Midway
Per Capita Income in Midway is $24,103, while median incomes of families and households are $59,531 and $57,500 respectively.
| Characteristic | Number | Measure |
| Per Capita Income | 257 | $24,103 |
| Median Family Income | 71 | $59,531 |
| Mean Family Income | 71 | $70,801 |
| Median Household Income | 94 | $57,500 |
| Mean Household Income | 94 | $66,789 |
| Income Deficit | 71 | $0 |
| Wage / Income Gap (%) | 257 | 45.22% |
| Wage / Income Gap ($) | 257 | 54.78¢ per $1 |
| Gini / Inequality Index | 257 | 0.35 |
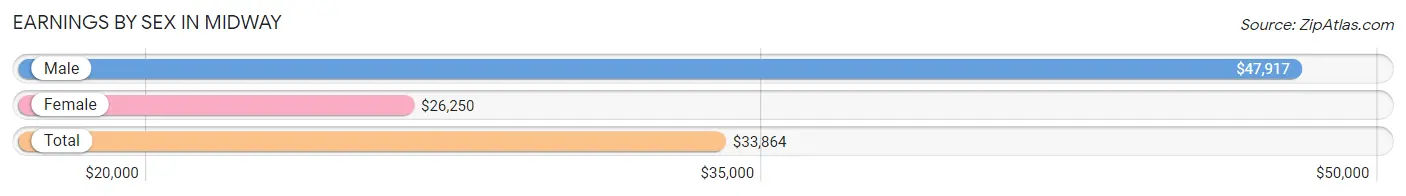
Earnings by Sex in Midway
Average Earnings in Midway are $33,864, $47,917 for men and $26,250 for women, a difference of 45.2%.
| Sex | Number | Average Earnings |
| Male | 66 (55.0%) | $47,917 |
| Female | 54 (45.0%) | $26,250 |
| Total | 120 (100.0%) | $33,864 |
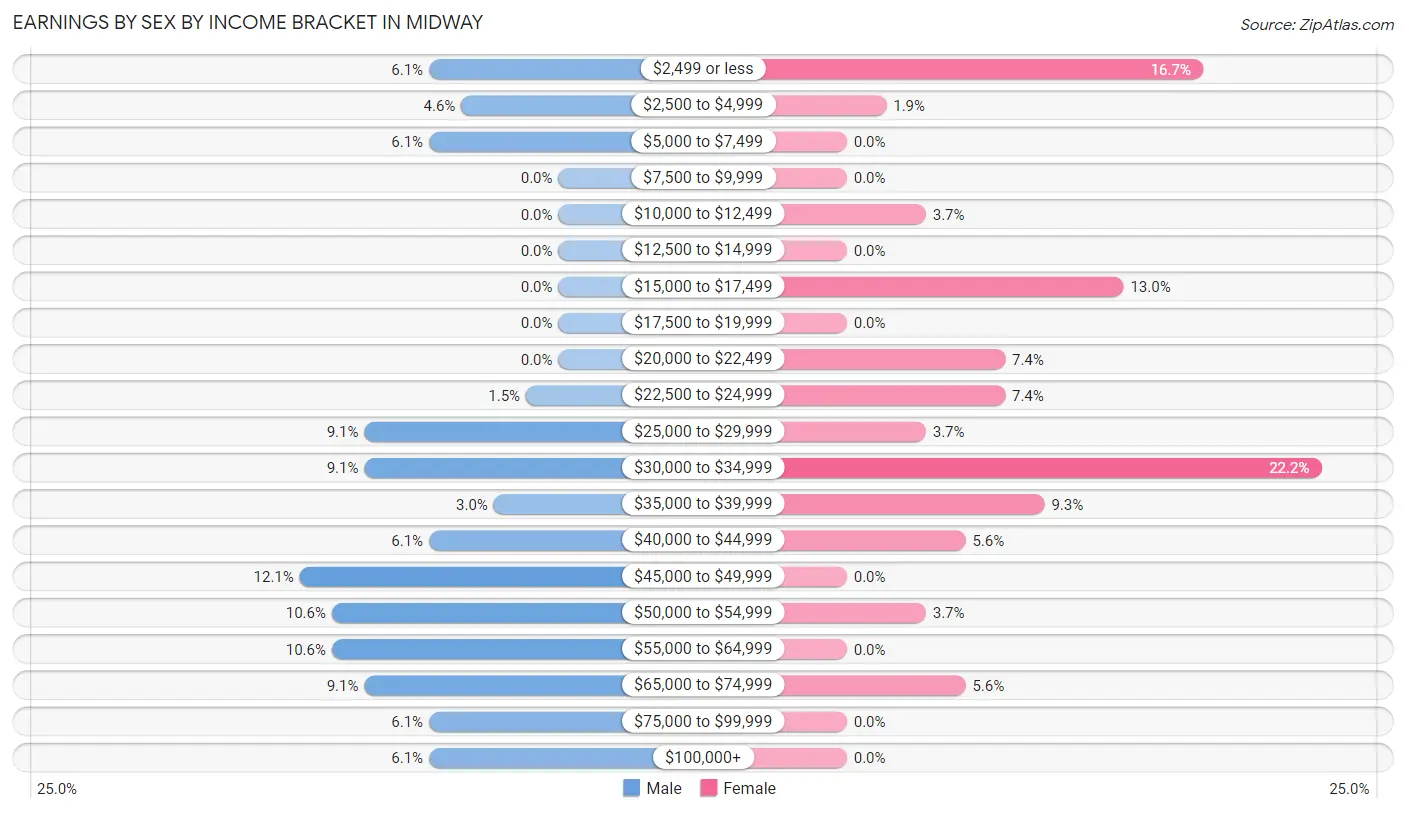
Earnings by Sex by Income Bracket in Midway
The most common earnings brackets in Midway are $45,000 to $49,999 for men (8 | 12.1%) and $30,000 to $34,999 for women (12 | 22.2%).
| Income | Male | Female |
| $2,499 or less | 4 (6.1%) | 9 (16.7%) |
| $2,500 to $4,999 | 3 (4.5%) | 1 (1.8%) |
| $5,000 to $7,499 | 4 (6.1%) | 0 (0.0%) |
| $7,500 to $9,999 | 0 (0.0%) | 0 (0.0%) |
| $10,000 to $12,499 | 0 (0.0%) | 2 (3.7%) |
| $12,500 to $14,999 | 0 (0.0%) | 0 (0.0%) |
| $15,000 to $17,499 | 0 (0.0%) | 7 (13.0%) |
| $17,500 to $19,999 | 0 (0.0%) | 0 (0.0%) |
| $20,000 to $22,499 | 0 (0.0%) | 4 (7.4%) |
| $22,500 to $24,999 | 1 (1.5%) | 4 (7.4%) |
| $25,000 to $29,999 | 6 (9.1%) | 2 (3.7%) |
| $30,000 to $34,999 | 6 (9.1%) | 12 (22.2%) |
| $35,000 to $39,999 | 2 (3.0%) | 5 (9.3%) |
| $40,000 to $44,999 | 4 (6.1%) | 3 (5.6%) |
| $45,000 to $49,999 | 8 (12.1%) | 0 (0.0%) |
| $50,000 to $54,999 | 7 (10.6%) | 2 (3.7%) |
| $55,000 to $64,999 | 7 (10.6%) | 0 (0.0%) |
| $65,000 to $74,999 | 6 (9.1%) | 3 (5.6%) |
| $75,000 to $99,999 | 4 (6.1%) | 0 (0.0%) |
| $100,000+ | 4 (6.1%) | 0 (0.0%) |
| Total | 66 (100.0%) | 54 (100.0%) |
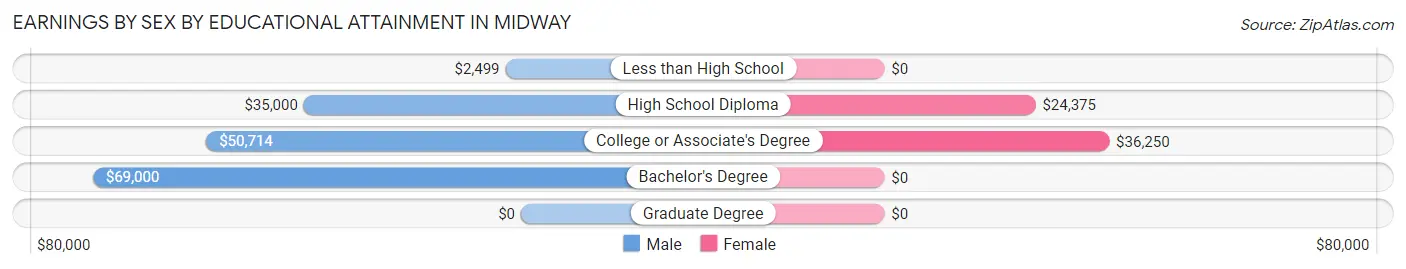
Earnings by Sex by Educational Attainment in Midway
Average earnings in Midway are $48,125 for men and $23,750 for women, a difference of 50.6%. Men with an educational attainment of bachelor's degree enjoy the highest average annual earnings of $69,000, while those with less than high school education earn the least with $2,499. Women with an educational attainment of college or associate's degree earn the most with the average annual earnings of $36,250, while those with high school diploma education have the smallest earnings of $24,375.
| Educational Attainment | Male Income | Female Income |
| Less than High School | $2,499 | $0 |
| High School Diploma | $35,000 | $24,375 |
| College or Associate's Degree | $50,714 | $36,250 |
| Bachelor's Degree | $69,000 | $0 |
| Graduate Degree | - | - |
| Total | $48,125 | $23,750 |
Family Income in Midway
Family Income Brackets in Midway
According to the Midway family income data, there are 23 families falling into the $50,000 to $74,999 income range, which is the most common income bracket and makes up 32.4% of all families.
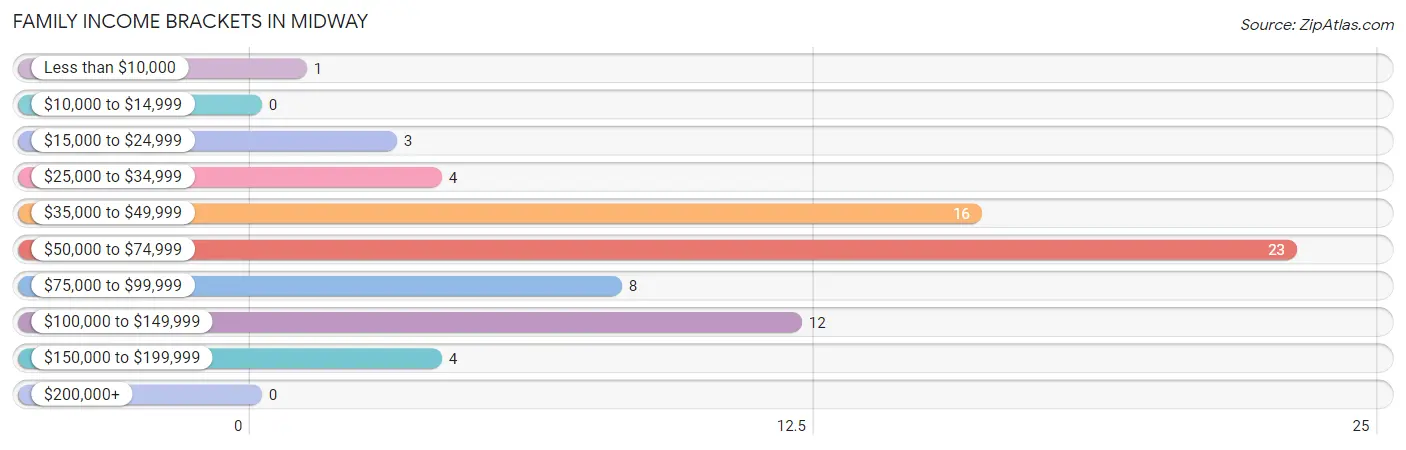
| Income Bracket | # Families | % Families |
| Less than $10,000 | 1 | 1.4% |
| $10,000 to $14,999 | 0 | 0.0% |
| $15,000 to $24,999 | 3 | 4.2% |
| $25,000 to $34,999 | 4 | 5.6% |
| $35,000 to $49,999 | 16 | 22.5% |
| $50,000 to $74,999 | 23 | 32.4% |
| $75,000 to $99,999 | 8 | 11.3% |
| $100,000 to $149,999 | 12 | 16.9% |
| $150,000 to $199,999 | 4 | 5.6% |
| $200,000+ | 0 | 0.0% |
Family Income by Famaliy Size in Midway
3-person families (11 | 15.5%) account for the highest median family income in Midway with $77,813 per family, while 2-person families (42 | 59.2%) have the highest median income of $28,125 per family member.
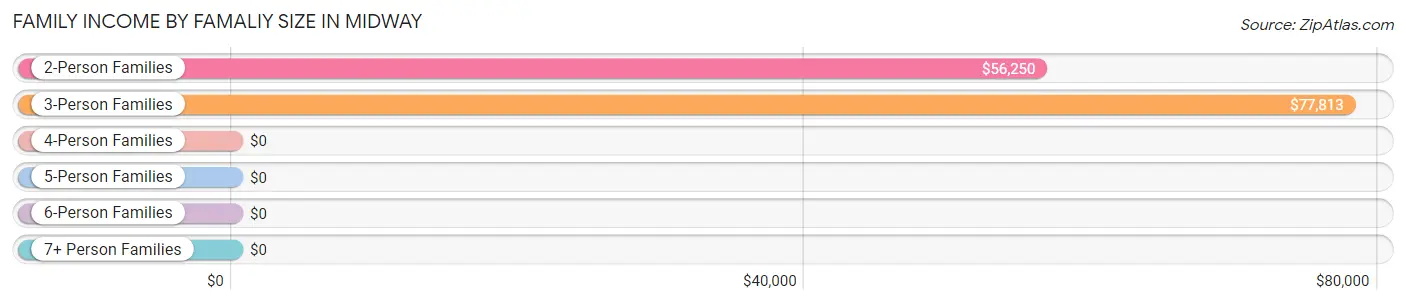
| Income Bracket | # Families | Median Income |
| 2-Person Families | 42 (59.2%) | $56,250 |
| 3-Person Families | 11 (15.5%) | $77,813 |
| 4-Person Families | 14 (19.7%) | $0 |
| 5-Person Families | 4 (5.6%) | $0 |
| 6-Person Families | 0 (0.0%) | $0 |
| 7+ Person Families | 0 (0.0%) | $0 |
| Total | 71 (100.0%) | $59,531 |
Family Income by Number of Earners in Midway
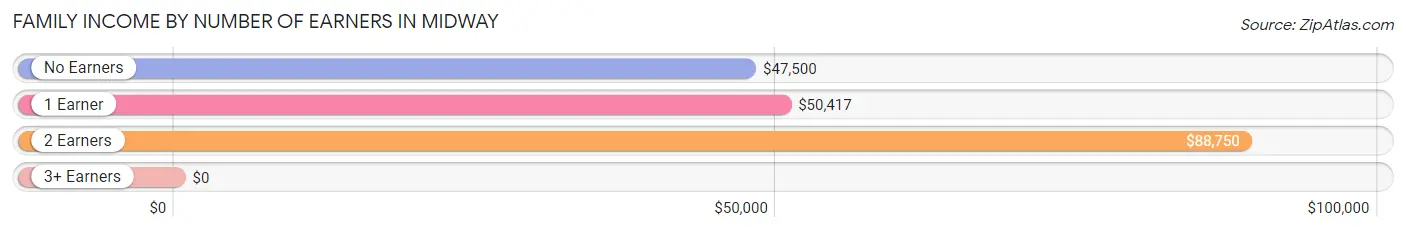
| Number of Earners | # Families | Median Income |
| No Earners | 16 (22.5%) | $47,500 |
| 1 Earner | 29 (40.8%) | $50,417 |
| 2 Earners | 21 (29.6%) | $88,750 |
| 3+ Earners | 5 (7.0%) | $0 |
| Total | 71 (100.0%) | $59,531 |
Household Income in Midway
Household Income Brackets in Midway
With 17 households falling in the category, the $35,000 to $49,999 income range is the most frequent in Midway, accounting for 18.1% of all households.
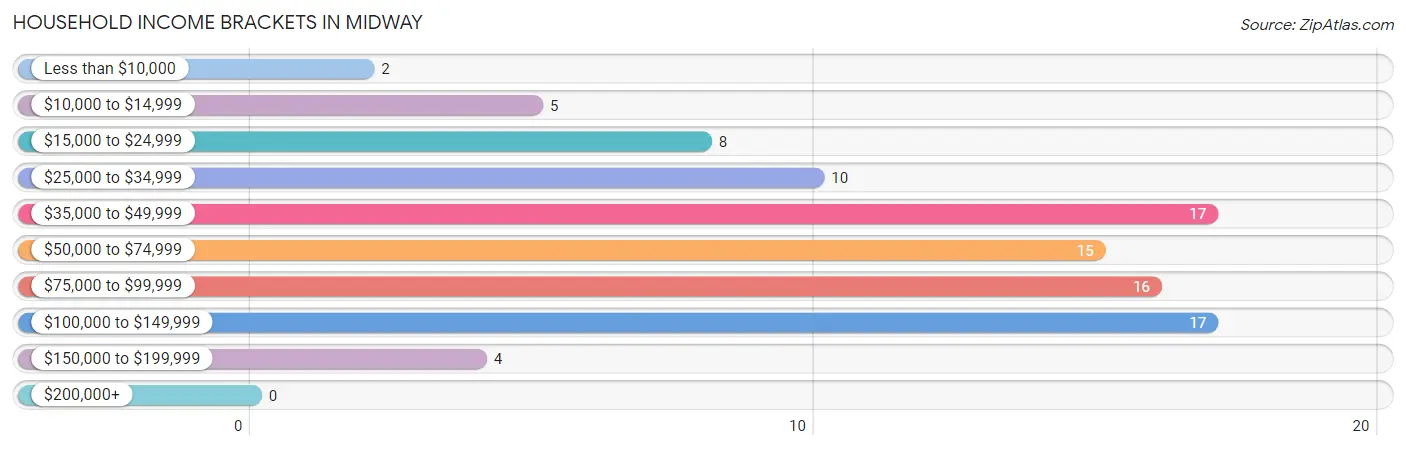
| Income Bracket | # Households | % Households |
| Less than $10,000 | 2 | 2.1% |
| $10,000 to $14,999 | 5 | 5.3% |
| $15,000 to $24,999 | 8 | 8.5% |
| $25,000 to $34,999 | 10 | 10.6% |
| $35,000 to $49,999 | 17 | 18.1% |
| $50,000 to $74,999 | 15 | 16.0% |
| $75,000 to $99,999 | 16 | 17.0% |
| $100,000 to $149,999 | 17 | 18.1% |
| $150,000 to $199,999 | 4 | 4.3% |
| $200,000+ | 0 | 0.0% |
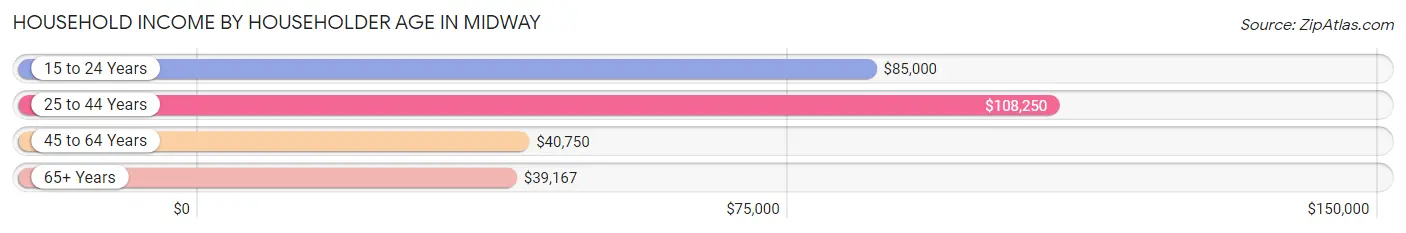
Household Income by Householder Age in Midway
The median household income in Midway is $57,500, with the highest median household income of $108,250 found in the 25 to 44 years age bracket for the primary householder. A total of 23 households (24.5%) fall into this category. Meanwhile, the 65+ years age bracket for the primary householder has the lowest median household income of $39,167, with 30 households (31.9%) in this group.
| Income Bracket | # Households | Median Income |
| 15 to 24 Years | 10 (10.6%) | $85,000 |
| 25 to 44 Years | 23 (24.5%) | $108,250 |
| 45 to 64 Years | 31 (33.0%) | $40,750 |
| 65+ Years | 30 (31.9%) | $39,167 |
| Total | 94 (100.0%) | $57,500 |
Poverty in Midway
Income Below Poverty by Sex and Age in Midway
With 3.2% poverty level for males and 25.8% for females among the residents of Midway, 16 and 17 year old males and 6 to 11 year old females are the most vulnerable to poverty, with 1 males (50.0%) and 9 females (56.2%) in their respective age groups living below the poverty level.
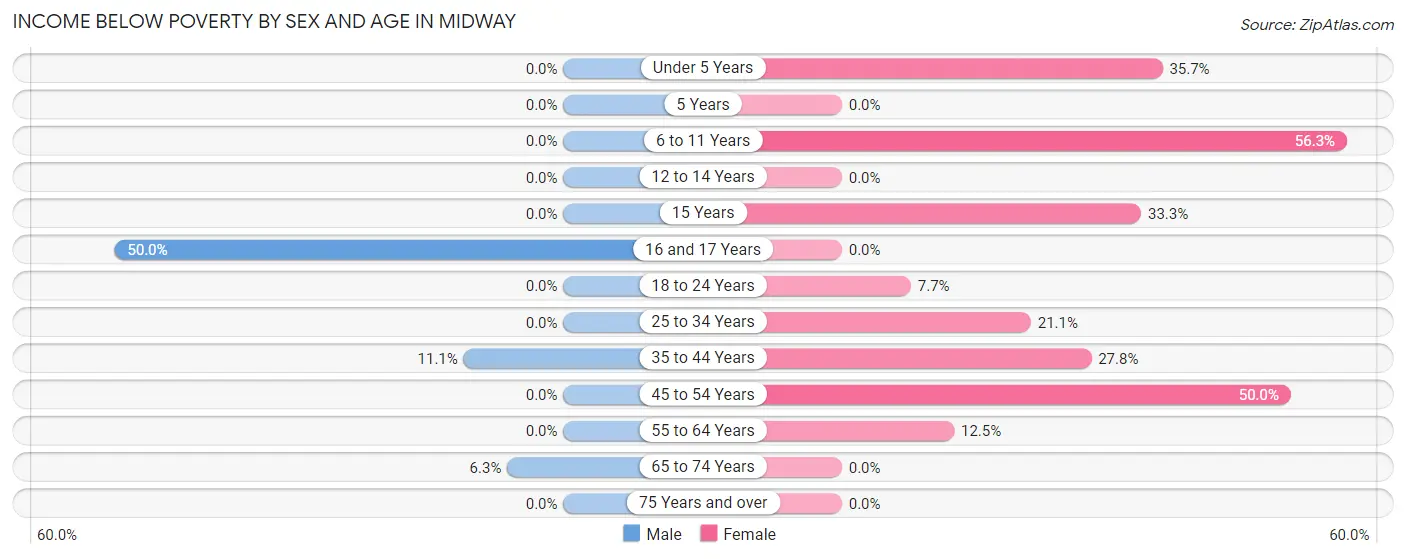
| Age Bracket | Male | Female |
| Under 5 Years | 0 (0.0%) | 5 (35.7%) |
| 5 Years | 0 (0.0%) | 0 (0.0%) |
| 6 to 11 Years | 0 (0.0%) | 9 (56.2%) |
| 12 to 14 Years | 0 (0.0%) | 0 (0.0%) |
| 15 Years | 0 (0.0%) | 1 (33.3%) |
| 16 and 17 Years | 1 (50.0%) | 0 (0.0%) |
| 18 to 24 Years | 0 (0.0%) | 1 (7.7%) |
| 25 to 34 Years | 0 (0.0%) | 4 (21.0%) |
| 35 to 44 Years | 2 (11.1%) | 5 (27.8%) |
| 45 to 54 Years | 0 (0.0%) | 8 (50.0%) |
| 55 to 64 Years | 0 (0.0%) | 1 (12.5%) |
| 65 to 74 Years | 1 (6.2%) | 0 (0.0%) |
| 75 Years and over | 0 (0.0%) | 0 (0.0%) |
| Total | 4 (3.2%) | 34 (25.8%) |
Income Above Poverty by Sex and Age in Midway
According to the poverty statistics in Midway, males aged under 5 years and females aged 65 to 74 years are the age groups that are most secure financially, with 100.0% of males and 100.0% of females in these age groups living above the poverty line.

| Age Bracket | Male | Female |
| Under 5 Years | 11 (100.0%) | 9 (64.3%) |
| 5 Years | 4 (100.0%) | 0 (0.0%) |
| 6 to 11 Years | 12 (100.0%) | 7 (43.8%) |
| 12 to 14 Years | 7 (100.0%) | 0 (0.0%) |
| 15 Years | 4 (100.0%) | 2 (66.7%) |
| 16 and 17 Years | 1 (50.0%) | 0 (0.0%) |
| 18 to 24 Years | 9 (100.0%) | 12 (92.3%) |
| 25 to 34 Years | 16 (100.0%) | 15 (78.9%) |
| 35 to 44 Years | 16 (88.9%) | 13 (72.2%) |
| 45 to 54 Years | 6 (100.0%) | 8 (50.0%) |
| 55 to 64 Years | 9 (100.0%) | 7 (87.5%) |
| 65 to 74 Years | 15 (93.8%) | 16 (100.0%) |
| 75 Years and over | 11 (100.0%) | 9 (100.0%) |
| Total | 121 (96.8%) | 98 (74.2%) |
Income Below Poverty Among Married-Couple Families in Midway
The poverty statistics for married-couple families in Midway show that 5.4% or 2 of the total 37 families live below the poverty line. Families with 1 or 2 children have the highest poverty rate of 18.2%, comprising of 2 families. On the other hand, families with no children have the lowest poverty rate of 0.0%, which includes 0 families.
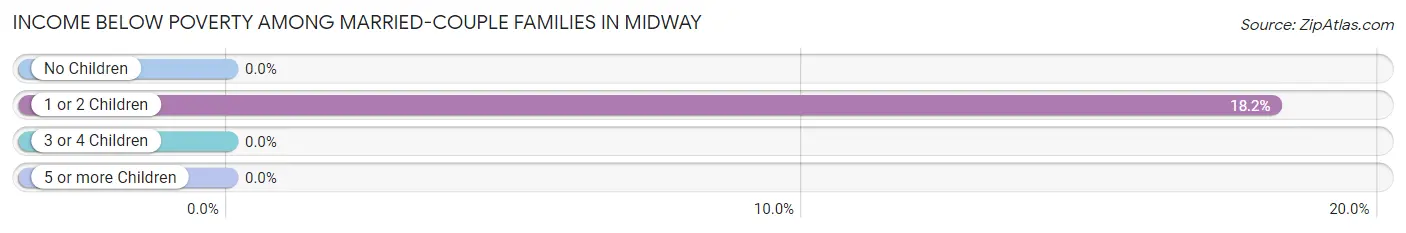
| Children | Above Poverty | Below Poverty |
| No Children | 26 (100.0%) | 0 (0.0%) |
| 1 or 2 Children | 9 (81.8%) | 2 (18.2%) |
| 3 or 4 Children | 0 (0.0%) | 0 (0.0%) |
| 5 or more Children | 0 (0.0%) | 0 (0.0%) |
| Total | 35 (94.6%) | 2 (5.4%) |
Income Below Poverty Among Single-Parent Households in Midway
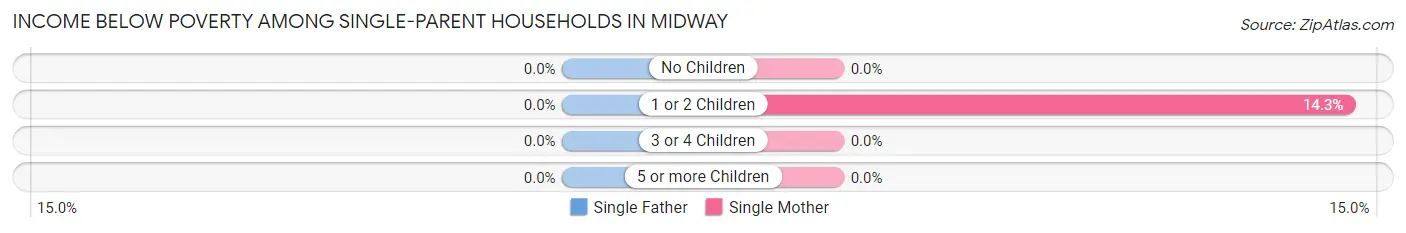
| Children | Single Father | Single Mother |
| No Children | 0 (0.0%) | 0 (0.0%) |
| 1 or 2 Children | 0 (0.0%) | 1 (14.3%) |
| 3 or 4 Children | 0 (0.0%) | 0 (0.0%) |
| 5 or more Children | 0 (0.0%) | 0 (0.0%) |
| Total | 0 (0.0%) | 1 (7.7%) |
Income Below Poverty Among Married-Couple vs Single-Parent Households in Midway
The poverty data for Midway shows that 2 of the married-couple family households (5.4%) and 1 of the single-parent households (2.9%) are living below the poverty level. Within the married-couple family households, those with 1 or 2 children have the highest poverty rate, with 2 households (18.2%) falling below the poverty line. Among the single-parent households, those with 1 or 2 children have the highest poverty rate, with 1 household (8.3%) living below poverty.
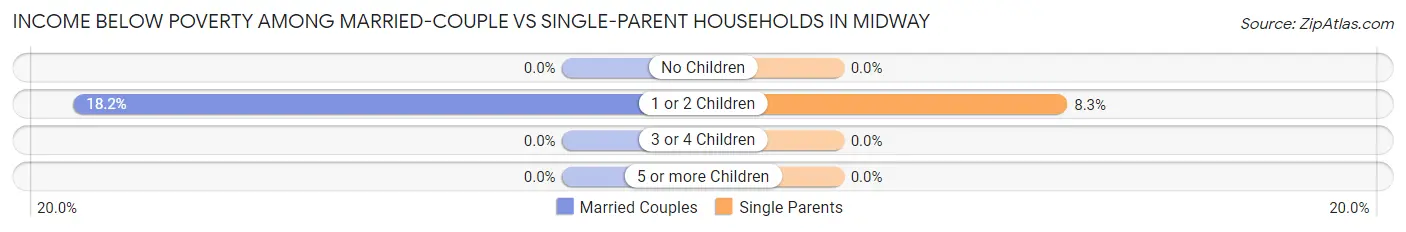
| Children | Married-Couple Families | Single-Parent Households |
| No Children | 0 (0.0%) | 0 (0.0%) |
| 1 or 2 Children | 2 (18.2%) | 1 (8.3%) |
| 3 or 4 Children | 0 (0.0%) | 0 (0.0%) |
| 5 or more Children | 0 (0.0%) | 0 (0.0%) |
| Total | 2 (5.4%) | 1 (2.9%) |
Race in Midway
The most populous races in Midway are White / Caucasian (252 | 98.1%), Hispanic or Latino (18 | 7.0%), and Some other Race (4 | 1.6%).
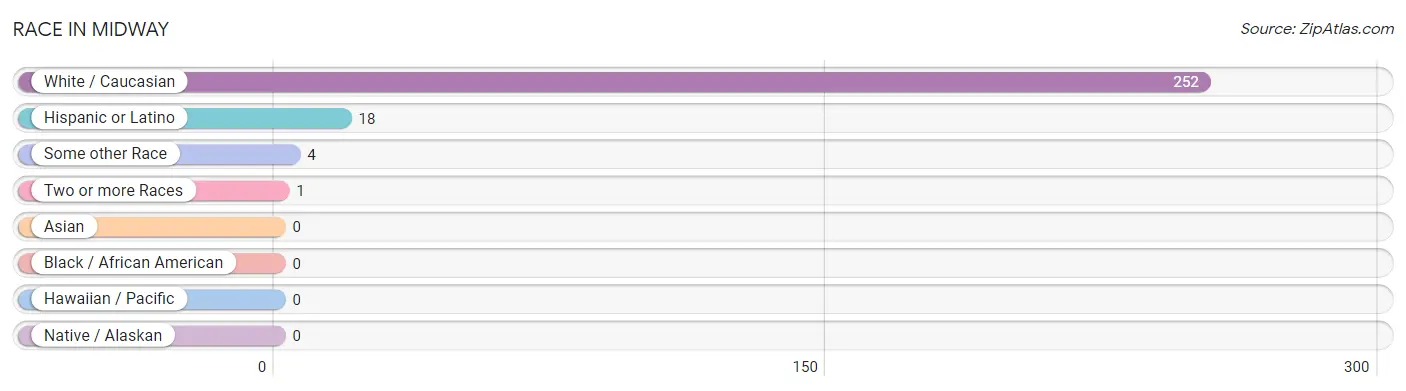
| Race | # Population | % Population |
| Asian | 0 | 0.0% |
| Black / African American | 0 | 0.0% |
| Hawaiian / Pacific | 0 | 0.0% |
| Hispanic or Latino | 18 | 7.0% |
| Native / Alaskan | 0 | 0.0% |
| White / Caucasian | 252 | 98.1% |
| Two or more Races | 1 | 0.4% |
| Some other Race | 4 | 1.6% |
| Total | 257 | 100.0% |
Ancestry in Midway
The most populous ancestries reported in Midway are American (92 | 35.8%), German (60 | 23.4%), Irish (44 | 17.1%), English (31 | 12.1%), and Central American (18 | 7.0%), together accounting for 95.3% of all Midway residents.
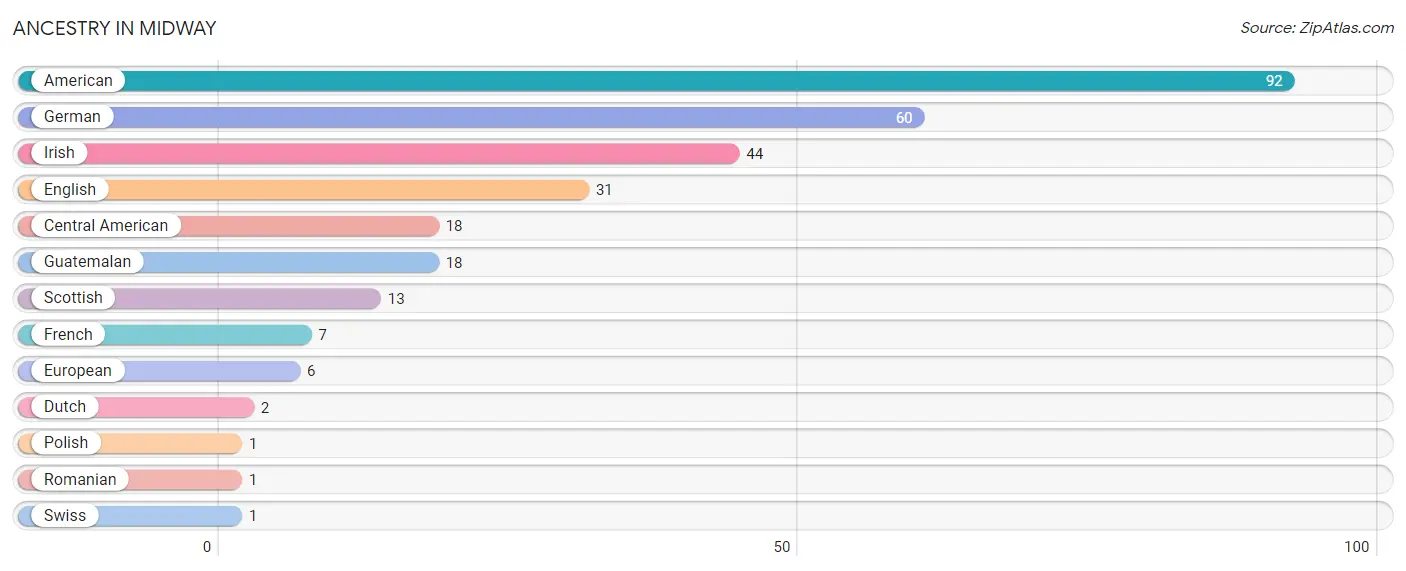
| Ancestry | # Population | % Population |
| American | 92 | 35.8% |
| Central American | 18 | 7.0% |
| Dutch | 2 | 0.8% |
| English | 31 | 12.1% |
| European | 6 | 2.3% |
| French | 7 | 2.7% |
| German | 60 | 23.4% |
| Guatemalan | 18 | 7.0% |
| Irish | 44 | 17.1% |
| Polish | 1 | 0.4% |
| Romanian | 1 | 0.4% |
| Scottish | 13 | 5.1% |
| Swiss | 1 | 0.4% | View All 13 Rows |
Immigrants in Midway
The most numerous immigrant groups reported in Midway came from Central America (5 | 1.9%), Guatemala (5 | 1.9%), and Latin America (5 | 1.9%), together accounting for 5.8% of all Midway residents.
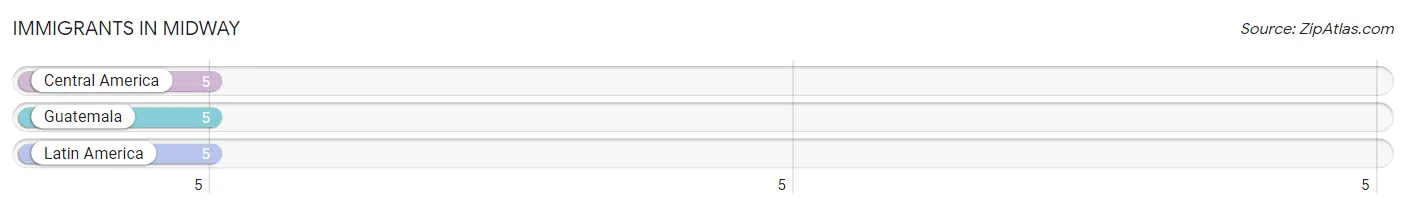
| Immigration Origin | # Population | % Population |
| Central America | 5 | 1.9% |
| Guatemala | 5 | 1.9% |
| Latin America | 5 | 1.9% | View All 3 Rows |
Sex and Age in Midway
Sex and Age in Midway
The most populous age groups in Midway are 5 to 9 Years (14 | 11.2%) for men and 5 to 9 Years (16 | 12.1%) for women.
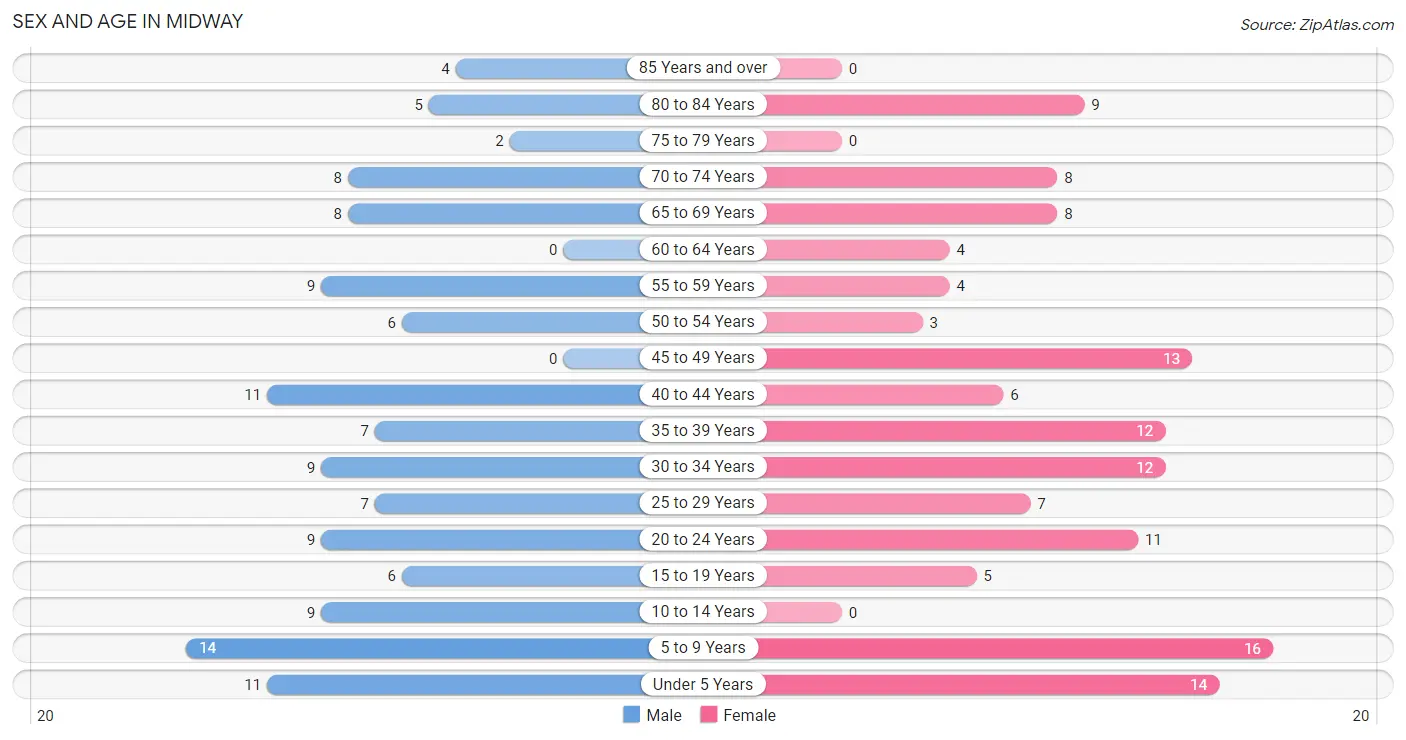
| Age Bracket | Male | Female |
| Under 5 Years | 11 (8.8%) | 14 (10.6%) |
| 5 to 9 Years | 14 (11.2%) | 16 (12.1%) |
| 10 to 14 Years | 9 (7.2%) | 0 (0.0%) |
| 15 to 19 Years | 6 (4.8%) | 5 (3.8%) |
| 20 to 24 Years | 9 (7.2%) | 11 (8.3%) |
| 25 to 29 Years | 7 (5.6%) | 7 (5.3%) |
| 30 to 34 Years | 9 (7.2%) | 12 (9.1%) |
| 35 to 39 Years | 7 (5.6%) | 12 (9.1%) |
| 40 to 44 Years | 11 (8.8%) | 6 (4.5%) |
| 45 to 49 Years | 0 (0.0%) | 13 (9.9%) |
| 50 to 54 Years | 6 (4.8%) | 3 (2.3%) |
| 55 to 59 Years | 9 (7.2%) | 4 (3.0%) |
| 60 to 64 Years | 0 (0.0%) | 4 (3.0%) |
| 65 to 69 Years | 8 (6.4%) | 8 (6.1%) |
| 70 to 74 Years | 8 (6.4%) | 8 (6.1%) |
| 75 to 79 Years | 2 (1.6%) | 0 (0.0%) |
| 80 to 84 Years | 5 (4.0%) | 9 (6.8%) |
| 85 Years and over | 4 (3.2%) | 0 (0.0%) |
| Total | 125 (100.0%) | 132 (100.0%) |
Families and Households in Midway
Median Family Size in Midway
The median family size in Midway is 2.99 persons per family, with single male/father families (21 | 29.6%) accounting for the largest median family size of 3.14 persons per family. On the other hand, single female/mother families (13 | 18.3%) represent the smallest median family size with 2.85 persons per family.
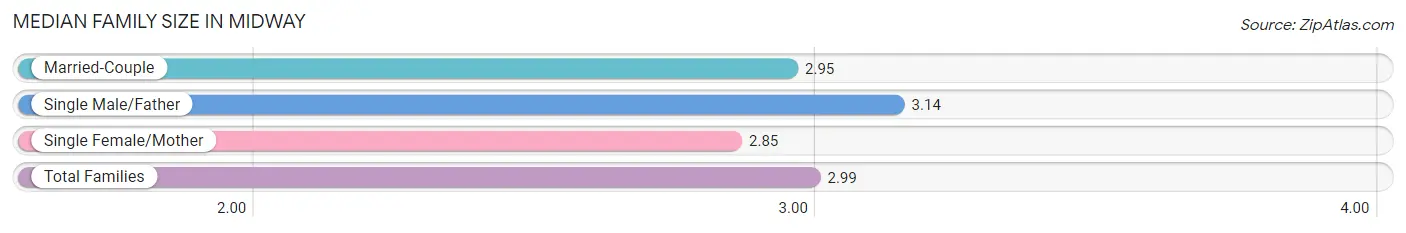
| Family Type | # Families | Family Size |
| Married-Couple | 37 (52.1%) | 2.95 |
| Single Male/Father | 21 (29.6%) | 3.14 |
| Single Female/Mother | 13 (18.3%) | 2.85 |
| Total Families | 71 (100.0%) | 2.99 |
Median Household Size in Midway
The median household size in Midway is 2.73 persons per household, with single male/father households (21 | 22.3%) accounting for the largest median household size of 3.76 persons per household. non-family households (23 | 24.5%) represent the smallest median household size with 1.04 persons per household.
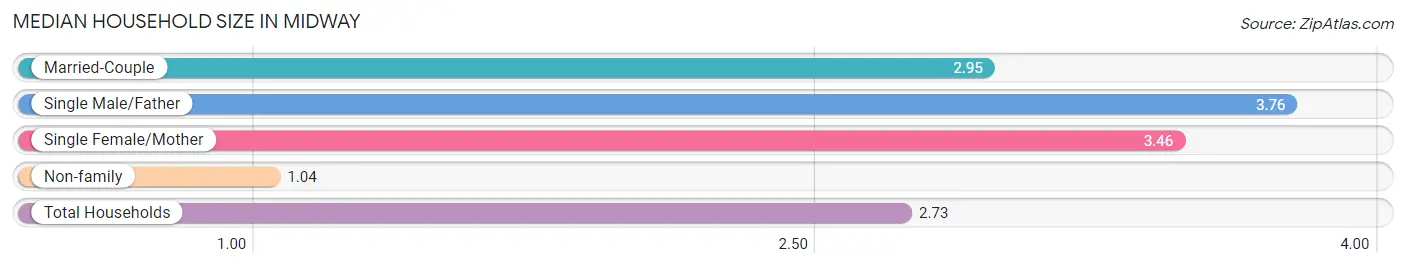
| Household Type | # Households | Household Size |
| Married-Couple | 37 (39.4%) | 2.95 |
| Single Male/Father | 21 (22.3%) | 3.76 |
| Single Female/Mother | 13 (13.8%) | 3.46 |
| Non-family | 23 (24.5%) | 1.04 |
| Total Households | 94 (100.0%) | 2.73 |
Household Size by Marriage Status in Midway
Out of a total of 94 households in Midway, 71 (75.5%) are family households, while 23 (24.5%) are nonfamily households. The most numerous type of family households are 2-person households, comprising 36, and the most common type of nonfamily households are 1-person households, comprising 21.
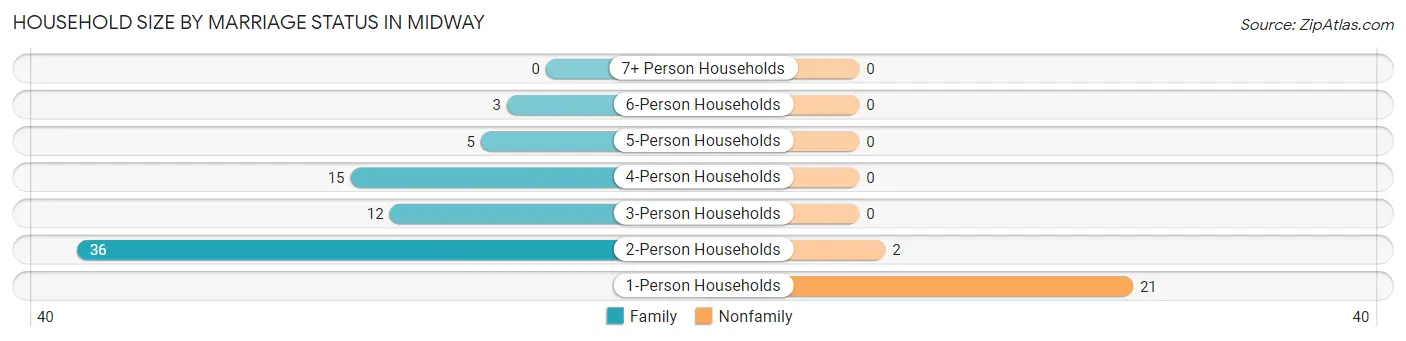
| Household Size | Family Households | Nonfamily Households |
| 1-Person Households | - | 21 (22.3%) |
| 2-Person Households | 36 (38.3%) | 2 (2.1%) |
| 3-Person Households | 12 (12.8%) | 0 (0.0%) |
| 4-Person Households | 15 (16.0%) | 0 (0.0%) |
| 5-Person Households | 5 (5.3%) | 0 (0.0%) |
| 6-Person Households | 3 (3.2%) | 0 (0.0%) |
| 7+ Person Households | 0 (0.0%) | 0 (0.0%) |
| Total | 71 (75.5%) | 23 (24.5%) |
Female Fertility in Midway
Fertility by Age in Midway
Average fertility rate in Midway is 90.0 births per 1,000 women. Women in the age bracket of 20 to 34 years have the highest fertility rate with 200.0 births per 1,000 women. Women in the age bracket of 20 to 34 years acount for 100.0% of all women with births.
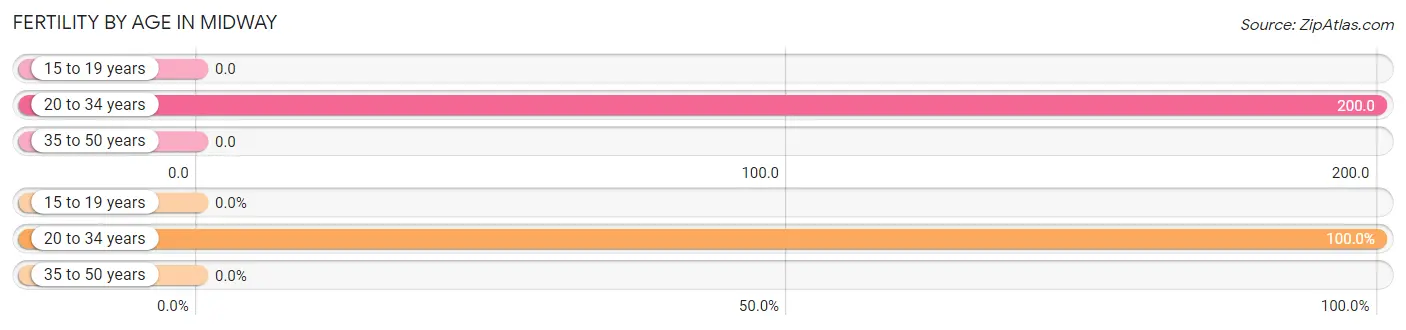
| Age Bracket | Women with Births | Births / 1,000 Women |
| 15 to 19 years | 0 (0.0%) | 0.0 |
| 20 to 34 years | 6 (100.0%) | 200.0 |
| 35 to 50 years | 0 (0.0%) | 0.0 |
| Total | 6 (100.0%) | 90.0 |
Fertility by Age by Marriage Status in Midway
16.7% of women with births (6) in Midway are married. The highest percentage of unmarried women with births falls into 20 to 34 years age bracket with 83.3% of them unmarried at the time of birth, while the lowest percentage of unmarried women with births belong to 20 to 34 years age bracket with 83.3% of them unmarried.
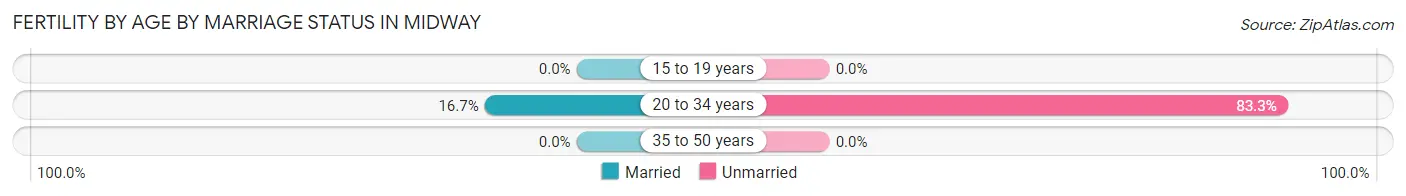
| Age Bracket | Married | Unmarried |
| 15 to 19 years | 0 (0.0%) | 0 (0.0%) |
| 20 to 34 years | 1 (16.7%) | 5 (83.3%) |
| 35 to 50 years | 0 (0.0%) | 0 (0.0%) |
| Total | 1 (16.7%) | 5 (83.3%) |
Fertility by Education in Midway
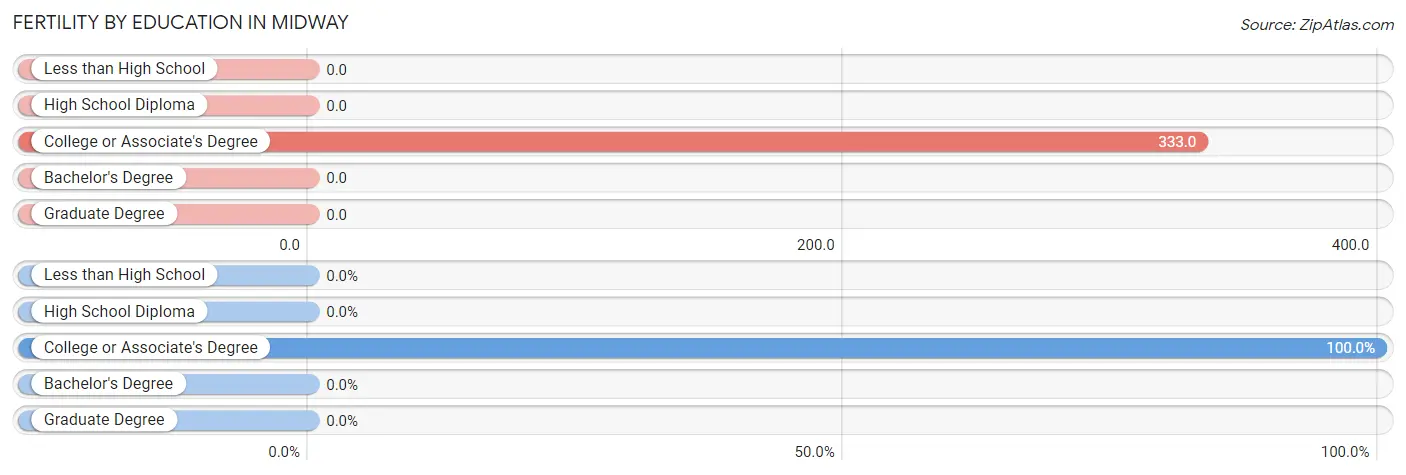
| Educational Attainment | Women with Births | Births / 1,000 Women |
| Less than High School | 0 (0.0%) | 0.0 |
| High School Diploma | 0 (0.0%) | 0.0 |
| College or Associate's Degree | 6 (100.0%) | 333.0 |
| Bachelor's Degree | 0 (0.0%) | 0.0 |
| Graduate Degree | 0 (0.0%) | 0.0 |
| Total | 6 (100.0%) | 90.0 |
Fertility by Education by Marriage Status in Midway
83.3% of women with births in Midway are unmarried. Women with the educational attainment of college or associate's degree are most likely to be married with 16.7% of them married at childbirth, while women with the educational attainment of college or associate's degree are least likely to be married with 83.3% of them unmarried at childbirth.
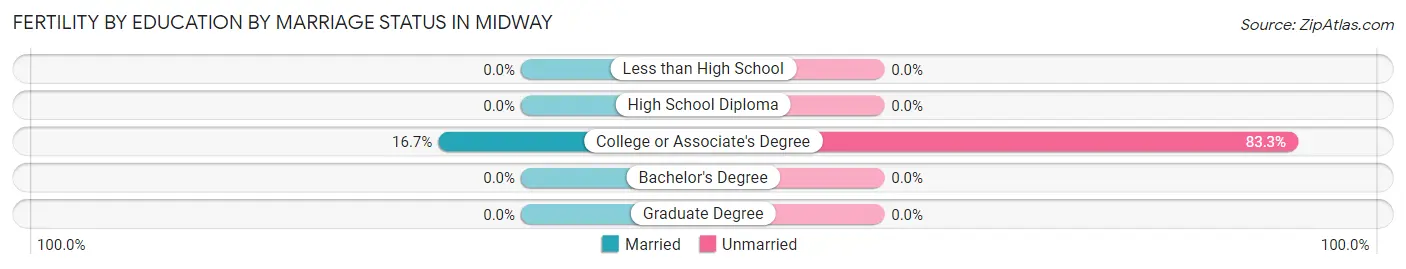
| Educational Attainment | Married | Unmarried |
| Less than High School | 0 (0.0%) | 0 (0.0%) |
| High School Diploma | 0 (0.0%) | 0 (0.0%) |
| College or Associate's Degree | 1 (16.7%) | 5 (83.3%) |
| Bachelor's Degree | 0 (0.0%) | 0 (0.0%) |
| Graduate Degree | 0 (0.0%) | 0 (0.0%) |
| Total | 1 (16.7%) | 5 (83.3%) |
Employment Characteristics in Midway
Employment by Class of Employer in Midway
Among the 110 employed individuals in Midway, private company employees (79 | 71.8%), local government employees (11 | 10.0%), and self-employed (not incorporated) (8 | 7.3%) make up the most common classes of employment.
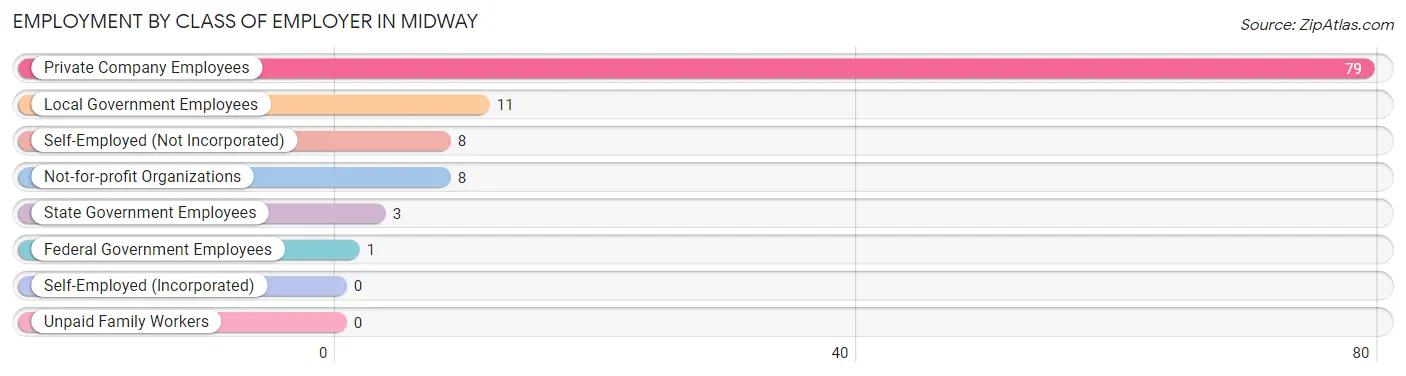
| Employer Class | # Employees | % Employees |
| Private Company Employees | 79 | 71.8% |
| Self-Employed (Incorporated) | 0 | 0.0% |
| Self-Employed (Not Incorporated) | 8 | 7.3% |
| Not-for-profit Organizations | 8 | 7.3% |
| Local Government Employees | 11 | 10.0% |
| State Government Employees | 3 | 2.7% |
| Federal Government Employees | 1 | 0.9% |
| Unpaid Family Workers | 0 | 0.0% |
| Total | 110 | 100.0% |
Employment Status by Age in Midway
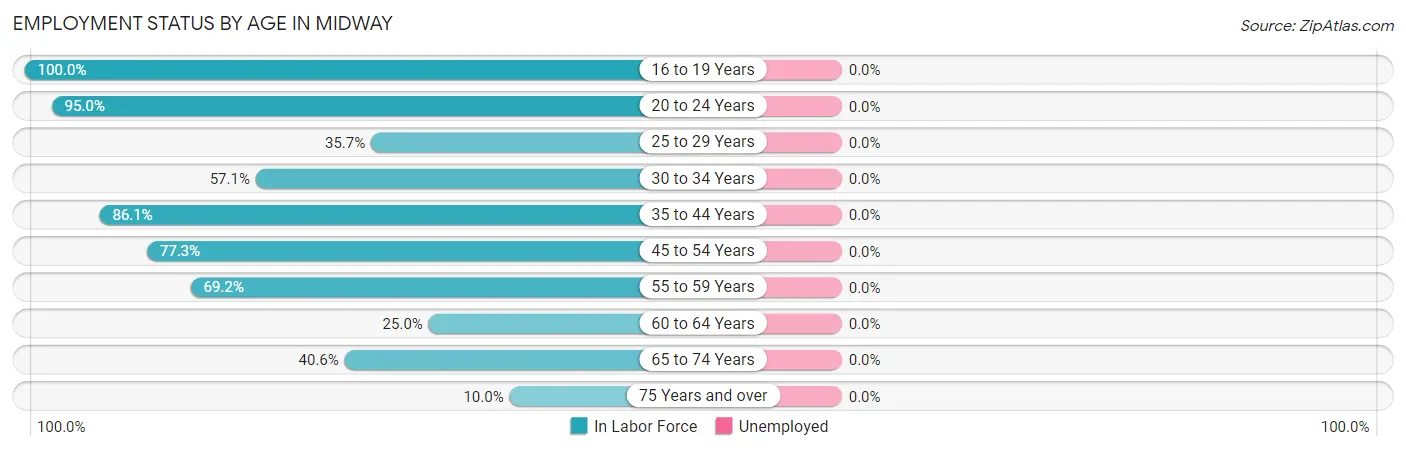
| Age Bracket | In Labor Force | Unemployed |
| 16 to 19 Years | 4 (100.0%) | 0 (0.0%) |
| 20 to 24 Years | 19 (95.0%) | 0 (0.0%) |
| 25 to 29 Years | 5 (35.7%) | 0 (0.0%) |
| 30 to 34 Years | 12 (57.1%) | 0 (0.0%) |
| 35 to 44 Years | 31 (86.1%) | 0 (0.0%) |
| 45 to 54 Years | 17 (77.3%) | 0 (0.0%) |
| 55 to 59 Years | 9 (69.2%) | 0 (0.0%) |
| 60 to 64 Years | 1 (25.0%) | 0 (0.0%) |
| 65 to 74 Years | 13 (40.6%) | 0 (0.0%) |
| 75 Years and over | 2 (10.0%) | 0 (0.0%) |
| Total | 113 (60.8%) | 0 (0.0%) |
Employment Status by Educational Attainment in Midway
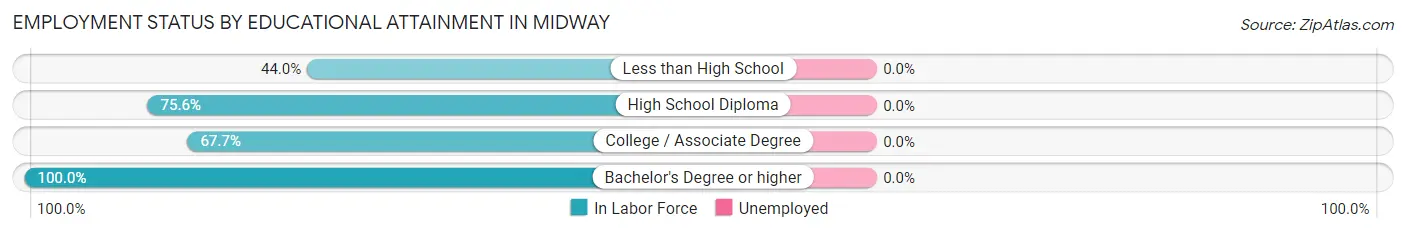
| Educational Attainment | In Labor Force | Unemployed |
| Less than High School | 11 (44.0%) | 0 (0.0%) |
| High School Diploma | 34 (75.6%) | 0 (0.0%) |
| College / Associate Degree | 21 (67.7%) | 0 (0.0%) |
| Bachelor's Degree or higher | 9 (100.0%) | 0 (0.0%) |
| Total | 75 (68.2%) | 0 (0.0%) |
Employment Occupations by Sex in Midway
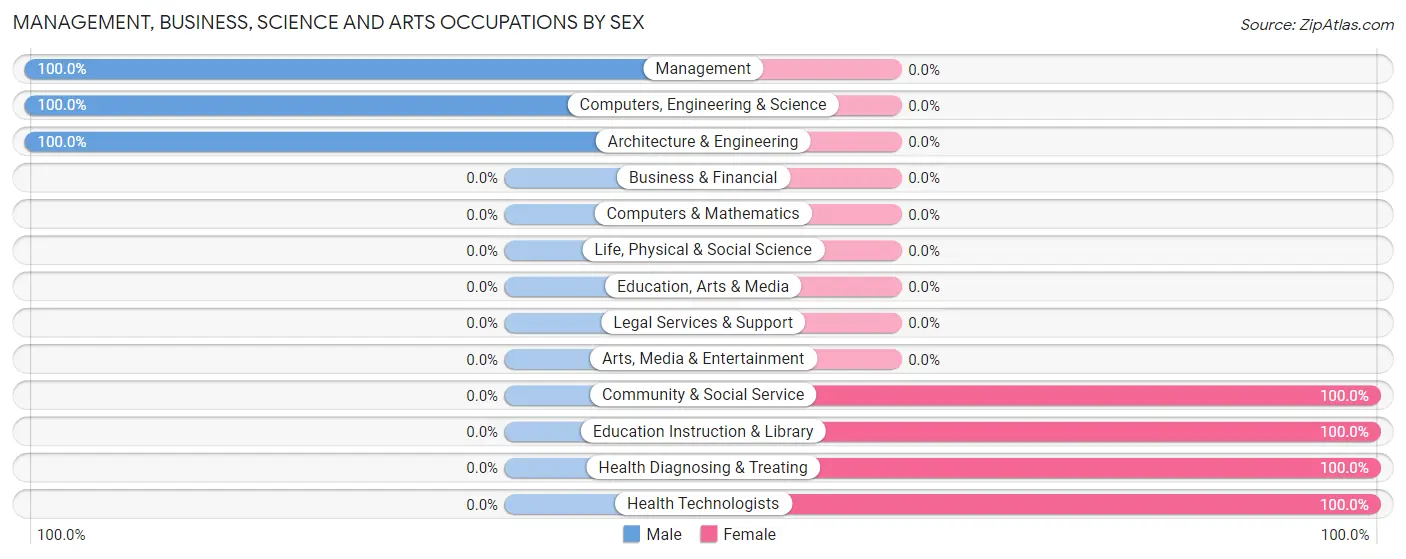
Management, Business, Science and Arts Occupations
The most common Management, Business, Science and Arts occupations in Midway are Health Diagnosing & Treating (8 | 7.1%), Management (7 | 6.2%), Community & Social Service (6 | 5.3%), Education Instruction & Library (6 | 5.3%), and Health Technologists (2 | 1.8%).
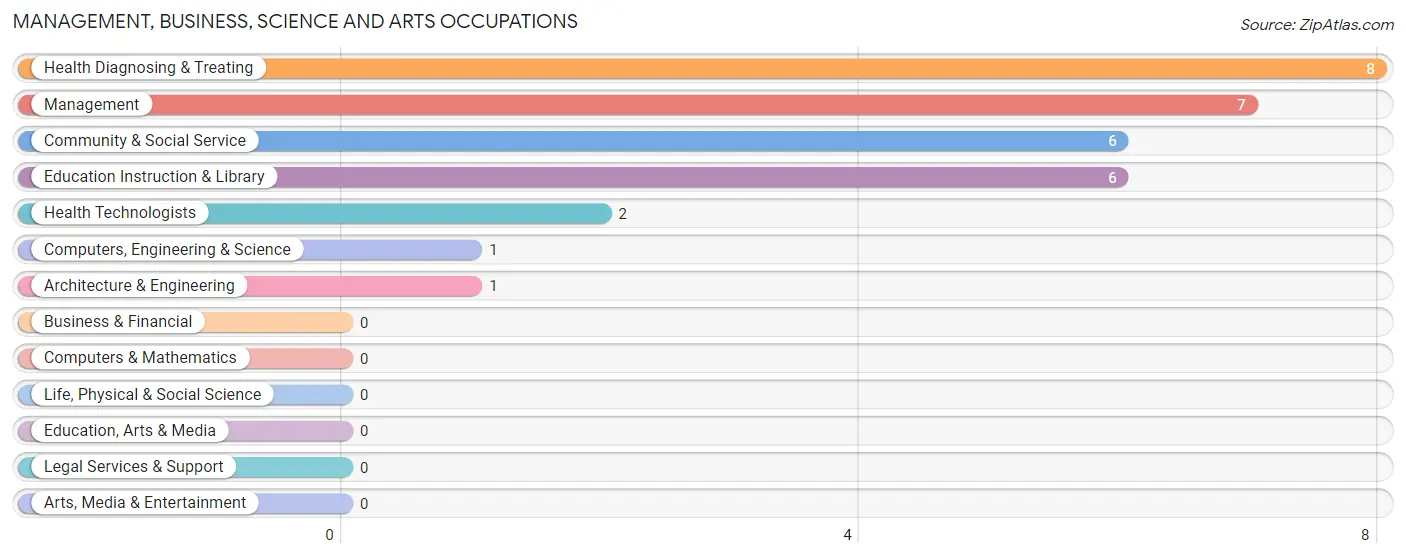
Management, Business, Science and Arts Occupations by Sex
Within the Management, Business, Science and Arts occupations in Midway, the most male-oriented occupations are Management (100.0%), Computers, Engineering & Science (100.0%), and Architecture & Engineering (100.0%), while the most female-oriented occupations are Community & Social Service (100.0%), Education Instruction & Library (100.0%), and Health Diagnosing & Treating (100.0%).
| Occupation | Male | Female |
| Management | 7 (100.0%) | 0 (0.0%) |
| Business & Financial | 0 (0.0%) | 0 (0.0%) |
| Computers, Engineering & Science | 1 (100.0%) | 0 (0.0%) |
| Computers & Mathematics | 0 (0.0%) | 0 (0.0%) |
| Architecture & Engineering | 1 (100.0%) | 0 (0.0%) |
| Life, Physical & Social Science | 0 (0.0%) | 0 (0.0%) |
| Community & Social Service | 0 (0.0%) | 6 (100.0%) |
| Education, Arts & Media | 0 (0.0%) | 0 (0.0%) |
| Legal Services & Support | 0 (0.0%) | 0 (0.0%) |
| Education Instruction & Library | 0 (0.0%) | 6 (100.0%) |
| Arts, Media & Entertainment | 0 (0.0%) | 0 (0.0%) |
| Health Diagnosing & Treating | 0 (0.0%) | 8 (100.0%) |
| Health Technologists | 0 (0.0%) | 2 (100.0%) |
| Total (Category) | 8 (36.4%) | 14 (63.6%) |
| Total (Overall) | 64 (56.6%) | 49 (43.4%) |
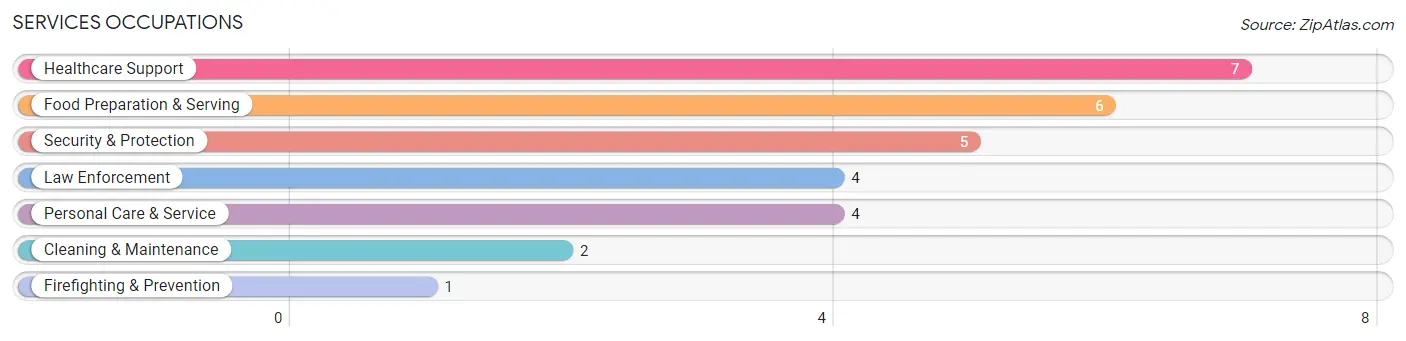
Services Occupations
The most common Services occupations in Midway are Healthcare Support (7 | 6.2%), Food Preparation & Serving (6 | 5.3%), Security & Protection (5 | 4.4%), Law Enforcement (4 | 3.5%), and Personal Care & Service (4 | 3.5%).
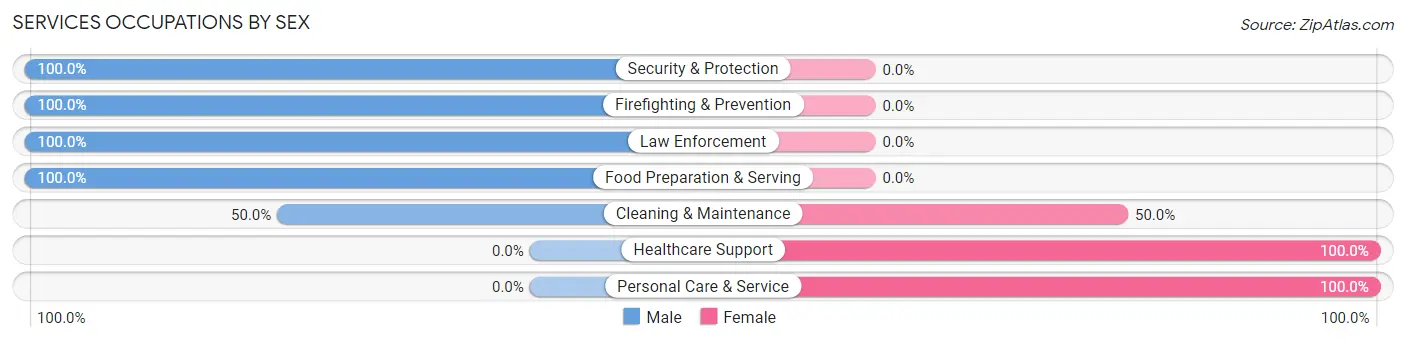
Services Occupations by Sex
Within the Services occupations in Midway, the most male-oriented occupations are Security & Protection (100.0%), Firefighting & Prevention (100.0%), and Law Enforcement (100.0%), while the most female-oriented occupations are Healthcare Support (100.0%), Personal Care & Service (100.0%), and Cleaning & Maintenance (50.0%).
| Occupation | Male | Female |
| Healthcare Support | 0 (0.0%) | 7 (100.0%) |
| Security & Protection | 5 (100.0%) | 0 (0.0%) |
| Firefighting & Prevention | 1 (100.0%) | 0 (0.0%) |
| Law Enforcement | 4 (100.0%) | 0 (0.0%) |
| Food Preparation & Serving | 6 (100.0%) | 0 (0.0%) |
| Cleaning & Maintenance | 1 (50.0%) | 1 (50.0%) |
| Personal Care & Service | 0 (0.0%) | 4 (100.0%) |
| Total (Category) | 12 (50.0%) | 12 (50.0%) |
| Total (Overall) | 64 (56.6%) | 49 (43.4%) |
Sales and Office Occupations
The most common Sales and Office occupations in Midway are Office & Administration (18 | 15.9%), and Sales & Related (12 | 10.6%).

Sales and Office Occupations by Sex

| Occupation | Male | Female |
| Sales & Related | 12 (100.0%) | 0 (0.0%) |
| Office & Administration | 4 (22.2%) | 14 (77.8%) |
| Total (Category) | 16 (53.3%) | 14 (46.7%) |
| Total (Overall) | 64 (56.6%) | 49 (43.4%) |
Natural Resources, Construction and Maintenance Occupations
The most common Natural Resources, Construction and Maintenance occupations in Midway are Installation, Maintenance & Repair (13 | 11.5%), Farming, Fishing & Forestry (1 | 0.9%), and Construction & Extraction (1 | 0.9%).

Natural Resources, Construction and Maintenance Occupations by Sex

| Occupation | Male | Female |
| Farming, Fishing & Forestry | 1 (100.0%) | 0 (0.0%) |
| Construction & Extraction | 1 (100.0%) | 0 (0.0%) |
| Installation, Maintenance & Repair | 13 (100.0%) | 0 (0.0%) |
| Total (Category) | 15 (100.0%) | 0 (0.0%) |
| Total (Overall) | 64 (56.6%) | 49 (43.4%) |
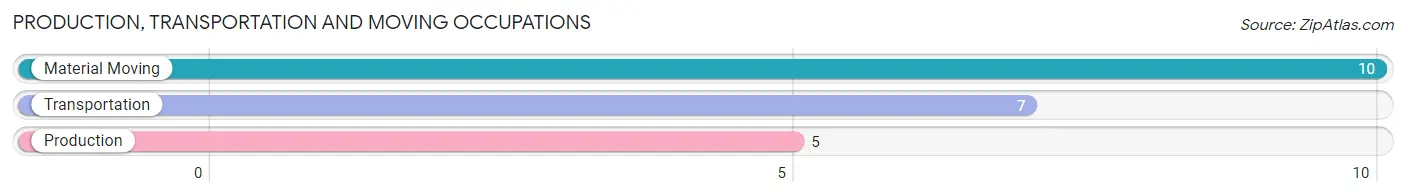
Production, Transportation and Moving Occupations
The most common Production, Transportation and Moving occupations in Midway are Material Moving (10 | 8.8%), Transportation (7 | 6.2%), and Production (5 | 4.4%).
Production, Transportation and Moving Occupations by Sex
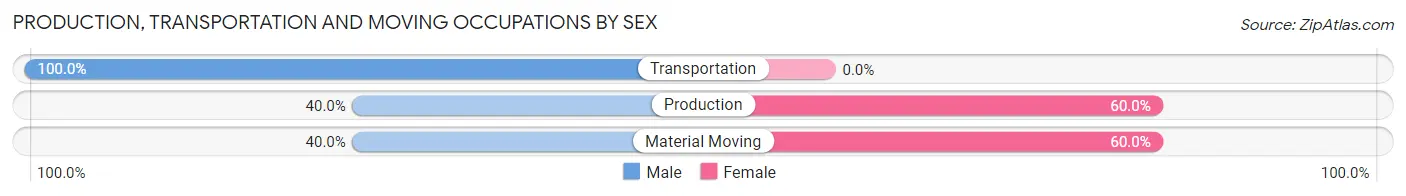
| Occupation | Male | Female |
| Production | 2 (40.0%) | 3 (60.0%) |
| Transportation | 7 (100.0%) | 0 (0.0%) |
| Material Moving | 4 (40.0%) | 6 (60.0%) |
| Total (Category) | 13 (59.1%) | 9 (40.9%) |
| Total (Overall) | 64 (56.6%) | 49 (43.4%) |
Employment Industries by Sex in Midway
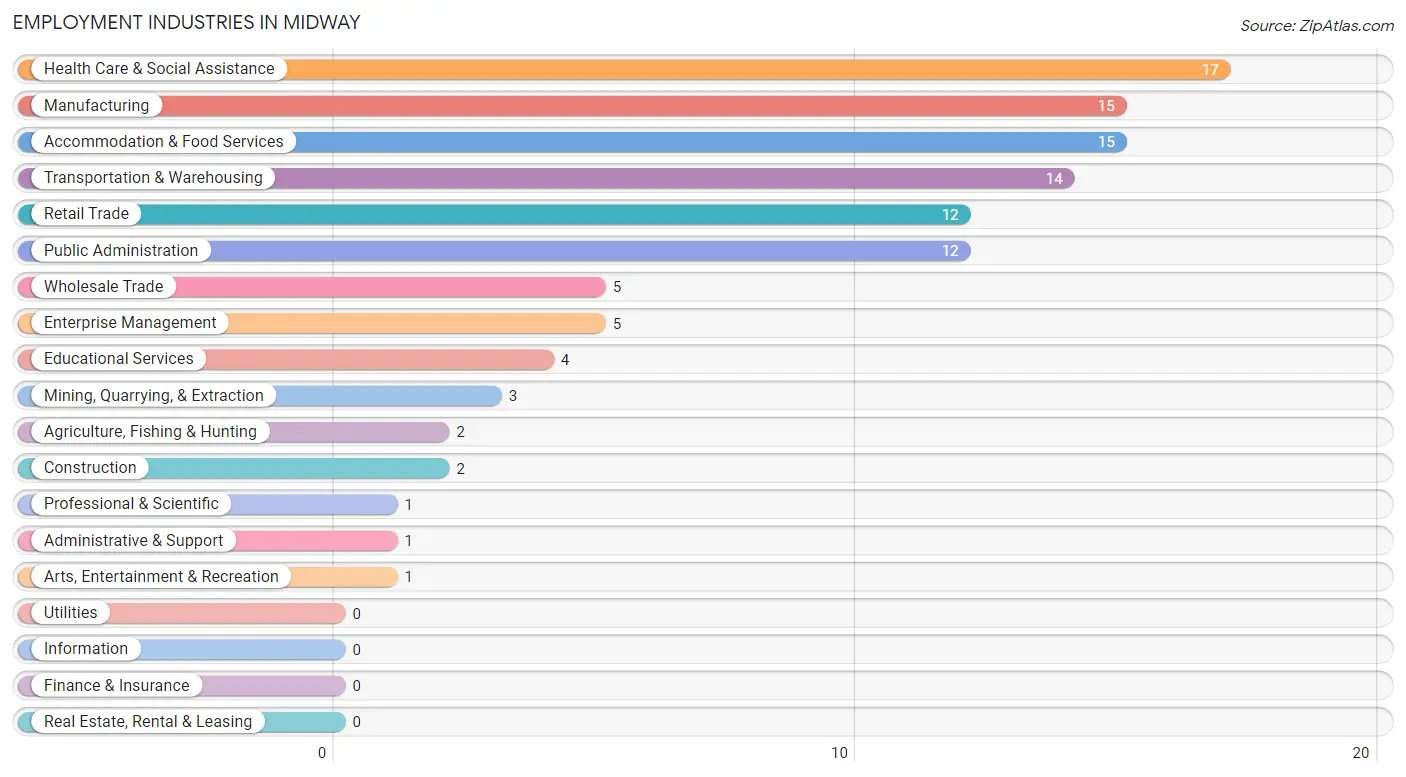
Employment Industries in Midway
The major employment industries in Midway include Health Care & Social Assistance (17 | 15.0%), Manufacturing (15 | 13.3%), Accommodation & Food Services (15 | 13.3%), Transportation & Warehousing (14 | 12.4%), and Retail Trade (12 | 10.6%).
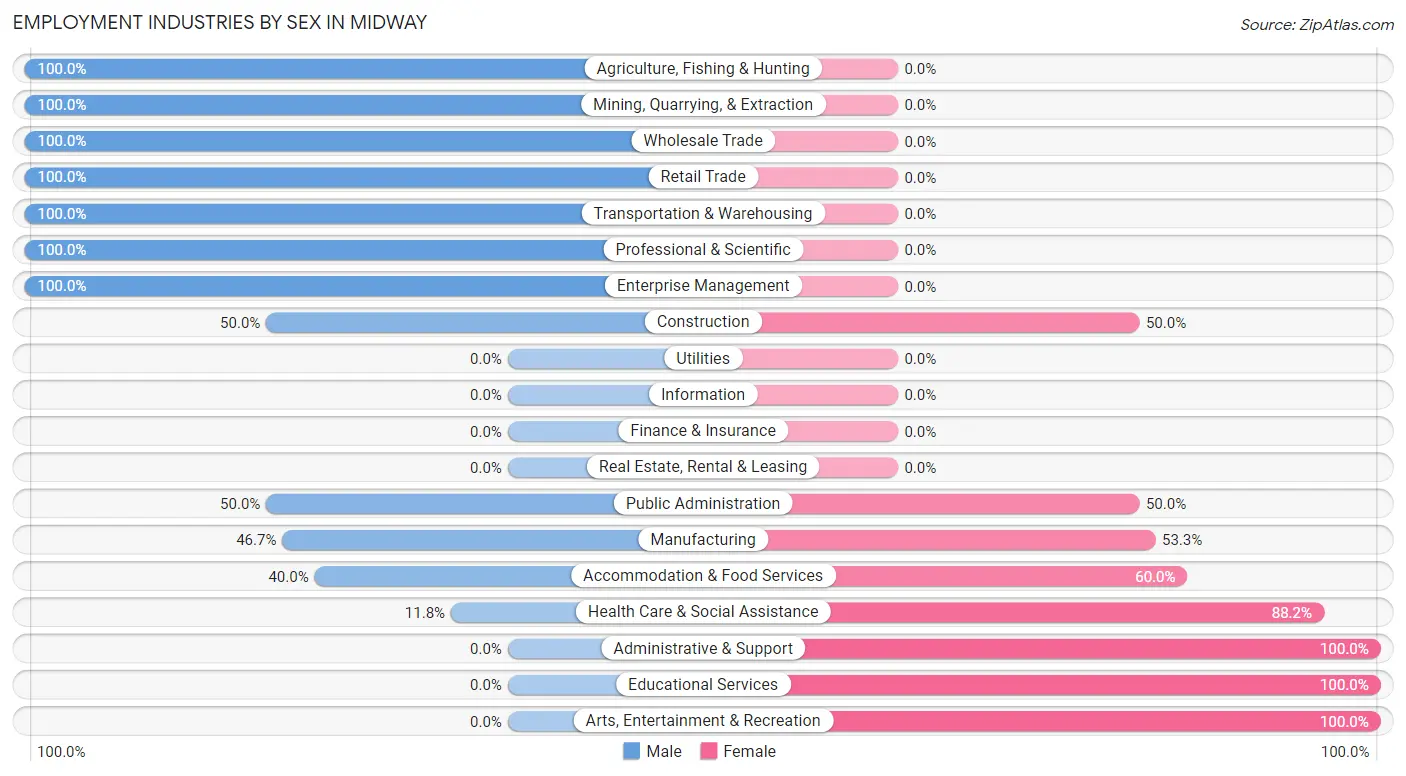
Employment Industries by Sex in Midway
The Midway industries that see more men than women are Agriculture, Fishing & Hunting (100.0%), Mining, Quarrying, & Extraction (100.0%), and Wholesale Trade (100.0%), whereas the industries that tend to have a higher number of women are Administrative & Support (100.0%), Educational Services (100.0%), and Arts, Entertainment & Recreation (100.0%).
| Industry | Male | Female |
| Agriculture, Fishing & Hunting | 2 (100.0%) | 0 (0.0%) |
| Mining, Quarrying, & Extraction | 3 (100.0%) | 0 (0.0%) |
| Construction | 1 (50.0%) | 1 (50.0%) |
| Manufacturing | 7 (46.7%) | 8 (53.3%) |
| Wholesale Trade | 5 (100.0%) | 0 (0.0%) |
| Retail Trade | 12 (100.0%) | 0 (0.0%) |
| Transportation & Warehousing | 14 (100.0%) | 0 (0.0%) |
| Utilities | 0 (0.0%) | 0 (0.0%) |
| Information | 0 (0.0%) | 0 (0.0%) |
| Finance & Insurance | 0 (0.0%) | 0 (0.0%) |
| Real Estate, Rental & Leasing | 0 (0.0%) | 0 (0.0%) |
| Professional & Scientific | 1 (100.0%) | 0 (0.0%) |
| Enterprise Management | 5 (100.0%) | 0 (0.0%) |
| Administrative & Support | 0 (0.0%) | 1 (100.0%) |
| Educational Services | 0 (0.0%) | 4 (100.0%) |
| Health Care & Social Assistance | 2 (11.8%) | 15 (88.2%) |
| Arts, Entertainment & Recreation | 0 (0.0%) | 1 (100.0%) |
| Accommodation & Food Services | 6 (40.0%) | 9 (60.0%) |
| Public Administration | 6 (50.0%) | 6 (50.0%) |
| Total | 64 (56.6%) | 49 (43.4%) |
Education in Midway
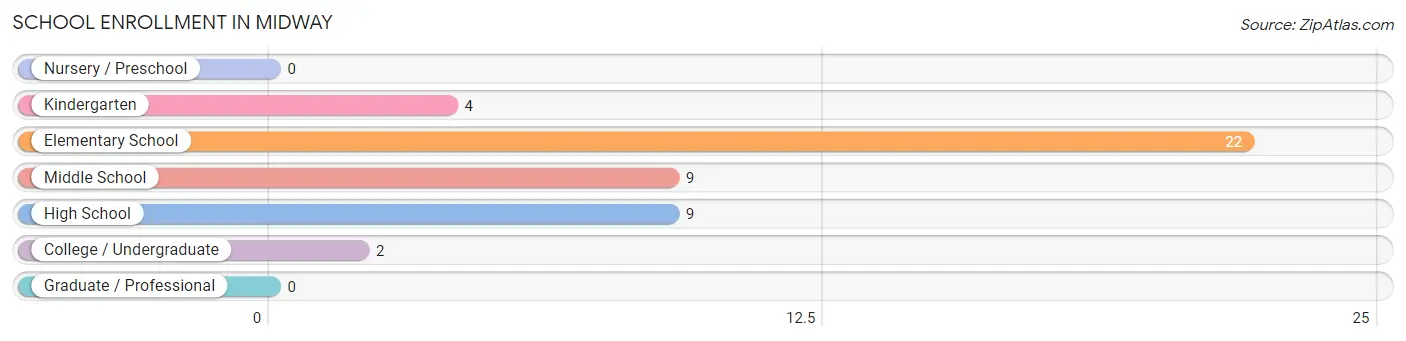
School Enrollment in Midway
The most common levels of schooling among the 46 students in Midway are elementary school (22 | 47.8%), middle school (9 | 19.6%), and high school (9 | 19.6%).
| School Level | # Students | % Students |
| Nursery / Preschool | 0 | 0.0% |
| Kindergarten | 4 | 8.7% |
| Elementary School | 22 | 47.8% |
| Middle School | 9 | 19.6% |
| High School | 9 | 19.6% |
| College / Undergraduate | 2 | 4.3% |
| Graduate / Professional | 0 | 0.0% |
| Total | 46 | 100.0% |
School Enrollment by Age by Funding Source in Midway
Out of a total of 46 students who are enrolled in schools in Midway, 4 (8.7%) attend a private institution, while the remaining 42 (91.3%) are enrolled in public schools. The age group of 5 to 9 year old has the highest likelihood of being enrolled in private schools, with 4 (15.4% in the age bracket) enrolled. Conversely, the age group of 10 to 14 year olds has the lowest likelihood of being enrolled in a private school, with 9 (100.0% in the age bracket) attending a public institution.
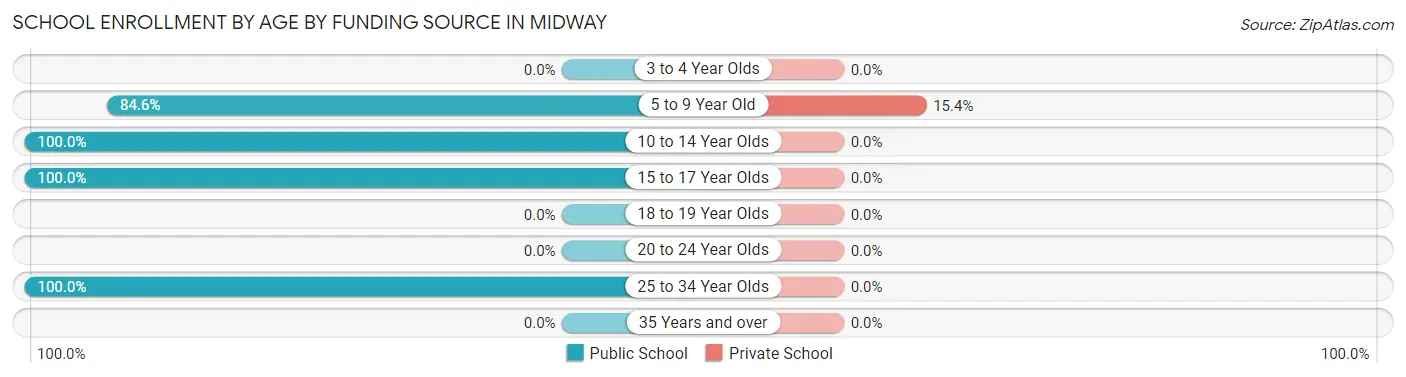
| Age Bracket | Public School | Private School |
| 3 to 4 Year Olds | 0 (0.0%) | 0 (0.0%) |
| 5 to 9 Year Old | 22 (84.6%) | 4 (15.4%) |
| 10 to 14 Year Olds | 9 (100.0%) | 0 (0.0%) |
| 15 to 17 Year Olds | 9 (100.0%) | 0 (0.0%) |
| 18 to 19 Year Olds | 0 (0.0%) | 0 (0.0%) |
| 20 to 24 Year Olds | 0 (0.0%) | 0 (0.0%) |
| 25 to 34 Year Olds | 2 (100.0%) | 0 (0.0%) |
| 35 Years and over | 0 (0.0%) | 0 (0.0%) |
| Total | 42 (91.3%) | 4 (8.7%) |
Educational Attainment by Field of Study in Midway
Bio, nature & agricultural (5 | 45.5%), science & technology (2 | 18.2%), arts & humanities (2 | 18.2%), psychology (1 | 9.1%), and business (1 | 9.1%) are the most common fields of study among 11 individuals in Midway who have obtained a bachelor's degree or higher.
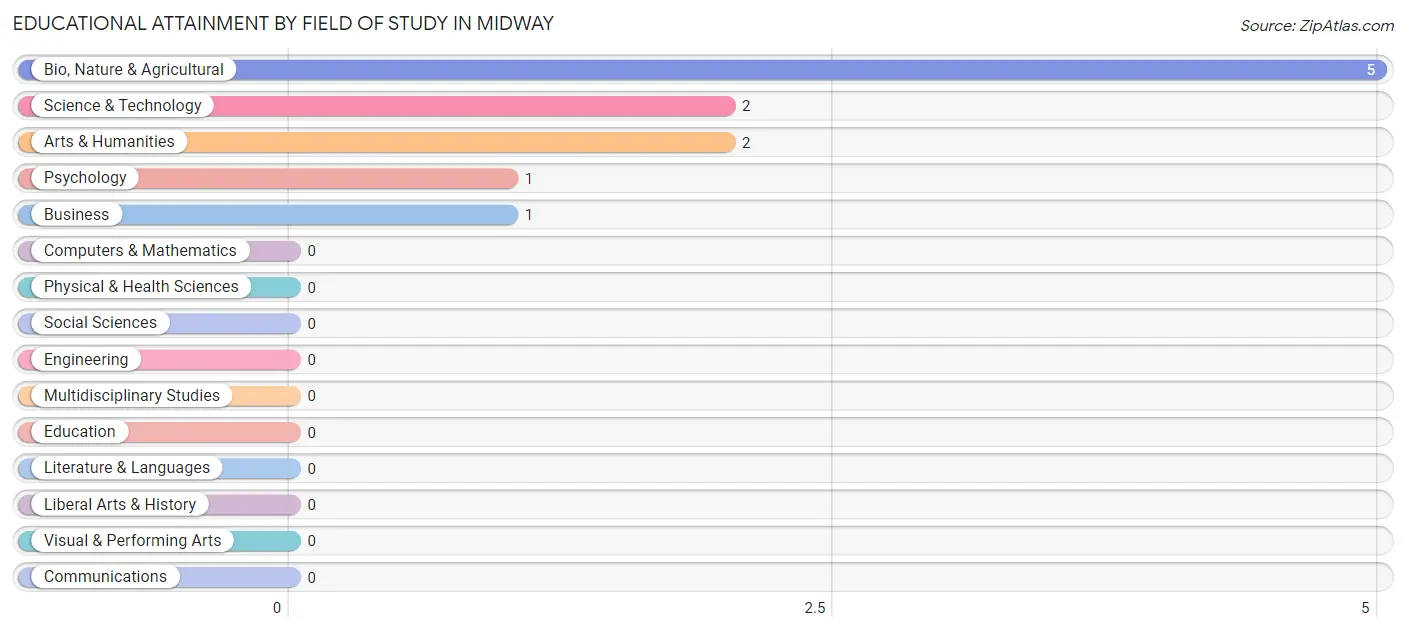
| Field of Study | # Graduates | % Graduates |
| Computers & Mathematics | 0 | 0.0% |
| Bio, Nature & Agricultural | 5 | 45.5% |
| Physical & Health Sciences | 0 | 0.0% |
| Psychology | 1 | 9.1% |
| Social Sciences | 0 | 0.0% |
| Engineering | 0 | 0.0% |
| Multidisciplinary Studies | 0 | 0.0% |
| Science & Technology | 2 | 18.2% |
| Business | 1 | 9.1% |
| Education | 0 | 0.0% |
| Literature & Languages | 0 | 0.0% |
| Liberal Arts & History | 0 | 0.0% |
| Visual & Performing Arts | 0 | 0.0% |
| Communications | 0 | 0.0% |
| Arts & Humanities | 2 | 18.2% |
| Total | 11 | 100.0% |
Transportation & Commute in Midway
Vehicle Availability by Sex in Midway
The most prevalent vehicle ownership categories in Midway are males with 2 vehicles (45, accounting for 73.8%) and females with 2 vehicles (36, making up 91.8%).
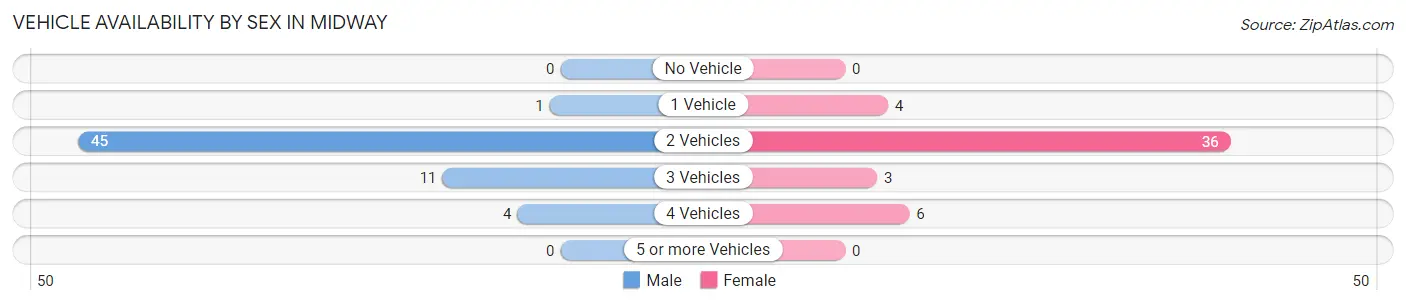
| Vehicles Available | Male | Female |
| No Vehicle | 0 (0.0%) | 0 (0.0%) |
| 1 Vehicle | 1 (1.6%) | 4 (8.2%) |
| 2 Vehicles | 45 (73.8%) | 36 (73.5%) |
| 3 Vehicles | 11 (18.0%) | 3 (6.1%) |
| 4 Vehicles | 4 (6.6%) | 6 (12.2%) |
| 5 or more Vehicles | 0 (0.0%) | 0 (0.0%) |
| Total | 61 (100.0%) | 49 (100.0%) |
Commute Time in Midway
The most frequently occuring commute durations in Midway are 25 to 29 minutes (22 commuters, 21.4%), 15 to 19 minutes (18 commuters, 17.5%), and 30 to 34 minutes (16 commuters, 15.5%).
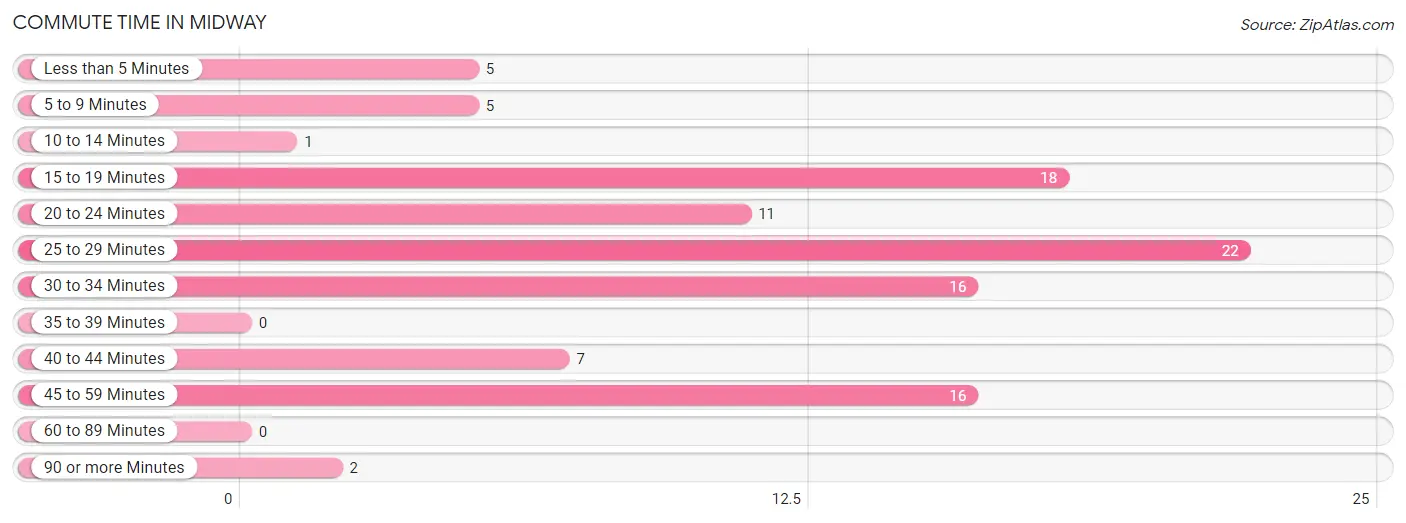
| Commute Time | # Commuters | % Commuters |
| Less than 5 Minutes | 5 | 4.9% |
| 5 to 9 Minutes | 5 | 4.9% |
| 10 to 14 Minutes | 1 | 1.0% |
| 15 to 19 Minutes | 18 | 17.5% |
| 20 to 24 Minutes | 11 | 10.7% |
| 25 to 29 Minutes | 22 | 21.4% |
| 30 to 34 Minutes | 16 | 15.5% |
| 35 to 39 Minutes | 0 | 0.0% |
| 40 to 44 Minutes | 7 | 6.8% |
| 45 to 59 Minutes | 16 | 15.5% |
| 60 to 89 Minutes | 0 | 0.0% |
| 90 or more Minutes | 2 | 1.9% |
Commute Time by Sex in Midway
The most common commute times in Midway are 25 to 29 minutes (14 commuters, 24.1%) for males and 15 to 19 minutes (12 commuters, 26.7%) for females.
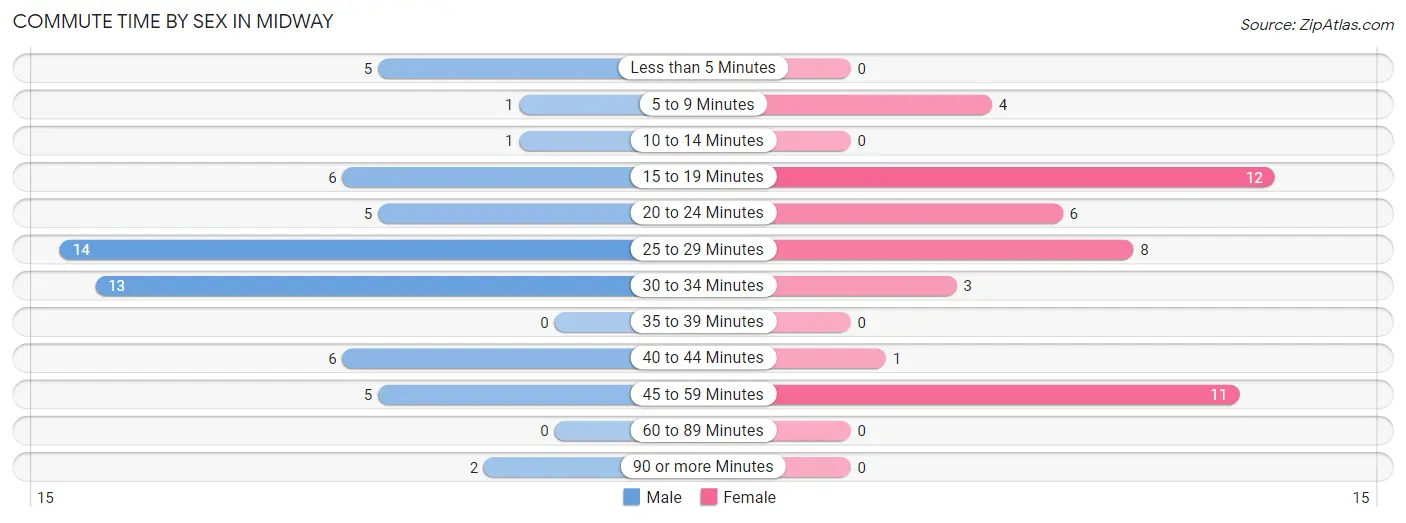
| Commute Time | Male | Female |
| Less than 5 Minutes | 5 (8.6%) | 0 (0.0%) |
| 5 to 9 Minutes | 1 (1.7%) | 4 (8.9%) |
| 10 to 14 Minutes | 1 (1.7%) | 0 (0.0%) |
| 15 to 19 Minutes | 6 (10.3%) | 12 (26.7%) |
| 20 to 24 Minutes | 5 (8.6%) | 6 (13.3%) |
| 25 to 29 Minutes | 14 (24.1%) | 8 (17.8%) |
| 30 to 34 Minutes | 13 (22.4%) | 3 (6.7%) |
| 35 to 39 Minutes | 0 (0.0%) | 0 (0.0%) |
| 40 to 44 Minutes | 6 (10.3%) | 1 (2.2%) |
| 45 to 59 Minutes | 5 (8.6%) | 11 (24.4%) |
| 60 to 89 Minutes | 0 (0.0%) | 0 (0.0%) |
| 90 or more Minutes | 2 (3.5%) | 0 (0.0%) |
Time of Departure to Work by Sex in Midway
The most frequent times of departure to work in Midway are 9:00 AM to 9:59 AM (12, 20.7%) for males and 6:30 AM to 6:59 AM (12, 26.7%) for females.
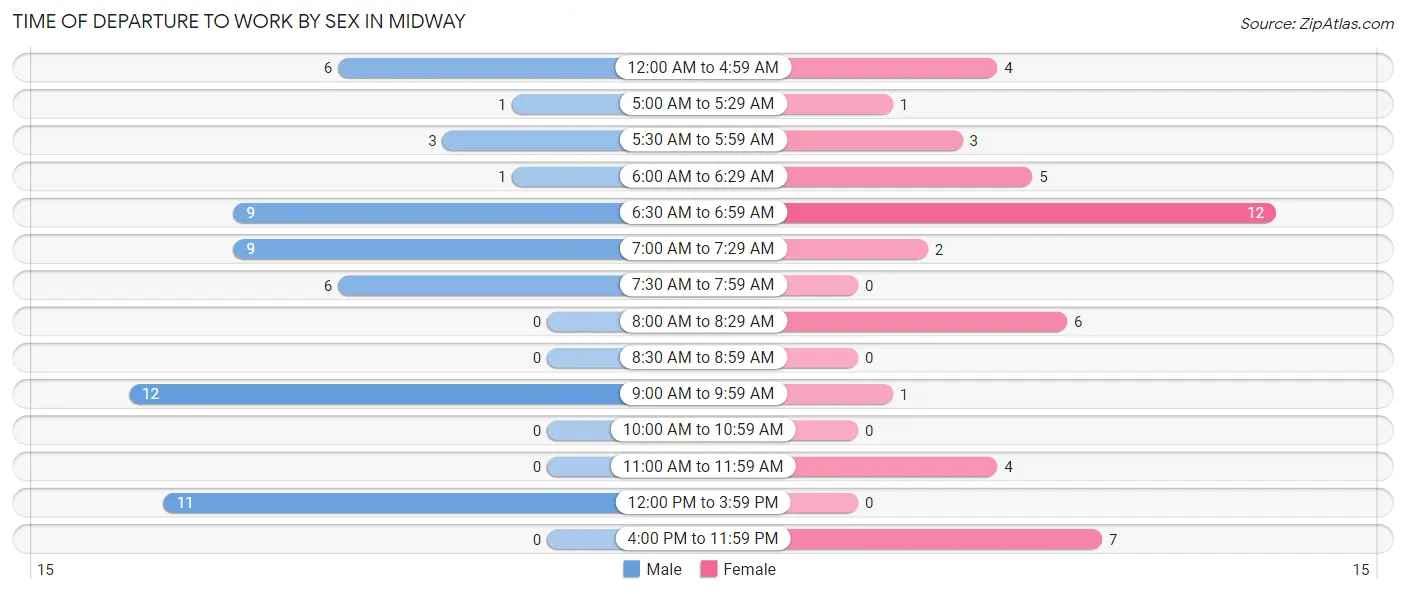
| Time of Departure | Male | Female |
| 12:00 AM to 4:59 AM | 6 (10.3%) | 4 (8.9%) |
| 5:00 AM to 5:29 AM | 1 (1.7%) | 1 (2.2%) |
| 5:30 AM to 5:59 AM | 3 (5.2%) | 3 (6.7%) |
| 6:00 AM to 6:29 AM | 1 (1.7%) | 5 (11.1%) |
| 6:30 AM to 6:59 AM | 9 (15.5%) | 12 (26.7%) |
| 7:00 AM to 7:29 AM | 9 (15.5%) | 2 (4.4%) |
| 7:30 AM to 7:59 AM | 6 (10.3%) | 0 (0.0%) |
| 8:00 AM to 8:29 AM | 0 (0.0%) | 6 (13.3%) |
| 8:30 AM to 8:59 AM | 0 (0.0%) | 0 (0.0%) |
| 9:00 AM to 9:59 AM | 12 (20.7%) | 1 (2.2%) |
| 10:00 AM to 10:59 AM | 0 (0.0%) | 0 (0.0%) |
| 11:00 AM to 11:59 AM | 0 (0.0%) | 4 (8.9%) |
| 12:00 PM to 3:59 PM | 11 (19.0%) | 0 (0.0%) |
| 4:00 PM to 11:59 PM | 0 (0.0%) | 7 (15.6%) |
| Total | 58 (100.0%) | 45 (100.0%) |
Housing Occupancy in Midway
Occupancy by Ownership in Midway
Of the total 94 dwellings in Midway, owner-occupied units account for 62 (66.0%), while renter-occupied units make up 32 (34.0%).
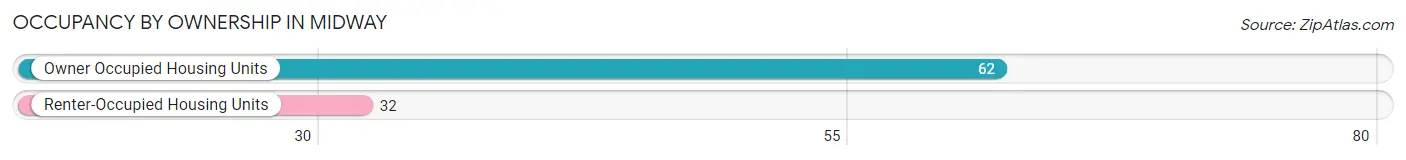
| Occupancy | # Housing Units | % Housing Units |
| Owner Occupied Housing Units | 62 | 66.0% |
| Renter-Occupied Housing Units | 32 | 34.0% |
| Total Occupied Housing Units | 94 | 100.0% |
Occupancy by Household Size in Midway
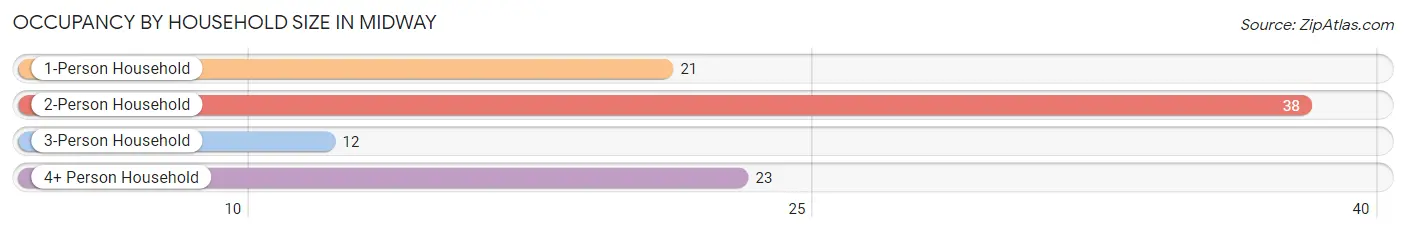
| Household Size | # Housing Units | % Housing Units |
| 1-Person Household | 21 | 22.3% |
| 2-Person Household | 38 | 40.4% |
| 3-Person Household | 12 | 12.8% |
| 4+ Person Household | 23 | 24.5% |
| Total Housing Units | 94 | 100.0% |
Occupancy by Ownership by Household Size in Midway
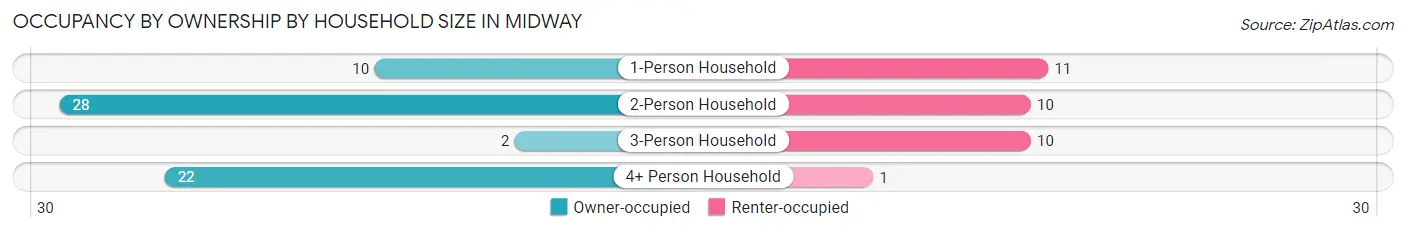
| Household Size | Owner-occupied | Renter-occupied |
| 1-Person Household | 10 (47.6%) | 11 (52.4%) |
| 2-Person Household | 28 (73.7%) | 10 (26.3%) |
| 3-Person Household | 2 (16.7%) | 10 (83.3%) |
| 4+ Person Household | 22 (95.7%) | 1 (4.3%) |
| Total Housing Units | 62 (66.0%) | 32 (34.0%) |
Occupancy by Educational Attainment in Midway
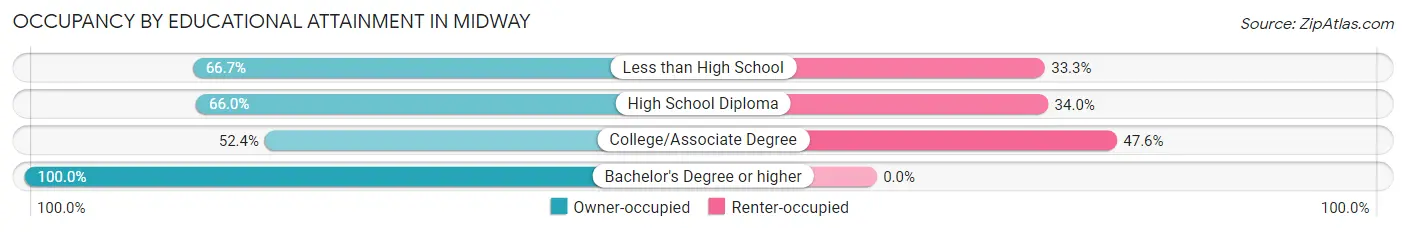
| Household Size | Owner-occupied | Renter-occupied |
| Less than High School | 10 (66.7%) | 5 (33.3%) |
| High School Diploma | 33 (66.0%) | 17 (34.0%) |
| College/Associate Degree | 11 (52.4%) | 10 (47.6%) |
| Bachelor's Degree or higher | 8 (100.0%) | 0 (0.0%) |
Occupancy by Age of Householder in Midway
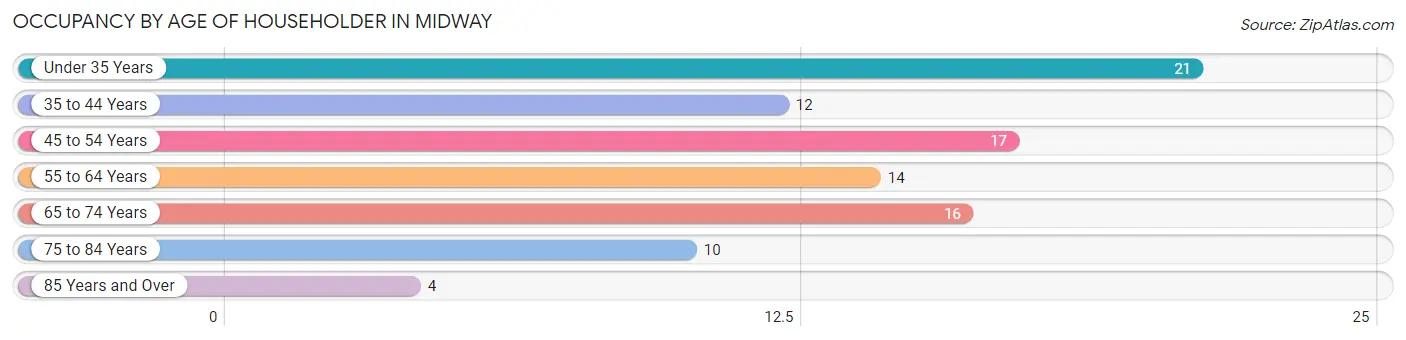
| Age Bracket | # Households | % Households |
| Under 35 Years | 21 | 22.3% |
| 35 to 44 Years | 12 | 12.8% |
| 45 to 54 Years | 17 | 18.1% |
| 55 to 64 Years | 14 | 14.9% |
| 65 to 74 Years | 16 | 17.0% |
| 75 to 84 Years | 10 | 10.6% |
| 85 Years and Over | 4 | 4.3% |
| Total | 94 | 100.0% |
Housing Finances in Midway
Median Income by Occupancy in Midway
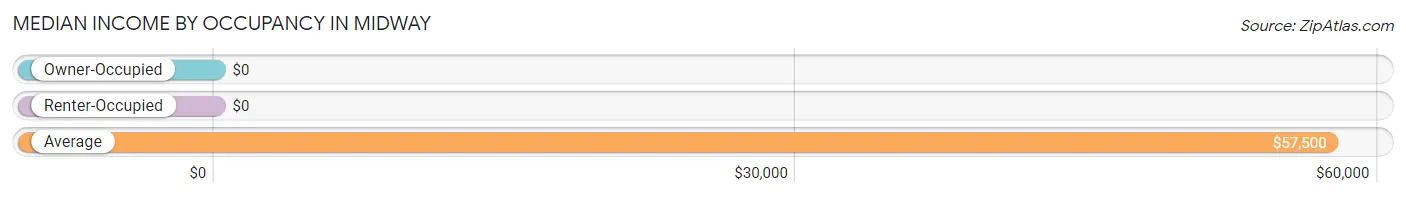
| Occupancy Type | # Households | Median Income |
| Owner-Occupied | 62 (66.0%) | $0 |
| Renter-Occupied | 32 (34.0%) | $0 |
| Average | 94 (100.0%) | $57,500 |
Occupancy by Householder Income Bracket in Midway
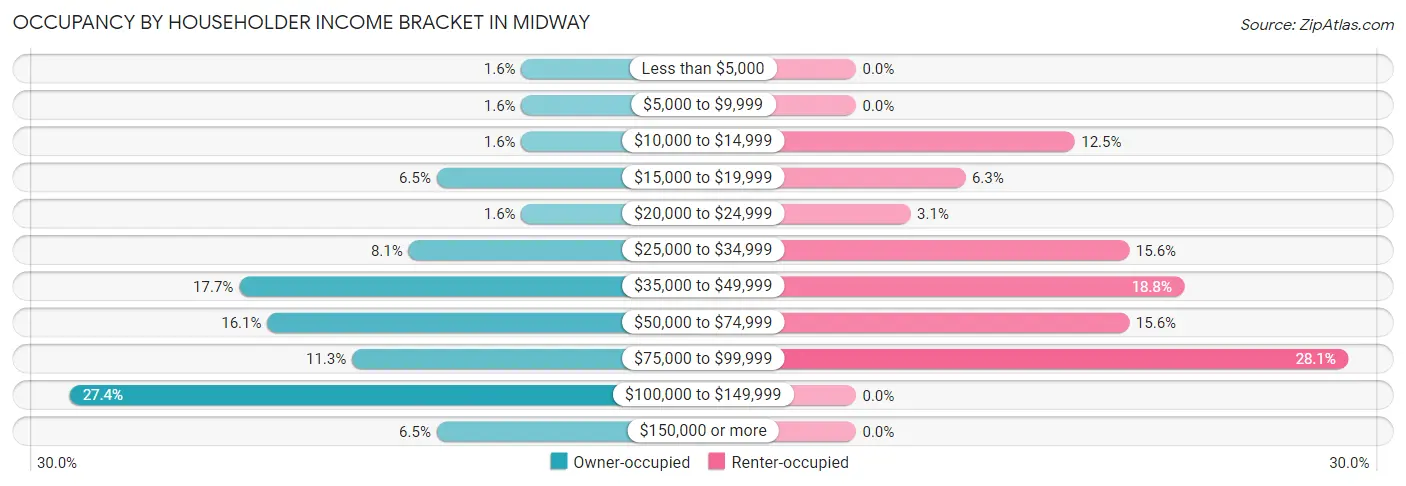
| Income Bracket | Owner-occupied | Renter-occupied |
| Less than $5,000 | 1 (1.6%) | 0 (0.0%) |
| $5,000 to $9,999 | 1 (1.6%) | 0 (0.0%) |
| $10,000 to $14,999 | 1 (1.6%) | 4 (12.5%) |
| $15,000 to $19,999 | 4 (6.5%) | 2 (6.2%) |
| $20,000 to $24,999 | 1 (1.6%) | 1 (3.1%) |
| $25,000 to $34,999 | 5 (8.1%) | 5 (15.6%) |
| $35,000 to $49,999 | 11 (17.7%) | 6 (18.8%) |
| $50,000 to $74,999 | 10 (16.1%) | 5 (15.6%) |
| $75,000 to $99,999 | 7 (11.3%) | 9 (28.1%) |
| $100,000 to $149,999 | 17 (27.4%) | 0 (0.0%) |
| $150,000 or more | 4 (6.5%) | 0 (0.0%) |
| Total | 62 (100.0%) | 32 (100.0%) |
Monthly Housing Cost Tiers in Midway
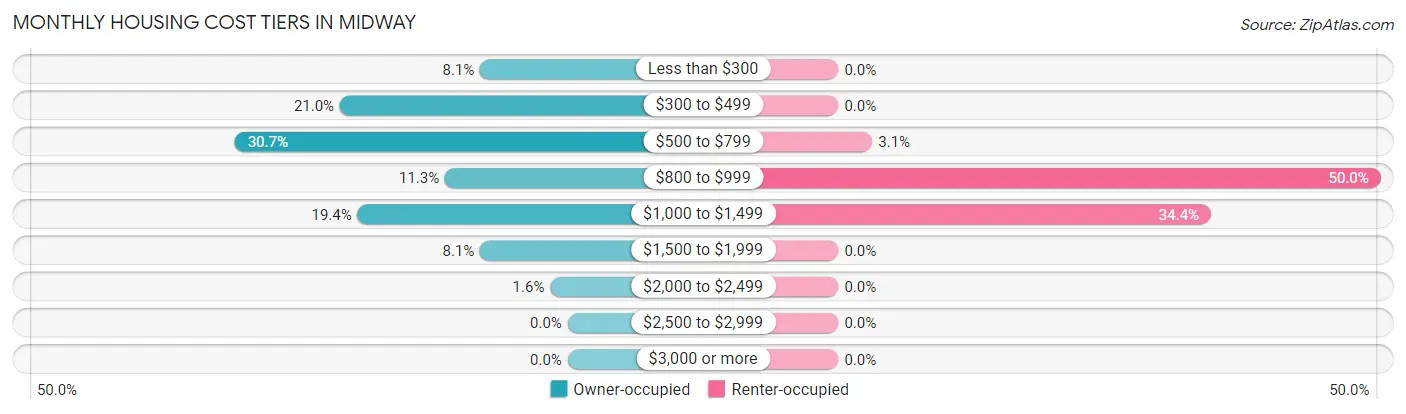
| Monthly Cost | Owner-occupied | Renter-occupied |
| Less than $300 | 5 (8.1%) | 0 (0.0%) |
| $300 to $499 | 13 (21.0%) | 0 (0.0%) |
| $500 to $799 | 19 (30.6%) | 1 (3.1%) |
| $800 to $999 | 7 (11.3%) | 16 (50.0%) |
| $1,000 to $1,499 | 12 (19.4%) | 11 (34.4%) |
| $1,500 to $1,999 | 5 (8.1%) | 0 (0.0%) |
| $2,000 to $2,499 | 1 (1.6%) | 0 (0.0%) |
| $2,500 to $2,999 | 0 (0.0%) | 0 (0.0%) |
| $3,000 or more | 0 (0.0%) | 0 (0.0%) |
| Total | 62 (100.0%) | 32 (100.0%) |
Physical Housing Characteristics in Midway
Housing Structures in Midway
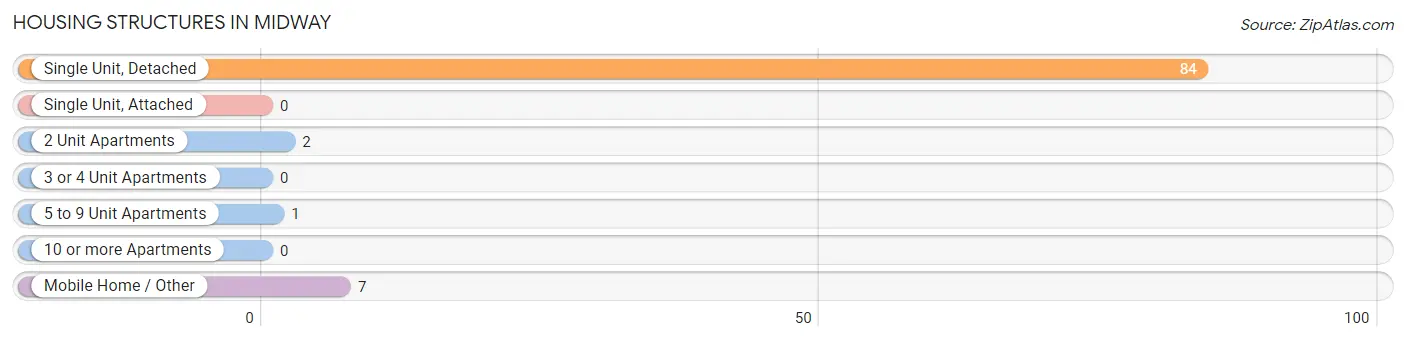
| Structure Type | # Housing Units | % Housing Units |
| Single Unit, Detached | 84 | 89.4% |
| Single Unit, Attached | 0 | 0.0% |
| 2 Unit Apartments | 2 | 2.1% |
| 3 or 4 Unit Apartments | 0 | 0.0% |
| 5 to 9 Unit Apartments | 1 | 1.1% |
| 10 or more Apartments | 0 | 0.0% |
| Mobile Home / Other | 7 | 7.4% |
| Total | 94 | 100.0% |
Housing Structures by Occupancy in Midway
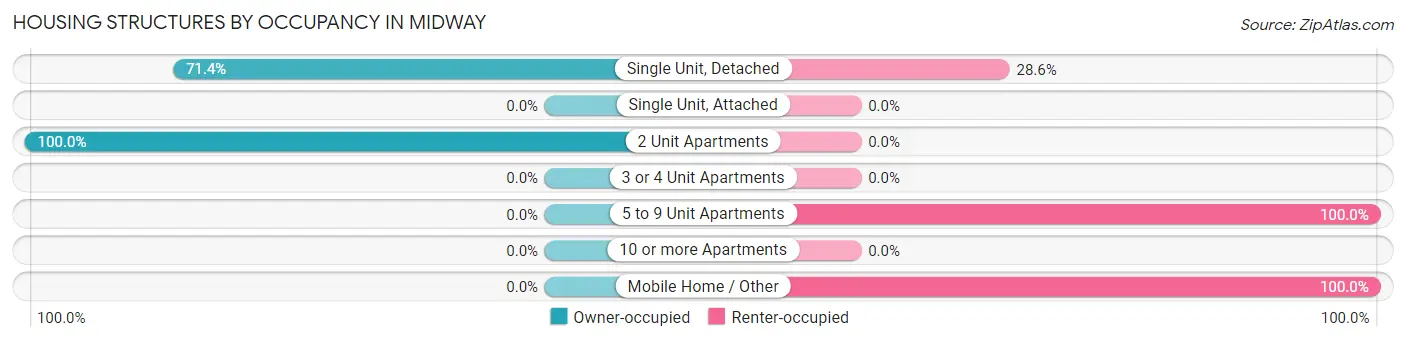
| Structure Type | Owner-occupied | Renter-occupied |
| Single Unit, Detached | 60 (71.4%) | 24 (28.6%) |
| Single Unit, Attached | 0 (0.0%) | 0 (0.0%) |
| 2 Unit Apartments | 2 (100.0%) | 0 (0.0%) |
| 3 or 4 Unit Apartments | 0 (0.0%) | 0 (0.0%) |
| 5 to 9 Unit Apartments | 0 (0.0%) | 1 (100.0%) |
| 10 or more Apartments | 0 (0.0%) | 0 (0.0%) |
| Mobile Home / Other | 0 (0.0%) | 7 (100.0%) |
| Total | 62 (66.0%) | 32 (34.0%) |
Housing Structures by Number of Rooms in Midway
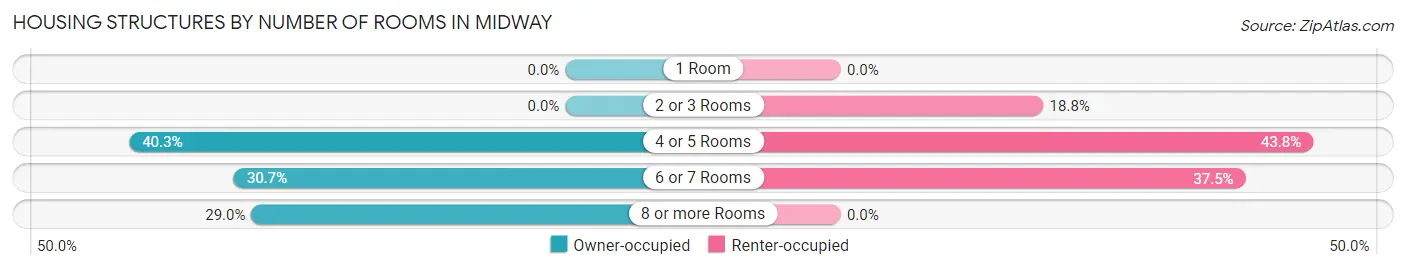
| Number of Rooms | Owner-occupied | Renter-occupied |
| 1 Room | 0 (0.0%) | 0 (0.0%) |
| 2 or 3 Rooms | 0 (0.0%) | 6 (18.8%) |
| 4 or 5 Rooms | 25 (40.3%) | 14 (43.8%) |
| 6 or 7 Rooms | 19 (30.6%) | 12 (37.5%) |
| 8 or more Rooms | 18 (29.0%) | 0 (0.0%) |
| Total | 62 (100.0%) | 32 (100.0%) |
Housing Structure by Heating Type in Midway
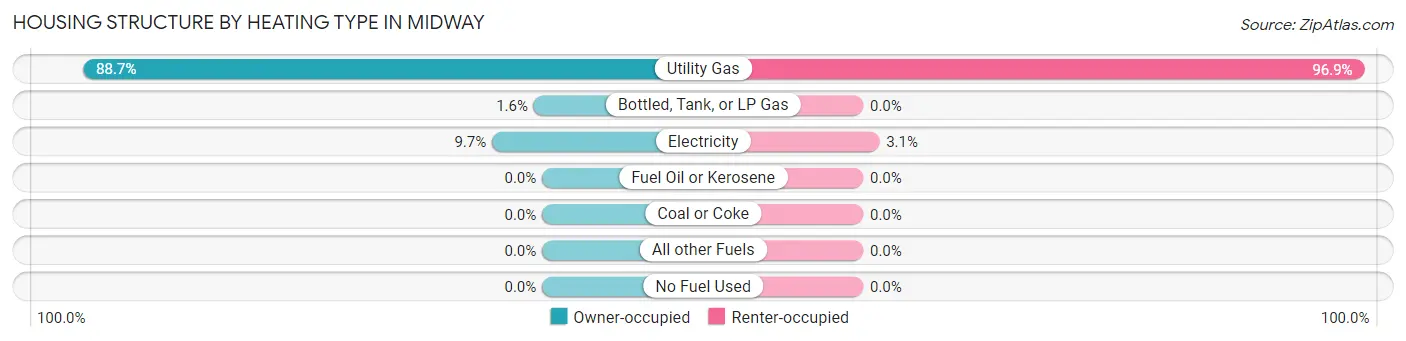
| Heating Type | Owner-occupied | Renter-occupied |
| Utility Gas | 55 (88.7%) | 31 (96.9%) |
| Bottled, Tank, or LP Gas | 1 (1.6%) | 0 (0.0%) |
| Electricity | 6 (9.7%) | 1 (3.1%) |
| Fuel Oil or Kerosene | 0 (0.0%) | 0 (0.0%) |
| Coal or Coke | 0 (0.0%) | 0 (0.0%) |
| All other Fuels | 0 (0.0%) | 0 (0.0%) |
| No Fuel Used | 0 (0.0%) | 0 (0.0%) |
| Total | 62 (100.0%) | 32 (100.0%) |
Household Vehicle Usage in Midway
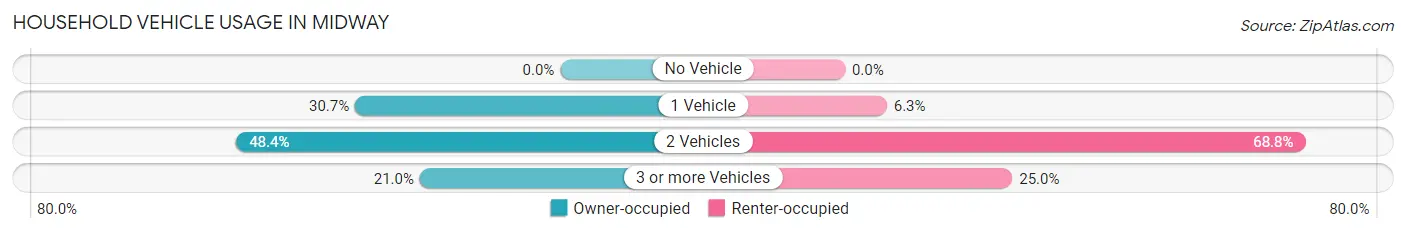
| Vehicles per Household | Owner-occupied | Renter-occupied |
| No Vehicle | 0 (0.0%) | 0 (0.0%) |
| 1 Vehicle | 19 (30.6%) | 2 (6.2%) |
| 2 Vehicles | 30 (48.4%) | 22 (68.8%) |
| 3 or more Vehicles | 13 (21.0%) | 8 (25.0%) |
| Total | 62 (100.0%) | 32 (100.0%) |
Real Estate & Mortgages in Midway
Real Estate and Mortgage Overview in Midway
| Characteristic | Without Mortgage | With Mortgage |
| Housing Units | 27 | 35 |
| Median Property Value | $105,400 | $126,800 |
| Median Household Income | - | - |
| Monthly Housing Costs | $458 | $0 |
| Real Estate Taxes | $1,393 | $2 |
Property Value by Mortgage Status in Midway
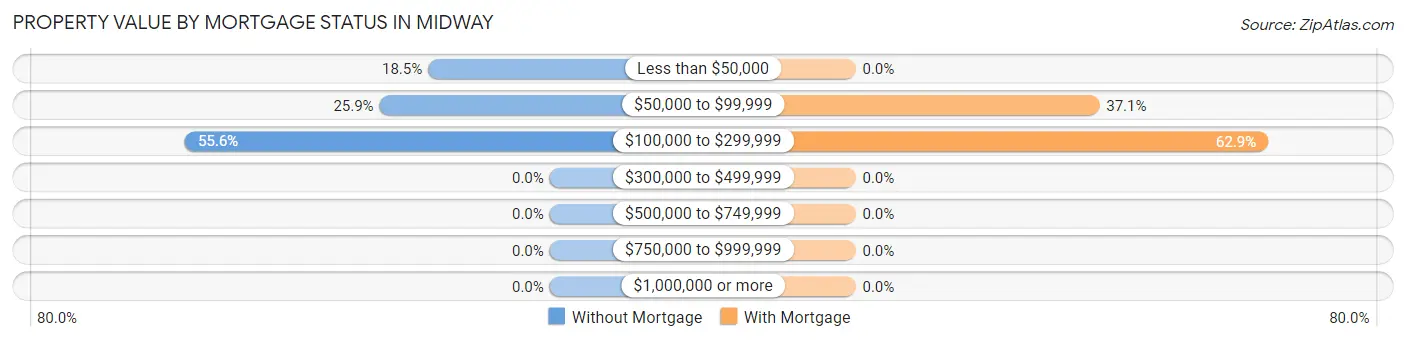
| Property Value | Without Mortgage | With Mortgage |
| Less than $50,000 | 5 (18.5%) | 0 (0.0%) |
| $50,000 to $99,999 | 7 (25.9%) | 13 (37.1%) |
| $100,000 to $299,999 | 15 (55.6%) | 22 (62.9%) |
| $300,000 to $499,999 | 0 (0.0%) | 0 (0.0%) |
| $500,000 to $749,999 | 0 (0.0%) | 0 (0.0%) |
| $750,000 to $999,999 | 0 (0.0%) | 0 (0.0%) |
| $1,000,000 or more | 0 (0.0%) | 0 (0.0%) |
| Total | 27 (100.0%) | 35 (100.0%) |
Household Income by Mortgage Status in Midway
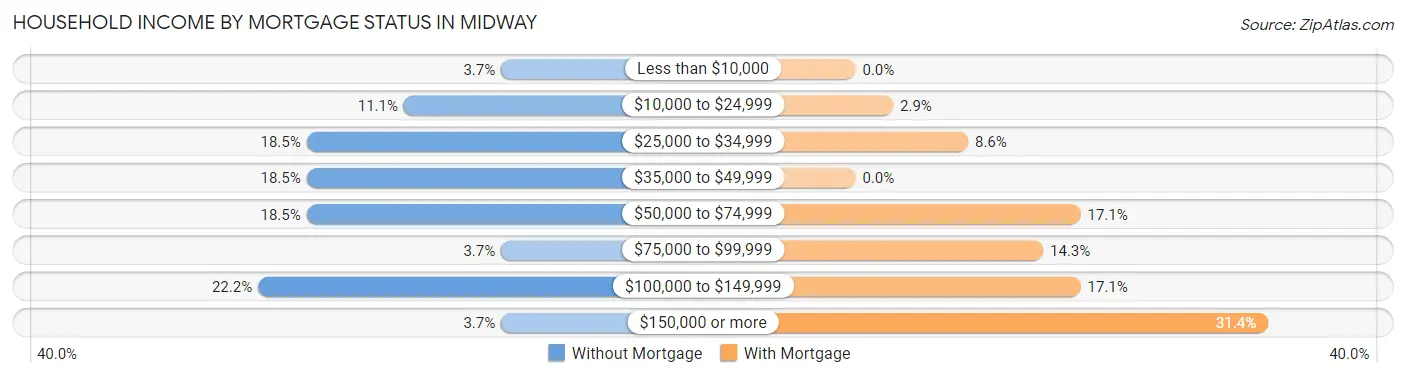
| Household Income | Without Mortgage | With Mortgage |
| Less than $10,000 | 1 (3.7%) | 0 (0.0%) |
| $10,000 to $24,999 | 3 (11.1%) | 1 (2.9%) |
| $25,000 to $34,999 | 5 (18.5%) | 3 (8.6%) |
| $35,000 to $49,999 | 5 (18.5%) | 0 (0.0%) |
| $50,000 to $74,999 | 5 (18.5%) | 6 (17.1%) |
| $75,000 to $99,999 | 1 (3.7%) | 5 (14.3%) |
| $100,000 to $149,999 | 6 (22.2%) | 6 (17.1%) |
| $150,000 or more | 1 (3.7%) | 11 (31.4%) |
| Total | 27 (100.0%) | 35 (100.0%) |
Property Value to Household Income Ratio in Midway
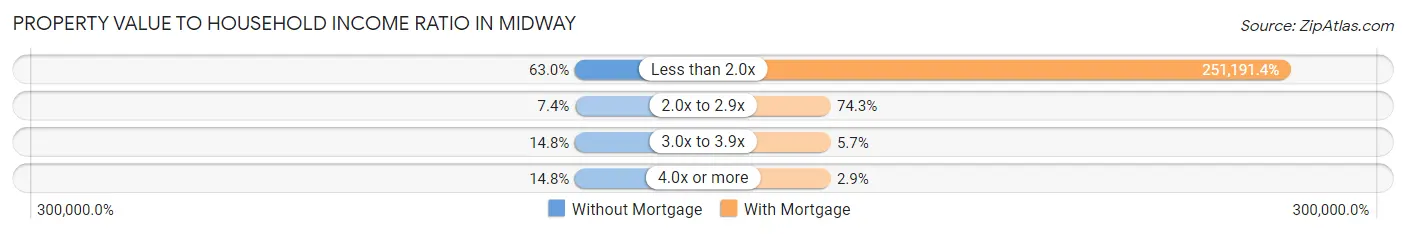
| Value-to-Income Ratio | Without Mortgage | With Mortgage |
| Less than 2.0x | 17 (63.0%) | 87,917 (251,191.4%) |
| 2.0x to 2.9x | 2 (7.4%) | 26 (74.3%) |
| 3.0x to 3.9x | 4 (14.8%) | 2 (5.7%) |
| 4.0x or more | 4 (14.8%) | 1 (2.9%) |
| Total | 27 (100.0%) | 35 (100.0%) |
Real Estate Taxes by Mortgage Status in Midway
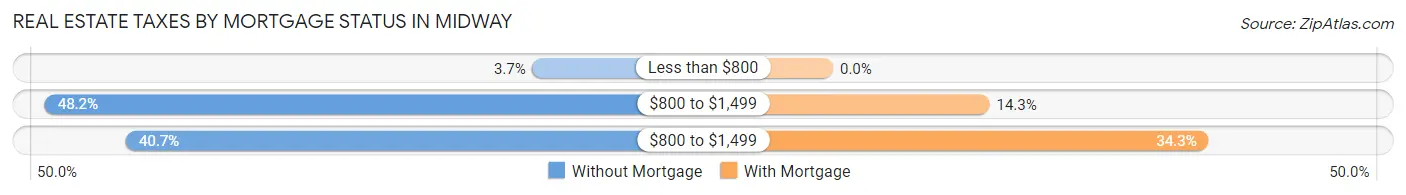
| Property Taxes | Without Mortgage | With Mortgage |
| Less than $800 | 1 (3.7%) | 0 (0.0%) |
| $800 to $1,499 | 13 (48.1%) | 5 (14.3%) |
| $800 to $1,499 | 11 (40.7%) | 12 (34.3%) |
| Total | 27 (100.0%) | 35 (100.0%) |
Health & Disability in Midway
Health Insurance Coverage by Age in Midway
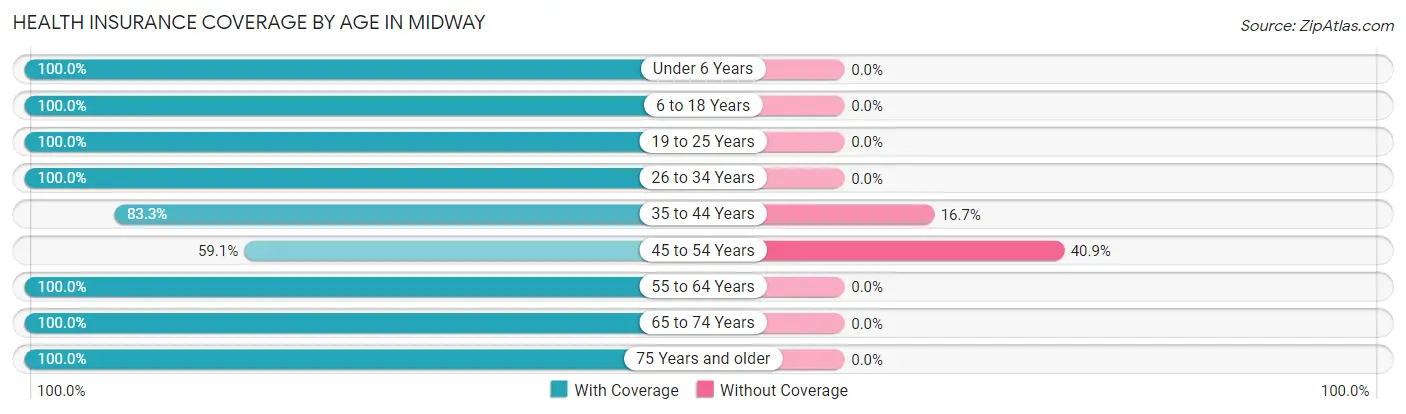
| Age Bracket | With Coverage | Without Coverage |
| Under 6 Years | 29 (100.0%) | 0 (0.0%) |
| 6 to 18 Years | 44 (100.0%) | 0 (0.0%) |
| 19 to 25 Years | 23 (100.0%) | 0 (0.0%) |
| 26 to 34 Years | 34 (100.0%) | 0 (0.0%) |
| 35 to 44 Years | 30 (83.3%) | 6 (16.7%) |
| 45 to 54 Years | 13 (59.1%) | 9 (40.9%) |
| 55 to 64 Years | 17 (100.0%) | 0 (0.0%) |
| 65 to 74 Years | 32 (100.0%) | 0 (0.0%) |
| 75 Years and older | 20 (100.0%) | 0 (0.0%) |
| Total | 242 (94.2%) | 15 (5.8%) |
Health Insurance Coverage by Citizenship Status in Midway
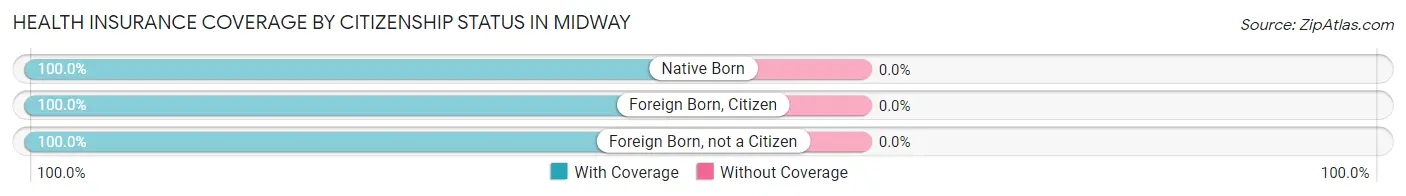
| Citizenship Status | With Coverage | Without Coverage |
| Native Born | 29 (100.0%) | 0 (0.0%) |
| Foreign Born, Citizen | 44 (100.0%) | 0 (0.0%) |
| Foreign Born, not a Citizen | 23 (100.0%) | 0 (0.0%) |
Health Insurance Coverage by Household Income in Midway
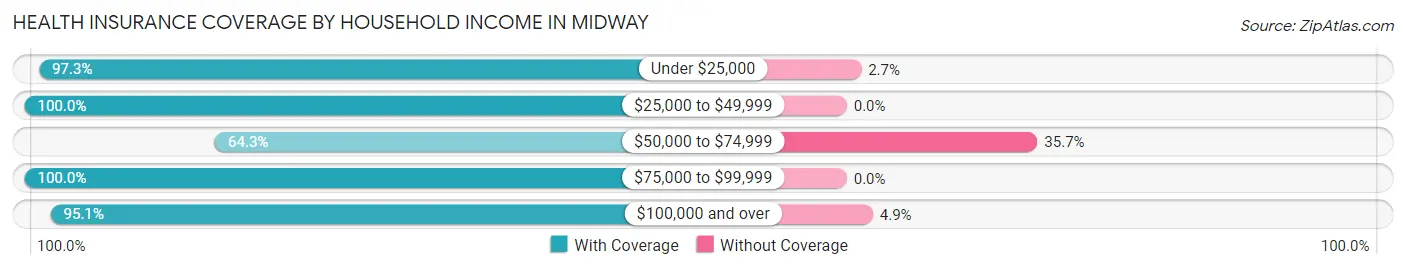
| Household Income | With Coverage | Without Coverage |
| Under $25,000 | 36 (97.3%) | 1 (2.7%) |
| $25,000 to $49,999 | 70 (100.0%) | 0 (0.0%) |
| $50,000 to $74,999 | 18 (64.3%) | 10 (35.7%) |
| $75,000 to $99,999 | 40 (100.0%) | 0 (0.0%) |
| $100,000 and over | 78 (95.1%) | 4 (4.9%) |
Public vs Private Health Insurance Coverage by Age in Midway
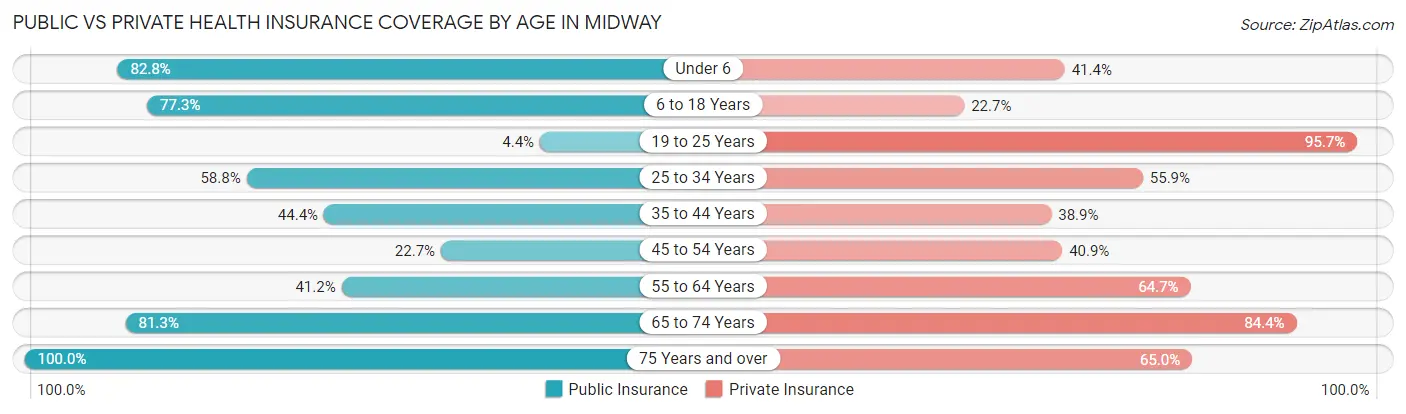
| Age Bracket | Public Insurance | Private Insurance |
| Under 6 | 24 (82.8%) | 12 (41.4%) |
| 6 to 18 Years | 34 (77.3%) | 10 (22.7%) |
| 19 to 25 Years | 1 (4.3%) | 22 (95.7%) |
| 25 to 34 Years | 20 (58.8%) | 19 (55.9%) |
| 35 to 44 Years | 16 (44.4%) | 14 (38.9%) |
| 45 to 54 Years | 5 (22.7%) | 9 (40.9%) |
| 55 to 64 Years | 7 (41.2%) | 11 (64.7%) |
| 65 to 74 Years | 26 (81.2%) | 27 (84.4%) |
| 75 Years and over | 20 (100.0%) | 13 (65.0%) |
| Total | 153 (59.5%) | 137 (53.3%) |
Disability Status by Sex by Age in Midway
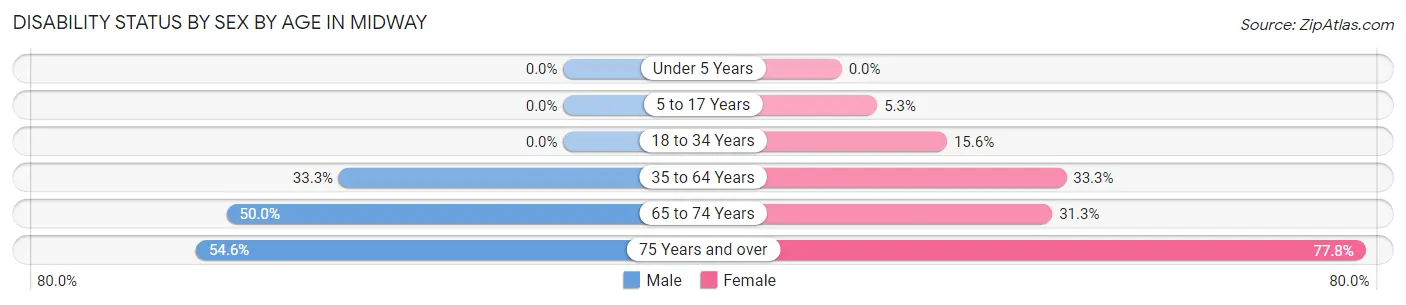
| Age Bracket | Male | Female |
| Under 5 Years | 0 (0.0%) | 0 (0.0%) |
| 5 to 17 Years | 0 (0.0%) | 1 (5.3%) |
| 18 to 34 Years | 0 (0.0%) | 5 (15.6%) |
| 35 to 64 Years | 11 (33.3%) | 14 (33.3%) |
| 65 to 74 Years | 8 (50.0%) | 5 (31.2%) |
| 75 Years and over | 6 (54.5%) | 7 (77.8%) |
Disability Class by Sex by Age in Midway
Disability Class: Hearing Difficulty
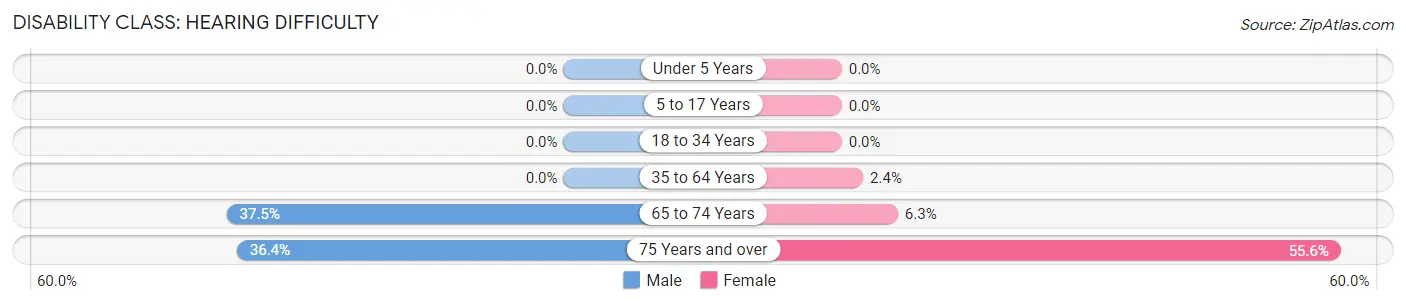
| Age Bracket | Male | Female |
| Under 5 Years | 0 (0.0%) | 0 (0.0%) |
| 5 to 17 Years | 0 (0.0%) | 0 (0.0%) |
| 18 to 34 Years | 0 (0.0%) | 0 (0.0%) |
| 35 to 64 Years | 0 (0.0%) | 1 (2.4%) |
| 65 to 74 Years | 6 (37.5%) | 1 (6.2%) |
| 75 Years and over | 4 (36.4%) | 5 (55.6%) |
Disability Class: Vision Difficulty
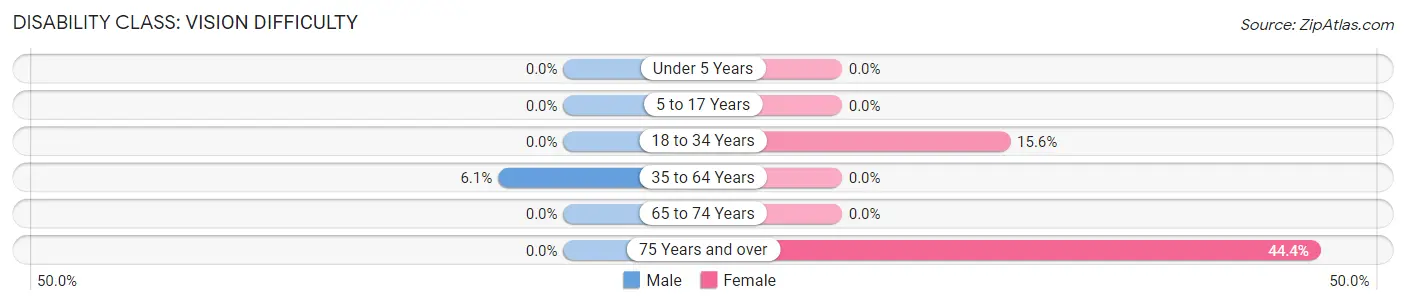
| Age Bracket | Male | Female |
| Under 5 Years | 0 (0.0%) | 0 (0.0%) |
| 5 to 17 Years | 0 (0.0%) | 0 (0.0%) |
| 18 to 34 Years | 0 (0.0%) | 5 (15.6%) |
| 35 to 64 Years | 2 (6.1%) | 0 (0.0%) |
| 65 to 74 Years | 0 (0.0%) | 0 (0.0%) |
| 75 Years and over | 0 (0.0%) | 4 (44.4%) |
Disability Class: Cognitive Difficulty
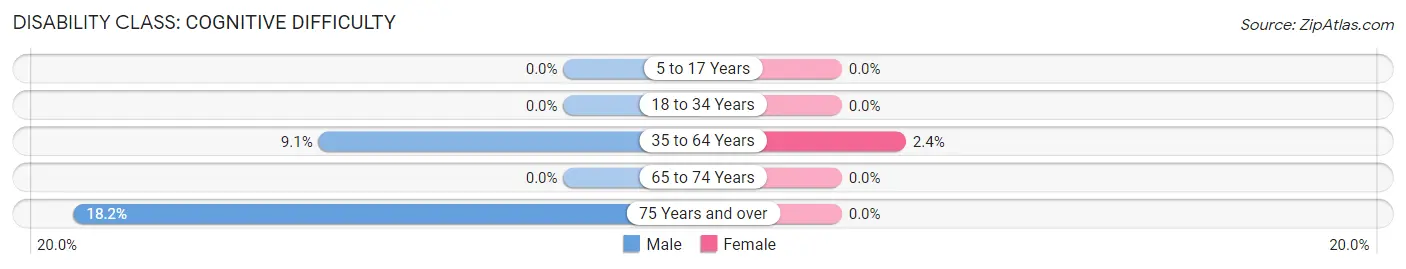
| Age Bracket | Male | Female |
| 5 to 17 Years | 0 (0.0%) | 0 (0.0%) |
| 18 to 34 Years | 0 (0.0%) | 0 (0.0%) |
| 35 to 64 Years | 3 (9.1%) | 1 (2.4%) |
| 65 to 74 Years | 0 (0.0%) | 0 (0.0%) |
| 75 Years and over | 2 (18.2%) | 0 (0.0%) |
Disability Class: Ambulatory Difficulty
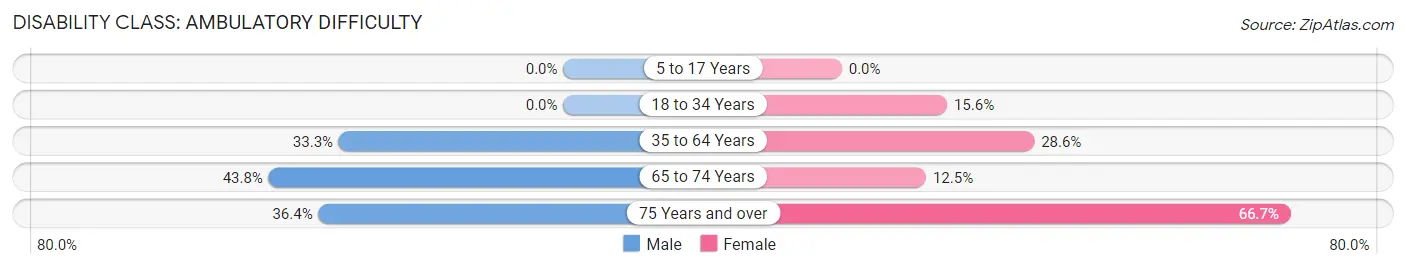
| Age Bracket | Male | Female |
| 5 to 17 Years | 0 (0.0%) | 0 (0.0%) |
| 18 to 34 Years | 0 (0.0%) | 5 (15.6%) |
| 35 to 64 Years | 11 (33.3%) | 12 (28.6%) |
| 65 to 74 Years | 7 (43.8%) | 2 (12.5%) |
| 75 Years and over | 4 (36.4%) | 6 (66.7%) |
Disability Class: Self-Care Difficulty
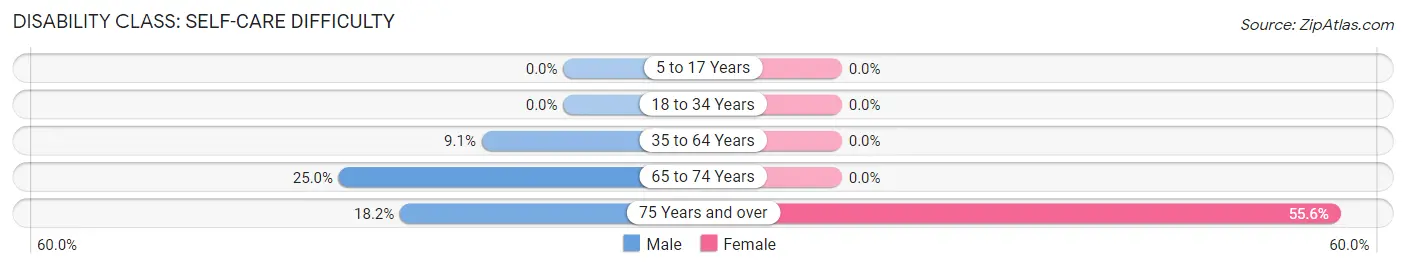
| Age Bracket | Male | Female |
| 5 to 17 Years | 0 (0.0%) | 0 (0.0%) |
| 18 to 34 Years | 0 (0.0%) | 0 (0.0%) |
| 35 to 64 Years | 3 (9.1%) | 0 (0.0%) |
| 65 to 74 Years | 4 (25.0%) | 0 (0.0%) |
| 75 Years and over | 2 (18.2%) | 5 (55.6%) |
Technology Access in Midway
Computing Device Access in Midway
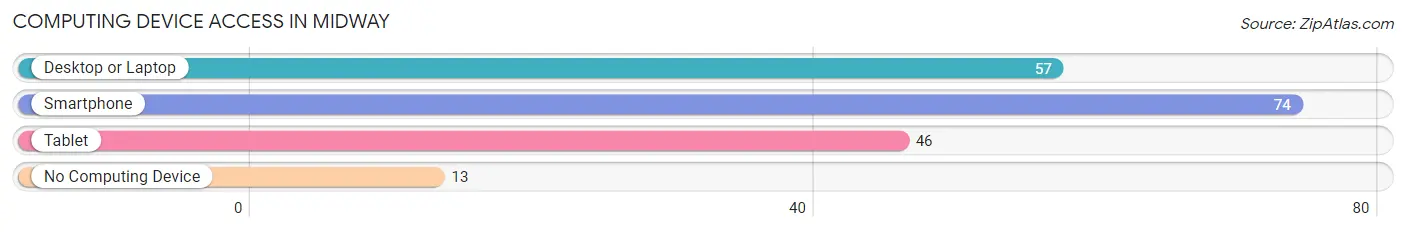
| Device Type | # Households | % Households |
| Desktop or Laptop | 57 | 60.6% |
| Smartphone | 74 | 78.7% |
| Tablet | 46 | 48.9% |
| No Computing Device | 13 | 13.8% |
| Total | 94 | 100.0% |
Internet Access in Midway
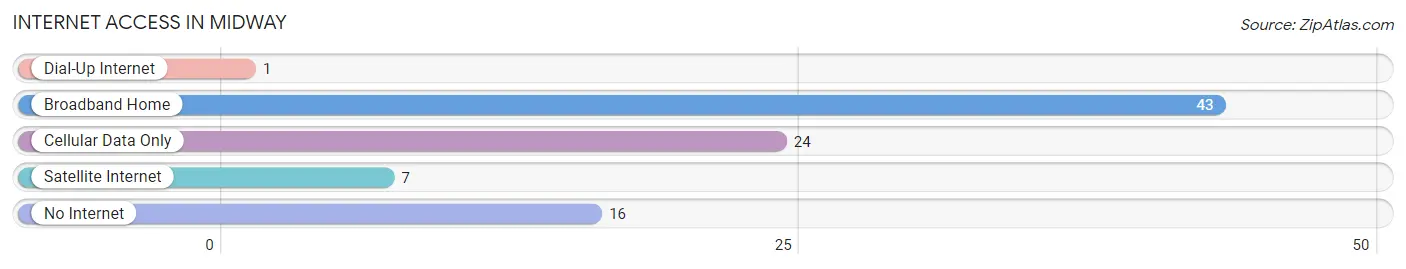
| Internet Type | # Households | % Households |
| Dial-Up Internet | 1 | 1.1% |
| Broadband Home | 43 | 45.7% |
| Cellular Data Only | 24 | 25.5% |
| Satellite Internet | 7 | 7.4% |
| No Internet | 16 | 17.0% |
| Total | 94 | 100.0% |
Midway Summary
Midway, Ohio is a small village located in the southeastern corner of Warren County, Ohio. It is situated on the Little Miami River, approximately 25 miles northeast of Cincinnati. The village was founded in 1817 and incorporated in 1845. As of the 2010 census, the population was 1,845.
History
The area that is now Midway was originally inhabited by the Shawnee Indians. The first settlers arrived in the area in the late 1700s. The village was originally known as “Middletown”, but was later changed to “Midway” in 1817. The name was chosen to reflect the village’s location halfway between Cincinnati and Dayton.
The village was officially incorporated in 1845. During the 19th century, Midway was a thriving agricultural community. The village was home to several mills, including a grist mill, a saw mill, and a woolen mill. The village also had a blacksmith shop, a general store, and a post office.
In the early 20th century, Midway began to experience a decline in population. This was due in part to the Great Depression and the decline of the agricultural industry. The village was also affected by the construction of the Little Miami River Scenic Trail, which diverted traffic away from the village.
Geography
Midway is located at 39°27'N 84°17'W (39.45, -84.28). The village is situated on the Little Miami River, approximately 25 miles northeast of Cincinnati. The village has a total area of 0.9 square miles, all of which is land.
The village is located in the Miami Valley region of Ohio. The climate is humid continental, with hot summers and cold winters. The average annual temperature is 52°F. The average annual precipitation is 40 inches.
Economy
The economy of Midway is largely based on agriculture. The village is home to several farms, including dairy farms, beef farms, and vegetable farms. The village also has several small businesses, including restaurants, retail stores, and service providers.
The village is also home to several manufacturing companies, including a plastics manufacturer and a metal fabrication company. The village is also home to a number of small technology companies.
Demographics
As of the 2010 census, the population of Midway was 1,845. The racial makeup of the village was 97.2% White, 0.7% African American, 0.3% Native American, 0.3% Asian, 0.2% from other races, and 1.5% from two or more races. Hispanic or Latino of any race were 1.2% of the population.
The median household income in Midway was $50,938, and the median family income was $60,000. The per capita income was $25,938. About 8.2% of families and 10.2% of the population were below the poverty line, including 14.2% of those under age 18 and 5.2% of those age 65 or over.
Common Questions
What is Per Capita Income in Midway?
Per Capita income in Midway is $24,103.
What is the Median Family Income in Midway?
Median Family Income in Midway is $59,531.
What is the Median Household income in Midway?
Median Household Income in Midway is $57,500.
What is Income or Wage Gap in Midway?
Income or Wage Gap in Midway is 45.2%.
Women in Midway earn 54.8 cents for every dollar earned by a man.
What is Inequality or Gini Index in Midway?
Inequality or Gini Index in Midway is 0.35.
What is the Total Population of Midway?
Total Population of Midway is 257.
What is the Total Male Population of Midway?
Total Male Population of Midway is 125.
What is the Total Female Population of Midway?
Total Female Population of Midway is 132.
What is the Ratio of Males per 100 Females in Midway?
There are 94.70 Males per 100 Females in Midway.
What is the Ratio of Females per 100 Males in Midway?
There are 105.60 Females per 100 Males in Midway.
What is the Median Population Age in Midway?
Median Population Age in Midway is 34.7 Years.
What is the Average Family Size in Midway
Average Family Size in Midway is 3.0 People.
What is the Average Household Size in Midway
Average Household Size in Midway is 2.7 People.
How Large is the Labor Force in Midway?
There are 113 People in the Labor Forcein in Midway.
What is the Percentage of People in the Labor Force in Midway?
60.8% of People are in the Labor Force in Midway.