Bailey Lakes, OH Map & Demographics
Bailey Lakes Map
Bailey Lakes Overview
$47,547
PER CAPITA INCOME
$95,000
AVG FAMILY INCOME
$80,750
AVG HOUSEHOLD INCOME
15.5%
WAGE / INCOME GAP [ % ]
84.5¢/ $1
WAGE / INCOME GAP [ $ ]
0.52
INEQUALITY / GINI INDEX
331
TOTAL POPULATION
163
MALE POPULATION
168
FEMALE POPULATION
97.02
MALES / 100 FEMALES
103.07
FEMALES / 100 MALES
37.8
MEDIAN AGE
2.8
AVG FAMILY SIZE
2.3
AVG HOUSEHOLD SIZE
215
LABOR FORCE [ PEOPLE ]
74.7%
PERCENT IN LABOR FORCE
2.8%
UNEMPLOYMENT RATE
Income in Bailey Lakes
Income Overview in Bailey Lakes
Per Capita Income in Bailey Lakes is $47,547, while median incomes of families and households are $95,000 and $80,750 respectively.
| Characteristic | Number | Measure |
| Per Capita Income | 331 | $47,547 |
| Median Family Income | 84 | $95,000 |
| Mean Family Income | 84 | $96,574 |
| Median Household Income | 145 | $80,750 |
| Mean Household Income | 145 | $108,807 |
| Income Deficit | 84 | $0 |
| Wage / Income Gap (%) | 331 | 15.46% |
| Wage / Income Gap ($) | 331 | 84.54¢ per $1 |
| Gini / Inequality Index | 331 | 0.52 |
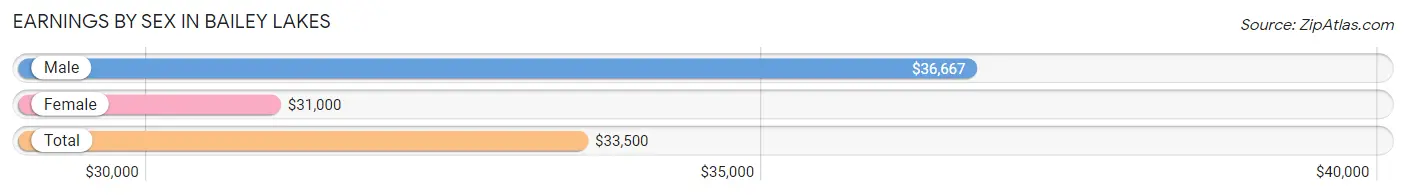
Earnings by Sex in Bailey Lakes
Average Earnings in Bailey Lakes are $33,500, $36,667 for men and $31,000 for women, a difference of 15.5%.
| Sex | Number | Average Earnings |
| Male | 120 (53.6%) | $36,667 |
| Female | 104 (46.4%) | $31,000 |
| Total | 224 (100.0%) | $33,500 |
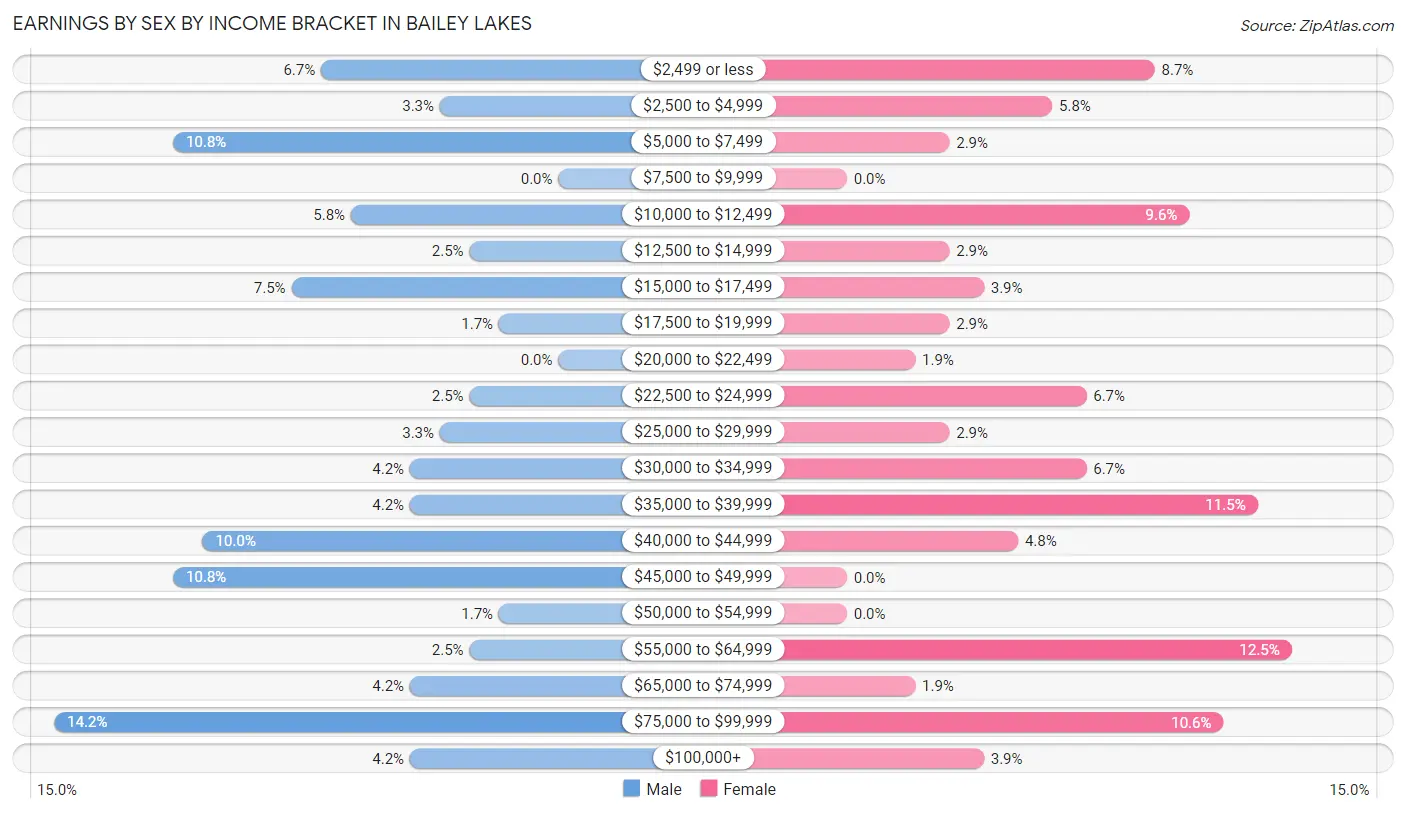
Earnings by Sex by Income Bracket in Bailey Lakes
The most common earnings brackets in Bailey Lakes are $75,000 to $99,999 for men (17 | 14.2%) and $55,000 to $64,999 for women (13 | 12.5%).
| Income | Male | Female |
| $2,499 or less | 8 (6.7%) | 9 (8.6%) |
| $2,500 to $4,999 | 4 (3.3%) | 6 (5.8%) |
| $5,000 to $7,499 | 13 (10.8%) | 3 (2.9%) |
| $7,500 to $9,999 | 0 (0.0%) | 0 (0.0%) |
| $10,000 to $12,499 | 7 (5.8%) | 10 (9.6%) |
| $12,500 to $14,999 | 3 (2.5%) | 3 (2.9%) |
| $15,000 to $17,499 | 9 (7.5%) | 4 (3.8%) |
| $17,500 to $19,999 | 2 (1.7%) | 3 (2.9%) |
| $20,000 to $22,499 | 0 (0.0%) | 2 (1.9%) |
| $22,500 to $24,999 | 3 (2.5%) | 7 (6.7%) |
| $25,000 to $29,999 | 4 (3.3%) | 3 (2.9%) |
| $30,000 to $34,999 | 5 (4.2%) | 7 (6.7%) |
| $35,000 to $39,999 | 5 (4.2%) | 12 (11.5%) |
| $40,000 to $44,999 | 12 (10.0%) | 5 (4.8%) |
| $45,000 to $49,999 | 13 (10.8%) | 0 (0.0%) |
| $50,000 to $54,999 | 2 (1.7%) | 0 (0.0%) |
| $55,000 to $64,999 | 3 (2.5%) | 13 (12.5%) |
| $65,000 to $74,999 | 5 (4.2%) | 2 (1.9%) |
| $75,000 to $99,999 | 17 (14.2%) | 11 (10.6%) |
| $100,000+ | 5 (4.2%) | 4 (3.8%) |
| Total | 120 (100.0%) | 104 (100.0%) |
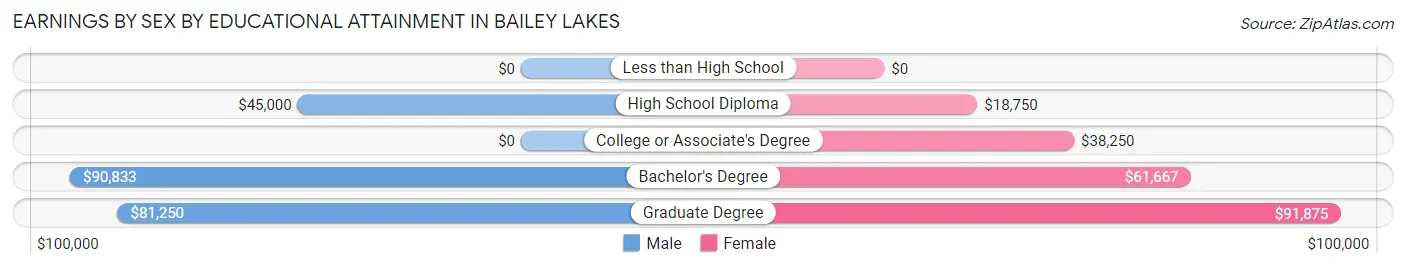
Earnings by Sex by Educational Attainment in Bailey Lakes
Average earnings in Bailey Lakes are $42,750 for men and $39,000 for women, a difference of 8.8%. Men with an educational attainment of bachelor's degree enjoy the highest average annual earnings of $90,833, while those with high school diploma education earn the least with $45,000. Women with an educational attainment of graduate degree earn the most with the average annual earnings of $91,875, while those with high school diploma education have the smallest earnings of $18,750.
| Educational Attainment | Male Income | Female Income |
| Less than High School | - | - |
| High School Diploma | $45,000 | $18,750 |
| College or Associate's Degree | - | - |
| Bachelor's Degree | $90,833 | $61,667 |
| Graduate Degree | $81,250 | $91,875 |
| Total | $42,750 | $39,000 |
Family Income in Bailey Lakes
Family Income Brackets in Bailey Lakes
According to the Bailey Lakes family income data, there are 29 families falling into the $75,000 to $99,999 income range, which is the most common income bracket and makes up 34.5% of all families.
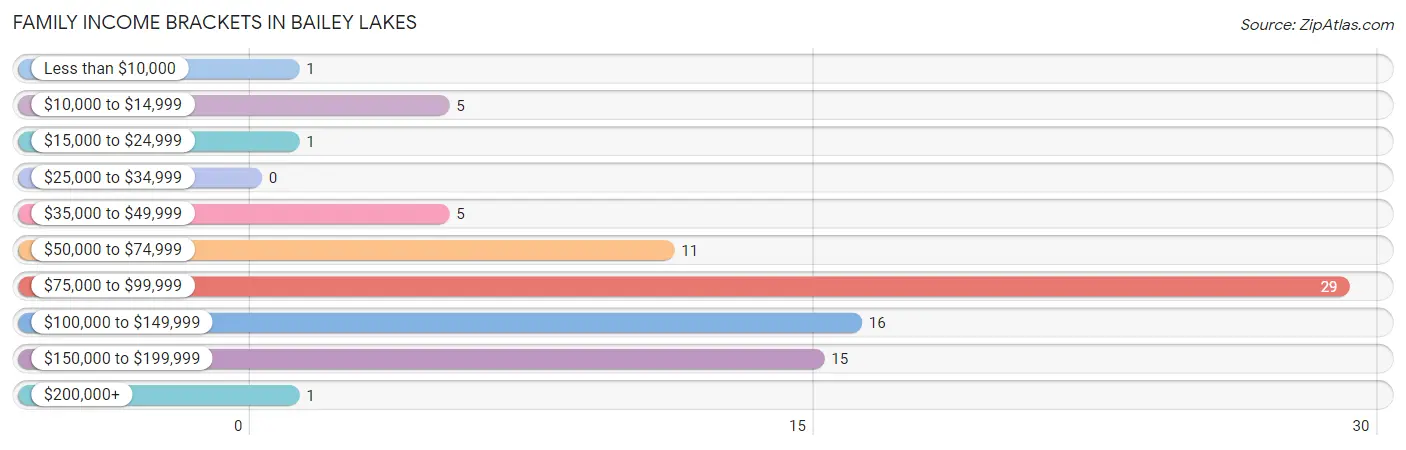
| Income Bracket | # Families | % Families |
| Less than $10,000 | 1 | 1.2% |
| $10,000 to $14,999 | 5 | 6.0% |
| $15,000 to $24,999 | 1 | 1.2% |
| $25,000 to $34,999 | 0 | 0.0% |
| $35,000 to $49,999 | 5 | 6.0% |
| $50,000 to $74,999 | 11 | 13.1% |
| $75,000 to $99,999 | 29 | 34.5% |
| $100,000 to $149,999 | 16 | 19.0% |
| $150,000 to $199,999 | 15 | 17.9% |
| $200,000+ | 1 | 1.2% |
Family Income by Famaliy Size in Bailey Lakes
4-person families (5 | 5.9%) account for the highest median family income in Bailey Lakes with $157,917 per family, while 2-person families (44 | 52.4%) have the highest median income of $47,500 per family member.
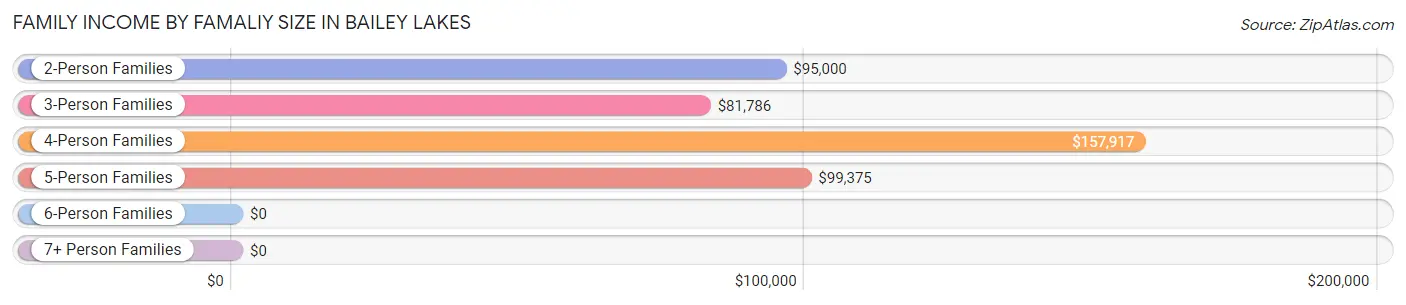
| Income Bracket | # Families | Median Income |
| 2-Person Families | 44 (52.4%) | $95,000 |
| 3-Person Families | 22 (26.2%) | $81,786 |
| 4-Person Families | 5 (5.9%) | $157,917 |
| 5-Person Families | 10 (11.9%) | $99,375 |
| 6-Person Families | 3 (3.6%) | $0 |
| 7+ Person Families | 0 (0.0%) | $0 |
| Total | 84 (100.0%) | $95,000 |
Family Income by Number of Earners in Bailey Lakes
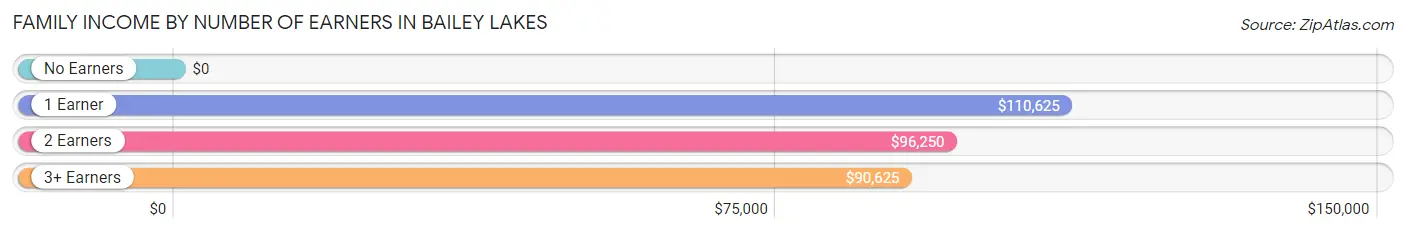
| Number of Earners | # Families | Median Income |
| No Earners | 13 (15.5%) | $0 |
| 1 Earner | 9 (10.7%) | $110,625 |
| 2 Earners | 45 (53.6%) | $96,250 |
| 3+ Earners | 17 (20.2%) | $90,625 |
| Total | 84 (100.0%) | $95,000 |
Household Income in Bailey Lakes
Household Income Brackets in Bailey Lakes
With 41 households falling in the category, the $75,000 to $99,999 income range is the most frequent in Bailey Lakes, accounting for 28.3% of all households. In contrast, only 2 households (1.4%) fall into the $10,000 to $14,999 income bracket, making it the least populous group.
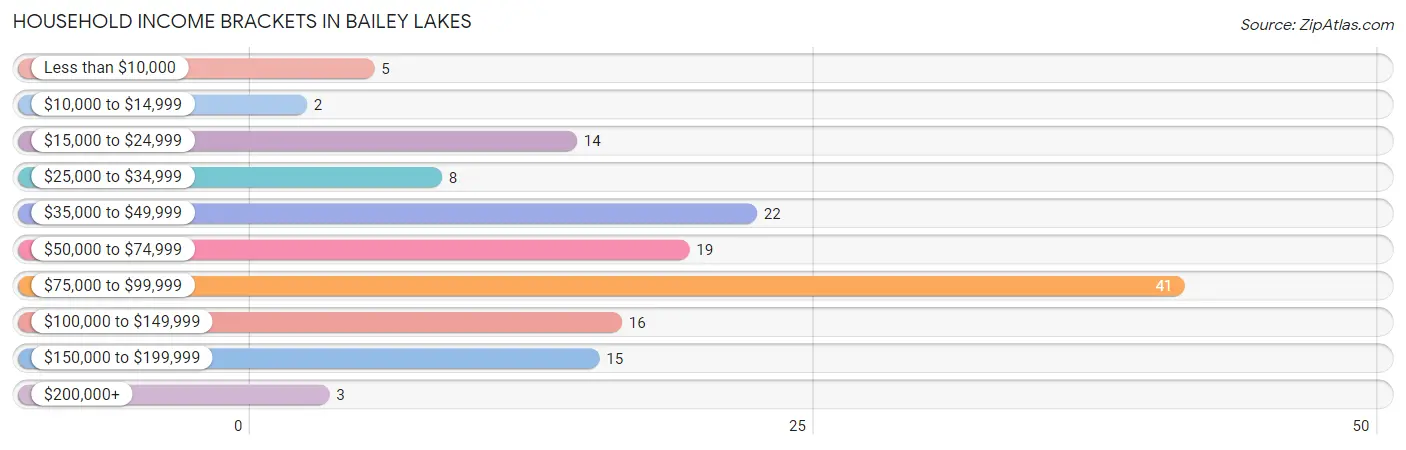
| Income Bracket | # Households | % Households |
| Less than $10,000 | 5 | 3.4% |
| $10,000 to $14,999 | 2 | 1.4% |
| $15,000 to $24,999 | 14 | 9.7% |
| $25,000 to $34,999 | 8 | 5.5% |
| $35,000 to $49,999 | 22 | 15.2% |
| $50,000 to $74,999 | 19 | 13.1% |
| $75,000 to $99,999 | 41 | 28.3% |
| $100,000 to $149,999 | 16 | 11.0% |
| $150,000 to $199,999 | 15 | 10.3% |
| $200,000+ | 3 | 2.1% |
Household Income by Householder Age in Bailey Lakes
The median household income in Bailey Lakes is $80,750, with the highest median household income of $86,875 found in the 65+ years age bracket for the primary householder. A total of 39 households (26.9%) fall into this category. Meanwhile, the 15 to 24 years age bracket for the primary householder has the lowest median household income of $48,542, with 11 households (7.6%) in this group.
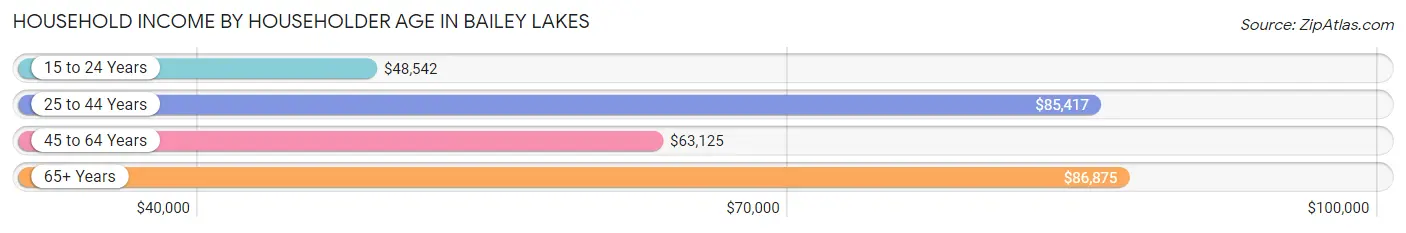
| Income Bracket | # Households | Median Income |
| 15 to 24 Years | 11 (7.6%) | $48,542 |
| 25 to 44 Years | 56 (38.6%) | $85,417 |
| 45 to 64 Years | 39 (26.9%) | $63,125 |
| 65+ Years | 39 (26.9%) | $86,875 |
| Total | 145 (100.0%) | $80,750 |
Poverty in Bailey Lakes
Income Below Poverty by Sex and Age in Bailey Lakes
With 14.7% poverty level for males and 7.1% for females among the residents of Bailey Lakes, 6 to 11 year old males and 35 to 44 year old females are the most vulnerable to poverty, with 5 males (62.5%) and 5 females (25.0%) in their respective age groups living below the poverty level.
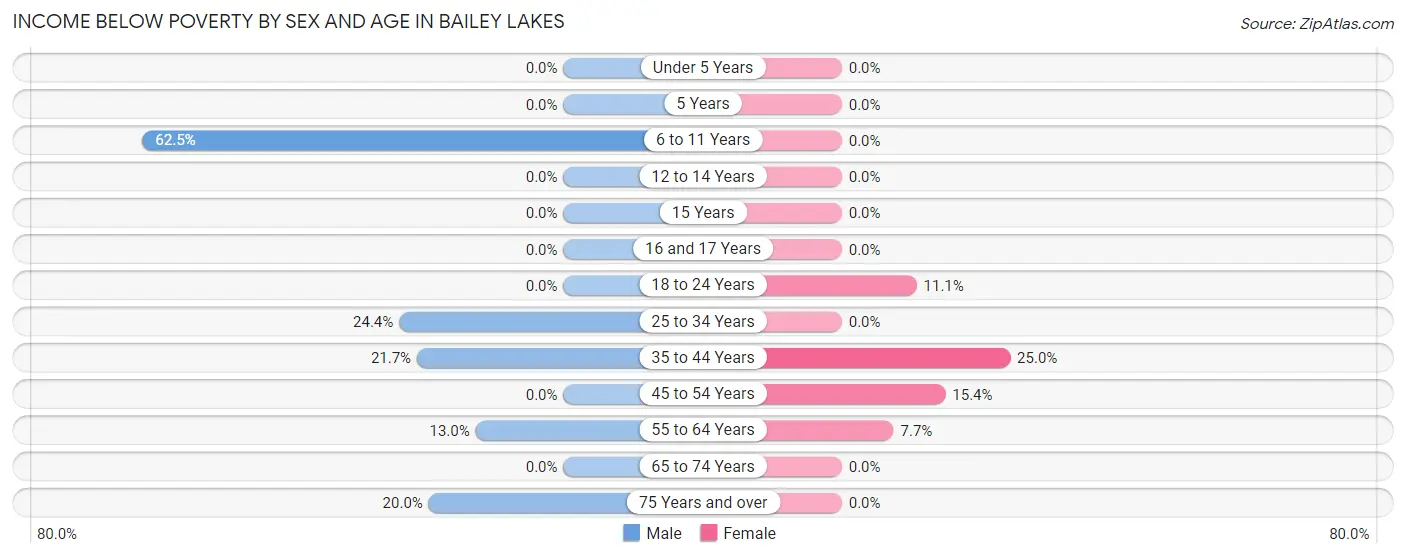
| Age Bracket | Male | Female |
| Under 5 Years | 0 (0.0%) | 0 (0.0%) |
| 5 Years | 0 (0.0%) | 0 (0.0%) |
| 6 to 11 Years | 5 (62.5%) | 0 (0.0%) |
| 12 to 14 Years | 0 (0.0%) | 0 (0.0%) |
| 15 Years | 0 (0.0%) | 0 (0.0%) |
| 16 and 17 Years | 0 (0.0%) | 0 (0.0%) |
| 18 to 24 Years | 0 (0.0%) | 3 (11.1%) |
| 25 to 34 Years | 10 (24.4%) | 0 (0.0%) |
| 35 to 44 Years | 5 (21.7%) | 5 (25.0%) |
| 45 to 54 Years | 0 (0.0%) | 2 (15.4%) |
| 55 to 64 Years | 3 (13.0%) | 2 (7.7%) |
| 65 to 74 Years | 0 (0.0%) | 0 (0.0%) |
| 75 Years and over | 1 (20.0%) | 0 (0.0%) |
| Total | 24 (14.7%) | 12 (7.1%) |
Income Above Poverty by Sex and Age in Bailey Lakes
According to the poverty statistics in Bailey Lakes, males aged under 5 years and females aged under 5 years are the age groups that are most secure financially, with 100.0% of males and 100.0% of females in these age groups living above the poverty line.
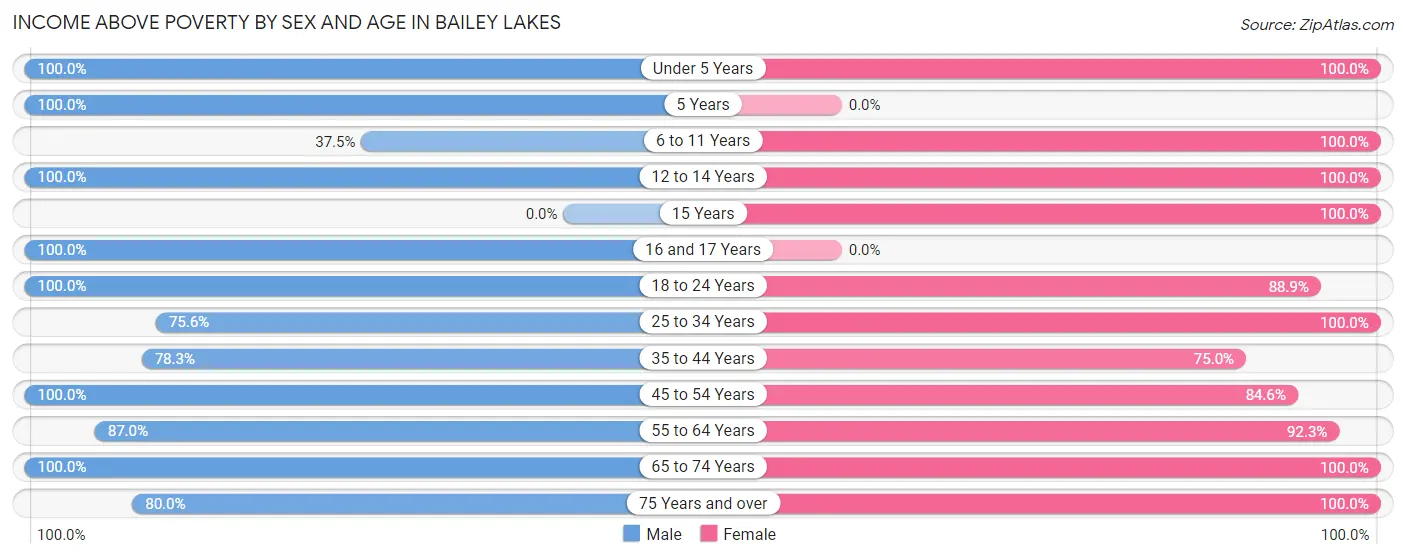
| Age Bracket | Male | Female |
| Under 5 Years | 1 (100.0%) | 10 (100.0%) |
| 5 Years | 4 (100.0%) | 0 (0.0%) |
| 6 to 11 Years | 3 (37.5%) | 7 (100.0%) |
| 12 to 14 Years | 4 (100.0%) | 5 (100.0%) |
| 15 Years | 0 (0.0%) | 4 (100.0%) |
| 16 and 17 Years | 1 (100.0%) | 0 (0.0%) |
| 18 to 24 Years | 18 (100.0%) | 24 (88.9%) |
| 25 to 34 Years | 31 (75.6%) | 22 (100.0%) |
| 35 to 44 Years | 18 (78.3%) | 15 (75.0%) |
| 45 to 54 Years | 13 (100.0%) | 11 (84.6%) |
| 55 to 64 Years | 20 (87.0%) | 24 (92.3%) |
| 65 to 74 Years | 22 (100.0%) | 25 (100.0%) |
| 75 Years and over | 4 (80.0%) | 9 (100.0%) |
| Total | 139 (85.3%) | 156 (92.9%) |
Income Below Poverty Among Married-Couple Families in Bailey Lakes
The poverty statistics for married-couple families in Bailey Lakes show that 1.5% or 1 of the total 68 families live below the poverty line. Families with no children have the highest poverty rate of 2.1%, comprising of 1 families. On the other hand, families with 1 or 2 children have the lowest poverty rate of 0.0%, which includes 0 families.
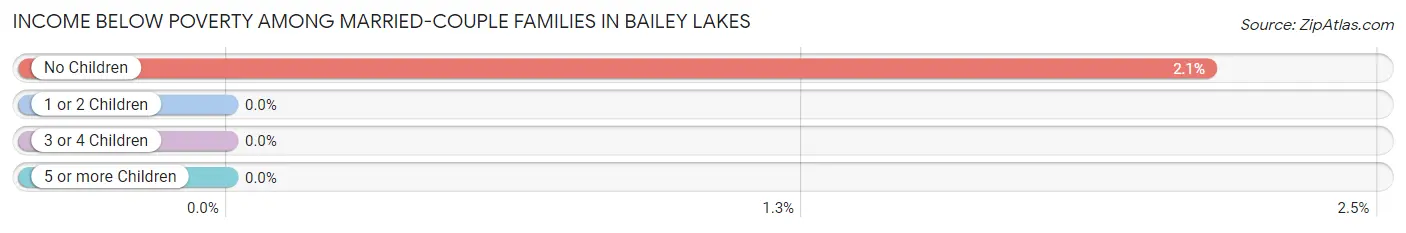
| Children | Above Poverty | Below Poverty |
| No Children | 46 (97.9%) | 1 (2.1%) |
| 1 or 2 Children | 16 (100.0%) | 0 (0.0%) |
| 3 or 4 Children | 5 (100.0%) | 0 (0.0%) |
| 5 or more Children | 0 (0.0%) | 0 (0.0%) |
| Total | 67 (98.5%) | 1 (1.5%) |
Income Below Poverty Among Single-Parent Households in Bailey Lakes
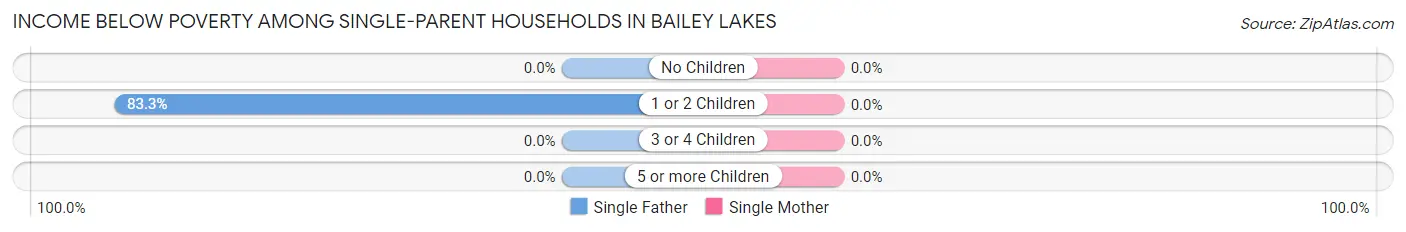
| Children | Single Father | Single Mother |
| No Children | 0 (0.0%) | 0 (0.0%) |
| 1 or 2 Children | 5 (83.3%) | 0 (0.0%) |
| 3 or 4 Children | 0 (0.0%) | 0 (0.0%) |
| 5 or more Children | 0 (0.0%) | 0 (0.0%) |
| Total | 5 (41.7%) | 0 (0.0%) |
Income Below Poverty Among Married-Couple vs Single-Parent Households in Bailey Lakes
The poverty data for Bailey Lakes shows that 1 of the married-couple family households (1.5%) and 5 of the single-parent households (31.2%) are living below the poverty level. Within the married-couple family households, those with no children have the highest poverty rate, with 1 households (2.1%) falling below the poverty line. Among the single-parent households, those with 1 or 2 children have the highest poverty rate, with 5 household (83.3%) living below poverty.
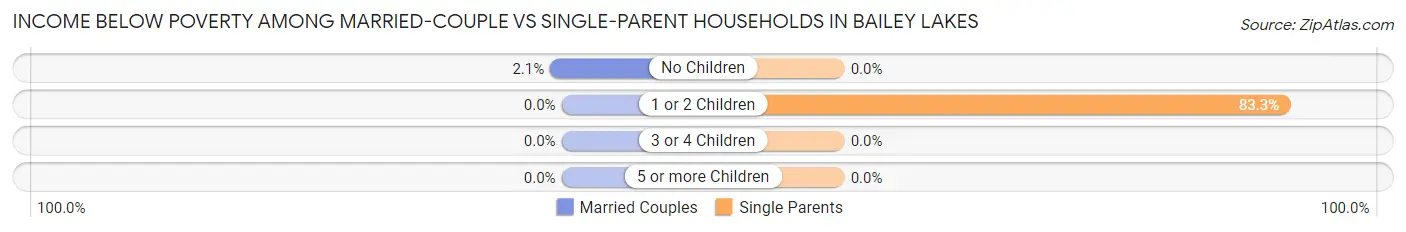
| Children | Married-Couple Families | Single-Parent Households |
| No Children | 1 (2.1%) | 0 (0.0%) |
| 1 or 2 Children | 0 (0.0%) | 5 (83.3%) |
| 3 or 4 Children | 0 (0.0%) | 0 (0.0%) |
| 5 or more Children | 0 (0.0%) | 0 (0.0%) |
| Total | 1 (1.5%) | 5 (31.2%) |
Race in Bailey Lakes
The most populous races in Bailey Lakes are White / Caucasian (309 | 93.3%), Two or more Races (19 | 5.7%), and Black / African American (3 | 0.9%).
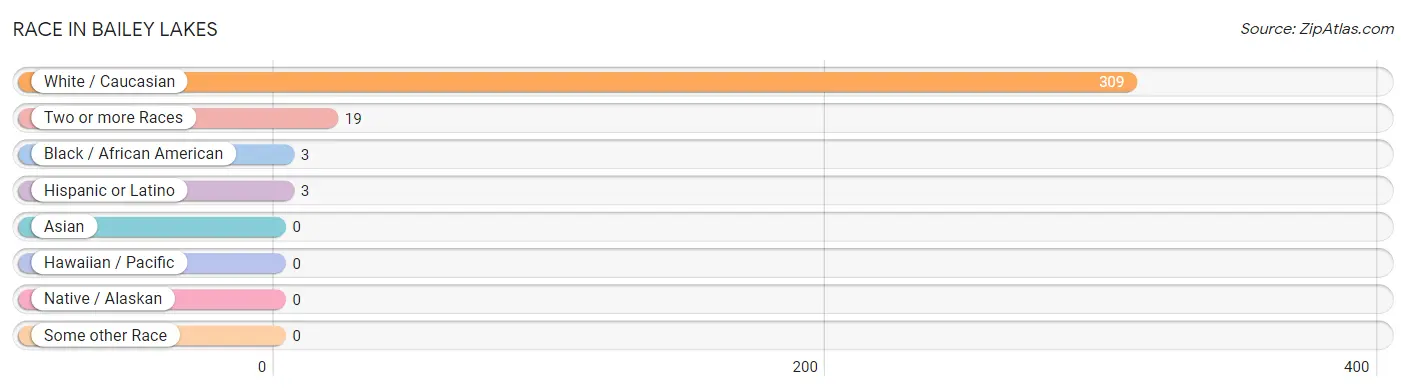
| Race | # Population | % Population |
| Asian | 0 | 0.0% |
| Black / African American | 3 | 0.9% |
| Hawaiian / Pacific | 0 | 0.0% |
| Hispanic or Latino | 3 | 0.9% |
| Native / Alaskan | 0 | 0.0% |
| White / Caucasian | 309 | 93.3% |
| Two or more Races | 19 | 5.7% |
| Some other Race | 0 | 0.0% |
| Total | 331 | 100.0% |
Ancestry in Bailey Lakes
The most populous ancestries reported in Bailey Lakes are German (130 | 39.3%), English (78 | 23.6%), Irish (63 | 19.0%), Polish (22 | 6.7%), and Scottish (19 | 5.7%), together accounting for 94.3% of all Bailey Lakes residents.
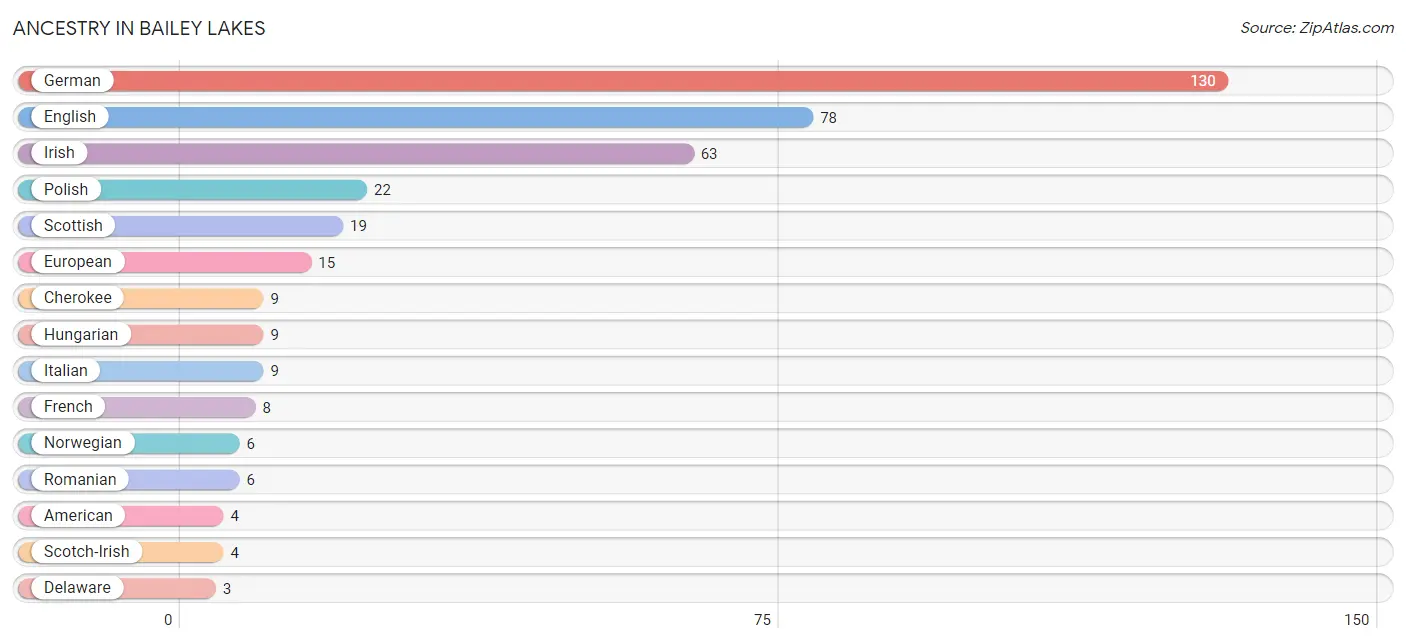
| Ancestry | # Population | % Population |
| American | 4 | 1.2% |
| Cherokee | 9 | 2.7% |
| Czech | 1 | 0.3% |
| Delaware | 3 | 0.9% |
| Dutch | 1 | 0.3% |
| English | 78 | 23.6% |
| European | 15 | 4.5% |
| French | 8 | 2.4% |
| German | 130 | 39.3% |
| Hungarian | 9 | 2.7% |
| Irish | 63 | 19.0% |
| Italian | 9 | 2.7% |
| Mexican | 3 | 0.9% |
| Norwegian | 6 | 1.8% |
| Polish | 22 | 6.7% |
| Romanian | 6 | 1.8% |
| Scandinavian | 3 | 0.9% |
| Scotch-Irish | 4 | 1.2% |
| Scottish | 19 | 5.7% |
| Slovene | 2 | 0.6% |
| Swedish | 2 | 0.6% |
| Turkish | 3 | 0.9% |
| Welsh | 3 | 0.9% | View All 23 Rows |
Immigrants in Bailey Lakes
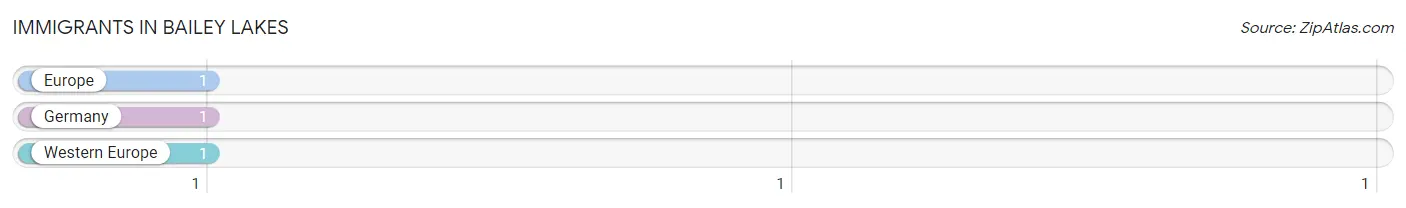
The most numerous immigrant groups reported in Bailey Lakes came from Europe (1 | 0.3%), Germany (1 | 0.3%), and Western Europe (1 | 0.3%), together accounting for 0.9% of all Bailey Lakes residents.
| Immigration Origin | # Population | % Population |
| Europe | 1 | 0.3% |
| Germany | 1 | 0.3% |
| Western Europe | 1 | 0.3% | View All 3 Rows |
Sex and Age in Bailey Lakes
Sex and Age in Bailey Lakes
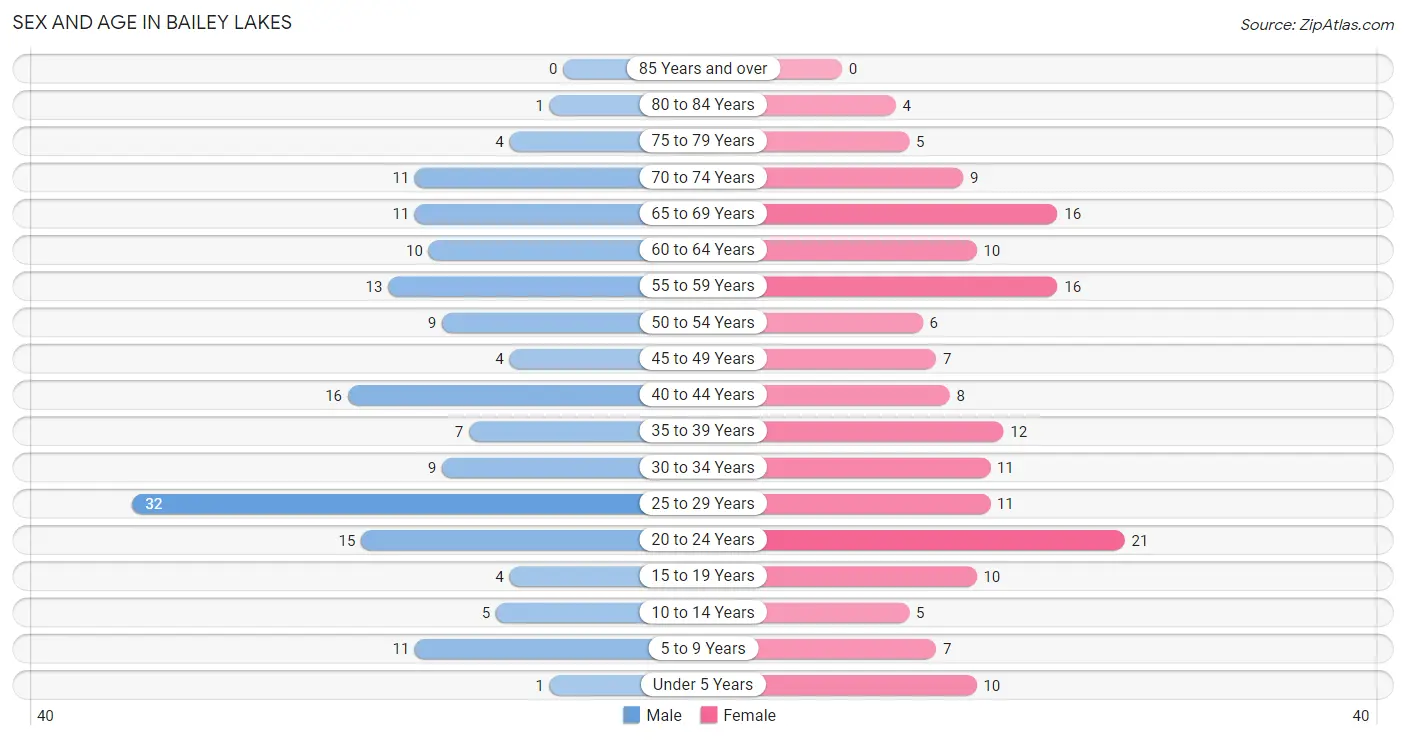
The most populous age groups in Bailey Lakes are 25 to 29 Years (32 | 19.6%) for men and 20 to 24 Years (21 | 12.5%) for women.
| Age Bracket | Male | Female |
| Under 5 Years | 1 (0.6%) | 10 (5.9%) |
| 5 to 9 Years | 11 (6.8%) | 7 (4.2%) |
| 10 to 14 Years | 5 (3.1%) | 5 (3.0%) |
| 15 to 19 Years | 4 (2.5%) | 10 (5.9%) |
| 20 to 24 Years | 15 (9.2%) | 21 (12.5%) |
| 25 to 29 Years | 32 (19.6%) | 11 (6.6%) |
| 30 to 34 Years | 9 (5.5%) | 11 (6.6%) |
| 35 to 39 Years | 7 (4.3%) | 12 (7.1%) |
| 40 to 44 Years | 16 (9.8%) | 8 (4.8%) |
| 45 to 49 Years | 4 (2.5%) | 7 (4.2%) |
| 50 to 54 Years | 9 (5.5%) | 6 (3.6%) |
| 55 to 59 Years | 13 (8.0%) | 16 (9.5%) |
| 60 to 64 Years | 10 (6.1%) | 10 (5.9%) |
| 65 to 69 Years | 11 (6.8%) | 16 (9.5%) |
| 70 to 74 Years | 11 (6.8%) | 9 (5.4%) |
| 75 to 79 Years | 4 (2.5%) | 5 (3.0%) |
| 80 to 84 Years | 1 (0.6%) | 4 (2.4%) |
| 85 Years and over | 0 (0.0%) | 0 (0.0%) |
| Total | 163 (100.0%) | 168 (100.0%) |
Families and Households in Bailey Lakes
Median Family Size in Bailey Lakes
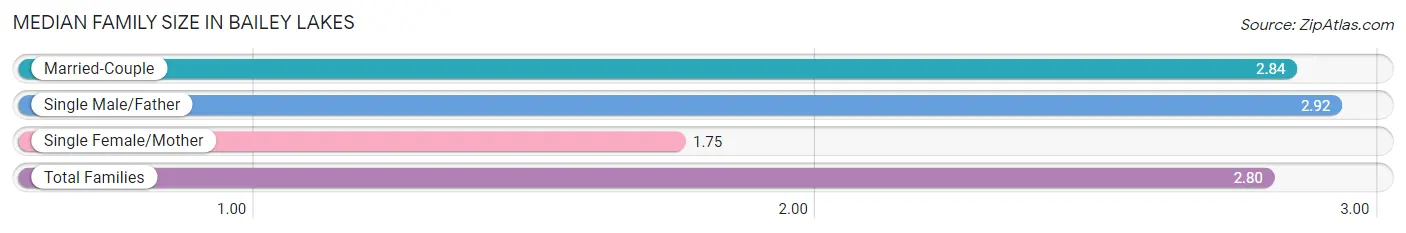
The median family size in Bailey Lakes is 2.80 persons per family, with single male/father families (12 | 14.3%) accounting for the largest median family size of 2.92 persons per family. On the other hand, single female/mother families (4 | 4.8%) represent the smallest median family size with 1.75 persons per family.
| Family Type | # Families | Family Size |
| Married-Couple | 68 (80.9%) | 2.84 |
| Single Male/Father | 12 (14.3%) | 2.92 |
| Single Female/Mother | 4 (4.8%) | 1.75 |
| Total Families | 84 (100.0%) | 2.80 |
Median Household Size in Bailey Lakes
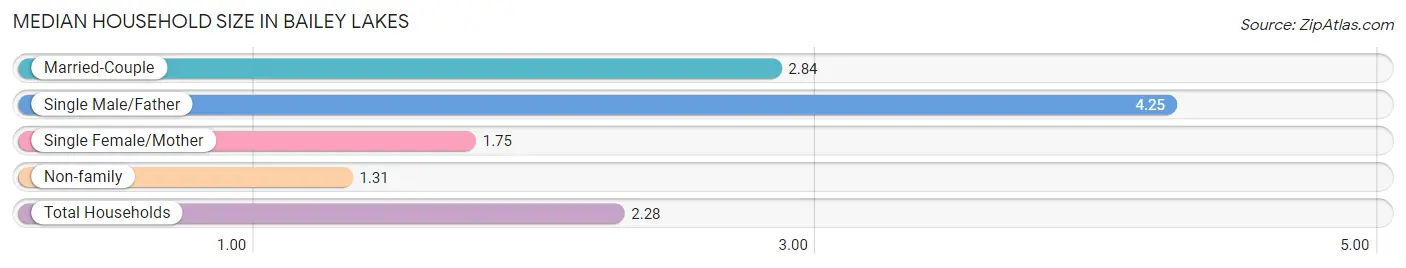
The median household size in Bailey Lakes is 2.28 persons per household, with single male/father households (12 | 8.3%) accounting for the largest median household size of 4.25 persons per household. non-family households (61 | 42.1%) represent the smallest median household size with 1.31 persons per household.
| Household Type | # Households | Household Size |
| Married-Couple | 68 (46.9%) | 2.84 |
| Single Male/Father | 12 (8.3%) | 4.25 |
| Single Female/Mother | 4 (2.8%) | 1.75 |
| Non-family | 61 (42.1%) | 1.31 |
| Total Households | 145 (100.0%) | 2.28 |
Household Size by Marriage Status in Bailey Lakes
Out of a total of 145 households in Bailey Lakes, 84 (57.9%) are family households, while 61 (42.1%) are nonfamily households. The most numerous type of family households are 2-person households, comprising 38, and the most common type of nonfamily households are 1-person households, comprising 42.
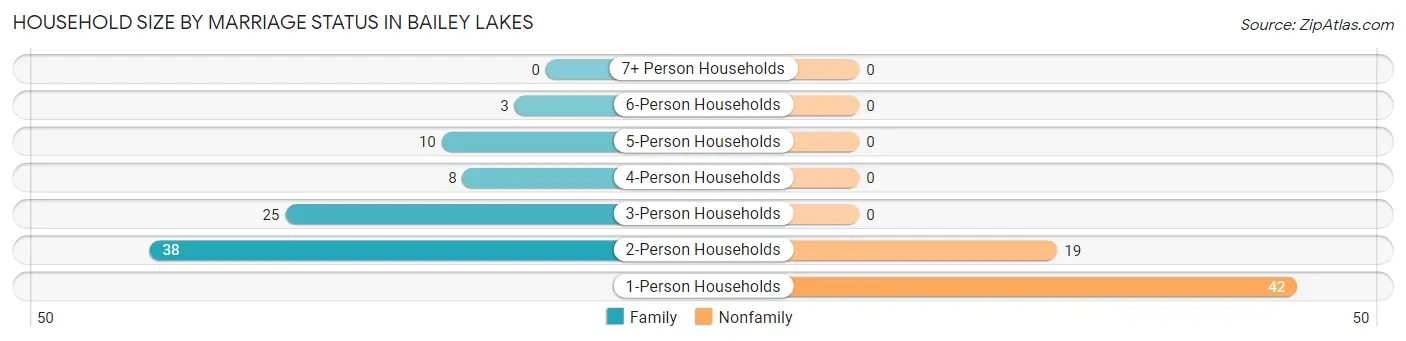
| Household Size | Family Households | Nonfamily Households |
| 1-Person Households | - | 42 (29.0%) |
| 2-Person Households | 38 (26.2%) | 19 (13.1%) |
| 3-Person Households | 25 (17.2%) | 0 (0.0%) |
| 4-Person Households | 8 (5.5%) | 0 (0.0%) |
| 5-Person Households | 10 (6.9%) | 0 (0.0%) |
| 6-Person Households | 3 (2.1%) | 0 (0.0%) |
| 7+ Person Households | 0 (0.0%) | 0 (0.0%) |
| Total | 84 (57.9%) | 61 (42.1%) |
Female Fertility in Bailey Lakes
Fertility by Age in Bailey Lakes
Average fertility rate in Bailey Lakes is 25.0 births per 1,000 women. Women in the age bracket of 35 to 50 years have the highest fertility rate with 74.0 births per 1,000 women. Women in the age bracket of 35 to 50 years acount for 100.0% of all women with births.
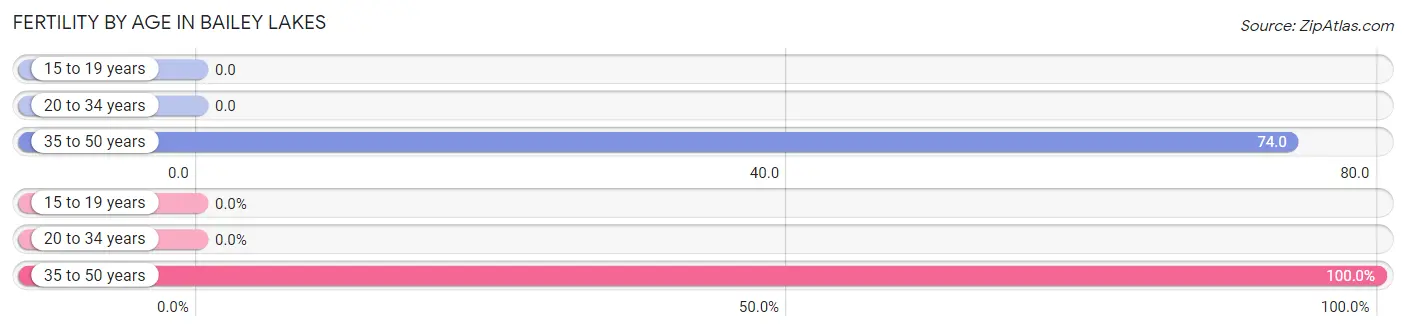
| Age Bracket | Women with Births | Births / 1,000 Women |
| 15 to 19 years | 0 (0.0%) | 0.0 |
| 20 to 34 years | 0 (0.0%) | 0.0 |
| 35 to 50 years | 2 (100.0%) | 74.0 |
| Total | 2 (100.0%) | 25.0 |
Fertility by Age by Marriage Status in Bailey Lakes
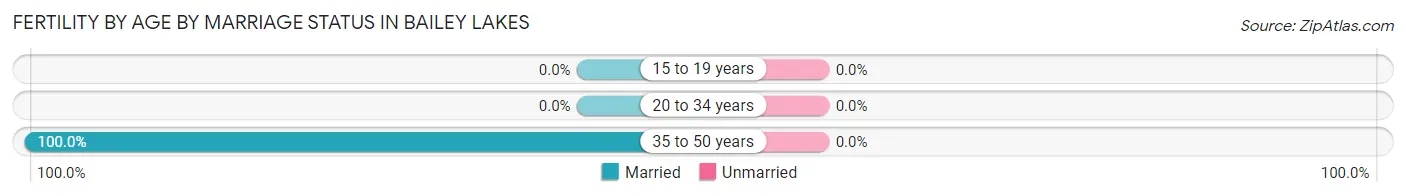
| Age Bracket | Married | Unmarried |
| 15 to 19 years | 0 (0.0%) | 0 (0.0%) |
| 20 to 34 years | 0 (0.0%) | 0 (0.0%) |
| 35 to 50 years | 2 (100.0%) | 0 (0.0%) |
| Total | 2 (100.0%) | 0 (0.0%) |
Fertility by Education in Bailey Lakes
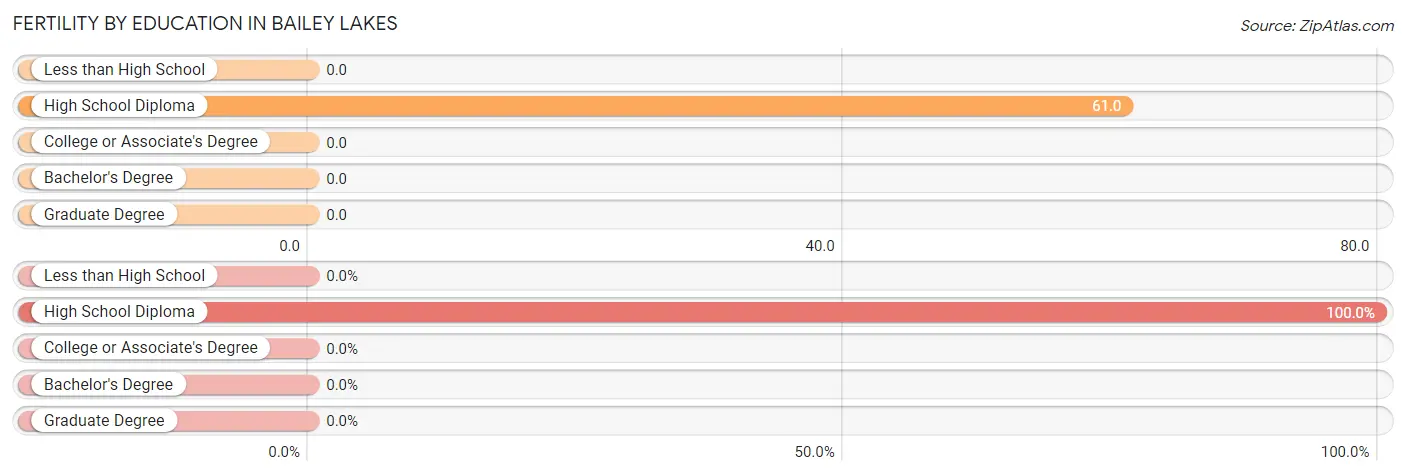
| Educational Attainment | Women with Births | Births / 1,000 Women |
| Less than High School | 0 (0.0%) | 0.0 |
| High School Diploma | 2 (100.0%) | 61.0 |
| College or Associate's Degree | 0 (0.0%) | 0.0 |
| Bachelor's Degree | 0 (0.0%) | 0.0 |
| Graduate Degree | 0 (0.0%) | 0.0 |
| Total | 2 (100.0%) | 25.0 |
Fertility by Education by Marriage Status in Bailey Lakes
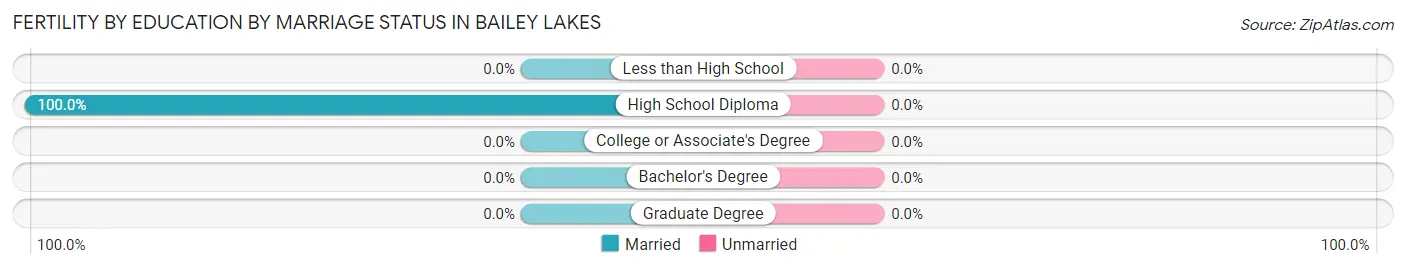
| Educational Attainment | Married | Unmarried |
| Less than High School | 0 (0.0%) | 0 (0.0%) |
| High School Diploma | 2 (100.0%) | 0 (0.0%) |
| College or Associate's Degree | 0 (0.0%) | 0 (0.0%) |
| Bachelor's Degree | 0 (0.0%) | 0 (0.0%) |
| Graduate Degree | 0 (0.0%) | 0 (0.0%) |
| Total | 2 (100.0%) | 0 (0.0%) |
Employment Characteristics in Bailey Lakes
Employment by Class of Employer in Bailey Lakes
Among the 208 employed individuals in Bailey Lakes, private company employees (150 | 72.1%), local government employees (23 | 11.1%), and not-for-profit organizations (13 | 6.2%) make up the most common classes of employment.
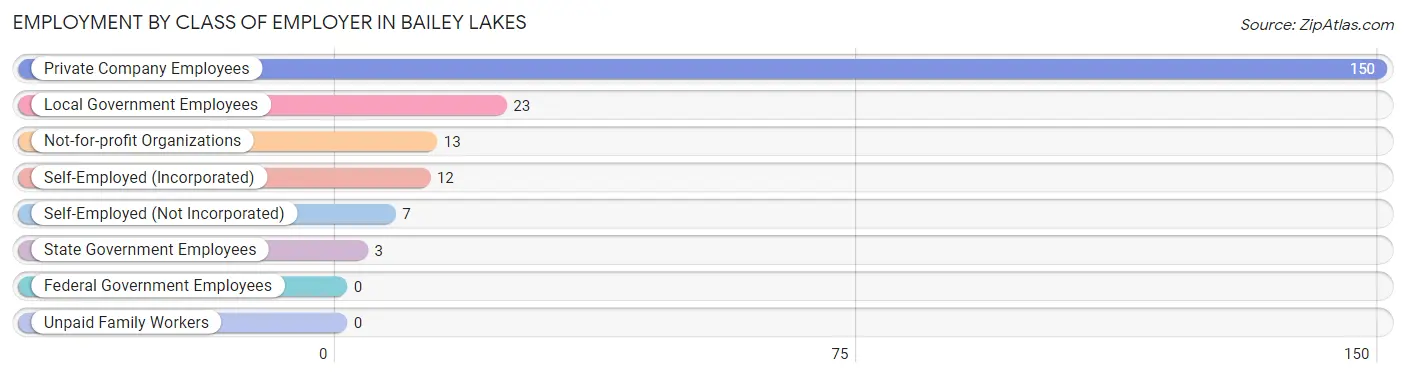
| Employer Class | # Employees | % Employees |
| Private Company Employees | 150 | 72.1% |
| Self-Employed (Incorporated) | 12 | 5.8% |
| Self-Employed (Not Incorporated) | 7 | 3.4% |
| Not-for-profit Organizations | 13 | 6.2% |
| Local Government Employees | 23 | 11.1% |
| State Government Employees | 3 | 1.4% |
| Federal Government Employees | 0 | 0.0% |
| Unpaid Family Workers | 0 | 0.0% |
| Total | 208 | 100.0% |
Employment Status by Age in Bailey Lakes
According to the labor force statistics for Bailey Lakes, out of the total population over 16 years of age (288), 74.7% or 215 individuals are in the labor force, with 2.8% or 6 of them unemployed. The age group with the highest labor force participation rate is 30 to 34 years, with 100.0% or 20 individuals in the labor force. Within the labor force, the 20 to 24 years age range has the highest percentage of unemployed individuals, with 8.6% or 3 of them being unemployed.
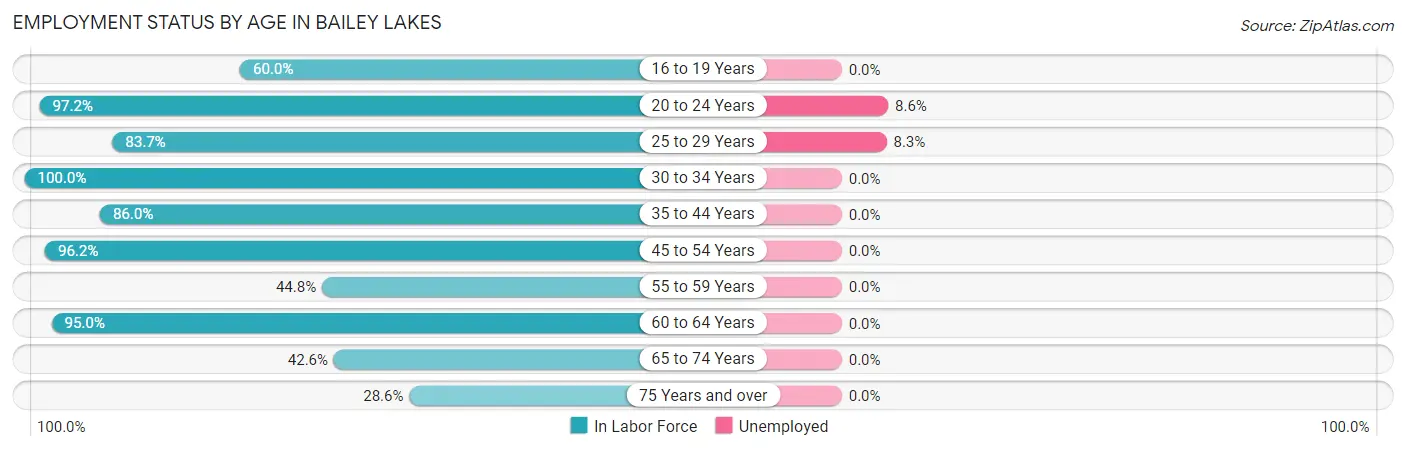
| Age Bracket | In Labor Force | Unemployed |
| 16 to 19 Years | 6 (60.0%) | 0 (0.0%) |
| 20 to 24 Years | 35 (97.2%) | 3 (8.6%) |
| 25 to 29 Years | 36 (83.7%) | 3 (8.3%) |
| 30 to 34 Years | 20 (100.0%) | 0 (0.0%) |
| 35 to 44 Years | 37 (86.0%) | 0 (0.0%) |
| 45 to 54 Years | 25 (96.2%) | 0 (0.0%) |
| 55 to 59 Years | 13 (44.8%) | 0 (0.0%) |
| 60 to 64 Years | 19 (95.0%) | 0 (0.0%) |
| 65 to 74 Years | 20 (42.6%) | 0 (0.0%) |
| 75 Years and over | 4 (28.6%) | 0 (0.0%) |
| Total | 215 (74.7%) | 6 (2.8%) |
Employment Status by Educational Attainment in Bailey Lakes
According to labor force statistics for Bailey Lakes, 82.9% of individuals (150) out of the total population between 25 and 64 years of age (181) are in the labor force, with 2.0% or 3 of them being unemployed. The group with the highest labor force participation rate are those with the educational attainment of bachelor's degree or higher, with 91.1% or 41 individuals in the labor force. Within the labor force, individuals with high school diploma education have the highest percentage of unemployment, with 4.5% or 3 of them being unemployed.
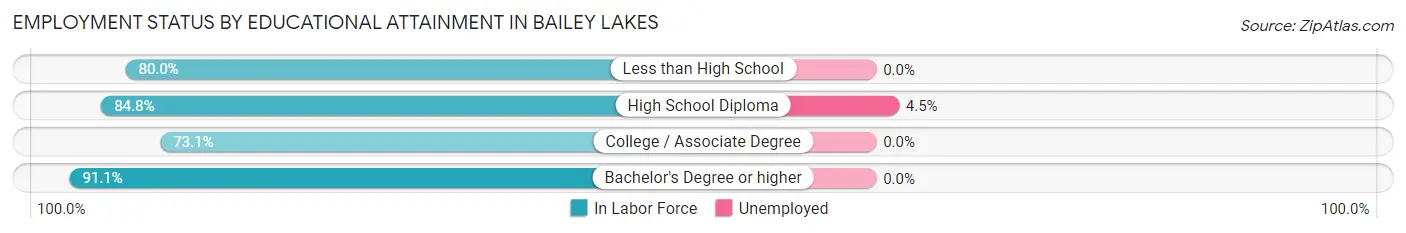
| Educational Attainment | In Labor Force | Unemployed |
| Less than High School | 4 (80.0%) | 0 (0.0%) |
| High School Diploma | 67 (84.8%) | 4 (4.5%) |
| College / Associate Degree | 38 (73.1%) | 0 (0.0%) |
| Bachelor's Degree or higher | 41 (91.1%) | 0 (0.0%) |
| Total | 150 (82.9%) | 4 (2.0%) |
Employment Occupations by Sex in Bailey Lakes
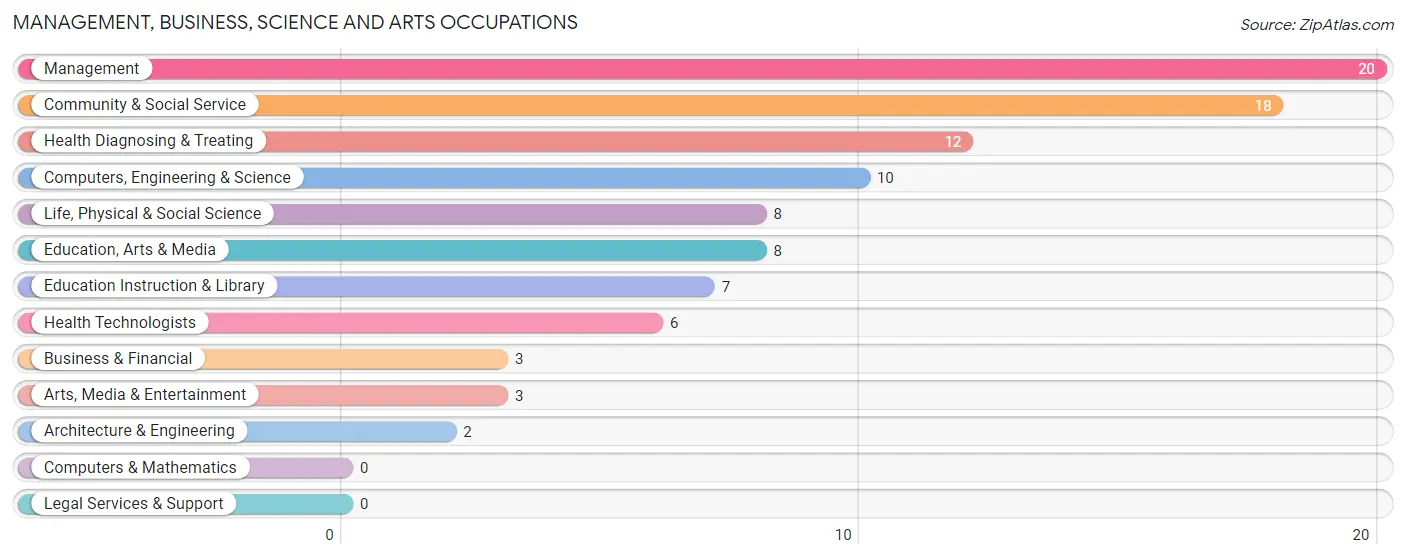
Management, Business, Science and Arts Occupations
The most common Management, Business, Science and Arts occupations in Bailey Lakes are Management (20 | 9.6%), Community & Social Service (18 | 8.6%), Health Diagnosing & Treating (12 | 5.7%), Computers, Engineering & Science (10 | 4.8%), and Life, Physical & Social Science (8 | 3.8%).
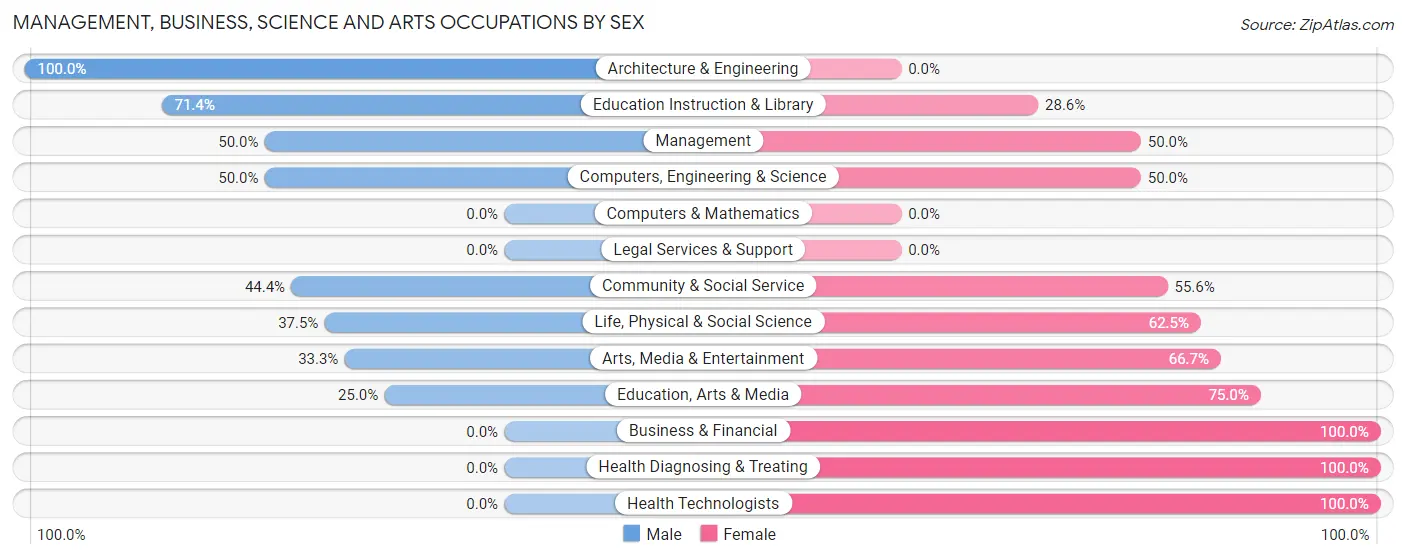
Management, Business, Science and Arts Occupations by Sex
Within the Management, Business, Science and Arts occupations in Bailey Lakes, the most male-oriented occupations are Architecture & Engineering (100.0%), Education Instruction & Library (71.4%), and Management (50.0%), while the most female-oriented occupations are Business & Financial (100.0%), Health Diagnosing & Treating (100.0%), and Health Technologists (100.0%).
| Occupation | Male | Female |
| Management | 10 (50.0%) | 10 (50.0%) |
| Business & Financial | 0 (0.0%) | 3 (100.0%) |
| Computers, Engineering & Science | 5 (50.0%) | 5 (50.0%) |
| Computers & Mathematics | 0 (0.0%) | 0 (0.0%) |
| Architecture & Engineering | 2 (100.0%) | 0 (0.0%) |
| Life, Physical & Social Science | 3 (37.5%) | 5 (62.5%) |
| Community & Social Service | 8 (44.4%) | 10 (55.6%) |
| Education, Arts & Media | 2 (25.0%) | 6 (75.0%) |
| Legal Services & Support | 0 (0.0%) | 0 (0.0%) |
| Education Instruction & Library | 5 (71.4%) | 2 (28.6%) |
| Arts, Media & Entertainment | 1 (33.3%) | 2 (66.7%) |
| Health Diagnosing & Treating | 0 (0.0%) | 12 (100.0%) |
| Health Technologists | 0 (0.0%) | 6 (100.0%) |
| Total (Category) | 23 (36.5%) | 40 (63.5%) |
| Total (Overall) | 107 (51.2%) | 102 (48.8%) |
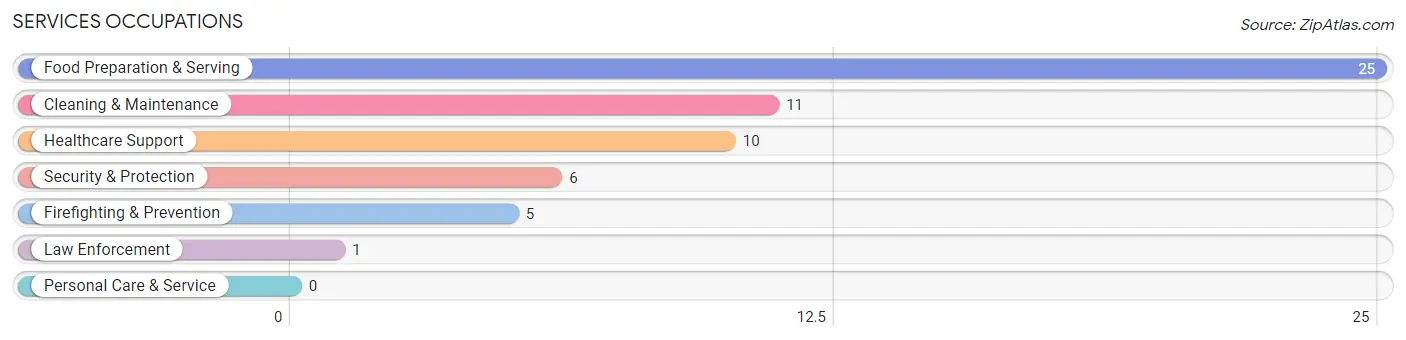
Services Occupations
The most common Services occupations in Bailey Lakes are Food Preparation & Serving (25 | 12.0%), Cleaning & Maintenance (11 | 5.3%), Healthcare Support (10 | 4.8%), Security & Protection (6 | 2.9%), and Firefighting & Prevention (5 | 2.4%).
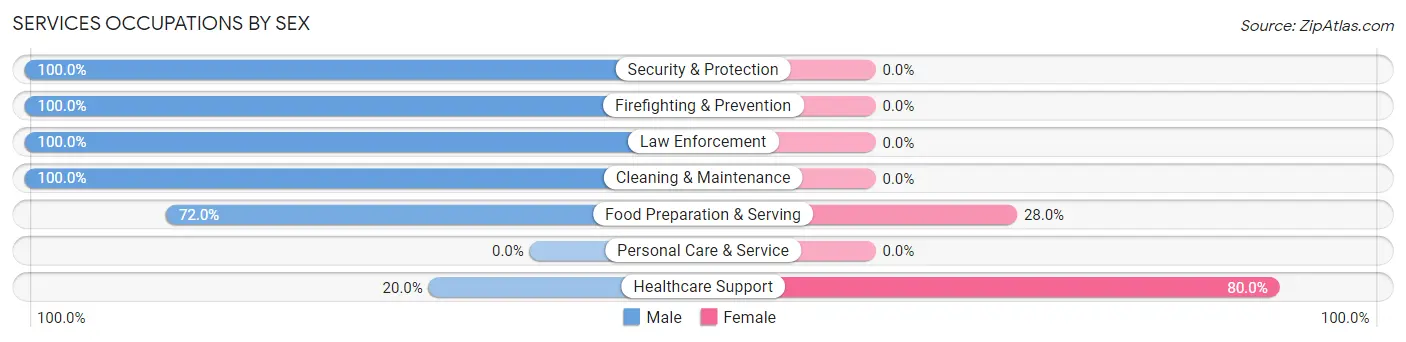
Services Occupations by Sex
Within the Services occupations in Bailey Lakes, the most male-oriented occupations are Security & Protection (100.0%), Firefighting & Prevention (100.0%), and Law Enforcement (100.0%), while the most female-oriented occupations are Healthcare Support (80.0%), and Food Preparation & Serving (28.0%).
| Occupation | Male | Female |
| Healthcare Support | 2 (20.0%) | 8 (80.0%) |
| Security & Protection | 6 (100.0%) | 0 (0.0%) |
| Firefighting & Prevention | 5 (100.0%) | 0 (0.0%) |
| Law Enforcement | 1 (100.0%) | 0 (0.0%) |
| Food Preparation & Serving | 18 (72.0%) | 7 (28.0%) |
| Cleaning & Maintenance | 11 (100.0%) | 0 (0.0%) |
| Personal Care & Service | 0 (0.0%) | 0 (0.0%) |
| Total (Category) | 37 (71.2%) | 15 (28.8%) |
| Total (Overall) | 107 (51.2%) | 102 (48.8%) |
Sales and Office Occupations
The most common Sales and Office occupations in Bailey Lakes are Sales & Related (38 | 18.2%), and Office & Administration (14 | 6.7%).
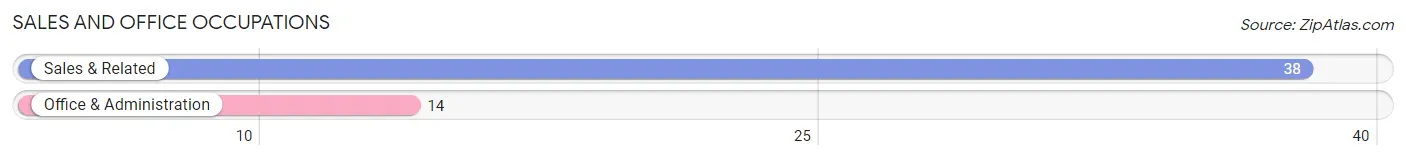
Sales and Office Occupations by Sex
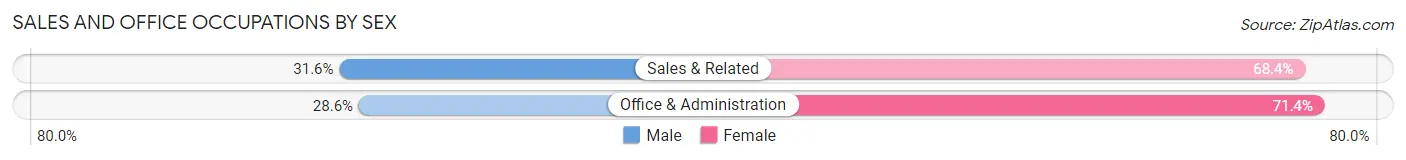
| Occupation | Male | Female |
| Sales & Related | 12 (31.6%) | 26 (68.4%) |
| Office & Administration | 4 (28.6%) | 10 (71.4%) |
| Total (Category) | 16 (30.8%) | 36 (69.2%) |
| Total (Overall) | 107 (51.2%) | 102 (48.8%) |
Natural Resources, Construction and Maintenance Occupations
The most common Natural Resources, Construction and Maintenance occupations in Bailey Lakes are Installation, Maintenance & Repair (14 | 6.7%), Construction & Extraction (3 | 1.4%), and Farming, Fishing & Forestry (1 | 0.5%).
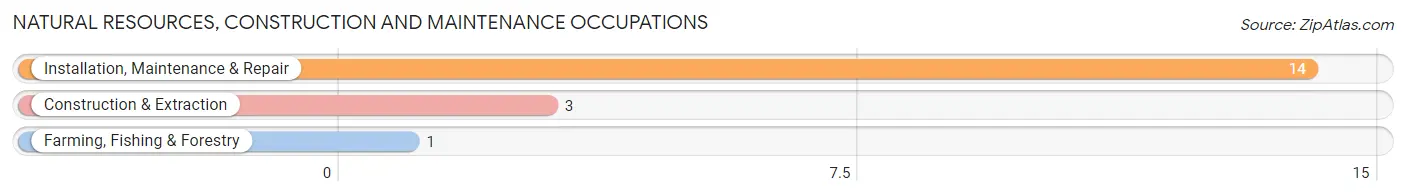
Natural Resources, Construction and Maintenance Occupations by Sex
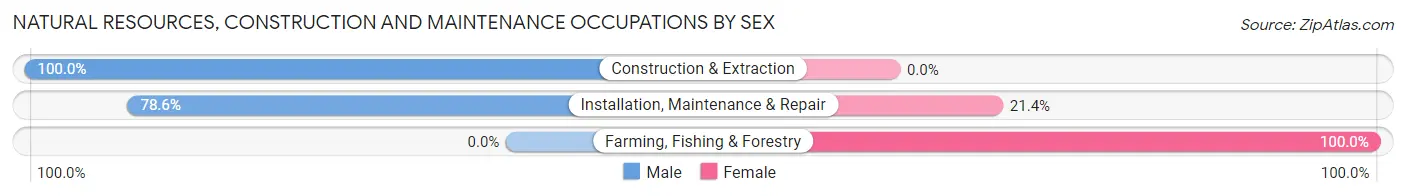
| Occupation | Male | Female |
| Farming, Fishing & Forestry | 0 (0.0%) | 1 (100.0%) |
| Construction & Extraction | 3 (100.0%) | 0 (0.0%) |
| Installation, Maintenance & Repair | 11 (78.6%) | 3 (21.4%) |
| Total (Category) | 14 (77.8%) | 4 (22.2%) |
| Total (Overall) | 107 (51.2%) | 102 (48.8%) |
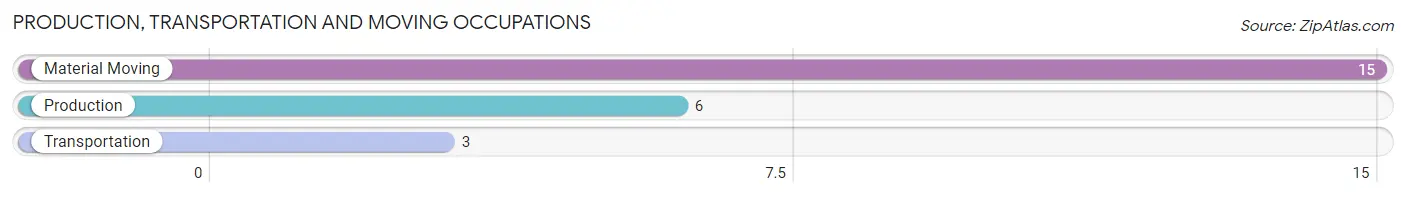
Production, Transportation and Moving Occupations
The most common Production, Transportation and Moving occupations in Bailey Lakes are Material Moving (15 | 7.2%), Production (6 | 2.9%), and Transportation (3 | 1.4%).
Production, Transportation and Moving Occupations by Sex
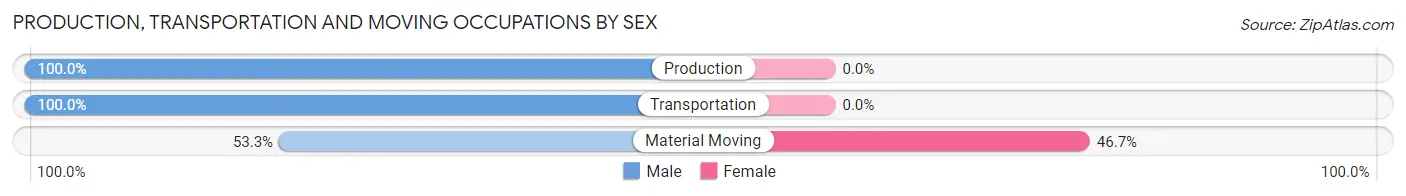
| Occupation | Male | Female |
| Production | 6 (100.0%) | 0 (0.0%) |
| Transportation | 3 (100.0%) | 0 (0.0%) |
| Material Moving | 8 (53.3%) | 7 (46.7%) |
| Total (Category) | 17 (70.8%) | 7 (29.2%) |
| Total (Overall) | 107 (51.2%) | 102 (48.8%) |
Employment Industries by Sex in Bailey Lakes
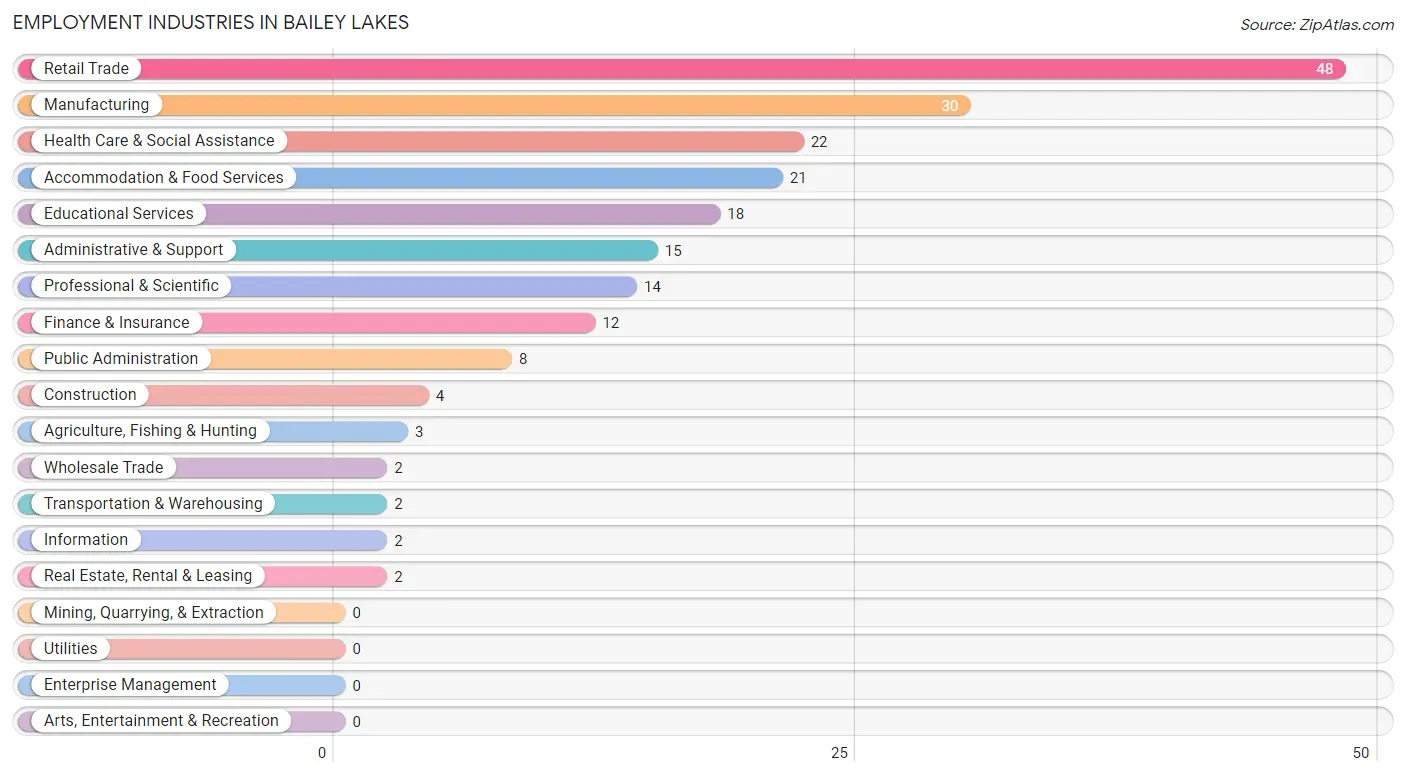
Employment Industries in Bailey Lakes
The major employment industries in Bailey Lakes include Retail Trade (48 | 23.0%), Manufacturing (30 | 14.3%), Health Care & Social Assistance (22 | 10.5%), Accommodation & Food Services (21 | 10.1%), and Educational Services (18 | 8.6%).
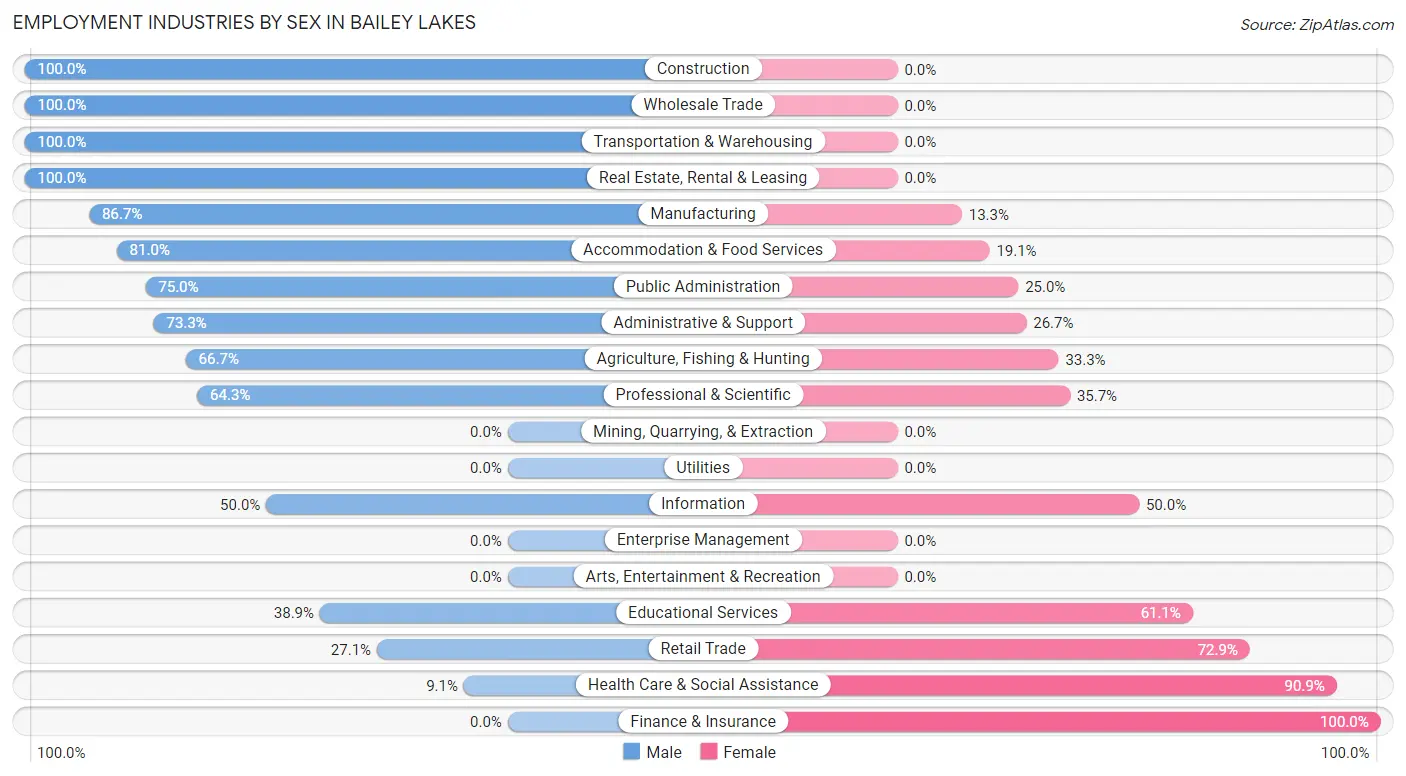
Employment Industries by Sex in Bailey Lakes
The Bailey Lakes industries that see more men than women are Construction (100.0%), Wholesale Trade (100.0%), and Transportation & Warehousing (100.0%), whereas the industries that tend to have a higher number of women are Finance & Insurance (100.0%), Health Care & Social Assistance (90.9%), and Retail Trade (72.9%).
| Industry | Male | Female |
| Agriculture, Fishing & Hunting | 2 (66.7%) | 1 (33.3%) |
| Mining, Quarrying, & Extraction | 0 (0.0%) | 0 (0.0%) |
| Construction | 4 (100.0%) | 0 (0.0%) |
| Manufacturing | 26 (86.7%) | 4 (13.3%) |
| Wholesale Trade | 2 (100.0%) | 0 (0.0%) |
| Retail Trade | 13 (27.1%) | 35 (72.9%) |
| Transportation & Warehousing | 2 (100.0%) | 0 (0.0%) |
| Utilities | 0 (0.0%) | 0 (0.0%) |
| Information | 1 (50.0%) | 1 (50.0%) |
| Finance & Insurance | 0 (0.0%) | 12 (100.0%) |
| Real Estate, Rental & Leasing | 2 (100.0%) | 0 (0.0%) |
| Professional & Scientific | 9 (64.3%) | 5 (35.7%) |
| Enterprise Management | 0 (0.0%) | 0 (0.0%) |
| Administrative & Support | 11 (73.3%) | 4 (26.7%) |
| Educational Services | 7 (38.9%) | 11 (61.1%) |
| Health Care & Social Assistance | 2 (9.1%) | 20 (90.9%) |
| Arts, Entertainment & Recreation | 0 (0.0%) | 0 (0.0%) |
| Accommodation & Food Services | 17 (80.9%) | 4 (19.1%) |
| Public Administration | 6 (75.0%) | 2 (25.0%) |
| Total | 107 (51.2%) | 102 (48.8%) |
Education in Bailey Lakes
School Enrollment in Bailey Lakes
The most common levels of schooling among the 53 students in Bailey Lakes are elementary school (14 | 26.4%), college / undergraduate (14 | 26.4%), and high school (12 | 22.6%).
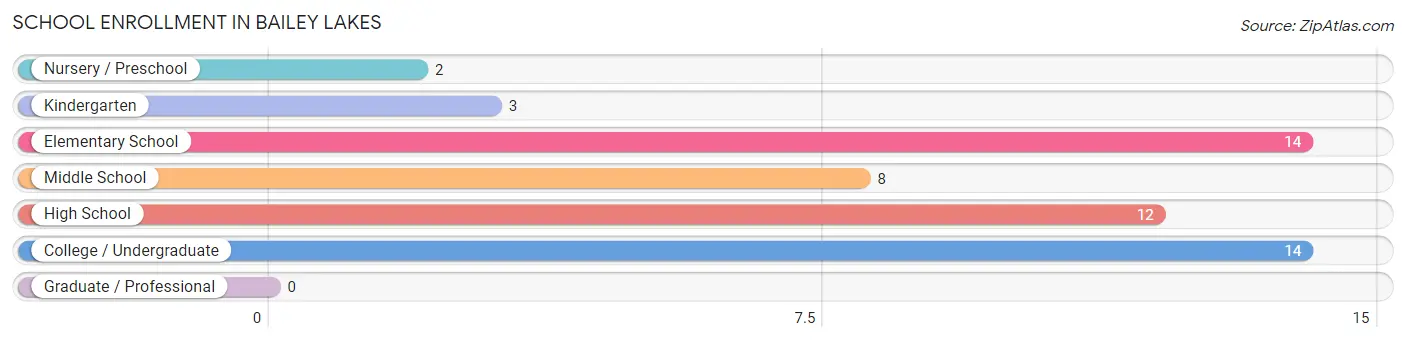
| School Level | # Students | % Students |
| Nursery / Preschool | 2 | 3.8% |
| Kindergarten | 3 | 5.7% |
| Elementary School | 14 | 26.4% |
| Middle School | 8 | 15.1% |
| High School | 12 | 22.6% |
| College / Undergraduate | 14 | 26.4% |
| Graduate / Professional | 0 | 0.0% |
| Total | 53 | 100.0% |
School Enrollment by Age by Funding Source in Bailey Lakes
Out of a total of 53 students who are enrolled in schools in Bailey Lakes, 15 (28.3%) attend a private institution, while the remaining 38 (71.7%) are enrolled in public schools. The age group of 20 to 24 year olds has the highest likelihood of being enrolled in private schools, with 3 (50.0% in the age bracket) enrolled. Conversely, the age group of 3 to 4 year olds has the lowest likelihood of being enrolled in a private school, with 1 (100.0% in the age bracket) attending a public institution.
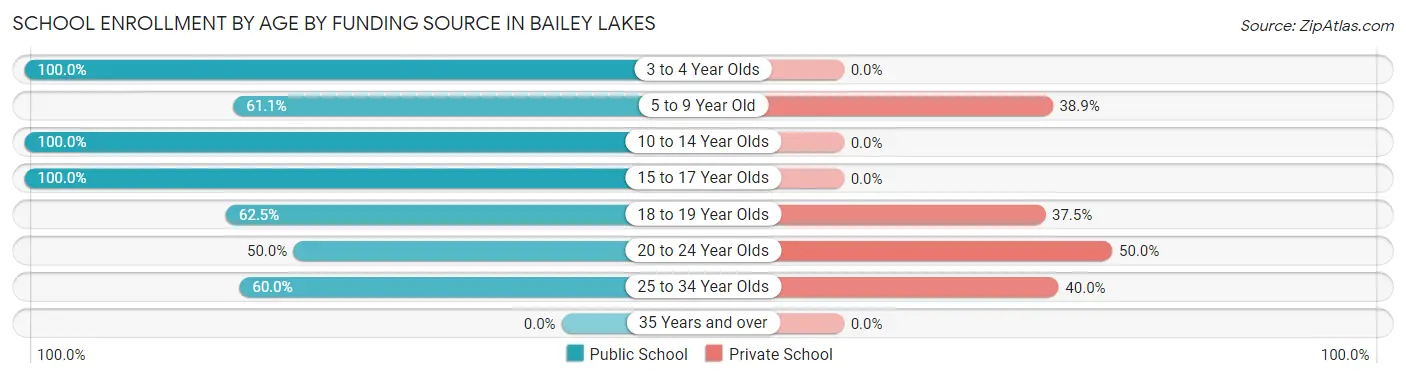
| Age Bracket | Public School | Private School |
| 3 to 4 Year Olds | 1 (100.0%) | 0 (0.0%) |
| 5 to 9 Year Old | 11 (61.1%) | 7 (38.9%) |
| 10 to 14 Year Olds | 10 (100.0%) | 0 (0.0%) |
| 15 to 17 Year Olds | 5 (100.0%) | 0 (0.0%) |
| 18 to 19 Year Olds | 5 (62.5%) | 3 (37.5%) |
| 20 to 24 Year Olds | 3 (50.0%) | 3 (50.0%) |
| 25 to 34 Year Olds | 3 (60.0%) | 2 (40.0%) |
| 35 Years and over | 0 (0.0%) | 0 (0.0%) |
| Total | 38 (71.7%) | 15 (28.3%) |
Educational Attainment by Field of Study in Bailey Lakes
Education (21 | 32.8%), business (10 | 15.6%), science & technology (9 | 14.1%), liberal arts & history (7 | 10.9%), and arts & humanities (7 | 10.9%) are the most common fields of study among 64 individuals in Bailey Lakes who have obtained a bachelor's degree or higher.
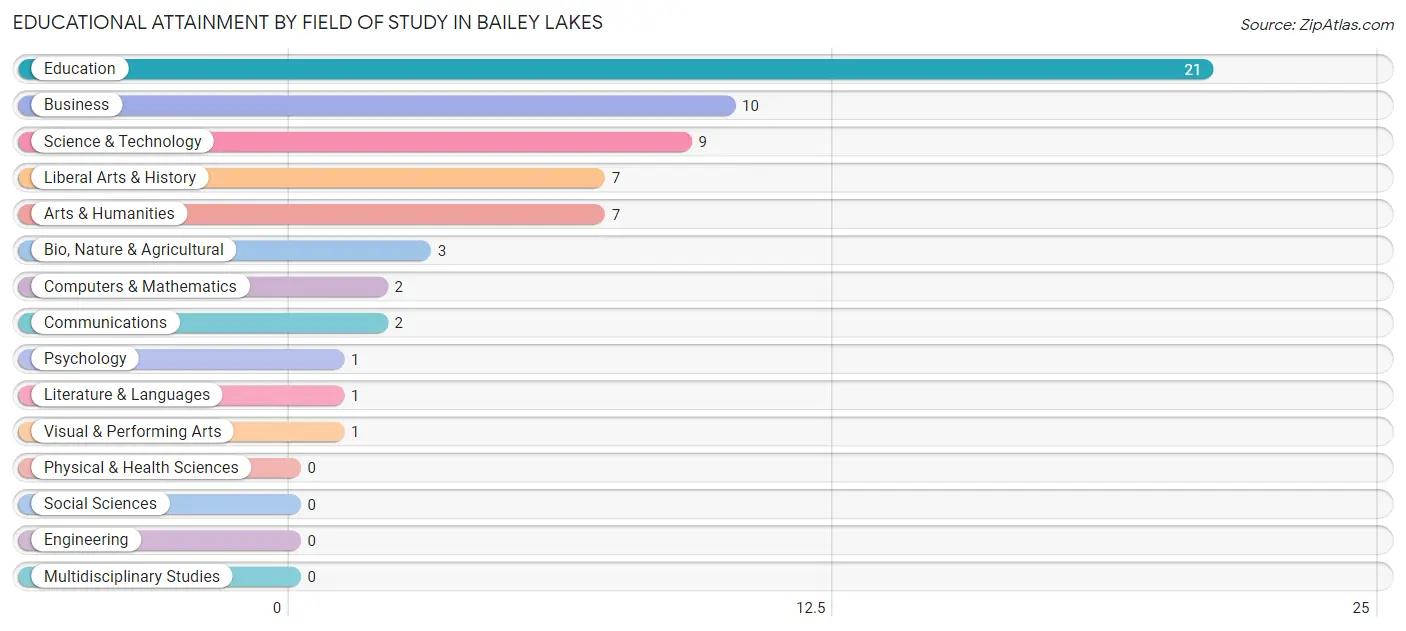
| Field of Study | # Graduates | % Graduates |
| Computers & Mathematics | 2 | 3.1% |
| Bio, Nature & Agricultural | 3 | 4.7% |
| Physical & Health Sciences | 0 | 0.0% |
| Psychology | 1 | 1.6% |
| Social Sciences | 0 | 0.0% |
| Engineering | 0 | 0.0% |
| Multidisciplinary Studies | 0 | 0.0% |
| Science & Technology | 9 | 14.1% |
| Business | 10 | 15.6% |
| Education | 21 | 32.8% |
| Literature & Languages | 1 | 1.6% |
| Liberal Arts & History | 7 | 10.9% |
| Visual & Performing Arts | 1 | 1.6% |
| Communications | 2 | 3.1% |
| Arts & Humanities | 7 | 10.9% |
| Total | 64 | 100.0% |
Transportation & Commute in Bailey Lakes
Vehicle Availability by Sex in Bailey Lakes
The most prevalent vehicle ownership categories in Bailey Lakes are males with 2 vehicles (45, accounting for 42.1%) and females with 2 vehicles (46, making up 44.6%).
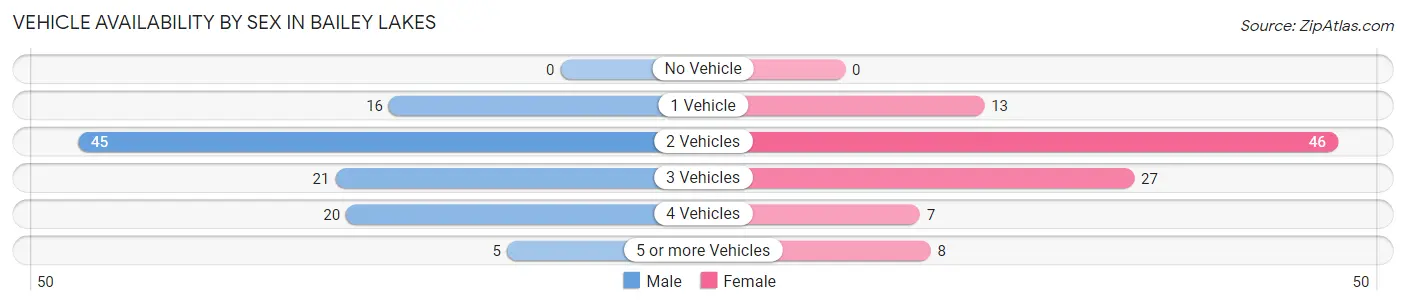
| Vehicles Available | Male | Female |
| No Vehicle | 0 (0.0%) | 0 (0.0%) |
| 1 Vehicle | 16 (14.9%) | 13 (12.9%) |
| 2 Vehicles | 45 (42.1%) | 46 (45.5%) |
| 3 Vehicles | 21 (19.6%) | 27 (26.7%) |
| 4 Vehicles | 20 (18.7%) | 7 (6.9%) |
| 5 or more Vehicles | 5 (4.7%) | 8 (7.9%) |
| Total | 107 (100.0%) | 101 (100.0%) |
Commute Time in Bailey Lakes
The most frequently occuring commute durations in Bailey Lakes are 15 to 19 minutes (62 commuters, 32.1%), 10 to 14 minutes (43 commuters, 22.3%), and 20 to 24 minutes (19 commuters, 9.8%).
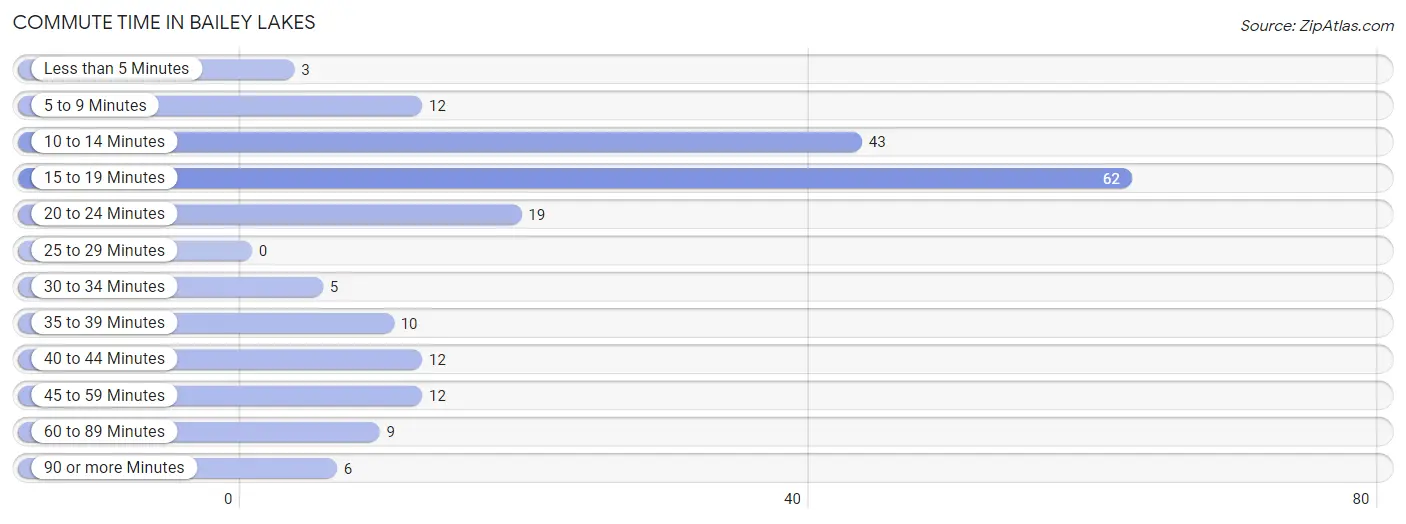
| Commute Time | # Commuters | % Commuters |
| Less than 5 Minutes | 3 | 1.5% |
| 5 to 9 Minutes | 12 | 6.2% |
| 10 to 14 Minutes | 43 | 22.3% |
| 15 to 19 Minutes | 62 | 32.1% |
| 20 to 24 Minutes | 19 | 9.8% |
| 25 to 29 Minutes | 0 | 0.0% |
| 30 to 34 Minutes | 5 | 2.6% |
| 35 to 39 Minutes | 10 | 5.2% |
| 40 to 44 Minutes | 12 | 6.2% |
| 45 to 59 Minutes | 12 | 6.2% |
| 60 to 89 Minutes | 9 | 4.7% |
| 90 or more Minutes | 6 | 3.1% |
Commute Time by Sex in Bailey Lakes
The most common commute times in Bailey Lakes are 15 to 19 minutes (27 commuters, 25.7%) for males and 15 to 19 minutes (35 commuters, 39.8%) for females.
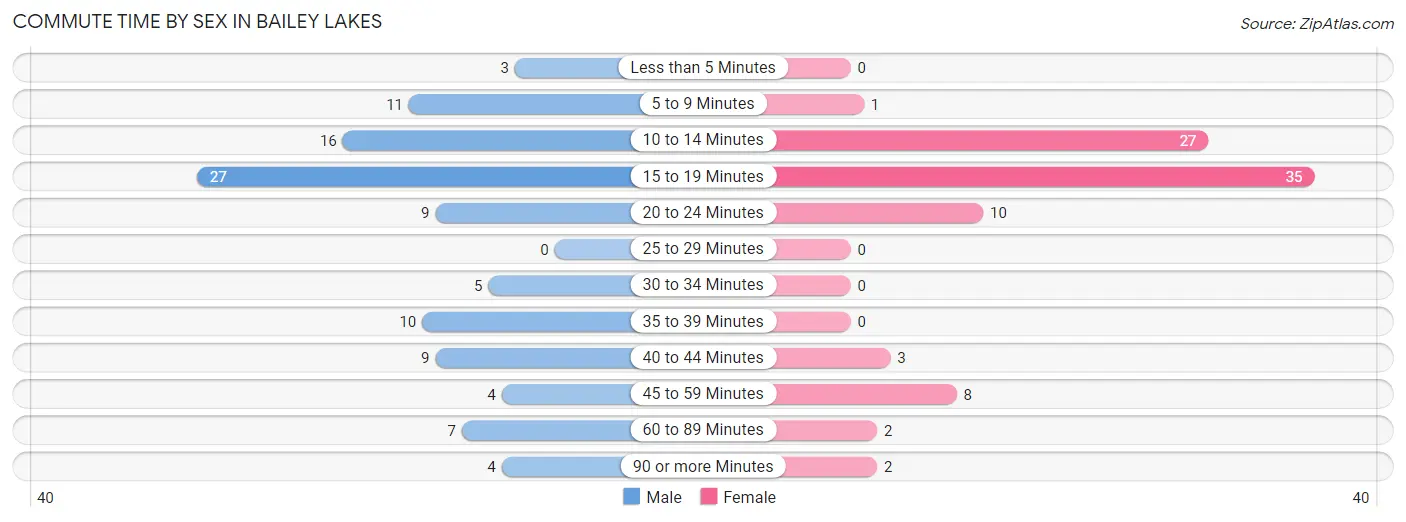
| Commute Time | Male | Female |
| Less than 5 Minutes | 3 (2.9%) | 0 (0.0%) |
| 5 to 9 Minutes | 11 (10.5%) | 1 (1.1%) |
| 10 to 14 Minutes | 16 (15.2%) | 27 (30.7%) |
| 15 to 19 Minutes | 27 (25.7%) | 35 (39.8%) |
| 20 to 24 Minutes | 9 (8.6%) | 10 (11.4%) |
| 25 to 29 Minutes | 0 (0.0%) | 0 (0.0%) |
| 30 to 34 Minutes | 5 (4.8%) | 0 (0.0%) |
| 35 to 39 Minutes | 10 (9.5%) | 0 (0.0%) |
| 40 to 44 Minutes | 9 (8.6%) | 3 (3.4%) |
| 45 to 59 Minutes | 4 (3.8%) | 8 (9.1%) |
| 60 to 89 Minutes | 7 (6.7%) | 2 (2.3%) |
| 90 or more Minutes | 4 (3.8%) | 2 (2.3%) |
Time of Departure to Work by Sex in Bailey Lakes
The most frequent times of departure to work in Bailey Lakes are 6:30 AM to 6:59 AM (30, 28.6%) for males and 7:30 AM to 7:59 AM (22, 25.0%) for females.
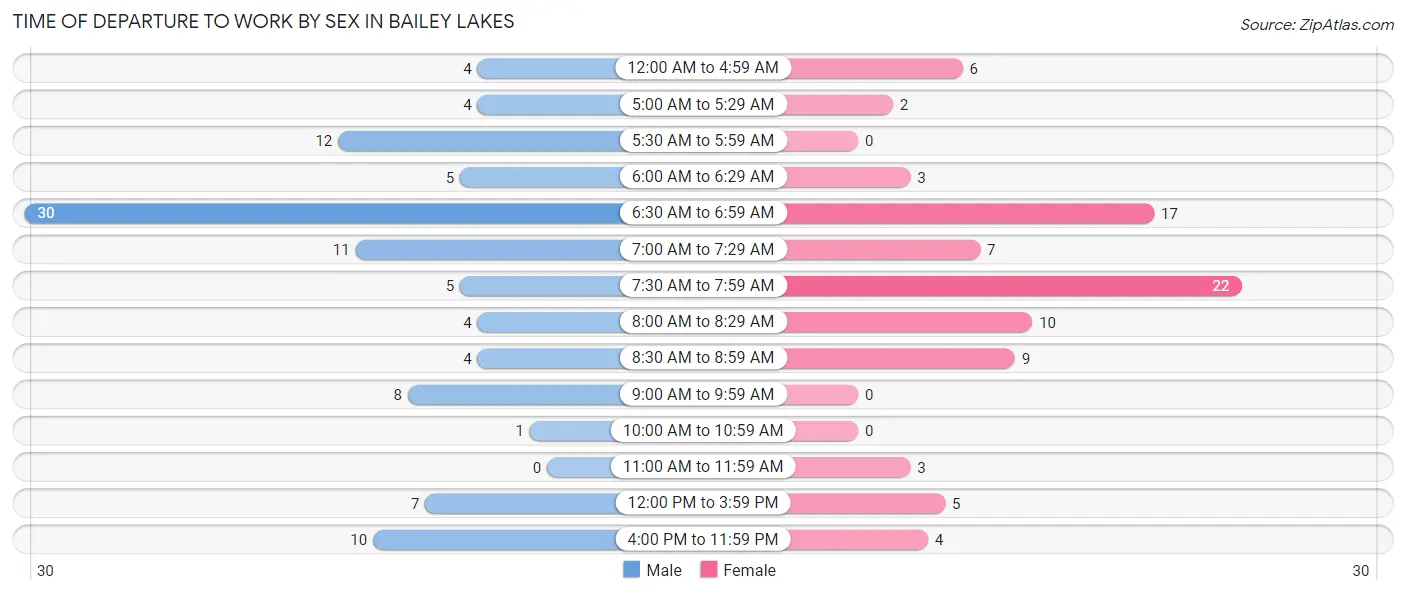
| Time of Departure | Male | Female |
| 12:00 AM to 4:59 AM | 4 (3.8%) | 6 (6.8%) |
| 5:00 AM to 5:29 AM | 4 (3.8%) | 2 (2.3%) |
| 5:30 AM to 5:59 AM | 12 (11.4%) | 0 (0.0%) |
| 6:00 AM to 6:29 AM | 5 (4.8%) | 3 (3.4%) |
| 6:30 AM to 6:59 AM | 30 (28.6%) | 17 (19.3%) |
| 7:00 AM to 7:29 AM | 11 (10.5%) | 7 (8.0%) |
| 7:30 AM to 7:59 AM | 5 (4.8%) | 22 (25.0%) |
| 8:00 AM to 8:29 AM | 4 (3.8%) | 10 (11.4%) |
| 8:30 AM to 8:59 AM | 4 (3.8%) | 9 (10.2%) |
| 9:00 AM to 9:59 AM | 8 (7.6%) | 0 (0.0%) |
| 10:00 AM to 10:59 AM | 1 (0.9%) | 0 (0.0%) |
| 11:00 AM to 11:59 AM | 0 (0.0%) | 3 (3.4%) |
| 12:00 PM to 3:59 PM | 7 (6.7%) | 5 (5.7%) |
| 4:00 PM to 11:59 PM | 10 (9.5%) | 4 (4.5%) |
| Total | 105 (100.0%) | 88 (100.0%) |
Housing Occupancy in Bailey Lakes
Occupancy by Ownership in Bailey Lakes
Of the total 145 dwellings in Bailey Lakes, owner-occupied units account for 89 (61.4%), while renter-occupied units make up 56 (38.6%).
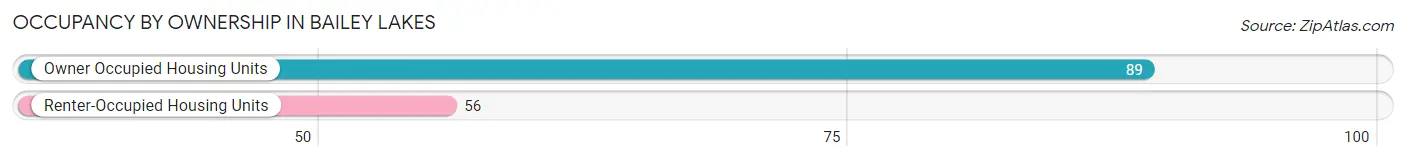
| Occupancy | # Housing Units | % Housing Units |
| Owner Occupied Housing Units | 89 | 61.4% |
| Renter-Occupied Housing Units | 56 | 38.6% |
| Total Occupied Housing Units | 145 | 100.0% |
Occupancy by Household Size in Bailey Lakes
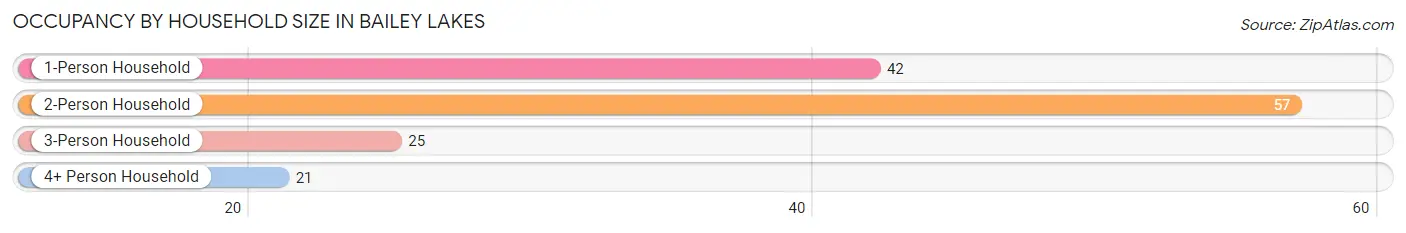
| Household Size | # Housing Units | % Housing Units |
| 1-Person Household | 42 | 29.0% |
| 2-Person Household | 57 | 39.3% |
| 3-Person Household | 25 | 17.2% |
| 4+ Person Household | 21 | 14.5% |
| Total Housing Units | 145 | 100.0% |
Occupancy by Ownership by Household Size in Bailey Lakes
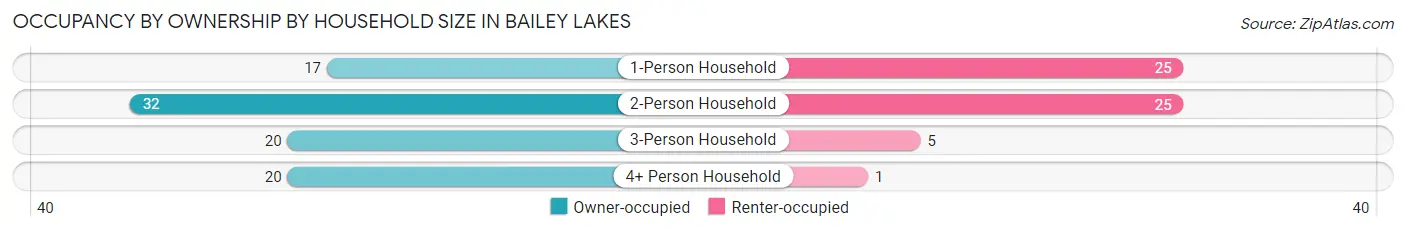
| Household Size | Owner-occupied | Renter-occupied |
| 1-Person Household | 17 (40.5%) | 25 (59.5%) |
| 2-Person Household | 32 (56.1%) | 25 (43.9%) |
| 3-Person Household | 20 (80.0%) | 5 (20.0%) |
| 4+ Person Household | 20 (95.2%) | 1 (4.8%) |
| Total Housing Units | 89 (61.4%) | 56 (38.6%) |
Occupancy by Educational Attainment in Bailey Lakes
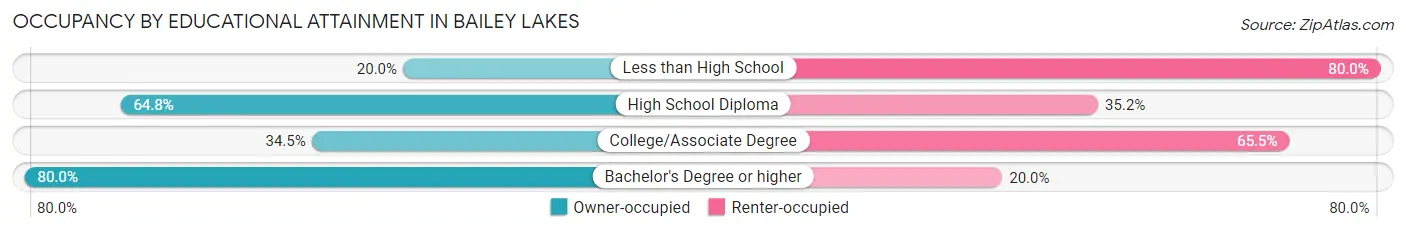
| Household Size | Owner-occupied | Renter-occupied |
| Less than High School | 1 (20.0%) | 4 (80.0%) |
| High School Diploma | 46 (64.8%) | 25 (35.2%) |
| College/Associate Degree | 10 (34.5%) | 19 (65.5%) |
| Bachelor's Degree or higher | 32 (80.0%) | 8 (20.0%) |
Occupancy by Age of Householder in Bailey Lakes
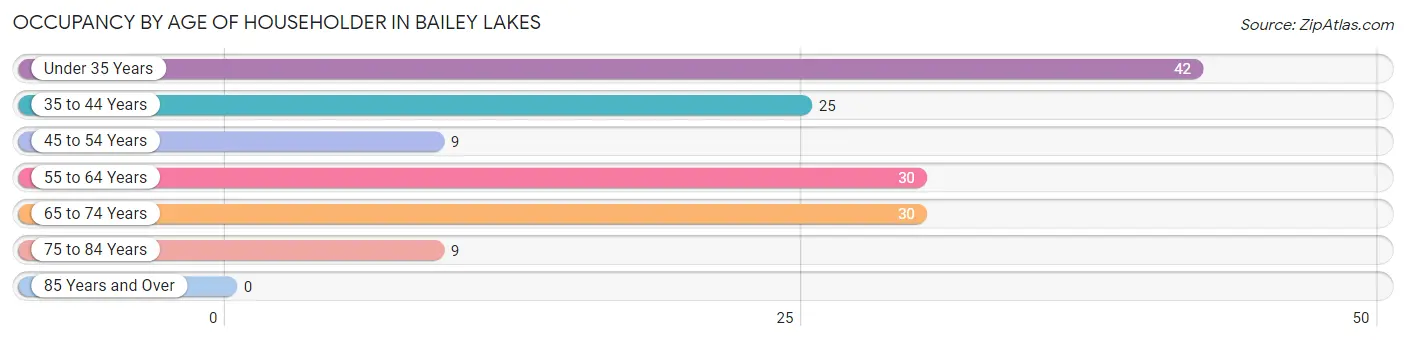
| Age Bracket | # Households | % Households |
| Under 35 Years | 42 | 29.0% |
| 35 to 44 Years | 25 | 17.2% |
| 45 to 54 Years | 9 | 6.2% |
| 55 to 64 Years | 30 | 20.7% |
| 65 to 74 Years | 30 | 20.7% |
| 75 to 84 Years | 9 | 6.2% |
| 85 Years and Over | 0 | 0.0% |
| Total | 145 | 100.0% |
Housing Finances in Bailey Lakes
Median Income by Occupancy in Bailey Lakes
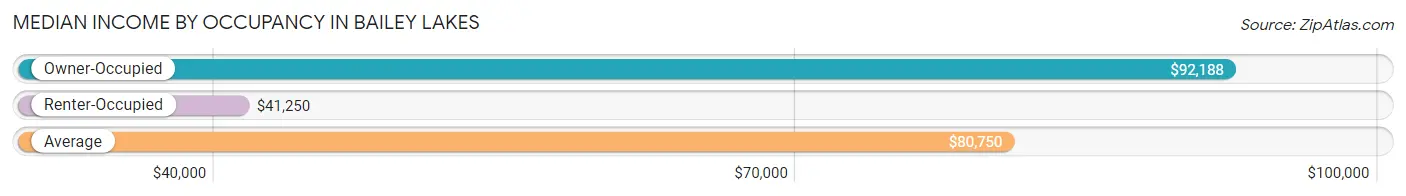
| Occupancy Type | # Households | Median Income |
| Owner-Occupied | 89 (61.4%) | $92,188 |
| Renter-Occupied | 56 (38.6%) | $41,250 |
| Average | 145 (100.0%) | $80,750 |
Occupancy by Householder Income Bracket in Bailey Lakes
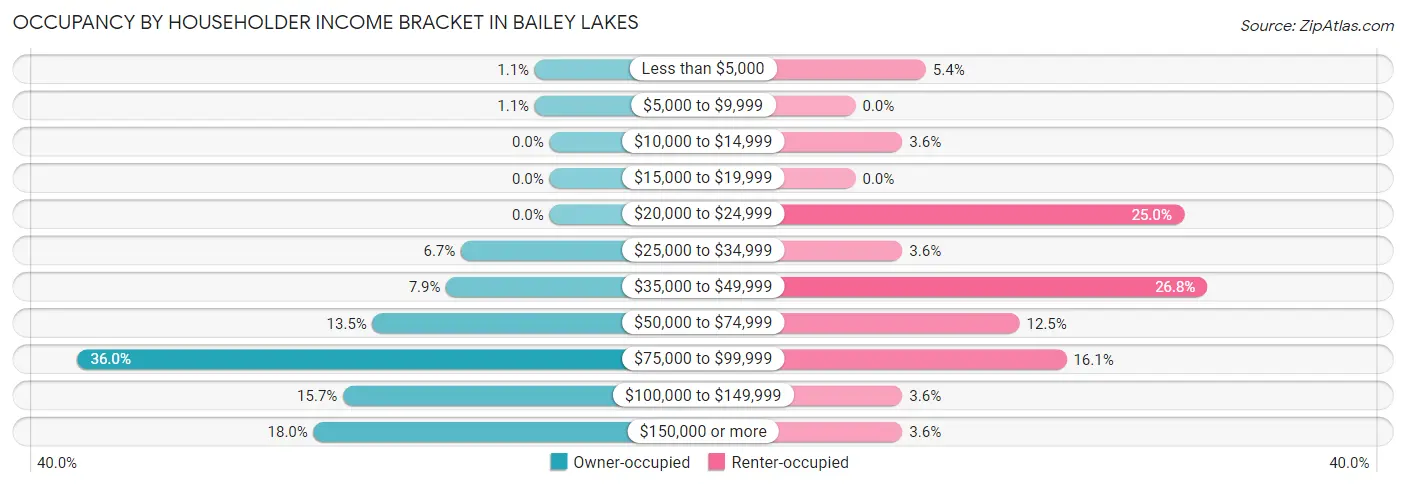
| Income Bracket | Owner-occupied | Renter-occupied |
| Less than $5,000 | 1 (1.1%) | 3 (5.4%) |
| $5,000 to $9,999 | 1 (1.1%) | 0 (0.0%) |
| $10,000 to $14,999 | 0 (0.0%) | 2 (3.6%) |
| $15,000 to $19,999 | 0 (0.0%) | 0 (0.0%) |
| $20,000 to $24,999 | 0 (0.0%) | 14 (25.0%) |
| $25,000 to $34,999 | 6 (6.7%) | 2 (3.6%) |
| $35,000 to $49,999 | 7 (7.9%) | 15 (26.8%) |
| $50,000 to $74,999 | 12 (13.5%) | 7 (12.5%) |
| $75,000 to $99,999 | 32 (36.0%) | 9 (16.1%) |
| $100,000 to $149,999 | 14 (15.7%) | 2 (3.6%) |
| $150,000 or more | 16 (18.0%) | 2 (3.6%) |
| Total | 89 (100.0%) | 56 (100.0%) |
Monthly Housing Cost Tiers in Bailey Lakes
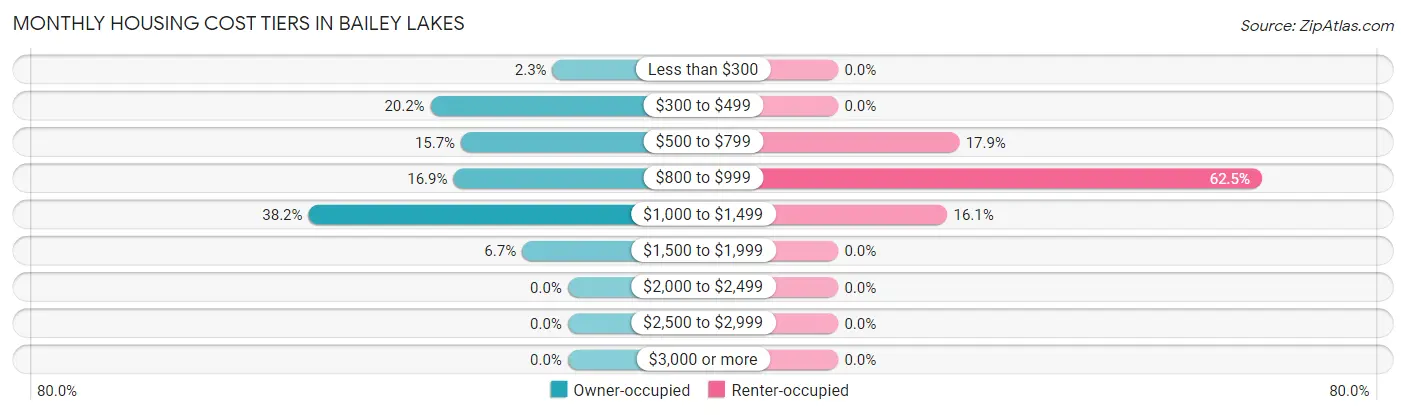
| Monthly Cost | Owner-occupied | Renter-occupied |
| Less than $300 | 2 (2.2%) | 0 (0.0%) |
| $300 to $499 | 18 (20.2%) | 0 (0.0%) |
| $500 to $799 | 14 (15.7%) | 10 (17.9%) |
| $800 to $999 | 15 (16.9%) | 35 (62.5%) |
| $1,000 to $1,499 | 34 (38.2%) | 9 (16.1%) |
| $1,500 to $1,999 | 6 (6.7%) | 0 (0.0%) |
| $2,000 to $2,499 | 0 (0.0%) | 0 (0.0%) |
| $2,500 to $2,999 | 0 (0.0%) | 0 (0.0%) |
| $3,000 or more | 0 (0.0%) | 0 (0.0%) |
| Total | 89 (100.0%) | 56 (100.0%) |
Physical Housing Characteristics in Bailey Lakes
Housing Structures in Bailey Lakes
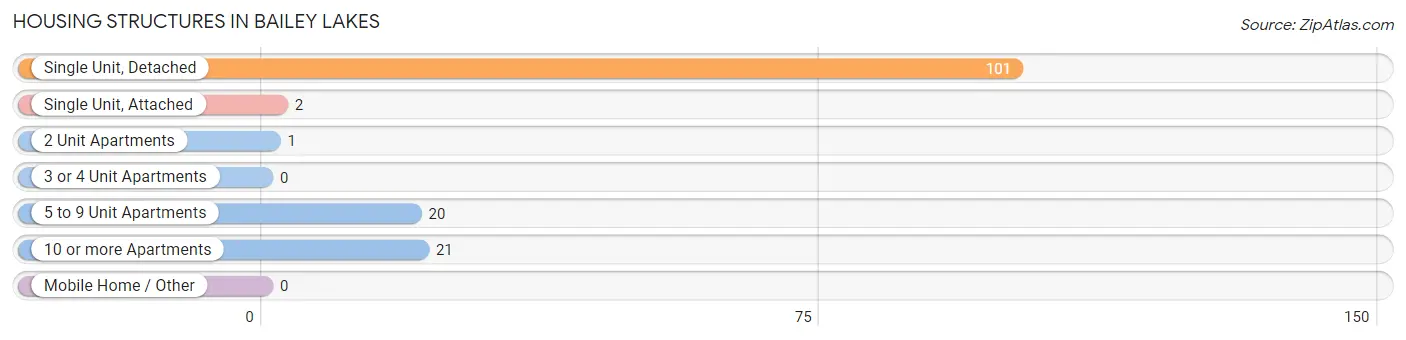
| Structure Type | # Housing Units | % Housing Units |
| Single Unit, Detached | 101 | 69.7% |
| Single Unit, Attached | 2 | 1.4% |
| 2 Unit Apartments | 1 | 0.7% |
| 3 or 4 Unit Apartments | 0 | 0.0% |
| 5 to 9 Unit Apartments | 20 | 13.8% |
| 10 or more Apartments | 21 | 14.5% |
| Mobile Home / Other | 0 | 0.0% |
| Total | 145 | 100.0% |
Housing Structures by Occupancy in Bailey Lakes
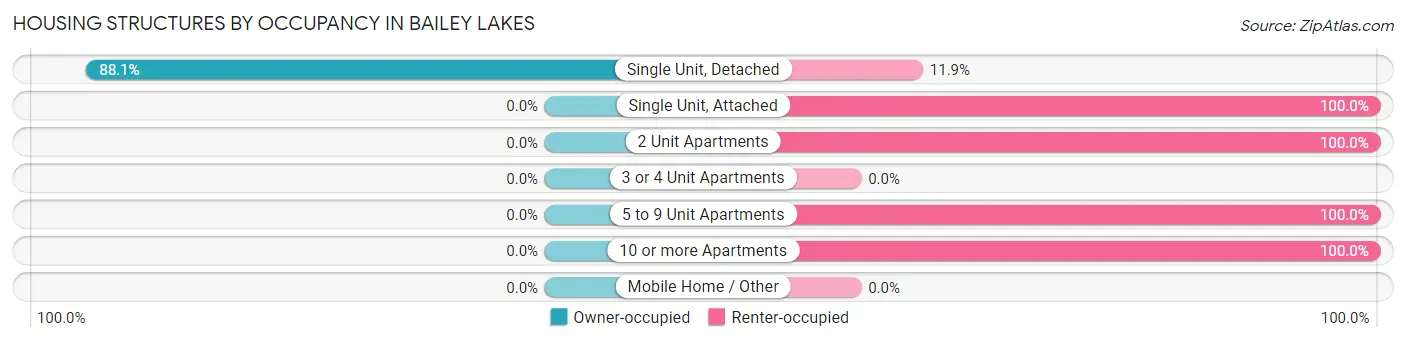
| Structure Type | Owner-occupied | Renter-occupied |
| Single Unit, Detached | 89 (88.1%) | 12 (11.9%) |
| Single Unit, Attached | 0 (0.0%) | 2 (100.0%) |
| 2 Unit Apartments | 0 (0.0%) | 1 (100.0%) |
| 3 or 4 Unit Apartments | 0 (0.0%) | 0 (0.0%) |
| 5 to 9 Unit Apartments | 0 (0.0%) | 20 (100.0%) |
| 10 or more Apartments | 0 (0.0%) | 21 (100.0%) |
| Mobile Home / Other | 0 (0.0%) | 0 (0.0%) |
| Total | 89 (61.4%) | 56 (38.6%) |
Housing Structures by Number of Rooms in Bailey Lakes
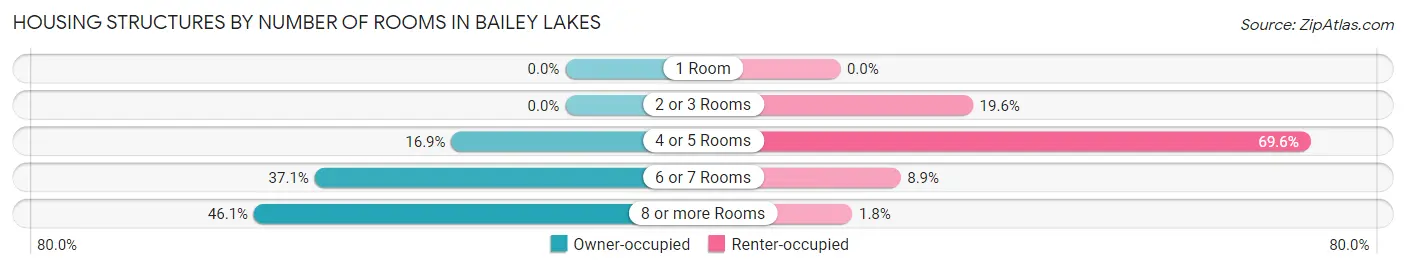
| Number of Rooms | Owner-occupied | Renter-occupied |
| 1 Room | 0 (0.0%) | 0 (0.0%) |
| 2 or 3 Rooms | 0 (0.0%) | 11 (19.6%) |
| 4 or 5 Rooms | 15 (16.9%) | 39 (69.6%) |
| 6 or 7 Rooms | 33 (37.1%) | 5 (8.9%) |
| 8 or more Rooms | 41 (46.1%) | 1 (1.8%) |
| Total | 89 (100.0%) | 56 (100.0%) |
Housing Structure by Heating Type in Bailey Lakes
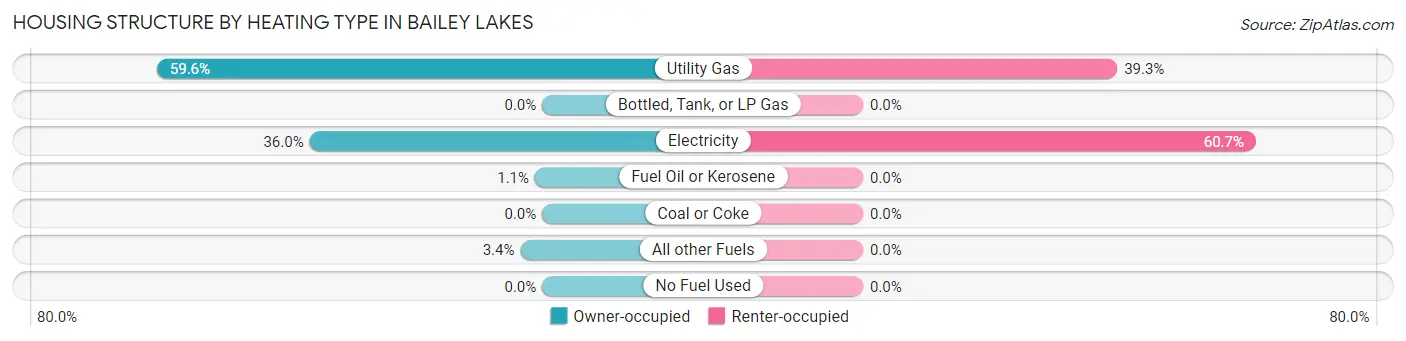
| Heating Type | Owner-occupied | Renter-occupied |
| Utility Gas | 53 (59.6%) | 22 (39.3%) |
| Bottled, Tank, or LP Gas | 0 (0.0%) | 0 (0.0%) |
| Electricity | 32 (36.0%) | 34 (60.7%) |
| Fuel Oil or Kerosene | 1 (1.1%) | 0 (0.0%) |
| Coal or Coke | 0 (0.0%) | 0 (0.0%) |
| All other Fuels | 3 (3.4%) | 0 (0.0%) |
| No Fuel Used | 0 (0.0%) | 0 (0.0%) |
| Total | 89 (100.0%) | 56 (100.0%) |
Household Vehicle Usage in Bailey Lakes
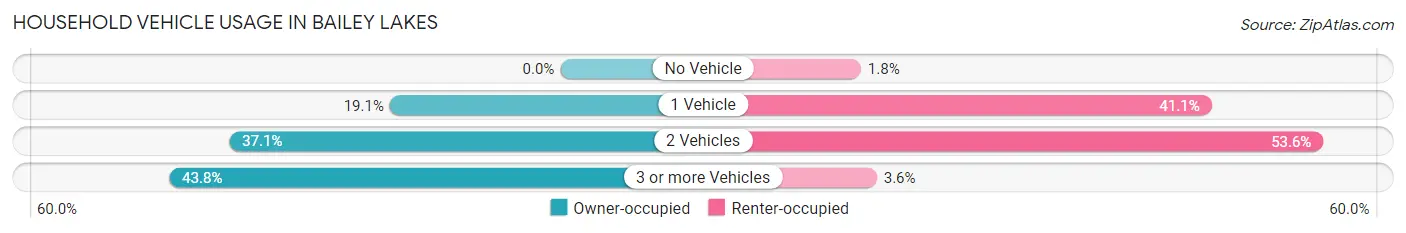
| Vehicles per Household | Owner-occupied | Renter-occupied |
| No Vehicle | 0 (0.0%) | 1 (1.8%) |
| 1 Vehicle | 17 (19.1%) | 23 (41.1%) |
| 2 Vehicles | 33 (37.1%) | 30 (53.6%) |
| 3 or more Vehicles | 39 (43.8%) | 2 (3.6%) |
| Total | 89 (100.0%) | 56 (100.0%) |
Real Estate & Mortgages in Bailey Lakes
Real Estate and Mortgage Overview in Bailey Lakes
| Characteristic | Without Mortgage | With Mortgage |
| Housing Units | 26 | 63 |
| Median Property Value | $120,800 | $123,900 |
| Median Household Income | $95,000 | $8 |
| Monthly Housing Costs | $464 | $0 |
| Real Estate Taxes | $1,542 | $0 |
Property Value by Mortgage Status in Bailey Lakes
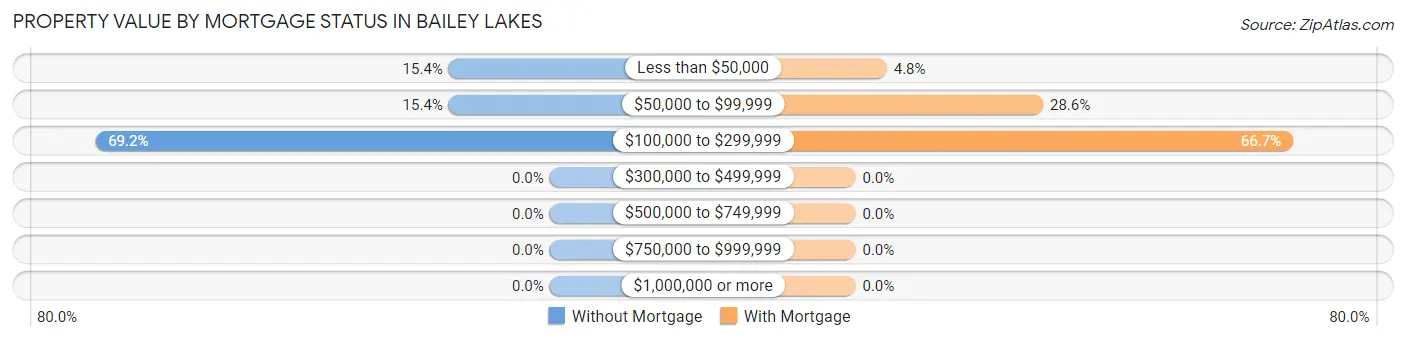
| Property Value | Without Mortgage | With Mortgage |
| Less than $50,000 | 4 (15.4%) | 3 (4.8%) |
| $50,000 to $99,999 | 4 (15.4%) | 18 (28.6%) |
| $100,000 to $299,999 | 18 (69.2%) | 42 (66.7%) |
| $300,000 to $499,999 | 0 (0.0%) | 0 (0.0%) |
| $500,000 to $749,999 | 0 (0.0%) | 0 (0.0%) |
| $750,000 to $999,999 | 0 (0.0%) | 0 (0.0%) |
| $1,000,000 or more | 0 (0.0%) | 0 (0.0%) |
| Total | 26 (100.0%) | 63 (100.0%) |
Household Income by Mortgage Status in Bailey Lakes
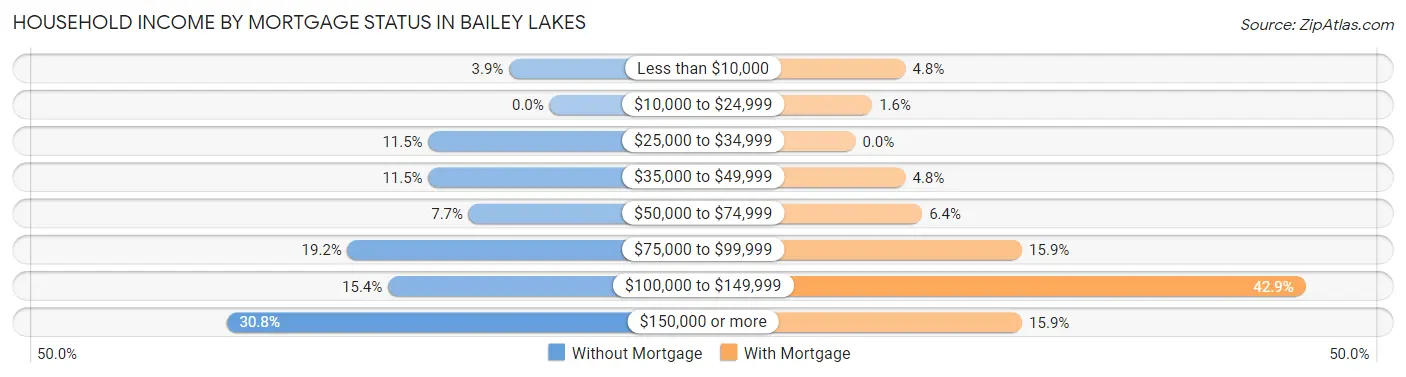
| Household Income | Without Mortgage | With Mortgage |
| Less than $10,000 | 1 (3.8%) | 3 (4.8%) |
| $10,000 to $24,999 | 0 (0.0%) | 1 (1.6%) |
| $25,000 to $34,999 | 3 (11.5%) | 0 (0.0%) |
| $35,000 to $49,999 | 3 (11.5%) | 3 (4.8%) |
| $50,000 to $74,999 | 2 (7.7%) | 4 (6.4%) |
| $75,000 to $99,999 | 5 (19.2%) | 10 (15.9%) |
| $100,000 to $149,999 | 4 (15.4%) | 27 (42.9%) |
| $150,000 or more | 8 (30.8%) | 10 (15.9%) |
| Total | 26 (100.0%) | 63 (100.0%) |
Property Value to Household Income Ratio in Bailey Lakes
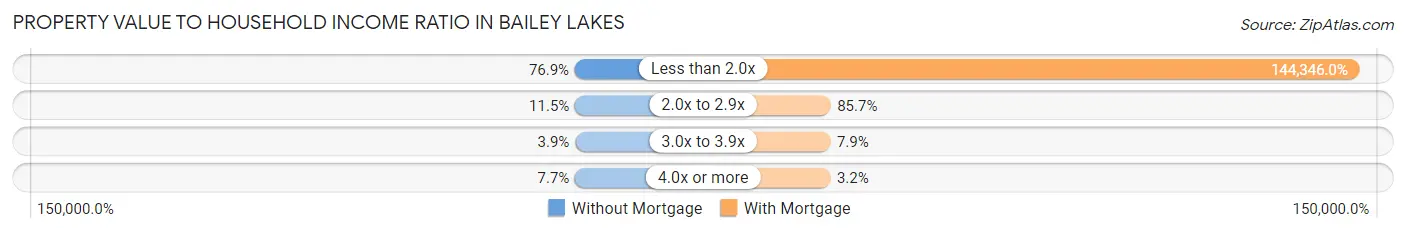
| Value-to-Income Ratio | Without Mortgage | With Mortgage |
| Less than 2.0x | 20 (76.9%) | 90,938 (144,346.0%) |
| 2.0x to 2.9x | 3 (11.5%) | 54 (85.7%) |
| 3.0x to 3.9x | 1 (3.8%) | 5 (7.9%) |
| 4.0x or more | 2 (7.7%) | 2 (3.2%) |
| Total | 26 (100.0%) | 63 (100.0%) |
Real Estate Taxes by Mortgage Status in Bailey Lakes
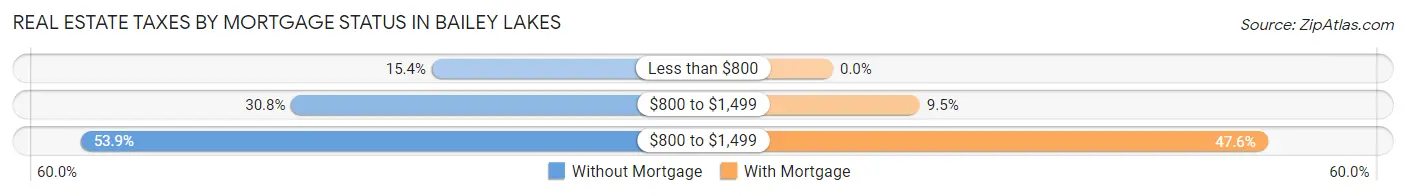
| Property Taxes | Without Mortgage | With Mortgage |
| Less than $800 | 4 (15.4%) | 0 (0.0%) |
| $800 to $1,499 | 8 (30.8%) | 6 (9.5%) |
| $800 to $1,499 | 14 (53.8%) | 30 (47.6%) |
| Total | 26 (100.0%) | 63 (100.0%) |
Health & Disability in Bailey Lakes
Health Insurance Coverage by Age in Bailey Lakes
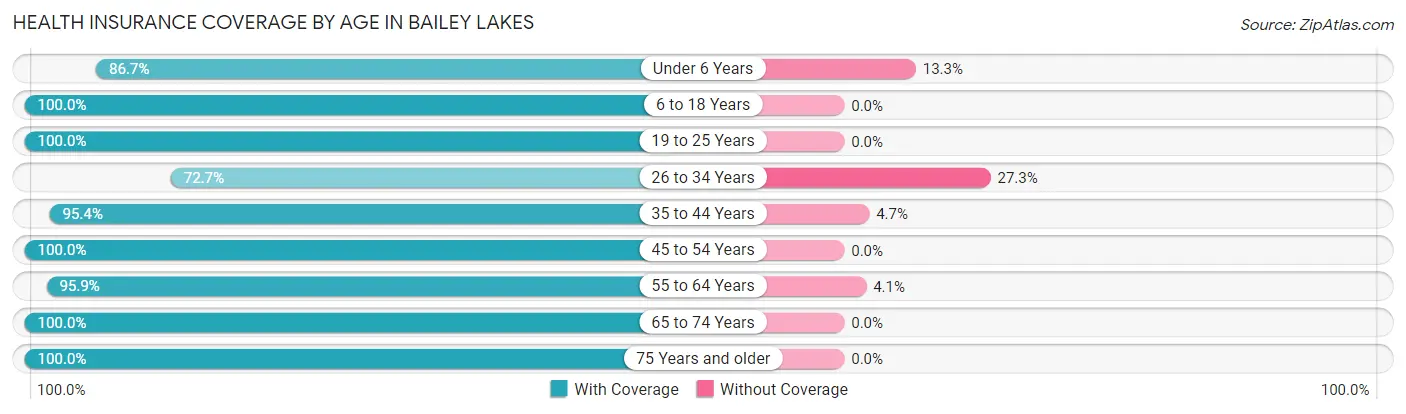
| Age Bracket | With Coverage | Without Coverage |
| Under 6 Years | 13 (86.7%) | 2 (13.3%) |
| 6 to 18 Years | 34 (100.0%) | 0 (0.0%) |
| 19 to 25 Years | 59 (100.0%) | 0 (0.0%) |
| 26 to 34 Years | 32 (72.7%) | 12 (27.3%) |
| 35 to 44 Years | 41 (95.4%) | 2 (4.6%) |
| 45 to 54 Years | 26 (100.0%) | 0 (0.0%) |
| 55 to 64 Years | 47 (95.9%) | 2 (4.1%) |
| 65 to 74 Years | 47 (100.0%) | 0 (0.0%) |
| 75 Years and older | 14 (100.0%) | 0 (0.0%) |
| Total | 313 (94.6%) | 18 (5.4%) |
Health Insurance Coverage by Citizenship Status in Bailey Lakes
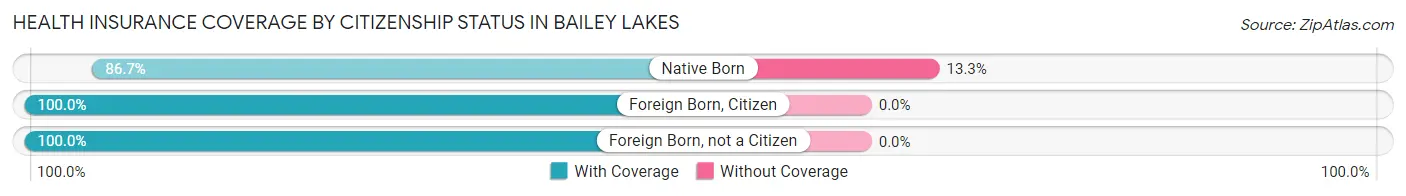
| Citizenship Status | With Coverage | Without Coverage |
| Native Born | 13 (86.7%) | 2 (13.3%) |
| Foreign Born, Citizen | 34 (100.0%) | 0 (0.0%) |
| Foreign Born, not a Citizen | 59 (100.0%) | 0 (0.0%) |
Health Insurance Coverage by Household Income in Bailey Lakes
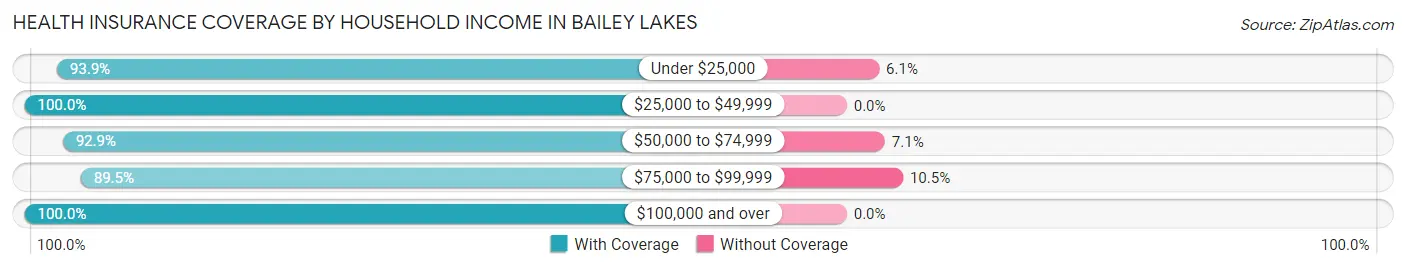
| Household Income | With Coverage | Without Coverage |
| Under $25,000 | 31 (93.9%) | 2 (6.1%) |
| $25,000 to $49,999 | 43 (100.0%) | 0 (0.0%) |
| $50,000 to $74,999 | 52 (92.9%) | 4 (7.1%) |
| $75,000 to $99,999 | 102 (89.5%) | 12 (10.5%) |
| $100,000 and over | 85 (100.0%) | 0 (0.0%) |
Public vs Private Health Insurance Coverage by Age in Bailey Lakes
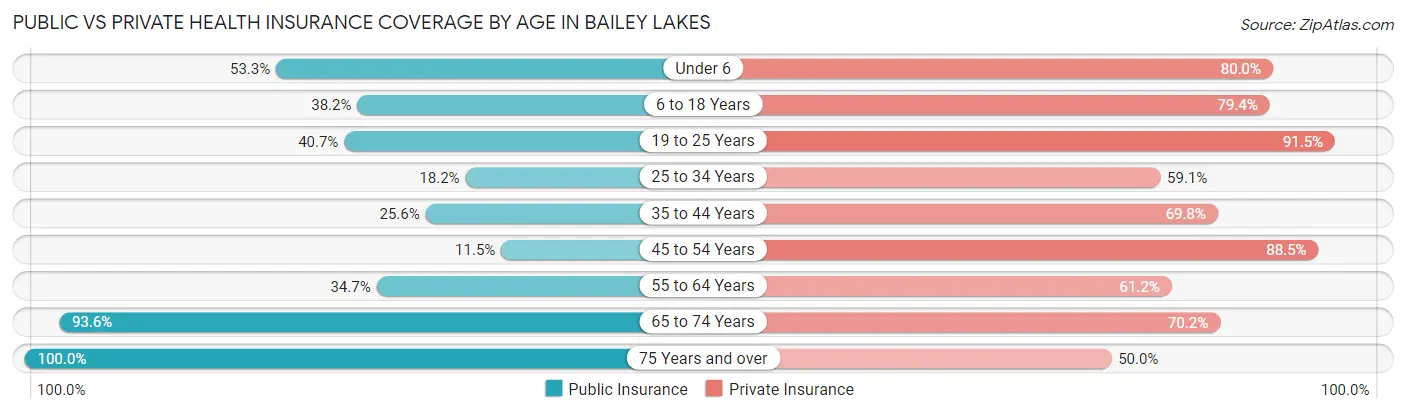
| Age Bracket | Public Insurance | Private Insurance |
| Under 6 | 8 (53.3%) | 12 (80.0%) |
| 6 to 18 Years | 13 (38.2%) | 27 (79.4%) |
| 19 to 25 Years | 24 (40.7%) | 54 (91.5%) |
| 25 to 34 Years | 8 (18.2%) | 26 (59.1%) |
| 35 to 44 Years | 11 (25.6%) | 30 (69.8%) |
| 45 to 54 Years | 3 (11.5%) | 23 (88.5%) |
| 55 to 64 Years | 17 (34.7%) | 30 (61.2%) |
| 65 to 74 Years | 44 (93.6%) | 33 (70.2%) |
| 75 Years and over | 14 (100.0%) | 7 (50.0%) |
| Total | 142 (42.9%) | 242 (73.1%) |
Disability Status by Sex by Age in Bailey Lakes
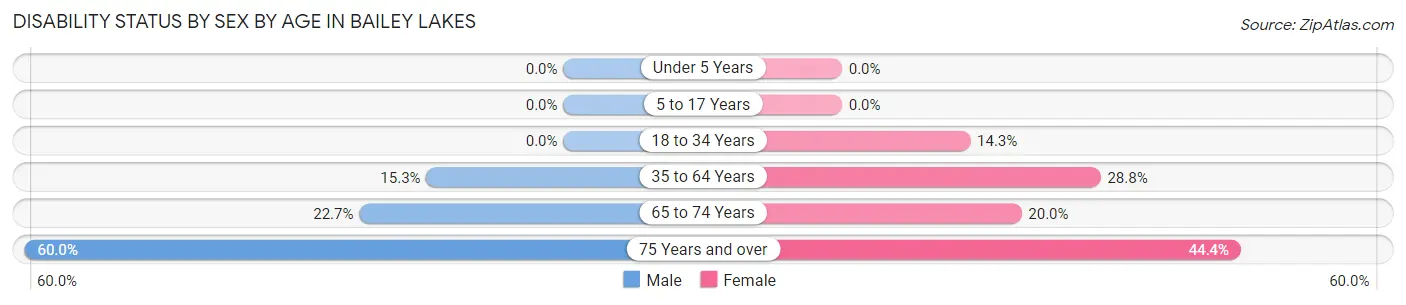
| Age Bracket | Male | Female |
| Under 5 Years | 0 (0.0%) | 0 (0.0%) |
| 5 to 17 Years | 0 (0.0%) | 0 (0.0%) |
| 18 to 34 Years | 0 (0.0%) | 7 (14.3%) |
| 35 to 64 Years | 9 (15.2%) | 17 (28.8%) |
| 65 to 74 Years | 5 (22.7%) | 5 (20.0%) |
| 75 Years and over | 3 (60.0%) | 4 (44.4%) |
Disability Class by Sex by Age in Bailey Lakes
Disability Class: Hearing Difficulty
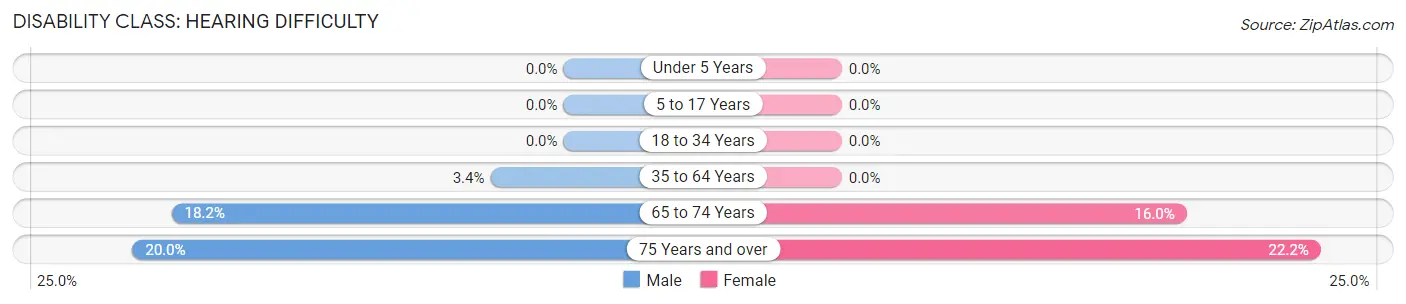
| Age Bracket | Male | Female |
| Under 5 Years | 0 (0.0%) | 0 (0.0%) |
| 5 to 17 Years | 0 (0.0%) | 0 (0.0%) |
| 18 to 34 Years | 0 (0.0%) | 0 (0.0%) |
| 35 to 64 Years | 2 (3.4%) | 0 (0.0%) |
| 65 to 74 Years | 4 (18.2%) | 4 (16.0%) |
| 75 Years and over | 1 (20.0%) | 2 (22.2%) |
Disability Class: Vision Difficulty
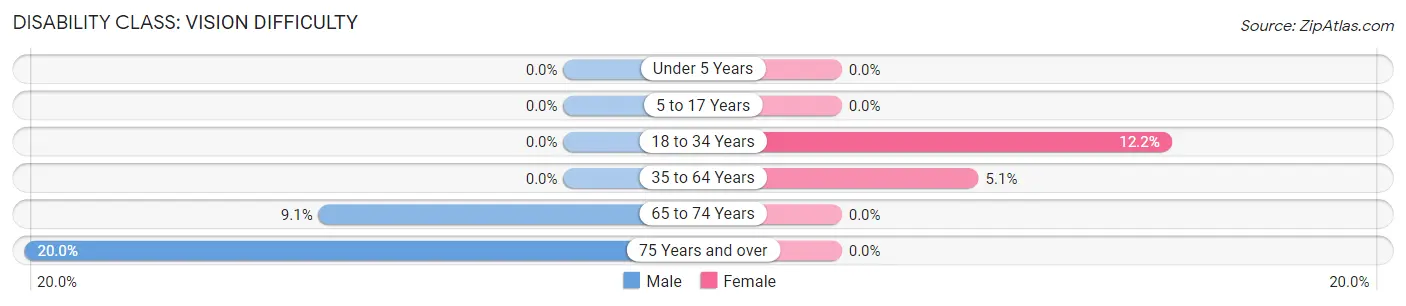
| Age Bracket | Male | Female |
| Under 5 Years | 0 (0.0%) | 0 (0.0%) |
| 5 to 17 Years | 0 (0.0%) | 0 (0.0%) |
| 18 to 34 Years | 0 (0.0%) | 6 (12.2%) |
| 35 to 64 Years | 0 (0.0%) | 3 (5.1%) |
| 65 to 74 Years | 2 (9.1%) | 0 (0.0%) |
| 75 Years and over | 1 (20.0%) | 0 (0.0%) |
Disability Class: Cognitive Difficulty
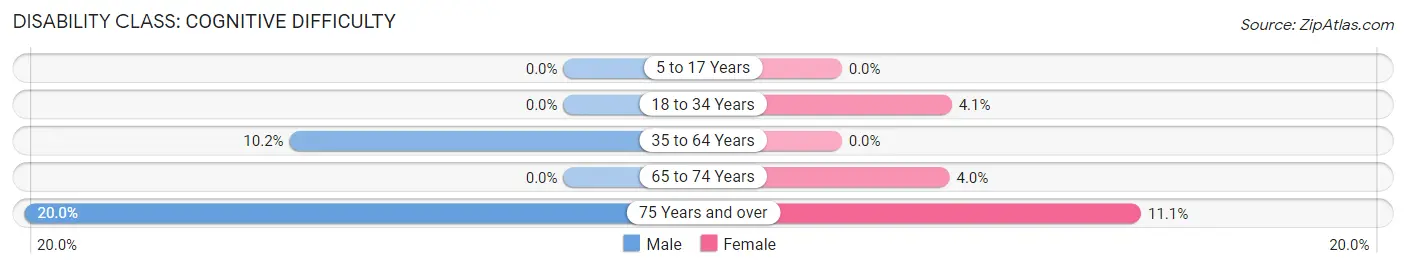
| Age Bracket | Male | Female |
| 5 to 17 Years | 0 (0.0%) | 0 (0.0%) |
| 18 to 34 Years | 0 (0.0%) | 2 (4.1%) |
| 35 to 64 Years | 6 (10.2%) | 0 (0.0%) |
| 65 to 74 Years | 0 (0.0%) | 1 (4.0%) |
| 75 Years and over | 1 (20.0%) | 1 (11.1%) |
Disability Class: Ambulatory Difficulty
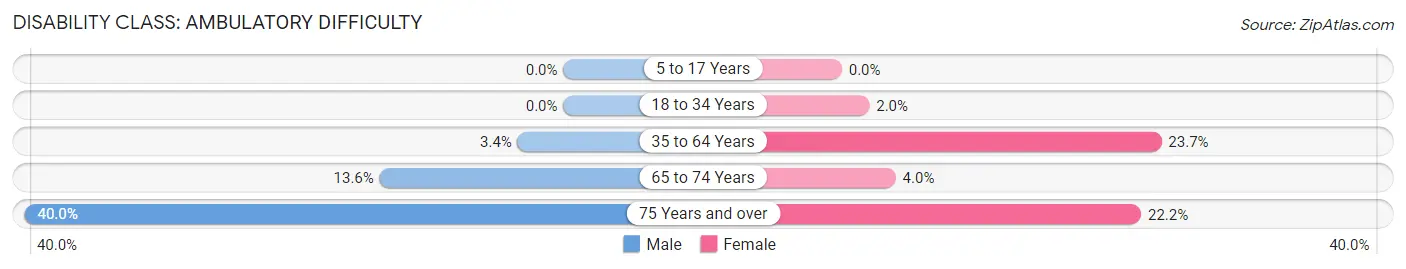
| Age Bracket | Male | Female |
| 5 to 17 Years | 0 (0.0%) | 0 (0.0%) |
| 18 to 34 Years | 0 (0.0%) | 1 (2.0%) |
| 35 to 64 Years | 2 (3.4%) | 14 (23.7%) |
| 65 to 74 Years | 3 (13.6%) | 1 (4.0%) |
| 75 Years and over | 2 (40.0%) | 2 (22.2%) |
Disability Class: Self-Care Difficulty
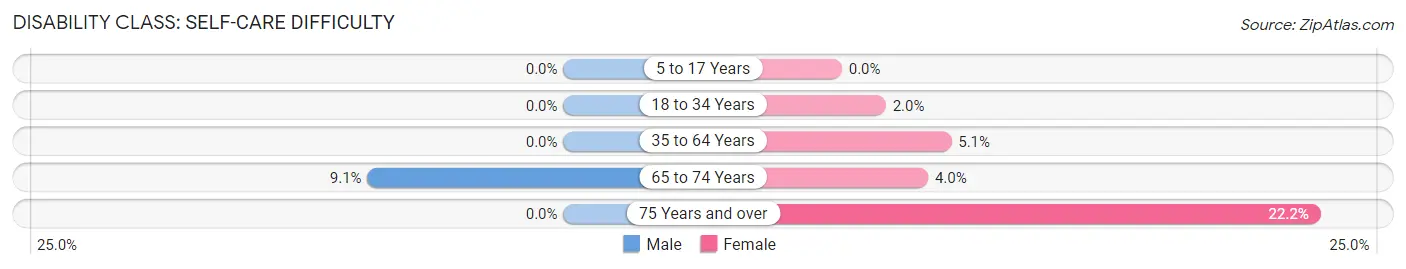
| Age Bracket | Male | Female |
| 5 to 17 Years | 0 (0.0%) | 0 (0.0%) |
| 18 to 34 Years | 0 (0.0%) | 1 (2.0%) |
| 35 to 64 Years | 0 (0.0%) | 3 (5.1%) |
| 65 to 74 Years | 2 (9.1%) | 1 (4.0%) |
| 75 Years and over | 0 (0.0%) | 2 (22.2%) |
Technology Access in Bailey Lakes
Computing Device Access in Bailey Lakes
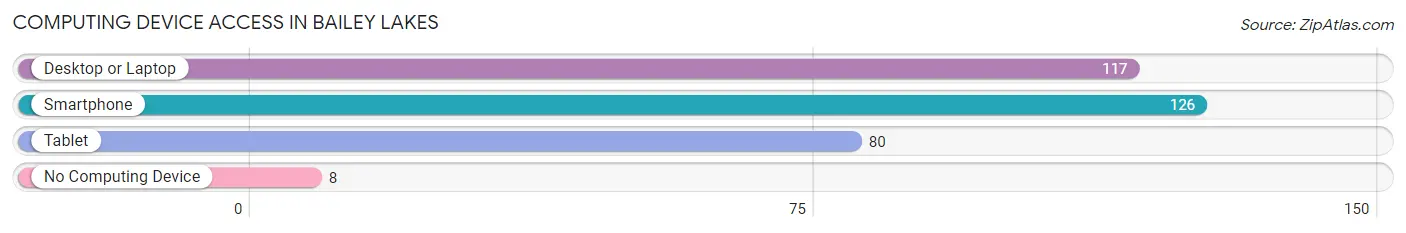
| Device Type | # Households | % Households |
| Desktop or Laptop | 117 | 80.7% |
| Smartphone | 126 | 86.9% |
| Tablet | 80 | 55.2% |
| No Computing Device | 8 | 5.5% |
| Total | 145 | 100.0% |
Internet Access in Bailey Lakes
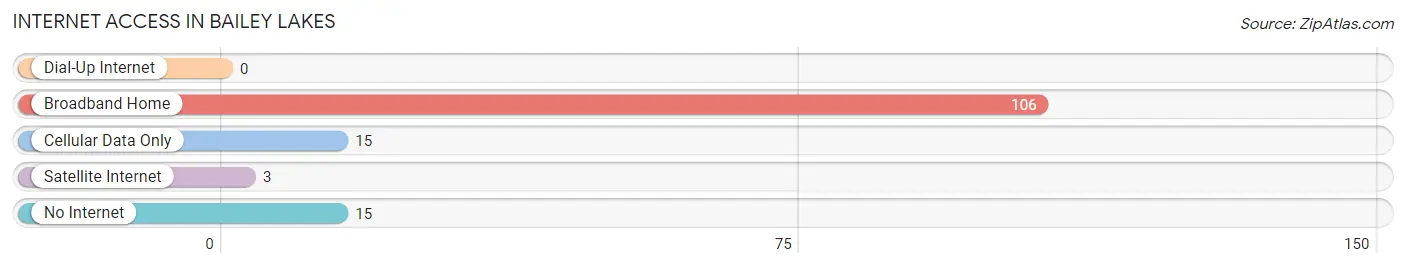
| Internet Type | # Households | % Households |
| Dial-Up Internet | 0 | 0.0% |
| Broadband Home | 106 | 73.1% |
| Cellular Data Only | 15 | 10.3% |
| Satellite Internet | 3 | 2.1% |
| No Internet | 15 | 10.3% |
| Total | 145 | 100.0% |
Bailey Lakes Summary
Bailey Lakes is a small village located in Huron County, Ohio. It is situated on the banks of the Huron River, approximately 10 miles south of the city of Norwalk. The village has a population of approximately 500 people and is part of the Norwalk Micropolitan Statistical Area.
History
The area that is now Bailey Lakes was first settled in the early 1800s by a group of settlers from Connecticut. The settlers named the area after their hometown of Bailey, Connecticut. The village was officially incorporated in 1837.
In the late 1800s, the village was a popular destination for vacationers from Cleveland and other nearby cities. The village was known for its beautiful scenery and its abundance of fish and game.
In the early 1900s, the village began to decline as the railroad bypassed it and the population began to move away. The village was nearly abandoned by the 1950s.
In the late 1970s, the village was revitalized by a group of local residents who wanted to preserve the village’s history and charm. The village was listed on the National Register of Historic Places in 1979.
Geography
Bailey Lakes is located in the western part of Huron County, Ohio. It is situated on the banks of the Huron River, approximately 10 miles south of the city of Norwalk. The village is surrounded by rolling hills and farmland.
The village has a total area of 0.3 square miles, all of which is land. The village is located at an elevation of 845 feet above sea level.
Economy
The economy of Bailey Lakes is largely based on agriculture and tourism. The village is home to several small businesses, including a general store, a restaurant, and a bed and breakfast.
The village is also home to a number of small farms, which produce a variety of crops, including corn, soybeans, and wheat. The village is also home to a number of wineries, which produce a variety of wines.
Demographics
As of the 2010 census, the population of Bailey Lakes was 498. The racial makeup of the village was 97.2% White, 0.2% African American, 0.2% Native American, 0.4% Asian, 0.2% from other races, and 1.9% from two or more races. Hispanic or Latino of any race were 0.8% of the population.
The median income for a household in the village was $41,250, and the median income for a family was $50,000. The per capita income for the village was $20,945. About 8.2% of families and 10.2% of the population were below the poverty line, including 14.3% of those under age 18 and 6.3% of those age 65 or over.
Common Questions
What is Per Capita Income in Bailey Lakes?
Per Capita income in Bailey Lakes is $47,547.
What is the Median Family Income in Bailey Lakes?
Median Family Income in Bailey Lakes is $95,000.
What is the Median Household income in Bailey Lakes?
Median Household Income in Bailey Lakes is $80,750.
What is Income or Wage Gap in Bailey Lakes?
Income or Wage Gap in Bailey Lakes is 15.5%.
Women in Bailey Lakes earn 84.5 cents for every dollar earned by a man.
What is Inequality or Gini Index in Bailey Lakes?
Inequality or Gini Index in Bailey Lakes is 0.52.
What is the Total Population of Bailey Lakes?
Total Population of Bailey Lakes is 331.
What is the Total Male Population of Bailey Lakes?
Total Male Population of Bailey Lakes is 163.
What is the Total Female Population of Bailey Lakes?
Total Female Population of Bailey Lakes is 168.
What is the Ratio of Males per 100 Females in Bailey Lakes?
There are 97.02 Males per 100 Females in Bailey Lakes.
What is the Ratio of Females per 100 Males in Bailey Lakes?
There are 103.07 Females per 100 Males in Bailey Lakes.
What is the Median Population Age in Bailey Lakes?
Median Population Age in Bailey Lakes is 37.8 Years.
What is the Average Family Size in Bailey Lakes
Average Family Size in Bailey Lakes is 2.8 People.
What is the Average Household Size in Bailey Lakes
Average Household Size in Bailey Lakes is 2.3 People.
How Large is the Labor Force in Bailey Lakes?
There are 215 People in the Labor Forcein in Bailey Lakes.
What is the Percentage of People in the Labor Force in Bailey Lakes?
74.7% of People are in the Labor Force in Bailey Lakes.
What is the Unemployment Rate in Bailey Lakes?
Unemployment Rate in Bailey Lakes is 2.8%.