South Zanesville, OH Map & Demographics
South Zanesville Map
South Zanesville Overview
$26,751
PER CAPITA INCOME
$51,324
AVG FAMILY INCOME
$38,170
AVG HOUSEHOLD INCOME
5.7%
WAGE / INCOME GAP [ % ]
94.3¢/ $1
WAGE / INCOME GAP [ $ ]
0.43
INEQUALITY / GINI INDEX
1,876
TOTAL POPULATION
820
MALE POPULATION
1,056
FEMALE POPULATION
77.65
MALES / 100 FEMALES
128.78
FEMALES / 100 MALES
43.3
MEDIAN AGE
2.7
AVG FAMILY SIZE
1.9
AVG HOUSEHOLD SIZE
800
LABOR FORCE [ PEOPLE ]
54.3%
PERCENT IN LABOR FORCE
3.3%
UNEMPLOYMENT RATE
South Zanesville Area Codes
Income in South Zanesville
Income Overview in South Zanesville
Per Capita Income in South Zanesville is $26,751, while median incomes of families and households are $51,324 and $38,170 respectively.
| Characteristic | Number | Measure |
| Per Capita Income | 1,876 | $26,751 |
| Median Family Income | 520 | $51,324 |
| Mean Family Income | 520 | $60,282 |
| Median Household Income | 966 | $38,170 |
| Mean Household Income | 966 | $52,243 |
| Income Deficit | 520 | $0 |
| Wage / Income Gap (%) | 1,876 | 5.73% |
| Wage / Income Gap ($) | 1,876 | 94.27¢ per $1 |
| Gini / Inequality Index | 1,876 | 0.43 |
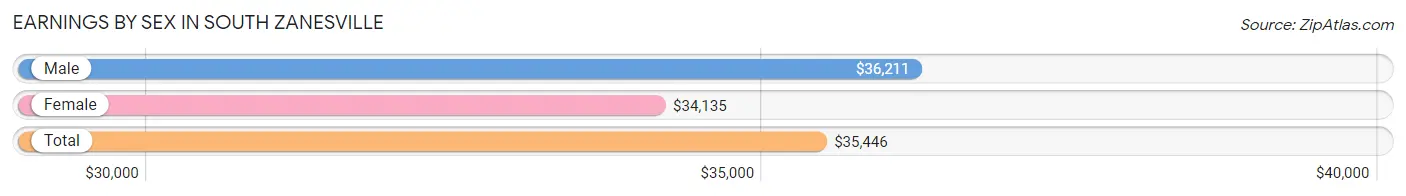
Earnings by Sex in South Zanesville
Average Earnings in South Zanesville are $35,446, $36,211 for men and $34,135 for women, a difference of 5.7%.
| Sex | Number | Average Earnings |
| Male | 404 (49.9%) | $36,211 |
| Female | 405 (50.1%) | $34,135 |
| Total | 809 (100.0%) | $35,446 |
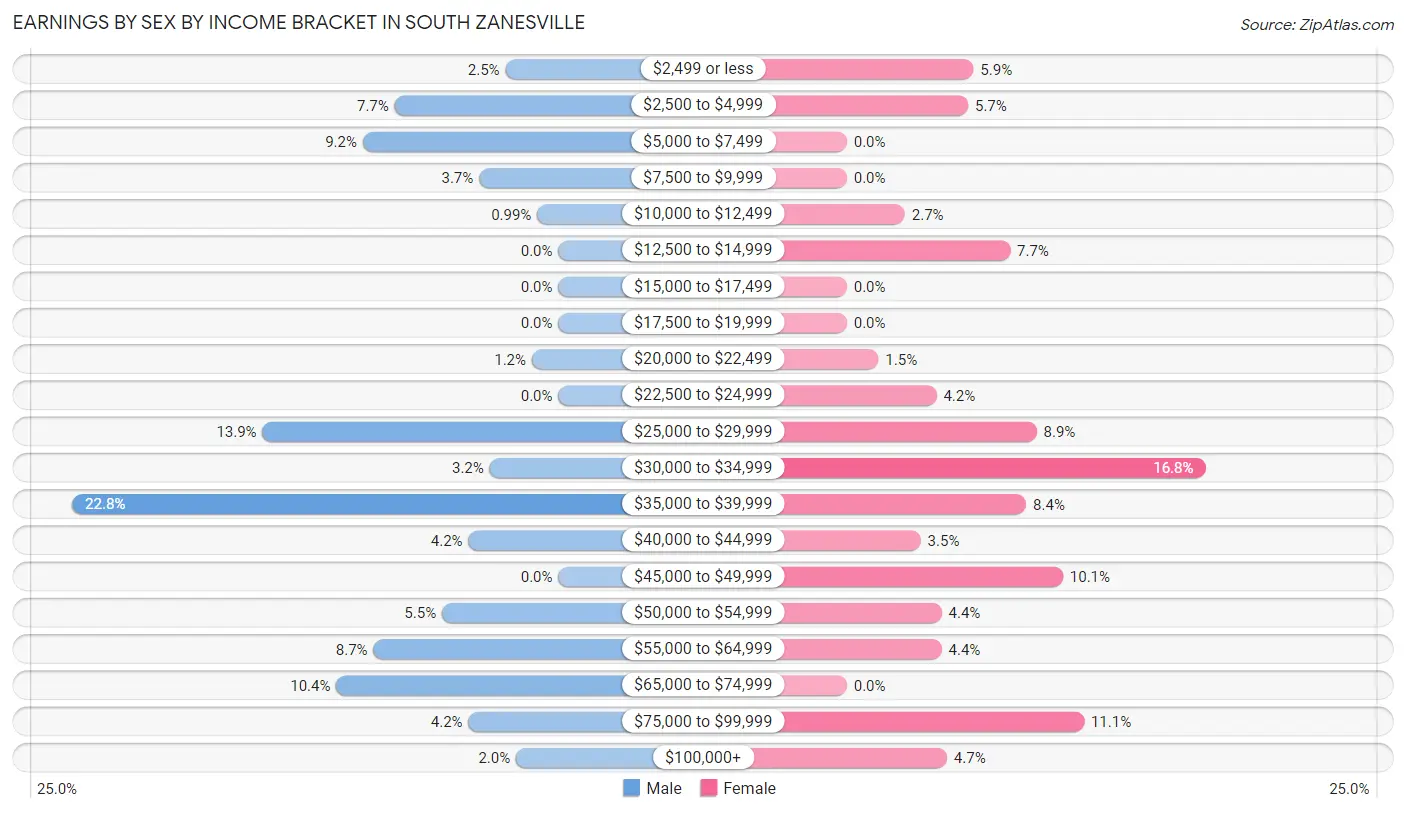
Earnings by Sex by Income Bracket in South Zanesville
The most common earnings brackets in South Zanesville are $35,000 to $39,999 for men (92 | 22.8%) and $30,000 to $34,999 for women (68 | 16.8%).
| Income | Male | Female |
| $2,499 or less | 10 (2.5%) | 24 (5.9%) |
| $2,500 to $4,999 | 31 (7.7%) | 23 (5.7%) |
| $5,000 to $7,499 | 37 (9.2%) | 0 (0.0%) |
| $7,500 to $9,999 | 15 (3.7%) | 0 (0.0%) |
| $10,000 to $12,499 | 4 (1.0%) | 11 (2.7%) |
| $12,500 to $14,999 | 0 (0.0%) | 31 (7.6%) |
| $15,000 to $17,499 | 0 (0.0%) | 0 (0.0%) |
| $17,500 to $19,999 | 0 (0.0%) | 0 (0.0%) |
| $20,000 to $22,499 | 5 (1.2%) | 6 (1.5%) |
| $22,500 to $24,999 | 0 (0.0%) | 17 (4.2%) |
| $25,000 to $29,999 | 56 (13.9%) | 36 (8.9%) |
| $30,000 to $34,999 | 13 (3.2%) | 68 (16.8%) |
| $35,000 to $39,999 | 92 (22.8%) | 34 (8.4%) |
| $40,000 to $44,999 | 17 (4.2%) | 14 (3.5%) |
| $45,000 to $49,999 | 0 (0.0%) | 41 (10.1%) |
| $50,000 to $54,999 | 22 (5.4%) | 18 (4.4%) |
| $55,000 to $64,999 | 35 (8.7%) | 18 (4.4%) |
| $65,000 to $74,999 | 42 (10.4%) | 0 (0.0%) |
| $75,000 to $99,999 | 17 (4.2%) | 45 (11.1%) |
| $100,000+ | 8 (2.0%) | 19 (4.7%) |
| Total | 404 (100.0%) | 405 (100.0%) |
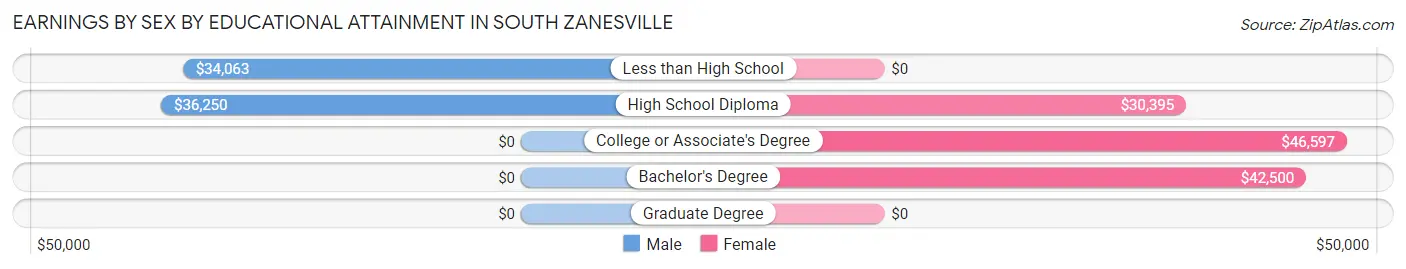
Earnings by Sex by Educational Attainment in South Zanesville
Average earnings in South Zanesville are $36,635 for men and $34,904 for women, a difference of 4.7%. Men with an educational attainment of high school diploma enjoy the highest average annual earnings of $36,250, while those with less than high school education earn the least with $34,063. Women with an educational attainment of college or associate's degree earn the most with the average annual earnings of $46,597, while those with high school diploma education have the smallest earnings of $30,395.
| Educational Attainment | Male Income | Female Income |
| Less than High School | $34,063 | $0 |
| High School Diploma | $36,250 | $30,395 |
| College or Associate's Degree | - | - |
| Bachelor's Degree | - | - |
| Graduate Degree | - | - |
| Total | $36,635 | $34,904 |
Family Income in South Zanesville
Family Income Brackets in South Zanesville
According to the South Zanesville family income data, there are 126 families falling into the $50,000 to $74,999 income range, which is the most common income bracket and makes up 24.2% of all families.
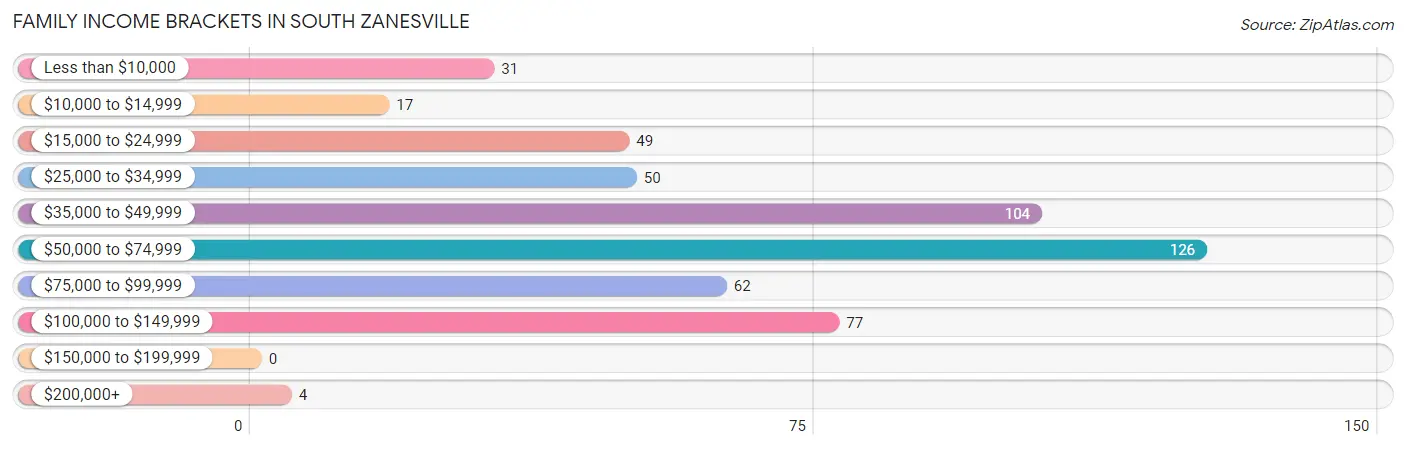
| Income Bracket | # Families | % Families |
| Less than $10,000 | 31 | 6.0% |
| $10,000 to $14,999 | 17 | 3.3% |
| $15,000 to $24,999 | 49 | 9.4% |
| $25,000 to $34,999 | 50 | 9.6% |
| $35,000 to $49,999 | 104 | 20.0% |
| $50,000 to $74,999 | 126 | 24.2% |
| $75,000 to $99,999 | 62 | 11.9% |
| $100,000 to $149,999 | 77 | 14.8% |
| $150,000 to $199,999 | 0 | 0.0% |
| $200,000+ | 4 | 0.8% |
Family Income by Famaliy Size in South Zanesville
4-person families (55 | 10.6%) account for the highest median family income in South Zanesville with $83,542 per family, while 3-person families (90 | 17.3%) have the highest median income of $24,583 per family member.
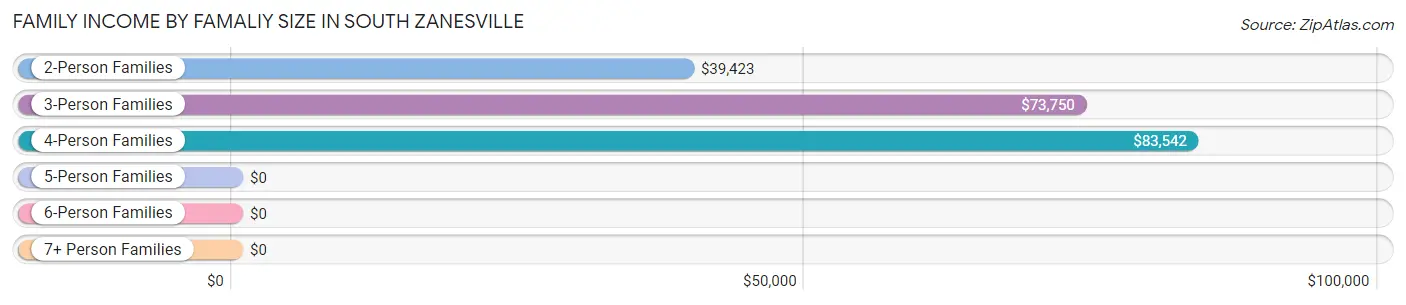
| Income Bracket | # Families | Median Income |
| 2-Person Families | 340 (65.4%) | $39,423 |
| 3-Person Families | 90 (17.3%) | $73,750 |
| 4-Person Families | 55 (10.6%) | $83,542 |
| 5-Person Families | 12 (2.3%) | $0 |
| 6-Person Families | 6 (1.1%) | $0 |
| 7+ Person Families | 17 (3.3%) | $0 |
| Total | 520 (100.0%) | $51,324 |
Family Income by Number of Earners in South Zanesville
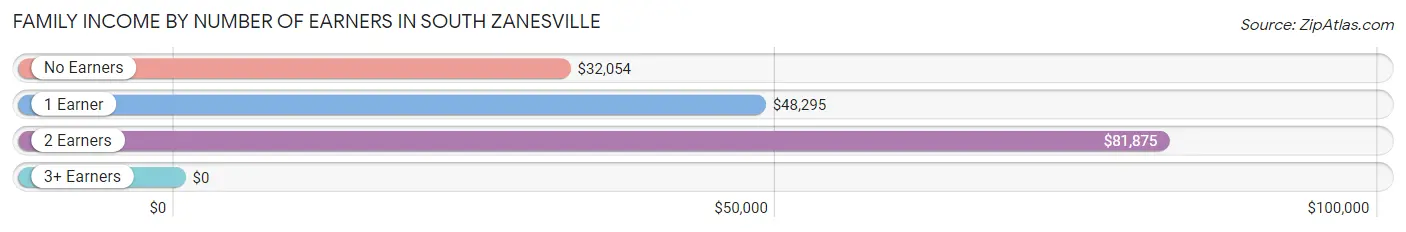
| Number of Earners | # Families | Median Income |
| No Earners | 129 (24.8%) | $32,054 |
| 1 Earner | 217 (41.7%) | $48,295 |
| 2 Earners | 170 (32.7%) | $81,875 |
| 3+ Earners | 4 (0.8%) | $0 |
| Total | 520 (100.0%) | $51,324 |
Household Income in South Zanesville
Household Income Brackets in South Zanesville
With 209 households falling in the category, the $50,000 to $74,999 income range is the most frequent in South Zanesville, accounting for 21.6% of all households. In contrast, only 3 households (0.3%) fall into the $150,000 to $199,999 income bracket, making it the least populous group.
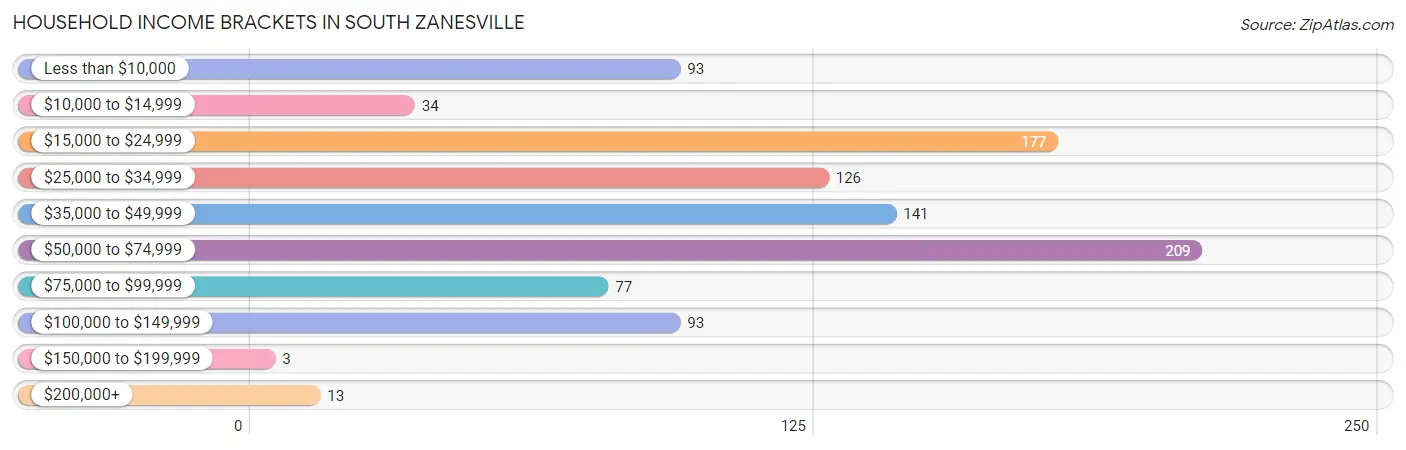
| Income Bracket | # Households | % Households |
| Less than $10,000 | 93 | 9.6% |
| $10,000 to $14,999 | 34 | 3.5% |
| $15,000 to $24,999 | 177 | 18.3% |
| $25,000 to $34,999 | 126 | 13.0% |
| $35,000 to $49,999 | 141 | 14.6% |
| $50,000 to $74,999 | 209 | 21.6% |
| $75,000 to $99,999 | 77 | 8.0% |
| $100,000 to $149,999 | 93 | 9.6% |
| $150,000 to $199,999 | 3 | 0.3% |
| $200,000+ | 13 | 1.3% |
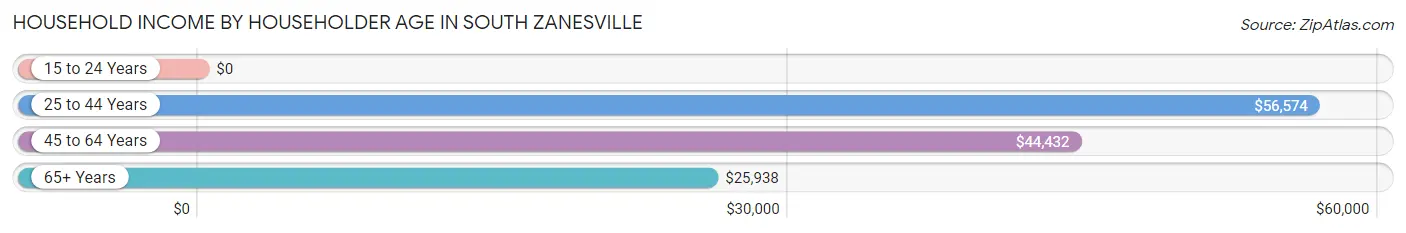
Household Income by Householder Age in South Zanesville
The median household income in South Zanesville is $38,170, with the highest median household income of $56,574 found in the 25 to 44 years age bracket for the primary householder. A total of 262 households (27.1%) fall into this category. Meanwhile, the 15 to 24 years age bracket for the primary householder has the lowest median household income of $0, with 37 households (3.8%) in this group.
| Income Bracket | # Households | Median Income |
| 15 to 24 Years | 37 (3.8%) | $0 |
| 25 to 44 Years | 262 (27.1%) | $56,574 |
| 45 to 64 Years | 347 (35.9%) | $44,432 |
| 65+ Years | 320 (33.1%) | $25,938 |
| Total | 966 (100.0%) | $38,170 |
Poverty in South Zanesville
Income Below Poverty by Sex and Age in South Zanesville
With 14.0% poverty level for males and 13.5% for females among the residents of South Zanesville, under 5 year old males and 25 to 34 year old females are the most vulnerable to poverty, with 28 males (52.8%) and 32 females (31.7%) in their respective age groups living below the poverty level.
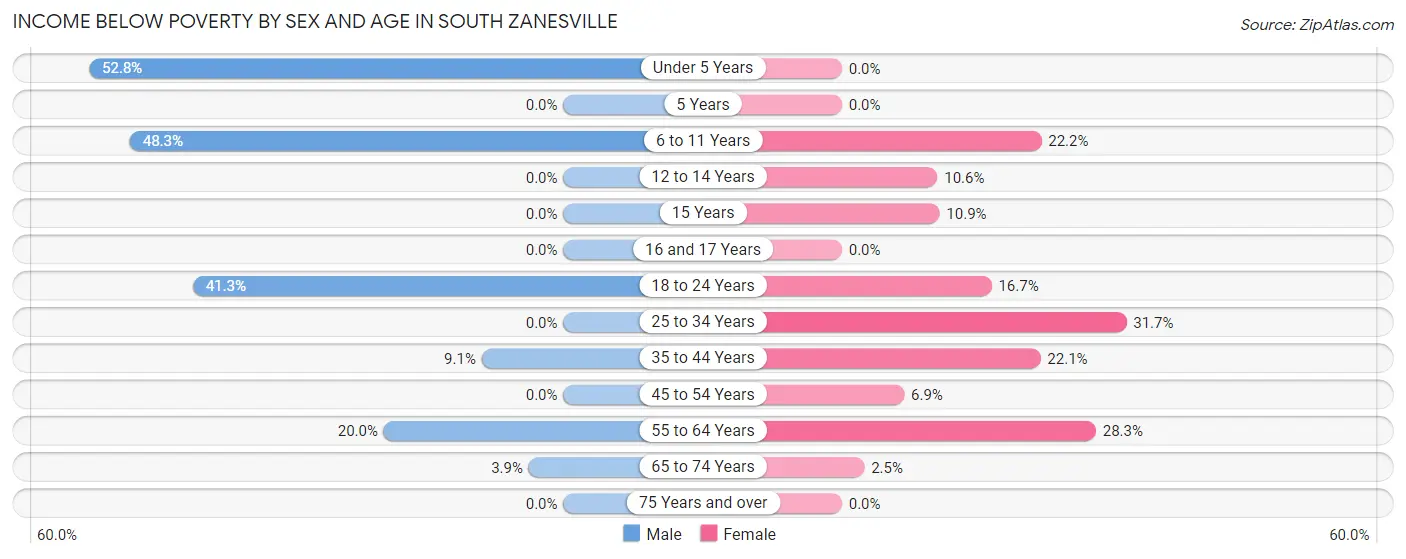
| Age Bracket | Male | Female |
| Under 5 Years | 28 (52.8%) | 0 (0.0%) |
| 5 Years | 0 (0.0%) | 0 (0.0%) |
| 6 to 11 Years | 28 (48.3%) | 18 (22.2%) |
| 12 to 14 Years | 0 (0.0%) | 5 (10.6%) |
| 15 Years | 0 (0.0%) | 5 (10.9%) |
| 16 and 17 Years | 0 (0.0%) | 0 (0.0%) |
| 18 to 24 Years | 26 (41.3%) | 4 (16.7%) |
| 25 to 34 Years | 0 (0.0%) | 32 (31.7%) |
| 35 to 44 Years | 12 (9.1%) | 23 (22.1%) |
| 45 to 54 Years | 0 (0.0%) | 10 (6.9%) |
| 55 to 64 Years | 17 (20.0%) | 43 (28.3%) |
| 65 to 74 Years | 4 (3.8%) | 3 (2.5%) |
| 75 Years and over | 0 (0.0%) | 0 (0.0%) |
| Total | 115 (14.0%) | 143 (13.5%) |
Income Above Poverty by Sex and Age in South Zanesville
According to the poverty statistics in South Zanesville, males aged 5 years and females aged under 5 years are the age groups that are most secure financially, with 100.0% of males and 100.0% of females in these age groups living above the poverty line.
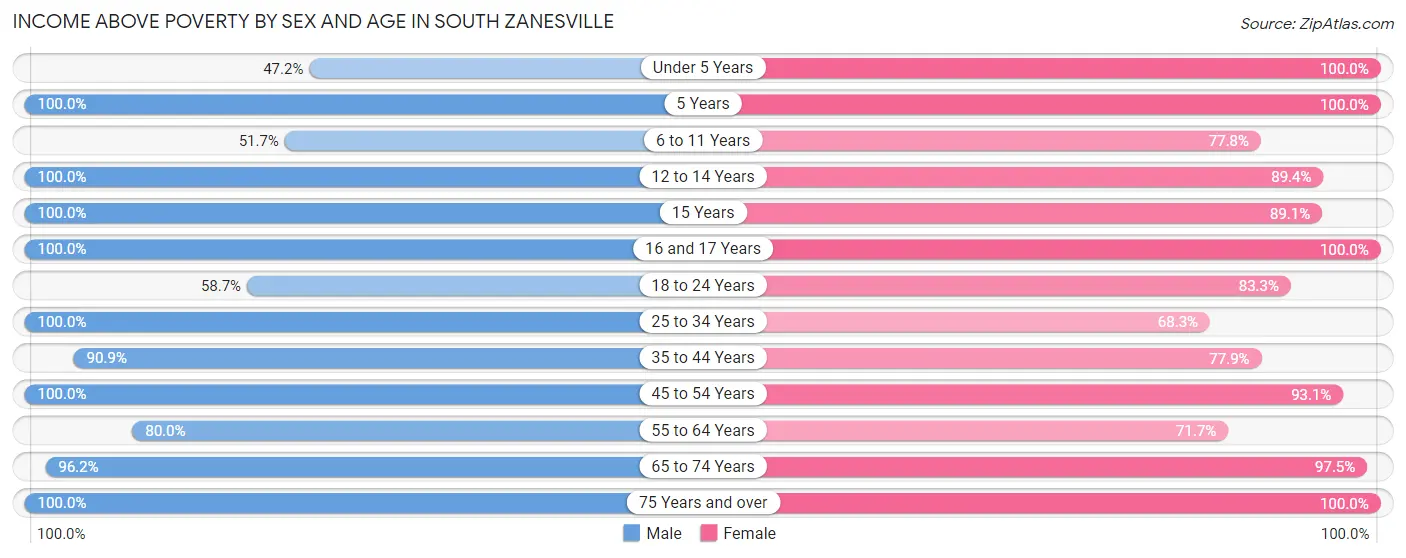
| Age Bracket | Male | Female |
| Under 5 Years | 25 (47.2%) | 77 (100.0%) |
| 5 Years | 6 (100.0%) | 6 (100.0%) |
| 6 to 11 Years | 30 (51.7%) | 63 (77.8%) |
| 12 to 14 Years | 18 (100.0%) | 42 (89.4%) |
| 15 Years | 10 (100.0%) | 41 (89.1%) |
| 16 and 17 Years | 30 (100.0%) | 11 (100.0%) |
| 18 to 24 Years | 37 (58.7%) | 20 (83.3%) |
| 25 to 34 Years | 100 (100.0%) | 69 (68.3%) |
| 35 to 44 Years | 120 (90.9%) | 81 (77.9%) |
| 45 to 54 Years | 91 (100.0%) | 134 (93.1%) |
| 55 to 64 Years | 68 (80.0%) | 109 (71.7%) |
| 65 to 74 Years | 100 (96.2%) | 117 (97.5%) |
| 75 Years and over | 70 (100.0%) | 143 (100.0%) |
| Total | 705 (86.0%) | 913 (86.5%) |
Income Below Poverty Among Married-Couple Families in South Zanesville
The poverty statistics for married-couple families in South Zanesville show that 7.2% or 25 of the total 349 families live below the poverty line. Families with 5 or more children have the highest poverty rate of 100.0%, comprising of 6 families. On the other hand, families with 1 or 2 children have the lowest poverty rate of 0.0%, which includes 0 families.
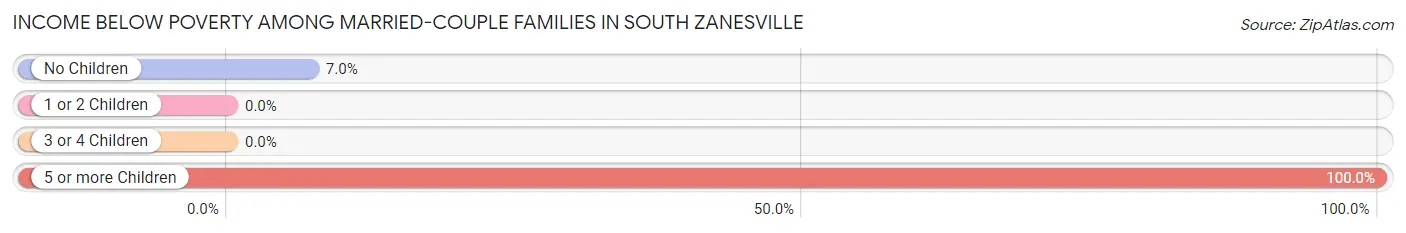
| Children | Above Poverty | Below Poverty |
| No Children | 251 (93.0%) | 19 (7.0%) |
| 1 or 2 Children | 67 (100.0%) | 0 (0.0%) |
| 3 or 4 Children | 6 (100.0%) | 0 (0.0%) |
| 5 or more Children | 0 (0.0%) | 6 (100.0%) |
| Total | 324 (92.8%) | 25 (7.2%) |
Income Below Poverty Among Single-Parent Households in South Zanesville
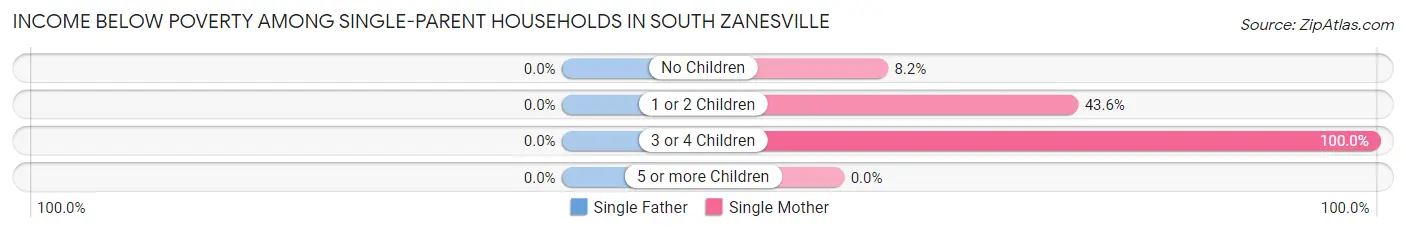
| Children | Single Father | Single Mother |
| No Children | 0 (0.0%) | 4 (8.2%) |
| 1 or 2 Children | 0 (0.0%) | 17 (43.6%) |
| 3 or 4 Children | 0 (0.0%) | 15 (100.0%) |
| 5 or more Children | 0 (0.0%) | 0 (0.0%) |
| Total | 0 (0.0%) | 36 (31.6%) |
Income Below Poverty Among Married-Couple vs Single-Parent Households in South Zanesville
The poverty data for South Zanesville shows that 25 of the married-couple family households (7.2%) and 36 of the single-parent households (21.0%) are living below the poverty level. Within the married-couple family households, those with 5 or more children have the highest poverty rate, with 6 households (100.0%) falling below the poverty line. Among the single-parent households, those with 3 or 4 children have the highest poverty rate, with 15 household (55.6%) living below poverty.
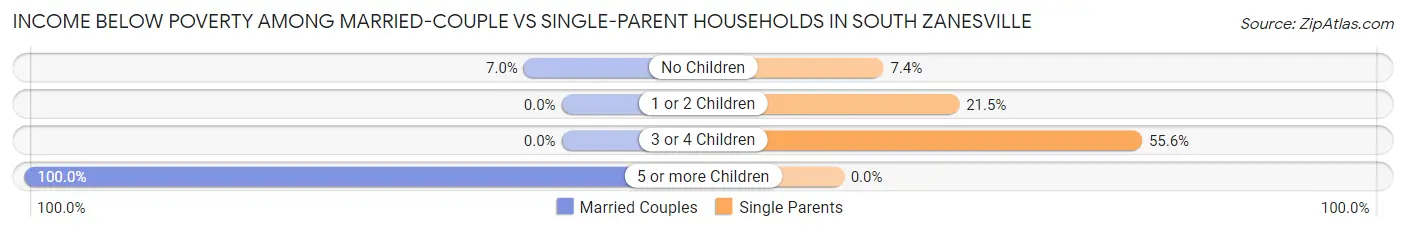
| Children | Married-Couple Families | Single-Parent Households |
| No Children | 19 (7.0%) | 4 (7.4%) |
| 1 or 2 Children | 0 (0.0%) | 17 (21.5%) |
| 3 or 4 Children | 0 (0.0%) | 15 (55.6%) |
| 5 or more Children | 6 (100.0%) | 0 (0.0%) |
| Total | 25 (7.2%) | 36 (21.0%) |
Race in South Zanesville
The most populous races in South Zanesville are White / Caucasian (1,719 | 91.6%), Two or more Races (114 | 6.1%), and Black / African American (43 | 2.3%).
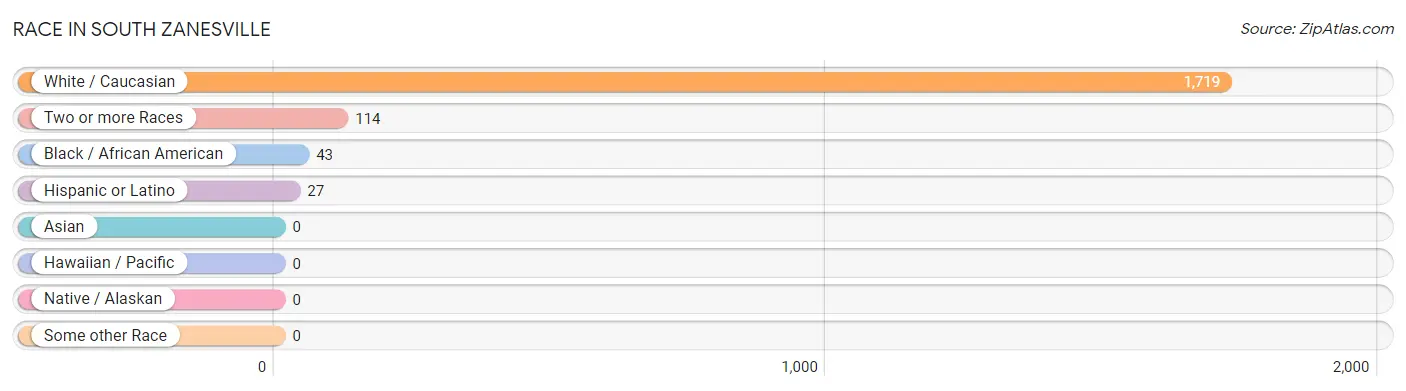
| Race | # Population | % Population |
| Asian | 0 | 0.0% |
| Black / African American | 43 | 2.3% |
| Hawaiian / Pacific | 0 | 0.0% |
| Hispanic or Latino | 27 | 1.4% |
| Native / Alaskan | 0 | 0.0% |
| White / Caucasian | 1,719 | 91.6% |
| Two or more Races | 114 | 6.1% |
| Some other Race | 0 | 0.0% |
| Total | 1,876 | 100.0% |
Ancestry in South Zanesville
The most populous ancestries reported in South Zanesville are German (296 | 15.8%), Irish (221 | 11.8%), English (164 | 8.7%), American (117 | 6.2%), and French (80 | 4.3%), together accounting for 46.8% of all South Zanesville residents.
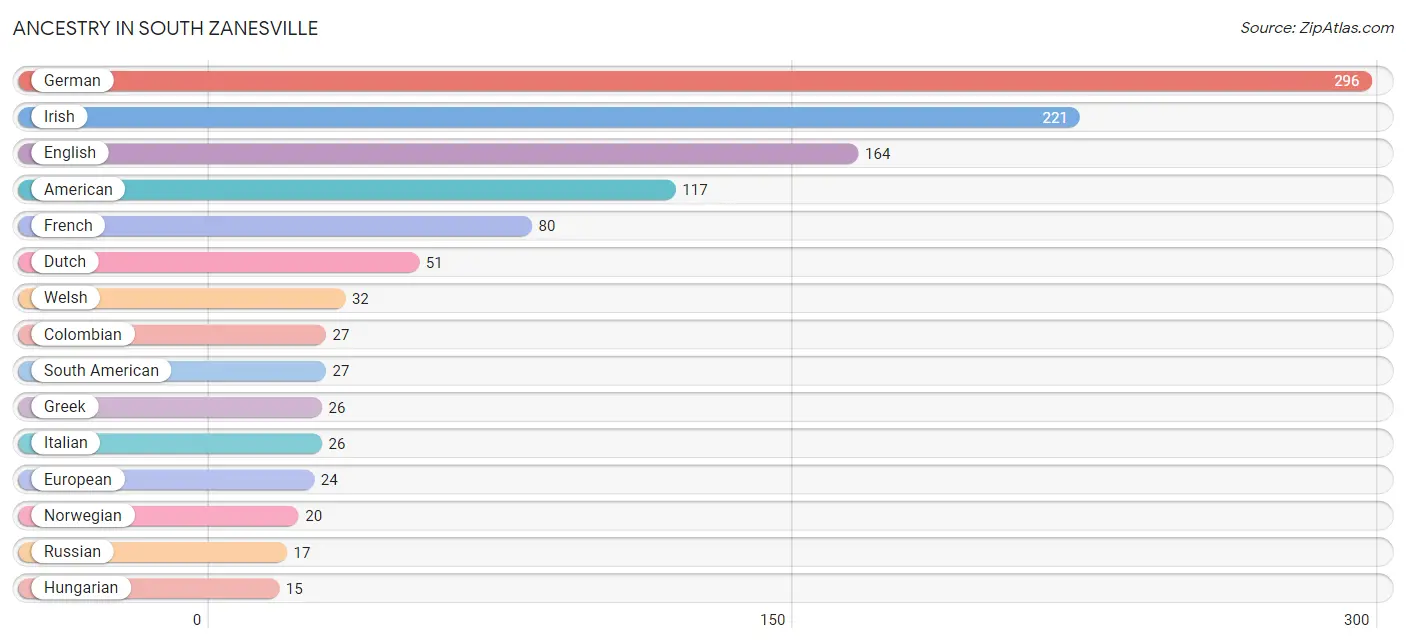
| Ancestry | # Population | % Population |
| American | 117 | 6.2% |
| Arab | 11 | 0.6% |
| Colombian | 27 | 1.4% |
| Dutch | 51 | 2.7% |
| English | 164 | 8.7% |
| European | 24 | 1.3% |
| French | 80 | 4.3% |
| German | 296 | 15.8% |
| Greek | 26 | 1.4% |
| Hungarian | 15 | 0.8% |
| Indian (Asian) | 6 | 0.3% |
| Irish | 221 | 11.8% |
| Italian | 26 | 1.4% |
| Latvian | 5 | 0.3% |
| Lebanese | 11 | 0.6% |
| Norwegian | 20 | 1.1% |
| Russian | 17 | 0.9% |
| Scotch-Irish | 11 | 0.6% |
| Slavic | 5 | 0.3% |
| South American | 27 | 1.4% |
| Swedish | 10 | 0.5% |
| Welsh | 32 | 1.7% | View All 22 Rows |
Immigrants in South Zanesville

| Immigration Origin | # Population | % Population | View All 0 Rows |
Sex and Age in South Zanesville
Sex and Age in South Zanesville
The most populous age groups in South Zanesville are 35 to 39 Years (93 | 11.3%) for men and 75 to 79 Years (98 | 9.3%) for women.
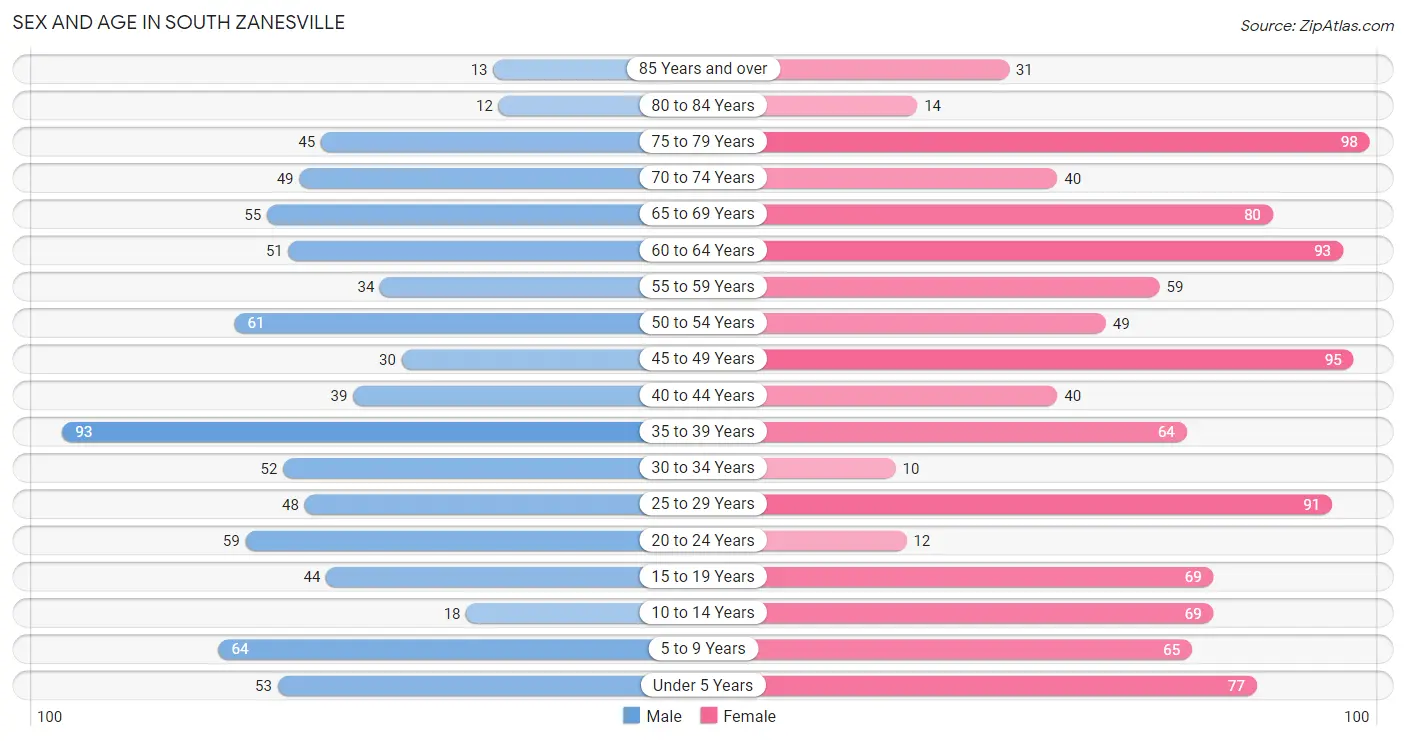
| Age Bracket | Male | Female |
| Under 5 Years | 53 (6.5%) | 77 (7.3%) |
| 5 to 9 Years | 64 (7.8%) | 65 (6.2%) |
| 10 to 14 Years | 18 (2.2%) | 69 (6.5%) |
| 15 to 19 Years | 44 (5.4%) | 69 (6.5%) |
| 20 to 24 Years | 59 (7.2%) | 12 (1.1%) |
| 25 to 29 Years | 48 (5.9%) | 91 (8.6%) |
| 30 to 34 Years | 52 (6.3%) | 10 (0.9%) |
| 35 to 39 Years | 93 (11.3%) | 64 (6.1%) |
| 40 to 44 Years | 39 (4.8%) | 40 (3.8%) |
| 45 to 49 Years | 30 (3.7%) | 95 (9.0%) |
| 50 to 54 Years | 61 (7.4%) | 49 (4.6%) |
| 55 to 59 Years | 34 (4.2%) | 59 (5.6%) |
| 60 to 64 Years | 51 (6.2%) | 93 (8.8%) |
| 65 to 69 Years | 55 (6.7%) | 80 (7.6%) |
| 70 to 74 Years | 49 (6.0%) | 40 (3.8%) |
| 75 to 79 Years | 45 (5.5%) | 98 (9.3%) |
| 80 to 84 Years | 12 (1.5%) | 14 (1.3%) |
| 85 Years and over | 13 (1.6%) | 31 (2.9%) |
| Total | 820 (100.0%) | 1,056 (100.0%) |
Families and Households in South Zanesville
Median Family Size in South Zanesville
The median family size in South Zanesville is 2.66 persons per family, with single male/father families (57 | 11.0%) accounting for the largest median family size of 3.3 persons per family. On the other hand, married-couple families (349 | 67.1%) represent the smallest median family size with 2.40 persons per family.
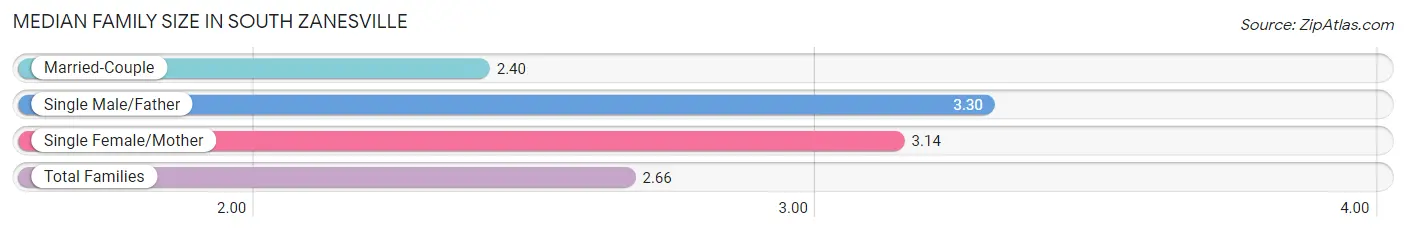
| Family Type | # Families | Family Size |
| Married-Couple | 349 (67.1%) | 2.40 |
| Single Male/Father | 57 (11.0%) | 3.30 |
| Single Female/Mother | 114 (21.9%) | 3.14 |
| Total Families | 520 (100.0%) | 2.66 |
Median Household Size in South Zanesville
The median household size in South Zanesville is 1.94 persons per household, with single male/father households (57 | 5.9%) accounting for the largest median household size of 3.53 persons per household. non-family households (446 | 46.2%) represent the smallest median household size with 1.06 persons per household.
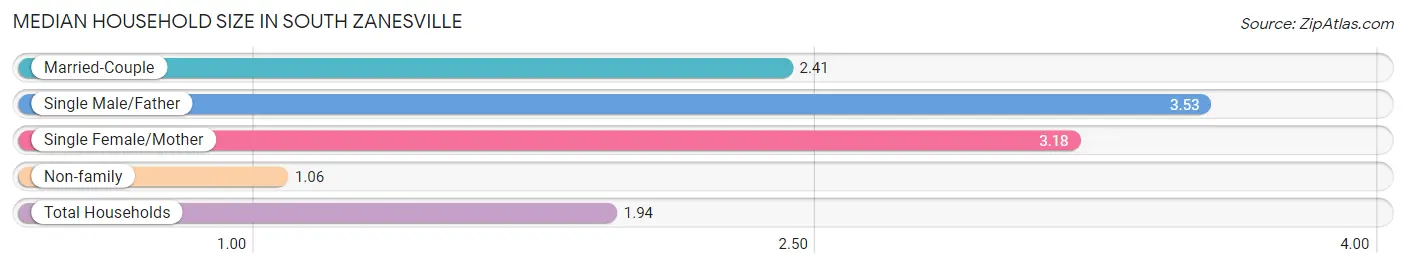
| Household Type | # Households | Household Size |
| Married-Couple | 349 (36.1%) | 2.41 |
| Single Male/Father | 57 (5.9%) | 3.53 |
| Single Female/Mother | 114 (11.8%) | 3.18 |
| Non-family | 446 (46.2%) | 1.06 |
| Total Households | 966 (100.0%) | 1.94 |
Household Size by Marriage Status in South Zanesville
Out of a total of 966 households in South Zanesville, 520 (53.8%) are family households, while 446 (46.2%) are nonfamily households. The most numerous type of family households are 2-person households, comprising 340, and the most common type of nonfamily households are 1-person households, comprising 424.
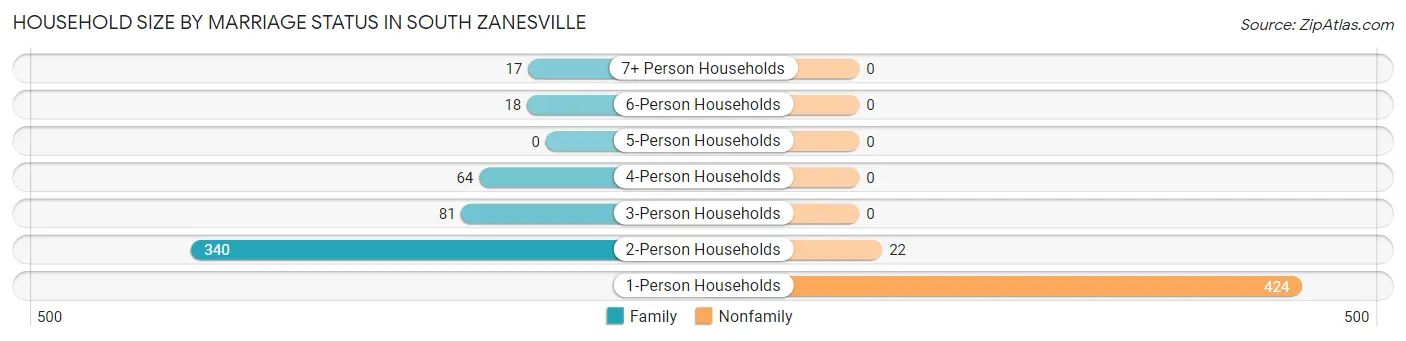
| Household Size | Family Households | Nonfamily Households |
| 1-Person Households | - | 424 (43.9%) |
| 2-Person Households | 340 (35.2%) | 22 (2.3%) |
| 3-Person Households | 81 (8.4%) | 0 (0.0%) |
| 4-Person Households | 64 (6.6%) | 0 (0.0%) |
| 5-Person Households | 0 (0.0%) | 0 (0.0%) |
| 6-Person Households | 18 (1.9%) | 0 (0.0%) |
| 7+ Person Households | 17 (1.8%) | 0 (0.0%) |
| Total | 520 (53.8%) | 446 (46.2%) |
Female Fertility in South Zanesville
Fertility by Age in South Zanesville
Average fertility rate in South Zanesville is 31.0 births per 1,000 women. Women in the age bracket of 20 to 34 years have the highest fertility rate with 53.0 births per 1,000 women. Women in the age bracket of 20 to 34 years acount for 50.0% of all women with births.
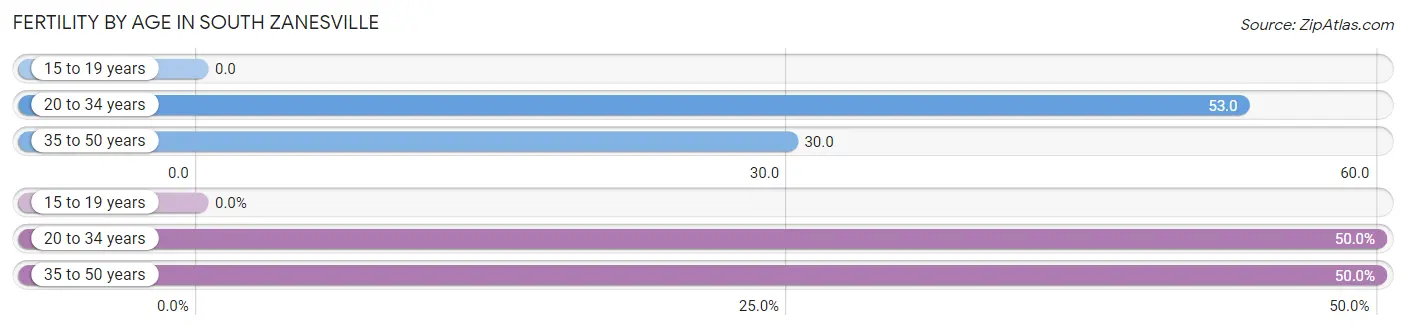
| Age Bracket | Women with Births | Births / 1,000 Women |
| 15 to 19 years | 0 (0.0%) | 0.0 |
| 20 to 34 years | 6 (50.0%) | 53.0 |
| 35 to 50 years | 6 (50.0%) | 30.0 |
| Total | 12 (100.0%) | 31.0 |
Fertility by Age by Marriage Status in South Zanesville
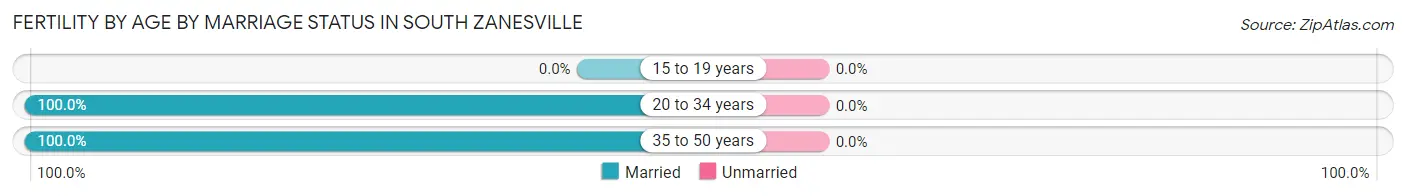
| Age Bracket | Married | Unmarried |
| 15 to 19 years | 0 (0.0%) | 0 (0.0%) |
| 20 to 34 years | 6 (100.0%) | 0 (0.0%) |
| 35 to 50 years | 6 (100.0%) | 0 (0.0%) |
| Total | 12 (100.0%) | 0 (0.0%) |
Fertility by Education in South Zanesville
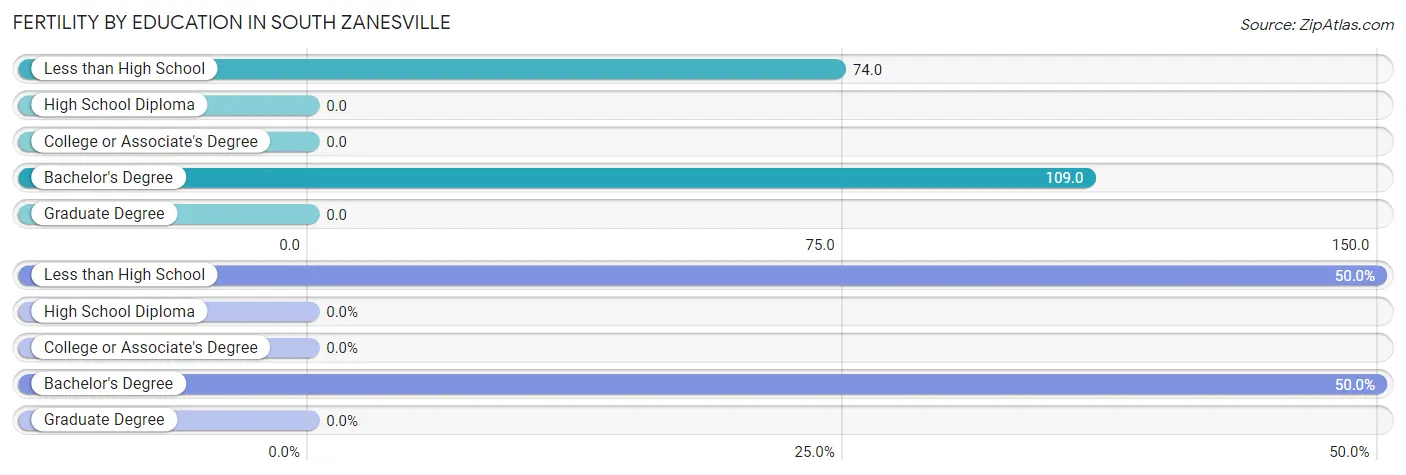
| Educational Attainment | Women with Births | Births / 1,000 Women |
| Less than High School | 6 (50.0%) | 74.0 |
| High School Diploma | 0 (0.0%) | 0.0 |
| College or Associate's Degree | 0 (0.0%) | 0.0 |
| Bachelor's Degree | 6 (50.0%) | 109.0 |
| Graduate Degree | 0 (0.0%) | 0.0 |
| Total | 12 (100.0%) | 31.0 |
Fertility by Education by Marriage Status in South Zanesville
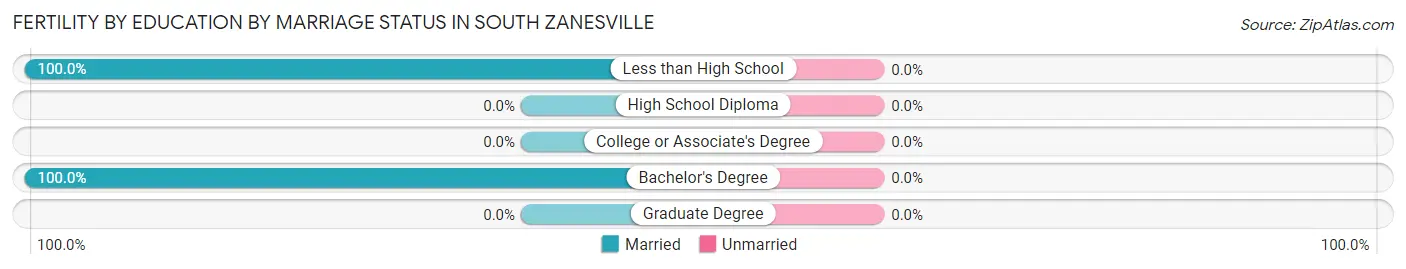
| Educational Attainment | Married | Unmarried |
| Less than High School | 6 (100.0%) | 0 (0.0%) |
| High School Diploma | 0 (0.0%) | 0 (0.0%) |
| College or Associate's Degree | 0 (0.0%) | 0 (0.0%) |
| Bachelor's Degree | 6 (100.0%) | 0 (0.0%) |
| Graduate Degree | 0 (0.0%) | 0 (0.0%) |
| Total | 12 (100.0%) | 0 (0.0%) |
Employment Characteristics in South Zanesville
Employment by Class of Employer in South Zanesville
Among the 757 employed individuals in South Zanesville, private company employees (603 | 79.7%), not-for-profit organizations (54 | 7.1%), and self-employed (not incorporated) (50 | 6.6%) make up the most common classes of employment.
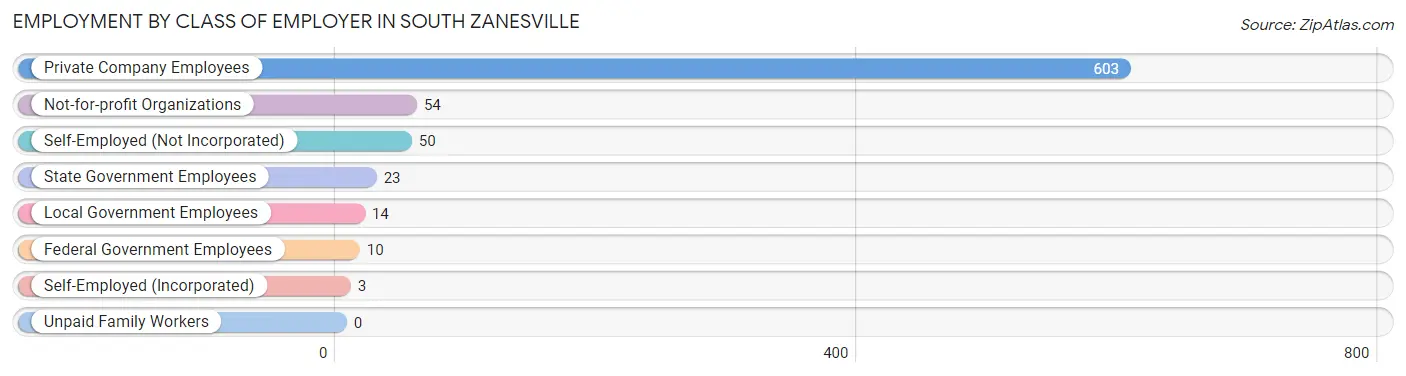
| Employer Class | # Employees | % Employees |
| Private Company Employees | 603 | 79.7% |
| Self-Employed (Incorporated) | 3 | 0.4% |
| Self-Employed (Not Incorporated) | 50 | 6.6% |
| Not-for-profit Organizations | 54 | 7.1% |
| Local Government Employees | 14 | 1.8% |
| State Government Employees | 23 | 3.0% |
| Federal Government Employees | 10 | 1.3% |
| Unpaid Family Workers | 0 | 0.0% |
| Total | 757 | 100.0% |
Employment Status by Age in South Zanesville
According to the labor force statistics for South Zanesville, out of the total population over 16 years of age (1,474), 54.3% or 800 individuals are in the labor force, with 3.3% or 26 of them unemployed. The age group with the highest labor force participation rate is 30 to 34 years, with 91.9% or 57 individuals in the labor force. Within the labor force, the 60 to 64 years age range has the highest percentage of unemployed individuals, with 14.9% or 10 of them being unemployed.
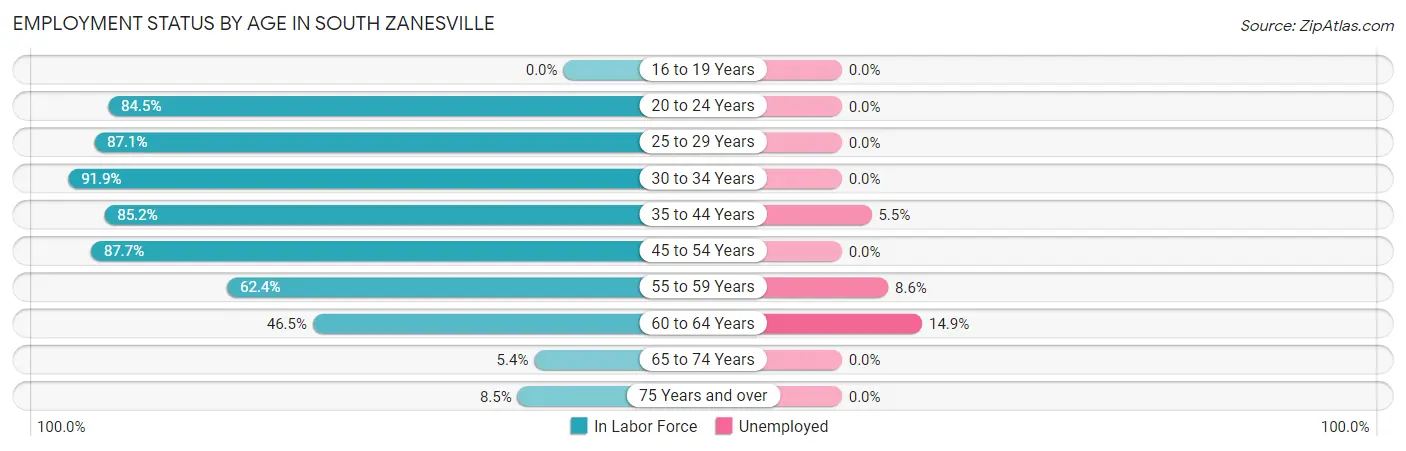
| Age Bracket | In Labor Force | Unemployed |
| 16 to 19 Years | 0 (0.0%) | 0 (0.0%) |
| 20 to 24 Years | 60 (84.5%) | 0 (0.0%) |
| 25 to 29 Years | 121 (87.1%) | 0 (0.0%) |
| 30 to 34 Years | 57 (91.9%) | 0 (0.0%) |
| 35 to 44 Years | 201 (85.2%) | 11 (5.5%) |
| 45 to 54 Years | 206 (87.7%) | 0 (0.0%) |
| 55 to 59 Years | 58 (62.4%) | 5 (8.6%) |
| 60 to 64 Years | 67 (46.5%) | 10 (14.9%) |
| 65 to 74 Years | 12 (5.4%) | 0 (0.0%) |
| 75 Years and over | 18 (8.5%) | 0 (0.0%) |
| Total | 800 (54.3%) | 26 (3.3%) |
Employment Status by Educational Attainment in South Zanesville
According to labor force statistics for South Zanesville, 78.1% of individuals (710) out of the total population between 25 and 64 years of age (909) are in the labor force, with 3.7% or 26 of them being unemployed. The group with the highest labor force participation rate are those with the educational attainment of bachelor's degree or higher, with 85.2% or 132 individuals in the labor force. Within the labor force, individuals with college / associate degree education have the highest percentage of unemployment, with 9.1% or 16 of them being unemployed.
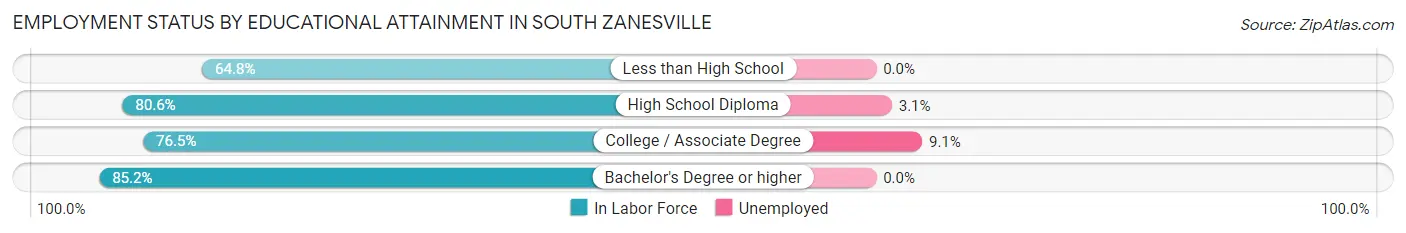
| Educational Attainment | In Labor Force | Unemployed |
| Less than High School | 83 (64.8%) | 0 (0.0%) |
| High School Diploma | 319 (80.6%) | 12 (3.1%) |
| College / Associate Degree | 176 (76.5%) | 21 (9.1%) |
| Bachelor's Degree or higher | 132 (85.2%) | 0 (0.0%) |
| Total | 710 (78.1%) | 34 (3.7%) |
Employment Occupations by Sex in South Zanesville
Management, Business, Science and Arts Occupations
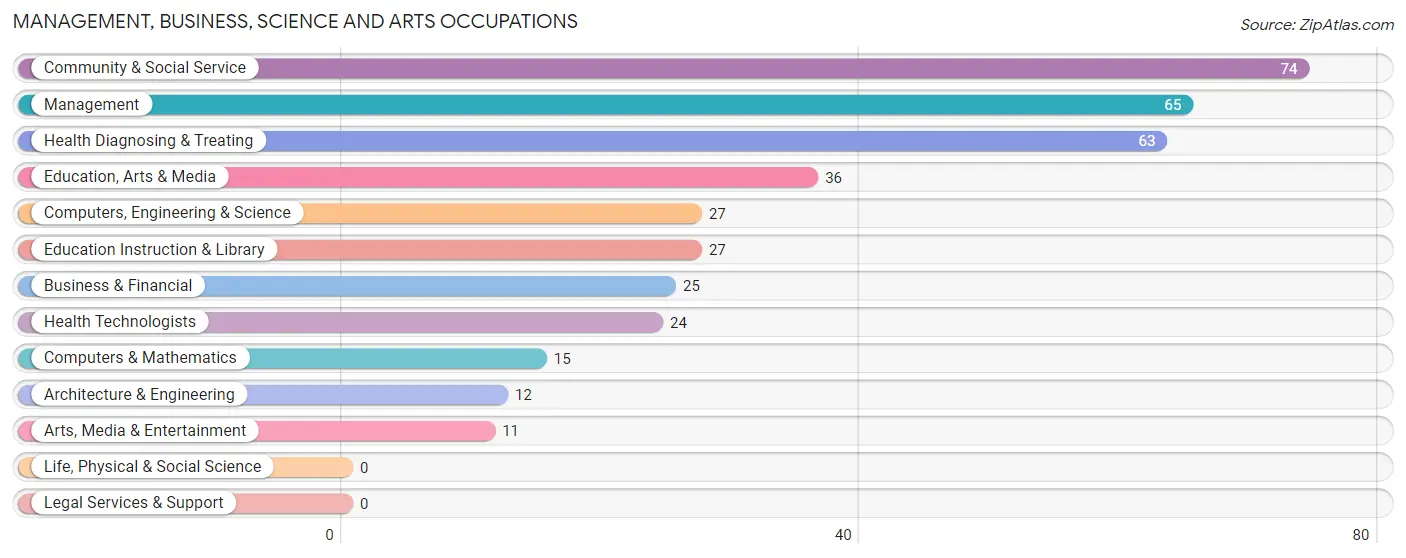
The most common Management, Business, Science and Arts occupations in South Zanesville are Community & Social Service (74 | 9.6%), Management (65 | 8.4%), Health Diagnosing & Treating (63 | 8.1%), Education, Arts & Media (36 | 4.6%), and Computers, Engineering & Science (27 | 3.5%).
Management, Business, Science and Arts Occupations by Sex
Within the Management, Business, Science and Arts occupations in South Zanesville, the most male-oriented occupations are Computers, Engineering & Science (100.0%), Computers & Mathematics (100.0%), and Architecture & Engineering (100.0%), while the most female-oriented occupations are Business & Financial (100.0%), Education Instruction & Library (100.0%), and Health Diagnosing & Treating (100.0%).
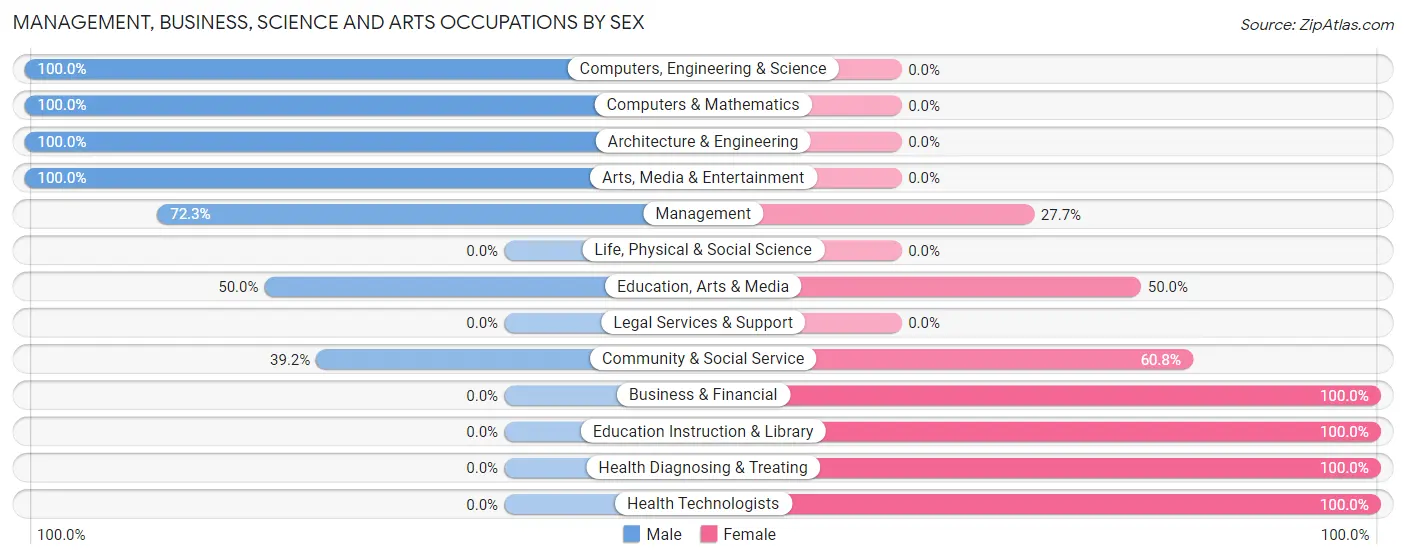
| Occupation | Male | Female |
| Management | 47 (72.3%) | 18 (27.7%) |
| Business & Financial | 0 (0.0%) | 25 (100.0%) |
| Computers, Engineering & Science | 27 (100.0%) | 0 (0.0%) |
| Computers & Mathematics | 15 (100.0%) | 0 (0.0%) |
| Architecture & Engineering | 12 (100.0%) | 0 (0.0%) |
| Life, Physical & Social Science | 0 (0.0%) | 0 (0.0%) |
| Community & Social Service | 29 (39.2%) | 45 (60.8%) |
| Education, Arts & Media | 18 (50.0%) | 18 (50.0%) |
| Legal Services & Support | 0 (0.0%) | 0 (0.0%) |
| Education Instruction & Library | 0 (0.0%) | 27 (100.0%) |
| Arts, Media & Entertainment | 11 (100.0%) | 0 (0.0%) |
| Health Diagnosing & Treating | 0 (0.0%) | 63 (100.0%) |
| Health Technologists | 0 (0.0%) | 24 (100.0%) |
| Total (Category) | 103 (40.6%) | 151 (59.5%) |
| Total (Overall) | 393 (50.8%) | 381 (49.2%) |
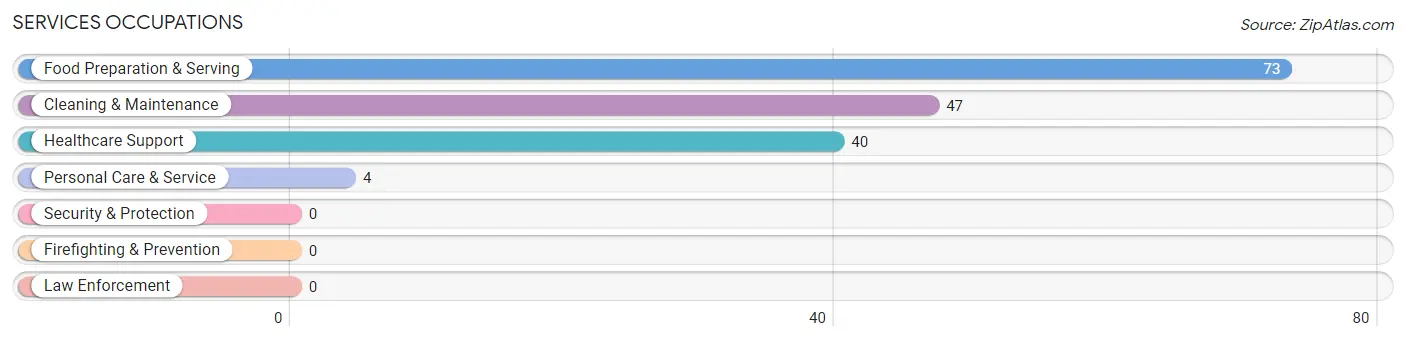
Services Occupations
The most common Services occupations in South Zanesville are Food Preparation & Serving (73 | 9.4%), Cleaning & Maintenance (47 | 6.1%), Healthcare Support (40 | 5.2%), and Personal Care & Service (4 | 0.5%).
Services Occupations by Sex
Within the Services occupations in South Zanesville, the most male-oriented occupations are Personal Care & Service (100.0%), Cleaning & Maintenance (89.4%), and Healthcare Support (65.0%), while the most female-oriented occupations are Food Preparation & Serving (57.5%), Healthcare Support (35.0%), and Cleaning & Maintenance (10.6%).
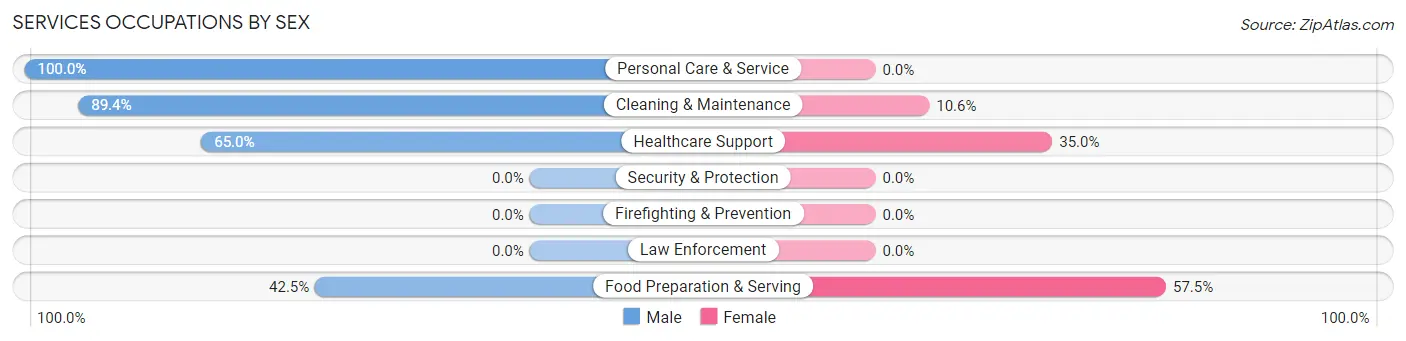
| Occupation | Male | Female |
| Healthcare Support | 26 (65.0%) | 14 (35.0%) |
| Security & Protection | 0 (0.0%) | 0 (0.0%) |
| Firefighting & Prevention | 0 (0.0%) | 0 (0.0%) |
| Law Enforcement | 0 (0.0%) | 0 (0.0%) |
| Food Preparation & Serving | 31 (42.5%) | 42 (57.5%) |
| Cleaning & Maintenance | 42 (89.4%) | 5 (10.6%) |
| Personal Care & Service | 4 (100.0%) | 0 (0.0%) |
| Total (Category) | 103 (62.8%) | 61 (37.2%) |
| Total (Overall) | 393 (50.8%) | 381 (49.2%) |
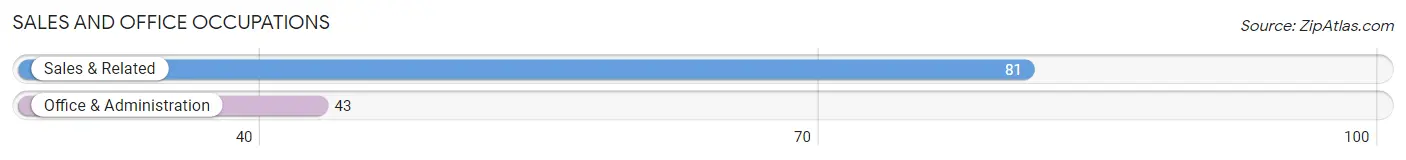
Sales and Office Occupations
The most common Sales and Office occupations in South Zanesville are Sales & Related (81 | 10.5%), and Office & Administration (43 | 5.6%).
Sales and Office Occupations by Sex
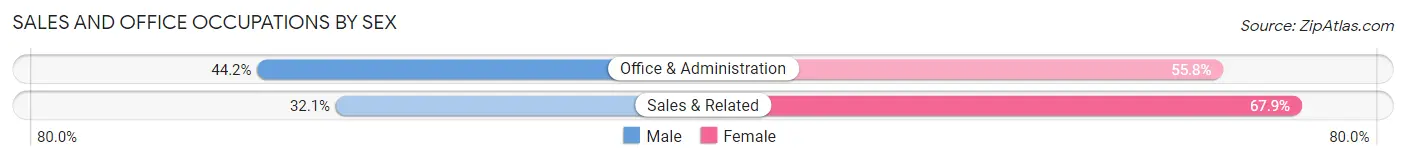
| Occupation | Male | Female |
| Sales & Related | 26 (32.1%) | 55 (67.9%) |
| Office & Administration | 19 (44.2%) | 24 (55.8%) |
| Total (Category) | 45 (36.3%) | 79 (63.7%) |
| Total (Overall) | 393 (50.8%) | 381 (49.2%) |
Natural Resources, Construction and Maintenance Occupations
The most common Natural Resources, Construction and Maintenance occupations in South Zanesville are Construction & Extraction (62 | 8.0%), and Installation, Maintenance & Repair (22 | 2.8%).
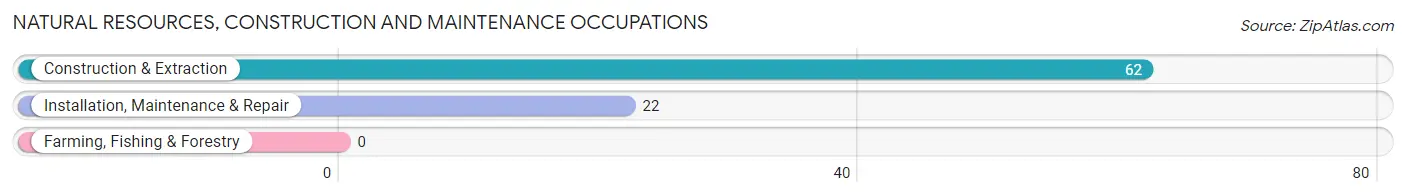
Natural Resources, Construction and Maintenance Occupations by Sex

| Occupation | Male | Female |
| Farming, Fishing & Forestry | 0 (0.0%) | 0 (0.0%) |
| Construction & Extraction | 62 (100.0%) | 0 (0.0%) |
| Installation, Maintenance & Repair | 4 (18.2%) | 18 (81.8%) |
| Total (Category) | 66 (78.6%) | 18 (21.4%) |
| Total (Overall) | 393 (50.8%) | 381 (49.2%) |
Production, Transportation and Moving Occupations
The most common Production, Transportation and Moving occupations in South Zanesville are Material Moving (56 | 7.2%), Transportation (49 | 6.3%), and Production (43 | 5.6%).
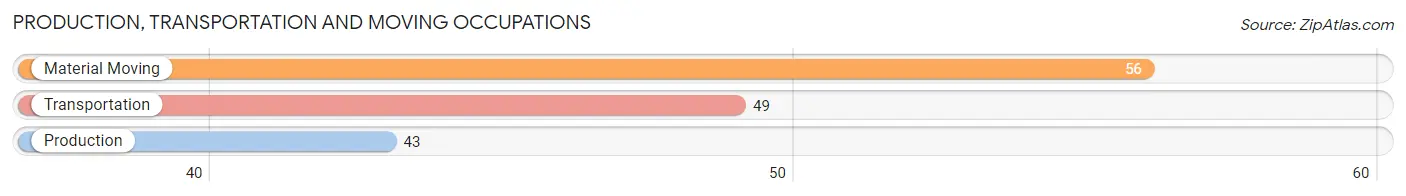
Production, Transportation and Moving Occupations by Sex
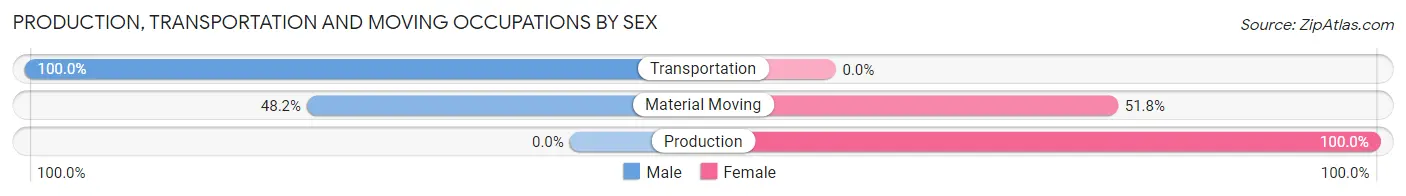
| Occupation | Male | Female |
| Production | 0 (0.0%) | 43 (100.0%) |
| Transportation | 49 (100.0%) | 0 (0.0%) |
| Material Moving | 27 (48.2%) | 29 (51.8%) |
| Total (Category) | 76 (51.3%) | 72 (48.6%) |
| Total (Overall) | 393 (50.8%) | 381 (49.2%) |
Employment Industries by Sex in South Zanesville
Employment Industries in South Zanesville
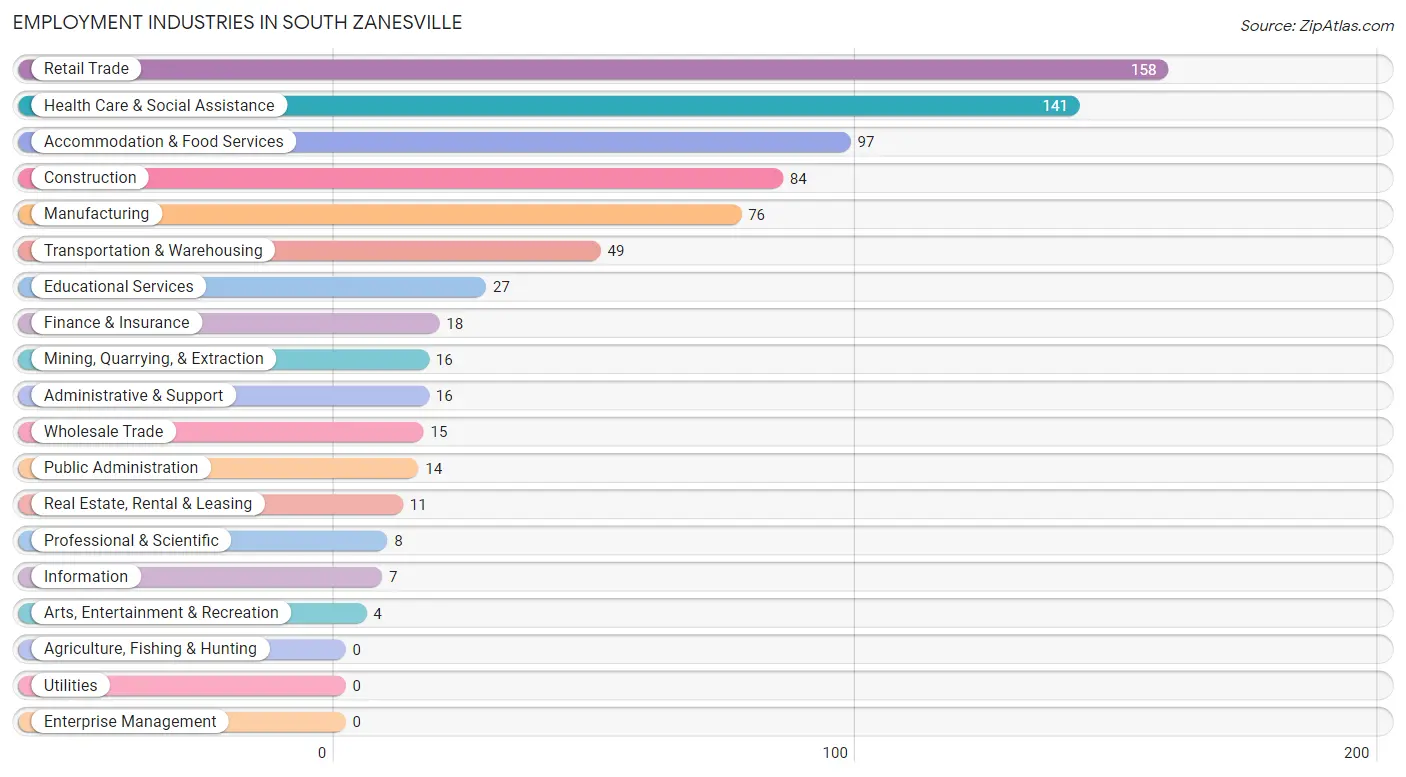
The major employment industries in South Zanesville include Retail Trade (158 | 20.4%), Health Care & Social Assistance (141 | 18.2%), Accommodation & Food Services (97 | 12.5%), Construction (84 | 10.8%), and Manufacturing (76 | 9.8%).
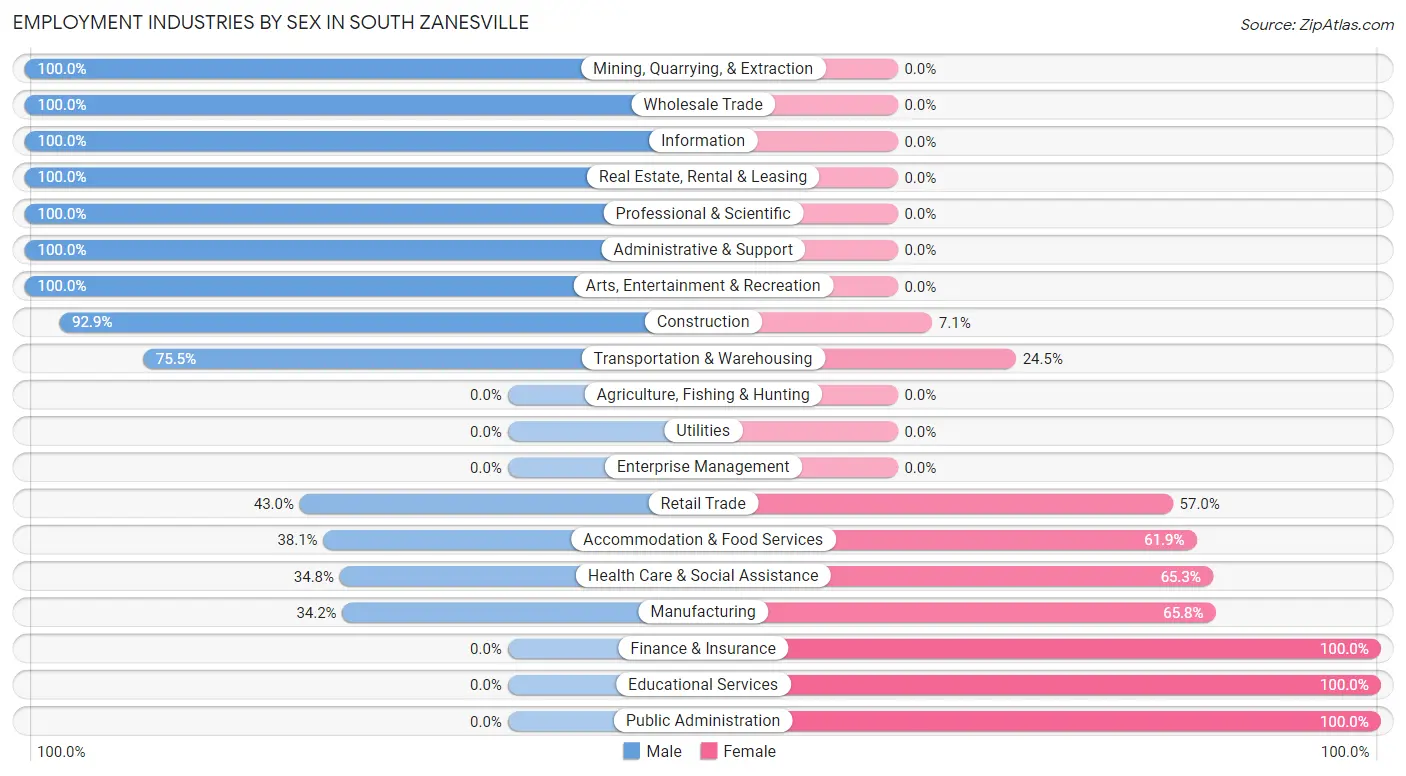
Employment Industries by Sex in South Zanesville
The South Zanesville industries that see more men than women are Mining, Quarrying, & Extraction (100.0%), Wholesale Trade (100.0%), and Information (100.0%), whereas the industries that tend to have a higher number of women are Finance & Insurance (100.0%), Educational Services (100.0%), and Public Administration (100.0%).
| Industry | Male | Female |
| Agriculture, Fishing & Hunting | 0 (0.0%) | 0 (0.0%) |
| Mining, Quarrying, & Extraction | 16 (100.0%) | 0 (0.0%) |
| Construction | 78 (92.9%) | 6 (7.1%) |
| Manufacturing | 26 (34.2%) | 50 (65.8%) |
| Wholesale Trade | 15 (100.0%) | 0 (0.0%) |
| Retail Trade | 68 (43.0%) | 90 (57.0%) |
| Transportation & Warehousing | 37 (75.5%) | 12 (24.5%) |
| Utilities | 0 (0.0%) | 0 (0.0%) |
| Information | 7 (100.0%) | 0 (0.0%) |
| Finance & Insurance | 0 (0.0%) | 18 (100.0%) |
| Real Estate, Rental & Leasing | 11 (100.0%) | 0 (0.0%) |
| Professional & Scientific | 8 (100.0%) | 0 (0.0%) |
| Enterprise Management | 0 (0.0%) | 0 (0.0%) |
| Administrative & Support | 16 (100.0%) | 0 (0.0%) |
| Educational Services | 0 (0.0%) | 27 (100.0%) |
| Health Care & Social Assistance | 49 (34.7%) | 92 (65.2%) |
| Arts, Entertainment & Recreation | 4 (100.0%) | 0 (0.0%) |
| Accommodation & Food Services | 37 (38.1%) | 60 (61.9%) |
| Public Administration | 0 (0.0%) | 14 (100.0%) |
| Total | 393 (50.8%) | 381 (49.2%) |
Education in South Zanesville
School Enrollment in South Zanesville
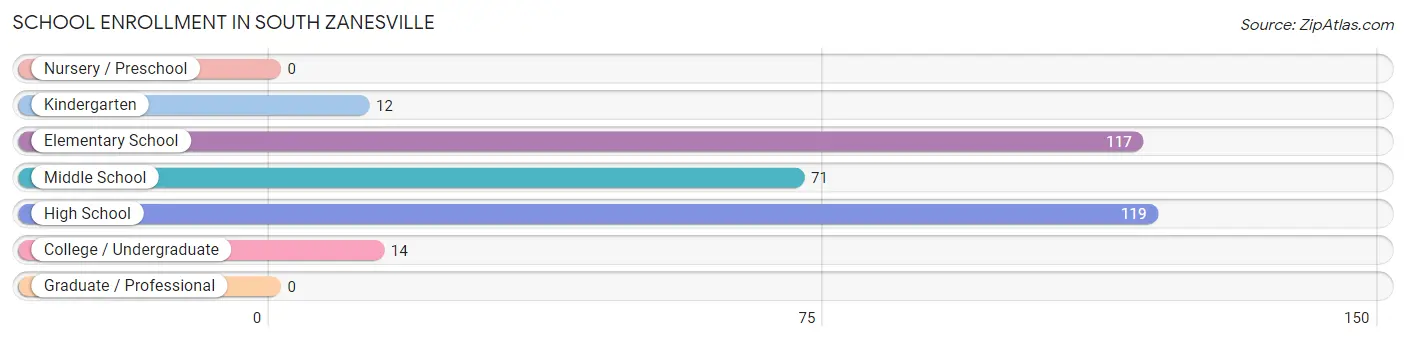
The most common levels of schooling among the 333 students in South Zanesville are high school (119 | 35.7%), elementary school (117 | 35.1%), and middle school (71 | 21.3%).
| School Level | # Students | % Students |
| Nursery / Preschool | 0 | 0.0% |
| Kindergarten | 12 | 3.6% |
| Elementary School | 117 | 35.1% |
| Middle School | 71 | 21.3% |
| High School | 119 | 35.7% |
| College / Undergraduate | 14 | 4.2% |
| Graduate / Professional | 0 | 0.0% |
| Total | 333 | 100.0% |
School Enrollment by Age by Funding Source in South Zanesville
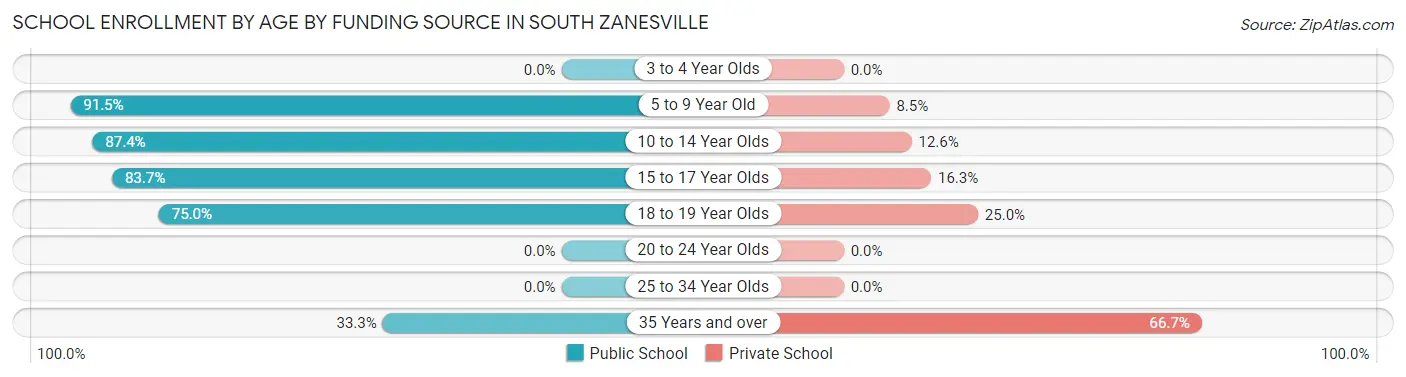
Out of a total of 333 students who are enrolled in schools in South Zanesville, 50 (15.0%) attend a private institution, while the remaining 283 (85.0%) are enrolled in public schools. The age group of 35 years and over has the highest likelihood of being enrolled in private schools, with 10 (66.7% in the age bracket) enrolled. Conversely, the age group of 5 to 9 year old has the lowest likelihood of being enrolled in a private school, with 118 (91.5% in the age bracket) attending a public institution.
| Age Bracket | Public School | Private School |
| 3 to 4 Year Olds | 0 (0.0%) | 0 (0.0%) |
| 5 to 9 Year Old | 118 (91.5%) | 11 (8.5%) |
| 10 to 14 Year Olds | 76 (87.4%) | 11 (12.6%) |
| 15 to 17 Year Olds | 72 (83.7%) | 14 (16.3%) |
| 18 to 19 Year Olds | 12 (75.0%) | 4 (25.0%) |
| 20 to 24 Year Olds | 0 (0.0%) | 0 (0.0%) |
| 25 to 34 Year Olds | 0 (0.0%) | 0 (0.0%) |
| 35 Years and over | 5 (33.3%) | 10 (66.7%) |
| Total | 283 (85.0%) | 50 (15.0%) |
Educational Attainment by Field of Study in South Zanesville
Arts & humanities (59 | 30.7%), business (28 | 14.6%), physical & health sciences (27 | 14.1%), visual & performing arts (23 | 12.0%), and science & technology (21 | 10.9%) are the most common fields of study among 192 individuals in South Zanesville who have obtained a bachelor's degree or higher.
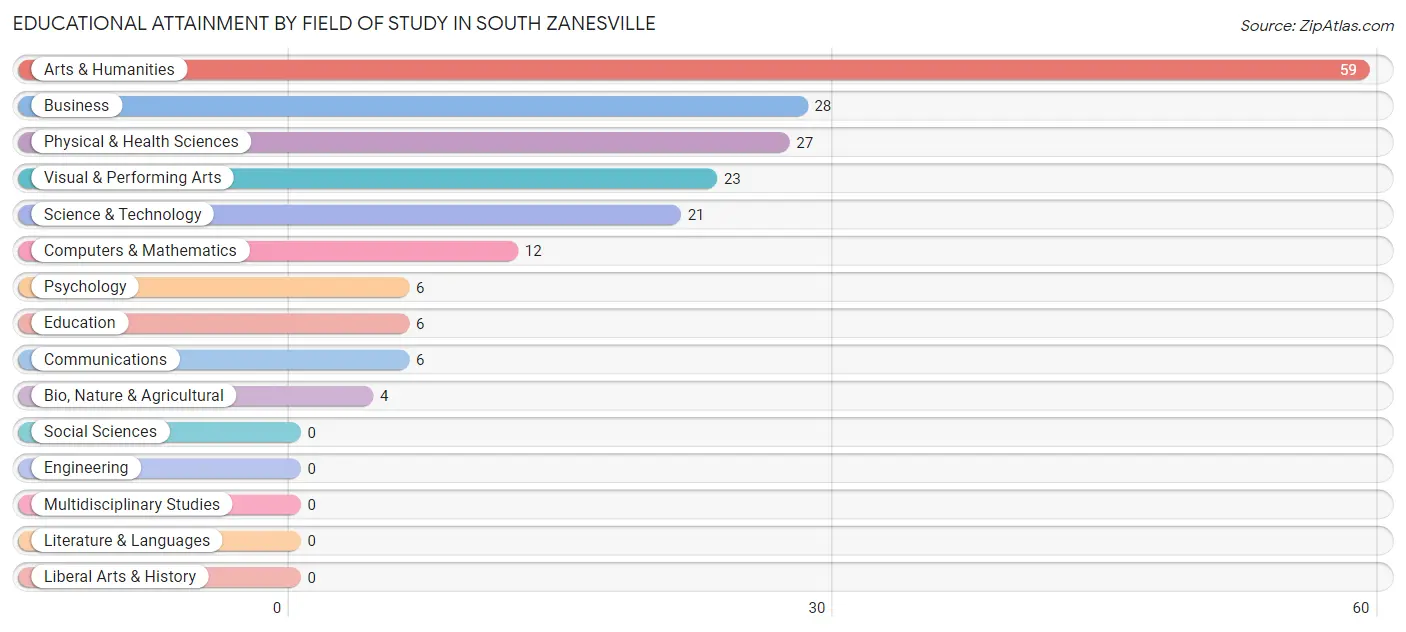
| Field of Study | # Graduates | % Graduates |
| Computers & Mathematics | 12 | 6.2% |
| Bio, Nature & Agricultural | 4 | 2.1% |
| Physical & Health Sciences | 27 | 14.1% |
| Psychology | 6 | 3.1% |
| Social Sciences | 0 | 0.0% |
| Engineering | 0 | 0.0% |
| Multidisciplinary Studies | 0 | 0.0% |
| Science & Technology | 21 | 10.9% |
| Business | 28 | 14.6% |
| Education | 6 | 3.1% |
| Literature & Languages | 0 | 0.0% |
| Liberal Arts & History | 0 | 0.0% |
| Visual & Performing Arts | 23 | 12.0% |
| Communications | 6 | 3.1% |
| Arts & Humanities | 59 | 30.7% |
| Total | 192 | 100.0% |
Transportation & Commute in South Zanesville
Vehicle Availability by Sex in South Zanesville
The most prevalent vehicle ownership categories in South Zanesville are males with 2 vehicles (205, accounting for 54.5%) and females with 2 vehicles (167, making up 53.8%).
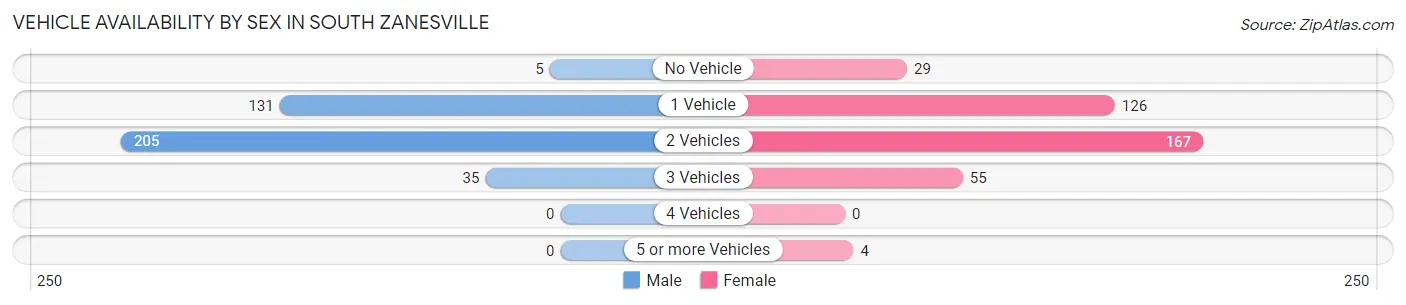
| Vehicles Available | Male | Female |
| No Vehicle | 5 (1.3%) | 29 (7.6%) |
| 1 Vehicle | 131 (34.8%) | 126 (33.1%) |
| 2 Vehicles | 205 (54.5%) | 167 (43.8%) |
| 3 Vehicles | 35 (9.3%) | 55 (14.4%) |
| 4 Vehicles | 0 (0.0%) | 0 (0.0%) |
| 5 or more Vehicles | 0 (0.0%) | 4 (1.1%) |
| Total | 376 (100.0%) | 381 (100.0%) |
Commute Time in South Zanesville
The most frequently occuring commute durations in South Zanesville are 10 to 14 minutes (144 commuters, 19.0%), 15 to 19 minutes (140 commuters, 18.5%), and 20 to 24 minutes (129 commuters, 17.0%).
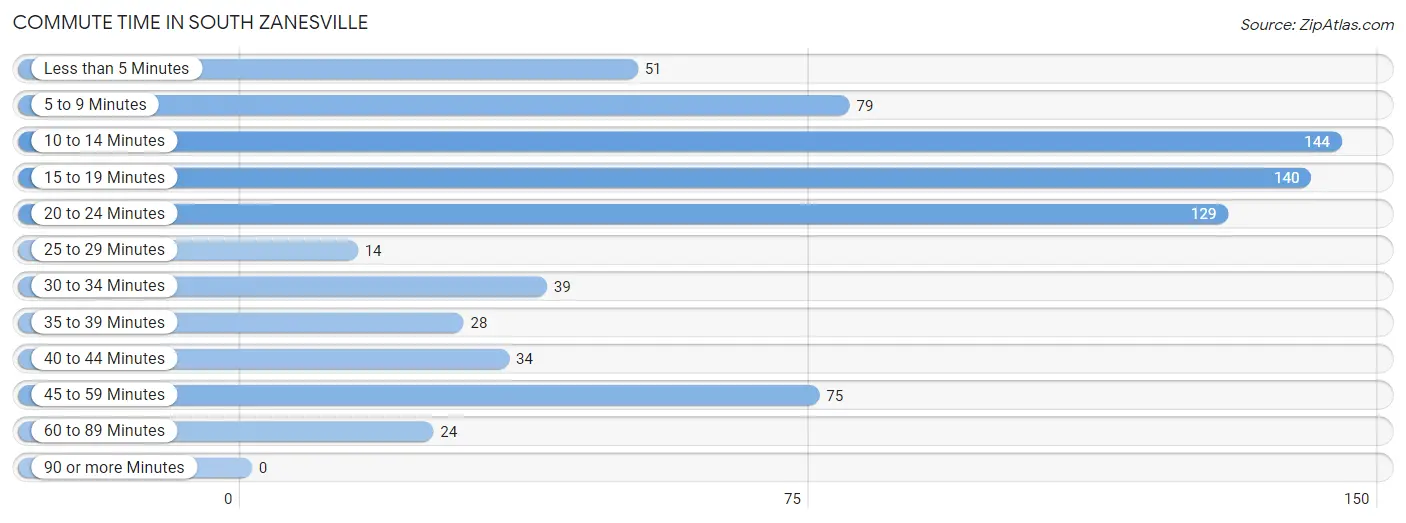
| Commute Time | # Commuters | % Commuters |
| Less than 5 Minutes | 51 | 6.7% |
| 5 to 9 Minutes | 79 | 10.4% |
| 10 to 14 Minutes | 144 | 19.0% |
| 15 to 19 Minutes | 140 | 18.5% |
| 20 to 24 Minutes | 129 | 17.0% |
| 25 to 29 Minutes | 14 | 1.8% |
| 30 to 34 Minutes | 39 | 5.1% |
| 35 to 39 Minutes | 28 | 3.7% |
| 40 to 44 Minutes | 34 | 4.5% |
| 45 to 59 Minutes | 75 | 9.9% |
| 60 to 89 Minutes | 24 | 3.2% |
| 90 or more Minutes | 0 | 0.0% |
Commute Time by Sex in South Zanesville
The most common commute times in South Zanesville are 10 to 14 minutes (112 commuters, 29.8%) for males and 15 to 19 minutes (82 commuters, 21.5%) for females.
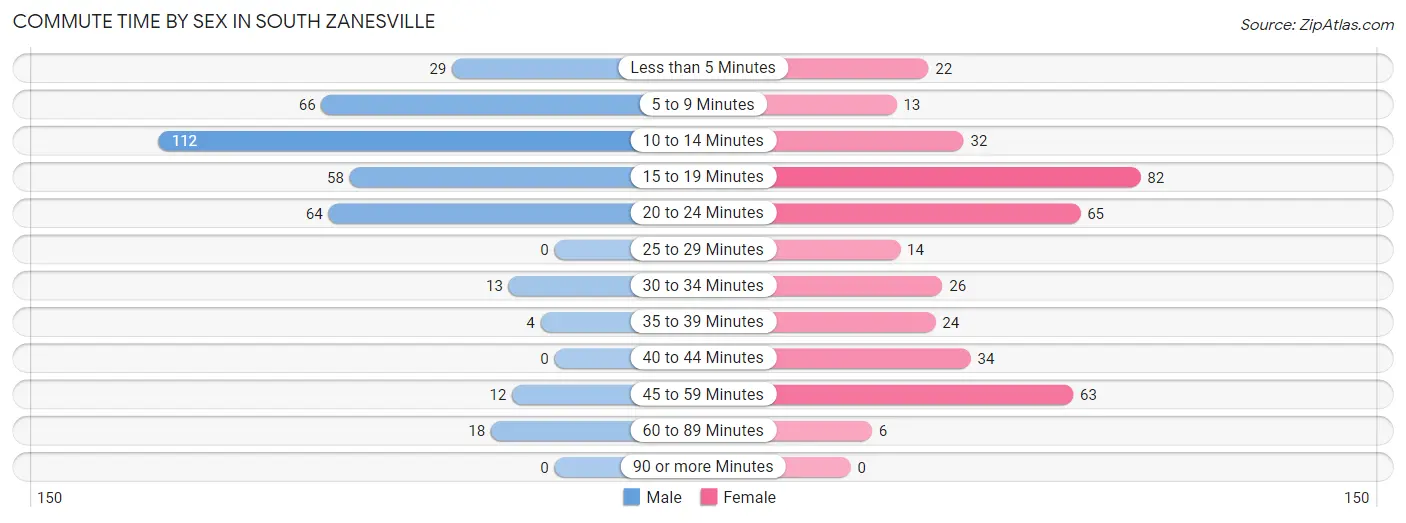
| Commute Time | Male | Female |
| Less than 5 Minutes | 29 (7.7%) | 22 (5.8%) |
| 5 to 9 Minutes | 66 (17.5%) | 13 (3.4%) |
| 10 to 14 Minutes | 112 (29.8%) | 32 (8.4%) |
| 15 to 19 Minutes | 58 (15.4%) | 82 (21.5%) |
| 20 to 24 Minutes | 64 (17.0%) | 65 (17.1%) |
| 25 to 29 Minutes | 0 (0.0%) | 14 (3.7%) |
| 30 to 34 Minutes | 13 (3.5%) | 26 (6.8%) |
| 35 to 39 Minutes | 4 (1.1%) | 24 (6.3%) |
| 40 to 44 Minutes | 0 (0.0%) | 34 (8.9%) |
| 45 to 59 Minutes | 12 (3.2%) | 63 (16.5%) |
| 60 to 89 Minutes | 18 (4.8%) | 6 (1.6%) |
| 90 or more Minutes | 0 (0.0%) | 0 (0.0%) |
Time of Departure to Work by Sex in South Zanesville
The most frequent times of departure to work in South Zanesville are 7:30 AM to 7:59 AM (92, 24.5%) for males and 9:00 AM to 9:59 AM (55, 14.4%) for females.
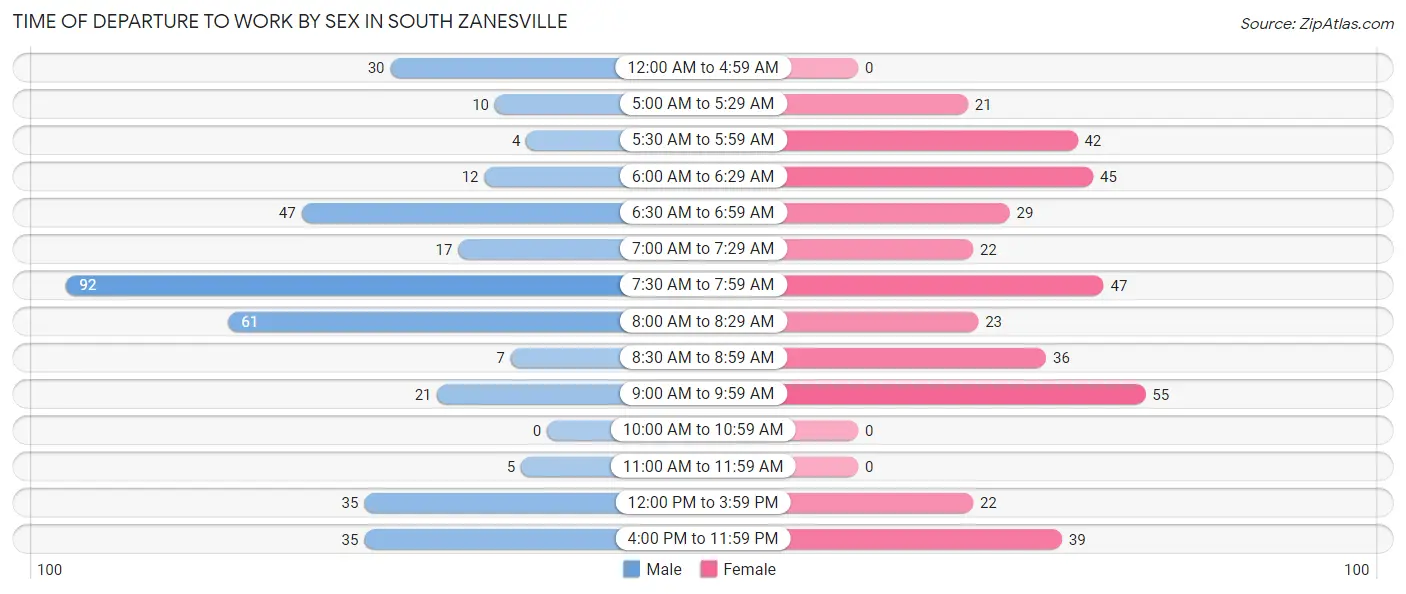
| Time of Departure | Male | Female |
| 12:00 AM to 4:59 AM | 30 (8.0%) | 0 (0.0%) |
| 5:00 AM to 5:29 AM | 10 (2.7%) | 21 (5.5%) |
| 5:30 AM to 5:59 AM | 4 (1.1%) | 42 (11.0%) |
| 6:00 AM to 6:29 AM | 12 (3.2%) | 45 (11.8%) |
| 6:30 AM to 6:59 AM | 47 (12.5%) | 29 (7.6%) |
| 7:00 AM to 7:29 AM | 17 (4.5%) | 22 (5.8%) |
| 7:30 AM to 7:59 AM | 92 (24.5%) | 47 (12.3%) |
| 8:00 AM to 8:29 AM | 61 (16.2%) | 23 (6.0%) |
| 8:30 AM to 8:59 AM | 7 (1.9%) | 36 (9.5%) |
| 9:00 AM to 9:59 AM | 21 (5.6%) | 55 (14.4%) |
| 10:00 AM to 10:59 AM | 0 (0.0%) | 0 (0.0%) |
| 11:00 AM to 11:59 AM | 5 (1.3%) | 0 (0.0%) |
| 12:00 PM to 3:59 PM | 35 (9.3%) | 22 (5.8%) |
| 4:00 PM to 11:59 PM | 35 (9.3%) | 39 (10.2%) |
| Total | 376 (100.0%) | 381 (100.0%) |
Housing Occupancy in South Zanesville
Occupancy by Ownership in South Zanesville
Of the total 966 dwellings in South Zanesville, owner-occupied units account for 670 (69.4%), while renter-occupied units make up 296 (30.6%).
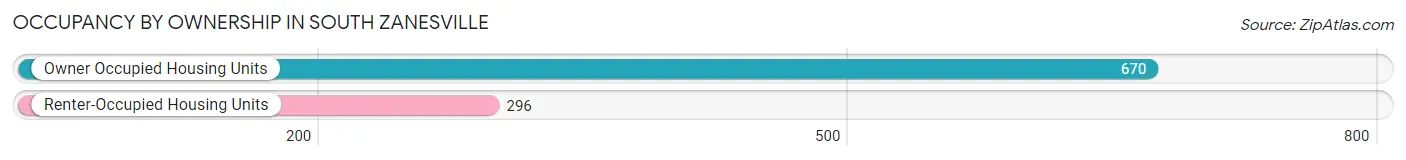
| Occupancy | # Housing Units | % Housing Units |
| Owner Occupied Housing Units | 670 | 69.4% |
| Renter-Occupied Housing Units | 296 | 30.6% |
| Total Occupied Housing Units | 966 | 100.0% |
Occupancy by Household Size in South Zanesville
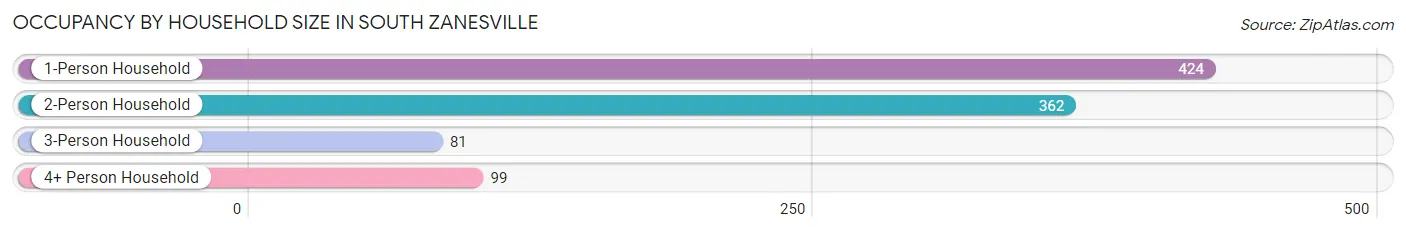
| Household Size | # Housing Units | % Housing Units |
| 1-Person Household | 424 | 43.9% |
| 2-Person Household | 362 | 37.5% |
| 3-Person Household | 81 | 8.4% |
| 4+ Person Household | 99 | 10.2% |
| Total Housing Units | 966 | 100.0% |
Occupancy by Ownership by Household Size in South Zanesville
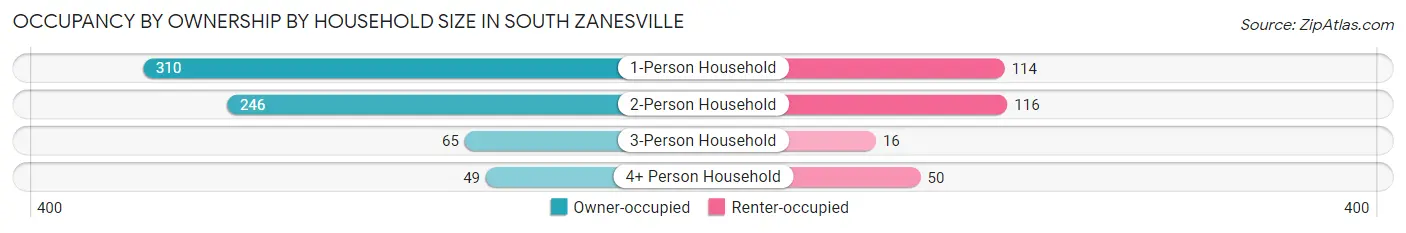
| Household Size | Owner-occupied | Renter-occupied |
| 1-Person Household | 310 (73.1%) | 114 (26.9%) |
| 2-Person Household | 246 (68.0%) | 116 (32.0%) |
| 3-Person Household | 65 (80.2%) | 16 (19.8%) |
| 4+ Person Household | 49 (49.5%) | 50 (50.5%) |
| Total Housing Units | 670 (69.4%) | 296 (30.6%) |
Occupancy by Educational Attainment in South Zanesville
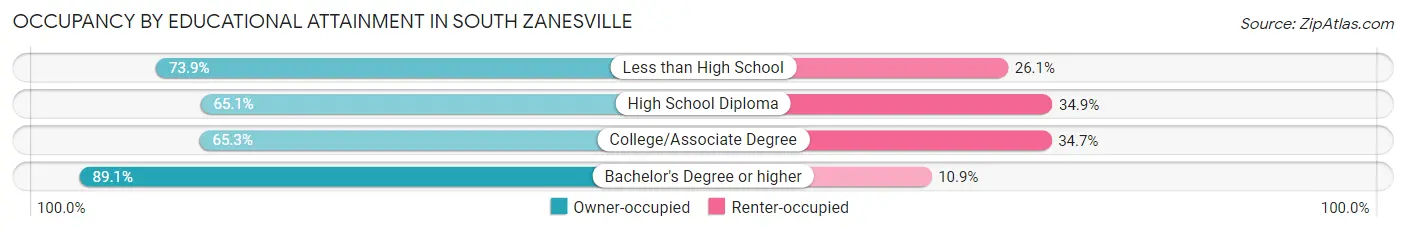
| Household Size | Owner-occupied | Renter-occupied |
| Less than High School | 119 (73.9%) | 42 (26.1%) |
| High School Diploma | 310 (65.1%) | 166 (34.9%) |
| College/Associate Degree | 143 (65.3%) | 76 (34.7%) |
| Bachelor's Degree or higher | 98 (89.1%) | 12 (10.9%) |
Occupancy by Age of Householder in South Zanesville

| Age Bracket | # Households | % Households |
| Under 35 Years | 178 | 18.4% |
| 35 to 44 Years | 121 | 12.5% |
| 45 to 54 Years | 156 | 16.2% |
| 55 to 64 Years | 191 | 19.8% |
| 65 to 74 Years | 139 | 14.4% |
| 75 to 84 Years | 137 | 14.2% |
| 85 Years and Over | 44 | 4.5% |
| Total | 966 | 100.0% |
Housing Finances in South Zanesville
Median Income by Occupancy in South Zanesville
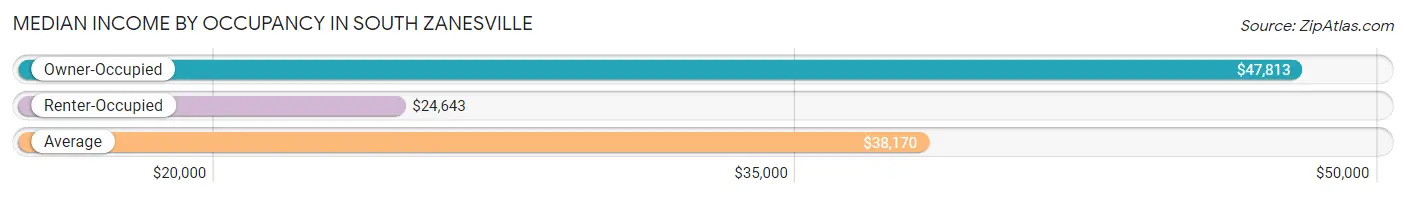
| Occupancy Type | # Households | Median Income |
| Owner-Occupied | 670 (69.4%) | $47,813 |
| Renter-Occupied | 296 (30.6%) | $24,643 |
| Average | 966 (100.0%) | $38,170 |
Occupancy by Householder Income Bracket in South Zanesville
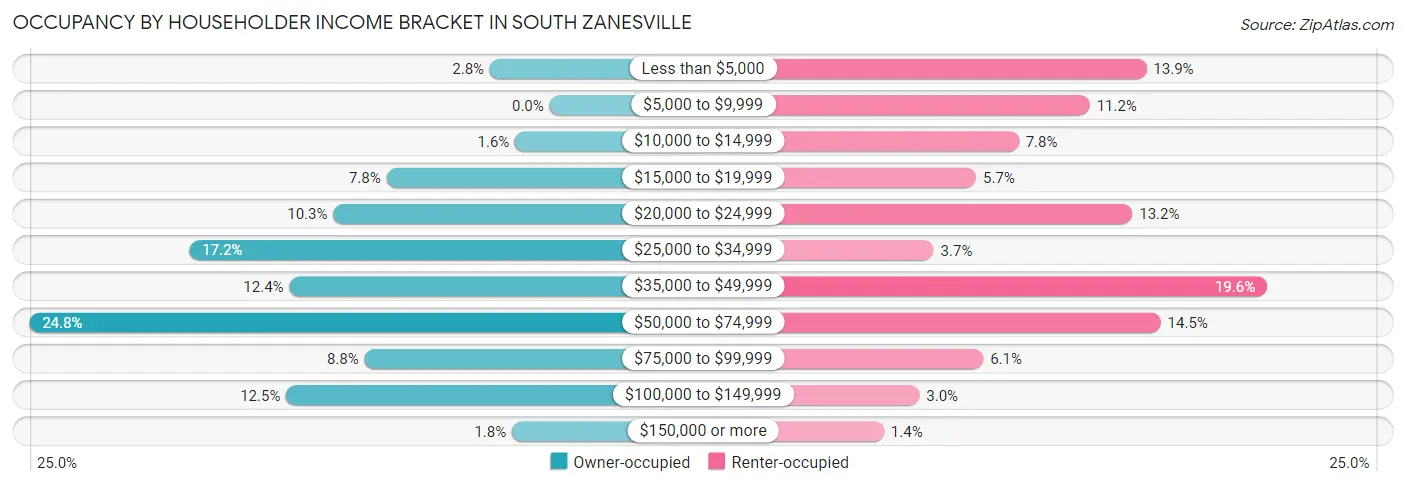
| Income Bracket | Owner-occupied | Renter-occupied |
| Less than $5,000 | 19 (2.8%) | 41 (13.9%) |
| $5,000 to $9,999 | 0 (0.0%) | 33 (11.2%) |
| $10,000 to $14,999 | 11 (1.6%) | 23 (7.8%) |
| $15,000 to $19,999 | 52 (7.8%) | 17 (5.7%) |
| $20,000 to $24,999 | 69 (10.3%) | 39 (13.2%) |
| $25,000 to $34,999 | 115 (17.2%) | 11 (3.7%) |
| $35,000 to $49,999 | 83 (12.4%) | 58 (19.6%) |
| $50,000 to $74,999 | 166 (24.8%) | 43 (14.5%) |
| $75,000 to $99,999 | 59 (8.8%) | 18 (6.1%) |
| $100,000 to $149,999 | 84 (12.5%) | 9 (3.0%) |
| $150,000 or more | 12 (1.8%) | 4 (1.3%) |
| Total | 670 (100.0%) | 296 (100.0%) |
Monthly Housing Cost Tiers in South Zanesville
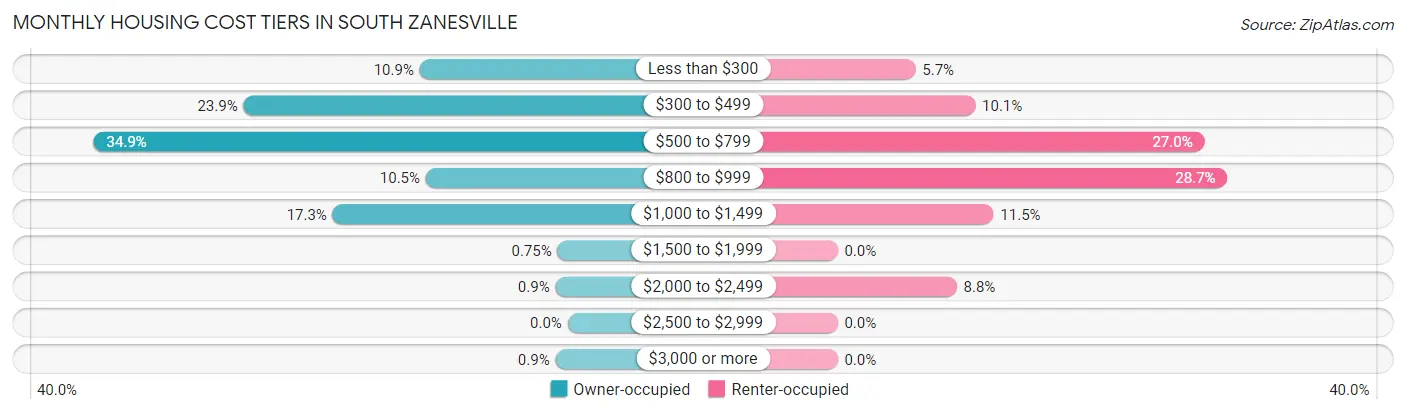
| Monthly Cost | Owner-occupied | Renter-occupied |
| Less than $300 | 73 (10.9%) | 17 (5.7%) |
| $300 to $499 | 160 (23.9%) | 30 (10.1%) |
| $500 to $799 | 234 (34.9%) | 80 (27.0%) |
| $800 to $999 | 70 (10.4%) | 85 (28.7%) |
| $1,000 to $1,499 | 116 (17.3%) | 34 (11.5%) |
| $1,500 to $1,999 | 5 (0.7%) | 0 (0.0%) |
| $2,000 to $2,499 | 6 (0.9%) | 26 (8.8%) |
| $2,500 to $2,999 | 0 (0.0%) | 0 (0.0%) |
| $3,000 or more | 6 (0.9%) | 0 (0.0%) |
| Total | 670 (100.0%) | 296 (100.0%) |
Physical Housing Characteristics in South Zanesville
Housing Structures in South Zanesville
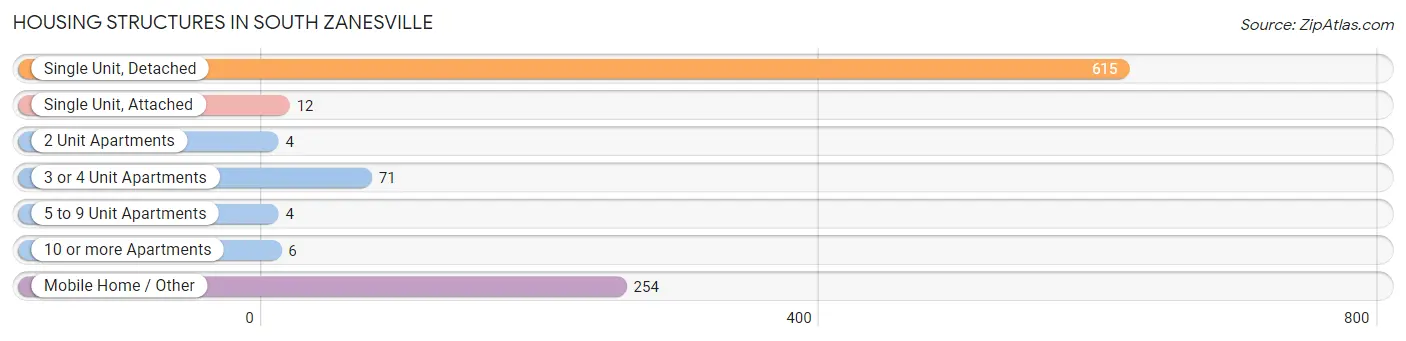
| Structure Type | # Housing Units | % Housing Units |
| Single Unit, Detached | 615 | 63.7% |
| Single Unit, Attached | 12 | 1.2% |
| 2 Unit Apartments | 4 | 0.4% |
| 3 or 4 Unit Apartments | 71 | 7.3% |
| 5 to 9 Unit Apartments | 4 | 0.4% |
| 10 or more Apartments | 6 | 0.6% |
| Mobile Home / Other | 254 | 26.3% |
| Total | 966 | 100.0% |
Housing Structures by Occupancy in South Zanesville
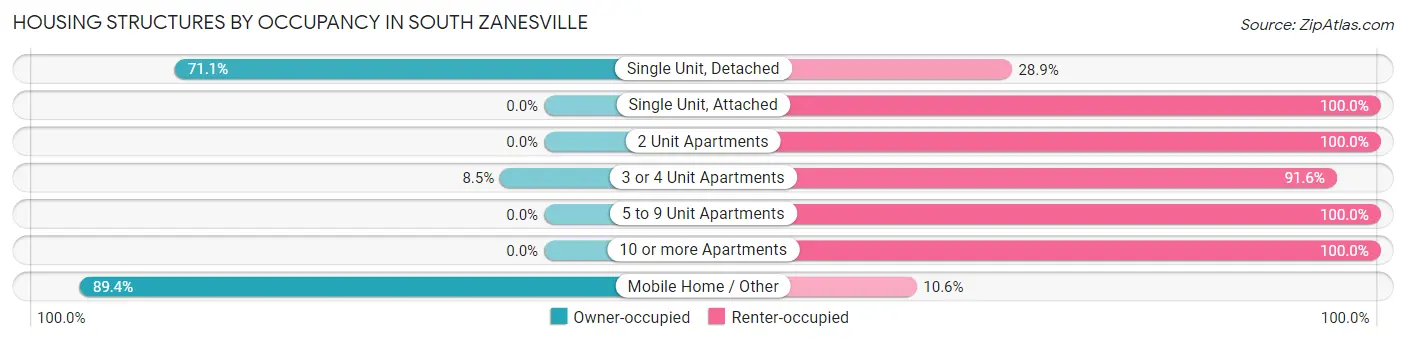
| Structure Type | Owner-occupied | Renter-occupied |
| Single Unit, Detached | 437 (71.1%) | 178 (28.9%) |
| Single Unit, Attached | 0 (0.0%) | 12 (100.0%) |
| 2 Unit Apartments | 0 (0.0%) | 4 (100.0%) |
| 3 or 4 Unit Apartments | 6 (8.5%) | 65 (91.5%) |
| 5 to 9 Unit Apartments | 0 (0.0%) | 4 (100.0%) |
| 10 or more Apartments | 0 (0.0%) | 6 (100.0%) |
| Mobile Home / Other | 227 (89.4%) | 27 (10.6%) |
| Total | 670 (69.4%) | 296 (30.6%) |
Housing Structures by Number of Rooms in South Zanesville
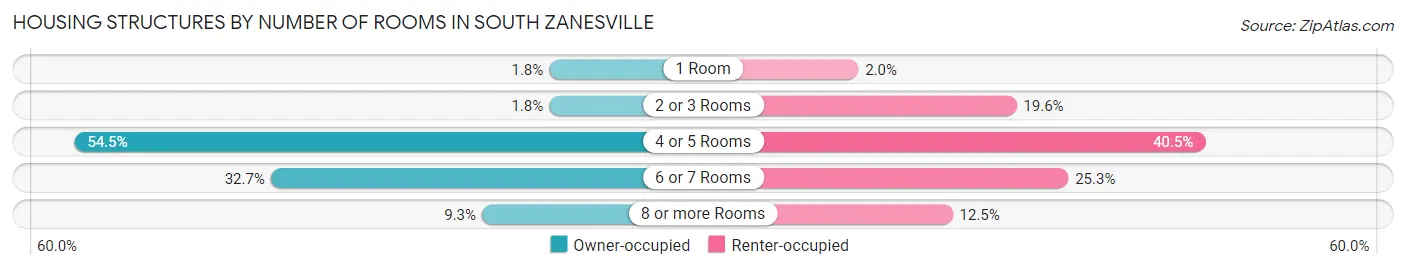
| Number of Rooms | Owner-occupied | Renter-occupied |
| 1 Room | 12 (1.8%) | 6 (2.0%) |
| 2 or 3 Rooms | 12 (1.8%) | 58 (19.6%) |
| 4 or 5 Rooms | 365 (54.5%) | 120 (40.5%) |
| 6 or 7 Rooms | 219 (32.7%) | 75 (25.3%) |
| 8 or more Rooms | 62 (9.2%) | 37 (12.5%) |
| Total | 670 (100.0%) | 296 (100.0%) |
Housing Structure by Heating Type in South Zanesville
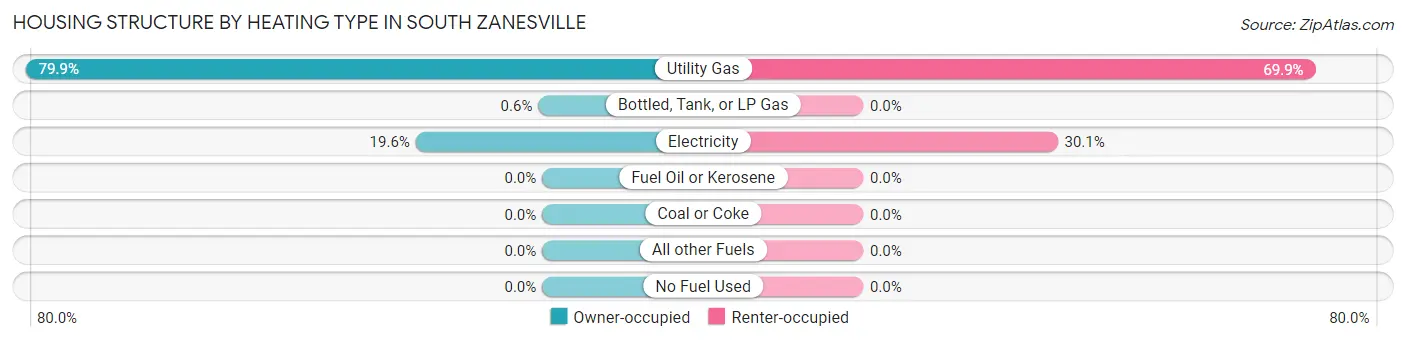
| Heating Type | Owner-occupied | Renter-occupied |
| Utility Gas | 535 (79.8%) | 207 (69.9%) |
| Bottled, Tank, or LP Gas | 4 (0.6%) | 0 (0.0%) |
| Electricity | 131 (19.6%) | 89 (30.1%) |
| Fuel Oil or Kerosene | 0 (0.0%) | 0 (0.0%) |
| Coal or Coke | 0 (0.0%) | 0 (0.0%) |
| All other Fuels | 0 (0.0%) | 0 (0.0%) |
| No Fuel Used | 0 (0.0%) | 0 (0.0%) |
| Total | 670 (100.0%) | 296 (100.0%) |
Household Vehicle Usage in South Zanesville
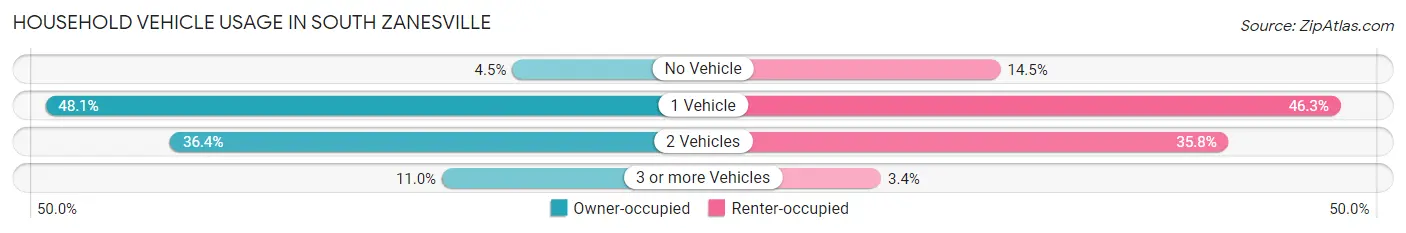
| Vehicles per Household | Owner-occupied | Renter-occupied |
| No Vehicle | 30 (4.5%) | 43 (14.5%) |
| 1 Vehicle | 322 (48.1%) | 137 (46.3%) |
| 2 Vehicles | 244 (36.4%) | 106 (35.8%) |
| 3 or more Vehicles | 74 (11.0%) | 10 (3.4%) |
| Total | 670 (100.0%) | 296 (100.0%) |
Real Estate & Mortgages in South Zanesville
Real Estate and Mortgage Overview in South Zanesville
| Characteristic | Without Mortgage | With Mortgage |
| Housing Units | 380 | 290 |
| Median Property Value | $39,300 | $104,700 |
| Median Household Income | $36,842 | $0 |
| Monthly Housing Costs | $457 | $6 |
| Real Estate Taxes | $358 | $7 |
Property Value by Mortgage Status in South Zanesville
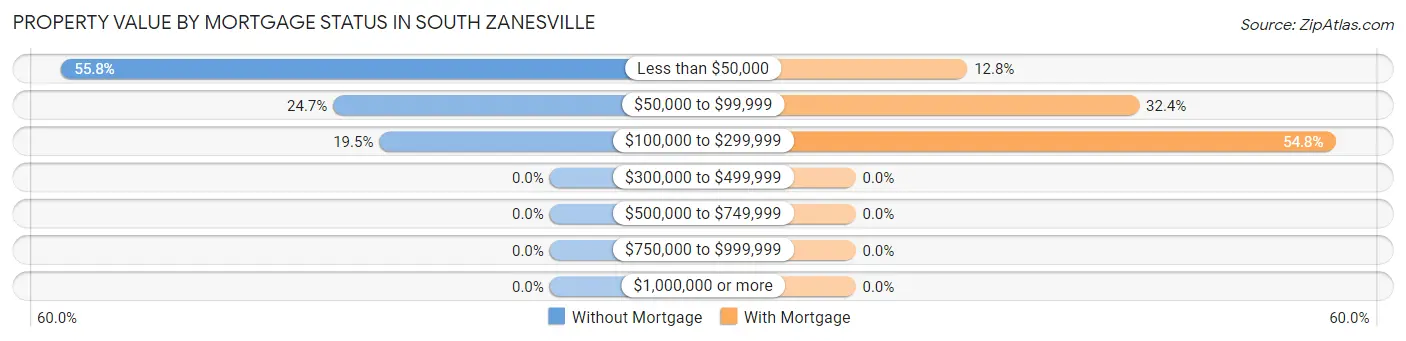
| Property Value | Without Mortgage | With Mortgage |
| Less than $50,000 | 212 (55.8%) | 37 (12.8%) |
| $50,000 to $99,999 | 94 (24.7%) | 94 (32.4%) |
| $100,000 to $299,999 | 74 (19.5%) | 159 (54.8%) |
| $300,000 to $499,999 | 0 (0.0%) | 0 (0.0%) |
| $500,000 to $749,999 | 0 (0.0%) | 0 (0.0%) |
| $750,000 to $999,999 | 0 (0.0%) | 0 (0.0%) |
| $1,000,000 or more | 0 (0.0%) | 0 (0.0%) |
| Total | 380 (100.0%) | 290 (100.0%) |
Household Income by Mortgage Status in South Zanesville
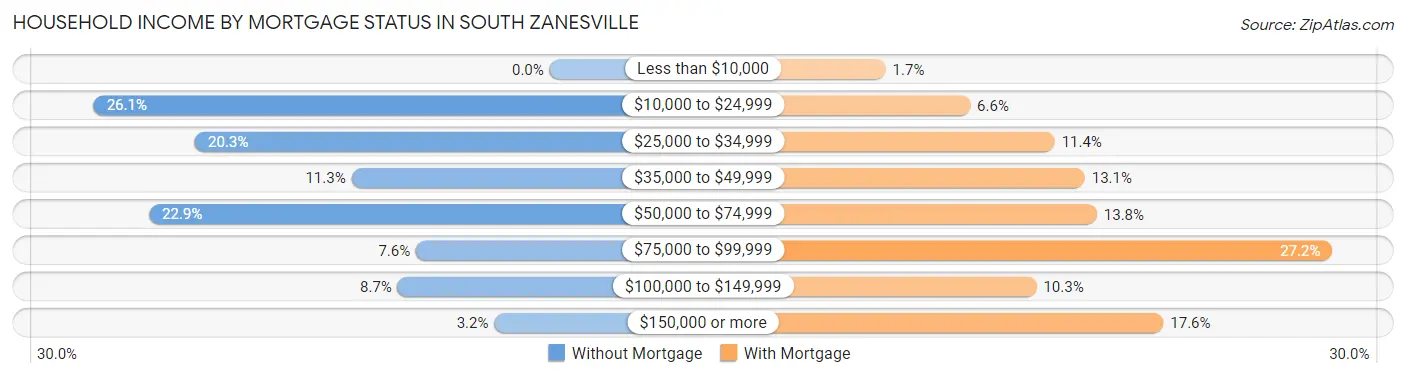
| Household Income | Without Mortgage | With Mortgage |
| Less than $10,000 | 0 (0.0%) | 5 (1.7%) |
| $10,000 to $24,999 | 99 (26.1%) | 19 (6.6%) |
| $25,000 to $34,999 | 77 (20.3%) | 33 (11.4%) |
| $35,000 to $49,999 | 43 (11.3%) | 38 (13.1%) |
| $50,000 to $74,999 | 87 (22.9%) | 40 (13.8%) |
| $75,000 to $99,999 | 29 (7.6%) | 79 (27.2%) |
| $100,000 to $149,999 | 33 (8.7%) | 30 (10.3%) |
| $150,000 or more | 12 (3.2%) | 51 (17.6%) |
| Total | 380 (100.0%) | 290 (100.0%) |
Property Value to Household Income Ratio in South Zanesville
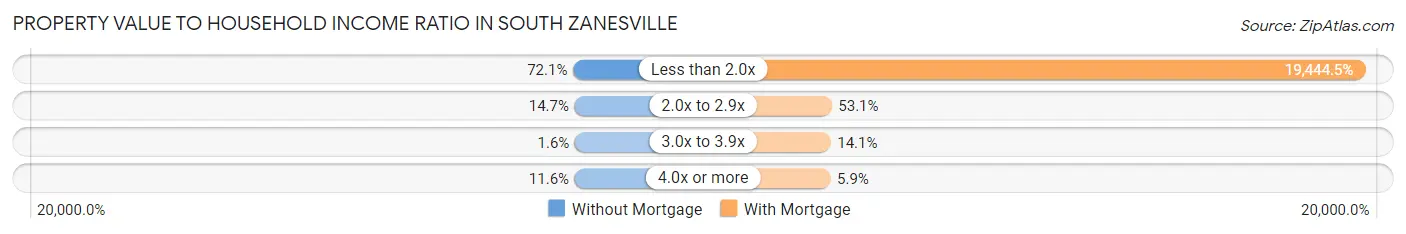
| Value-to-Income Ratio | Without Mortgage | With Mortgage |
| Less than 2.0x | 274 (72.1%) | 56,389 (19,444.5%) |
| 2.0x to 2.9x | 56 (14.7%) | 154 (53.1%) |
| 3.0x to 3.9x | 6 (1.6%) | 41 (14.1%) |
| 4.0x or more | 44 (11.6%) | 17 (5.9%) |
| Total | 380 (100.0%) | 290 (100.0%) |
Real Estate Taxes by Mortgage Status in South Zanesville
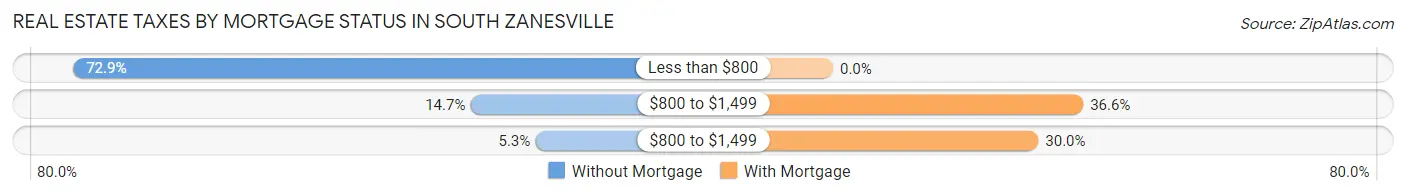
| Property Taxes | Without Mortgage | With Mortgage |
| Less than $800 | 277 (72.9%) | 0 (0.0%) |
| $800 to $1,499 | 56 (14.7%) | 106 (36.5%) |
| $800 to $1,499 | 20 (5.3%) | 87 (30.0%) |
| Total | 380 (100.0%) | 290 (100.0%) |
Health & Disability in South Zanesville
Health Insurance Coverage by Age in South Zanesville
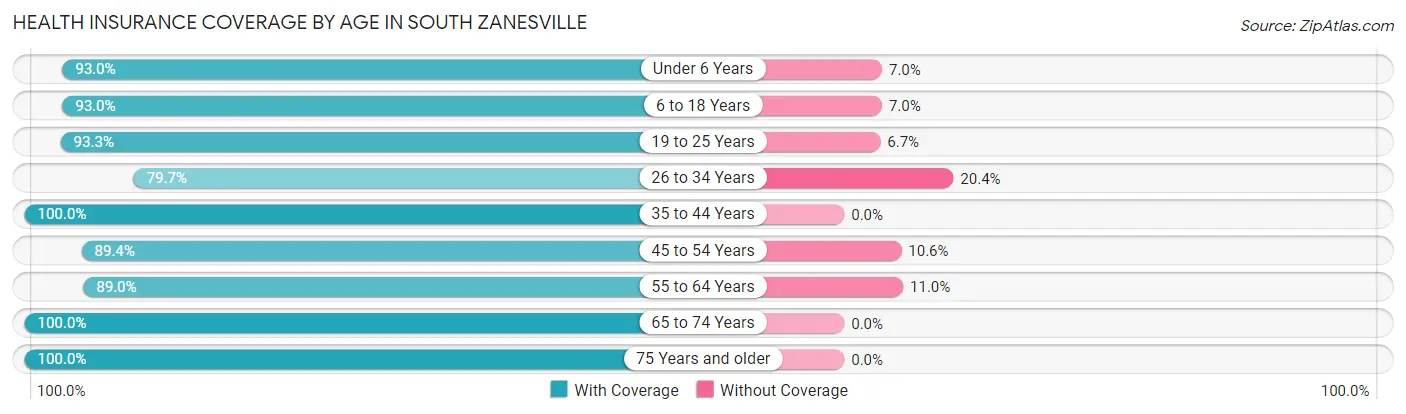
| Age Bracket | With Coverage | Without Coverage |
| Under 6 Years | 132 (93.0%) | 10 (7.0%) |
| 6 to 18 Years | 291 (93.0%) | 22 (7.0%) |
| 19 to 25 Years | 97 (93.3%) | 7 (6.7%) |
| 26 to 34 Years | 137 (79.6%) | 35 (20.3%) |
| 35 to 44 Years | 236 (100.0%) | 0 (0.0%) |
| 45 to 54 Years | 210 (89.4%) | 25 (10.6%) |
| 55 to 64 Years | 211 (89.0%) | 26 (11.0%) |
| 65 to 74 Years | 224 (100.0%) | 0 (0.0%) |
| 75 Years and older | 213 (100.0%) | 0 (0.0%) |
| Total | 1,751 (93.3%) | 125 (6.7%) |
Health Insurance Coverage by Citizenship Status in South Zanesville
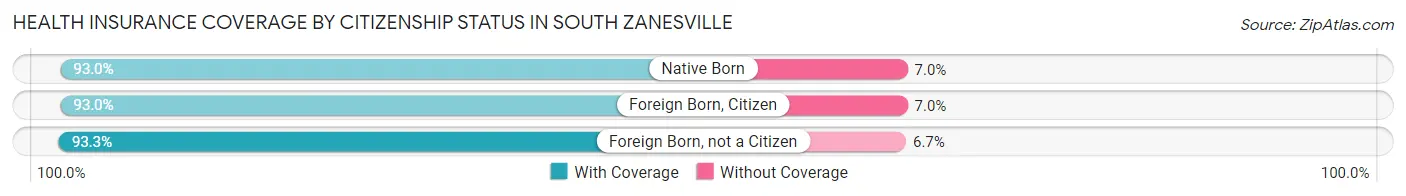
| Citizenship Status | With Coverage | Without Coverage |
| Native Born | 132 (93.0%) | 10 (7.0%) |
| Foreign Born, Citizen | 291 (93.0%) | 22 (7.0%) |
| Foreign Born, not a Citizen | 97 (93.3%) | 7 (6.7%) |
Health Insurance Coverage by Household Income in South Zanesville
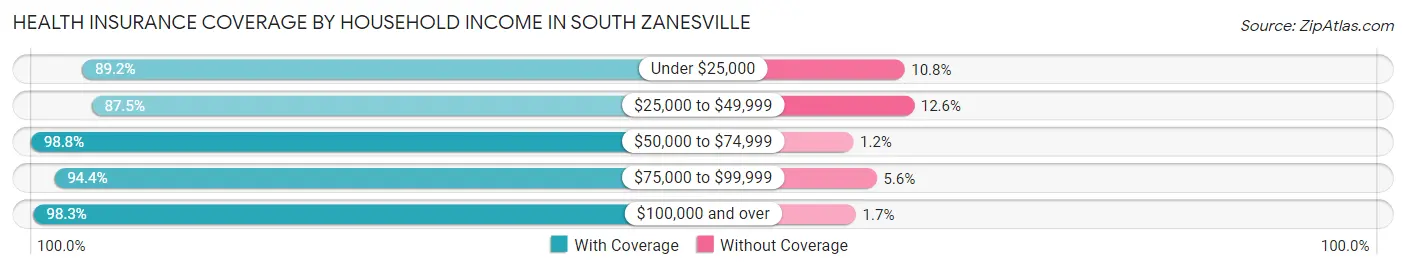
| Household Income | With Coverage | Without Coverage |
| Under $25,000 | 364 (89.2%) | 44 (10.8%) |
| $25,000 to $49,999 | 418 (87.5%) | 60 (12.6%) |
| $50,000 to $74,999 | 503 (98.8%) | 6 (1.2%) |
| $75,000 to $99,999 | 170 (94.4%) | 10 (5.6%) |
| $100,000 and over | 296 (98.3%) | 5 (1.7%) |
Public vs Private Health Insurance Coverage by Age in South Zanesville
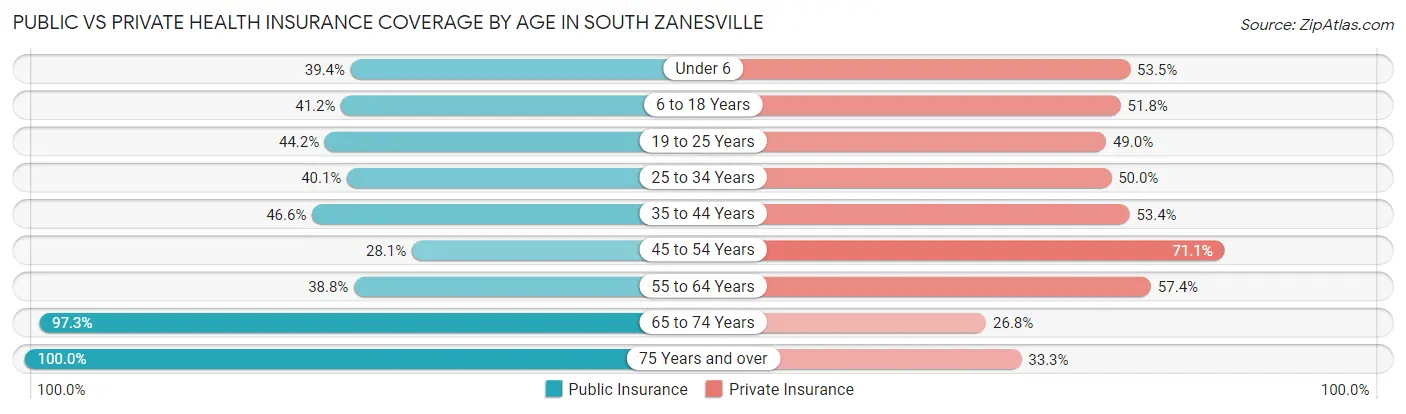
| Age Bracket | Public Insurance | Private Insurance |
| Under 6 | 56 (39.4%) | 76 (53.5%) |
| 6 to 18 Years | 129 (41.2%) | 162 (51.8%) |
| 19 to 25 Years | 46 (44.2%) | 51 (49.0%) |
| 25 to 34 Years | 69 (40.1%) | 86 (50.0%) |
| 35 to 44 Years | 110 (46.6%) | 126 (53.4%) |
| 45 to 54 Years | 66 (28.1%) | 167 (71.1%) |
| 55 to 64 Years | 92 (38.8%) | 136 (57.4%) |
| 65 to 74 Years | 218 (97.3%) | 60 (26.8%) |
| 75 Years and over | 213 (100.0%) | 71 (33.3%) |
| Total | 999 (53.2%) | 935 (49.8%) |
Disability Status by Sex by Age in South Zanesville
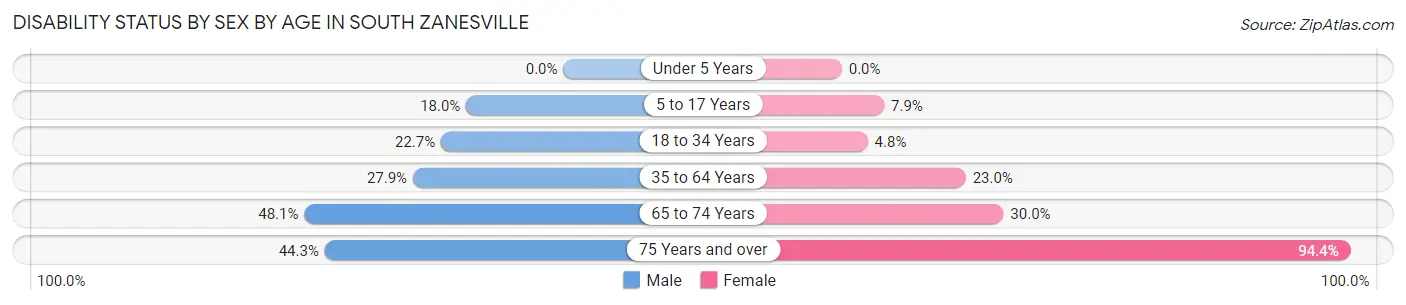
| Age Bracket | Male | Female |
| Under 5 Years | 0 (0.0%) | 0 (0.0%) |
| 5 to 17 Years | 22 (18.0%) | 15 (7.9%) |
| 18 to 34 Years | 37 (22.7%) | 6 (4.8%) |
| 35 to 64 Years | 86 (27.9%) | 92 (23.0%) |
| 65 to 74 Years | 50 (48.1%) | 36 (30.0%) |
| 75 Years and over | 31 (44.3%) | 135 (94.4%) |
Disability Class by Sex by Age in South Zanesville
Disability Class: Hearing Difficulty
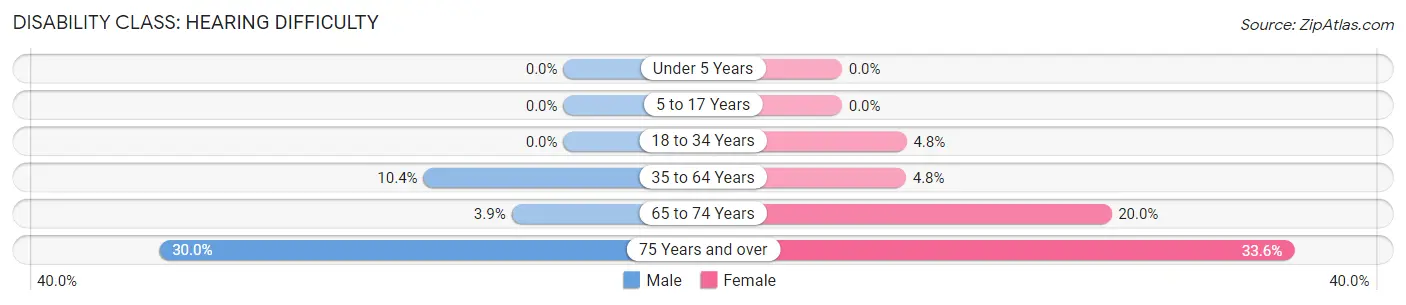
| Age Bracket | Male | Female |
| Under 5 Years | 0 (0.0%) | 0 (0.0%) |
| 5 to 17 Years | 0 (0.0%) | 0 (0.0%) |
| 18 to 34 Years | 0 (0.0%) | 6 (4.8%) |
| 35 to 64 Years | 32 (10.4%) | 19 (4.8%) |
| 65 to 74 Years | 4 (3.8%) | 24 (20.0%) |
| 75 Years and over | 21 (30.0%) | 48 (33.6%) |
Disability Class: Vision Difficulty
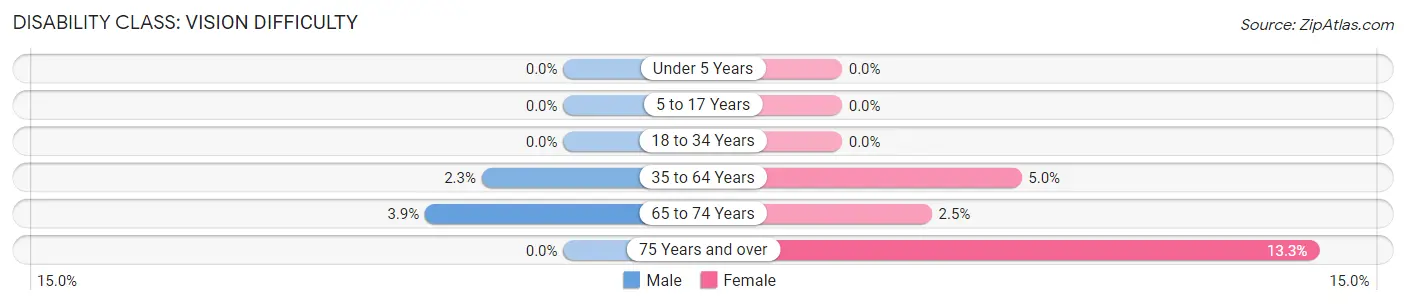
| Age Bracket | Male | Female |
| Under 5 Years | 0 (0.0%) | 0 (0.0%) |
| 5 to 17 Years | 0 (0.0%) | 0 (0.0%) |
| 18 to 34 Years | 0 (0.0%) | 0 (0.0%) |
| 35 to 64 Years | 7 (2.3%) | 20 (5.0%) |
| 65 to 74 Years | 4 (3.8%) | 3 (2.5%) |
| 75 Years and over | 0 (0.0%) | 19 (13.3%) |
Disability Class: Cognitive Difficulty
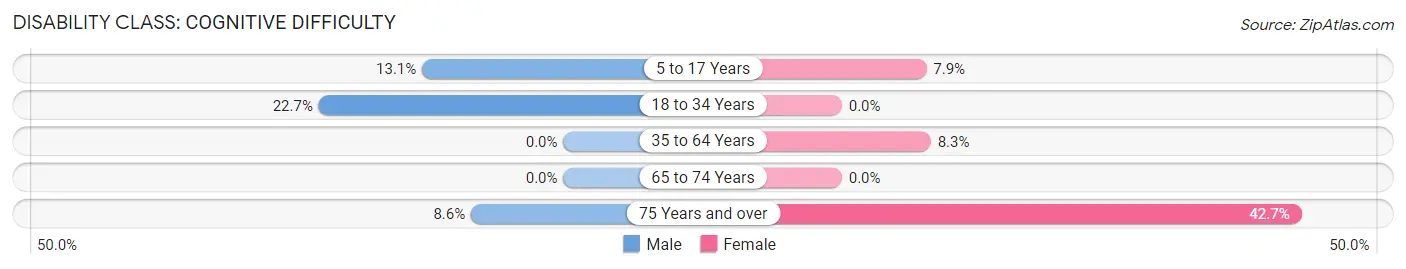
| Age Bracket | Male | Female |
| 5 to 17 Years | 16 (13.1%) | 15 (7.9%) |
| 18 to 34 Years | 37 (22.7%) | 0 (0.0%) |
| 35 to 64 Years | 0 (0.0%) | 33 (8.3%) |
| 65 to 74 Years | 0 (0.0%) | 0 (0.0%) |
| 75 Years and over | 6 (8.6%) | 61 (42.7%) |
Disability Class: Ambulatory Difficulty
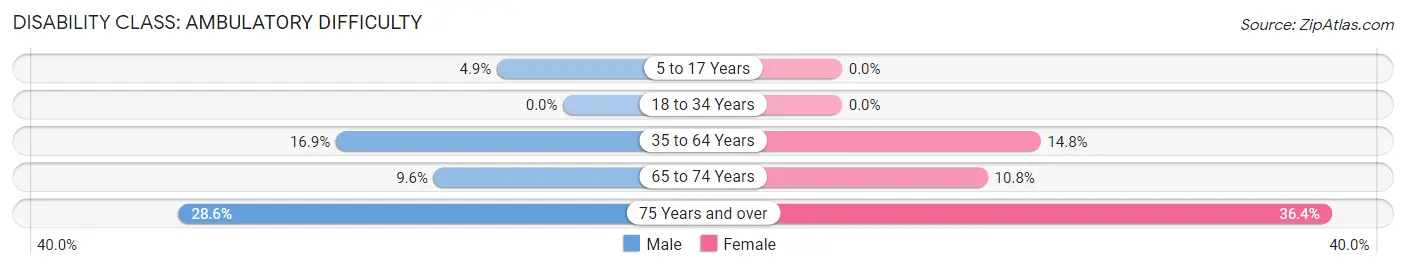
| Age Bracket | Male | Female |
| 5 to 17 Years | 6 (4.9%) | 0 (0.0%) |
| 18 to 34 Years | 0 (0.0%) | 0 (0.0%) |
| 35 to 64 Years | 52 (16.9%) | 59 (14.7%) |
| 65 to 74 Years | 10 (9.6%) | 13 (10.8%) |
| 75 Years and over | 20 (28.6%) | 52 (36.4%) |
Disability Class: Self-Care Difficulty
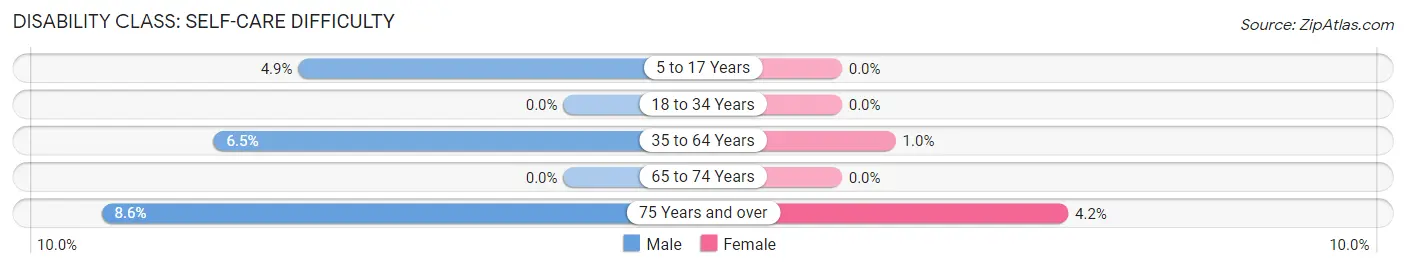
| Age Bracket | Male | Female |
| 5 to 17 Years | 6 (4.9%) | 0 (0.0%) |
| 18 to 34 Years | 0 (0.0%) | 0 (0.0%) |
| 35 to 64 Years | 20 (6.5%) | 4 (1.0%) |
| 65 to 74 Years | 0 (0.0%) | 0 (0.0%) |
| 75 Years and over | 6 (8.6%) | 6 (4.2%) |
Technology Access in South Zanesville
Computing Device Access in South Zanesville
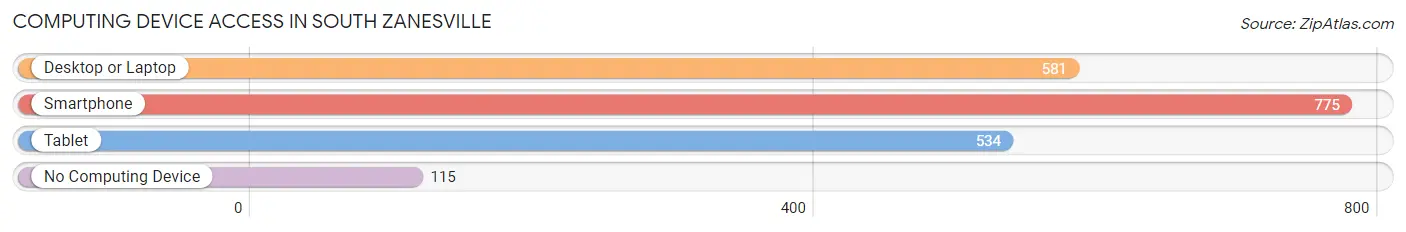
| Device Type | # Households | % Households |
| Desktop or Laptop | 581 | 60.1% |
| Smartphone | 775 | 80.2% |
| Tablet | 534 | 55.3% |
| No Computing Device | 115 | 11.9% |
| Total | 966 | 100.0% |
Internet Access in South Zanesville
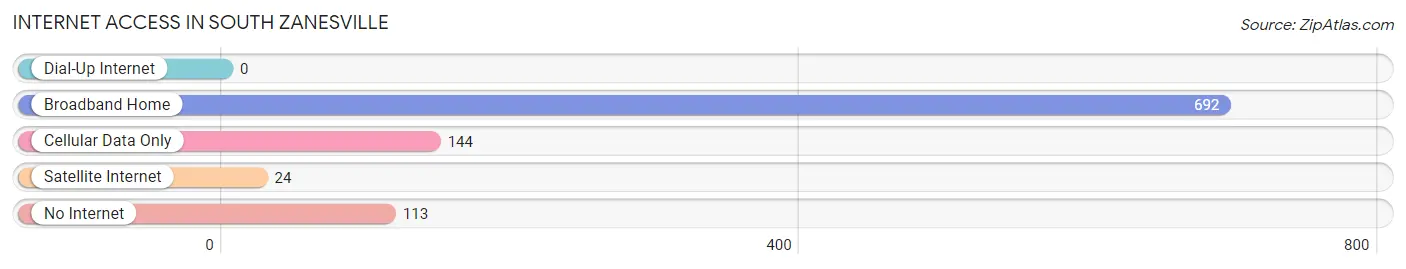
| Internet Type | # Households | % Households |
| Dial-Up Internet | 0 | 0.0% |
| Broadband Home | 692 | 71.6% |
| Cellular Data Only | 144 | 14.9% |
| Satellite Internet | 24 | 2.5% |
| No Internet | 113 | 11.7% |
| Total | 966 | 100.0% |
South Zanesville Summary
Zanesville, Ohio is a city located in Muskingum County, Ohio, United States. It is the county seat of Muskingum County and is located along the Muskingum River. The city is located in the southeastern part of the state, approximately 50 miles east of Columbus. The population of Zanesville was 25,586 at the 2010 census, making it the largest city in Muskingum County.
History
The area that is now Zanesville was first settled in 1797 by Ebenezer Zane, who had been granted a large tract of land by the United States government in exchange for his services as a Revolutionary War soldier. Zane named the settlement after himself and it quickly grew into a thriving community. In 1803, Zanesville was incorporated as a village and in 1835 it was incorporated as a city.
During the 19th century, Zanesville was an important center for manufacturing and transportation. The city was home to several factories, including the Zanesville Pottery Company, which produced a variety of pottery and china. The city was also home to several railroads, including the Baltimore and Ohio Railroad, which connected Zanesville to the rest of the country.
In the early 20th century, Zanesville was a major center for the production of glass. The city was home to several glass factories, including the Fostoria Glass Company, which produced a variety of glassware. The city was also home to several brickyards, which produced bricks for the construction of buildings throughout the region.
Geography
Zanesville is located in southeastern Ohio, approximately 50 miles east of Columbus. The city is situated along the Muskingum River, which flows through the city and is a major source of recreation for the area. The city is located in a hilly region of the state, with the highest point in the city being the Zanesville Country Club, which is located at an elevation of 1,068 feet.
The city has a total area of 11.3 square miles, of which 11.2 square miles is land and 0.1 square miles is water. The city is located in the Appalachian Plateau region of the state, which is characterized by rolling hills and valleys.
Economy
Zanesville’s economy is largely based on manufacturing and healthcare. The city is home to several manufacturing companies, including the Zanesville Pottery Company, the Fostoria Glass Company, and several brickyards. The city is also home to several healthcare facilities, including Genesis HealthCare System, which is the largest employer in the city.
The city is also home to several retail stores, including the Zanesville Mall, which is the largest shopping center in the city. The city is also home to several restaurants, bars, and other entertainment venues.
Demographics
As of the 2010 census, the population of Zanesville was 25,586. The racial makeup of the city was 90.2% White, 6.2% African American, 0.3% Native American, 0.7% Asian, 0.1% Pacific Islander, 0.7% from other races, and 1.9% from two or more races. Hispanic or Latino of any race were 2.2% of the population.
The median income for a household in the city was $30,945, and the median income for a family was $38,945. The per capita income for the city was $17,845. About 17.2% of families and 20.3% of the population were below the poverty line, including 28.2% of those under age 18 and 11.2% of those age 65 or over.
Common Questions
What is Per Capita Income in South Zanesville?
Per Capita income in South Zanesville is $26,751.
What is the Median Family Income in South Zanesville?
Median Family Income in South Zanesville is $51,324.
What is the Median Household income in South Zanesville?
Median Household Income in South Zanesville is $38,170.
What is Income or Wage Gap in South Zanesville?
Income or Wage Gap in South Zanesville is 5.7%.
Women in South Zanesville earn 94.3 cents for every dollar earned by a man.
What is Inequality or Gini Index in South Zanesville?
Inequality or Gini Index in South Zanesville is 0.43.
What is the Total Population of South Zanesville?
Total Population of South Zanesville is 1,876.
What is the Total Male Population of South Zanesville?
Total Male Population of South Zanesville is 820.
What is the Total Female Population of South Zanesville?
Total Female Population of South Zanesville is 1,056.
What is the Ratio of Males per 100 Females in South Zanesville?
There are 77.65 Males per 100 Females in South Zanesville.
What is the Ratio of Females per 100 Males in South Zanesville?
There are 128.78 Females per 100 Males in South Zanesville.
What is the Median Population Age in South Zanesville?
Median Population Age in South Zanesville is 43.3 Years.
What is the Average Family Size in South Zanesville
Average Family Size in South Zanesville is 2.7 People.
What is the Average Household Size in South Zanesville
Average Household Size in South Zanesville is 1.9 People.
How Large is the Labor Force in South Zanesville?
There are 800 People in the Labor Forcein in South Zanesville.
What is the Percentage of People in the Labor Force in South Zanesville?
54.3% of People are in the Labor Force in South Zanesville.
What is the Unemployment Rate in South Zanesville?
Unemployment Rate in South Zanesville is 3.3%.