Shortsville, NY Map & Demographics
Shortsville Map
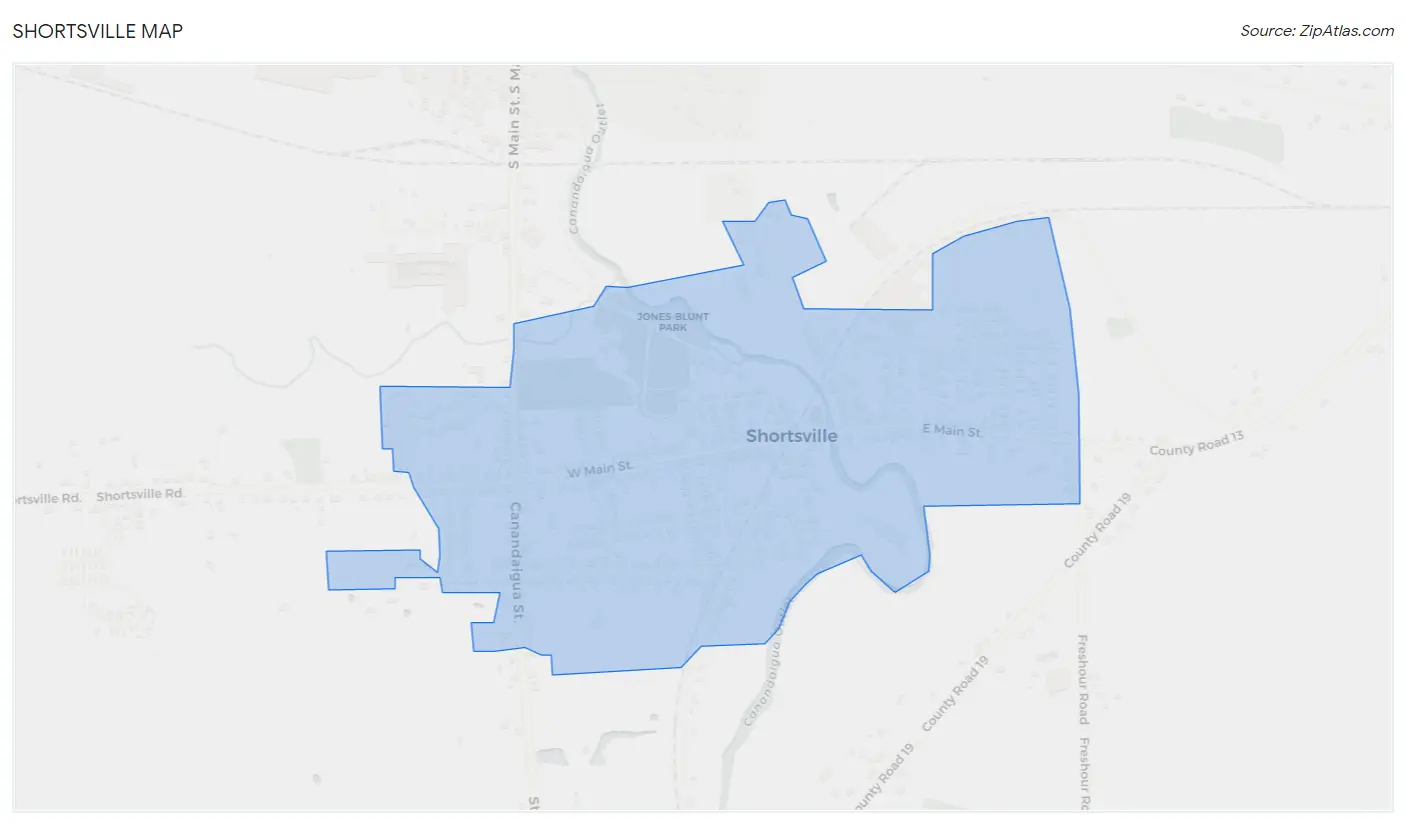
Shortsville Overview
$41,598
PER CAPITA INCOME
$90,096
AVG FAMILY INCOME
$77,639
AVG HOUSEHOLD INCOME
6.6%
WAGE / INCOME GAP [ % ]
93.4¢/ $1
WAGE / INCOME GAP [ $ ]
0.41
INEQUALITY / GINI INDEX
1,745
TOTAL POPULATION
991
MALE POPULATION
754
FEMALE POPULATION
131.43
MALES / 100 FEMALES
76.08
FEMALES / 100 MALES
45.0
MEDIAN AGE
3.0
AVG FAMILY SIZE
2.5
AVG HOUSEHOLD SIZE
1,000
LABOR FORCE [ PEOPLE ]
71.5%
PERCENT IN LABOR FORCE
1.3%
UNEMPLOYMENT RATE
Shortsville Zip Codes
Shortsville Area Codes
Income in Shortsville
Income Overview in Shortsville
Per Capita Income in Shortsville is $41,598, while median incomes of families and households are $90,096 and $77,639 respectively.
| Characteristic | Number | Measure |
| Per Capita Income | 1,745 | $41,598 |
| Median Family Income | 487 | $90,096 |
| Mean Family Income | 487 | $116,031 |
| Median Household Income | 688 | $77,639 |
| Mean Household Income | 688 | $101,680 |
| Income Deficit | 487 | $0 |
| Wage / Income Gap (%) | 1,745 | 6.62% |
| Wage / Income Gap ($) | 1,745 | 93.38¢ per $1 |
| Gini / Inequality Index | 1,745 | 0.41 |
Earnings by Sex in Shortsville
Average Earnings in Shortsville are $41,968, $43,691 for men and $40,797 for women, a difference of 6.6%.
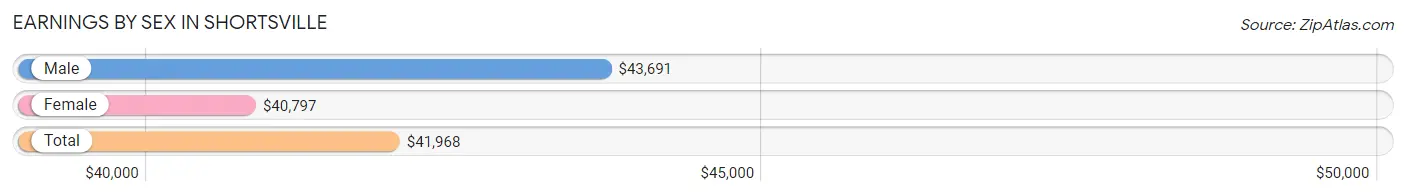
| Sex | Number | Average Earnings |
| Male | 587 (55.6%) | $43,691 |
| Female | 468 (44.4%) | $40,797 |
| Total | 1,055 (100.0%) | $41,968 |
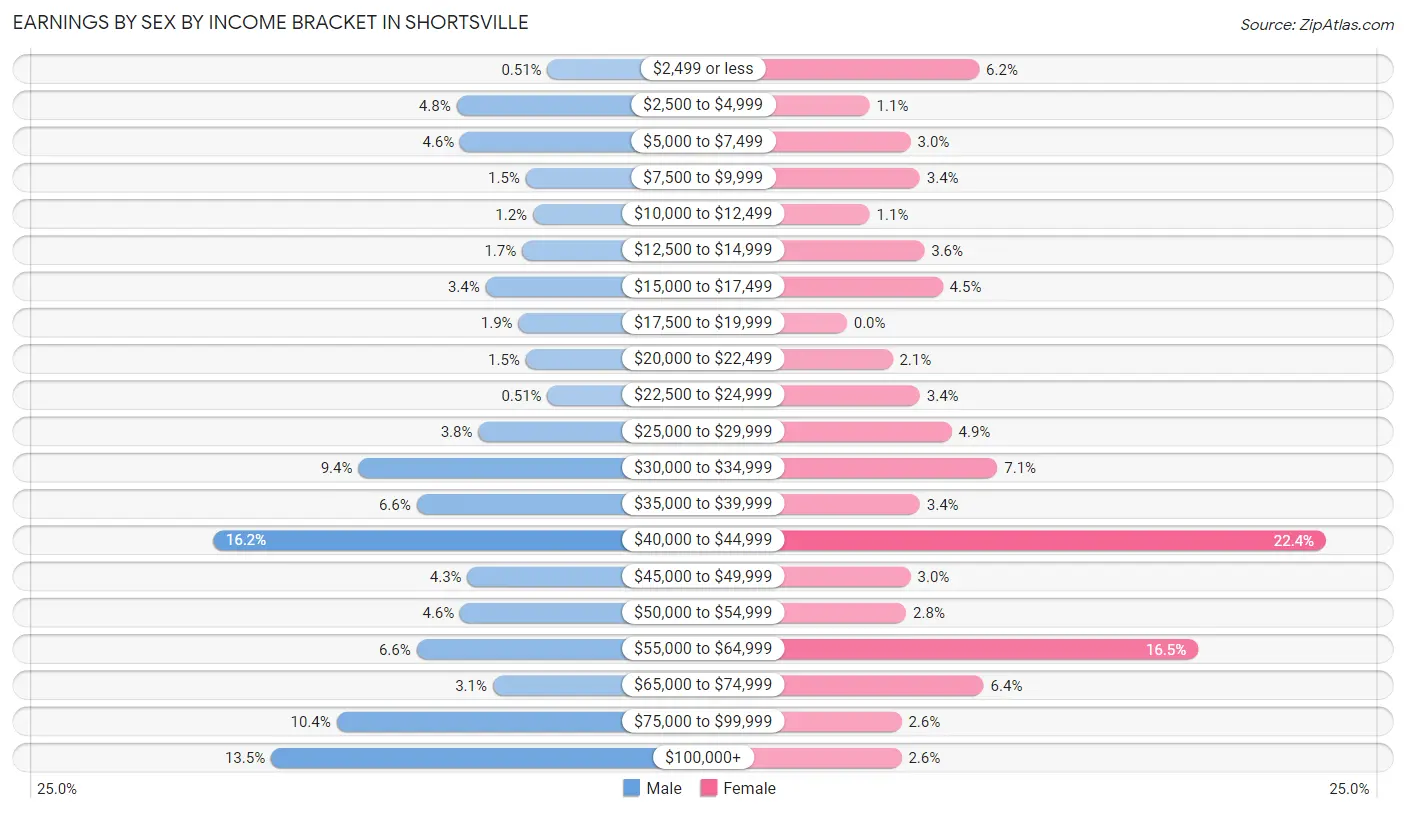
Earnings by Sex by Income Bracket in Shortsville
The most common earnings brackets in Shortsville are $40,000 to $44,999 for men (95 | 16.2%) and $40,000 to $44,999 for women (105 | 22.4%).
| Income | Male | Female |
| $2,499 or less | 3 (0.5%) | 29 (6.2%) |
| $2,500 to $4,999 | 28 (4.8%) | 5 (1.1%) |
| $5,000 to $7,499 | 27 (4.6%) | 14 (3.0%) |
| $7,500 to $9,999 | 9 (1.5%) | 16 (3.4%) |
| $10,000 to $12,499 | 7 (1.2%) | 5 (1.1%) |
| $12,500 to $14,999 | 10 (1.7%) | 17 (3.6%) |
| $15,000 to $17,499 | 20 (3.4%) | 21 (4.5%) |
| $17,500 to $19,999 | 11 (1.9%) | 0 (0.0%) |
| $20,000 to $22,499 | 9 (1.5%) | 10 (2.1%) |
| $22,500 to $24,999 | 3 (0.5%) | 16 (3.4%) |
| $25,000 to $29,999 | 22 (3.7%) | 23 (4.9%) |
| $30,000 to $34,999 | 55 (9.4%) | 33 (7.0%) |
| $35,000 to $39,999 | 39 (6.6%) | 16 (3.4%) |
| $40,000 to $44,999 | 95 (16.2%) | 105 (22.4%) |
| $45,000 to $49,999 | 25 (4.3%) | 14 (3.0%) |
| $50,000 to $54,999 | 27 (4.6%) | 13 (2.8%) |
| $55,000 to $64,999 | 39 (6.6%) | 77 (16.5%) |
| $65,000 to $74,999 | 18 (3.1%) | 30 (6.4%) |
| $75,000 to $99,999 | 61 (10.4%) | 12 (2.6%) |
| $100,000+ | 79 (13.5%) | 12 (2.6%) |
| Total | 587 (100.0%) | 468 (100.0%) |
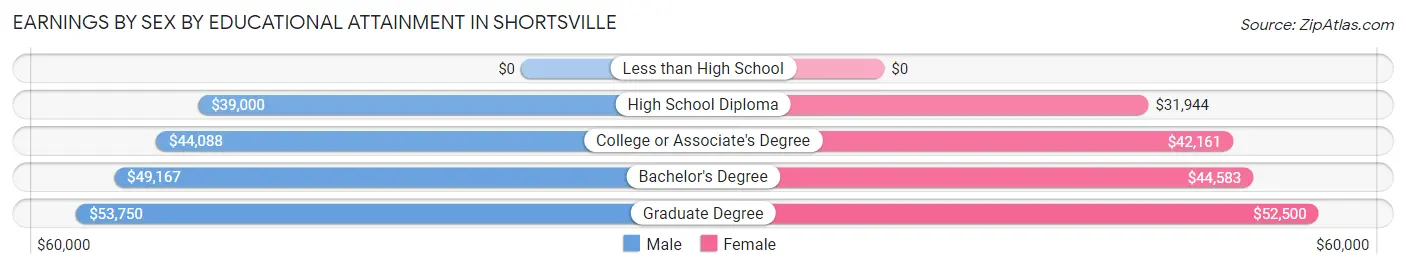
Earnings by Sex by Educational Attainment in Shortsville
Average earnings in Shortsville are $44,235 for men and $41,401 for women, a difference of 6.4%. Men with an educational attainment of graduate degree enjoy the highest average annual earnings of $53,750, while those with high school diploma education earn the least with $39,000. Women with an educational attainment of graduate degree earn the most with the average annual earnings of $52,500, while those with high school diploma education have the smallest earnings of $31,944.
| Educational Attainment | Male Income | Female Income |
| Less than High School | - | - |
| High School Diploma | $39,000 | $31,944 |
| College or Associate's Degree | $44,088 | $42,161 |
| Bachelor's Degree | $49,167 | $44,583 |
| Graduate Degree | $53,750 | $52,500 |
| Total | $44,235 | $41,401 |
Family Income in Shortsville
Family Income Brackets in Shortsville
According to the Shortsville family income data, there are 140 families falling into the $100,000 to $149,999 income range, which is the most common income bracket and makes up 28.7% of all families. Conversely, the $10,000 to $14,999 income bracket is the least frequent group with only 4 families (0.8%) belonging to this category.
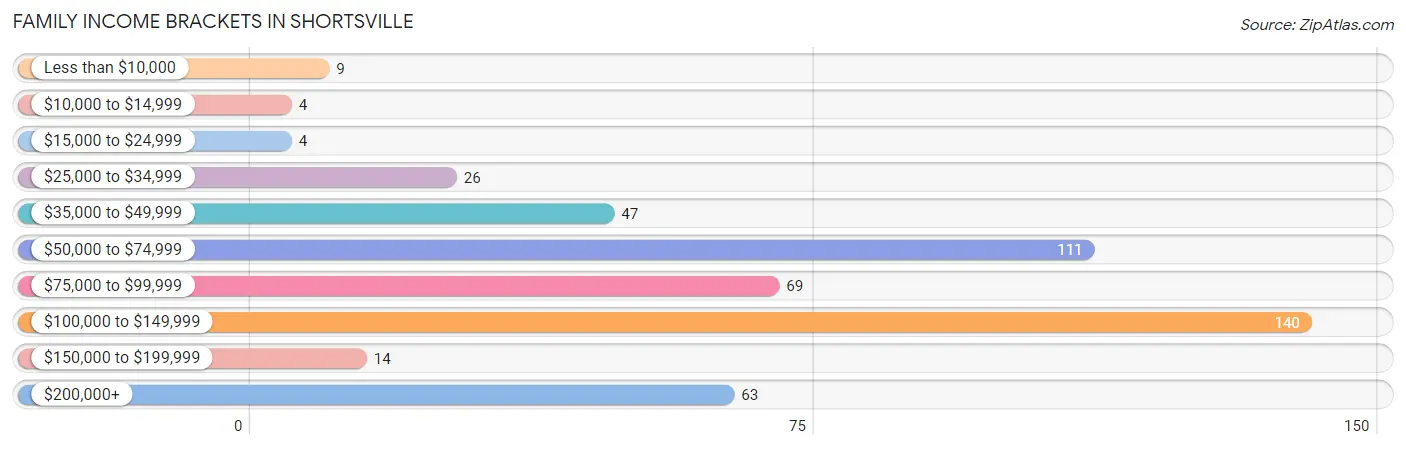
| Income Bracket | # Families | % Families |
| Less than $10,000 | 9 | 1.8% |
| $10,000 to $14,999 | 4 | 0.8% |
| $15,000 to $24,999 | 4 | 0.8% |
| $25,000 to $34,999 | 26 | 5.3% |
| $35,000 to $49,999 | 47 | 9.7% |
| $50,000 to $74,999 | 111 | 22.8% |
| $75,000 to $99,999 | 69 | 14.2% |
| $100,000 to $149,999 | 140 | 28.7% |
| $150,000 to $199,999 | 14 | 2.9% |
| $200,000+ | 63 | 12.9% |
Family Income by Famaliy Size in Shortsville
5-person families (76 | 15.6%) account for the highest median family income in Shortsville with $105,592 per family, while 2-person families (298 | 61.2%) have the highest median income of $43,125 per family member.
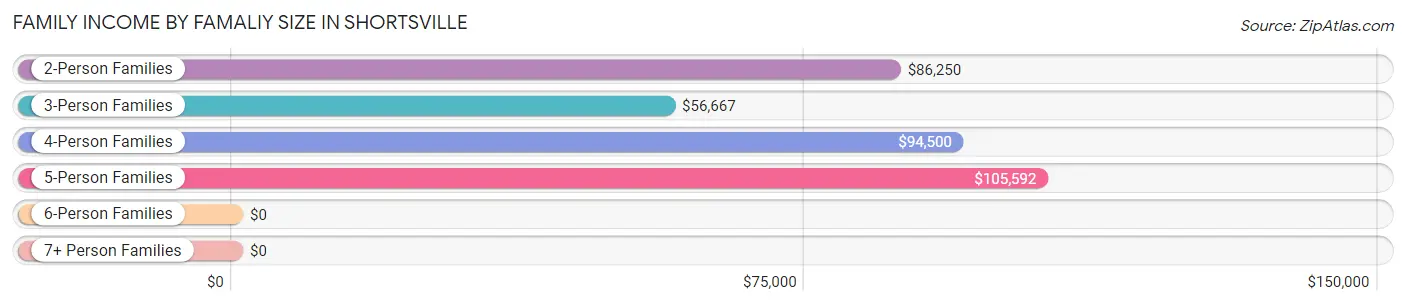
| Income Bracket | # Families | Median Income |
| 2-Person Families | 298 (61.2%) | $86,250 |
| 3-Person Families | 52 (10.7%) | $56,667 |
| 4-Person Families | 54 (11.1%) | $94,500 |
| 5-Person Families | 76 (15.6%) | $105,592 |
| 6-Person Families | 7 (1.4%) | $0 |
| 7+ Person Families | 0 (0.0%) | $0 |
| Total | 487 (100.0%) | $90,096 |
Family Income by Number of Earners in Shortsville
The median family income in Shortsville is $90,096, with families comprising 2 earners (257) having the highest median family income of $107,336, while families with 1 earner (115) have the lowest median family income of $55,139, accounting for 52.8% and 23.6% of families, respectively.
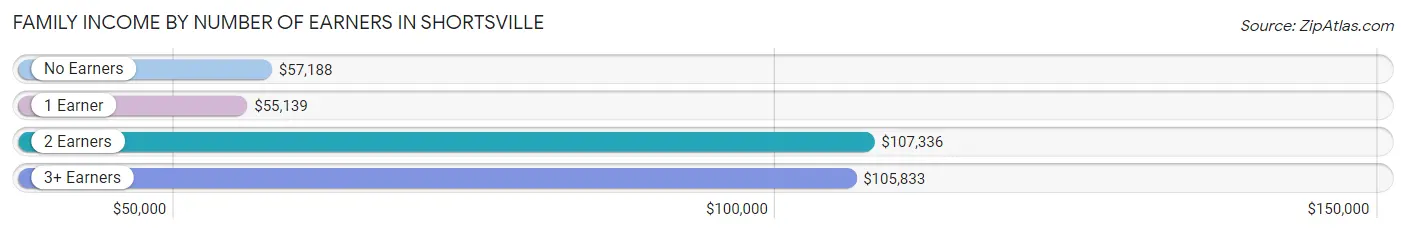
| Number of Earners | # Families | Median Income |
| No Earners | 71 (14.6%) | $57,188 |
| 1 Earner | 115 (23.6%) | $55,139 |
| 2 Earners | 257 (52.8%) | $107,336 |
| 3+ Earners | 44 (9.0%) | $105,833 |
| Total | 487 (100.0%) | $90,096 |
Household Income in Shortsville
Household Income Brackets in Shortsville
With 178 households falling in the category, the $50,000 to $74,999 income range is the most frequent in Shortsville, accounting for 25.9% of all households. In contrast, only 7 households (1.0%) fall into the $10,000 to $14,999 income bracket, making it the least populous group.
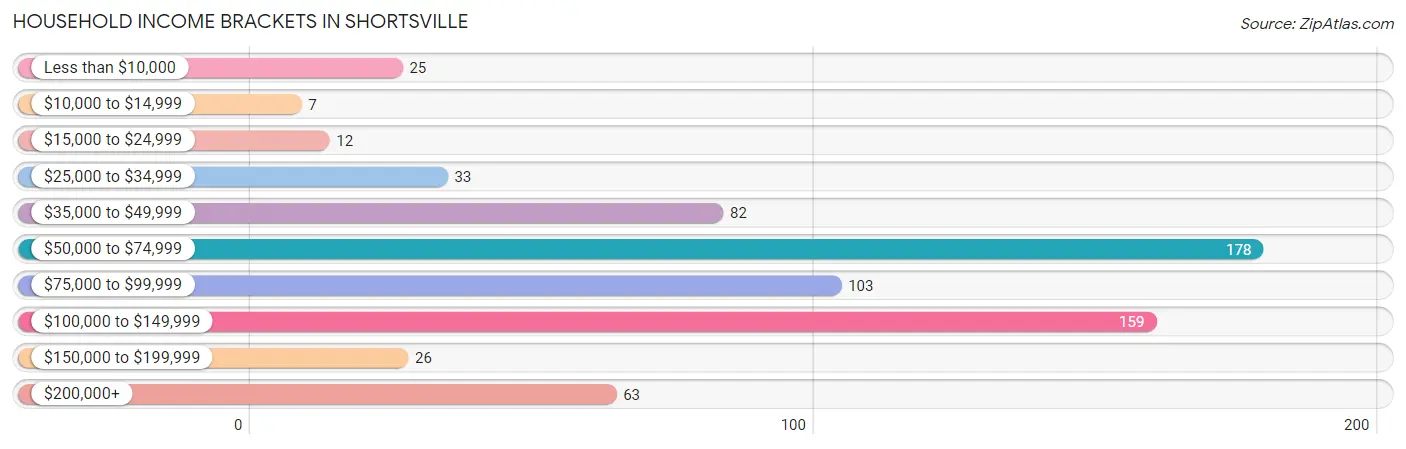
| Income Bracket | # Households | % Households |
| Less than $10,000 | 25 | 3.6% |
| $10,000 to $14,999 | 7 | 1.0% |
| $15,000 to $24,999 | 12 | 1.7% |
| $25,000 to $34,999 | 33 | 4.8% |
| $35,000 to $49,999 | 82 | 11.9% |
| $50,000 to $74,999 | 178 | 25.9% |
| $75,000 to $99,999 | 103 | 15.0% |
| $100,000 to $149,999 | 159 | 23.1% |
| $150,000 to $199,999 | 26 | 3.8% |
| $200,000+ | 63 | 9.2% |
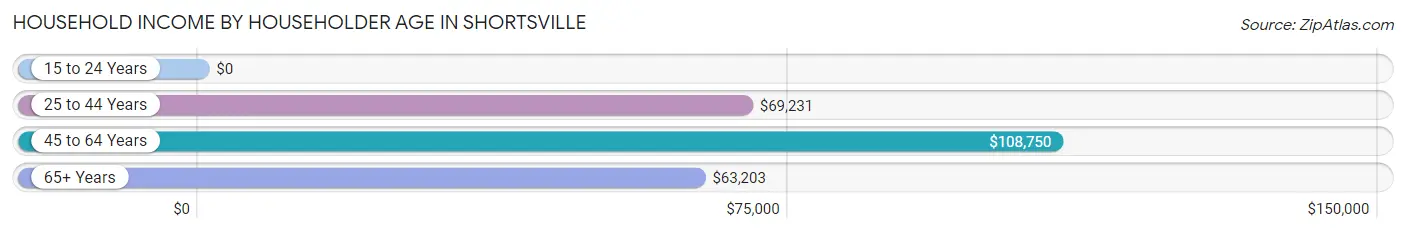
Household Income by Householder Age in Shortsville
The median household income in Shortsville is $77,639, with the highest median household income of $108,750 found in the 45 to 64 years age bracket for the primary householder. A total of 254 households (36.9%) fall into this category. Meanwhile, the 15 to 24 years age bracket for the primary householder has the lowest median household income of $0, with 5 households (0.7%) in this group.
| Income Bracket | # Households | Median Income |
| 15 to 24 Years | 5 (0.7%) | $0 |
| 25 to 44 Years | 246 (35.8%) | $69,231 |
| 45 to 64 Years | 254 (36.9%) | $108,750 |
| 65+ Years | 183 (26.6%) | $63,203 |
| Total | 688 (100.0%) | $77,639 |
Poverty in Shortsville
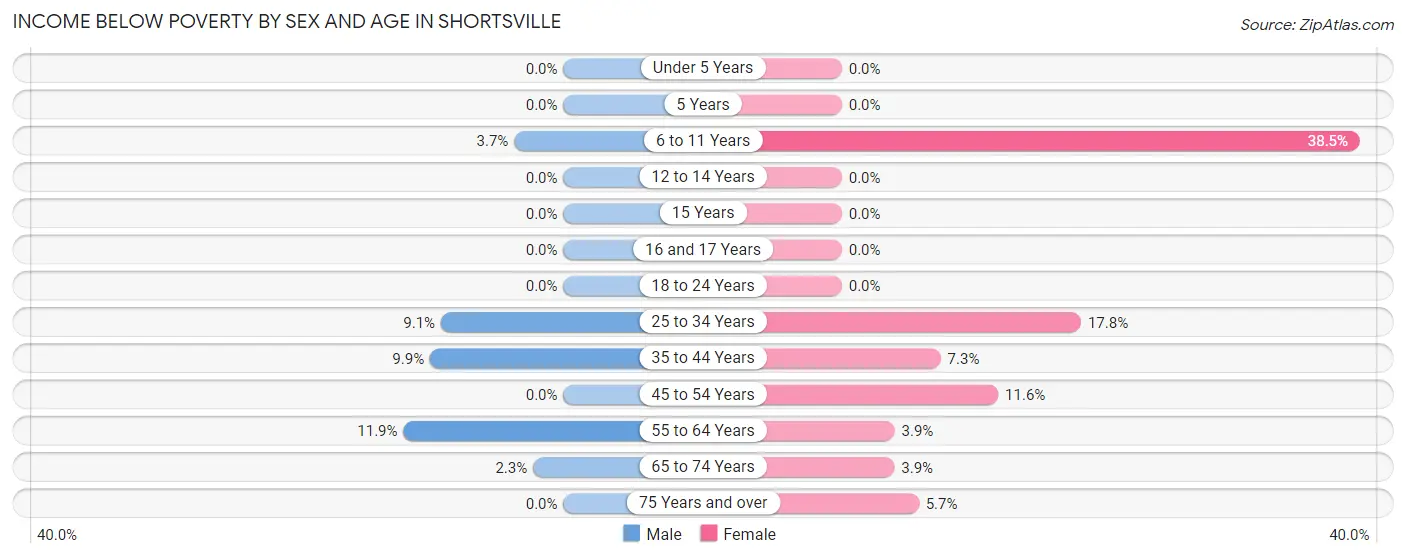
Income Below Poverty by Sex and Age in Shortsville
With 3.8% poverty level for males and 8.9% for females among the residents of Shortsville, 55 to 64 year old males and 6 to 11 year old females are the most vulnerable to poverty, with 12 males (11.9%) and 10 females (38.5%) in their respective age groups living below the poverty level.
| Age Bracket | Male | Female |
| Under 5 Years | 0 (0.0%) | 0 (0.0%) |
| 5 Years | 0 (0.0%) | 0 (0.0%) |
| 6 to 11 Years | 5 (3.6%) | 10 (38.5%) |
| 12 to 14 Years | 0 (0.0%) | 0 (0.0%) |
| 15 Years | 0 (0.0%) | 0 (0.0%) |
| 16 and 17 Years | 0 (0.0%) | 0 (0.0%) |
| 18 to 24 Years | 0 (0.0%) | 0 (0.0%) |
| 25 to 34 Years | 8 (9.1%) | 19 (17.8%) |
| 35 to 44 Years | 10 (9.9%) | 8 (7.3%) |
| 45 to 54 Years | 0 (0.0%) | 18 (11.6%) |
| 55 to 64 Years | 12 (11.9%) | 4 (3.9%) |
| 65 to 74 Years | 2 (2.2%) | 3 (3.9%) |
| 75 Years and over | 0 (0.0%) | 4 (5.7%) |
| Total | 37 (3.8%) | 66 (8.9%) |
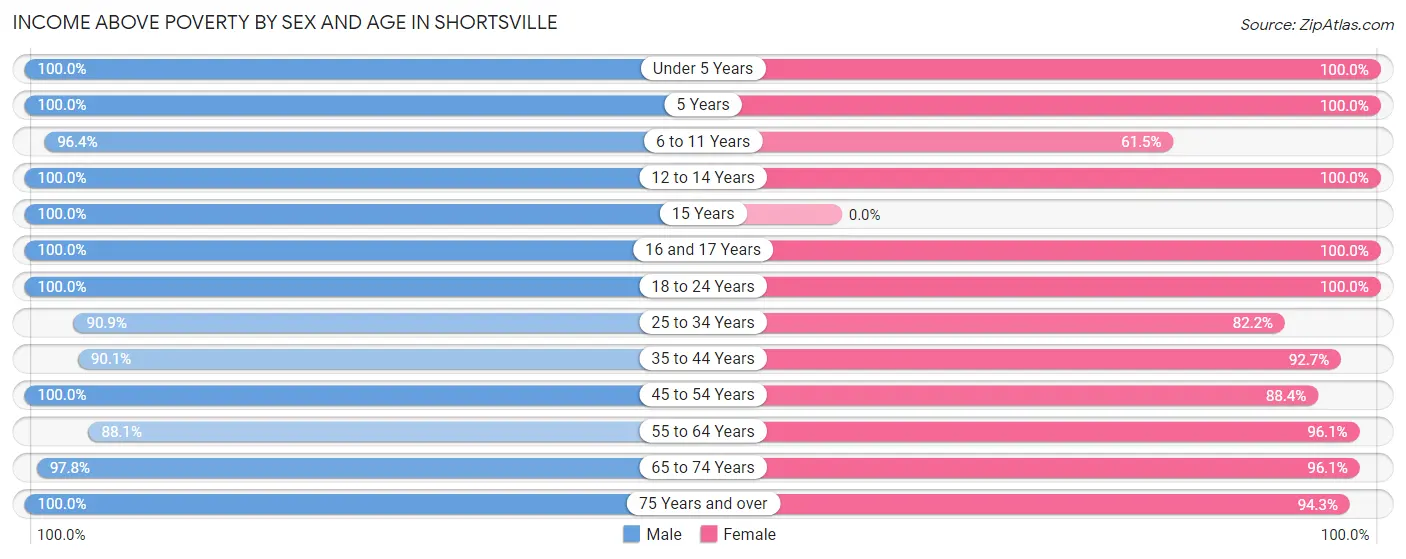
Income Above Poverty by Sex and Age in Shortsville
According to the poverty statistics in Shortsville, males aged under 5 years and females aged under 5 years are the age groups that are most secure financially, with 100.0% of males and 100.0% of females in these age groups living above the poverty line.
| Age Bracket | Male | Female |
| Under 5 Years | 52 (100.0%) | 20 (100.0%) |
| 5 Years | 3 (100.0%) | 12 (100.0%) |
| 6 to 11 Years | 132 (96.4%) | 16 (61.5%) |
| 12 to 14 Years | 55 (100.0%) | 11 (100.0%) |
| 15 Years | 11 (100.0%) | 0 (0.0%) |
| 16 and 17 Years | 11 (100.0%) | 19 (100.0%) |
| 18 to 24 Years | 52 (100.0%) | 37 (100.0%) |
| 25 to 34 Years | 80 (90.9%) | 88 (82.2%) |
| 35 to 44 Years | 91 (90.1%) | 101 (92.7%) |
| 45 to 54 Years | 212 (100.0%) | 137 (88.4%) |
| 55 to 64 Years | 89 (88.1%) | 98 (96.1%) |
| 65 to 74 Years | 87 (97.8%) | 74 (96.1%) |
| 75 Years and over | 68 (100.0%) | 66 (94.3%) |
| Total | 943 (96.2%) | 679 (91.1%) |
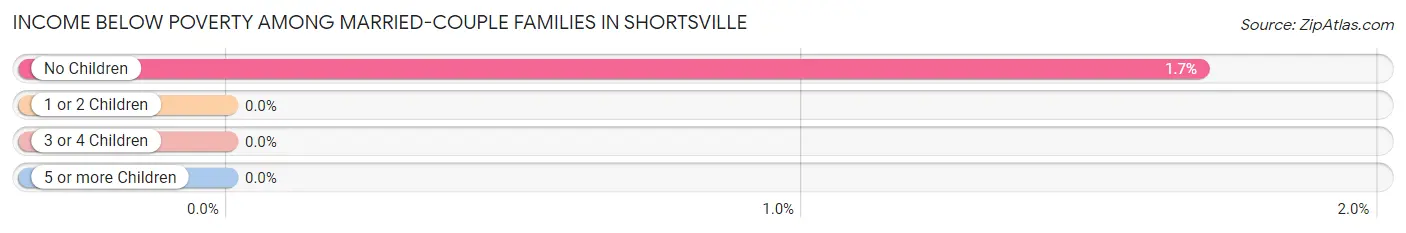
Income Below Poverty Among Married-Couple Families in Shortsville
The poverty statistics for married-couple families in Shortsville show that 1.1% or 4 of the total 378 families live below the poverty line. Families with no children have the highest poverty rate of 1.7%, comprising of 4 families. On the other hand, families with 1 or 2 children have the lowest poverty rate of 0.0%, which includes 0 families.
| Children | Above Poverty | Below Poverty |
| No Children | 233 (98.3%) | 4 (1.7%) |
| 1 or 2 Children | 86 (100.0%) | 0 (0.0%) |
| 3 or 4 Children | 55 (100.0%) | 0 (0.0%) |
| 5 or more Children | 0 (0.0%) | 0 (0.0%) |
| Total | 374 (98.9%) | 4 (1.1%) |
Income Below Poverty Among Single-Parent Households in Shortsville
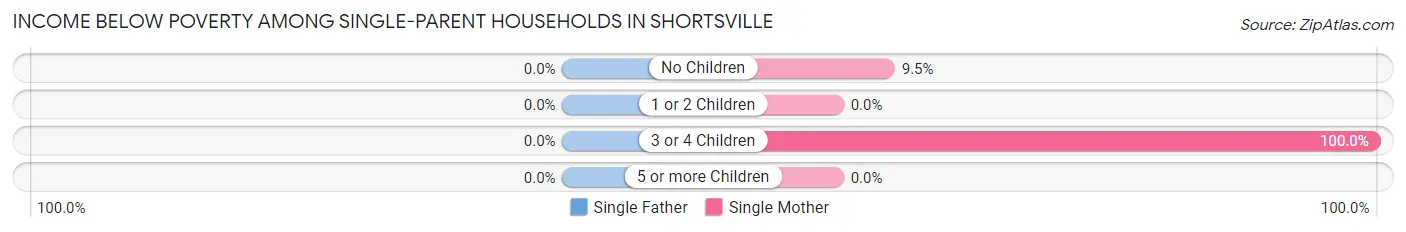
| Children | Single Father | Single Mother |
| No Children | 0 (0.0%) | 4 (9.5%) |
| 1 or 2 Children | 0 (0.0%) | 0 (0.0%) |
| 3 or 4 Children | 0 (0.0%) | 5 (100.0%) |
| 5 or more Children | 0 (0.0%) | 0 (0.0%) |
| Total | 0 (0.0%) | 9 (11.8%) |
Income Below Poverty Among Married-Couple vs Single-Parent Households in Shortsville
The poverty data for Shortsville shows that 4 of the married-couple family households (1.1%) and 9 of the single-parent households (8.3%) are living below the poverty level. Within the married-couple family households, those with no children have the highest poverty rate, with 4 households (1.7%) falling below the poverty line. Among the single-parent households, those with 3 or 4 children have the highest poverty rate, with 5 household (100.0%) living below poverty.
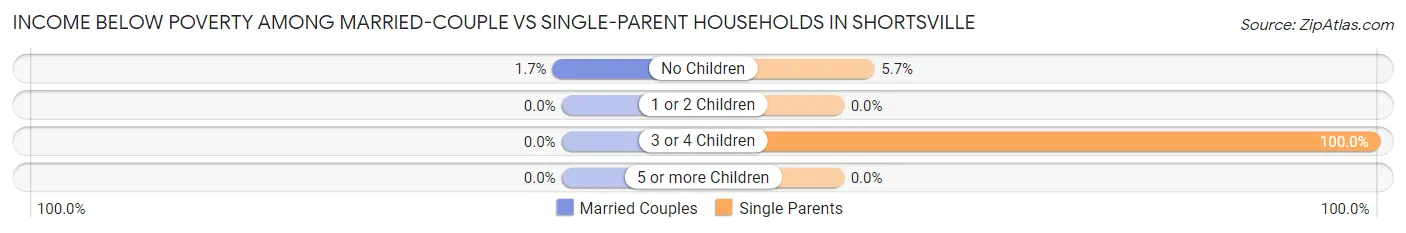
| Children | Married-Couple Families | Single-Parent Households |
| No Children | 4 (1.7%) | 4 (5.7%) |
| 1 or 2 Children | 0 (0.0%) | 0 (0.0%) |
| 3 or 4 Children | 0 (0.0%) | 5 (100.0%) |
| 5 or more Children | 0 (0.0%) | 0 (0.0%) |
| Total | 4 (1.1%) | 9 (8.3%) |
Race in Shortsville
The most populous races in Shortsville are White / Caucasian (1,692 | 97.0%), Two or more Races (39 | 2.2%), and Black / African American (9 | 0.5%).
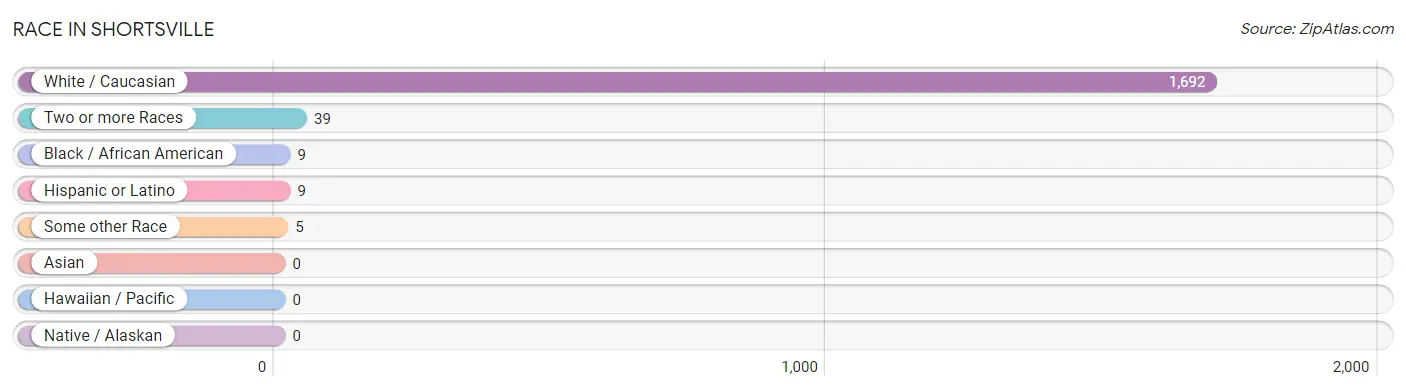
| Race | # Population | % Population |
| Asian | 0 | 0.0% |
| Black / African American | 9 | 0.5% |
| Hawaiian / Pacific | 0 | 0.0% |
| Hispanic or Latino | 9 | 0.5% |
| Native / Alaskan | 0 | 0.0% |
| White / Caucasian | 1,692 | 97.0% |
| Two or more Races | 39 | 2.2% |
| Some other Race | 5 | 0.3% |
| Total | 1,745 | 100.0% |
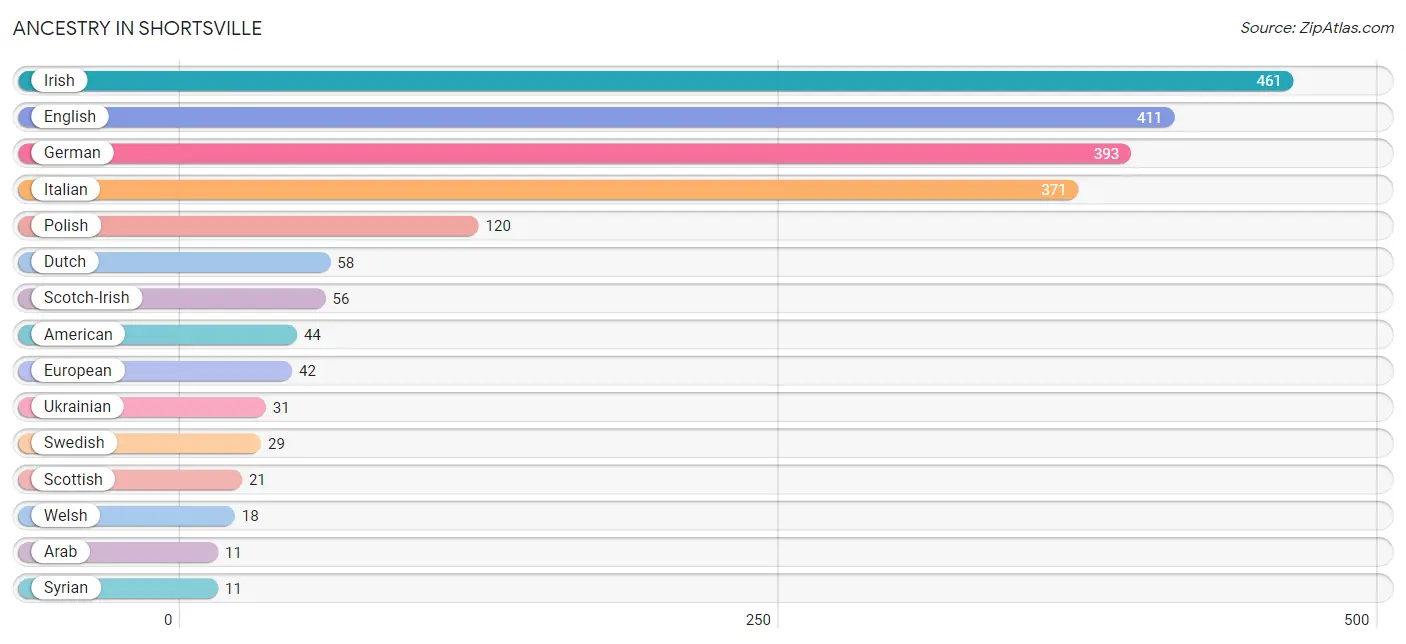
Ancestry in Shortsville
The most populous ancestries reported in Shortsville are Irish (461 | 26.4%), English (411 | 23.5%), German (393 | 22.5%), Italian (371 | 21.3%), and Polish (120 | 6.9%), together accounting for 100.6% of all Shortsville residents.
| Ancestry | # Population | % Population |
| American | 44 | 2.5% |
| Arab | 11 | 0.6% |
| Belgian | 4 | 0.2% |
| Canadian | 6 | 0.3% |
| Danish | 4 | 0.2% |
| Dutch | 58 | 3.3% |
| Eastern European | 10 | 0.6% |
| English | 411 | 23.5% |
| European | 42 | 2.4% |
| Finnish | 9 | 0.5% |
| French | 7 | 0.4% |
| French Canadian | 3 | 0.2% |
| German | 393 | 22.5% |
| Irish | 461 | 26.4% |
| Italian | 371 | 21.3% |
| Korean | 5 | 0.3% |
| Northern European | 2 | 0.1% |
| Polish | 120 | 6.9% |
| Puerto Rican | 9 | 0.5% |
| Scotch-Irish | 56 | 3.2% |
| Scottish | 21 | 1.2% |
| Swedish | 29 | 1.7% |
| Swiss | 3 | 0.2% |
| Syrian | 11 | 0.6% |
| Ukrainian | 31 | 1.8% |
| Welsh | 18 | 1.0% | View All 26 Rows |
Immigrants in Shortsville
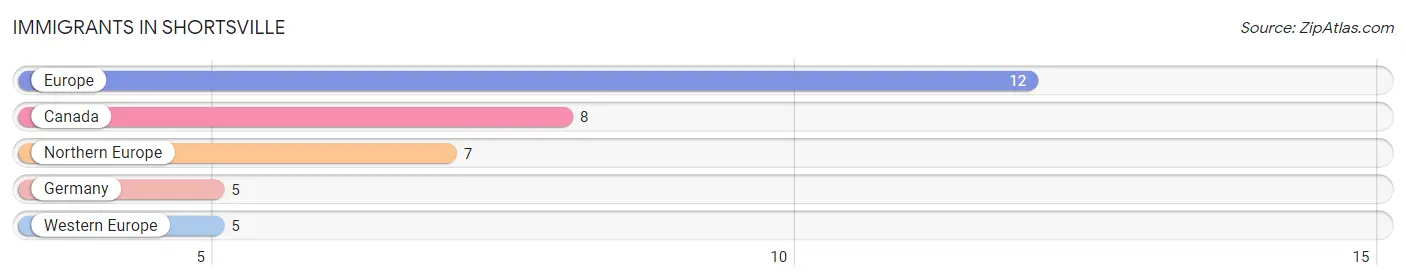
The most numerous immigrant groups reported in Shortsville came from Europe (12 | 0.7%), Canada (8 | 0.5%), Northern Europe (7 | 0.4%), Germany (5 | 0.3%), and Western Europe (5 | 0.3%), together accounting for 2.1% of all Shortsville residents.
| Immigration Origin | # Population | % Population |
| Canada | 8 | 0.5% |
| Europe | 12 | 0.7% |
| Germany | 5 | 0.3% |
| Northern Europe | 7 | 0.4% |
| Western Europe | 5 | 0.3% | View All 5 Rows |
Sex and Age in Shortsville
Sex and Age in Shortsville
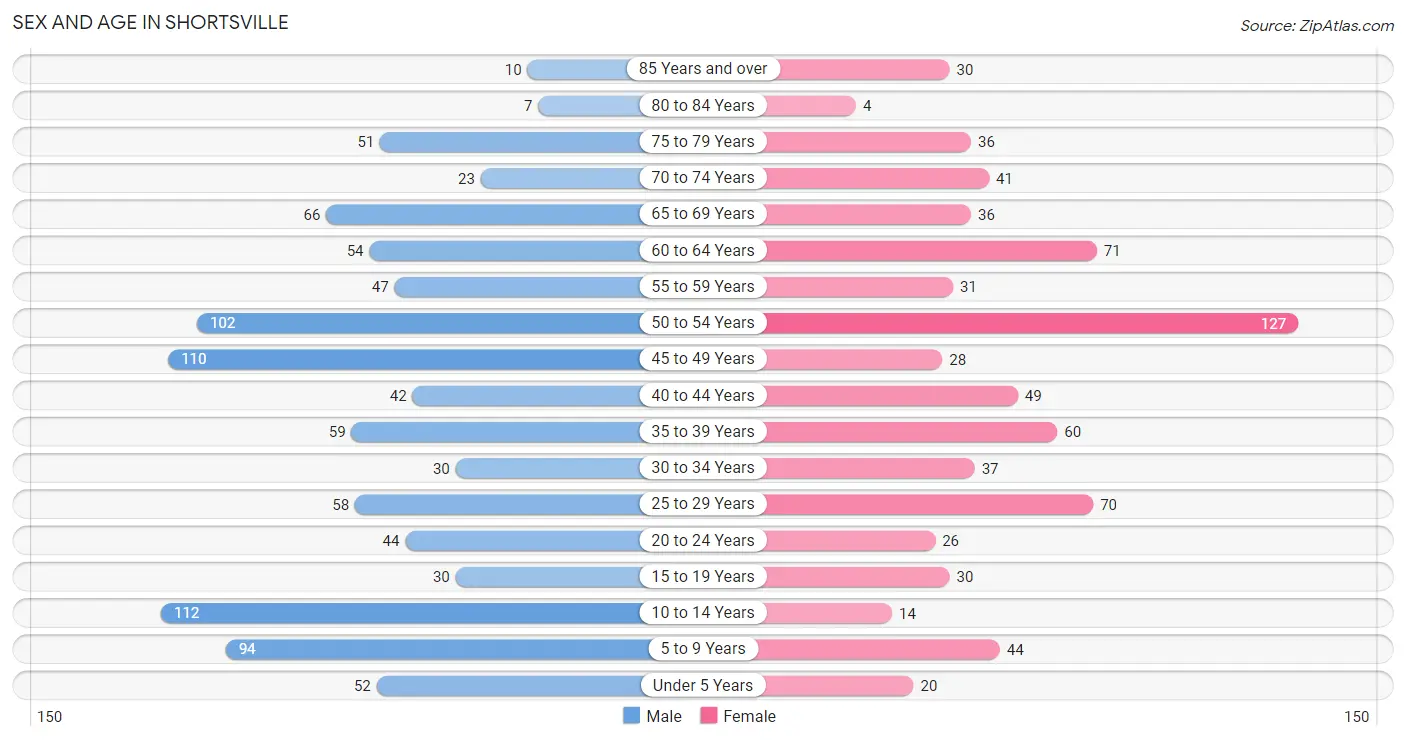
The most populous age groups in Shortsville are 10 to 14 Years (112 | 11.3%) for men and 50 to 54 Years (127 | 16.8%) for women.
| Age Bracket | Male | Female |
| Under 5 Years | 52 (5.2%) | 20 (2.6%) |
| 5 to 9 Years | 94 (9.5%) | 44 (5.8%) |
| 10 to 14 Years | 112 (11.3%) | 14 (1.9%) |
| 15 to 19 Years | 30 (3.0%) | 30 (4.0%) |
| 20 to 24 Years | 44 (4.4%) | 26 (3.5%) |
| 25 to 29 Years | 58 (5.9%) | 70 (9.3%) |
| 30 to 34 Years | 30 (3.0%) | 37 (4.9%) |
| 35 to 39 Years | 59 (5.9%) | 60 (8.0%) |
| 40 to 44 Years | 42 (4.2%) | 49 (6.5%) |
| 45 to 49 Years | 110 (11.1%) | 28 (3.7%) |
| 50 to 54 Years | 102 (10.3%) | 127 (16.8%) |
| 55 to 59 Years | 47 (4.7%) | 31 (4.1%) |
| 60 to 64 Years | 54 (5.4%) | 71 (9.4%) |
| 65 to 69 Years | 66 (6.7%) | 36 (4.8%) |
| 70 to 74 Years | 23 (2.3%) | 41 (5.4%) |
| 75 to 79 Years | 51 (5.1%) | 36 (4.8%) |
| 80 to 84 Years | 7 (0.7%) | 4 (0.5%) |
| 85 Years and over | 10 (1.0%) | 30 (4.0%) |
| Total | 991 (100.0%) | 754 (100.0%) |
Families and Households in Shortsville
Median Family Size in Shortsville
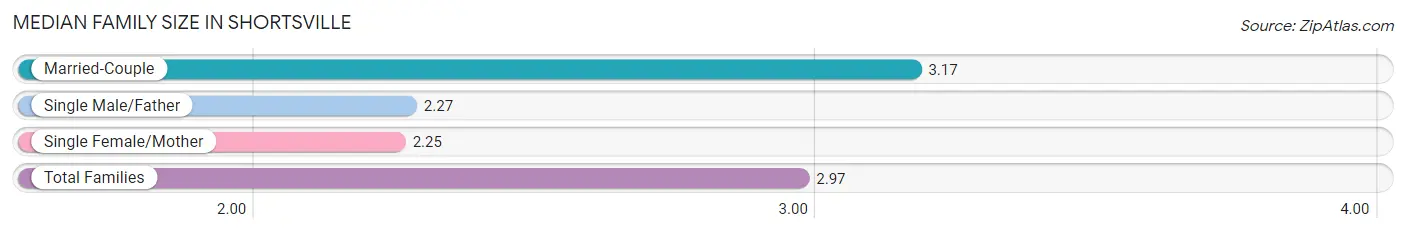
The median family size in Shortsville is 2.97 persons per family, with married-couple families (378 | 77.6%) accounting for the largest median family size of 3.17 persons per family. On the other hand, single female/mother families (76 | 15.6%) represent the smallest median family size with 2.25 persons per family.
| Family Type | # Families | Family Size |
| Married-Couple | 378 (77.6%) | 3.17 |
| Single Male/Father | 33 (6.8%) | 2.27 |
| Single Female/Mother | 76 (15.6%) | 2.25 |
| Total Families | 487 (100.0%) | 2.97 |
Median Household Size in Shortsville
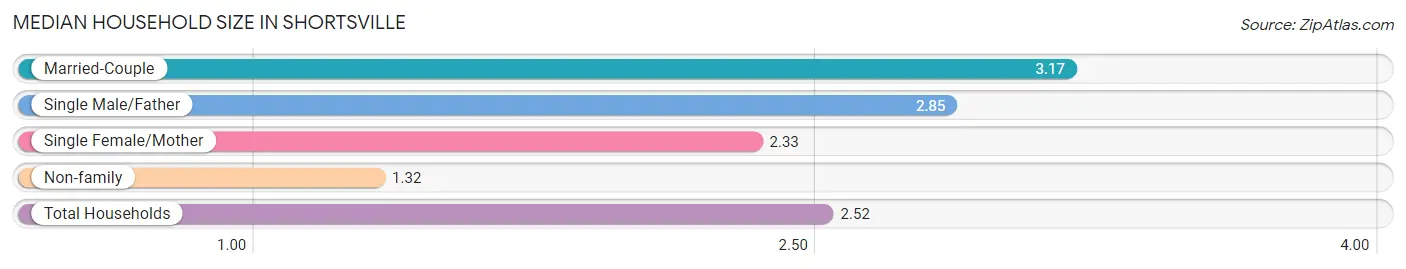
The median household size in Shortsville is 2.52 persons per household, with married-couple households (378 | 54.9%) accounting for the largest median household size of 3.17 persons per household. non-family households (201 | 29.2%) represent the smallest median household size with 1.32 persons per household.
| Household Type | # Households | Household Size |
| Married-Couple | 378 (54.9%) | 3.17 |
| Single Male/Father | 33 (4.8%) | 2.85 |
| Single Female/Mother | 76 (11.1%) | 2.33 |
| Non-family | 201 (29.2%) | 1.32 |
| Total Households | 688 (100.0%) | 2.52 |
Household Size by Marriage Status in Shortsville
Out of a total of 688 households in Shortsville, 487 (70.8%) are family households, while 201 (29.2%) are nonfamily households. The most numerous type of family households are 2-person households, comprising 279, and the most common type of nonfamily households are 1-person households, comprising 152.
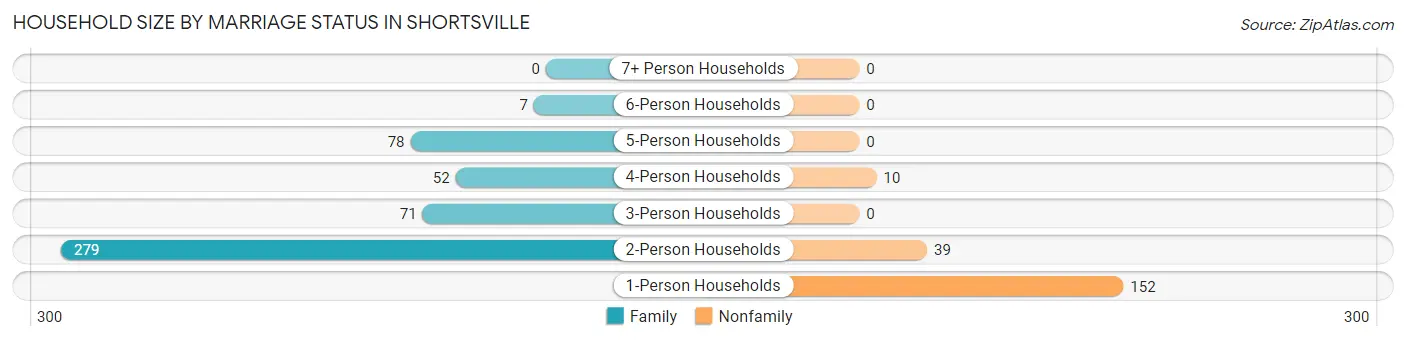
| Household Size | Family Households | Nonfamily Households |
| 1-Person Households | - | 152 (22.1%) |
| 2-Person Households | 279 (40.6%) | 39 (5.7%) |
| 3-Person Households | 71 (10.3%) | 0 (0.0%) |
| 4-Person Households | 52 (7.6%) | 10 (1.5%) |
| 5-Person Households | 78 (11.3%) | 0 (0.0%) |
| 6-Person Households | 7 (1.0%) | 0 (0.0%) |
| 7+ Person Households | 0 (0.0%) | 0 (0.0%) |
| Total | 487 (70.8%) | 201 (29.2%) |
Female Fertility in Shortsville
Fertility by Age in Shortsville
Average fertility rate in Shortsville is 67.0 births per 1,000 women. Women in the age bracket of 20 to 34 years have the highest fertility rate with 128.0 births per 1,000 women. Women in the age bracket of 20 to 34 years acount for 85.0% of all women with births.
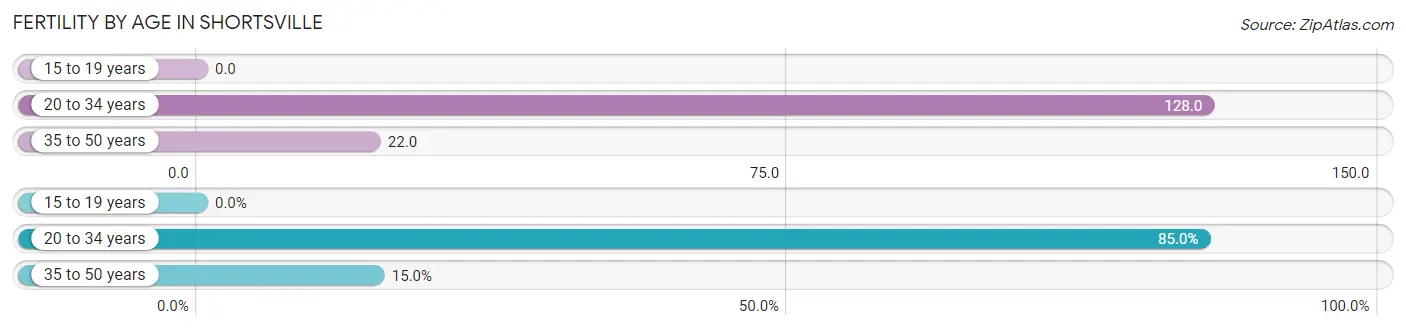
| Age Bracket | Women with Births | Births / 1,000 Women |
| 15 to 19 years | 0 (0.0%) | 0.0 |
| 20 to 34 years | 17 (85.0%) | 128.0 |
| 35 to 50 years | 3 (15.0%) | 22.0 |
| Total | 20 (100.0%) | 67.0 |
Fertility by Age by Marriage Status in Shortsville
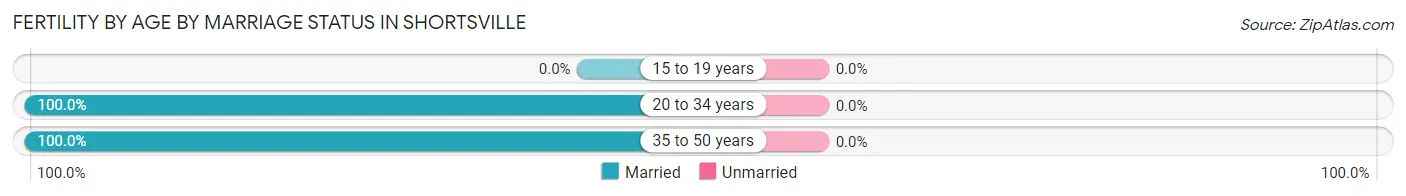
| Age Bracket | Married | Unmarried |
| 15 to 19 years | 0 (0.0%) | 0 (0.0%) |
| 20 to 34 years | 17 (100.0%) | 0 (0.0%) |
| 35 to 50 years | 3 (100.0%) | 0 (0.0%) |
| Total | 20 (100.0%) | 0 (0.0%) |
Fertility by Education in Shortsville
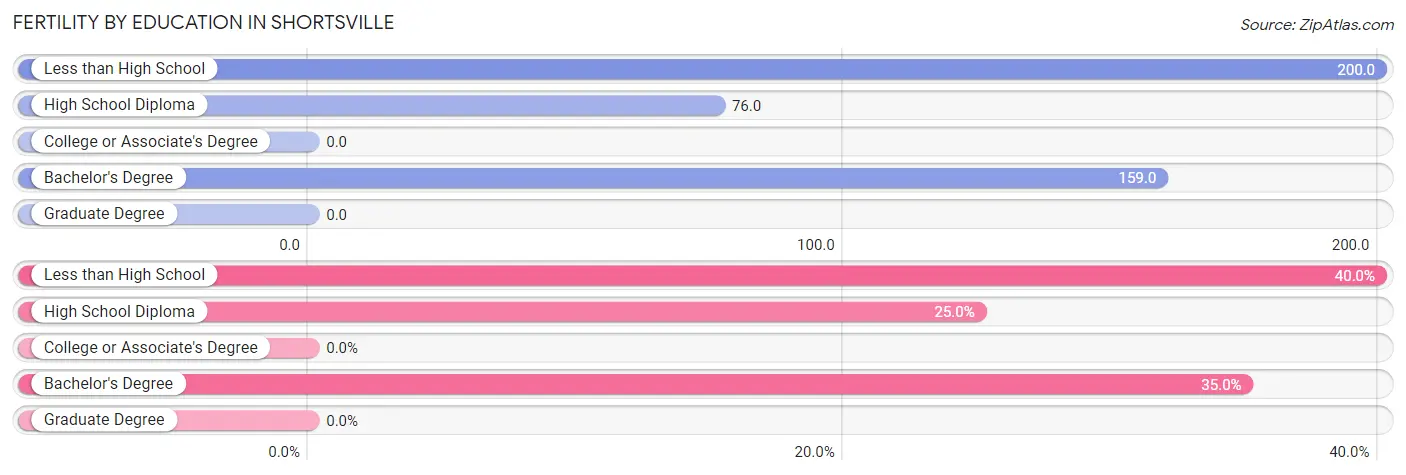
| Educational Attainment | Women with Births | Births / 1,000 Women |
| Less than High School | 8 (40.0%) | 200.0 |
| High School Diploma | 5 (25.0%) | 76.0 |
| College or Associate's Degree | 0 (0.0%) | 0.0 |
| Bachelor's Degree | 7 (35.0%) | 159.0 |
| Graduate Degree | 0 (0.0%) | 0.0 |
| Total | 20 (100.0%) | 67.0 |
Fertility by Education by Marriage Status in Shortsville
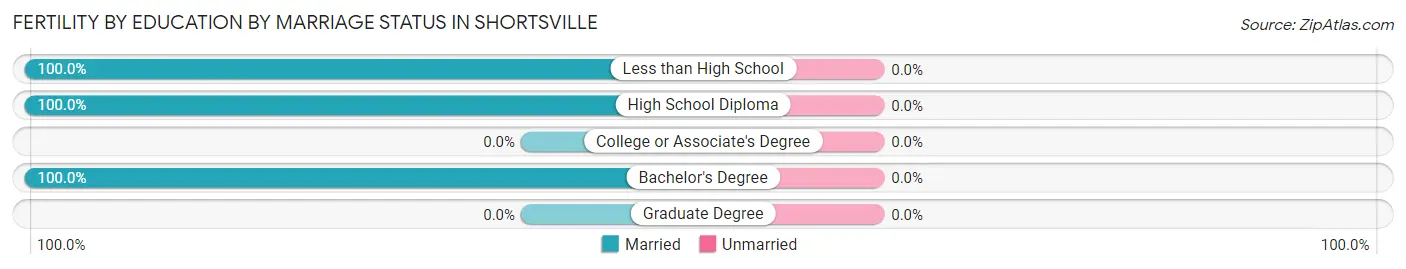
| Educational Attainment | Married | Unmarried |
| Less than High School | 8 (100.0%) | 0 (0.0%) |
| High School Diploma | 5 (100.0%) | 0 (0.0%) |
| College or Associate's Degree | 0 (0.0%) | 0 (0.0%) |
| Bachelor's Degree | 7 (100.0%) | 0 (0.0%) |
| Graduate Degree | 0 (0.0%) | 0 (0.0%) |
| Total | 20 (100.0%) | 0 (0.0%) |
Employment Characteristics in Shortsville
Employment by Class of Employer in Shortsville
Among the 958 employed individuals in Shortsville, private company employees (671 | 70.0%), local government employees (142 | 14.8%), and not-for-profit organizations (63 | 6.6%) make up the most common classes of employment.
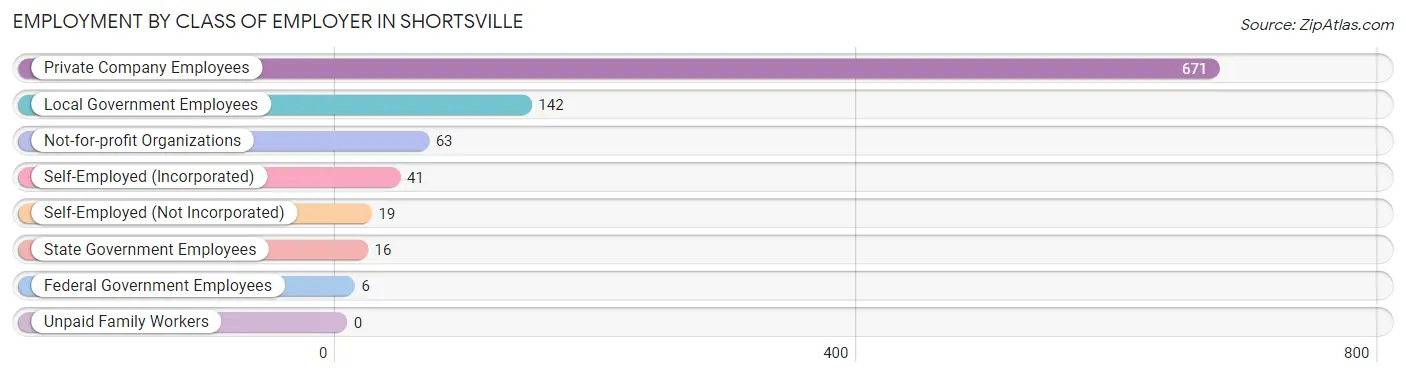
| Employer Class | # Employees | % Employees |
| Private Company Employees | 671 | 70.0% |
| Self-Employed (Incorporated) | 41 | 4.3% |
| Self-Employed (Not Incorporated) | 19 | 2.0% |
| Not-for-profit Organizations | 63 | 6.6% |
| Local Government Employees | 142 | 14.8% |
| State Government Employees | 16 | 1.7% |
| Federal Government Employees | 6 | 0.6% |
| Unpaid Family Workers | 0 | 0.0% |
| Total | 958 | 100.0% |
Employment Status by Age in Shortsville
According to the labor force statistics for Shortsville, out of the total population over 16 years of age (1,398), 71.5% or 1,000 individuals are in the labor force, with 1.3% or 13 of them unemployed. The age group with the highest labor force participation rate is 30 to 34 years, with 100.0% or 67 individuals in the labor force. Within the labor force, the 16 to 19 years age range has the highest percentage of unemployed individuals, with 21.2% or 7 of them being unemployed.
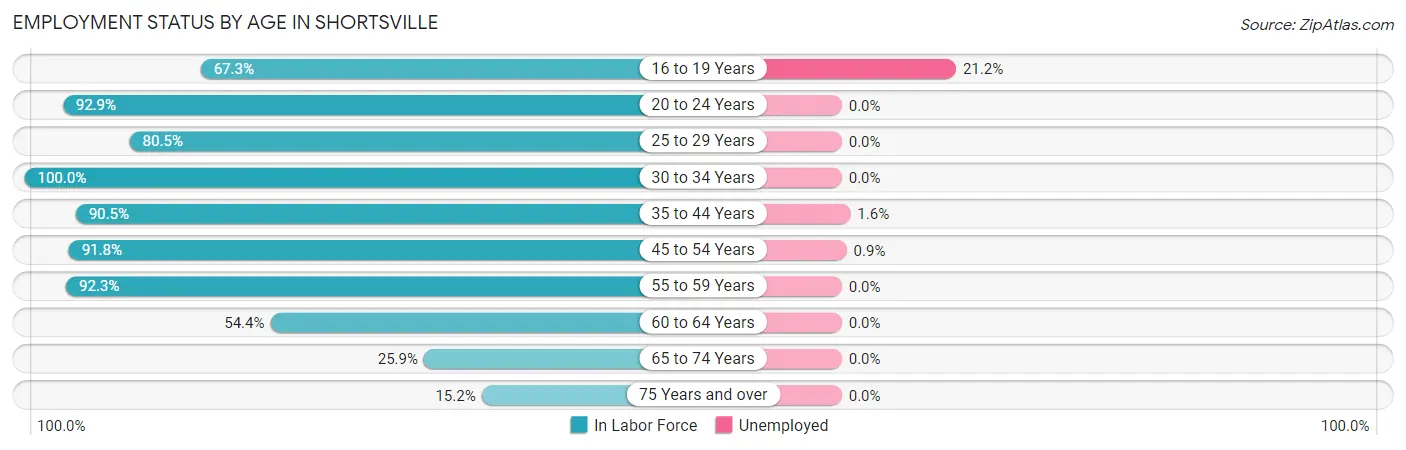
| Age Bracket | In Labor Force | Unemployed |
| 16 to 19 Years | 33 (67.3%) | 7 (21.2%) |
| 20 to 24 Years | 65 (92.9%) | 0 (0.0%) |
| 25 to 29 Years | 103 (80.5%) | 0 (0.0%) |
| 30 to 34 Years | 67 (100.0%) | 0 (0.0%) |
| 35 to 44 Years | 190 (90.5%) | 3 (1.6%) |
| 45 to 54 Years | 337 (91.8%) | 3 (0.9%) |
| 55 to 59 Years | 72 (92.3%) | 0 (0.0%) |
| 60 to 64 Years | 68 (54.4%) | 0 (0.0%) |
| 65 to 74 Years | 43 (25.9%) | 0 (0.0%) |
| 75 Years and over | 21 (15.2%) | 0 (0.0%) |
| Total | 1,000 (71.5%) | 13 (1.3%) |
Employment Status by Educational Attainment in Shortsville
According to labor force statistics for Shortsville, 85.8% of individuals (837) out of the total population between 25 and 64 years of age (975) are in the labor force, with 0.7% or 6 of them being unemployed. The group with the highest labor force participation rate are those with the educational attainment of bachelor's degree or higher, with 95.5% or 170 individuals in the labor force. Within the labor force, individuals with bachelor's degree or higher education have the highest percentage of unemployment, with 1.8% or 3 of them being unemployed.
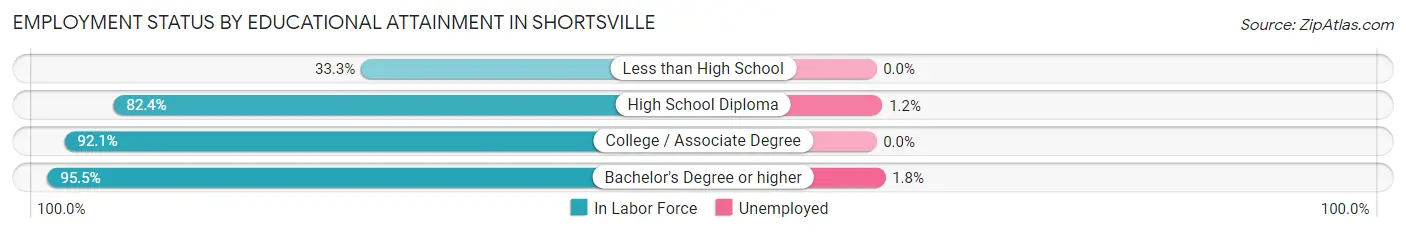
| Educational Attainment | In Labor Force | Unemployed |
| Less than High School | 21 (33.3%) | 0 (0.0%) |
| High School Diploma | 252 (82.4%) | 4 (1.2%) |
| College / Associate Degree | 394 (92.1%) | 0 (0.0%) |
| Bachelor's Degree or higher | 170 (95.5%) | 3 (1.8%) |
| Total | 837 (85.8%) | 7 (0.7%) |
Employment Occupations by Sex in Shortsville
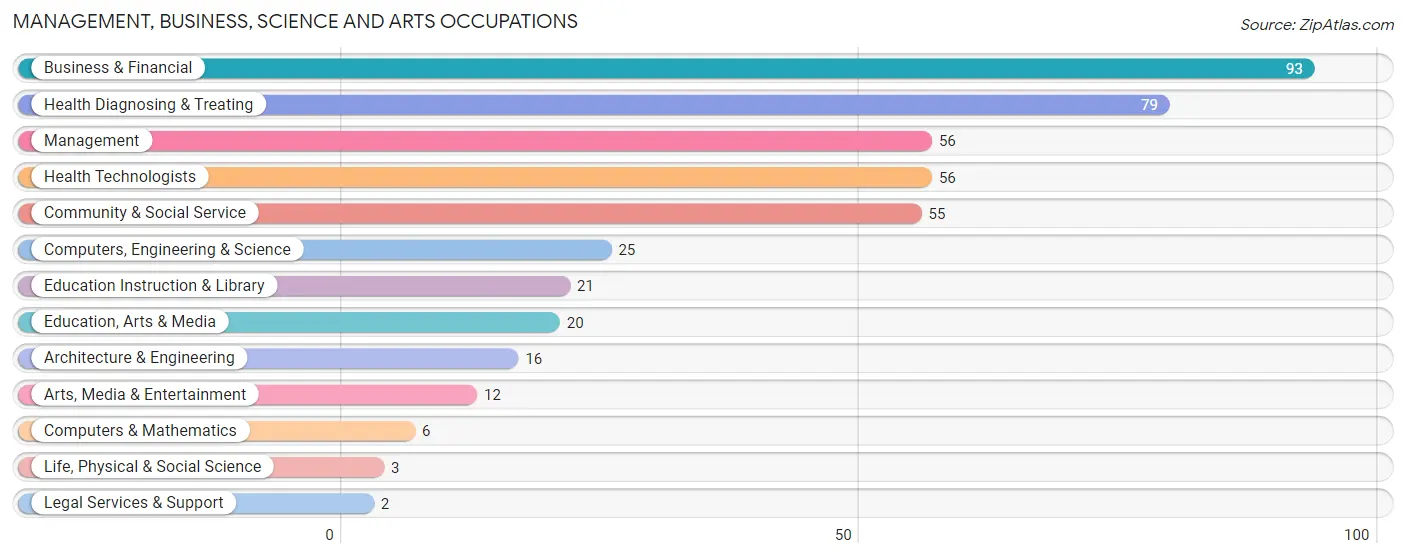
Management, Business, Science and Arts Occupations
The most common Management, Business, Science and Arts occupations in Shortsville are Business & Financial (93 | 9.4%), Health Diagnosing & Treating (79 | 8.0%), Management (56 | 5.7%), Health Technologists (56 | 5.7%), and Community & Social Service (55 | 5.6%).
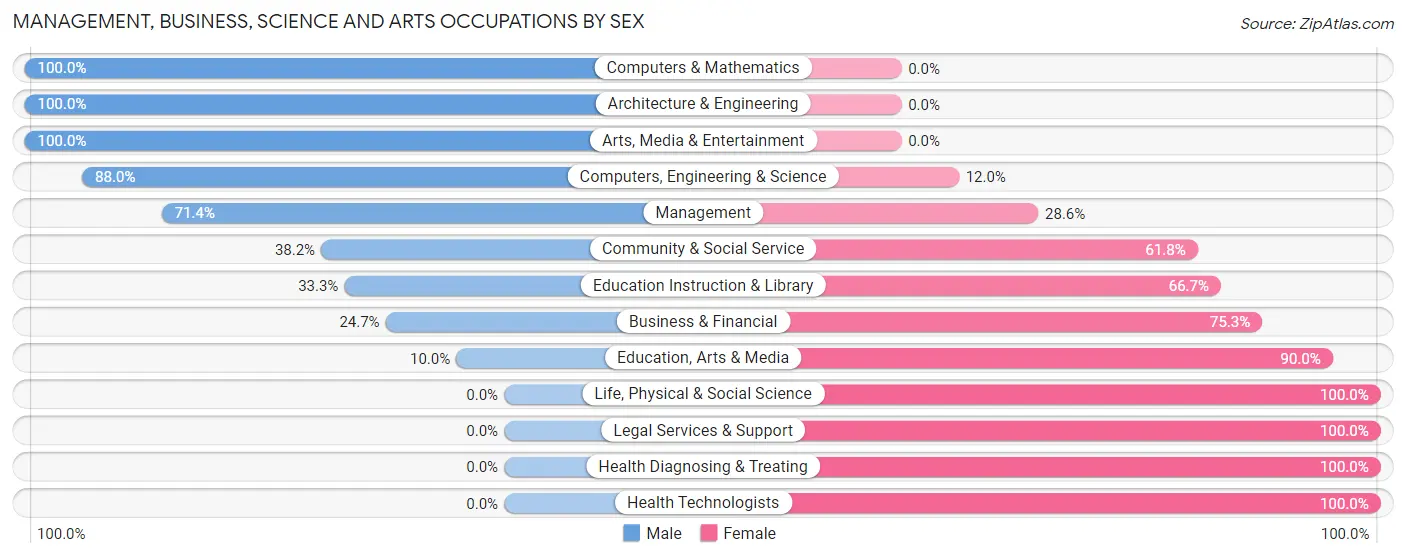
Management, Business, Science and Arts Occupations by Sex
Within the Management, Business, Science and Arts occupations in Shortsville, the most male-oriented occupations are Computers & Mathematics (100.0%), Architecture & Engineering (100.0%), and Arts, Media & Entertainment (100.0%), while the most female-oriented occupations are Life, Physical & Social Science (100.0%), Legal Services & Support (100.0%), and Health Diagnosing & Treating (100.0%).
| Occupation | Male | Female |
| Management | 40 (71.4%) | 16 (28.6%) |
| Business & Financial | 23 (24.7%) | 70 (75.3%) |
| Computers, Engineering & Science | 22 (88.0%) | 3 (12.0%) |
| Computers & Mathematics | 6 (100.0%) | 0 (0.0%) |
| Architecture & Engineering | 16 (100.0%) | 0 (0.0%) |
| Life, Physical & Social Science | 0 (0.0%) | 3 (100.0%) |
| Community & Social Service | 21 (38.2%) | 34 (61.8%) |
| Education, Arts & Media | 2 (10.0%) | 18 (90.0%) |
| Legal Services & Support | 0 (0.0%) | 2 (100.0%) |
| Education Instruction & Library | 7 (33.3%) | 14 (66.7%) |
| Arts, Media & Entertainment | 12 (100.0%) | 0 (0.0%) |
| Health Diagnosing & Treating | 0 (0.0%) | 79 (100.0%) |
| Health Technologists | 0 (0.0%) | 56 (100.0%) |
| Total (Category) | 106 (34.4%) | 202 (65.6%) |
| Total (Overall) | 536 (54.4%) | 450 (45.6%) |
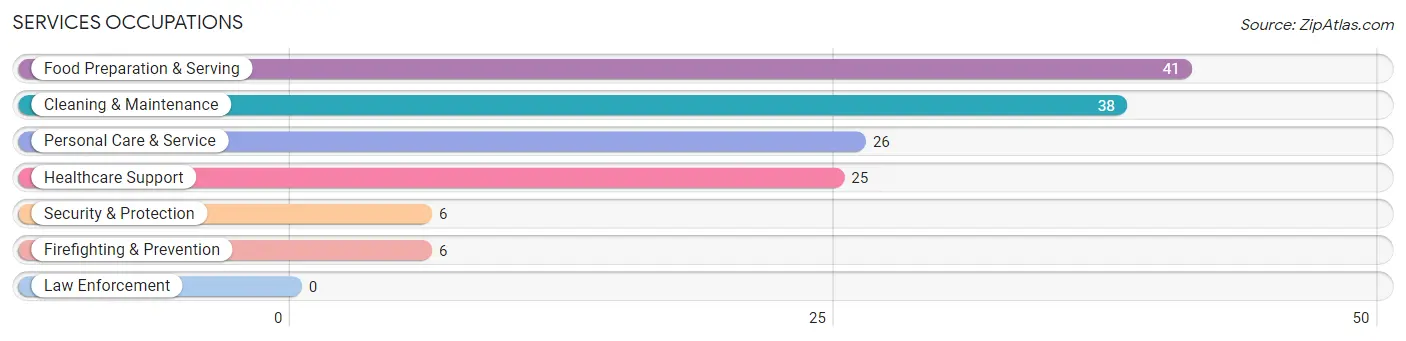
Services Occupations
The most common Services occupations in Shortsville are Food Preparation & Serving (41 | 4.2%), Cleaning & Maintenance (38 | 3.8%), Personal Care & Service (26 | 2.6%), Healthcare Support (25 | 2.5%), and Security & Protection (6 | 0.6%).
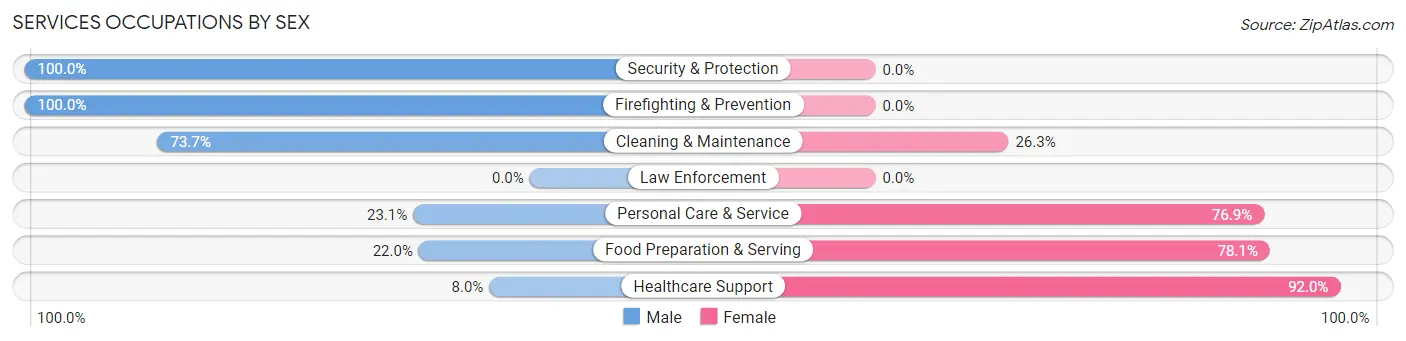
Services Occupations by Sex
Within the Services occupations in Shortsville, the most male-oriented occupations are Security & Protection (100.0%), Firefighting & Prevention (100.0%), and Cleaning & Maintenance (73.7%), while the most female-oriented occupations are Healthcare Support (92.0%), Food Preparation & Serving (78.0%), and Personal Care & Service (76.9%).
| Occupation | Male | Female |
| Healthcare Support | 2 (8.0%) | 23 (92.0%) |
| Security & Protection | 6 (100.0%) | 0 (0.0%) |
| Firefighting & Prevention | 6 (100.0%) | 0 (0.0%) |
| Law Enforcement | 0 (0.0%) | 0 (0.0%) |
| Food Preparation & Serving | 9 (22.0%) | 32 (78.0%) |
| Cleaning & Maintenance | 28 (73.7%) | 10 (26.3%) |
| Personal Care & Service | 6 (23.1%) | 20 (76.9%) |
| Total (Category) | 51 (37.5%) | 85 (62.5%) |
| Total (Overall) | 536 (54.4%) | 450 (45.6%) |
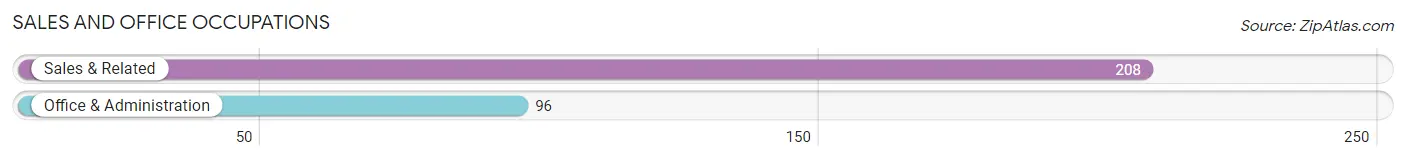
Sales and Office Occupations
The most common Sales and Office occupations in Shortsville are Sales & Related (208 | 21.1%), and Office & Administration (96 | 9.7%).
Sales and Office Occupations by Sex
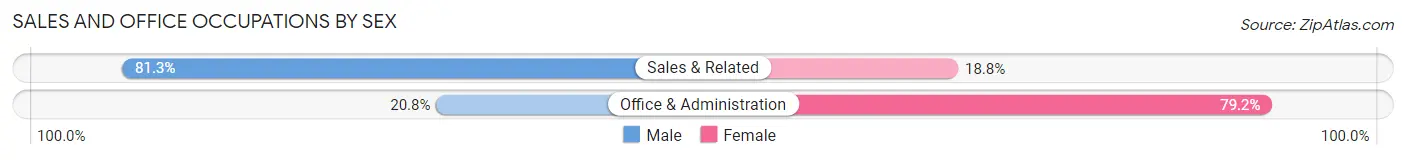
| Occupation | Male | Female |
| Sales & Related | 169 (81.2%) | 39 (18.8%) |
| Office & Administration | 20 (20.8%) | 76 (79.2%) |
| Total (Category) | 189 (62.2%) | 115 (37.8%) |
| Total (Overall) | 536 (54.4%) | 450 (45.6%) |
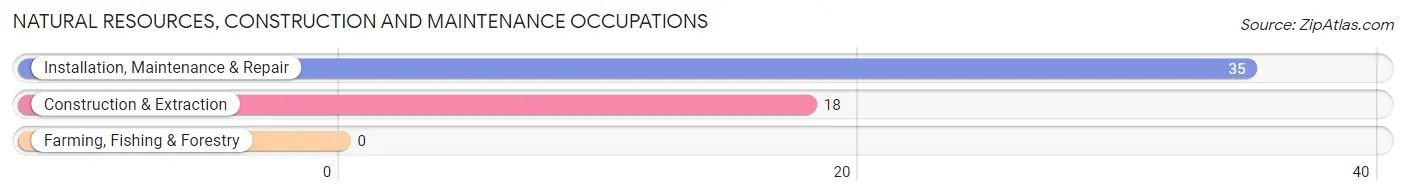
Natural Resources, Construction and Maintenance Occupations
The most common Natural Resources, Construction and Maintenance occupations in Shortsville are Installation, Maintenance & Repair (35 | 3.5%), and Construction & Extraction (18 | 1.8%).
Natural Resources, Construction and Maintenance Occupations by Sex
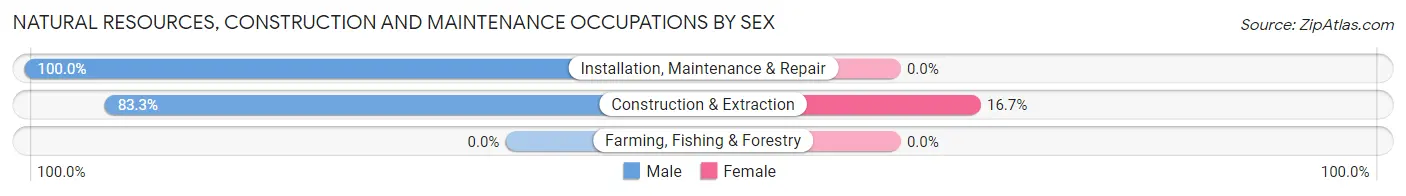
| Occupation | Male | Female |
| Farming, Fishing & Forestry | 0 (0.0%) | 0 (0.0%) |
| Construction & Extraction | 15 (83.3%) | 3 (16.7%) |
| Installation, Maintenance & Repair | 35 (100.0%) | 0 (0.0%) |
| Total (Category) | 50 (94.3%) | 3 (5.7%) |
| Total (Overall) | 536 (54.4%) | 450 (45.6%) |
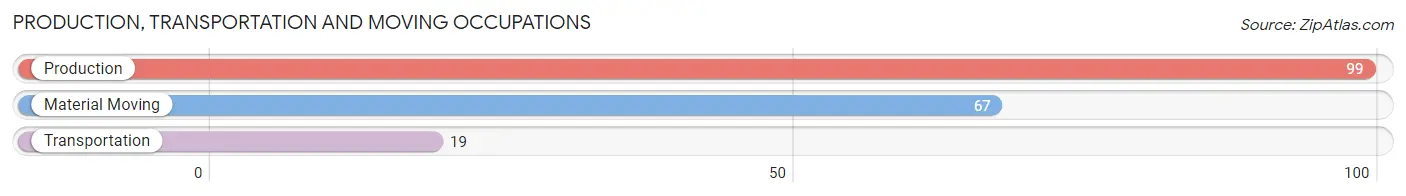
Production, Transportation and Moving Occupations
The most common Production, Transportation and Moving occupations in Shortsville are Production (99 | 10.0%), Material Moving (67 | 6.8%), and Transportation (19 | 1.9%).
Production, Transportation and Moving Occupations by Sex
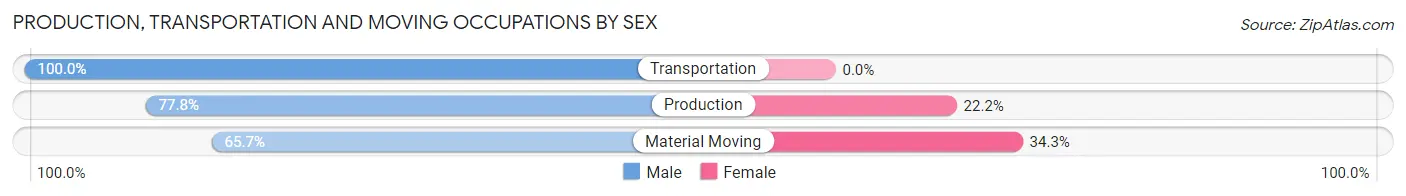
| Occupation | Male | Female |
| Production | 77 (77.8%) | 22 (22.2%) |
| Transportation | 19 (100.0%) | 0 (0.0%) |
| Material Moving | 44 (65.7%) | 23 (34.3%) |
| Total (Category) | 140 (75.7%) | 45 (24.3%) |
| Total (Overall) | 536 (54.4%) | 450 (45.6%) |
Employment Industries by Sex in Shortsville
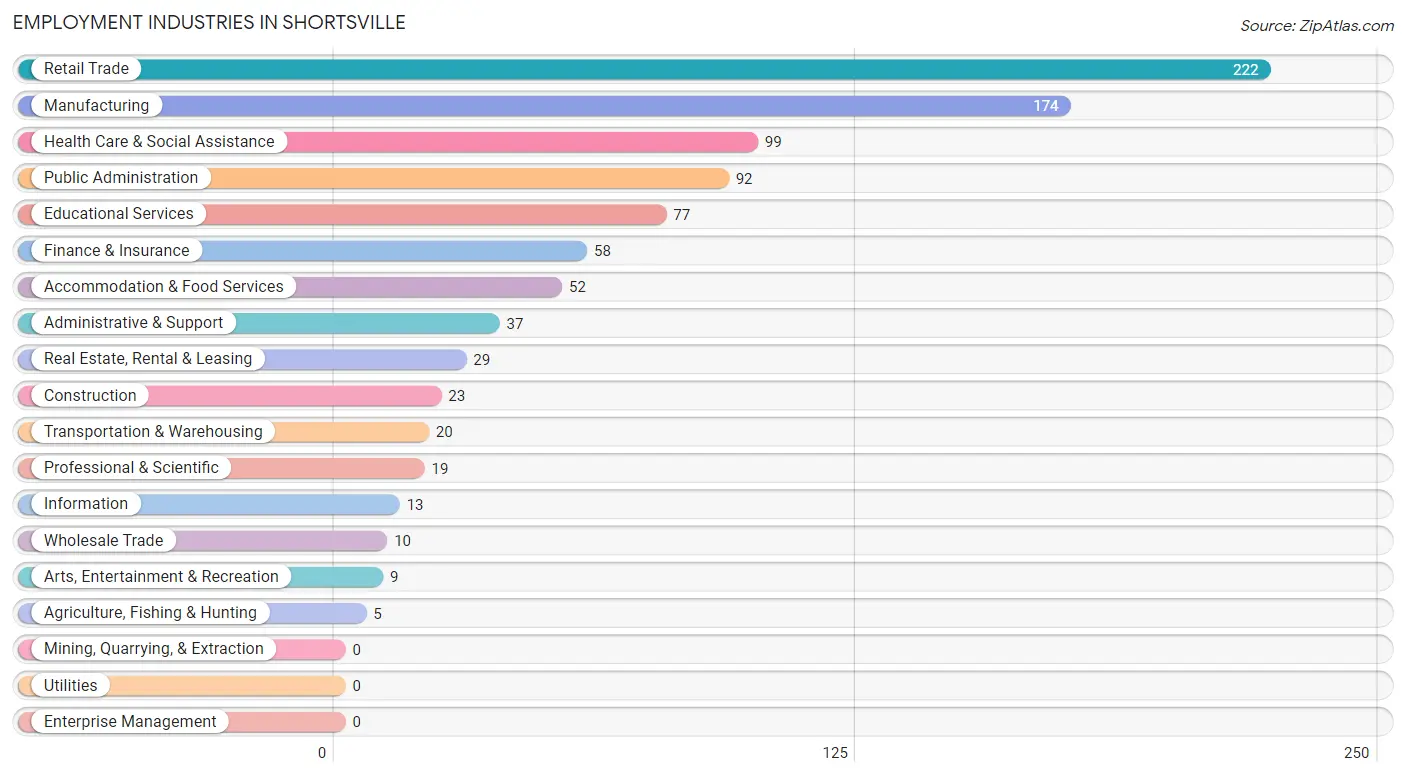
Employment Industries in Shortsville
The major employment industries in Shortsville include Retail Trade (222 | 22.5%), Manufacturing (174 | 17.6%), Health Care & Social Assistance (99 | 10.0%), Public Administration (92 | 9.3%), and Educational Services (77 | 7.8%).
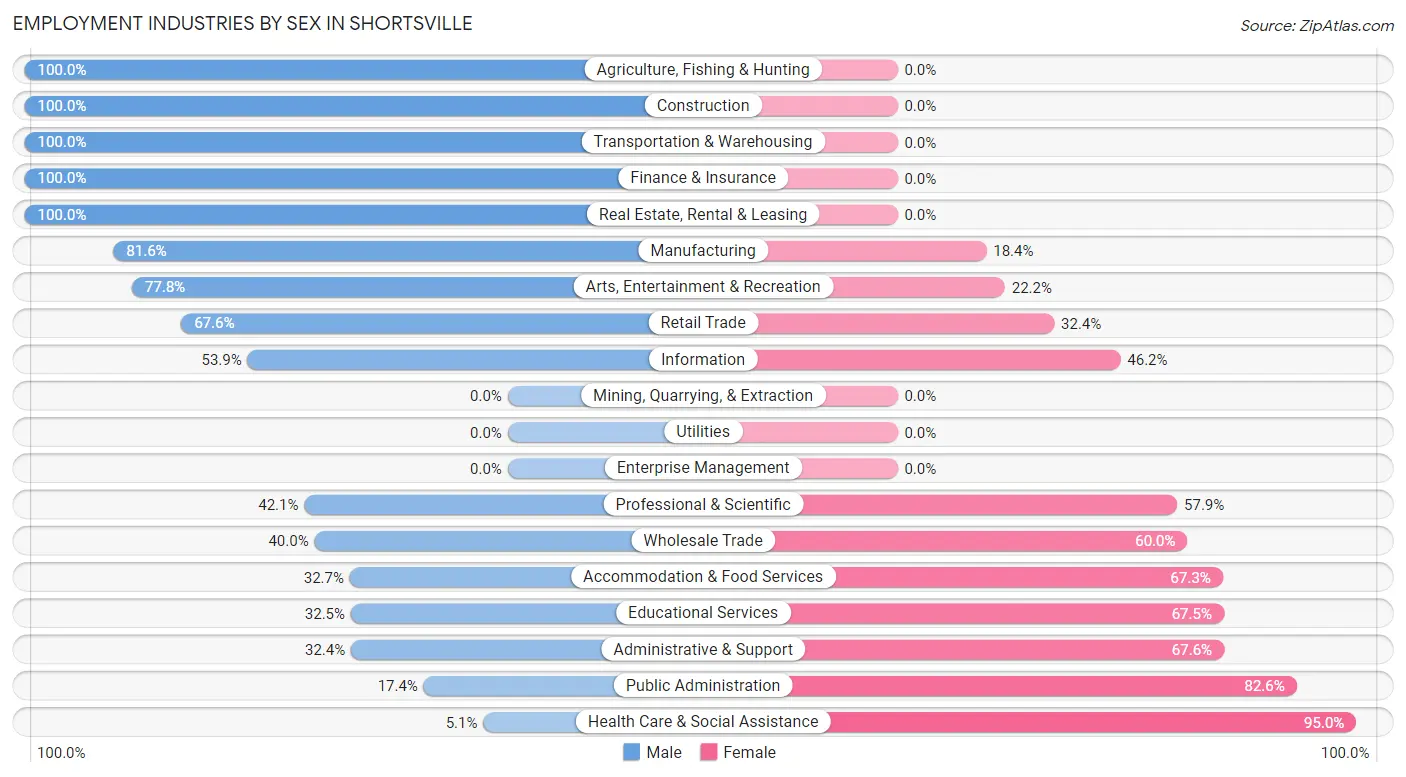
Employment Industries by Sex in Shortsville
The Shortsville industries that see more men than women are Agriculture, Fishing & Hunting (100.0%), Construction (100.0%), and Transportation & Warehousing (100.0%), whereas the industries that tend to have a higher number of women are Health Care & Social Assistance (95.0%), Public Administration (82.6%), and Administrative & Support (67.6%).
| Industry | Male | Female |
| Agriculture, Fishing & Hunting | 5 (100.0%) | 0 (0.0%) |
| Mining, Quarrying, & Extraction | 0 (0.0%) | 0 (0.0%) |
| Construction | 23 (100.0%) | 0 (0.0%) |
| Manufacturing | 142 (81.6%) | 32 (18.4%) |
| Wholesale Trade | 4 (40.0%) | 6 (60.0%) |
| Retail Trade | 150 (67.6%) | 72 (32.4%) |
| Transportation & Warehousing | 20 (100.0%) | 0 (0.0%) |
| Utilities | 0 (0.0%) | 0 (0.0%) |
| Information | 7 (53.8%) | 6 (46.2%) |
| Finance & Insurance | 58 (100.0%) | 0 (0.0%) |
| Real Estate, Rental & Leasing | 29 (100.0%) | 0 (0.0%) |
| Professional & Scientific | 8 (42.1%) | 11 (57.9%) |
| Enterprise Management | 0 (0.0%) | 0 (0.0%) |
| Administrative & Support | 12 (32.4%) | 25 (67.6%) |
| Educational Services | 25 (32.5%) | 52 (67.5%) |
| Health Care & Social Assistance | 5 (5.1%) | 94 (95.0%) |
| Arts, Entertainment & Recreation | 7 (77.8%) | 2 (22.2%) |
| Accommodation & Food Services | 17 (32.7%) | 35 (67.3%) |
| Public Administration | 16 (17.4%) | 76 (82.6%) |
| Total | 536 (54.4%) | 450 (45.6%) |
Education in Shortsville
School Enrollment in Shortsville
The most common levels of schooling among the 338 students in Shortsville are elementary school (146 | 43.2%), middle school (69 | 20.4%), and high school (50 | 14.8%).
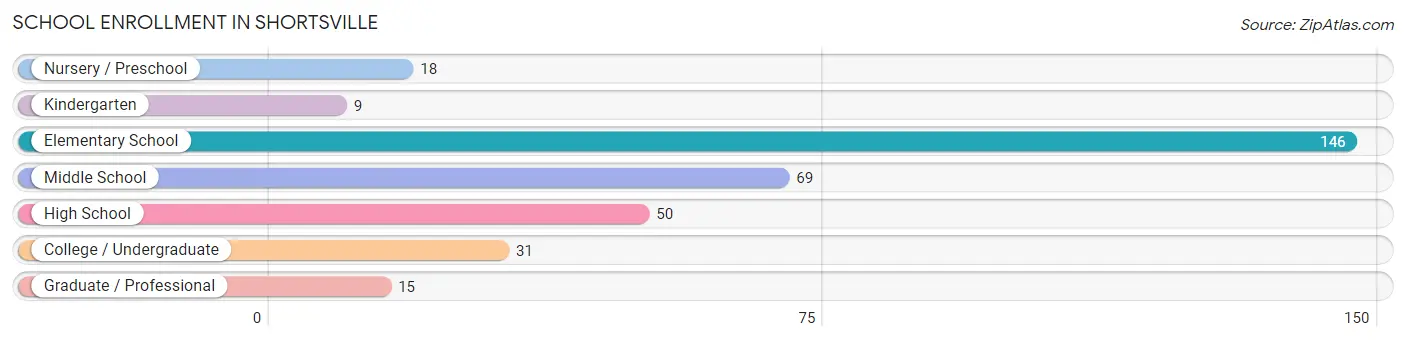
| School Level | # Students | % Students |
| Nursery / Preschool | 18 | 5.3% |
| Kindergarten | 9 | 2.7% |
| Elementary School | 146 | 43.2% |
| Middle School | 69 | 20.4% |
| High School | 50 | 14.8% |
| College / Undergraduate | 31 | 9.2% |
| Graduate / Professional | 15 | 4.4% |
| Total | 338 | 100.0% |
School Enrollment by Age by Funding Source in Shortsville
Out of a total of 338 students who are enrolled in schools in Shortsville, 21 (6.2%) attend a private institution, while the remaining 317 (93.8%) are enrolled in public schools. The age group of 18 to 19 year olds has the highest likelihood of being enrolled in private schools, with 6 (37.5% in the age bracket) enrolled. Conversely, the age group of 3 to 4 year olds has the lowest likelihood of being enrolled in a private school, with 10 (100.0% in the age bracket) attending a public institution.
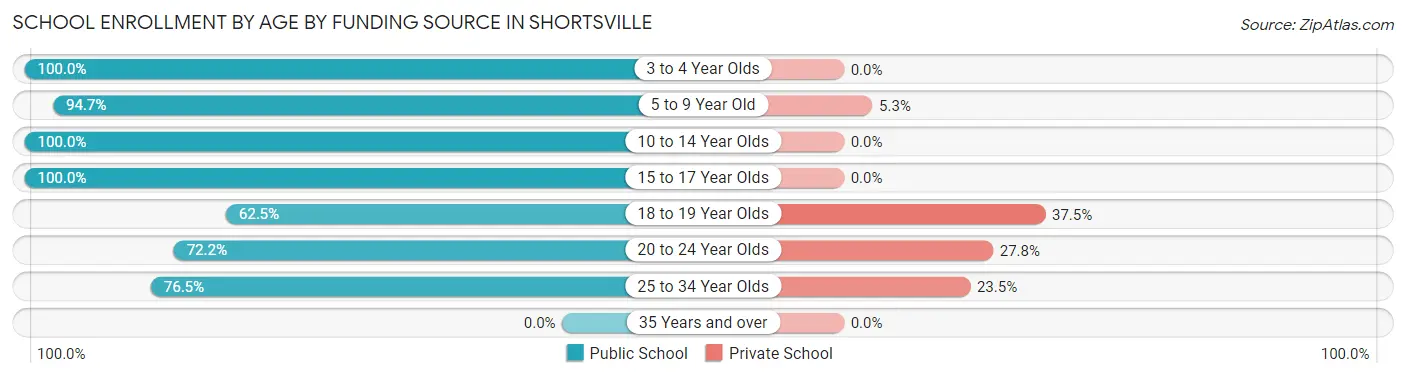
| Age Bracket | Public School | Private School |
| 3 to 4 Year Olds | 10 (100.0%) | 0 (0.0%) |
| 5 to 9 Year Old | 107 (94.7%) | 6 (5.3%) |
| 10 to 14 Year Olds | 123 (100.0%) | 0 (0.0%) |
| 15 to 17 Year Olds | 41 (100.0%) | 0 (0.0%) |
| 18 to 19 Year Olds | 10 (62.5%) | 6 (37.5%) |
| 20 to 24 Year Olds | 13 (72.2%) | 5 (27.8%) |
| 25 to 34 Year Olds | 13 (76.5%) | 4 (23.5%) |
| 35 Years and over | 0 (0.0%) | 0 (0.0%) |
| Total | 317 (93.8%) | 21 (6.2%) |
Educational Attainment by Field of Study in Shortsville
Science & technology (48 | 21.3%), bio, nature & agricultural (32 | 14.2%), business (31 | 13.8%), multidisciplinary studies (18 | 8.0%), and arts & humanities (18 | 8.0%) are the most common fields of study among 225 individuals in Shortsville who have obtained a bachelor's degree or higher.
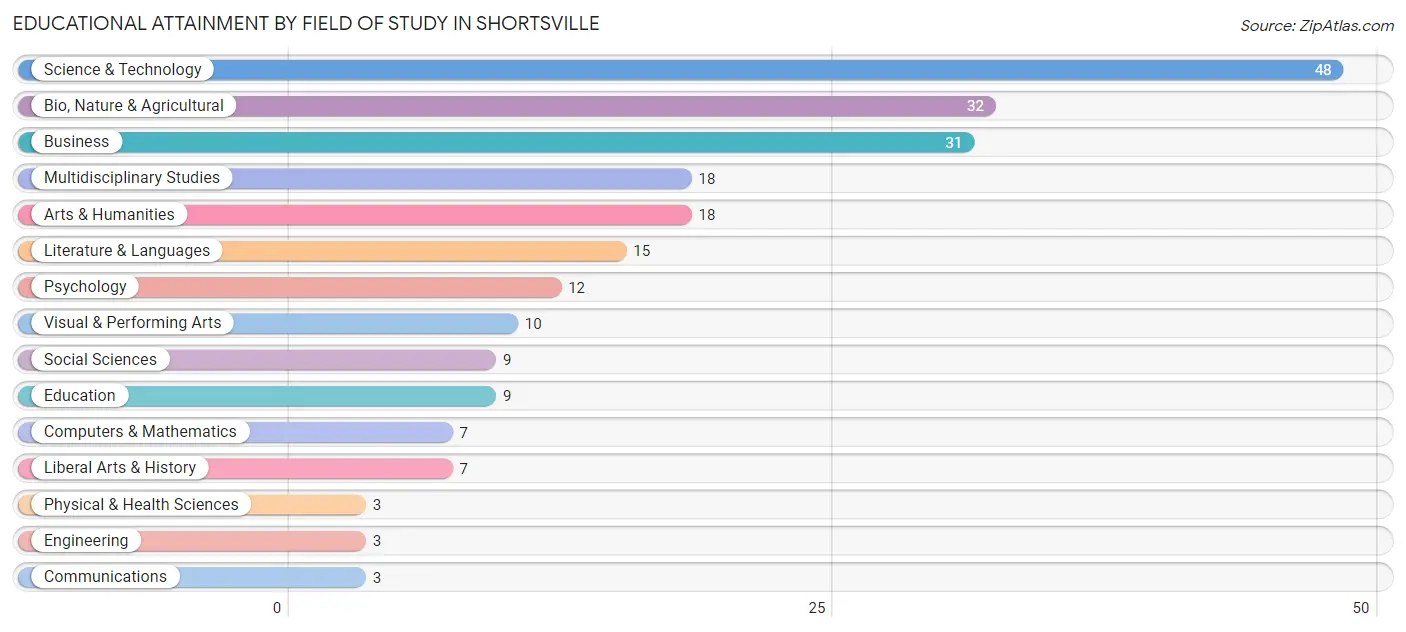
| Field of Study | # Graduates | % Graduates |
| Computers & Mathematics | 7 | 3.1% |
| Bio, Nature & Agricultural | 32 | 14.2% |
| Physical & Health Sciences | 3 | 1.3% |
| Psychology | 12 | 5.3% |
| Social Sciences | 9 | 4.0% |
| Engineering | 3 | 1.3% |
| Multidisciplinary Studies | 18 | 8.0% |
| Science & Technology | 48 | 21.3% |
| Business | 31 | 13.8% |
| Education | 9 | 4.0% |
| Literature & Languages | 15 | 6.7% |
| Liberal Arts & History | 7 | 3.1% |
| Visual & Performing Arts | 10 | 4.4% |
| Communications | 3 | 1.3% |
| Arts & Humanities | 18 | 8.0% |
| Total | 225 | 100.0% |
Transportation & Commute in Shortsville
Vehicle Availability by Sex in Shortsville
The most prevalent vehicle ownership categories in Shortsville are males with 2 vehicles (319, accounting for 60.8%) and females with 2 vehicles (229, making up 73.7%).
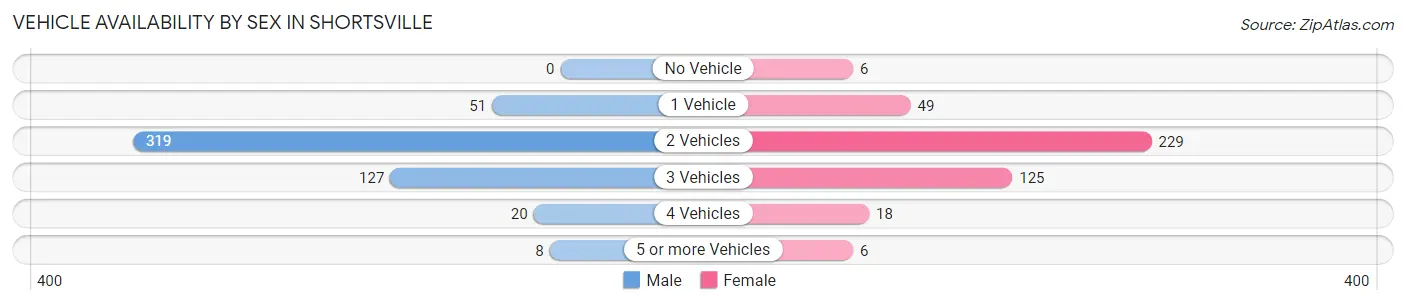
| Vehicles Available | Male | Female |
| No Vehicle | 0 (0.0%) | 6 (1.4%) |
| 1 Vehicle | 51 (9.7%) | 49 (11.3%) |
| 2 Vehicles | 319 (60.8%) | 229 (52.9%) |
| 3 Vehicles | 127 (24.2%) | 125 (28.9%) |
| 4 Vehicles | 20 (3.8%) | 18 (4.2%) |
| 5 or more Vehicles | 8 (1.5%) | 6 (1.4%) |
| Total | 525 (100.0%) | 433 (100.0%) |
Commute Time in Shortsville
The most frequently occuring commute durations in Shortsville are less than 5 minutes (142 commuters, 18.1%), 10 to 14 minutes (134 commuters, 17.1%), and 20 to 24 minutes (100 commuters, 12.7%).
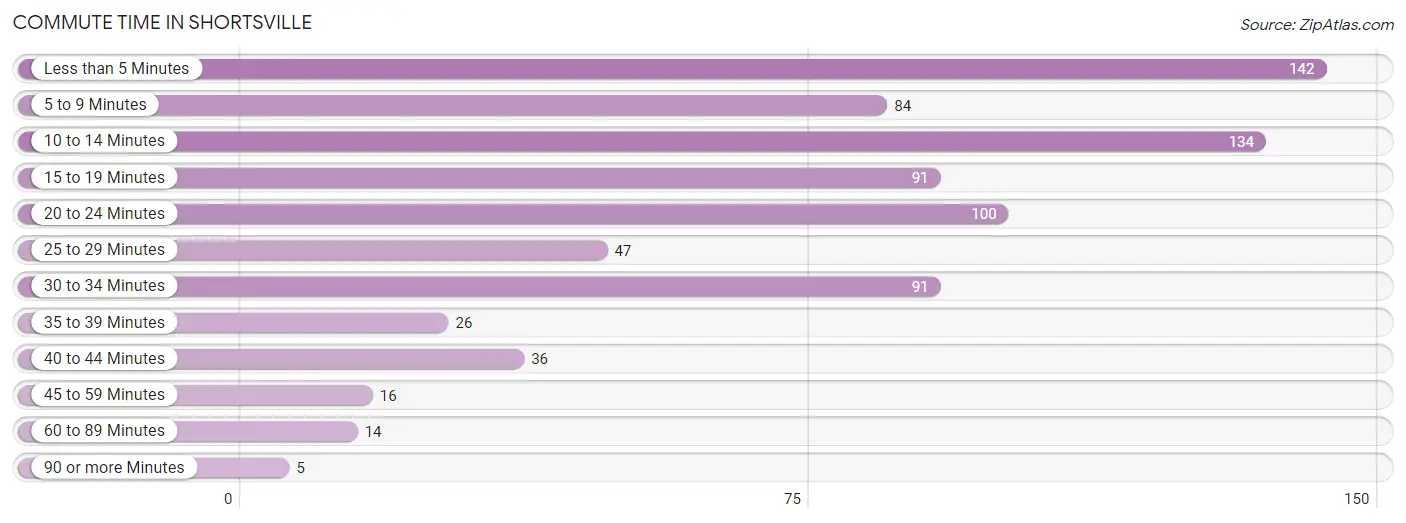
| Commute Time | # Commuters | % Commuters |
| Less than 5 Minutes | 142 | 18.1% |
| 5 to 9 Minutes | 84 | 10.7% |
| 10 to 14 Minutes | 134 | 17.1% |
| 15 to 19 Minutes | 91 | 11.6% |
| 20 to 24 Minutes | 100 | 12.7% |
| 25 to 29 Minutes | 47 | 6.0% |
| 30 to 34 Minutes | 91 | 11.6% |
| 35 to 39 Minutes | 26 | 3.3% |
| 40 to 44 Minutes | 36 | 4.6% |
| 45 to 59 Minutes | 16 | 2.0% |
| 60 to 89 Minutes | 14 | 1.8% |
| 90 or more Minutes | 5 | 0.6% |
Commute Time by Sex in Shortsville
The most common commute times in Shortsville are less than 5 minutes (91 commuters, 20.0%) for males and 10 to 14 minutes (62 commuters, 18.7%) for females.
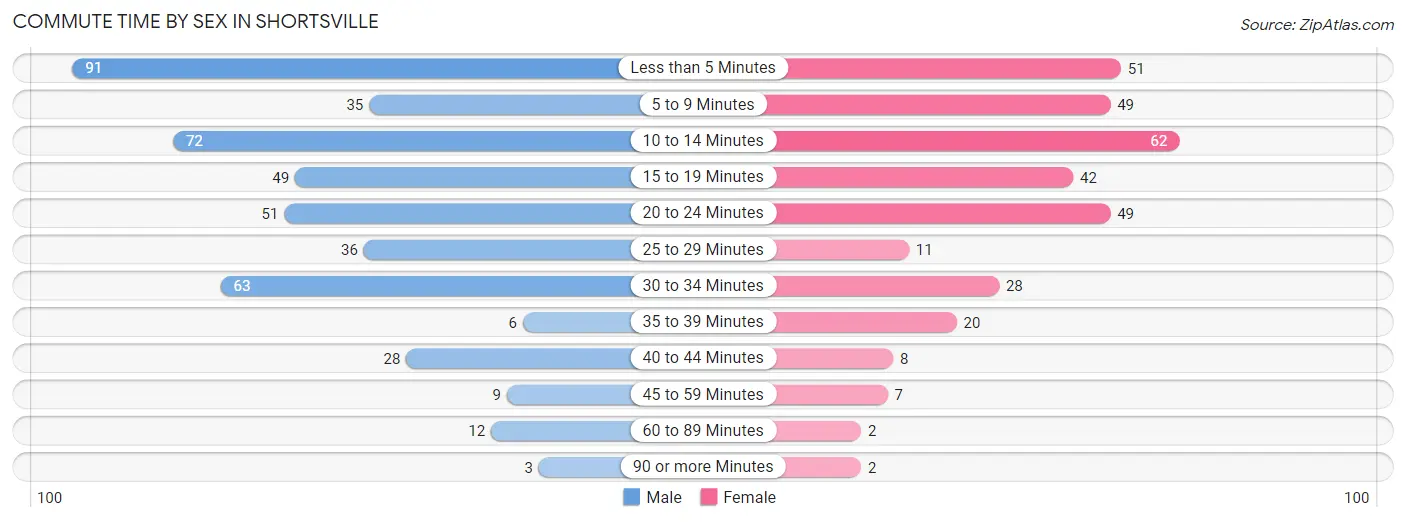
| Commute Time | Male | Female |
| Less than 5 Minutes | 91 (20.0%) | 51 (15.4%) |
| 5 to 9 Minutes | 35 (7.7%) | 49 (14.8%) |
| 10 to 14 Minutes | 72 (15.8%) | 62 (18.7%) |
| 15 to 19 Minutes | 49 (10.8%) | 42 (12.7%) |
| 20 to 24 Minutes | 51 (11.2%) | 49 (14.8%) |
| 25 to 29 Minutes | 36 (7.9%) | 11 (3.3%) |
| 30 to 34 Minutes | 63 (13.9%) | 28 (8.5%) |
| 35 to 39 Minutes | 6 (1.3%) | 20 (6.0%) |
| 40 to 44 Minutes | 28 (6.1%) | 8 (2.4%) |
| 45 to 59 Minutes | 9 (2.0%) | 7 (2.1%) |
| 60 to 89 Minutes | 12 (2.6%) | 2 (0.6%) |
| 90 or more Minutes | 3 (0.7%) | 2 (0.6%) |
Time of Departure to Work by Sex in Shortsville
The most frequent times of departure to work in Shortsville are 12:00 AM to 4:59 AM (96, 21.1%) for males and 7:30 AM to 7:59 AM (87, 26.3%) for females.
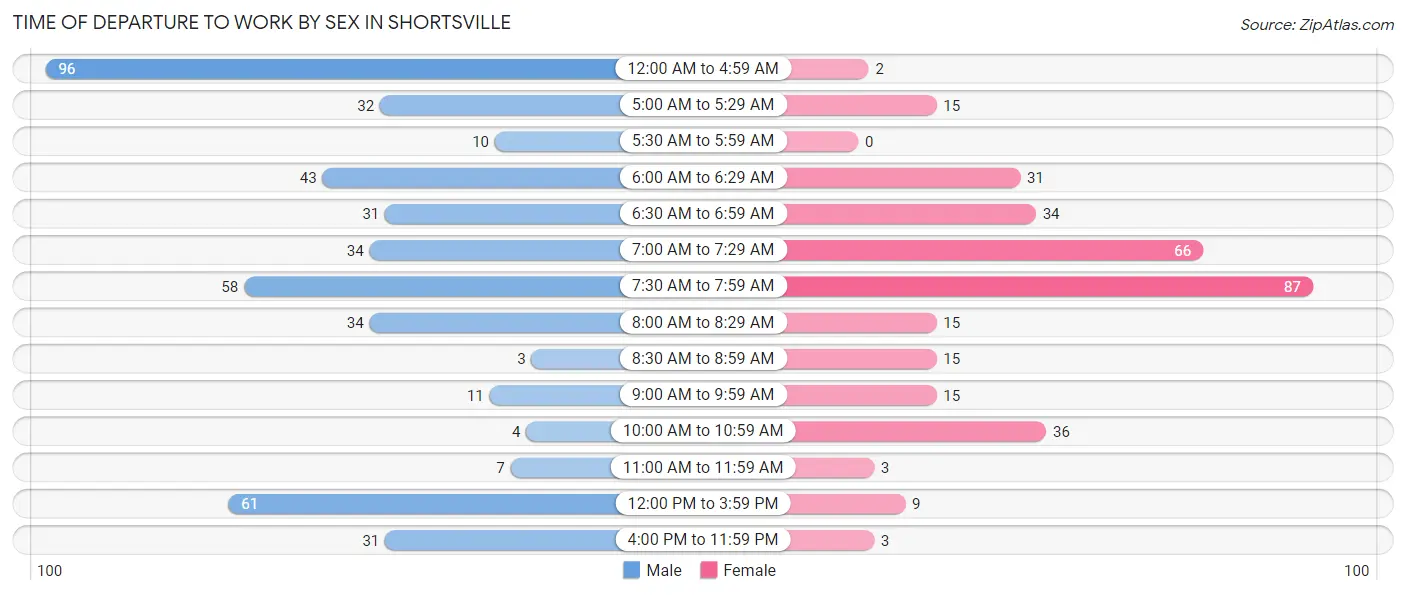
| Time of Departure | Male | Female |
| 12:00 AM to 4:59 AM | 96 (21.1%) | 2 (0.6%) |
| 5:00 AM to 5:29 AM | 32 (7.0%) | 15 (4.5%) |
| 5:30 AM to 5:59 AM | 10 (2.2%) | 0 (0.0%) |
| 6:00 AM to 6:29 AM | 43 (9.5%) | 31 (9.4%) |
| 6:30 AM to 6:59 AM | 31 (6.8%) | 34 (10.3%) |
| 7:00 AM to 7:29 AM | 34 (7.5%) | 66 (19.9%) |
| 7:30 AM to 7:59 AM | 58 (12.8%) | 87 (26.3%) |
| 8:00 AM to 8:29 AM | 34 (7.5%) | 15 (4.5%) |
| 8:30 AM to 8:59 AM | 3 (0.7%) | 15 (4.5%) |
| 9:00 AM to 9:59 AM | 11 (2.4%) | 15 (4.5%) |
| 10:00 AM to 10:59 AM | 4 (0.9%) | 36 (10.9%) |
| 11:00 AM to 11:59 AM | 7 (1.5%) | 3 (0.9%) |
| 12:00 PM to 3:59 PM | 61 (13.4%) | 9 (2.7%) |
| 4:00 PM to 11:59 PM | 31 (6.8%) | 3 (0.9%) |
| Total | 455 (100.0%) | 331 (100.0%) |
Housing Occupancy in Shortsville
Occupancy by Ownership in Shortsville
Of the total 688 dwellings in Shortsville, owner-occupied units account for 573 (83.3%), while renter-occupied units make up 115 (16.7%).
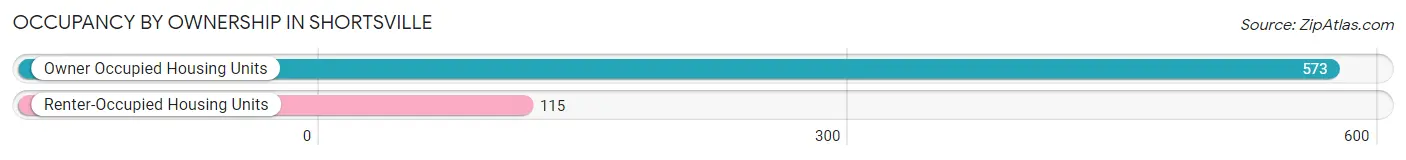
| Occupancy | # Housing Units | % Housing Units |
| Owner Occupied Housing Units | 573 | 83.3% |
| Renter-Occupied Housing Units | 115 | 16.7% |
| Total Occupied Housing Units | 688 | 100.0% |
Occupancy by Household Size in Shortsville
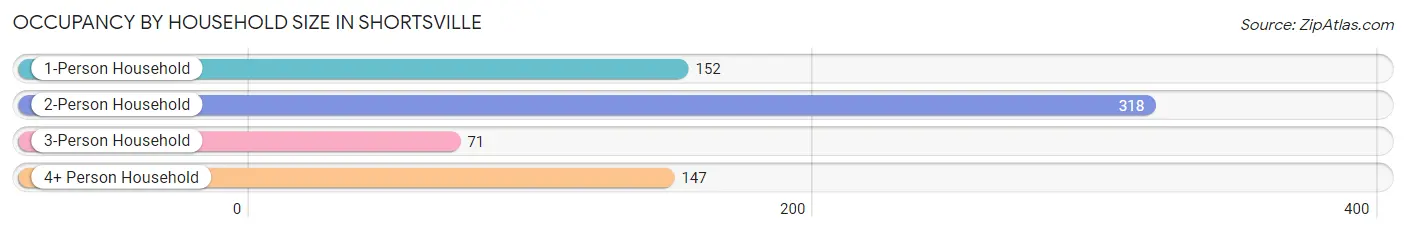
| Household Size | # Housing Units | % Housing Units |
| 1-Person Household | 152 | 22.1% |
| 2-Person Household | 318 | 46.2% |
| 3-Person Household | 71 | 10.3% |
| 4+ Person Household | 147 | 21.4% |
| Total Housing Units | 688 | 100.0% |
Occupancy by Ownership by Household Size in Shortsville
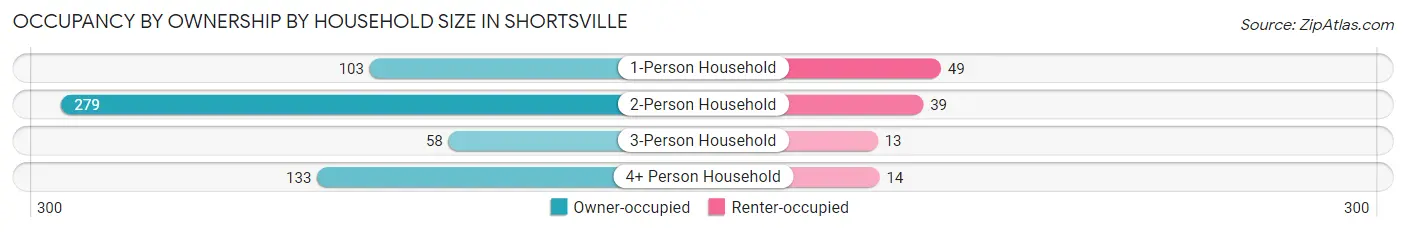
| Household Size | Owner-occupied | Renter-occupied |
| 1-Person Household | 103 (67.8%) | 49 (32.2%) |
| 2-Person Household | 279 (87.7%) | 39 (12.3%) |
| 3-Person Household | 58 (81.7%) | 13 (18.3%) |
| 4+ Person Household | 133 (90.5%) | 14 (9.5%) |
| Total Housing Units | 573 (83.3%) | 115 (16.7%) |
Occupancy by Educational Attainment in Shortsville
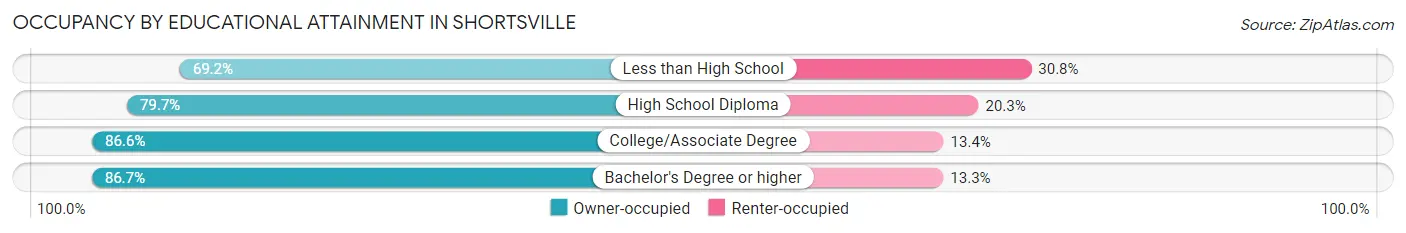
| Household Size | Owner-occupied | Renter-occupied |
| Less than High School | 36 (69.2%) | 16 (30.8%) |
| High School Diploma | 161 (79.7%) | 41 (20.3%) |
| College/Associate Degree | 233 (86.6%) | 36 (13.4%) |
| Bachelor's Degree or higher | 143 (86.7%) | 22 (13.3%) |
Occupancy by Age of Householder in Shortsville
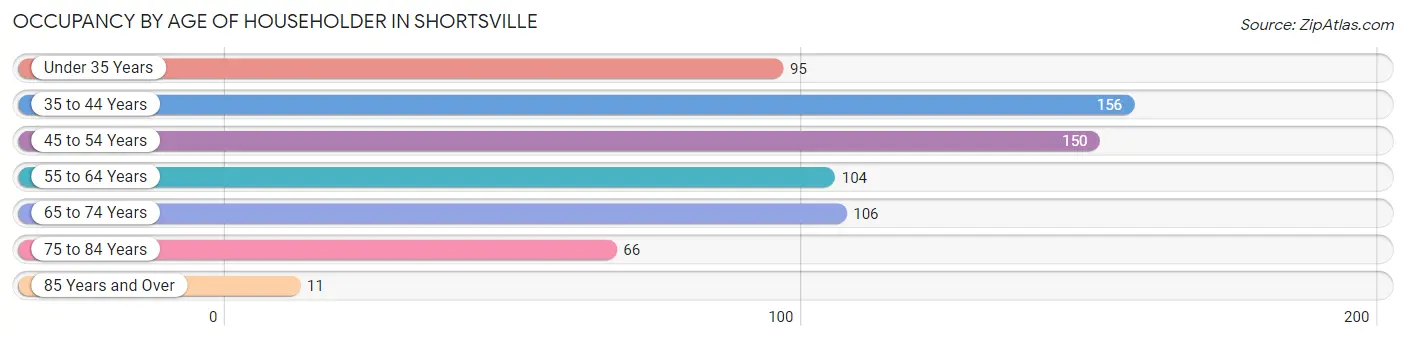
| Age Bracket | # Households | % Households |
| Under 35 Years | 95 | 13.8% |
| 35 to 44 Years | 156 | 22.7% |
| 45 to 54 Years | 150 | 21.8% |
| 55 to 64 Years | 104 | 15.1% |
| 65 to 74 Years | 106 | 15.4% |
| 75 to 84 Years | 66 | 9.6% |
| 85 Years and Over | 11 | 1.6% |
| Total | 688 | 100.0% |
Housing Finances in Shortsville
Median Income by Occupancy in Shortsville
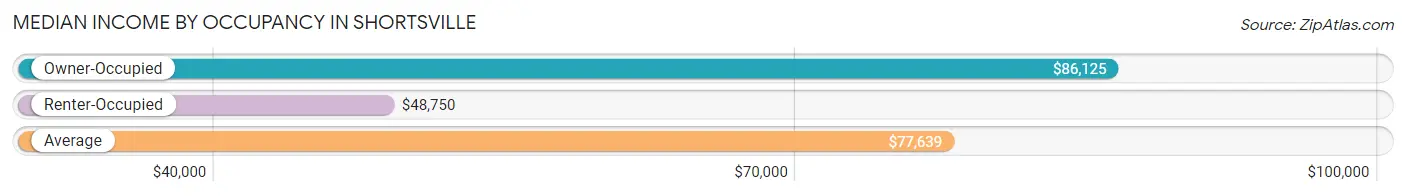
| Occupancy Type | # Households | Median Income |
| Owner-Occupied | 573 (83.3%) | $86,125 |
| Renter-Occupied | 115 (16.7%) | $48,750 |
| Average | 688 (100.0%) | $77,639 |
Occupancy by Householder Income Bracket in Shortsville
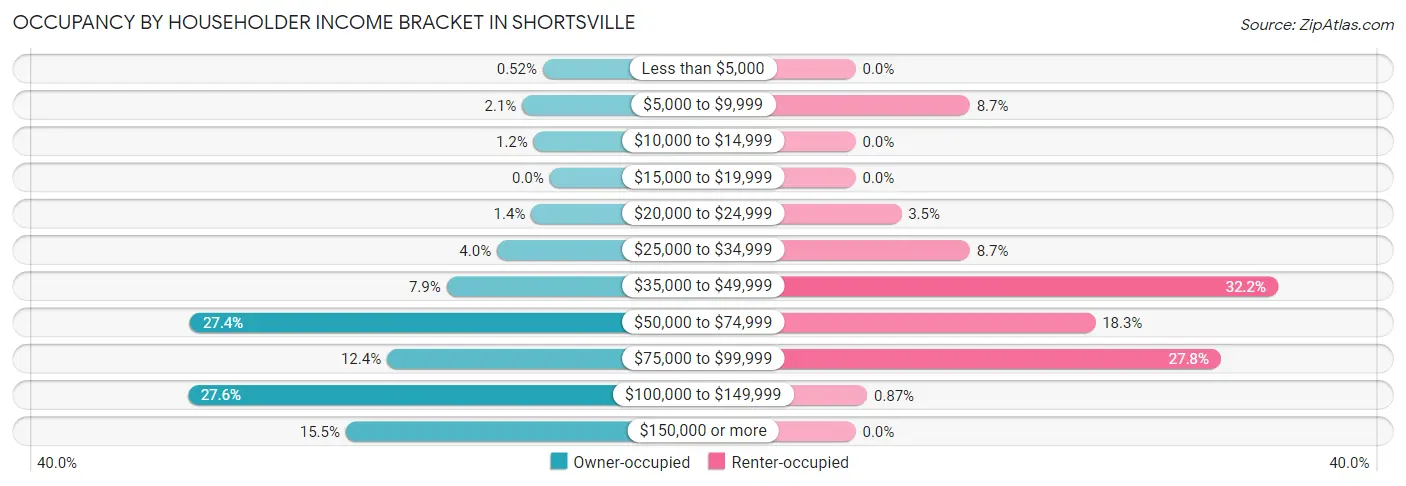
| Income Bracket | Owner-occupied | Renter-occupied |
| Less than $5,000 | 3 (0.5%) | 0 (0.0%) |
| $5,000 to $9,999 | 12 (2.1%) | 10 (8.7%) |
| $10,000 to $14,999 | 7 (1.2%) | 0 (0.0%) |
| $15,000 to $19,999 | 0 (0.0%) | 0 (0.0%) |
| $20,000 to $24,999 | 8 (1.4%) | 4 (3.5%) |
| $25,000 to $34,999 | 23 (4.0%) | 10 (8.7%) |
| $35,000 to $49,999 | 45 (7.9%) | 37 (32.2%) |
| $50,000 to $74,999 | 157 (27.4%) | 21 (18.3%) |
| $75,000 to $99,999 | 71 (12.4%) | 32 (27.8%) |
| $100,000 to $149,999 | 158 (27.6%) | 1 (0.9%) |
| $150,000 or more | 89 (15.5%) | 0 (0.0%) |
| Total | 573 (100.0%) | 115 (100.0%) |
Monthly Housing Cost Tiers in Shortsville
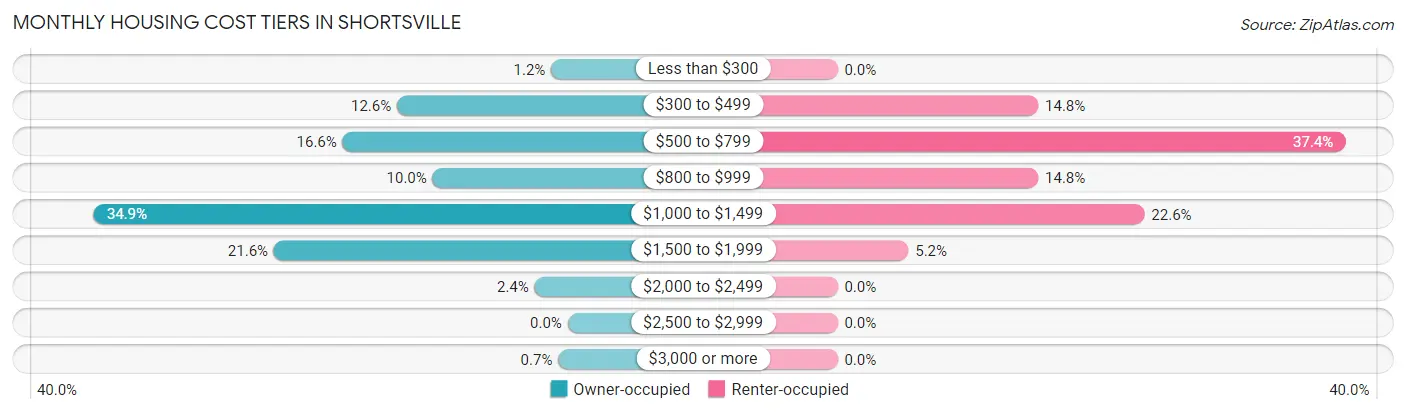
| Monthly Cost | Owner-occupied | Renter-occupied |
| Less than $300 | 7 (1.2%) | 0 (0.0%) |
| $300 to $499 | 72 (12.6%) | 17 (14.8%) |
| $500 to $799 | 95 (16.6%) | 43 (37.4%) |
| $800 to $999 | 57 (10.0%) | 17 (14.8%) |
| $1,000 to $1,499 | 200 (34.9%) | 26 (22.6%) |
| $1,500 to $1,999 | 124 (21.6%) | 6 (5.2%) |
| $2,000 to $2,499 | 14 (2.4%) | 0 (0.0%) |
| $2,500 to $2,999 | 0 (0.0%) | 0 (0.0%) |
| $3,000 or more | 4 (0.7%) | 0 (0.0%) |
| Total | 573 (100.0%) | 115 (100.0%) |
Physical Housing Characteristics in Shortsville
Housing Structures in Shortsville
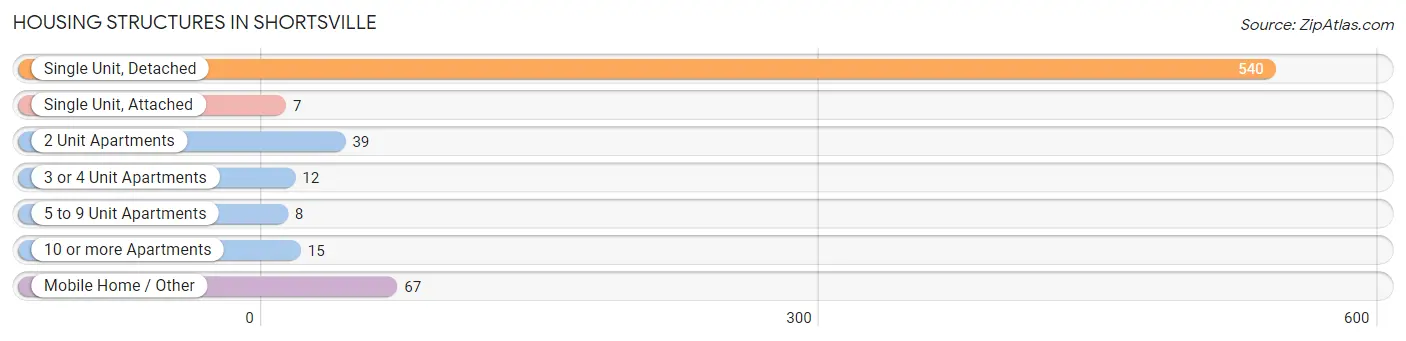
| Structure Type | # Housing Units | % Housing Units |
| Single Unit, Detached | 540 | 78.5% |
| Single Unit, Attached | 7 | 1.0% |
| 2 Unit Apartments | 39 | 5.7% |
| 3 or 4 Unit Apartments | 12 | 1.7% |
| 5 to 9 Unit Apartments | 8 | 1.2% |
| 10 or more Apartments | 15 | 2.2% |
| Mobile Home / Other | 67 | 9.7% |
| Total | 688 | 100.0% |
Housing Structures by Occupancy in Shortsville
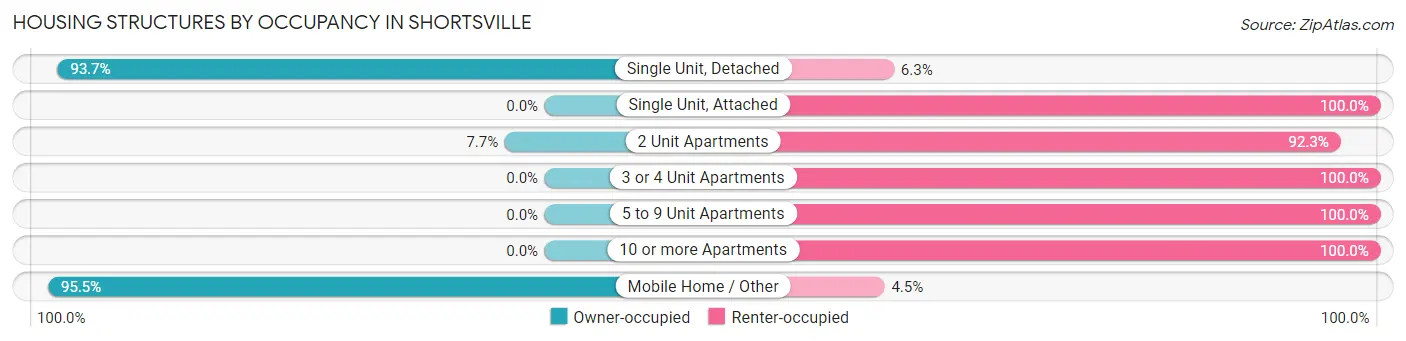
| Structure Type | Owner-occupied | Renter-occupied |
| Single Unit, Detached | 506 (93.7%) | 34 (6.3%) |
| Single Unit, Attached | 0 (0.0%) | 7 (100.0%) |
| 2 Unit Apartments | 3 (7.7%) | 36 (92.3%) |
| 3 or 4 Unit Apartments | 0 (0.0%) | 12 (100.0%) |
| 5 to 9 Unit Apartments | 0 (0.0%) | 8 (100.0%) |
| 10 or more Apartments | 0 (0.0%) | 15 (100.0%) |
| Mobile Home / Other | 64 (95.5%) | 3 (4.5%) |
| Total | 573 (83.3%) | 115 (16.7%) |
Housing Structures by Number of Rooms in Shortsville
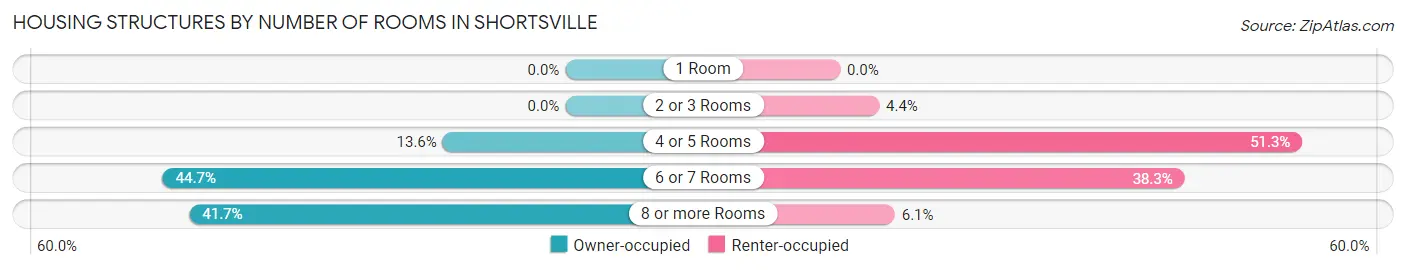
| Number of Rooms | Owner-occupied | Renter-occupied |
| 1 Room | 0 (0.0%) | 0 (0.0%) |
| 2 or 3 Rooms | 0 (0.0%) | 5 (4.3%) |
| 4 or 5 Rooms | 78 (13.6%) | 59 (51.3%) |
| 6 or 7 Rooms | 256 (44.7%) | 44 (38.3%) |
| 8 or more Rooms | 239 (41.7%) | 7 (6.1%) |
| Total | 573 (100.0%) | 115 (100.0%) |
Housing Structure by Heating Type in Shortsville
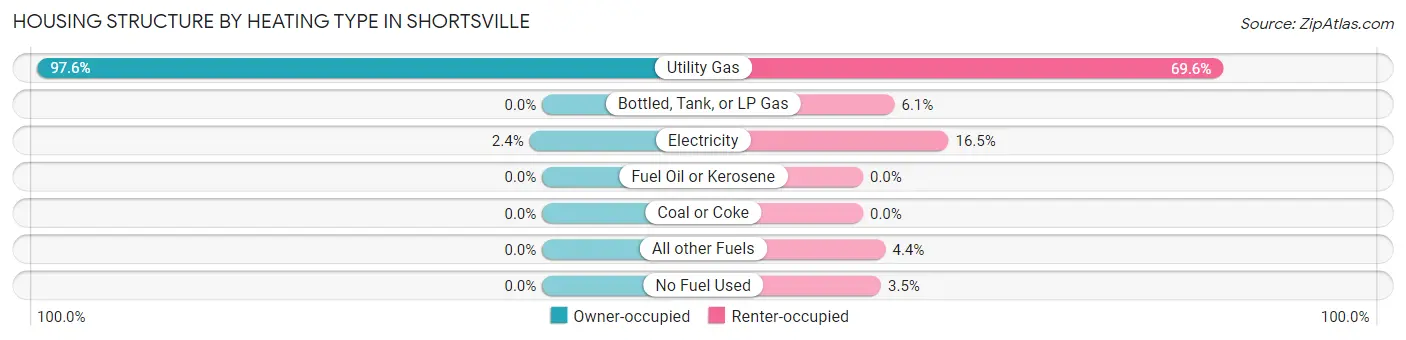
| Heating Type | Owner-occupied | Renter-occupied |
| Utility Gas | 559 (97.6%) | 80 (69.6%) |
| Bottled, Tank, or LP Gas | 0 (0.0%) | 7 (6.1%) |
| Electricity | 14 (2.4%) | 19 (16.5%) |
| Fuel Oil or Kerosene | 0 (0.0%) | 0 (0.0%) |
| Coal or Coke | 0 (0.0%) | 0 (0.0%) |
| All other Fuels | 0 (0.0%) | 5 (4.3%) |
| No Fuel Used | 0 (0.0%) | 4 (3.5%) |
| Total | 573 (100.0%) | 115 (100.0%) |
Household Vehicle Usage in Shortsville
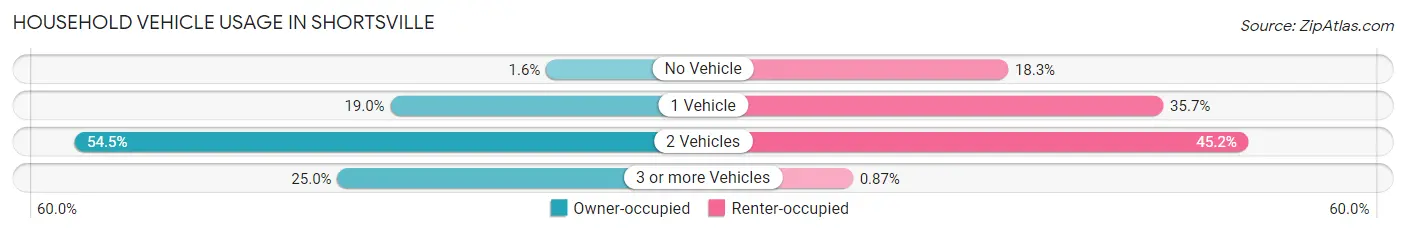
| Vehicles per Household | Owner-occupied | Renter-occupied |
| No Vehicle | 9 (1.6%) | 21 (18.3%) |
| 1 Vehicle | 109 (19.0%) | 41 (35.6%) |
| 2 Vehicles | 312 (54.4%) | 52 (45.2%) |
| 3 or more Vehicles | 143 (25.0%) | 1 (0.9%) |
| Total | 573 (100.0%) | 115 (100.0%) |
Real Estate & Mortgages in Shortsville
Real Estate and Mortgage Overview in Shortsville
| Characteristic | Without Mortgage | With Mortgage |
| Housing Units | 179 | 394 |
| Median Property Value | $103,800 | $144,900 |
| Median Household Income | $63,516 | $83 |
| Monthly Housing Costs | $596 | $4 |
| Real Estate Taxes | $3,156 | $7 |
Property Value by Mortgage Status in Shortsville
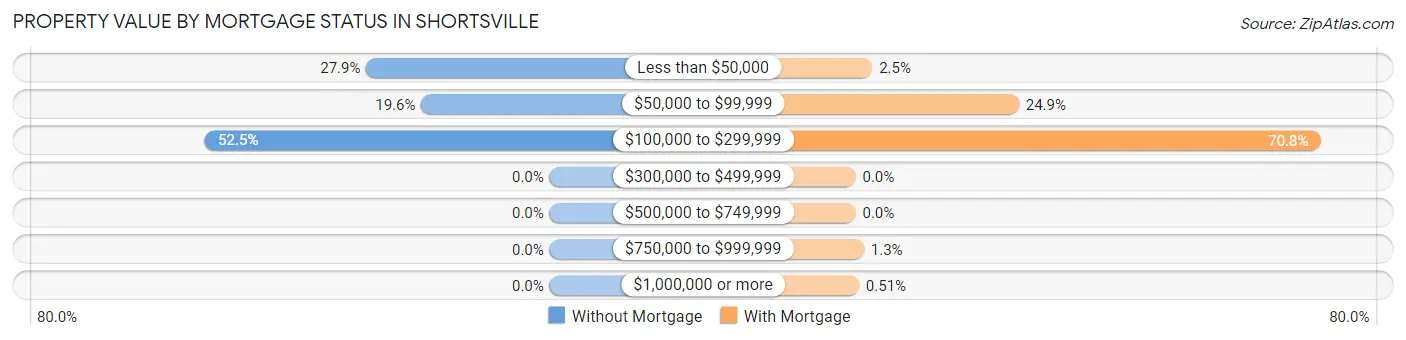
| Property Value | Without Mortgage | With Mortgage |
| Less than $50,000 | 50 (27.9%) | 10 (2.5%) |
| $50,000 to $99,999 | 35 (19.6%) | 98 (24.9%) |
| $100,000 to $299,999 | 94 (52.5%) | 279 (70.8%) |
| $300,000 to $499,999 | 0 (0.0%) | 0 (0.0%) |
| $500,000 to $749,999 | 0 (0.0%) | 0 (0.0%) |
| $750,000 to $999,999 | 0 (0.0%) | 5 (1.3%) |
| $1,000,000 or more | 0 (0.0%) | 2 (0.5%) |
| Total | 179 (100.0%) | 394 (100.0%) |
Household Income by Mortgage Status in Shortsville
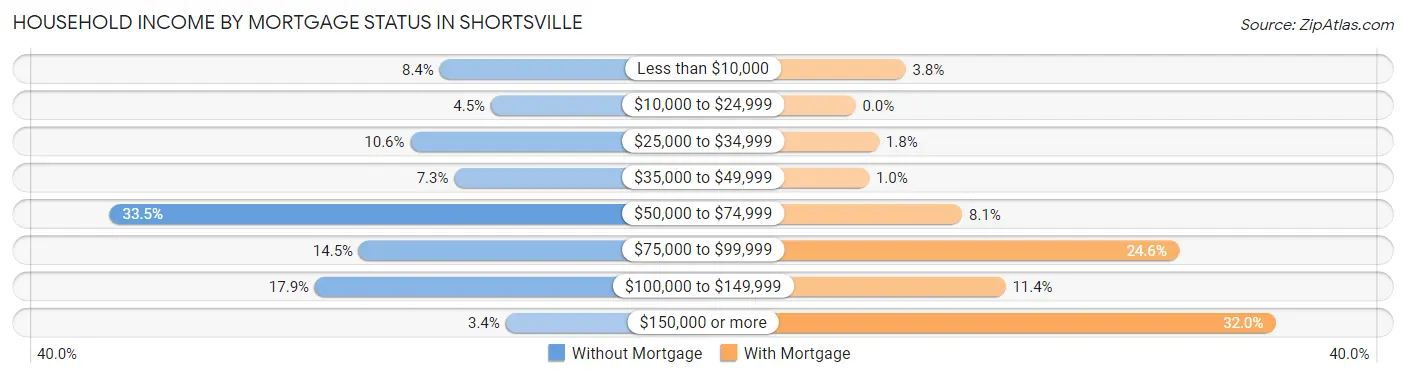
| Household Income | Without Mortgage | With Mortgage |
| Less than $10,000 | 15 (8.4%) | 15 (3.8%) |
| $10,000 to $24,999 | 8 (4.5%) | 0 (0.0%) |
| $25,000 to $34,999 | 19 (10.6%) | 7 (1.8%) |
| $35,000 to $49,999 | 13 (7.3%) | 4 (1.0%) |
| $50,000 to $74,999 | 60 (33.5%) | 32 (8.1%) |
| $75,000 to $99,999 | 26 (14.5%) | 97 (24.6%) |
| $100,000 to $149,999 | 32 (17.9%) | 45 (11.4%) |
| $150,000 or more | 6 (3.4%) | 126 (32.0%) |
| Total | 179 (100.0%) | 394 (100.0%) |
Property Value to Household Income Ratio in Shortsville
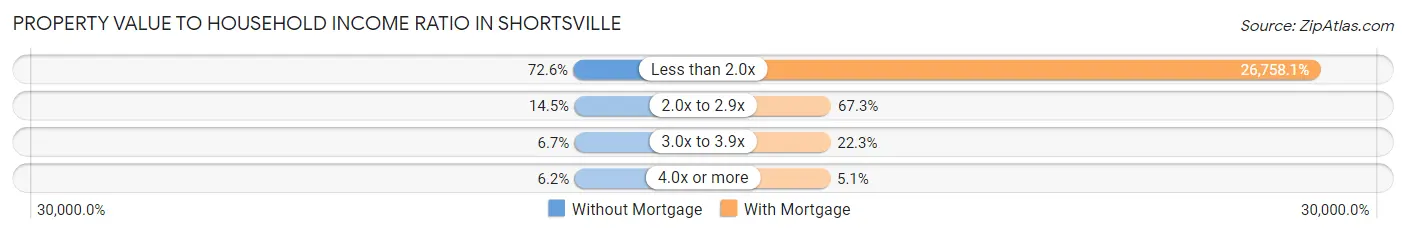
| Value-to-Income Ratio | Without Mortgage | With Mortgage |
| Less than 2.0x | 130 (72.6%) | 105,427 (26,758.1%) |
| 2.0x to 2.9x | 26 (14.5%) | 265 (67.3%) |
| 3.0x to 3.9x | 12 (6.7%) | 88 (22.3%) |
| 4.0x or more | 11 (6.1%) | 20 (5.1%) |
| Total | 179 (100.0%) | 394 (100.0%) |
Real Estate Taxes by Mortgage Status in Shortsville
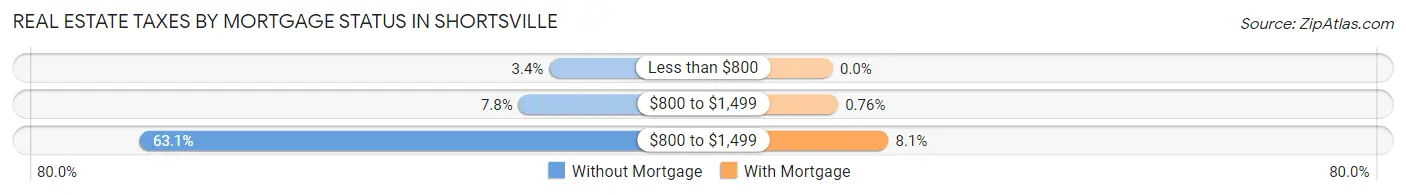
| Property Taxes | Without Mortgage | With Mortgage |
| Less than $800 | 6 (3.4%) | 0 (0.0%) |
| $800 to $1,499 | 14 (7.8%) | 3 (0.8%) |
| $800 to $1,499 | 113 (63.1%) | 32 (8.1%) |
| Total | 179 (100.0%) | 394 (100.0%) |
Health & Disability in Shortsville
Health Insurance Coverage by Age in Shortsville
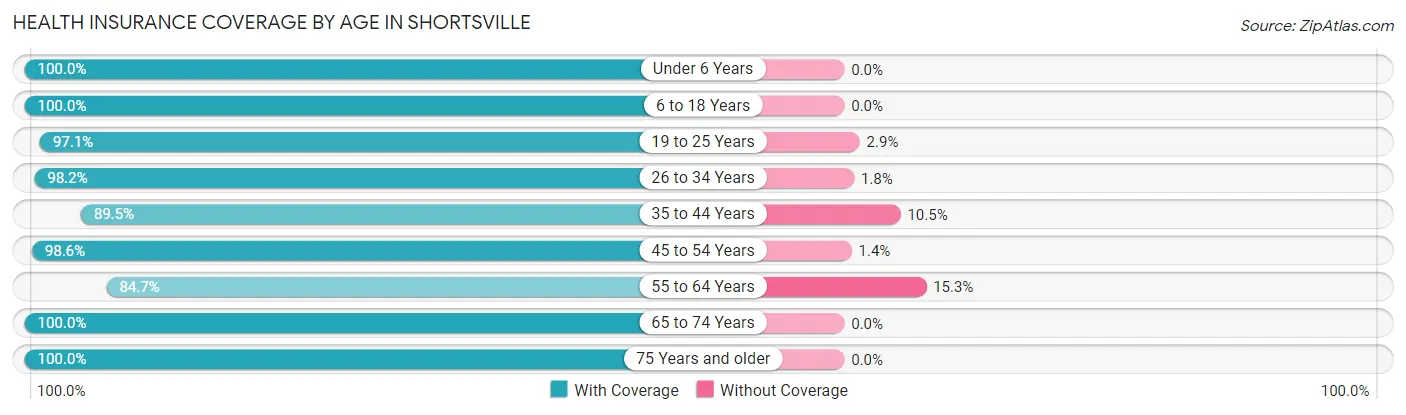
| Age Bracket | With Coverage | Without Coverage |
| Under 6 Years | 87 (100.0%) | 0 (0.0%) |
| 6 to 18 Years | 303 (100.0%) | 0 (0.0%) |
| 19 to 25 Years | 102 (97.1%) | 3 (2.9%) |
| 26 to 34 Years | 163 (98.2%) | 3 (1.8%) |
| 35 to 44 Years | 188 (89.5%) | 22 (10.5%) |
| 45 to 54 Years | 362 (98.6%) | 5 (1.4%) |
| 55 to 64 Years | 172 (84.7%) | 31 (15.3%) |
| 65 to 74 Years | 166 (100.0%) | 0 (0.0%) |
| 75 Years and older | 138 (100.0%) | 0 (0.0%) |
| Total | 1,681 (96.3%) | 64 (3.7%) |
Health Insurance Coverage by Citizenship Status in Shortsville
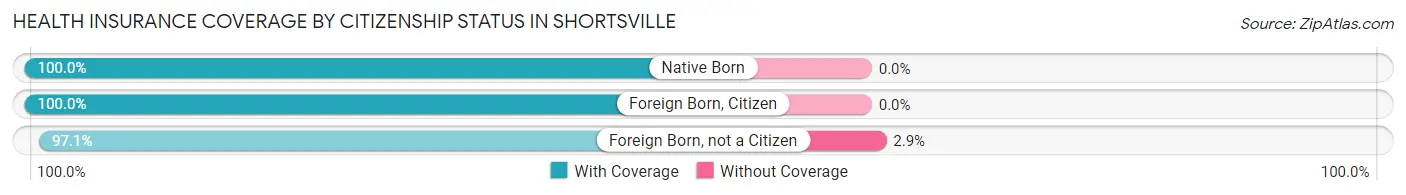
| Citizenship Status | With Coverage | Without Coverage |
| Native Born | 87 (100.0%) | 0 (0.0%) |
| Foreign Born, Citizen | 303 (100.0%) | 0 (0.0%) |
| Foreign Born, not a Citizen | 102 (97.1%) | 3 (2.9%) |
Health Insurance Coverage by Household Income in Shortsville
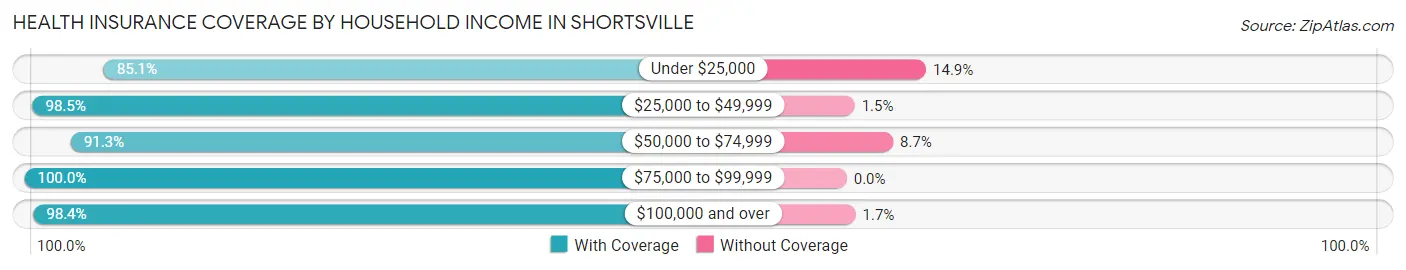
| Household Income | With Coverage | Without Coverage |
| Under $25,000 | 63 (85.1%) | 11 (14.9%) |
| $25,000 to $49,999 | 199 (98.5%) | 3 (1.5%) |
| $50,000 to $74,999 | 390 (91.3%) | 37 (8.7%) |
| $75,000 to $99,999 | 244 (100.0%) | 0 (0.0%) |
| $100,000 and over | 777 (98.4%) | 13 (1.7%) |
Public vs Private Health Insurance Coverage by Age in Shortsville
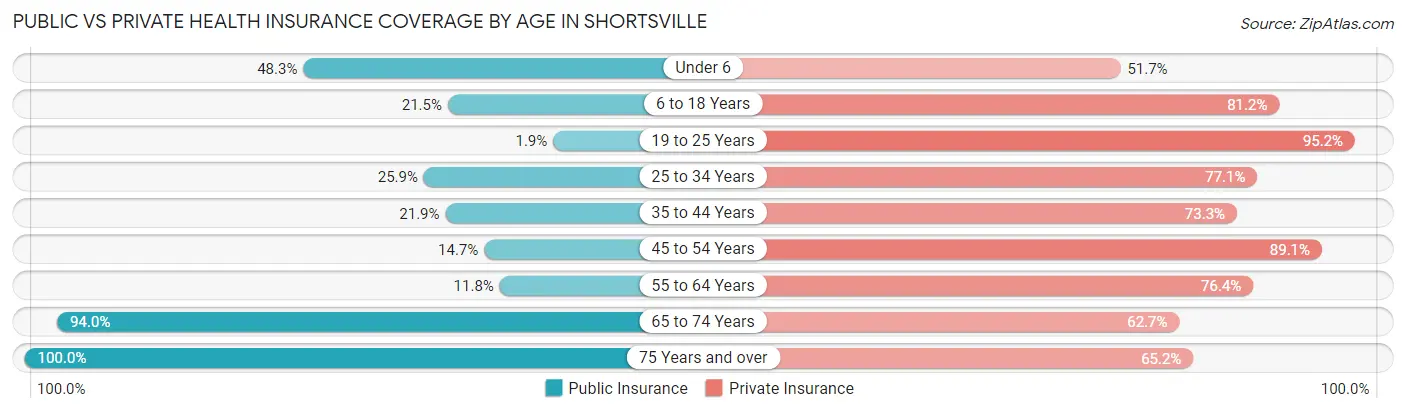
| Age Bracket | Public Insurance | Private Insurance |
| Under 6 | 42 (48.3%) | 45 (51.7%) |
| 6 to 18 Years | 65 (21.4%) | 246 (81.2%) |
| 19 to 25 Years | 2 (1.9%) | 100 (95.2%) |
| 25 to 34 Years | 43 (25.9%) | 128 (77.1%) |
| 35 to 44 Years | 46 (21.9%) | 154 (73.3%) |
| 45 to 54 Years | 54 (14.7%) | 327 (89.1%) |
| 55 to 64 Years | 24 (11.8%) | 155 (76.3%) |
| 65 to 74 Years | 156 (94.0%) | 104 (62.6%) |
| 75 Years and over | 138 (100.0%) | 90 (65.2%) |
| Total | 570 (32.7%) | 1,349 (77.3%) |
Disability Status by Sex by Age in Shortsville
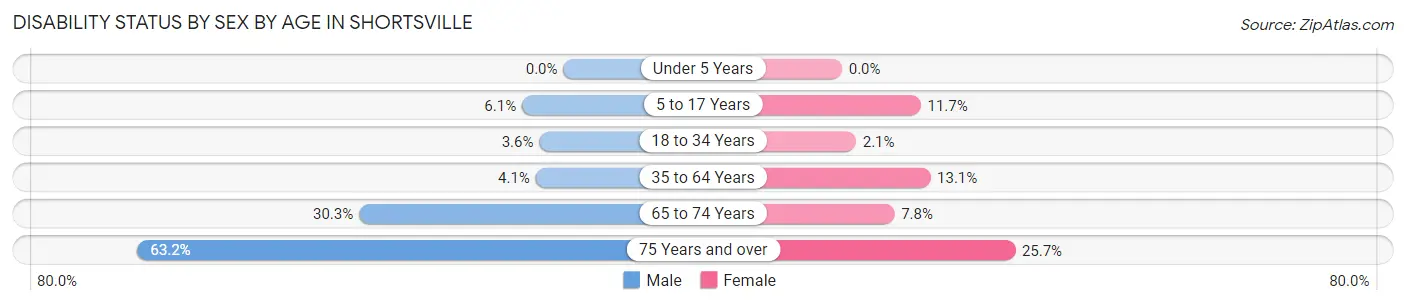
| Age Bracket | Male | Female |
| Under 5 Years | 0 (0.0%) | 0 (0.0%) |
| 5 to 17 Years | 14 (6.1%) | 9 (11.7%) |
| 18 to 34 Years | 5 (3.6%) | 3 (2.1%) |
| 35 to 64 Years | 17 (4.1%) | 48 (13.1%) |
| 65 to 74 Years | 27 (30.3%) | 6 (7.8%) |
| 75 Years and over | 43 (63.2%) | 18 (25.7%) |
Disability Class by Sex by Age in Shortsville
Disability Class: Hearing Difficulty
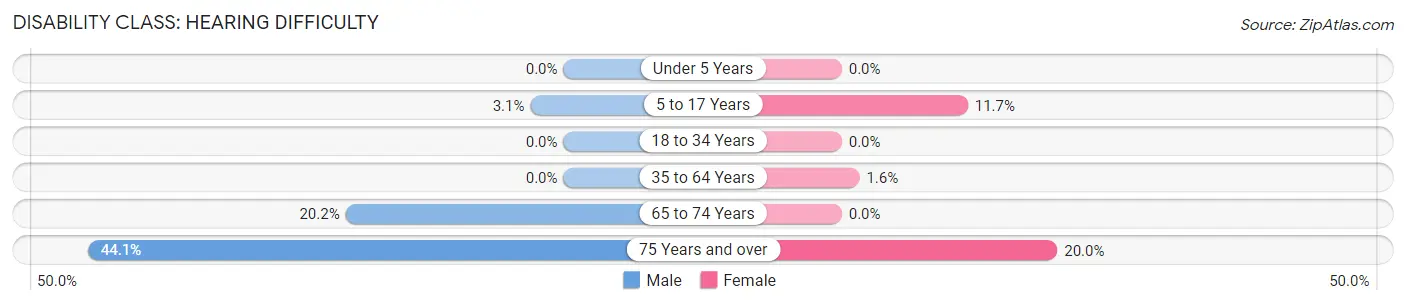
| Age Bracket | Male | Female |
| Under 5 Years | 0 (0.0%) | 0 (0.0%) |
| 5 to 17 Years | 7 (3.1%) | 9 (11.7%) |
| 18 to 34 Years | 0 (0.0%) | 0 (0.0%) |
| 35 to 64 Years | 0 (0.0%) | 6 (1.6%) |
| 65 to 74 Years | 18 (20.2%) | 0 (0.0%) |
| 75 Years and over | 30 (44.1%) | 14 (20.0%) |
Disability Class: Vision Difficulty
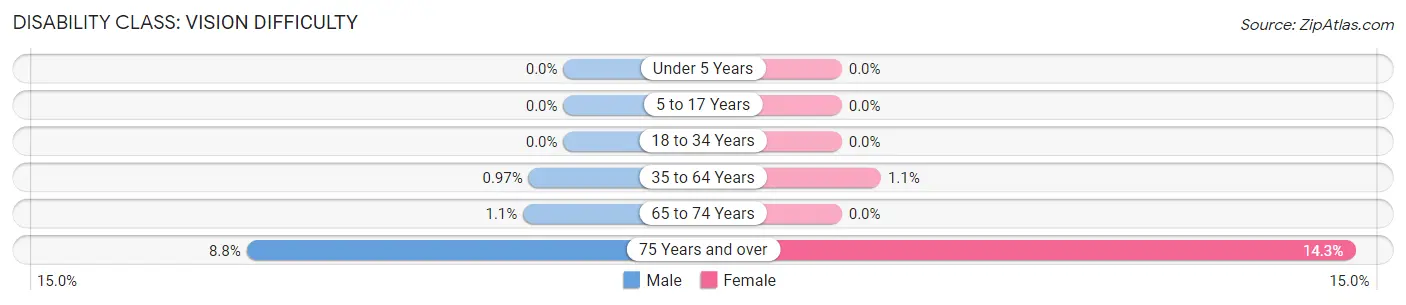
| Age Bracket | Male | Female |
| Under 5 Years | 0 (0.0%) | 0 (0.0%) |
| 5 to 17 Years | 0 (0.0%) | 0 (0.0%) |
| 18 to 34 Years | 0 (0.0%) | 0 (0.0%) |
| 35 to 64 Years | 4 (1.0%) | 4 (1.1%) |
| 65 to 74 Years | 1 (1.1%) | 0 (0.0%) |
| 75 Years and over | 6 (8.8%) | 10 (14.3%) |
Disability Class: Cognitive Difficulty
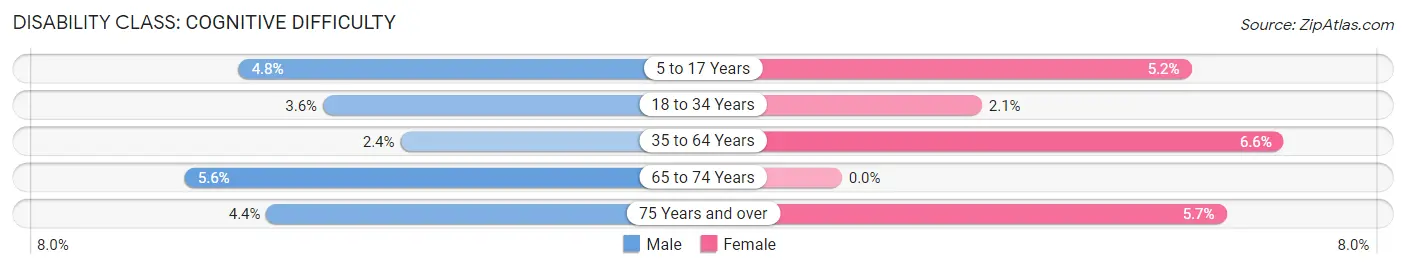
| Age Bracket | Male | Female |
| 5 to 17 Years | 11 (4.8%) | 4 (5.2%) |
| 18 to 34 Years | 5 (3.6%) | 3 (2.1%) |
| 35 to 64 Years | 10 (2.4%) | 24 (6.6%) |
| 65 to 74 Years | 5 (5.6%) | 0 (0.0%) |
| 75 Years and over | 3 (4.4%) | 4 (5.7%) |
Disability Class: Ambulatory Difficulty
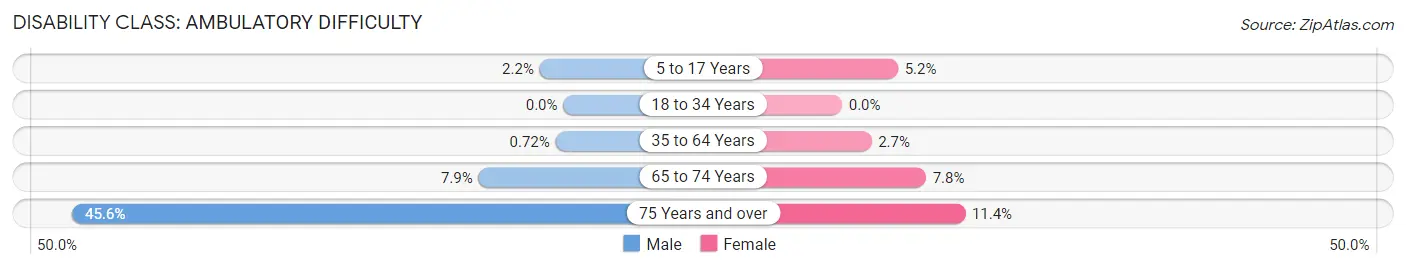
| Age Bracket | Male | Female |
| 5 to 17 Years | 5 (2.2%) | 4 (5.2%) |
| 18 to 34 Years | 0 (0.0%) | 0 (0.0%) |
| 35 to 64 Years | 3 (0.7%) | 10 (2.7%) |
| 65 to 74 Years | 7 (7.9%) | 6 (7.8%) |
| 75 Years and over | 31 (45.6%) | 8 (11.4%) |
Disability Class: Self-Care Difficulty
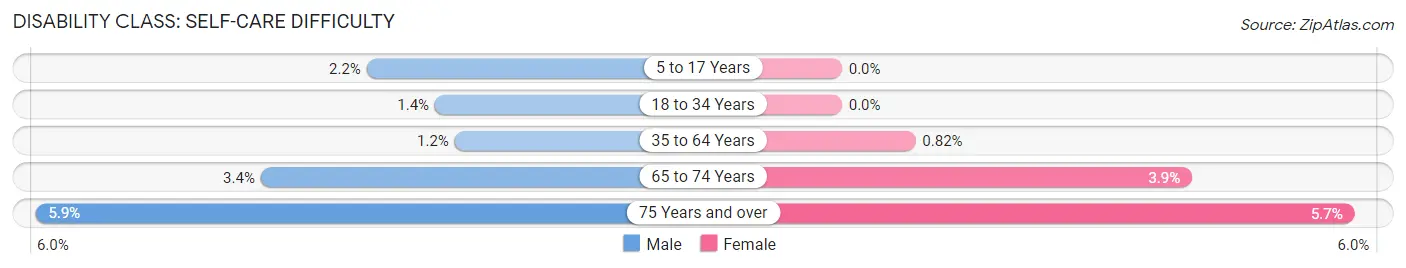
| Age Bracket | Male | Female |
| 5 to 17 Years | 5 (2.2%) | 0 (0.0%) |
| 18 to 34 Years | 2 (1.4%) | 0 (0.0%) |
| 35 to 64 Years | 5 (1.2%) | 3 (0.8%) |
| 65 to 74 Years | 3 (3.4%) | 3 (3.9%) |
| 75 Years and over | 4 (5.9%) | 4 (5.7%) |
Technology Access in Shortsville
Computing Device Access in Shortsville
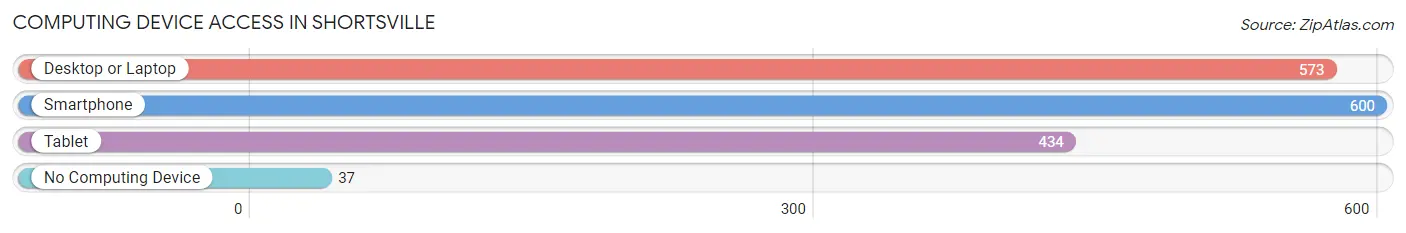
| Device Type | # Households | % Households |
| Desktop or Laptop | 573 | 83.3% |
| Smartphone | 600 | 87.2% |
| Tablet | 434 | 63.1% |
| No Computing Device | 37 | 5.4% |
| Total | 688 | 100.0% |
Internet Access in Shortsville
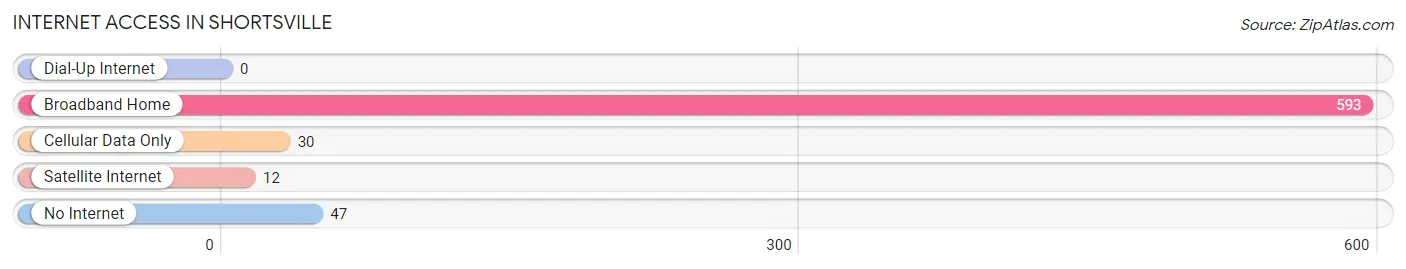
| Internet Type | # Households | % Households |
| Dial-Up Internet | 0 | 0.0% |
| Broadband Home | 593 | 86.2% |
| Cellular Data Only | 30 | 4.4% |
| Satellite Internet | 12 | 1.7% |
| No Internet | 47 | 6.8% |
| Total | 688 | 100.0% |
Shortsville Summary
Shortsville is a small village located in the town of Manchester, Ontario County, New York. It is situated on the east side of the Canandaigua Lake, about 10 miles south of the city of Canandaigua. The village is part of the Finger Lakes region of New York and is home to a population of approximately 1,500 people.
History
Shortsville was first settled in 1789 by a group of settlers from Connecticut. The village was originally known as “Short’s Corners” after the first settler, John Short. The village was officially incorporated in 1827 and was renamed Shortsville in 1836.
In the 19th century, Shortsville was a thriving agricultural community. The village was home to several mills, including a grist mill, a saw mill, and a woolen mill. The village also had a tannery, a blacksmith shop, and a carriage shop.
In the early 20th century, Shortsville began to experience a decline in its economy. The mills and other businesses began to close, and the population began to decline. In the 1950s, the village was revitalized with the construction of a new school and the opening of a new industrial park.
Geography
Shortsville is located in the Finger Lakes region of New York. The village is situated on the east side of Canandaigua Lake, about 10 miles south of the city of Canandaigua. The village is surrounded by rolling hills and farmland.
The village is located at the intersection of two major highways, New York State Route 21 and New York State Route 96. The nearest major airport is the Greater Rochester International Airport, located about 40 miles away.
Economy
Shortsville’s economy is largely based on agriculture and tourism. The village is home to several farms, including dairy farms, vegetable farms, and fruit farms. The village also has several wineries and breweries, as well as a number of restaurants and shops.
The village is also home to several small businesses, including a hardware store, a grocery store, and a pharmacy. The village also has a post office, a bank, and a library.
Demographics
As of the 2010 census, the population of Shortsville was 1,500. The racial makeup of the village was 97.2% White, 0.7% African American, 0.3% Native American, 0.3% Asian, 0.2% from other races, and 1.5% from two or more races. Hispanic or Latino of any race were 1.3% of the population.
The median household income in Shortsville was $45,000, and the median family income was $50,000. The per capita income for the village was $20,000. About 8.5% of families and 10.2% of the population were below the poverty line, including 14.3% of those under age 18 and 5.3% of those age 65 or over.
Common Questions
What is Per Capita Income in Shortsville?
Per Capita income in Shortsville is $41,598.
What is the Median Family Income in Shortsville?
Median Family Income in Shortsville is $90,096.
What is the Median Household income in Shortsville?
Median Household Income in Shortsville is $77,639.
What is Income or Wage Gap in Shortsville?
Income or Wage Gap in Shortsville is 6.6%.
Women in Shortsville earn 93.4 cents for every dollar earned by a man.
What is Inequality or Gini Index in Shortsville?
Inequality or Gini Index in Shortsville is 0.41.
What is the Total Population of Shortsville?
Total Population of Shortsville is 1,745.
What is the Total Male Population of Shortsville?
Total Male Population of Shortsville is 991.
What is the Total Female Population of Shortsville?
Total Female Population of Shortsville is 754.
What is the Ratio of Males per 100 Females in Shortsville?
There are 131.43 Males per 100 Females in Shortsville.
What is the Ratio of Females per 100 Males in Shortsville?
There are 76.08 Females per 100 Males in Shortsville.
What is the Median Population Age in Shortsville?
Median Population Age in Shortsville is 45.0 Years.
What is the Average Family Size in Shortsville
Average Family Size in Shortsville is 3.0 People.
What is the Average Household Size in Shortsville
Average Household Size in Shortsville is 2.5 People.
How Large is the Labor Force in Shortsville?
There are 1,000 People in the Labor Forcein in Shortsville.
What is the Percentage of People in the Labor Force in Shortsville?
71.5% of People are in the Labor Force in Shortsville.
What is the Unemployment Rate in Shortsville?
Unemployment Rate in Shortsville is 1.3%.