Zip Codes with the Largest Hungarian Community in New York
RELATED REPORTS & OPTIONS
Hungarian
New York
Compare Zip Codes
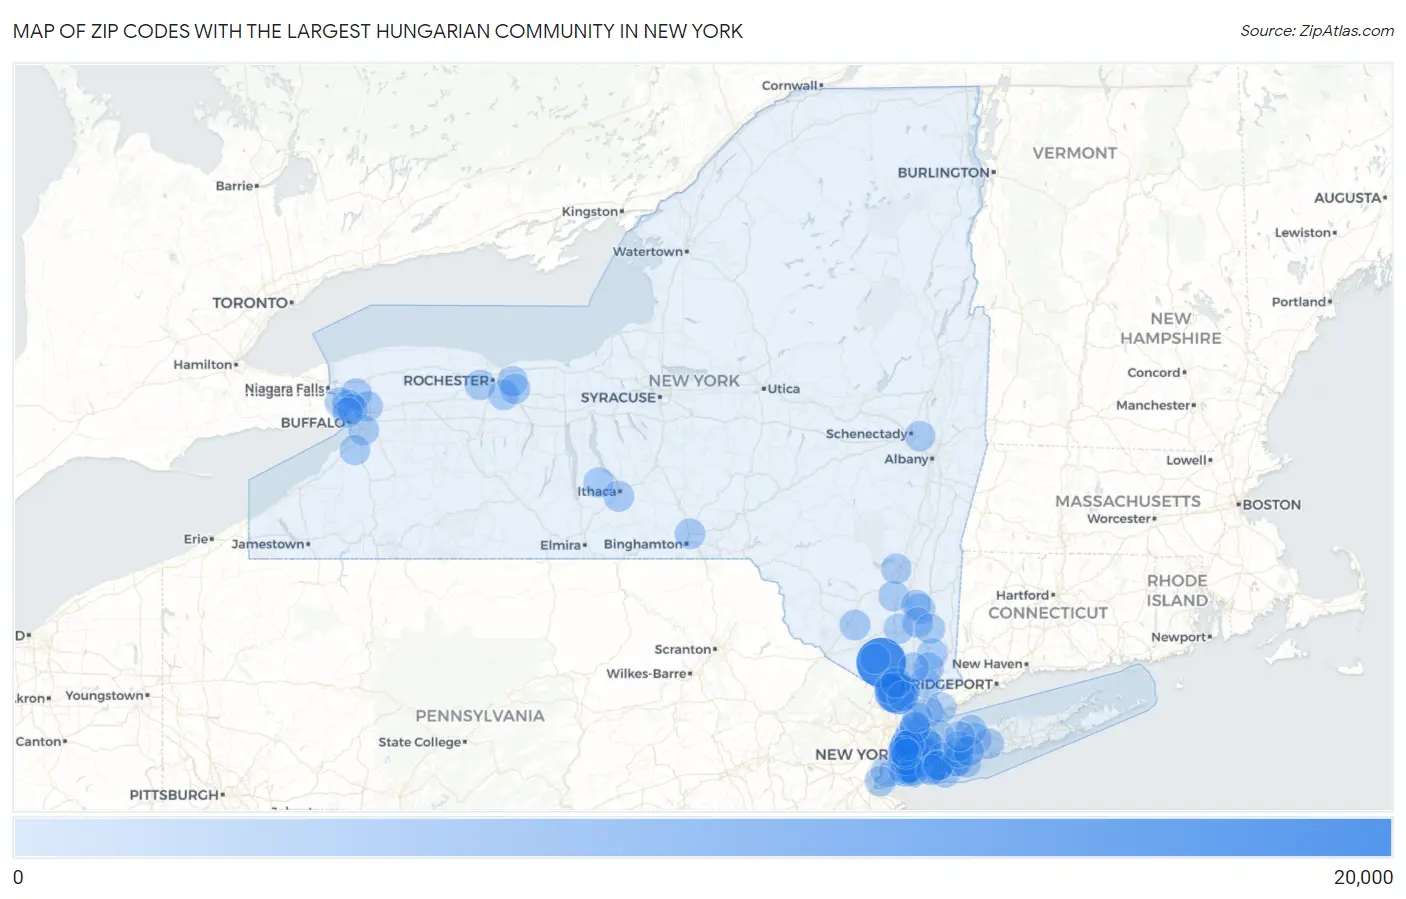
Map of Zip Codes with the Largest Hungarian Community in New York
0
20,000
Zip Codes with the Largest Hungarian Community in New York
| Zip Code | Hungarian | vs State | vs National | |
| 1. | 10950 | 15,523 | 147,442(10.53%)#1 | 1,294,135(1.20%)#1 |
| 2. | 10977 | 8,489 | 147,442(5.76%)#2 | 1,294,135(0.66%)#2 |
| 3. | 10952 | 8,142 | 147,442(5.52%)#3 | 1,294,135(0.63%)#3 |
| 4. | 11205 | 5,521 | 147,442(3.74%)#4 | 1,294,135(0.43%)#4 |
| 5. | 11206 | 4,840 | 147,442(3.28%)#5 | 1,294,135(0.37%)#5 |
| 6. | 11219 | 3,687 | 147,442(2.50%)#6 | 1,294,135(0.28%)#7 |
| 7. | 11211 | 3,427 | 147,442(2.32%)#7 | 1,294,135(0.26%)#8 |
| 8. | 11249 | 2,818 | 147,442(1.91%)#8 | 1,294,135(0.22%)#9 |
| 9. | 11204 | 1,607 | 147,442(1.09%)#9 | 1,294,135(0.12%)#20 |
| 10. | 11218 | 1,575 | 147,442(1.07%)#10 | 1,294,135(0.12%)#21 |
| 11. | 11230 | 1,133 | 147,442(0.77%)#11 | 1,294,135(0.09%)#40 |
| 12. | 10025 | 1,022 | 147,442(0.69%)#12 | 1,294,135(0.08%)#53 |
| 13. | 11559 | 1,019 | 147,442(0.69%)#13 | 1,294,135(0.08%)#55 |
| 14. | 10023 | 800 | 147,442(0.54%)#14 | 1,294,135(0.06%)#91 |
| 15. | 10024 | 795 | 147,442(0.54%)#15 | 1,294,135(0.06%)#94 |
| 16. | 10128 | 712 | 147,442(0.48%)#16 | 1,294,135(0.06%)#121 |
| 17. | 10011 | 709 | 147,442(0.48%)#17 | 1,294,135(0.05%)#123 |
| 18. | 10009 | 707 | 147,442(0.48%)#18 | 1,294,135(0.05%)#124 |
| 19. | 12721 | 673 | 147,442(0.46%)#19 | 1,294,135(0.05%)#142 |
| 20. | 10033 | 672 | 147,442(0.46%)#20 | 1,294,135(0.05%)#143 |
| 21. | 14850 | 657 | 147,442(0.45%)#21 | 1,294,135(0.05%)#155 |
| 22. | 11516 | 633 | 147,442(0.43%)#22 | 1,294,135(0.05%)#170 |
| 23. | 14120 | 617 | 147,442(0.42%)#23 | 1,294,135(0.05%)#179 |
| 24. | 10314 | 577 | 147,442(0.39%)#24 | 1,294,135(0.04%)#200 |
| 25. | 11746 | 558 | 147,442(0.38%)#25 | 1,294,135(0.04%)#212 |
| 26. | 10028 | 554 | 147,442(0.38%)#26 | 1,294,135(0.04%)#217 |
| 27. | 11385 | 526 | 147,442(0.36%)#27 | 1,294,135(0.04%)#244 |
| 28. | 11215 | 522 | 147,442(0.35%)#28 | 1,294,135(0.04%)#248 |
| 29. | 11566 | 515 | 147,442(0.35%)#29 | 1,294,135(0.04%)#258 |
| 30. | 11201 | 505 | 147,442(0.34%)#30 | 1,294,135(0.04%)#272 |
| 31. | 11375 | 494 | 147,442(0.34%)#31 | 1,294,135(0.04%)#281 |
| 32. | 10075 | 488 | 147,442(0.33%)#32 | 1,294,135(0.04%)#287 |
| 33. | 12603 | 484 | 147,442(0.33%)#33 | 1,294,135(0.04%)#292 |
| 34. | 11214 | 479 | 147,442(0.32%)#34 | 1,294,135(0.04%)#300 |
| 35. | 11210 | 479 | 147,442(0.32%)#35 | 1,294,135(0.04%)#301 |
| 36. | 10016 | 475 | 147,442(0.32%)#36 | 1,294,135(0.04%)#313 |
| 37. | 14150 | 466 | 147,442(0.32%)#37 | 1,294,135(0.04%)#326 |
| 38. | 11367 | 463 | 147,442(0.31%)#38 | 1,294,135(0.04%)#331 |
| 39. | 14221 | 458 | 147,442(0.31%)#39 | 1,294,135(0.04%)#337 |
| 40. | 10003 | 444 | 147,442(0.30%)#40 | 1,294,135(0.03%)#357 |
| 41. | 12561 | 435 | 147,442(0.30%)#41 | 1,294,135(0.03%)#369 |
| 42. | 13901 | 408 | 147,442(0.28%)#42 | 1,294,135(0.03%)#425 |
| 43. | 14534 | 404 | 147,442(0.27%)#43 | 1,294,135(0.03%)#434 |
| 44. | 10541 | 404 | 147,442(0.27%)#44 | 1,294,135(0.03%)#435 |
| 45. | 10901 | 396 | 147,442(0.27%)#45 | 1,294,135(0.03%)#454 |
| 46. | 10017 | 377 | 147,442(0.26%)#46 | 1,294,135(0.03%)#498 |
| 47. | 10583 | 373 | 147,442(0.25%)#47 | 1,294,135(0.03%)#507 |
| 48. | 10918 | 372 | 147,442(0.25%)#48 | 1,294,135(0.03%)#513 |
| 49. | 11231 | 370 | 147,442(0.25%)#49 | 1,294,135(0.03%)#517 |
| 50. | 14526 | 367 | 147,442(0.25%)#50 | 1,294,135(0.03%)#529 |
| 51. | 11103 | 365 | 147,442(0.25%)#51 | 1,294,135(0.03%)#531 |
| 52. | 11238 | 356 | 147,442(0.24%)#52 | 1,294,135(0.03%)#555 |
| 53. | 10471 | 354 | 147,442(0.24%)#53 | 1,294,135(0.03%)#562 |
| 54. | 12401 | 353 | 147,442(0.24%)#54 | 1,294,135(0.03%)#567 |
| 55. | 11717 | 347 | 147,442(0.24%)#55 | 1,294,135(0.03%)#585 |
| 56. | 11222 | 347 | 147,442(0.24%)#56 | 1,294,135(0.03%)#586 |
| 57. | 14072 | 347 | 147,442(0.24%)#57 | 1,294,135(0.03%)#588 |
| 58. | 11229 | 345 | 147,442(0.23%)#58 | 1,294,135(0.03%)#595 |
| 59. | 10562 | 345 | 147,442(0.23%)#59 | 1,294,135(0.03%)#596 |
| 60. | 10029 | 343 | 147,442(0.23%)#60 | 1,294,135(0.03%)#599 |
| 61. | 11561 | 337 | 147,442(0.23%)#61 | 1,294,135(0.03%)#626 |
| 62. | 12601 | 333 | 147,442(0.23%)#62 | 1,294,135(0.03%)#641 |
| 63. | 14224 | 333 | 147,442(0.23%)#63 | 1,294,135(0.03%)#642 |
| 64. | 11050 | 333 | 147,442(0.23%)#64 | 1,294,135(0.03%)#646 |
| 65. | 11234 | 327 | 147,442(0.22%)#65 | 1,294,135(0.03%)#667 |
| 66. | 14450 | 327 | 147,442(0.22%)#66 | 1,294,135(0.03%)#671 |
| 67. | 11361 | 327 | 147,442(0.22%)#67 | 1,294,135(0.03%)#673 |
| 68. | 11552 | 327 | 147,442(0.22%)#68 | 1,294,135(0.03%)#674 |
| 69. | 10954 | 325 | 147,442(0.22%)#69 | 1,294,135(0.03%)#680 |
| 70. | 11357 | 324 | 147,442(0.22%)#70 | 1,294,135(0.03%)#682 |
| 71. | 10463 | 321 | 147,442(0.22%)#71 | 1,294,135(0.02%)#692 |
| 72. | 10970 | 320 | 147,442(0.22%)#72 | 1,294,135(0.02%)#703 |
| 73. | 14624 | 317 | 147,442(0.21%)#73 | 1,294,135(0.02%)#721 |
| 74. | 14223 | 311 | 147,442(0.21%)#74 | 1,294,135(0.02%)#744 |
| 75. | 11598 | 310 | 147,442(0.21%)#75 | 1,294,135(0.02%)#748 |
| 76. | 11691 | 306 | 147,442(0.21%)#76 | 1,294,135(0.02%)#762 |
| 77. | 12309 | 304 | 147,442(0.21%)#77 | 1,294,135(0.02%)#772 |
| 78. | 14075 | 301 | 147,442(0.20%)#78 | 1,294,135(0.02%)#783 |
| 79. | 10036 | 300 | 147,442(0.20%)#79 | 1,294,135(0.02%)#792 |
| 80. | 14886 | 300 | 147,442(0.20%)#80 | 1,294,135(0.02%)#793 |
| 81. | 10598 | 294 | 147,442(0.20%)#81 | 1,294,135(0.02%)#810 |
| 82. | 11743 | 293 | 147,442(0.20%)#82 | 1,294,135(0.02%)#812 |
| 83. | 11710 | 291 | 147,442(0.20%)#83 | 1,294,135(0.02%)#826 |
| 84. | 11557 | 278 | 147,442(0.19%)#84 | 1,294,135(0.02%)#901 |
| 85. | 10573 | 276 | 147,442(0.19%)#85 | 1,294,135(0.02%)#906 |
| 86. | 10021 | 275 | 147,442(0.19%)#86 | 1,294,135(0.02%)#910 |
| 87. | 11758 | 270 | 147,442(0.18%)#87 | 1,294,135(0.02%)#936 |
| 88. | 11756 | 268 | 147,442(0.18%)#88 | 1,294,135(0.02%)#955 |
| 89. | 12590 | 263 | 147,442(0.18%)#89 | 1,294,135(0.02%)#990 |
| 90. | 10309 | 263 | 147,442(0.18%)#90 | 1,294,135(0.02%)#991 |
| 91. | 12550 | 262 | 147,442(0.18%)#91 | 1,294,135(0.02%)#997 |
| 92. | 11801 | 261 | 147,442(0.18%)#92 | 1,294,135(0.02%)#1,004 |
| 93. | 10701 | 260 | 147,442(0.18%)#93 | 1,294,135(0.02%)#1,009 |
| 94. | 10014 | 258 | 147,442(0.17%)#94 | 1,294,135(0.02%)#1,025 |
| 95. | 11735 | 257 | 147,442(0.17%)#95 | 1,294,135(0.02%)#1,034 |
| 96. | 10002 | 255 | 147,442(0.17%)#96 | 1,294,135(0.02%)#1,040 |
| 97. | 14207 | 255 | 147,442(0.17%)#97 | 1,294,135(0.02%)#1,045 |
| 98. | 12533 | 251 | 147,442(0.17%)#98 | 1,294,135(0.02%)#1,073 |
| 99. | 10566 | 251 | 147,442(0.17%)#99 | 1,294,135(0.02%)#1,075 |
| 100. | 11791 | 250 | 147,442(0.17%)#100 | 1,294,135(0.02%)#1,086 |
Common Questions
What are the Top 10 Zip Codes with the Largest Hungarian Community in New York?
Top 10 Zip Codes with the Largest Hungarian Community in New York are:
What zip code has the Largest Hungarian Community in New York?
10950 has the Largest Hungarian Community in New York with 15,523.
What is the Total Hungarian Population in the State of New York?
Total Hungarian Population in New York is 147,442.
What is the Total Hungarian Population in the United States?
Total Hungarian Population in the United States is 1,294,135.