Zip Codes with the Highest Percentage of Population with a Degree in Science and Engineering in Massachusetts
RELATED REPORTS & OPTIONS
Science and Engineering
Massachusetts
Compare Zip Codes
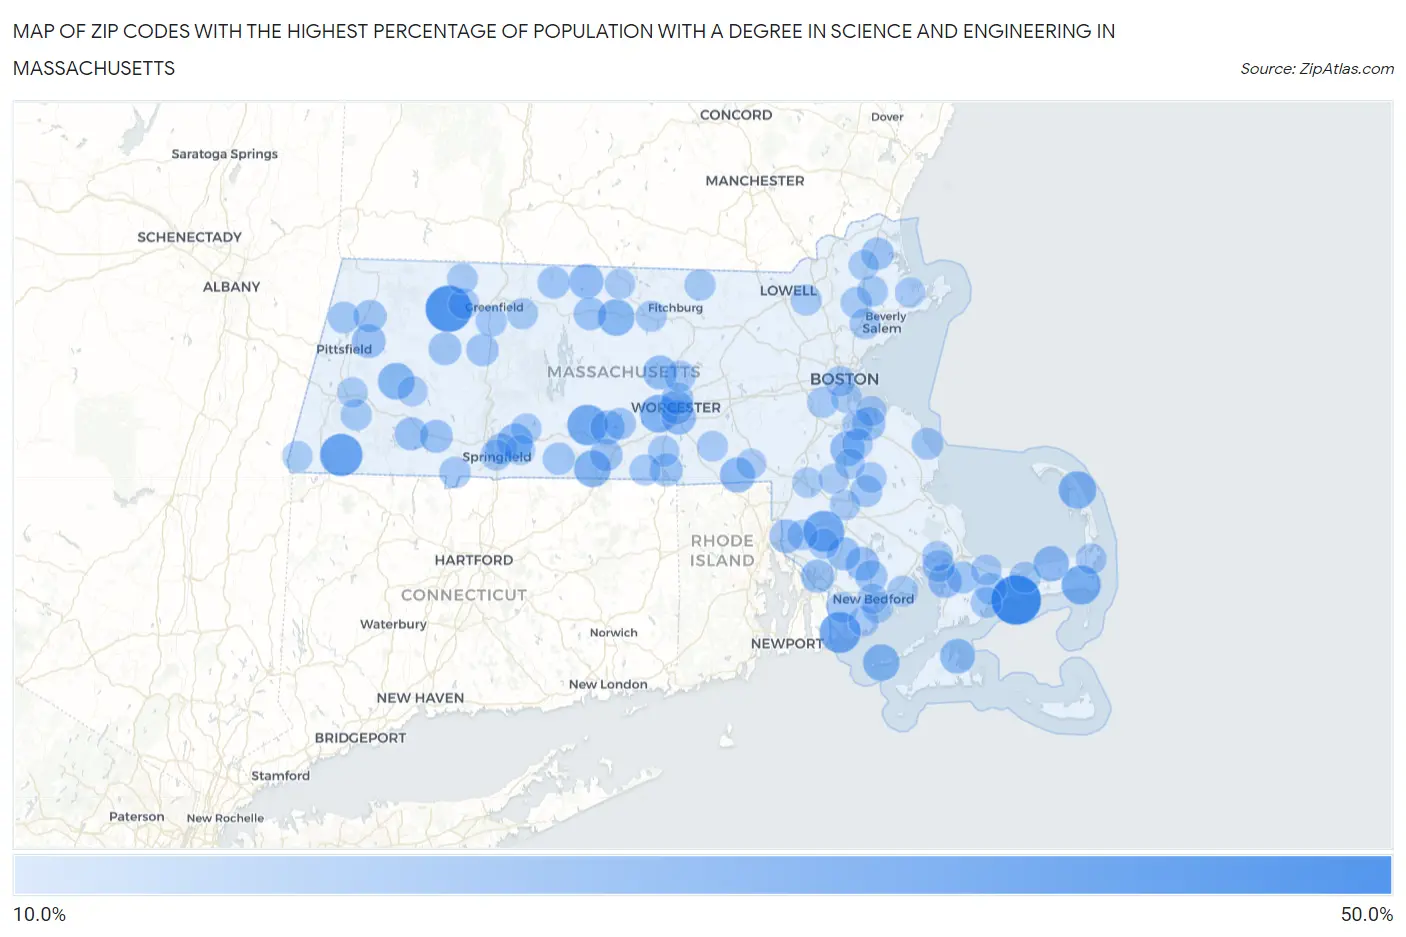
Map of Zip Codes with the Highest Percentage of Population with a Degree in Science and Engineering in Massachusetts
10.0%
50.0%
Zip Codes with the Highest Percentage of Population with a Degree in Science and Engineering in Massachusetts
| Zip Code | % Graduates | vs State | vs National | |
| 1. | 02647 | 47.7% | 8.5%(+39.3)#1 | 9.8%(+37.9)#456 |
| 2. | 01338 | 41.7% | 8.5%(+33.2)#2 | 9.8%(+31.9)#616 |
| 3. | 01244 | 34.2% | 8.5%(+25.7)#3 | 9.8%(+24.4)#983 |
| 4. | 02791 | 31.6% | 8.5%(+23.2)#4 | 9.8%(+21.9)#1,161 |
| 5. | 02764 | 31.3% | 8.5%(+22.9)#5 | 9.8%(+21.5)#1,191 |
| 6. | 01083 | 30.5% | 8.5%(+22.0)#6 | 9.8%(+20.7)#1,272 |
| 7. | 02659 | 28.3% | 8.5%(+19.8)#7 | 9.8%(+18.5)#1,499 |
| 8. | 01611 | 25.7% | 8.5%(+17.2)#8 | 9.8%(+15.9)#1,829 |
| 9. | 02666 | 25.1% | 8.5%(+16.7)#9 | 9.8%(+15.3)#1,924 |
| 10. | 01521 | 24.0% | 8.5%(+15.5)#10 | 9.8%(+14.2)#2,159 |
| 11. | 01243 | 23.6% | 8.5%(+15.1)#11 | 9.8%(+13.8)#2,240 |
| 12. | 02713 | 23.5% | 8.5%(+15.1)#12 | 9.8%(+13.7)#2,262 |
| 13. | 01468 | 23.5% | 8.5%(+15.0)#13 | 9.8%(+13.7)#2,267 |
| 14. | 01151 | 21.3% | 8.5%(+12.9)#14 | 9.8%(+11.6)#2,847 |
| 15. | 02641 | 21.1% | 8.5%(+12.6)#15 | 9.8%(+11.3)#2,926 |
| 16. | 01504 | 20.9% | 8.5%(+12.5)#16 | 9.8%(+11.2)#2,980 |
| 17. | 02557 | 20.2% | 8.5%(+11.8)#17 | 9.8%(+10.4)#3,258 |
| 18. | 02322 | 20.0% | 8.5%(+11.5)#18 | 9.8%(+10.2)#3,323 |
| 19. | 01368 | 19.9% | 8.5%(+11.4)#19 | 9.8%(+10.1)#3,434 |
| 20. | 01607 | 19.6% | 8.5%(+11.2)#20 | 9.8%(+9.85)#3,499 |
| 21. | 01506 | 19.1% | 8.5%(+10.6)#21 | 9.8%(+9.33)#3,748 |
| 22. | 01522 | 18.8% | 8.5%(+10.4)#22 | 9.8%(+9.06)#3,869 |
| 23. | 01608 | 18.4% | 8.5%(+9.91)#23 | 9.8%(+8.60)#4,095 |
| 24. | 02771 | 18.3% | 8.5%(+9.86)#24 | 9.8%(+8.55)#4,125 |
| 25. | 01226 | 18.2% | 8.5%(+9.68)#25 | 9.8%(+8.37)#4,232 |
| 26. | 02717 | 18.1% | 8.5%(+9.61)#26 | 9.8%(+8.30)#4,268 |
| 27. | 02559 | 18.0% | 8.5%(+9.49)#27 | 9.8%(+8.17)#4,348 |
| 28. | 02702 | 17.6% | 8.5%(+9.09)#28 | 9.8%(+7.78)#4,578 |
| 29. | 02188 | 17.4% | 8.5%(+8.96)#29 | 9.8%(+7.65)#4,673 |
| 30. | 01008 | 17.3% | 8.5%(+8.80)#30 | 9.8%(+7.49)#4,751 |
| 31. | 02725 | 17.2% | 8.5%(+8.78)#31 | 9.8%(+7.47)#4,760 |
| 32. | 01071 | 17.0% | 8.5%(+8.51)#32 | 9.8%(+7.19)#4,972 |
| 33. | 01331 | 16.9% | 8.5%(+8.45)#33 | 9.8%(+7.14)#5,012 |
| 34. | 01032 | 16.5% | 8.5%(+8.02)#34 | 9.8%(+6.71)#5,368 |
| 35. | 01570 | 16.4% | 8.5%(+7.96)#35 | 9.8%(+6.65)#5,420 |
| 36. | 01225 | 16.2% | 8.5%(+7.77)#36 | 9.8%(+6.46)#5,543 |
| 37. | 01518 | 16.1% | 8.5%(+7.63)#37 | 9.8%(+6.31)#5,662 |
| 38. | 01922 | 15.9% | 8.5%(+7.40)#38 | 9.8%(+6.09)#5,826 |
| 39. | 01093 | 15.7% | 8.5%(+7.22)#39 | 9.8%(+5.90)#5,998 |
| 40. | 02745 | 15.7% | 8.5%(+7.20)#40 | 9.8%(+5.88)#6,023 |
| 41. | 01378 | 15.5% | 8.5%(+7.08)#41 | 9.8%(+5.77)#6,146 |
| 42. | 01057 | 15.3% | 8.5%(+6.81)#42 | 9.8%(+5.50)#6,424 |
| 43. | 02542 | 15.2% | 8.5%(+6.77)#43 | 9.8%(+5.46)#6,458 |
| 44. | 02558 | 15.1% | 8.5%(+6.63)#44 | 9.8%(+5.31)#6,615 |
| 45. | 01605 | 15.0% | 8.5%(+6.51)#45 | 9.8%(+5.20)#6,747 |
| 46. | 02325 | 14.8% | 8.5%(+6.35)#46 | 9.8%(+5.03)#6,888 |
| 47. | 01237 | 14.7% | 8.5%(+6.20)#47 | 9.8%(+4.89)#7,031 |
| 48. | 02047 | 14.7% | 8.5%(+6.19)#48 | 9.8%(+4.87)#7,055 |
| 49. | 01515 | 14.6% | 8.5%(+6.16)#49 | 9.8%(+4.84)#7,088 |
| 50. | 02648 | 14.2% | 8.5%(+5.69)#50 | 9.8%(+4.38)#7,664 |
| 51. | 01104 | 14.1% | 8.5%(+5.66)#51 | 9.8%(+4.35)#7,695 |
| 52. | 01077 | 14.1% | 8.5%(+5.62)#52 | 9.8%(+4.31)#7,748 |
| 53. | 01540 | 14.0% | 8.5%(+5.58)#53 | 9.8%(+4.27)#7,803 |
| 54. | 01583 | 13.9% | 8.5%(+5.39)#54 | 9.8%(+4.08)#8,039 |
| 55. | 02637 | 13.9% | 8.5%(+5.38)#55 | 9.8%(+4.07)#8,049 |
| 56. | 01342 | 13.7% | 8.5%(+5.21)#56 | 9.8%(+3.89)#8,280 |
| 57. | 01876 | 13.6% | 8.5%(+5.16)#57 | 9.8%(+3.85)#8,343 |
| 58. | 01103 | 13.6% | 8.5%(+5.15)#58 | 9.8%(+3.84)#8,360 |
| 59. | 02790 | 13.6% | 8.5%(+5.12)#59 | 9.8%(+3.81)#8,393 |
| 60. | 01571 | 13.5% | 8.5%(+5.02)#60 | 9.8%(+3.71)#8,512 |
| 61. | 01264 | 13.5% | 8.5%(+4.99)#61 | 9.8%(+3.68)#8,560 |
| 62. | 01349 | 13.4% | 8.5%(+4.95)#62 | 9.8%(+3.64)#8,606 |
| 63. | 01469 | 13.4% | 8.5%(+4.94)#63 | 9.8%(+3.62)#8,629 |
| 64. | 02635 | 13.4% | 8.5%(+4.92)#64 | 9.8%(+3.60)#8,657 |
| 65. | 01949 | 13.3% | 8.5%(+4.86)#65 | 9.8%(+3.55)#8,748 |
| 66. | 02739 | 13.3% | 8.5%(+4.86)#66 | 9.8%(+3.54)#8,756 |
| 67. | 02744 | 13.3% | 8.5%(+4.80)#67 | 9.8%(+3.49)#8,832 |
| 68. | 02132 | 13.2% | 8.5%(+4.78)#68 | 9.8%(+3.47)#8,862 |
| 69. | 01960 | 13.1% | 8.5%(+4.63)#69 | 9.8%(+3.32)#9,095 |
| 70. | 01473 | 13.1% | 8.5%(+4.63)#70 | 9.8%(+3.32)#9,096 |
| 71. | 01983 | 12.9% | 8.5%(+4.46)#71 | 9.8%(+3.15)#9,347 |
| 72. | 02653 | 12.9% | 8.5%(+4.42)#72 | 9.8%(+3.11)#9,419 |
| 73. | 02122 | 12.9% | 8.5%(+4.40)#73 | 9.8%(+3.09)#9,437 |
| 74. | 01370 | 12.8% | 8.5%(+4.34)#74 | 9.8%(+3.03)#9,528 |
| 75. | 01534 | 12.8% | 8.5%(+4.30)#75 | 9.8%(+2.99)#9,603 |
| 76. | 02184 | 12.7% | 8.5%(+4.28)#76 | 9.8%(+2.96)#9,647 |
| 77. | 02343 | 12.7% | 8.5%(+4.24)#77 | 9.8%(+2.93)#9,690 |
| 78. | 02537 | 12.6% | 8.5%(+4.15)#78 | 9.8%(+2.84)#9,821 |
| 79. | 02748 | 12.6% | 8.5%(+4.11)#79 | 9.8%(+2.80)#9,876 |
| 80. | 02715 | 12.6% | 8.5%(+4.11)#80 | 9.8%(+2.80)#9,887 |
| 81. | 02048 | 12.6% | 8.5%(+4.08)#81 | 9.8%(+2.77)#9,934 |
| 82. | 01056 | 12.5% | 8.5%(+4.03)#82 | 9.8%(+2.72)#9,999 |
| 83. | 02538 | 12.5% | 8.5%(+4.03)#83 | 9.8%(+2.72)#10,008 |
| 84. | 02333 | 12.5% | 8.5%(+4.02)#84 | 9.8%(+2.70)#10,080 |
| 85. | 02199 | 12.5% | 8.5%(+4.01)#85 | 9.8%(+2.70)#10,088 |
| 86. | 02740 | 12.4% | 8.5%(+3.98)#86 | 9.8%(+2.66)#10,137 |
| 87. | 02767 | 12.4% | 8.5%(+3.92)#87 | 9.8%(+2.61)#10,219 |
| 88. | 01929 | 12.4% | 8.5%(+3.92)#88 | 9.8%(+2.60)#10,222 |
| 89. | 02769 | 12.3% | 8.5%(+3.80)#89 | 9.8%(+2.49)#10,417 |
| 90. | 01340 | 12.3% | 8.5%(+3.80)#90 | 9.8%(+2.49)#10,418 |
| 91. | 01475 | 12.2% | 8.5%(+3.77)#91 | 9.8%(+2.45)#10,468 |
| 92. | 01238 | 12.2% | 8.5%(+3.77)#92 | 9.8%(+2.45)#10,469 |
| 93. | 01258 | 12.2% | 8.5%(+3.75)#93 | 9.8%(+2.44)#10,486 |
| 94. | 02191 | 12.2% | 8.5%(+3.75)#94 | 9.8%(+2.44)#10,487 |
| 95. | 02375 | 12.2% | 8.5%(+3.69)#95 | 9.8%(+2.38)#10,617 |
| 96. | 02301 | 12.2% | 8.5%(+3.69)#96 | 9.8%(+2.37)#10,620 |
| 97. | 01129 | 12.1% | 8.5%(+3.66)#97 | 9.8%(+2.35)#10,668 |
| 98. | 01833 | 12.1% | 8.5%(+3.63)#98 | 9.8%(+2.32)#10,729 |
| 99. | 01011 | 12.0% | 8.5%(+3.53)#99 | 9.8%(+2.22)#10,889 |
| 100. | 02019 | 11.8% | 8.5%(+3.38)#100 | 9.8%(+2.06)#11,186 |
Common Questions
What are the Top 10 Zip Codes with the Highest Percentage of Population with a Degree in Science and Engineering in Massachusetts?
Top 10 Zip Codes with the Highest Percentage of Population with a Degree in Science and Engineering in Massachusetts are:
What zip code has the Highest Percentage of Population with a Degree in Science and Engineering in Massachusetts?
02647 has the Highest Percentage of Population with a Degree in Science and Engineering in Massachusetts with 47.7%.
What is the Percentage of Population with a Degree in Science and Engineering in the State of Massachusetts?
Percentage of Population with a Degree in Science and Engineering in Massachusetts is 8.5%.
What is the Percentage of Population with a Degree in Science and Engineering in the United States?
Percentage of Population with a Degree in Science and Engineering in the United States is 9.8%.