Keithsburg, IL Map & Demographics
Keithsburg Map
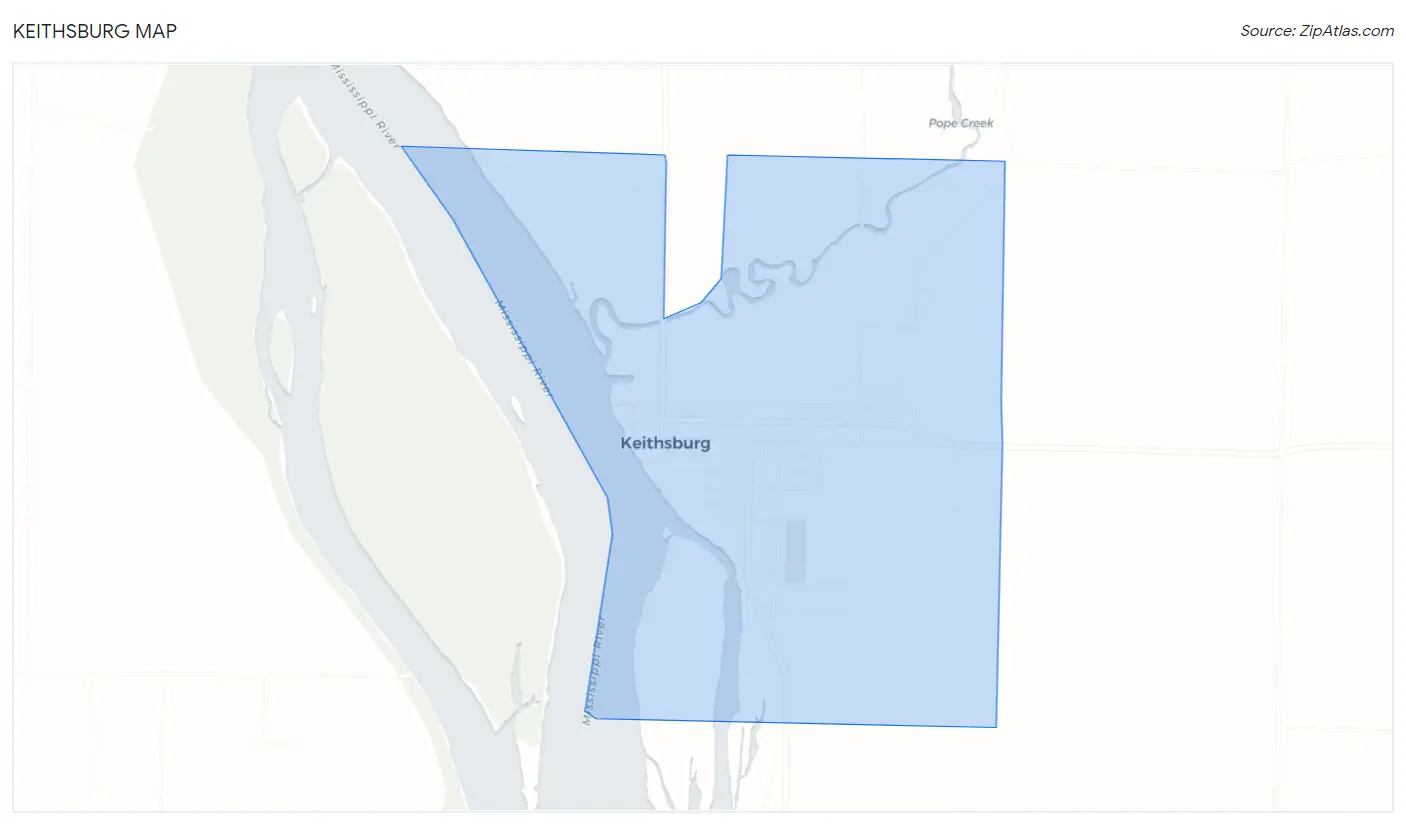
Keithsburg Overview
$40,108
PER CAPITA INCOME
$87,813
AVG FAMILY INCOME
$52,917
AVG HOUSEHOLD INCOME
25.7%
WAGE / INCOME GAP [ % ]
74.3¢/ $1
WAGE / INCOME GAP [ $ ]
$10,417
FAMILY INCOME DEFICIT
0.55
INEQUALITY / GINI INDEX
570
TOTAL POPULATION
287
MALE POPULATION
283
FEMALE POPULATION
101.41
MALES / 100 FEMALES
98.61
FEMALES / 100 MALES
50.4
MEDIAN AGE
2.9
AVG FAMILY SIZE
2.2
AVG HOUSEHOLD SIZE
286
LABOR FORCE [ PEOPLE ]
60.3%
PERCENT IN LABOR FORCE
11.5%
UNEMPLOYMENT RATE
Keithsburg Zip Codes
Keithsburg Area Codes
Income in Keithsburg
Income Overview in Keithsburg
Per Capita Income in Keithsburg is $40,108, while median incomes of families and households are $87,813 and $52,917 respectively.
| Characteristic | Number | Measure |
| Per Capita Income | 570 | $40,108 |
| Median Family Income | 160 | $87,813 |
| Mean Family Income | 160 | $116,866 |
| Median Household Income | 257 | $52,917 |
| Mean Household Income | 257 | $88,400 |
| Income Deficit | 160 | $10,417 |
| Wage / Income Gap (%) | 570 | 25.66% |
| Wage / Income Gap ($) | 570 | 74.34¢ per $1 |
| Gini / Inequality Index | 570 | 0.55 |
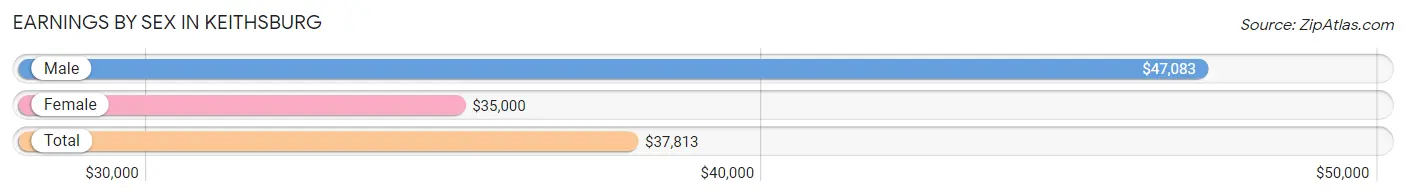
Earnings by Sex in Keithsburg
Average Earnings in Keithsburg are $37,813, $47,083 for men and $35,000 for women, a difference of 25.7%.
| Sex | Number | Average Earnings |
| Male | 155 (54.0%) | $47,083 |
| Female | 132 (46.0%) | $35,000 |
| Total | 287 (100.0%) | $37,813 |
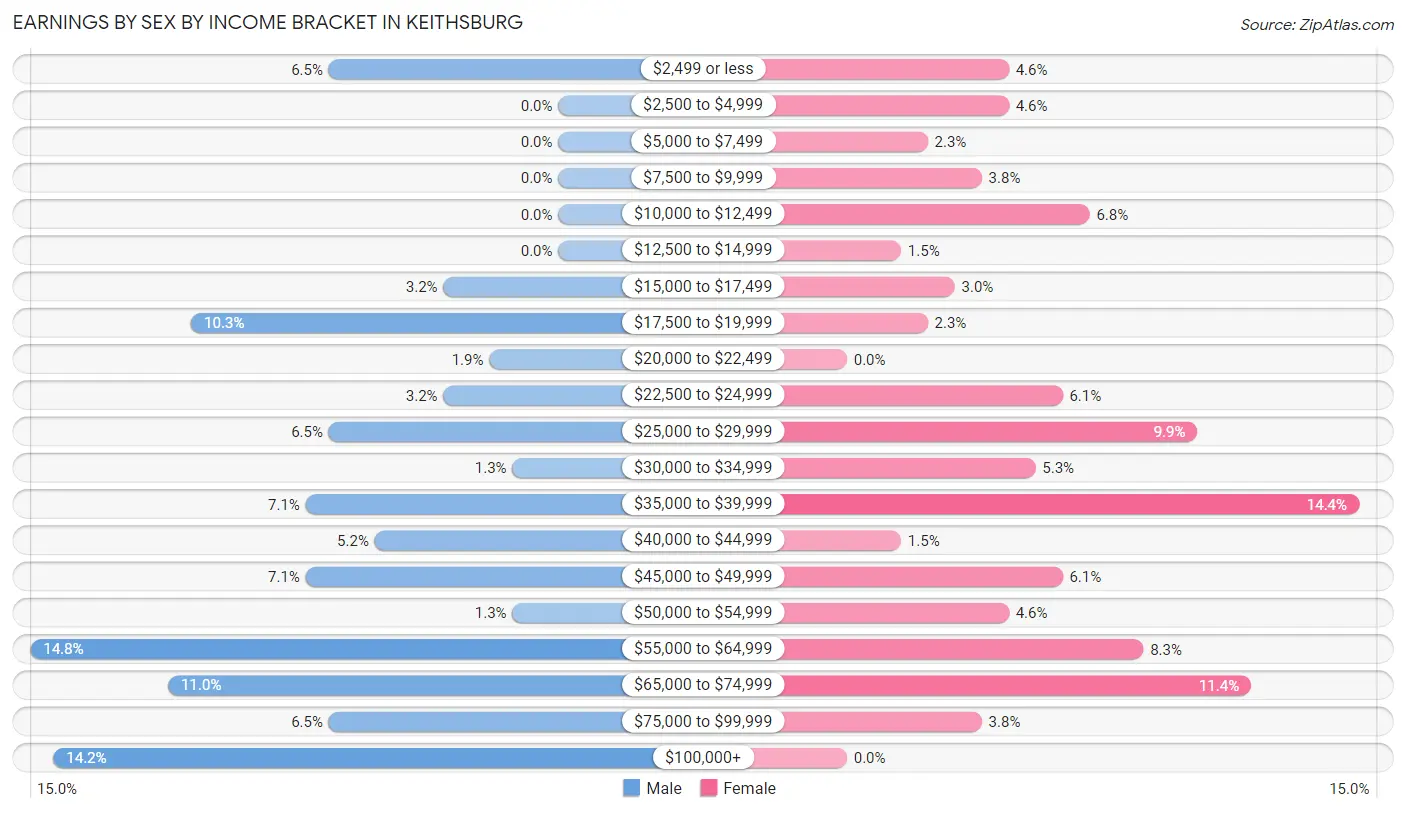
Earnings by Sex by Income Bracket in Keithsburg
The most common earnings brackets in Keithsburg are $55,000 to $64,999 for men (23 | 14.8%) and $35,000 to $39,999 for women (19 | 14.4%).
| Income | Male | Female |
| $2,499 or less | 10 (6.5%) | 6 (4.5%) |
| $2,500 to $4,999 | 0 (0.0%) | 6 (4.5%) |
| $5,000 to $7,499 | 0 (0.0%) | 3 (2.3%) |
| $7,500 to $9,999 | 0 (0.0%) | 5 (3.8%) |
| $10,000 to $12,499 | 0 (0.0%) | 9 (6.8%) |
| $12,500 to $14,999 | 0 (0.0%) | 2 (1.5%) |
| $15,000 to $17,499 | 5 (3.2%) | 4 (3.0%) |
| $17,500 to $19,999 | 16 (10.3%) | 3 (2.3%) |
| $20,000 to $22,499 | 3 (1.9%) | 0 (0.0%) |
| $22,500 to $24,999 | 5 (3.2%) | 8 (6.1%) |
| $25,000 to $29,999 | 10 (6.5%) | 13 (9.9%) |
| $30,000 to $34,999 | 2 (1.3%) | 7 (5.3%) |
| $35,000 to $39,999 | 11 (7.1%) | 19 (14.4%) |
| $40,000 to $44,999 | 8 (5.2%) | 2 (1.5%) |
| $45,000 to $49,999 | 11 (7.1%) | 8 (6.1%) |
| $50,000 to $54,999 | 2 (1.3%) | 6 (4.5%) |
| $55,000 to $64,999 | 23 (14.8%) | 11 (8.3%) |
| $65,000 to $74,999 | 17 (11.0%) | 15 (11.4%) |
| $75,000 to $99,999 | 10 (6.5%) | 5 (3.8%) |
| $100,000+ | 22 (14.2%) | 0 (0.0%) |
| Total | 155 (100.0%) | 132 (100.0%) |
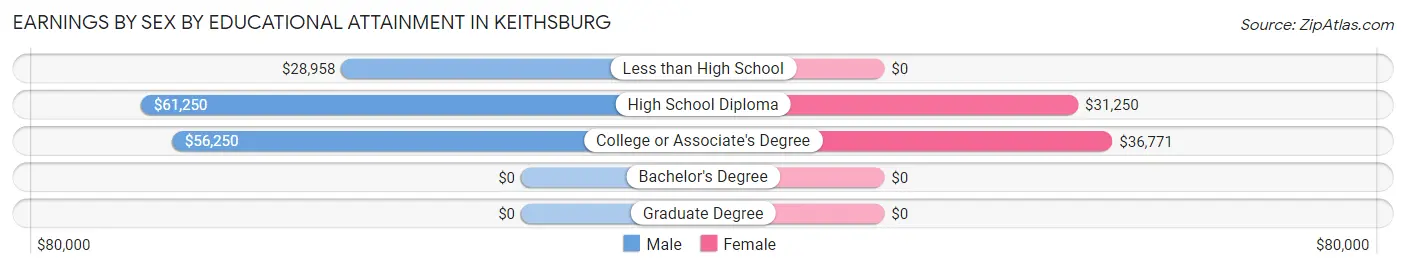
Earnings by Sex by Educational Attainment in Keithsburg
Average earnings in Keithsburg are $54,375 for men and $35,417 for women, a difference of 34.9%. Men with an educational attainment of high school diploma enjoy the highest average annual earnings of $61,250, while those with less than high school education earn the least with $28,958. Women with an educational attainment of college or associate's degree earn the most with the average annual earnings of $36,771, while those with high school diploma education have the smallest earnings of $31,250.
| Educational Attainment | Male Income | Female Income |
| Less than High School | $28,958 | $0 |
| High School Diploma | $61,250 | $31,250 |
| College or Associate's Degree | $56,250 | $36,771 |
| Bachelor's Degree | - | - |
| Graduate Degree | - | - |
| Total | $54,375 | $35,417 |
Family Income in Keithsburg
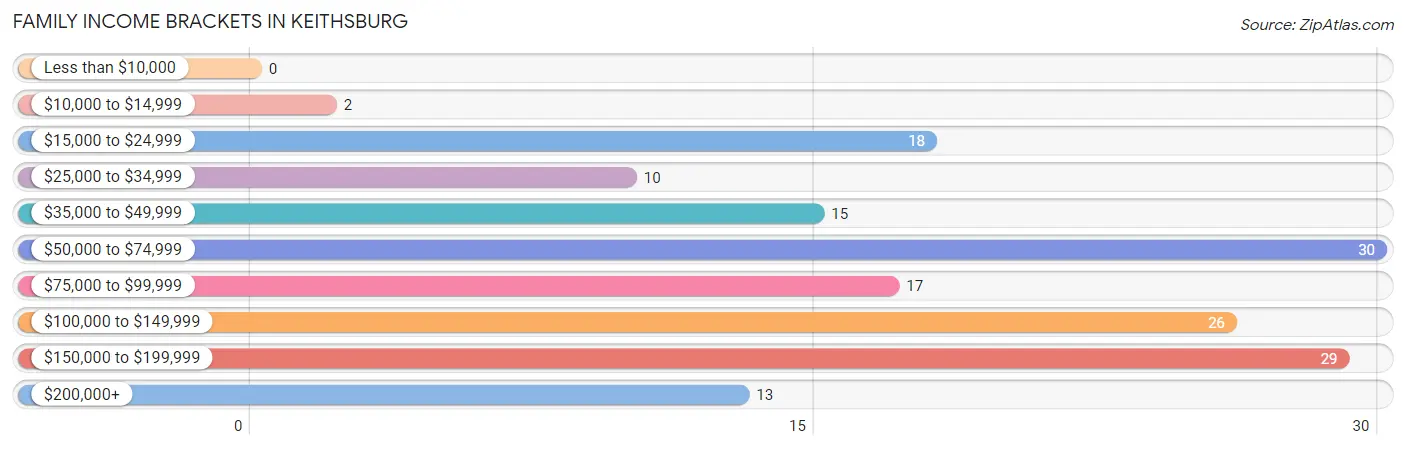
Family Income Brackets in Keithsburg
According to the Keithsburg family income data, there are 30 families falling into the $50,000 to $74,999 income range, which is the most common income bracket and makes up 18.8% of all families.
| Income Bracket | # Families | % Families |
| Less than $10,000 | 0 | 0.0% |
| $10,000 to $14,999 | 2 | 1.3% |
| $15,000 to $24,999 | 18 | 11.3% |
| $25,000 to $34,999 | 10 | 6.3% |
| $35,000 to $49,999 | 15 | 9.4% |
| $50,000 to $74,999 | 30 | 18.8% |
| $75,000 to $99,999 | 17 | 10.6% |
| $100,000 to $149,999 | 26 | 16.3% |
| $150,000 to $199,999 | 29 | 18.1% |
| $200,000+ | 13 | 8.1% |
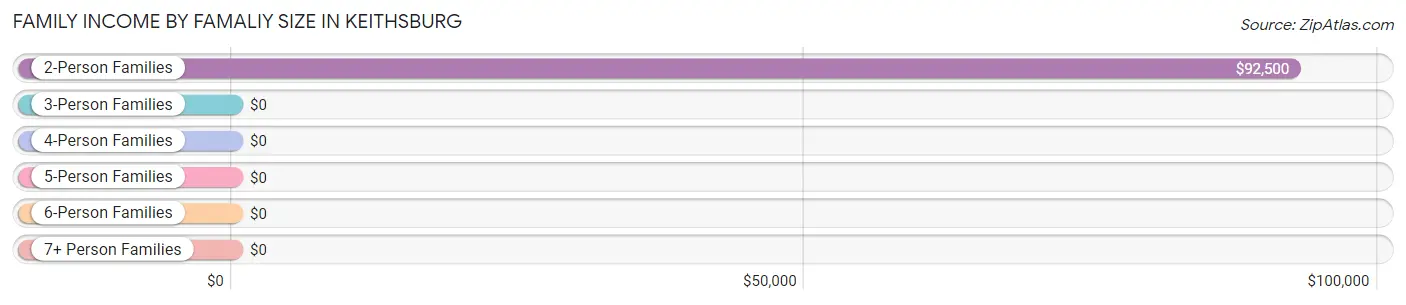
Family Income by Famaliy Size in Keithsburg
2-person families (94 | 58.8%) account for the highest median family income in Keithsburg with $92,500 per family, while 2-person families (94 | 58.8%) have the highest median income of $46,250 per family member.
| Income Bracket | # Families | Median Income |
| 2-Person Families | 94 (58.8%) | $92,500 |
| 3-Person Families | 25 (15.6%) | $0 |
| 4-Person Families | 28 (17.5%) | $0 |
| 5-Person Families | 10 (6.2%) | $0 |
| 6-Person Families | 0 (0.0%) | $0 |
| 7+ Person Families | 3 (1.9%) | $0 |
| Total | 160 (100.0%) | $87,813 |
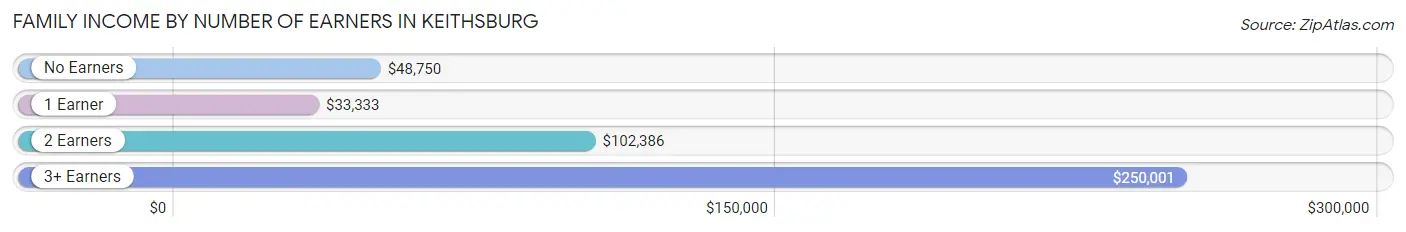
Family Income by Number of Earners in Keithsburg
The median family income in Keithsburg is $87,813, with families comprising 3+ earners (15) having the highest median family income of $250,001, while families with 1 earner (36) have the lowest median family income of $33,333, accounting for 9.4% and 22.5% of families, respectively.
| Number of Earners | # Families | Median Income |
| No Earners | 20 (12.5%) | $48,750 |
| 1 Earner | 36 (22.5%) | $33,333 |
| 2 Earners | 89 (55.6%) | $102,386 |
| 3+ Earners | 15 (9.4%) | $250,001 |
| Total | 160 (100.0%) | $87,813 |
Household Income in Keithsburg
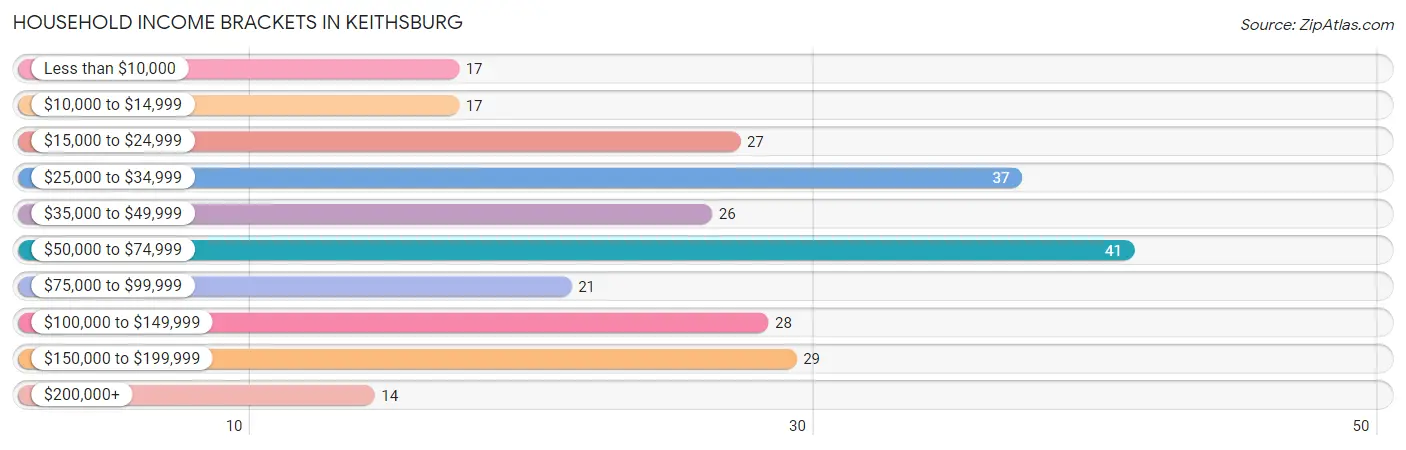
Household Income Brackets in Keithsburg
With 41 households falling in the category, the $50,000 to $74,999 income range is the most frequent in Keithsburg, accounting for 16.0% of all households. In contrast, only 14 households (5.4%) fall into the $200,000+ income bracket, making it the least populous group.
| Income Bracket | # Households | % Households |
| Less than $10,000 | 17 | 6.6% |
| $10,000 to $14,999 | 17 | 6.6% |
| $15,000 to $24,999 | 27 | 10.5% |
| $25,000 to $34,999 | 37 | 14.4% |
| $35,000 to $49,999 | 26 | 10.1% |
| $50,000 to $74,999 | 41 | 16.0% |
| $75,000 to $99,999 | 21 | 8.2% |
| $100,000 to $149,999 | 28 | 10.9% |
| $150,000 to $199,999 | 29 | 11.3% |
| $200,000+ | 14 | 5.4% |
Household Income by Householder Age in Keithsburg
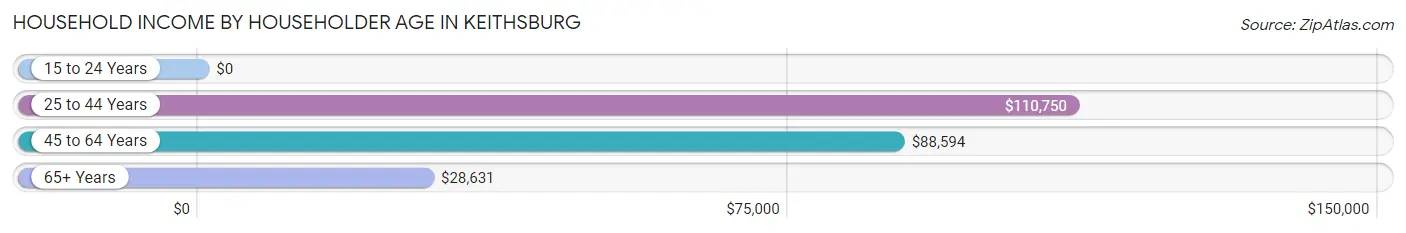
The median household income in Keithsburg is $52,917, with the highest median household income of $110,750 found in the 25 to 44 years age bracket for the primary householder. A total of 53 households (20.6%) fall into this category.
| Income Bracket | # Households | Median Income |
| 15 to 24 Years | 0 (0.0%) | $0 |
| 25 to 44 Years | 53 (20.6%) | $110,750 |
| 45 to 64 Years | 93 (36.2%) | $88,594 |
| 65+ Years | 111 (43.2%) | $28,631 |
| Total | 257 (100.0%) | $52,917 |
Poverty in Keithsburg
Income Below Poverty by Sex and Age in Keithsburg
With 15.3% poverty level for males and 18.7% for females among the residents of Keithsburg, 12 to 14 year old males and under 5 year old females are the most vulnerable to poverty, with 3 males (100.0%) and 10 females (47.6%) in their respective age groups living below the poverty level.
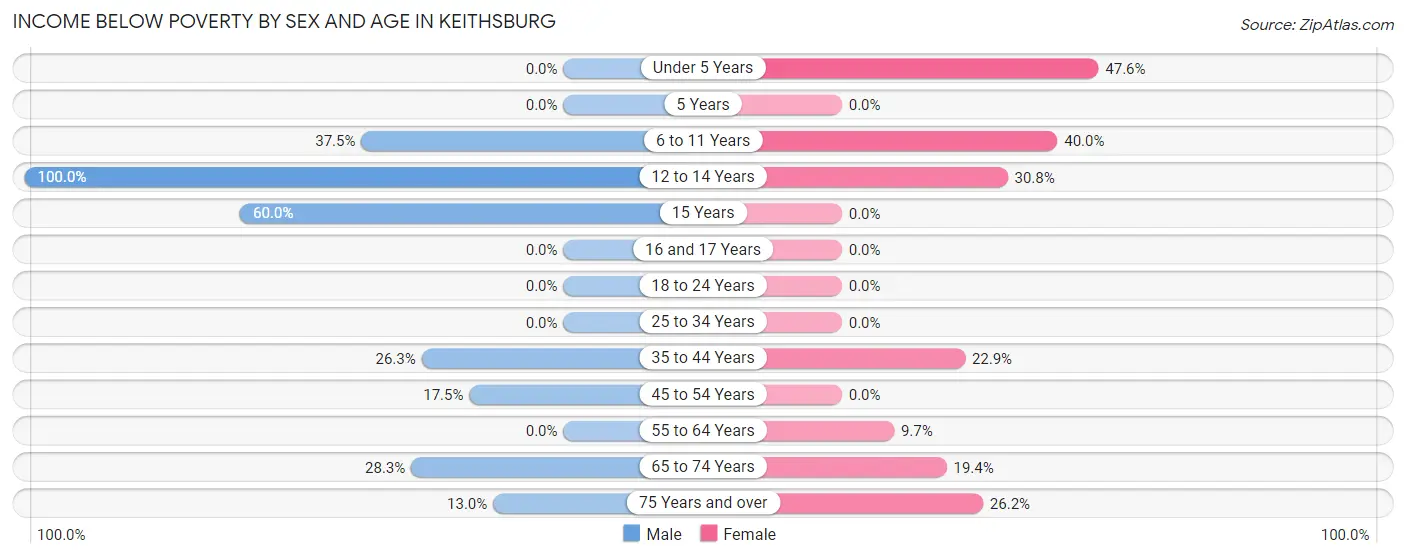
| Age Bracket | Male | Female |
| Under 5 Years | 0 (0.0%) | 10 (47.6%) |
| 5 Years | 0 (0.0%) | 0 (0.0%) |
| 6 to 11 Years | 6 (37.5%) | 6 (40.0%) |
| 12 to 14 Years | 3 (100.0%) | 8 (30.8%) |
| 15 Years | 3 (60.0%) | 0 (0.0%) |
| 16 and 17 Years | 0 (0.0%) | 0 (0.0%) |
| 18 to 24 Years | 0 (0.0%) | 0 (0.0%) |
| 25 to 34 Years | 0 (0.0%) | 0 (0.0%) |
| 35 to 44 Years | 5 (26.3%) | 8 (22.9%) |
| 45 to 54 Years | 11 (17.5%) | 0 (0.0%) |
| 55 to 64 Years | 0 (0.0%) | 3 (9.7%) |
| 65 to 74 Years | 13 (28.3%) | 7 (19.4%) |
| 75 Years and over | 3 (13.0%) | 11 (26.2%) |
| Total | 44 (15.3%) | 53 (18.7%) |
Income Above Poverty by Sex and Age in Keithsburg
According to the poverty statistics in Keithsburg, males aged under 5 years and females aged 15 years are the age groups that are most secure financially, with 100.0% of males and 100.0% of females in these age groups living above the poverty line.
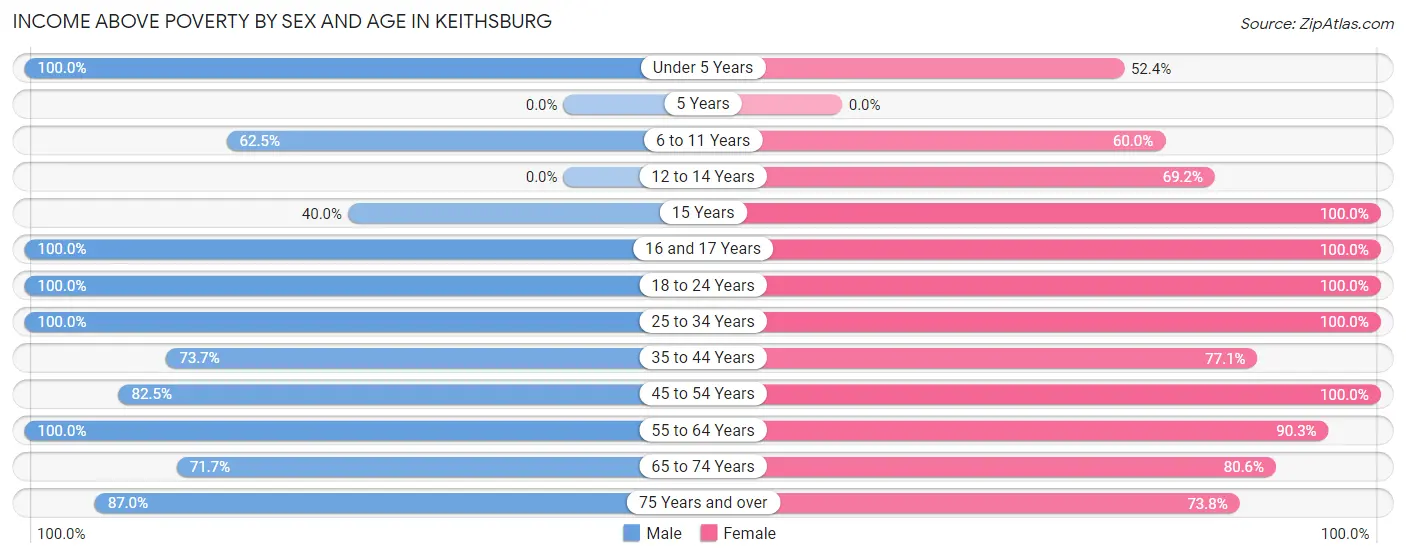
| Age Bracket | Male | Female |
| Under 5 Years | 9 (100.0%) | 11 (52.4%) |
| 5 Years | 0 (0.0%) | 0 (0.0%) |
| 6 to 11 Years | 10 (62.5%) | 9 (60.0%) |
| 12 to 14 Years | 0 (0.0%) | 18 (69.2%) |
| 15 Years | 2 (40.0%) | 1 (100.0%) |
| 16 and 17 Years | 1 (100.0%) | 3 (100.0%) |
| 18 to 24 Years | 34 (100.0%) | 3 (100.0%) |
| 25 to 34 Years | 27 (100.0%) | 36 (100.0%) |
| 35 to 44 Years | 14 (73.7%) | 27 (77.1%) |
| 45 to 54 Years | 52 (82.5%) | 34 (100.0%) |
| 55 to 64 Years | 41 (100.0%) | 28 (90.3%) |
| 65 to 74 Years | 33 (71.7%) | 29 (80.6%) |
| 75 Years and over | 20 (87.0%) | 31 (73.8%) |
| Total | 243 (84.7%) | 230 (81.3%) |
Income Below Poverty Among Married-Couple Families in Keithsburg
The poverty statistics for married-couple families in Keithsburg show that 8.6% or 12 of the total 139 families live below the poverty line. Families with 5 or more children have the highest poverty rate of 100.0%, comprising of 3 families. On the other hand, families with no children have the lowest poverty rate of 3.0%, which includes 3 families.
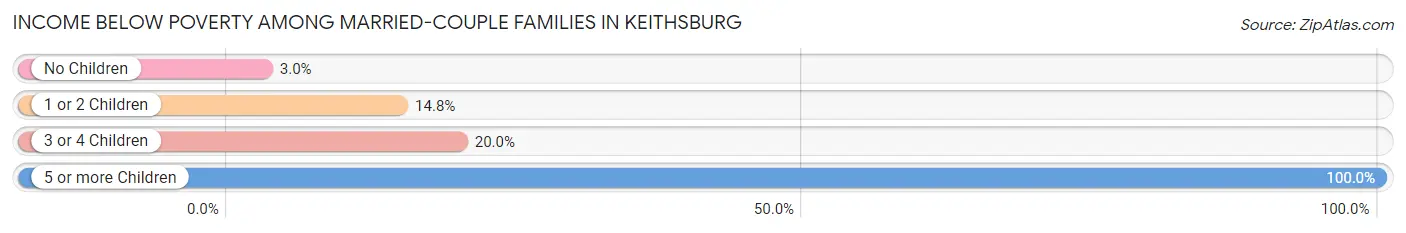
| Children | Above Poverty | Below Poverty |
| No Children | 96 (97.0%) | 3 (3.0%) |
| 1 or 2 Children | 23 (85.2%) | 4 (14.8%) |
| 3 or 4 Children | 8 (80.0%) | 2 (20.0%) |
| 5 or more Children | 0 (0.0%) | 3 (100.0%) |
| Total | 127 (91.4%) | 12 (8.6%) |
Income Below Poverty Among Single-Parent Households in Keithsburg
| Children | Single Father | Single Mother |
| No Children | 0 (0.0%) | 0 (0.0%) |
| 1 or 2 Children | 0 (0.0%) | 0 (0.0%) |
| 3 or 4 Children | 0 (0.0%) | 0 (0.0%) |
| 5 or more Children | 0 (0.0%) | 0 (0.0%) |
| Total | 0 (0.0%) | 0 (0.0%) |
Income Below Poverty Among Married-Couple vs Single-Parent Households in Keithsburg
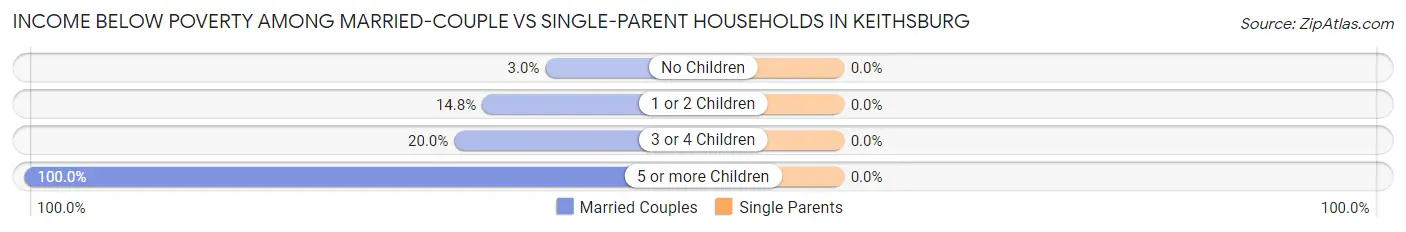
| Children | Married-Couple Families | Single-Parent Households |
| No Children | 3 (3.0%) | 0 (0.0%) |
| 1 or 2 Children | 4 (14.8%) | 0 (0.0%) |
| 3 or 4 Children | 2 (20.0%) | 0 (0.0%) |
| 5 or more Children | 3 (100.0%) | 0 (0.0%) |
| Total | 12 (8.6%) | 0 (0.0%) |
Race in Keithsburg
The most populous races in Keithsburg are White / Caucasian (562 | 98.6%), Two or more Races (8 | 1.4%), and Hispanic or Latino (2 | 0.4%).
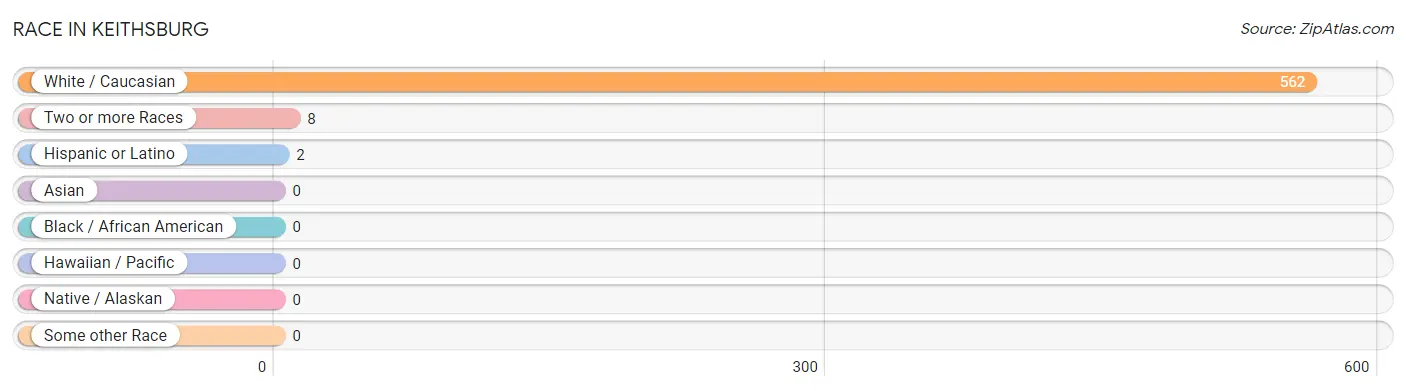
| Race | # Population | % Population |
| Asian | 0 | 0.0% |
| Black / African American | 0 | 0.0% |
| Hawaiian / Pacific | 0 | 0.0% |
| Hispanic or Latino | 2 | 0.4% |
| Native / Alaskan | 0 | 0.0% |
| White / Caucasian | 562 | 98.6% |
| Two or more Races | 8 | 1.4% |
| Some other Race | 0 | 0.0% |
| Total | 570 | 100.0% |
Ancestry in Keithsburg
The most populous ancestries reported in Keithsburg are German (116 | 20.3%), Irish (48 | 8.4%), American (43 | 7.5%), English (26 | 4.6%), and Scotch-Irish (24 | 4.2%), together accounting for 45.1% of all Keithsburg residents.
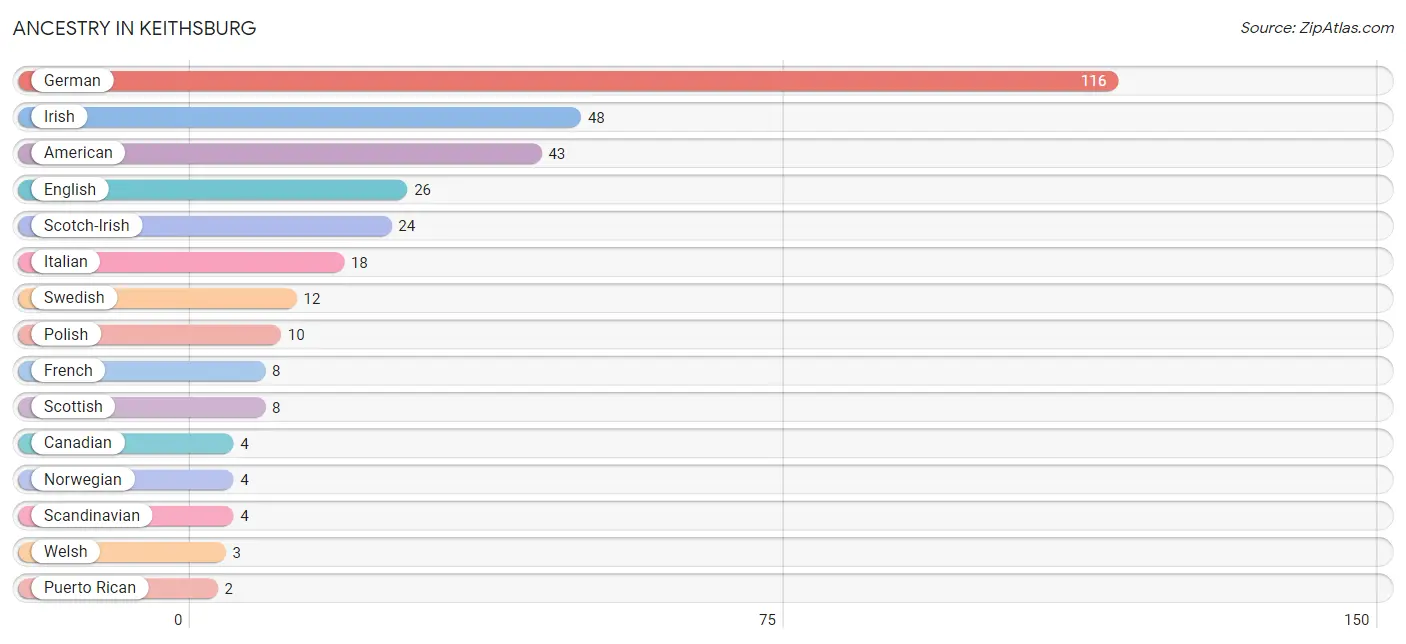
| Ancestry | # Population | % Population |
| American | 43 | 7.5% |
| Canadian | 4 | 0.7% |
| English | 26 | 4.6% |
| French | 8 | 1.4% |
| German | 116 | 20.3% |
| Irish | 48 | 8.4% |
| Italian | 18 | 3.2% |
| Norwegian | 4 | 0.7% |
| Polish | 10 | 1.8% |
| Puerto Rican | 2 | 0.4% |
| Scandinavian | 4 | 0.7% |
| Scotch-Irish | 24 | 4.2% |
| Scottish | 8 | 1.4% |
| Serbian | 2 | 0.4% |
| Slovak | 1 | 0.2% |
| Swedish | 12 | 2.1% |
| Welsh | 3 | 0.5% | View All 17 Rows |
Immigrants in Keithsburg
The most numerous immigrant groups reported in Keithsburg came from , and Canada (2 | 0.4%), together accounting for 0.4% of all Keithsburg residents.

| Immigration Origin | # Population | % Population |
| Canada | 2 | 0.4% | View All 1 Rows |
Sex and Age in Keithsburg
Sex and Age in Keithsburg
The most populous age groups in Keithsburg are 50 to 54 Years (42 | 14.6%) for men and 50 to 54 Years (32 | 11.3%) for women.
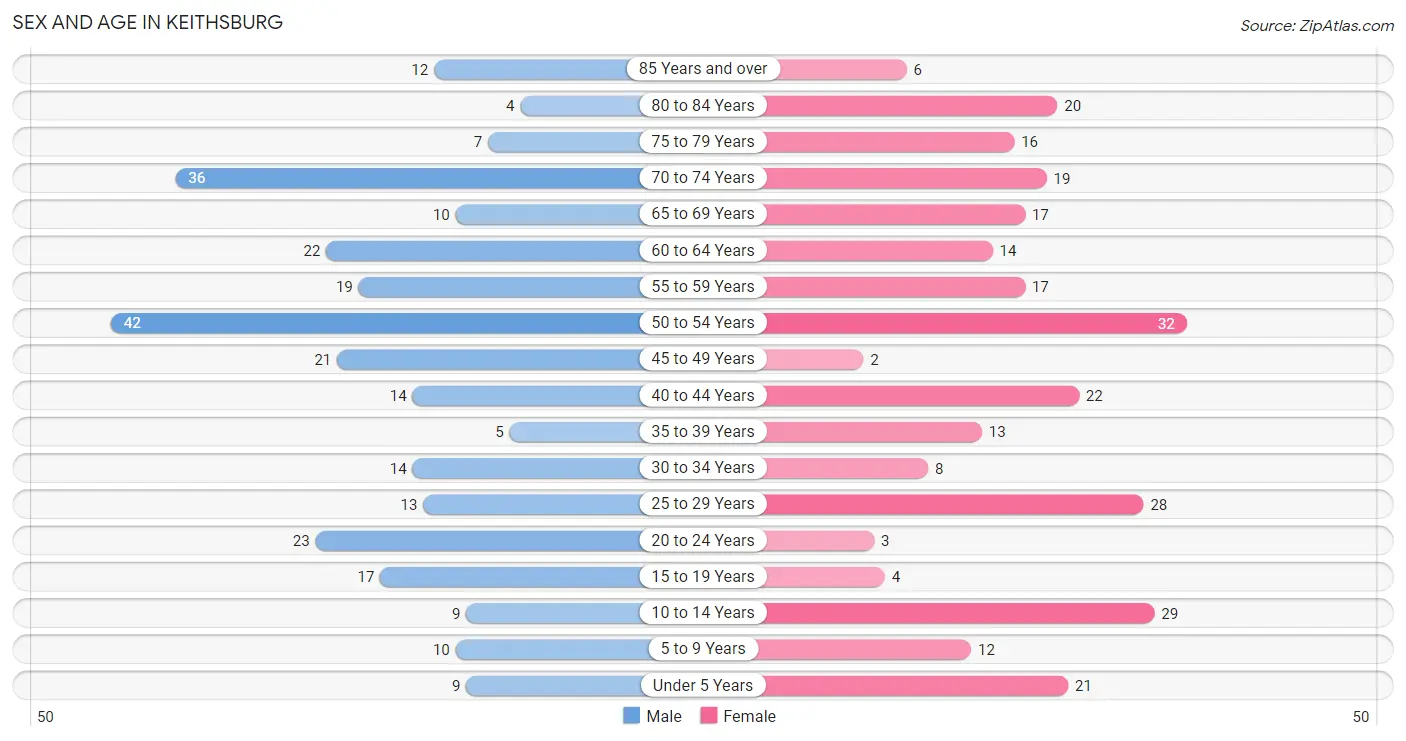
| Age Bracket | Male | Female |
| Under 5 Years | 9 (3.1%) | 21 (7.4%) |
| 5 to 9 Years | 10 (3.5%) | 12 (4.2%) |
| 10 to 14 Years | 9 (3.1%) | 29 (10.2%) |
| 15 to 19 Years | 17 (5.9%) | 4 (1.4%) |
| 20 to 24 Years | 23 (8.0%) | 3 (1.1%) |
| 25 to 29 Years | 13 (4.5%) | 28 (9.9%) |
| 30 to 34 Years | 14 (4.9%) | 8 (2.8%) |
| 35 to 39 Years | 5 (1.7%) | 13 (4.6%) |
| 40 to 44 Years | 14 (4.9%) | 22 (7.8%) |
| 45 to 49 Years | 21 (7.3%) | 2 (0.7%) |
| 50 to 54 Years | 42 (14.6%) | 32 (11.3%) |
| 55 to 59 Years | 19 (6.6%) | 17 (6.0%) |
| 60 to 64 Years | 22 (7.7%) | 14 (5.0%) |
| 65 to 69 Years | 10 (3.5%) | 17 (6.0%) |
| 70 to 74 Years | 36 (12.5%) | 19 (6.7%) |
| 75 to 79 Years | 7 (2.4%) | 16 (5.7%) |
| 80 to 84 Years | 4 (1.4%) | 20 (7.1%) |
| 85 Years and over | 12 (4.2%) | 6 (2.1%) |
| Total | 287 (100.0%) | 283 (100.0%) |
Families and Households in Keithsburg
Median Family Size in Keithsburg
The median family size in Keithsburg is 2.88 persons per family, with married-couple families (139 | 86.9%) accounting for the largest median family size of 2.95 persons per family. On the other hand, single female/mother families (14 | 8.7%) represent the smallest median family size with 2.21 persons per family.
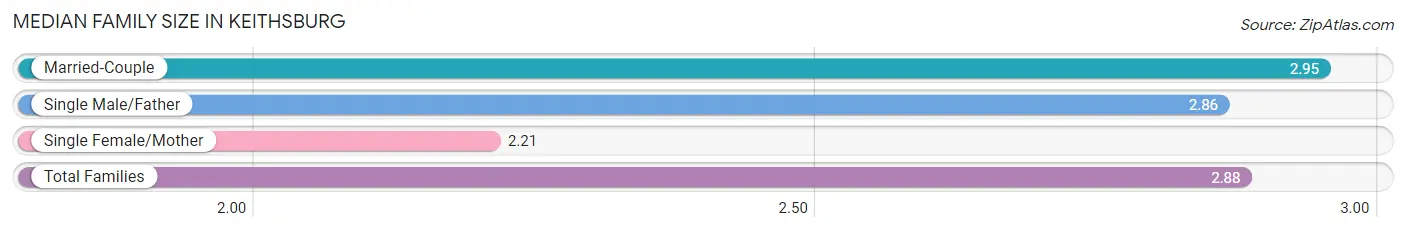
| Family Type | # Families | Family Size |
| Married-Couple | 139 (86.9%) | 2.95 |
| Single Male/Father | 7 (4.4%) | 2.86 |
| Single Female/Mother | 14 (8.7%) | 2.21 |
| Total Families | 160 (100.0%) | 2.88 |
Median Household Size in Keithsburg
The median household size in Keithsburg is 2.22 persons per household, with single male/father households (7 | 2.7%) accounting for the largest median household size of 3.57 persons per household. non-family households (97 | 37.7%) represent the smallest median household size with 1.07 persons per household.
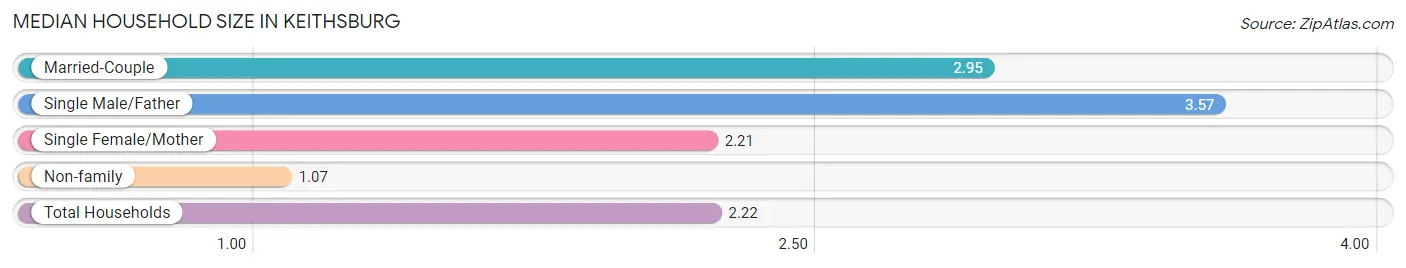
| Household Type | # Households | Household Size |
| Married-Couple | 139 (54.1%) | 2.95 |
| Single Male/Father | 7 (2.7%) | 3.57 |
| Single Female/Mother | 14 (5.4%) | 2.21 |
| Non-family | 97 (37.7%) | 1.07 |
| Total Households | 257 (100.0%) | 2.22 |
Household Size by Marriage Status in Keithsburg
Out of a total of 257 households in Keithsburg, 160 (62.3%) are family households, while 97 (37.7%) are nonfamily households. The most numerous type of family households are 2-person households, comprising 91, and the most common type of nonfamily households are 1-person households, comprising 92.
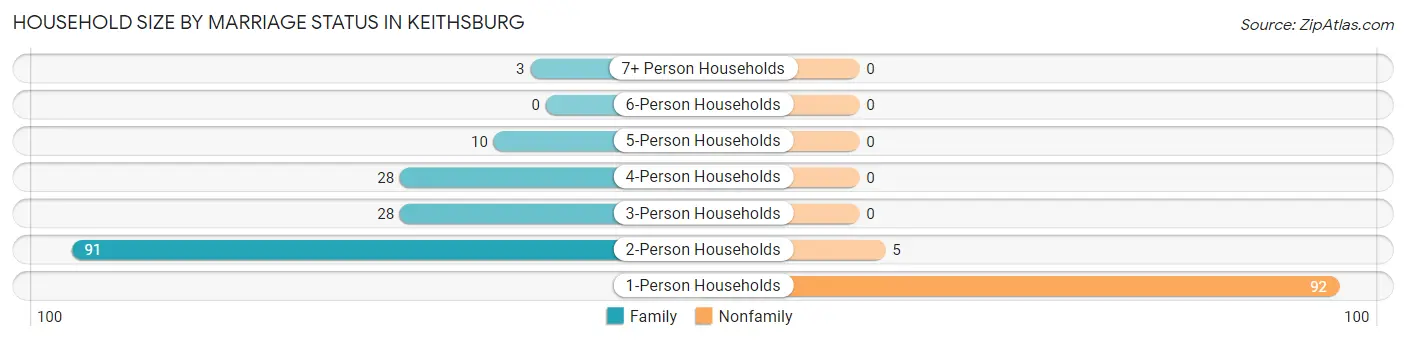
| Household Size | Family Households | Nonfamily Households |
| 1-Person Households | - | 92 (35.8%) |
| 2-Person Households | 91 (35.4%) | 5 (1.9%) |
| 3-Person Households | 28 (10.9%) | 0 (0.0%) |
| 4-Person Households | 28 (10.9%) | 0 (0.0%) |
| 5-Person Households | 10 (3.9%) | 0 (0.0%) |
| 6-Person Households | 0 (0.0%) | 0 (0.0%) |
| 7+ Person Households | 3 (1.2%) | 0 (0.0%) |
| Total | 160 (62.3%) | 97 (37.7%) |
Female Fertility in Keithsburg
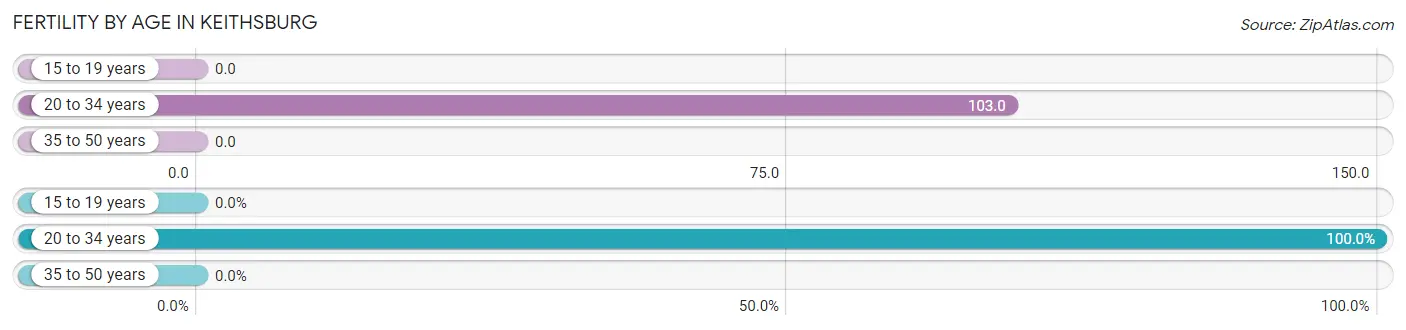
Fertility by Age in Keithsburg
Average fertility rate in Keithsburg is 43.0 births per 1,000 women. Women in the age bracket of 20 to 34 years have the highest fertility rate with 103.0 births per 1,000 women. Women in the age bracket of 20 to 34 years acount for 100.0% of all women with births.
| Age Bracket | Women with Births | Births / 1,000 Women |
| 15 to 19 years | 0 (0.0%) | 0.0 |
| 20 to 34 years | 4 (100.0%) | 103.0 |
| 35 to 50 years | 0 (0.0%) | 0.0 |
| Total | 4 (100.0%) | 43.0 |
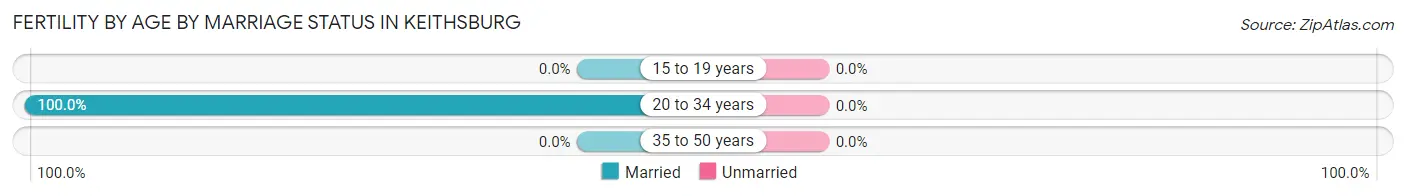
Fertility by Age by Marriage Status in Keithsburg
| Age Bracket | Married | Unmarried |
| 15 to 19 years | 0 (0.0%) | 0 (0.0%) |
| 20 to 34 years | 4 (100.0%) | 0 (0.0%) |
| 35 to 50 years | 0 (0.0%) | 0 (0.0%) |
| Total | 4 (100.0%) | 0 (0.0%) |
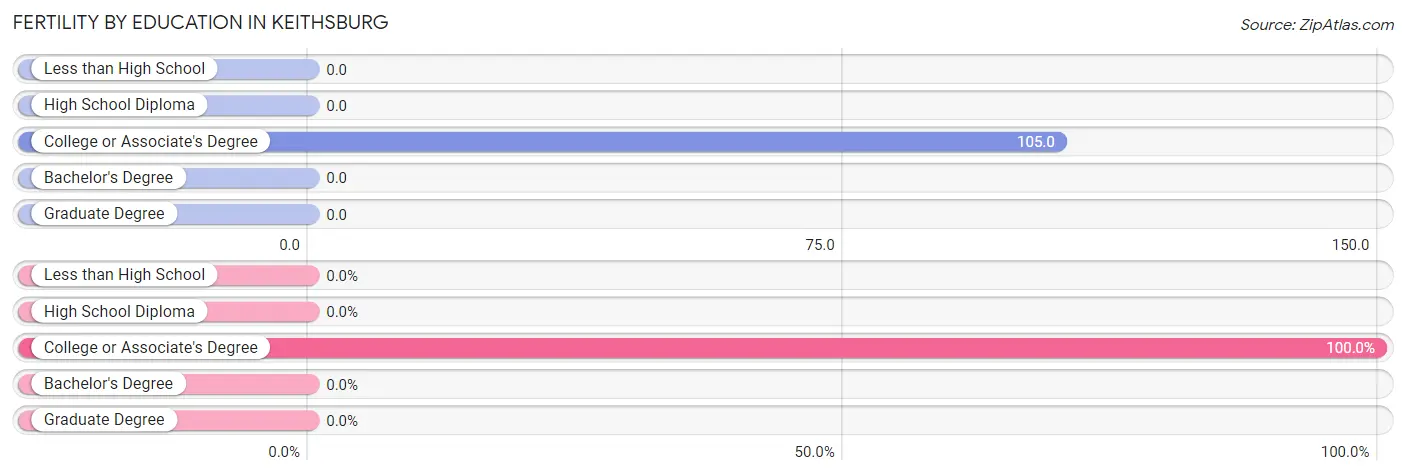
Fertility by Education in Keithsburg
| Educational Attainment | Women with Births | Births / 1,000 Women |
| Less than High School | 0 (0.0%) | 0.0 |
| High School Diploma | 0 (0.0%) | 0.0 |
| College or Associate's Degree | 4 (100.0%) | 105.0 |
| Bachelor's Degree | 0 (0.0%) | 0.0 |
| Graduate Degree | 0 (0.0%) | 0.0 |
| Total | 4 (100.0%) | 43.0 |
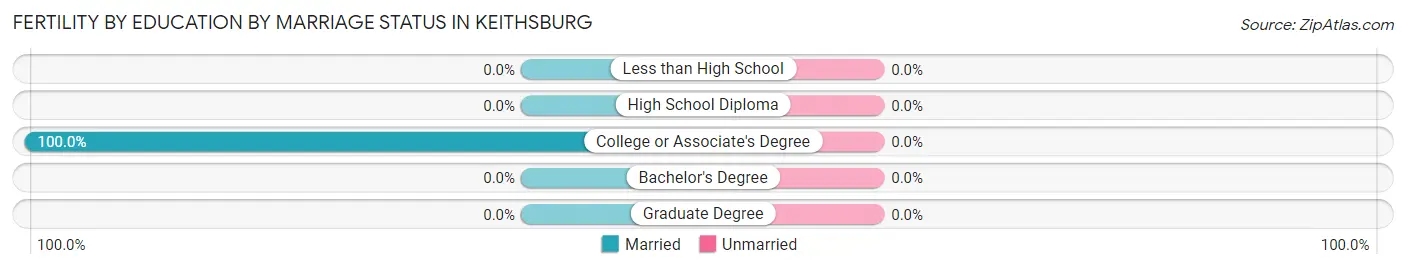
Fertility by Education by Marriage Status in Keithsburg
| Educational Attainment | Married | Unmarried |
| Less than High School | 0 (0.0%) | 0 (0.0%) |
| High School Diploma | 0 (0.0%) | 0 (0.0%) |
| College or Associate's Degree | 4 (100.0%) | 0 (0.0%) |
| Bachelor's Degree | 0 (0.0%) | 0 (0.0%) |
| Graduate Degree | 0 (0.0%) | 0 (0.0%) |
| Total | 4 (100.0%) | 0 (0.0%) |
Employment Characteristics in Keithsburg
Employment by Class of Employer in Keithsburg
Among the 253 employed individuals in Keithsburg, private company employees (216 | 85.4%), local government employees (17 | 6.7%), and not-for-profit organizations (11 | 4.3%) make up the most common classes of employment.
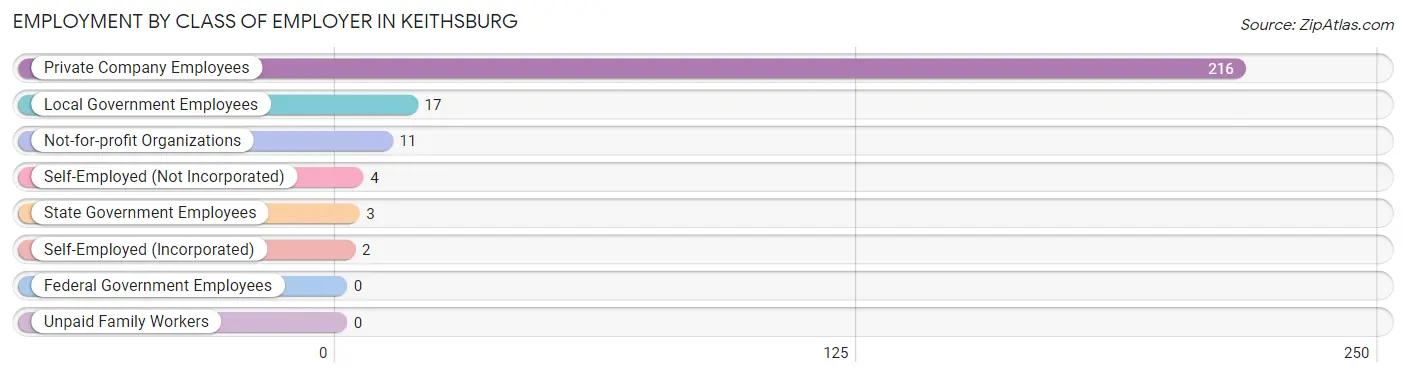
| Employer Class | # Employees | % Employees |
| Private Company Employees | 216 | 85.4% |
| Self-Employed (Incorporated) | 2 | 0.8% |
| Self-Employed (Not Incorporated) | 4 | 1.6% |
| Not-for-profit Organizations | 11 | 4.3% |
| Local Government Employees | 17 | 6.7% |
| State Government Employees | 3 | 1.2% |
| Federal Government Employees | 0 | 0.0% |
| Unpaid Family Workers | 0 | 0.0% |
| Total | 253 | 100.0% |
Employment Status by Age in Keithsburg
According to the labor force statistics for Keithsburg, out of the total population over 16 years of age (474), 60.3% or 286 individuals are in the labor force, with 11.5% or 33 of them unemployed. The age group with the highest labor force participation rate is 25 to 29 years, with 100.0% or 41 individuals in the labor force. Within the labor force, the 45 to 54 years age range has the highest percentage of unemployed individuals, with 33.3% or 29 of them being unemployed.
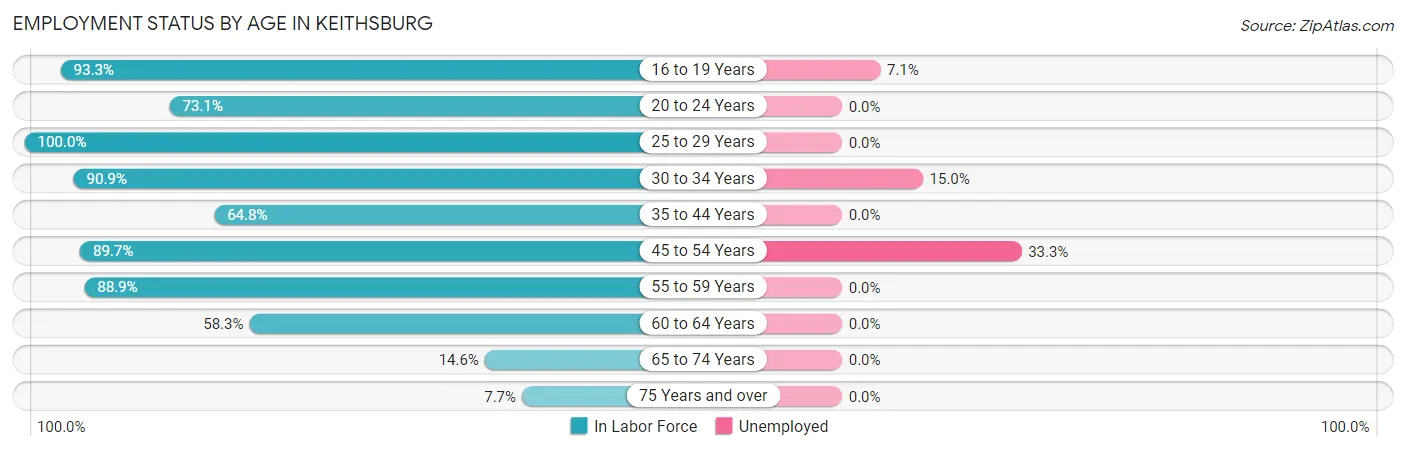
| Age Bracket | In Labor Force | Unemployed |
| 16 to 19 Years | 14 (93.3%) | 1 (7.1%) |
| 20 to 24 Years | 19 (73.1%) | 0 (0.0%) |
| 25 to 29 Years | 41 (100.0%) | 0 (0.0%) |
| 30 to 34 Years | 20 (90.9%) | 3 (15.0%) |
| 35 to 44 Years | 35 (64.8%) | 0 (0.0%) |
| 45 to 54 Years | 87 (89.7%) | 29 (33.3%) |
| 55 to 59 Years | 32 (88.9%) | 0 (0.0%) |
| 60 to 64 Years | 21 (58.3%) | 0 (0.0%) |
| 65 to 74 Years | 12 (14.6%) | 0 (0.0%) |
| 75 Years and over | 5 (7.7%) | 0 (0.0%) |
| Total | 286 (60.3%) | 33 (11.5%) |
Employment Status by Educational Attainment in Keithsburg
According to labor force statistics for Keithsburg, 82.5% of individuals (236) out of the total population between 25 and 64 years of age (286) are in the labor force, with 13.6% or 32 of them being unemployed. The group with the highest labor force participation rate are those with the educational attainment of college / associate degree, with 93.9% or 93 individuals in the labor force. Within the labor force, individuals with less than high school education have the highest percentage of unemployment, with 50.0% or 9 of them being unemployed.
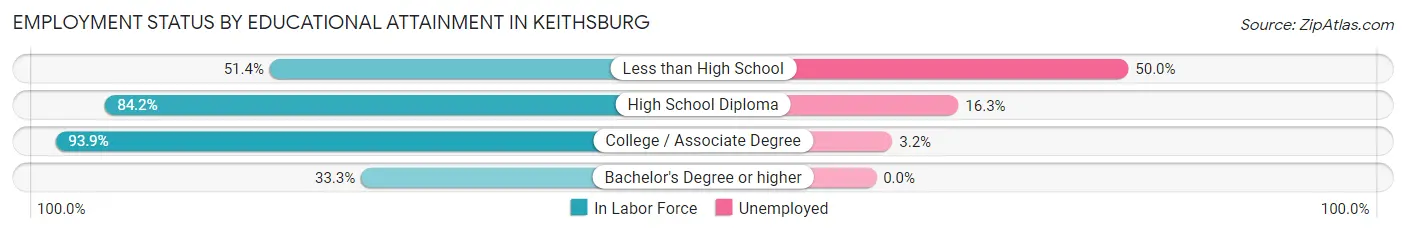
| Educational Attainment | In Labor Force | Unemployed |
| Less than High School | 18 (51.4%) | 18 (50.0%) |
| High School Diploma | 123 (84.2%) | 24 (16.3%) |
| College / Associate Degree | 93 (93.9%) | 3 (3.2%) |
| Bachelor's Degree or higher | 2 (33.3%) | 0 (0.0%) |
| Total | 236 (82.5%) | 39 (13.6%) |
Employment Occupations by Sex in Keithsburg
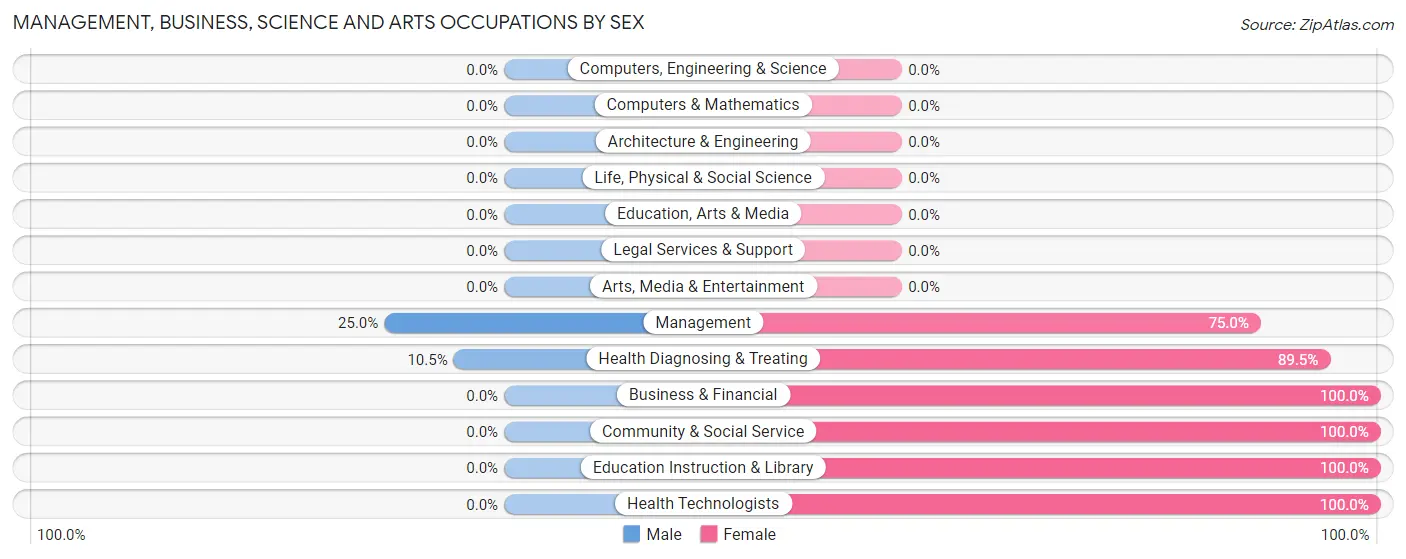
Management, Business, Science and Arts Occupations
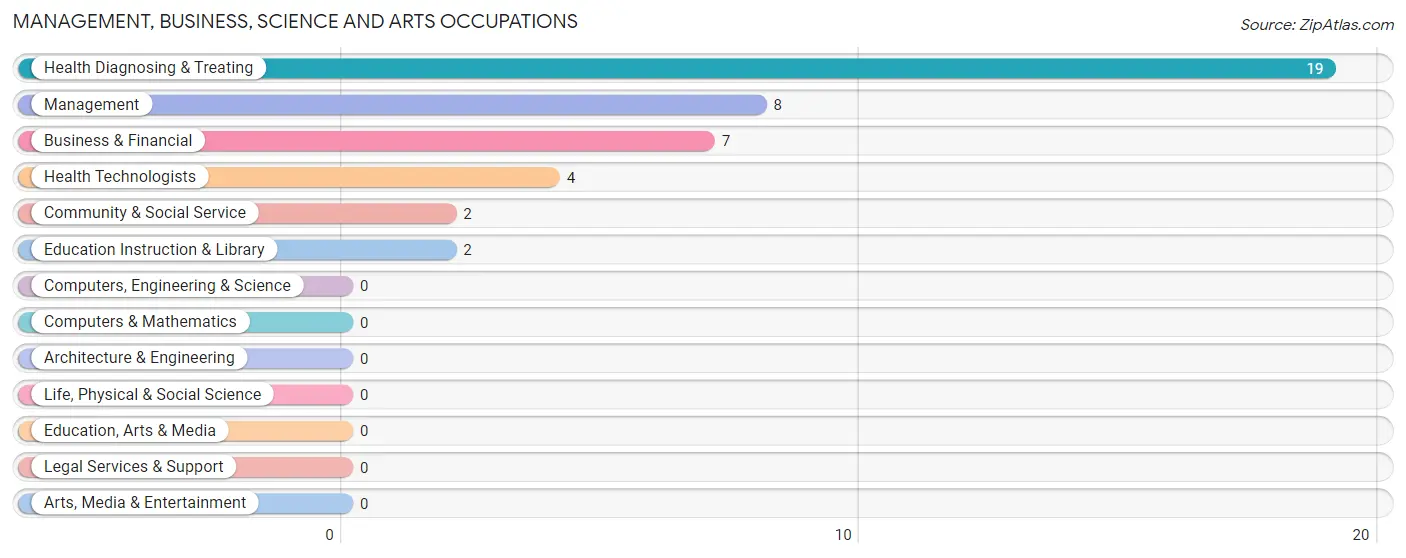
The most common Management, Business, Science and Arts occupations in Keithsburg are Health Diagnosing & Treating (19 | 7.5%), Management (8 | 3.2%), Business & Financial (7 | 2.8%), Health Technologists (4 | 1.6%), and Community & Social Service (2 | 0.8%).
Management, Business, Science and Arts Occupations by Sex
Within the Management, Business, Science and Arts occupations in Keithsburg, the most male-oriented occupations are Management (25.0%), and Health Diagnosing & Treating (10.5%), while the most female-oriented occupations are Business & Financial (100.0%), Community & Social Service (100.0%), and Education Instruction & Library (100.0%).
| Occupation | Male | Female |
| Management | 2 (25.0%) | 6 (75.0%) |
| Business & Financial | 0 (0.0%) | 7 (100.0%) |
| Computers, Engineering & Science | 0 (0.0%) | 0 (0.0%) |
| Computers & Mathematics | 0 (0.0%) | 0 (0.0%) |
| Architecture & Engineering | 0 (0.0%) | 0 (0.0%) |
| Life, Physical & Social Science | 0 (0.0%) | 0 (0.0%) |
| Community & Social Service | 0 (0.0%) | 2 (100.0%) |
| Education, Arts & Media | 0 (0.0%) | 0 (0.0%) |
| Legal Services & Support | 0 (0.0%) | 0 (0.0%) |
| Education Instruction & Library | 0 (0.0%) | 2 (100.0%) |
| Arts, Media & Entertainment | 0 (0.0%) | 0 (0.0%) |
| Health Diagnosing & Treating | 2 (10.5%) | 17 (89.5%) |
| Health Technologists | 0 (0.0%) | 4 (100.0%) |
| Total (Category) | 4 (11.1%) | 32 (88.9%) |
| Total (Overall) | 124 (49.0%) | 129 (51.0%) |
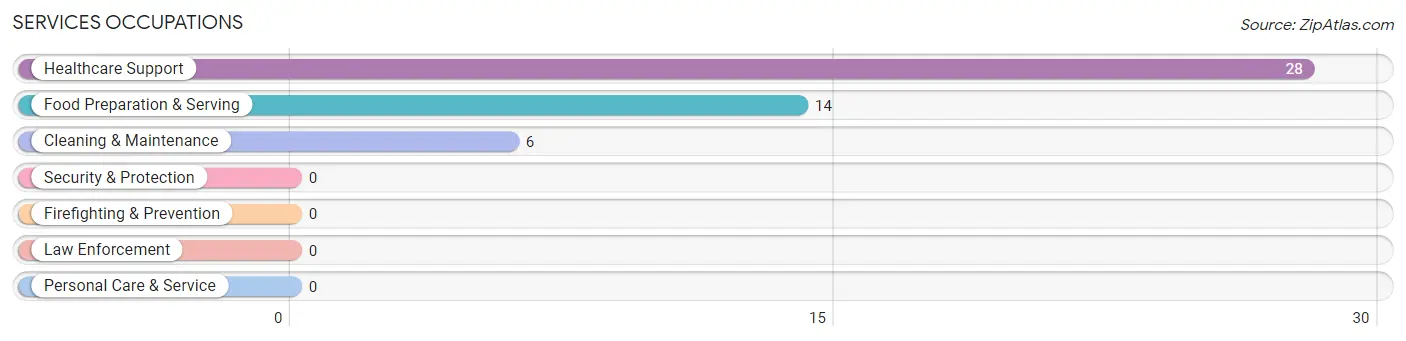
Services Occupations
The most common Services occupations in Keithsburg are Healthcare Support (28 | 11.1%), Food Preparation & Serving (14 | 5.5%), and Cleaning & Maintenance (6 | 2.4%).
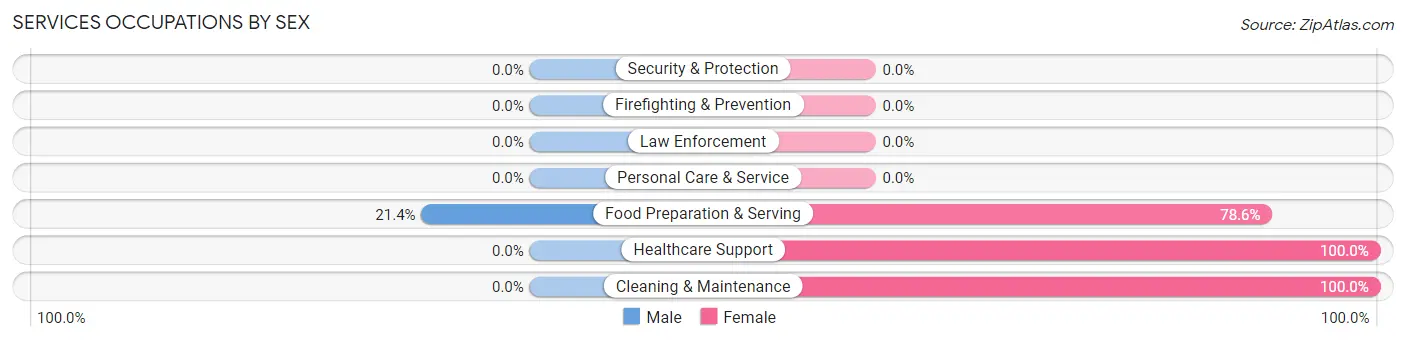
Services Occupations by Sex
| Occupation | Male | Female |
| Healthcare Support | 0 (0.0%) | 28 (100.0%) |
| Security & Protection | 0 (0.0%) | 0 (0.0%) |
| Firefighting & Prevention | 0 (0.0%) | 0 (0.0%) |
| Law Enforcement | 0 (0.0%) | 0 (0.0%) |
| Food Preparation & Serving | 3 (21.4%) | 11 (78.6%) |
| Cleaning & Maintenance | 0 (0.0%) | 6 (100.0%) |
| Personal Care & Service | 0 (0.0%) | 0 (0.0%) |
| Total (Category) | 3 (6.2%) | 45 (93.8%) |
| Total (Overall) | 124 (49.0%) | 129 (51.0%) |
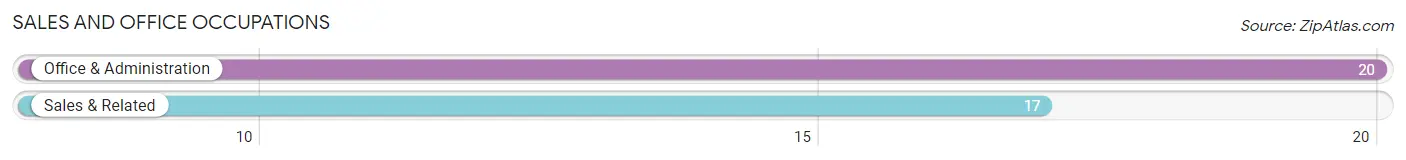
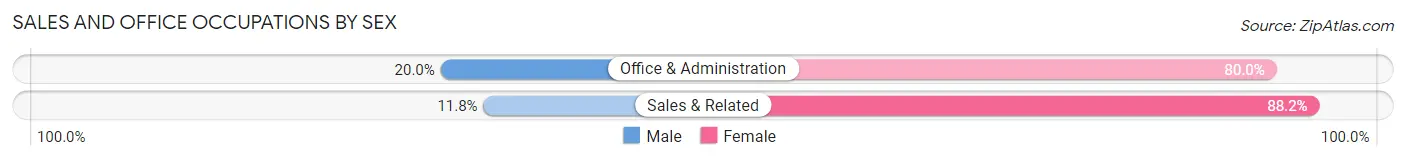
Sales and Office Occupations
The most common Sales and Office occupations in Keithsburg are Office & Administration (20 | 7.9%), and Sales & Related (17 | 6.7%).
Sales and Office Occupations by Sex
| Occupation | Male | Female |
| Sales & Related | 2 (11.8%) | 15 (88.2%) |
| Office & Administration | 4 (20.0%) | 16 (80.0%) |
| Total (Category) | 6 (16.2%) | 31 (83.8%) |
| Total (Overall) | 124 (49.0%) | 129 (51.0%) |
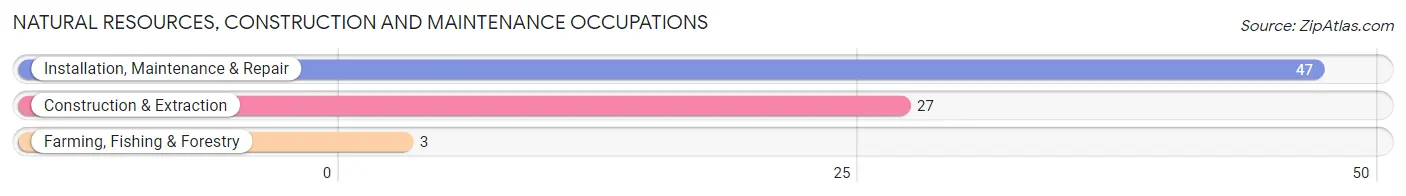
Natural Resources, Construction and Maintenance Occupations
The most common Natural Resources, Construction and Maintenance occupations in Keithsburg are Installation, Maintenance & Repair (47 | 18.6%), Construction & Extraction (27 | 10.7%), and Farming, Fishing & Forestry (3 | 1.2%).
Natural Resources, Construction and Maintenance Occupations by Sex
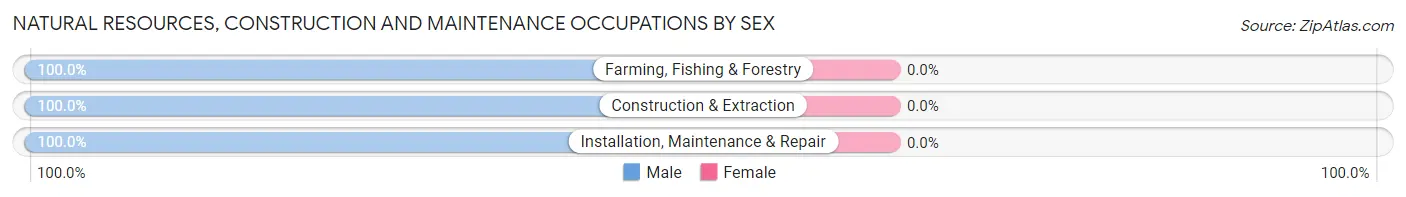
| Occupation | Male | Female |
| Farming, Fishing & Forestry | 3 (100.0%) | 0 (0.0%) |
| Construction & Extraction | 27 (100.0%) | 0 (0.0%) |
| Installation, Maintenance & Repair | 47 (100.0%) | 0 (0.0%) |
| Total (Category) | 77 (100.0%) | 0 (0.0%) |
| Total (Overall) | 124 (49.0%) | 129 (51.0%) |
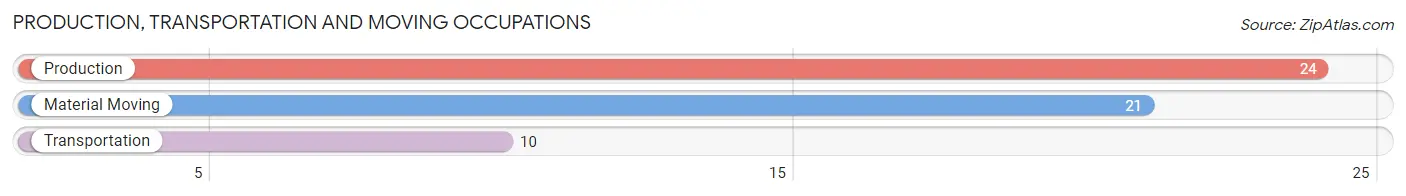
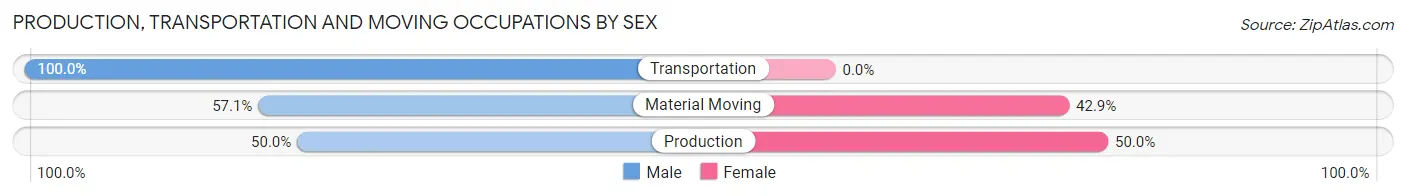
Production, Transportation and Moving Occupations
The most common Production, Transportation and Moving occupations in Keithsburg are Production (24 | 9.5%), Material Moving (21 | 8.3%), and Transportation (10 | 4.0%).
Production, Transportation and Moving Occupations by Sex
| Occupation | Male | Female |
| Production | 12 (50.0%) | 12 (50.0%) |
| Transportation | 10 (100.0%) | 0 (0.0%) |
| Material Moving | 12 (57.1%) | 9 (42.9%) |
| Total (Category) | 34 (61.8%) | 21 (38.2%) |
| Total (Overall) | 124 (49.0%) | 129 (51.0%) |
Employment Industries by Sex in Keithsburg
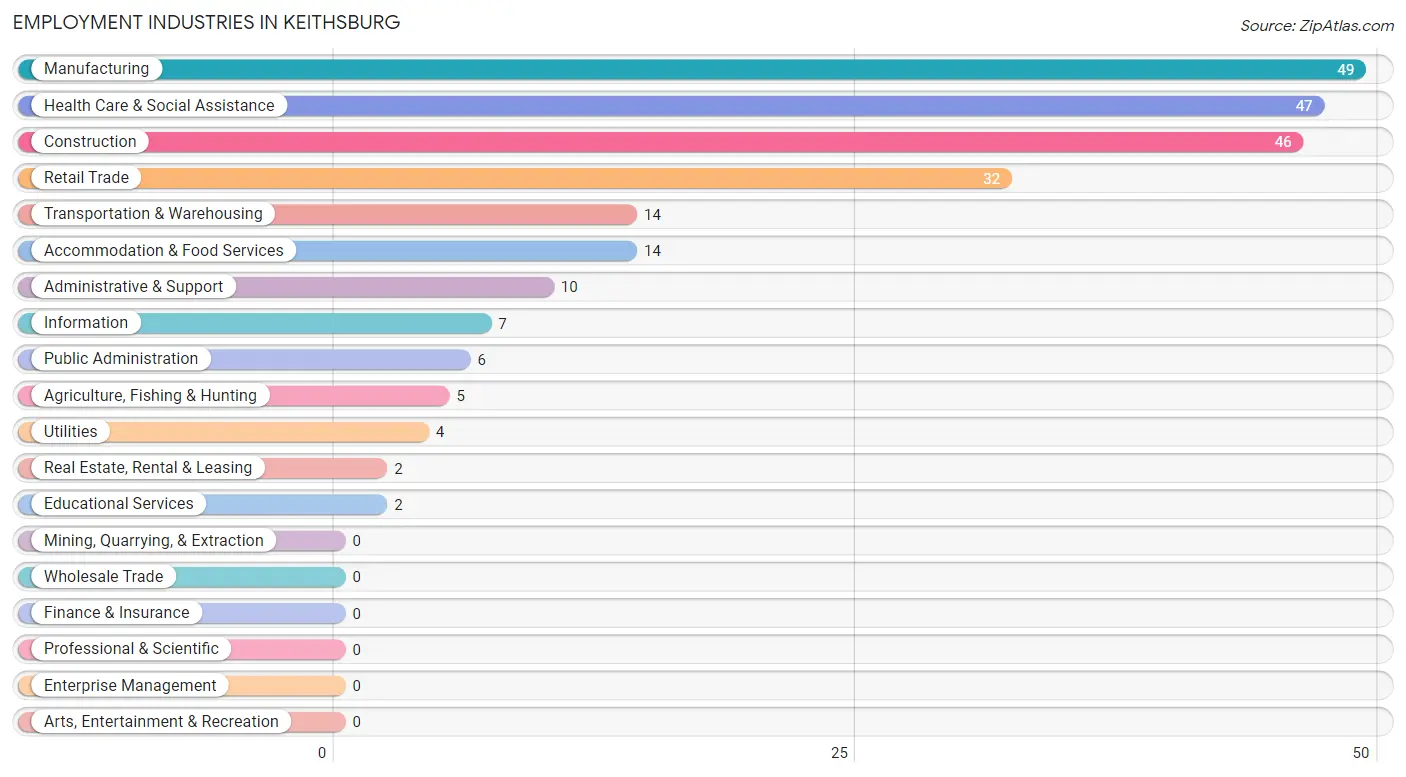
Employment Industries in Keithsburg
The major employment industries in Keithsburg include Manufacturing (49 | 19.4%), Health Care & Social Assistance (47 | 18.6%), Construction (46 | 18.2%), Retail Trade (32 | 12.7%), and Transportation & Warehousing (14 | 5.5%).
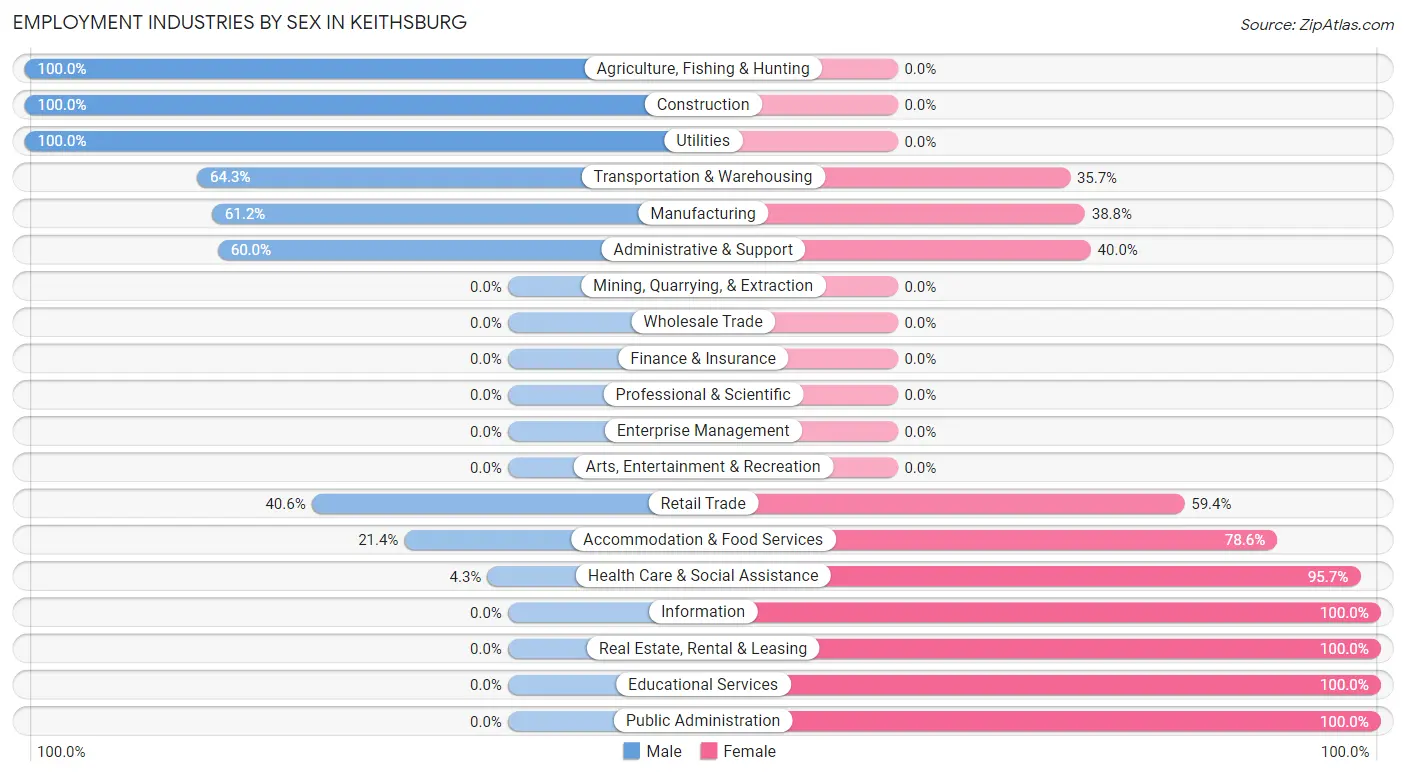
Employment Industries by Sex in Keithsburg
The Keithsburg industries that see more men than women are Agriculture, Fishing & Hunting (100.0%), Construction (100.0%), and Utilities (100.0%), whereas the industries that tend to have a higher number of women are Information (100.0%), Real Estate, Rental & Leasing (100.0%), and Educational Services (100.0%).
| Industry | Male | Female |
| Agriculture, Fishing & Hunting | 5 (100.0%) | 0 (0.0%) |
| Mining, Quarrying, & Extraction | 0 (0.0%) | 0 (0.0%) |
| Construction | 46 (100.0%) | 0 (0.0%) |
| Manufacturing | 30 (61.2%) | 19 (38.8%) |
| Wholesale Trade | 0 (0.0%) | 0 (0.0%) |
| Retail Trade | 13 (40.6%) | 19 (59.4%) |
| Transportation & Warehousing | 9 (64.3%) | 5 (35.7%) |
| Utilities | 4 (100.0%) | 0 (0.0%) |
| Information | 0 (0.0%) | 7 (100.0%) |
| Finance & Insurance | 0 (0.0%) | 0 (0.0%) |
| Real Estate, Rental & Leasing | 0 (0.0%) | 2 (100.0%) |
| Professional & Scientific | 0 (0.0%) | 0 (0.0%) |
| Enterprise Management | 0 (0.0%) | 0 (0.0%) |
| Administrative & Support | 6 (60.0%) | 4 (40.0%) |
| Educational Services | 0 (0.0%) | 2 (100.0%) |
| Health Care & Social Assistance | 2 (4.3%) | 45 (95.7%) |
| Arts, Entertainment & Recreation | 0 (0.0%) | 0 (0.0%) |
| Accommodation & Food Services | 3 (21.4%) | 11 (78.6%) |
| Public Administration | 0 (0.0%) | 6 (100.0%) |
| Total | 124 (49.0%) | 129 (51.0%) |
Education in Keithsburg
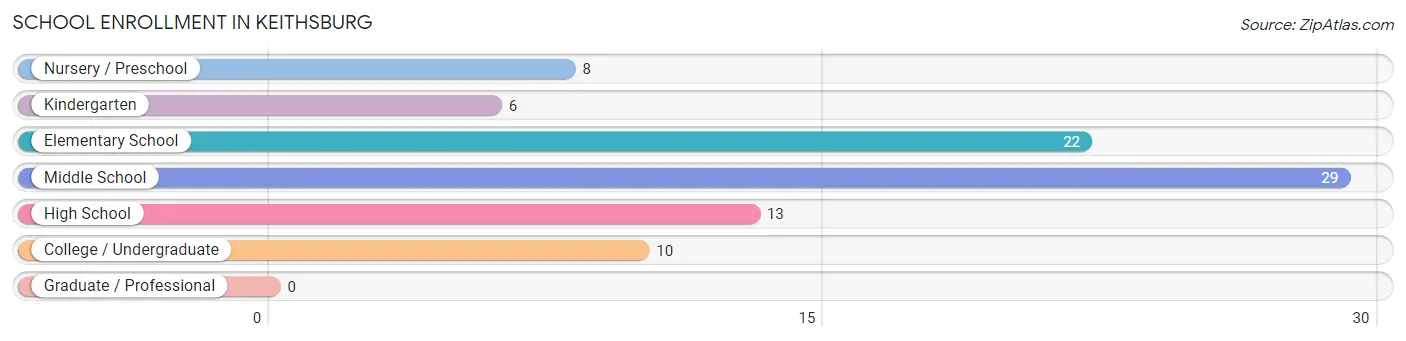
School Enrollment in Keithsburg
The most common levels of schooling among the 88 students in Keithsburg are middle school (29 | 33.0%), elementary school (22 | 25.0%), and high school (13 | 14.8%).
| School Level | # Students | % Students |
| Nursery / Preschool | 8 | 9.1% |
| Kindergarten | 6 | 6.8% |
| Elementary School | 22 | 25.0% |
| Middle School | 29 | 33.0% |
| High School | 13 | 14.8% |
| College / Undergraduate | 10 | 11.4% |
| Graduate / Professional | 0 | 0.0% |
| Total | 88 | 100.0% |
School Enrollment by Age by Funding Source in Keithsburg
Out of a total of 88 students who are enrolled in schools in Keithsburg, 9 (10.2%) attend a private institution, while the remaining 79 (89.8%) are enrolled in public schools. The age group of 10 to 14 year olds has the highest likelihood of being enrolled in private schools, with 8 (21.0% in the age bracket) enrolled. Conversely, the age group of 3 to 4 year olds has the lowest likelihood of being enrolled in a private school, with 8 (100.0% in the age bracket) attending a public institution.
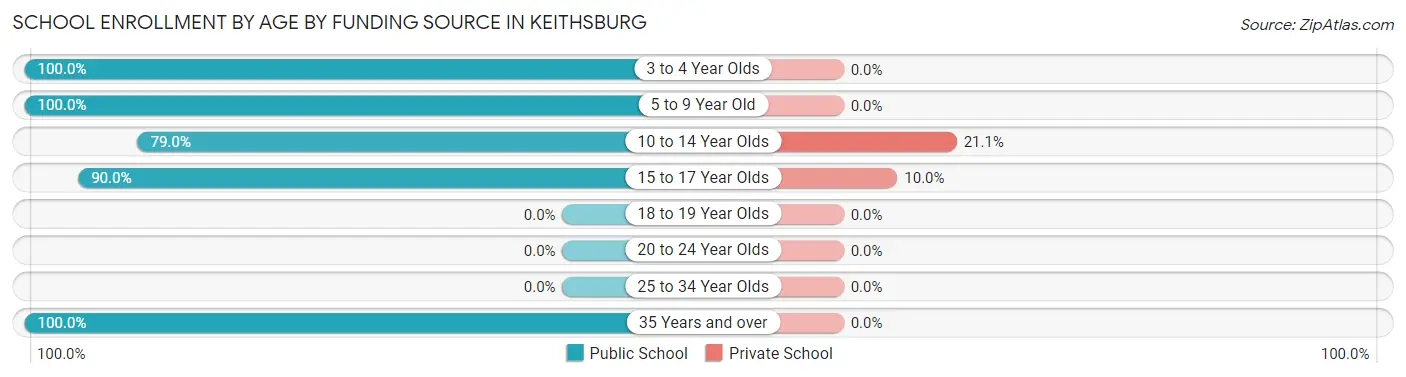
| Age Bracket | Public School | Private School |
| 3 to 4 Year Olds | 8 (100.0%) | 0 (0.0%) |
| 5 to 9 Year Old | 22 (100.0%) | 0 (0.0%) |
| 10 to 14 Year Olds | 30 (78.9%) | 8 (21.0%) |
| 15 to 17 Year Olds | 9 (90.0%) | 1 (10.0%) |
| 18 to 19 Year Olds | 0 (0.0%) | 0 (0.0%) |
| 20 to 24 Year Olds | 0 (0.0%) | 0 (0.0%) |
| 25 to 34 Year Olds | 0 (0.0%) | 0 (0.0%) |
| 35 Years and over | 10 (100.0%) | 0 (0.0%) |
| Total | 79 (89.8%) | 9 (10.2%) |
Educational Attainment by Field of Study in Keithsburg
Education (6 | 46.2%), arts & humanities (4 | 30.8%), and bio, nature & agricultural (3 | 23.1%) are the most common fields of study among 13 individuals in Keithsburg who have obtained a bachelor's degree or higher.
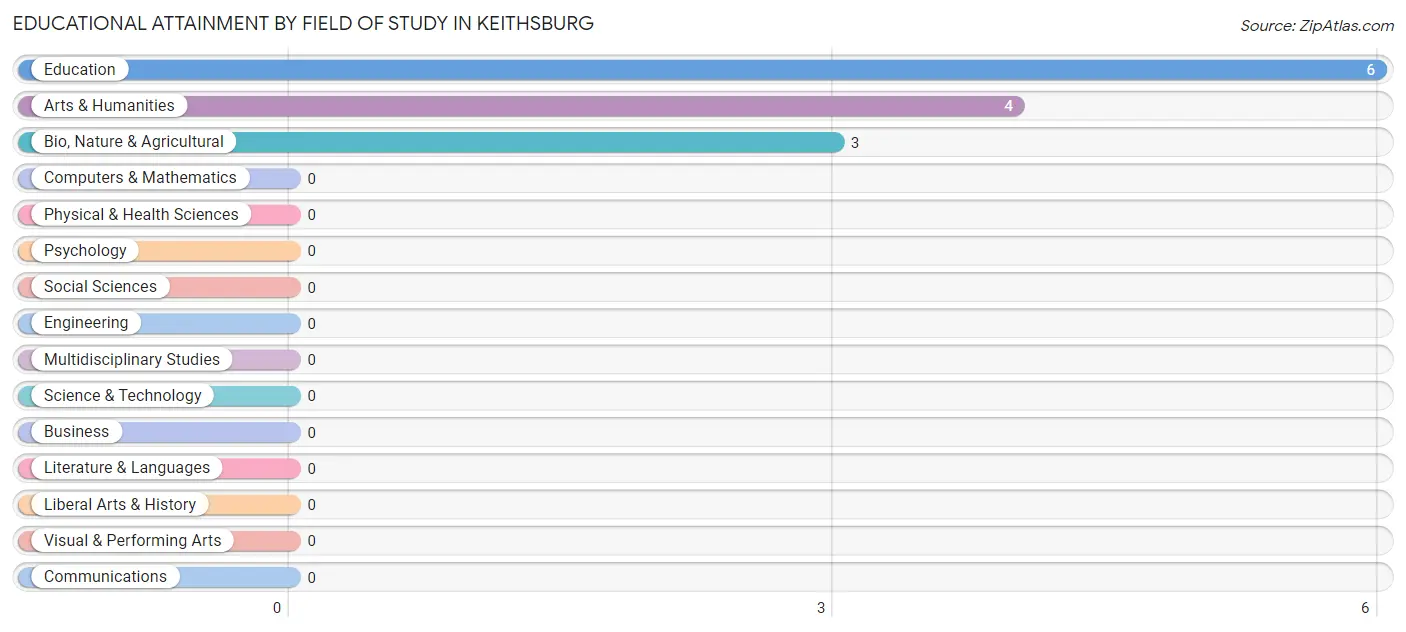
| Field of Study | # Graduates | % Graduates |
| Computers & Mathematics | 0 | 0.0% |
| Bio, Nature & Agricultural | 3 | 23.1% |
| Physical & Health Sciences | 0 | 0.0% |
| Psychology | 0 | 0.0% |
| Social Sciences | 0 | 0.0% |
| Engineering | 0 | 0.0% |
| Multidisciplinary Studies | 0 | 0.0% |
| Science & Technology | 0 | 0.0% |
| Business | 0 | 0.0% |
| Education | 6 | 46.2% |
| Literature & Languages | 0 | 0.0% |
| Liberal Arts & History | 0 | 0.0% |
| Visual & Performing Arts | 0 | 0.0% |
| Communications | 0 | 0.0% |
| Arts & Humanities | 4 | 30.8% |
| Total | 13 | 100.0% |
Transportation & Commute in Keithsburg
Vehicle Availability by Sex in Keithsburg
The most prevalent vehicle ownership categories in Keithsburg are males with 4 vehicles (49, accounting for 39.5%) and females with 4 vehicles (16, making up 38.0%).
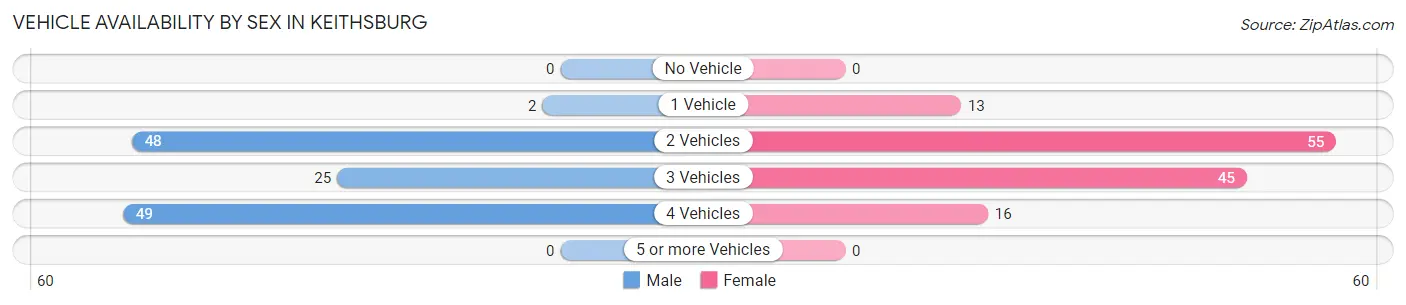
| Vehicles Available | Male | Female |
| No Vehicle | 0 (0.0%) | 0 (0.0%) |
| 1 Vehicle | 2 (1.6%) | 13 (10.1%) |
| 2 Vehicles | 48 (38.7%) | 55 (42.6%) |
| 3 Vehicles | 25 (20.2%) | 45 (34.9%) |
| 4 Vehicles | 49 (39.5%) | 16 (12.4%) |
| 5 or more Vehicles | 0 (0.0%) | 0 (0.0%) |
| Total | 124 (100.0%) | 129 (100.0%) |
Commute Time in Keithsburg
The most frequently occuring commute durations in Keithsburg are 45 to 59 minutes (54 commuters, 21.3%), 20 to 24 minutes (42 commuters, 16.6%), and 60 to 89 minutes (33 commuters, 13.0%).
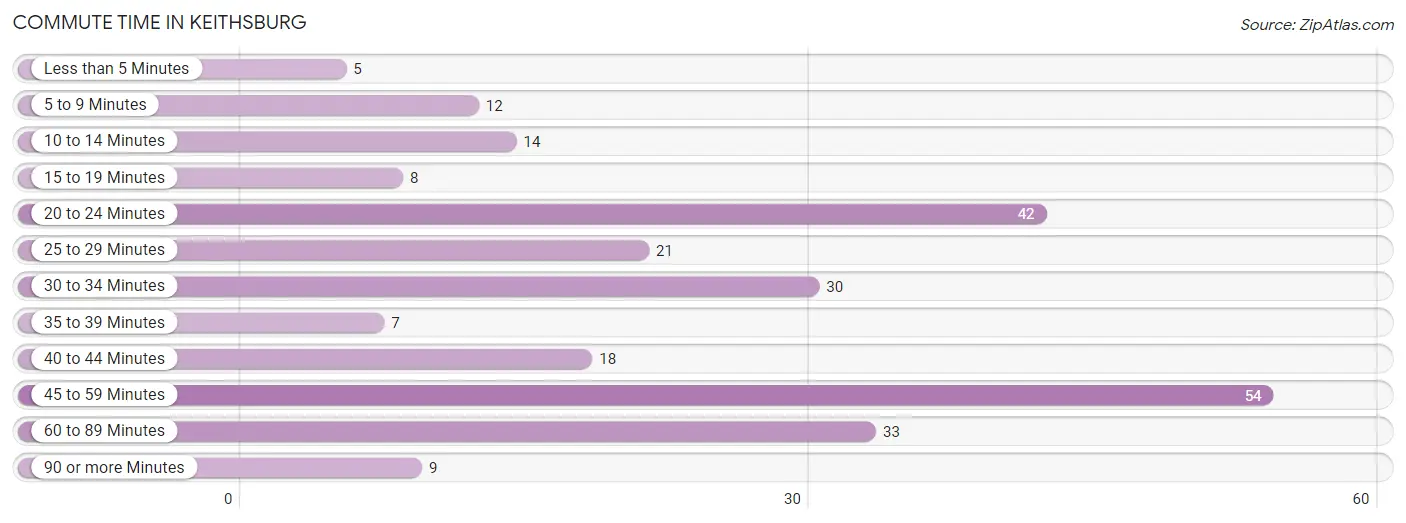
| Commute Time | # Commuters | % Commuters |
| Less than 5 Minutes | 5 | 2.0% |
| 5 to 9 Minutes | 12 | 4.7% |
| 10 to 14 Minutes | 14 | 5.5% |
| 15 to 19 Minutes | 8 | 3.2% |
| 20 to 24 Minutes | 42 | 16.6% |
| 25 to 29 Minutes | 21 | 8.3% |
| 30 to 34 Minutes | 30 | 11.9% |
| 35 to 39 Minutes | 7 | 2.8% |
| 40 to 44 Minutes | 18 | 7.1% |
| 45 to 59 Minutes | 54 | 21.3% |
| 60 to 89 Minutes | 33 | 13.0% |
| 90 or more Minutes | 9 | 3.6% |
Commute Time by Sex in Keithsburg
The most common commute times in Keithsburg are 45 to 59 minutes (32 commuters, 25.8%) for males and 45 to 59 minutes (22 commuters, 17.1%) for females.
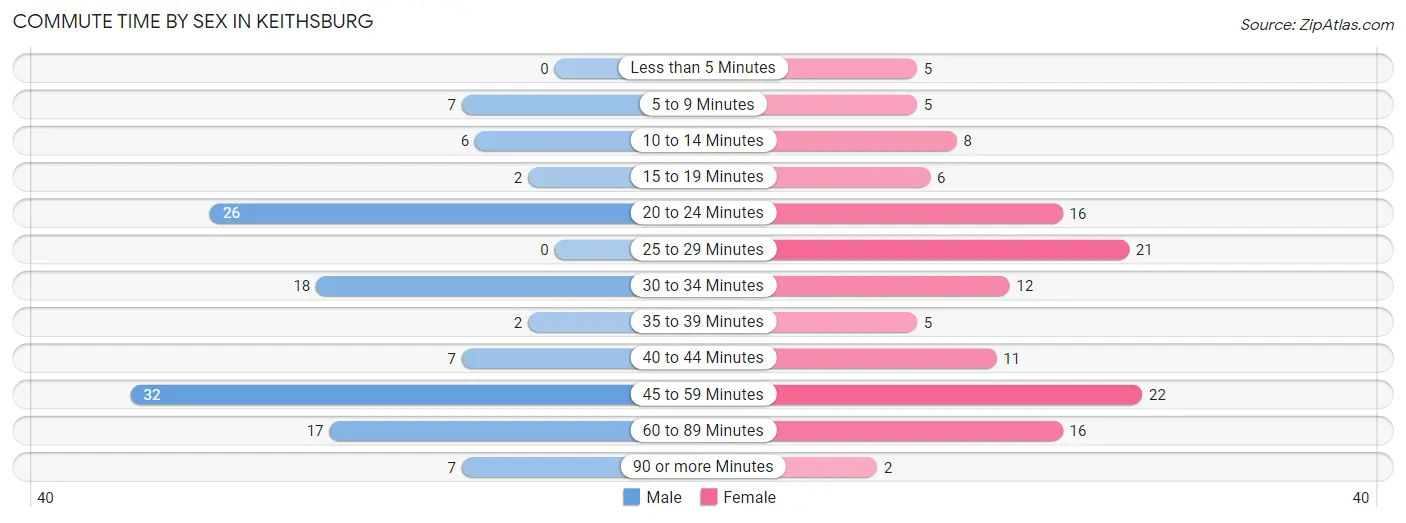
| Commute Time | Male | Female |
| Less than 5 Minutes | 0 (0.0%) | 5 (3.9%) |
| 5 to 9 Minutes | 7 (5.7%) | 5 (3.9%) |
| 10 to 14 Minutes | 6 (4.8%) | 8 (6.2%) |
| 15 to 19 Minutes | 2 (1.6%) | 6 (4.6%) |
| 20 to 24 Minutes | 26 (21.0%) | 16 (12.4%) |
| 25 to 29 Minutes | 0 (0.0%) | 21 (16.3%) |
| 30 to 34 Minutes | 18 (14.5%) | 12 (9.3%) |
| 35 to 39 Minutes | 2 (1.6%) | 5 (3.9%) |
| 40 to 44 Minutes | 7 (5.7%) | 11 (8.5%) |
| 45 to 59 Minutes | 32 (25.8%) | 22 (17.1%) |
| 60 to 89 Minutes | 17 (13.7%) | 16 (12.4%) |
| 90 or more Minutes | 7 (5.7%) | 2 (1.5%) |
Time of Departure to Work by Sex in Keithsburg
The most frequent times of departure to work in Keithsburg are 5:00 AM to 5:29 AM (28, 22.6%) for males and 6:30 AM to 6:59 AM (36, 27.9%) for females.
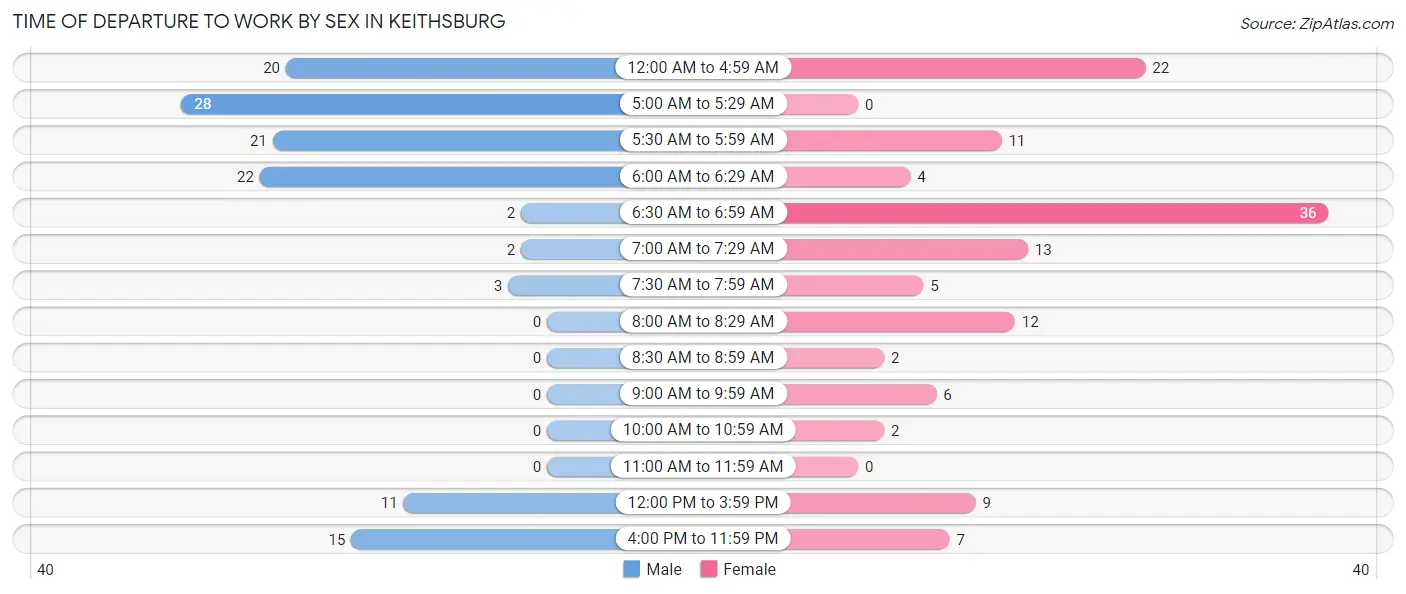
| Time of Departure | Male | Female |
| 12:00 AM to 4:59 AM | 20 (16.1%) | 22 (17.1%) |
| 5:00 AM to 5:29 AM | 28 (22.6%) | 0 (0.0%) |
| 5:30 AM to 5:59 AM | 21 (16.9%) | 11 (8.5%) |
| 6:00 AM to 6:29 AM | 22 (17.7%) | 4 (3.1%) |
| 6:30 AM to 6:59 AM | 2 (1.6%) | 36 (27.9%) |
| 7:00 AM to 7:29 AM | 2 (1.6%) | 13 (10.1%) |
| 7:30 AM to 7:59 AM | 3 (2.4%) | 5 (3.9%) |
| 8:00 AM to 8:29 AM | 0 (0.0%) | 12 (9.3%) |
| 8:30 AM to 8:59 AM | 0 (0.0%) | 2 (1.5%) |
| 9:00 AM to 9:59 AM | 0 (0.0%) | 6 (4.6%) |
| 10:00 AM to 10:59 AM | 0 (0.0%) | 2 (1.5%) |
| 11:00 AM to 11:59 AM | 0 (0.0%) | 0 (0.0%) |
| 12:00 PM to 3:59 PM | 11 (8.9%) | 9 (7.0%) |
| 4:00 PM to 11:59 PM | 15 (12.1%) | 7 (5.4%) |
| Total | 124 (100.0%) | 129 (100.0%) |
Housing Occupancy in Keithsburg
Occupancy by Ownership in Keithsburg
Of the total 257 dwellings in Keithsburg, owner-occupied units account for 220 (85.6%), while renter-occupied units make up 37 (14.4%).
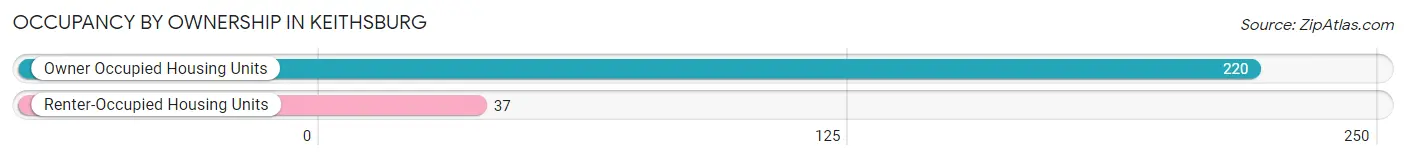
| Occupancy | # Housing Units | % Housing Units |
| Owner Occupied Housing Units | 220 | 85.6% |
| Renter-Occupied Housing Units | 37 | 14.4% |
| Total Occupied Housing Units | 257 | 100.0% |
Occupancy by Household Size in Keithsburg
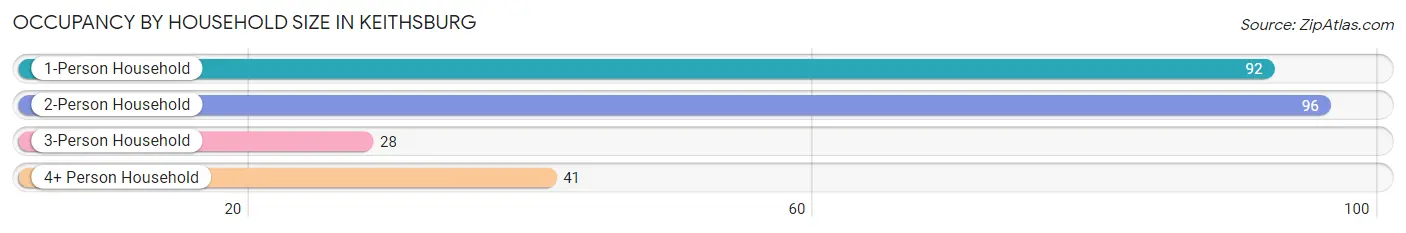
| Household Size | # Housing Units | % Housing Units |
| 1-Person Household | 92 | 35.8% |
| 2-Person Household | 96 | 37.3% |
| 3-Person Household | 28 | 10.9% |
| 4+ Person Household | 41 | 16.0% |
| Total Housing Units | 257 | 100.0% |
Occupancy by Ownership by Household Size in Keithsburg
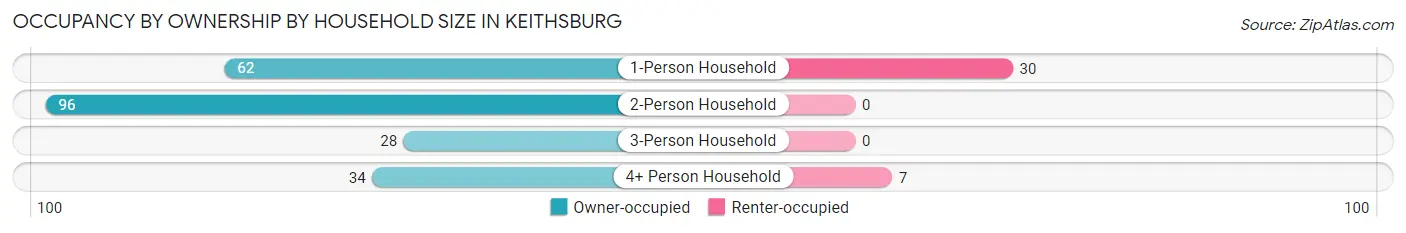
| Household Size | Owner-occupied | Renter-occupied |
| 1-Person Household | 62 (67.4%) | 30 (32.6%) |
| 2-Person Household | 96 (100.0%) | 0 (0.0%) |
| 3-Person Household | 28 (100.0%) | 0 (0.0%) |
| 4+ Person Household | 34 (82.9%) | 7 (17.1%) |
| Total Housing Units | 220 (85.6%) | 37 (14.4%) |
Occupancy by Educational Attainment in Keithsburg
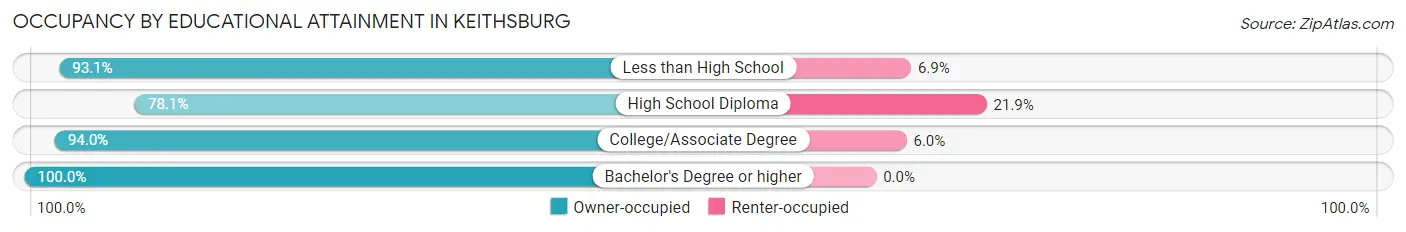
| Household Size | Owner-occupied | Renter-occupied |
| Less than High School | 27 (93.1%) | 2 (6.9%) |
| High School Diploma | 107 (78.1%) | 30 (21.9%) |
| College/Associate Degree | 78 (94.0%) | 5 (6.0%) |
| Bachelor's Degree or higher | 8 (100.0%) | 0 (0.0%) |
Occupancy by Age of Householder in Keithsburg
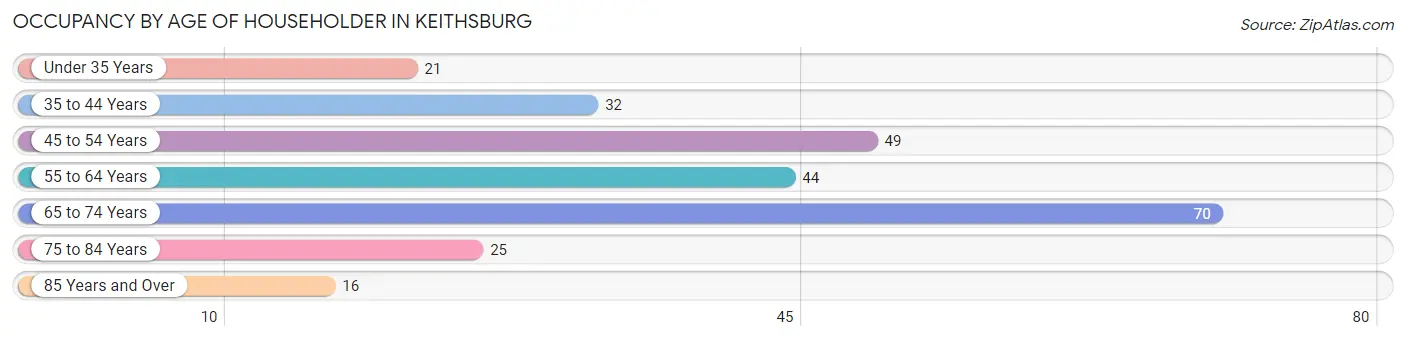
| Age Bracket | # Households | % Households |
| Under 35 Years | 21 | 8.2% |
| 35 to 44 Years | 32 | 12.4% |
| 45 to 54 Years | 49 | 19.1% |
| 55 to 64 Years | 44 | 17.1% |
| 65 to 74 Years | 70 | 27.2% |
| 75 to 84 Years | 25 | 9.7% |
| 85 Years and Over | 16 | 6.2% |
| Total | 257 | 100.0% |
Housing Finances in Keithsburg
Median Income by Occupancy in Keithsburg
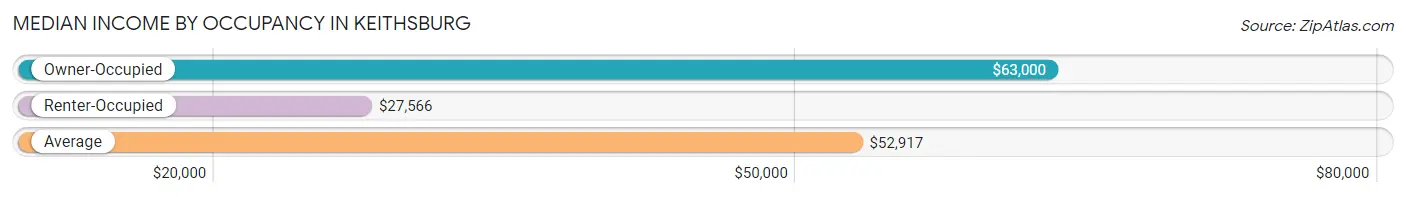
| Occupancy Type | # Households | Median Income |
| Owner-Occupied | 220 (85.6%) | $63,000 |
| Renter-Occupied | 37 (14.4%) | $27,566 |
| Average | 257 (100.0%) | $52,917 |
Occupancy by Householder Income Bracket in Keithsburg
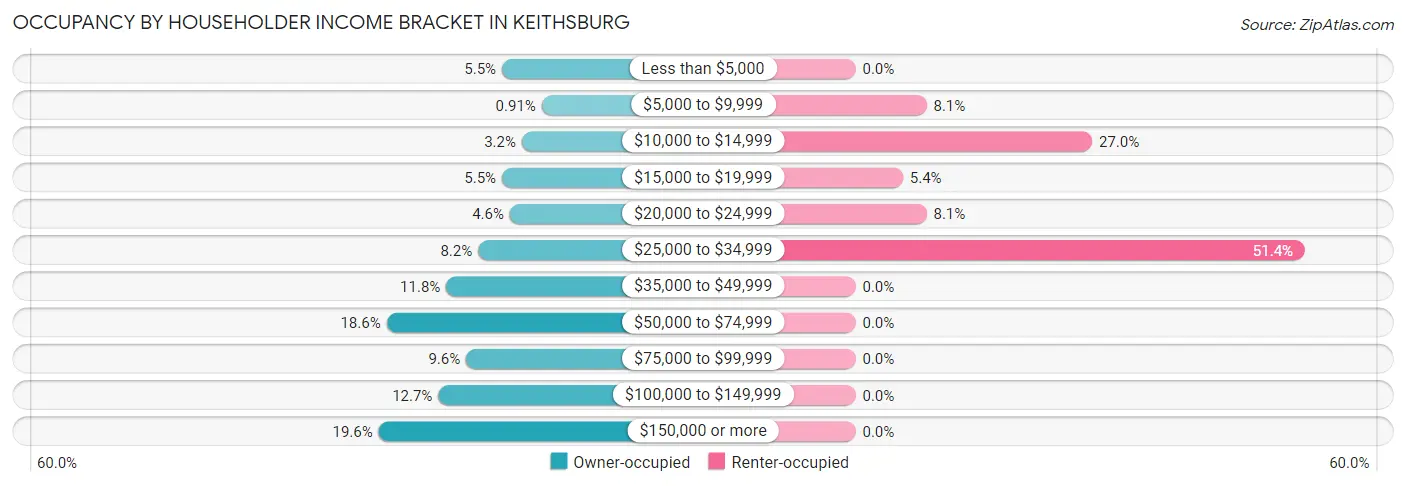
| Income Bracket | Owner-occupied | Renter-occupied |
| Less than $5,000 | 12 (5.4%) | 0 (0.0%) |
| $5,000 to $9,999 | 2 (0.9%) | 3 (8.1%) |
| $10,000 to $14,999 | 7 (3.2%) | 10 (27.0%) |
| $15,000 to $19,999 | 12 (5.4%) | 2 (5.4%) |
| $20,000 to $24,999 | 10 (4.5%) | 3 (8.1%) |
| $25,000 to $34,999 | 18 (8.2%) | 19 (51.3%) |
| $35,000 to $49,999 | 26 (11.8%) | 0 (0.0%) |
| $50,000 to $74,999 | 41 (18.6%) | 0 (0.0%) |
| $75,000 to $99,999 | 21 (9.6%) | 0 (0.0%) |
| $100,000 to $149,999 | 28 (12.7%) | 0 (0.0%) |
| $150,000 or more | 43 (19.6%) | 0 (0.0%) |
| Total | 220 (100.0%) | 37 (100.0%) |
Monthly Housing Cost Tiers in Keithsburg
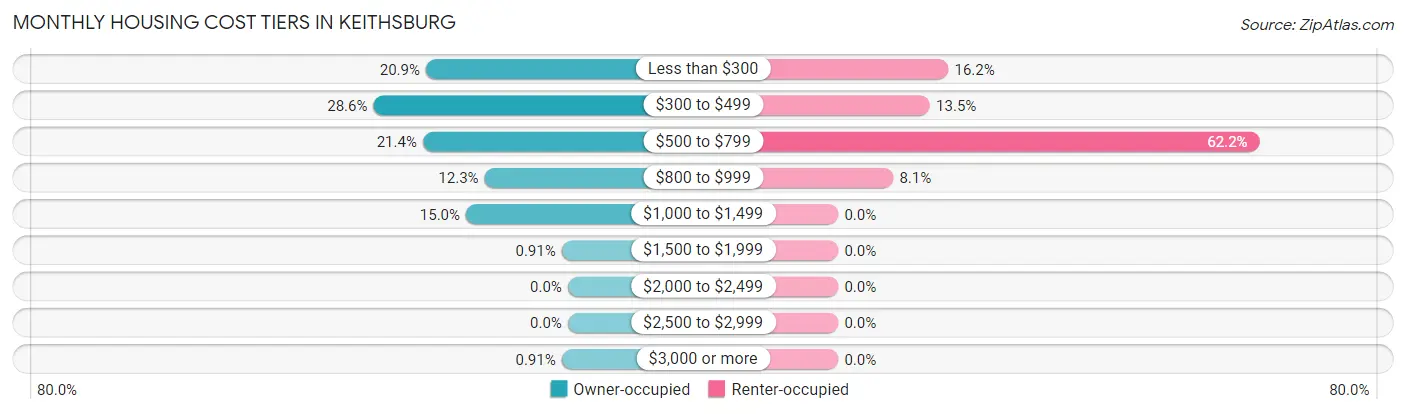
| Monthly Cost | Owner-occupied | Renter-occupied |
| Less than $300 | 46 (20.9%) | 6 (16.2%) |
| $300 to $499 | 63 (28.6%) | 5 (13.5%) |
| $500 to $799 | 47 (21.4%) | 23 (62.2%) |
| $800 to $999 | 27 (12.3%) | 3 (8.1%) |
| $1,000 to $1,499 | 33 (15.0%) | 0 (0.0%) |
| $1,500 to $1,999 | 2 (0.9%) | 0 (0.0%) |
| $2,000 to $2,499 | 0 (0.0%) | 0 (0.0%) |
| $2,500 to $2,999 | 0 (0.0%) | 0 (0.0%) |
| $3,000 or more | 2 (0.9%) | 0 (0.0%) |
| Total | 220 (100.0%) | 37 (100.0%) |
Physical Housing Characteristics in Keithsburg
Housing Structures in Keithsburg
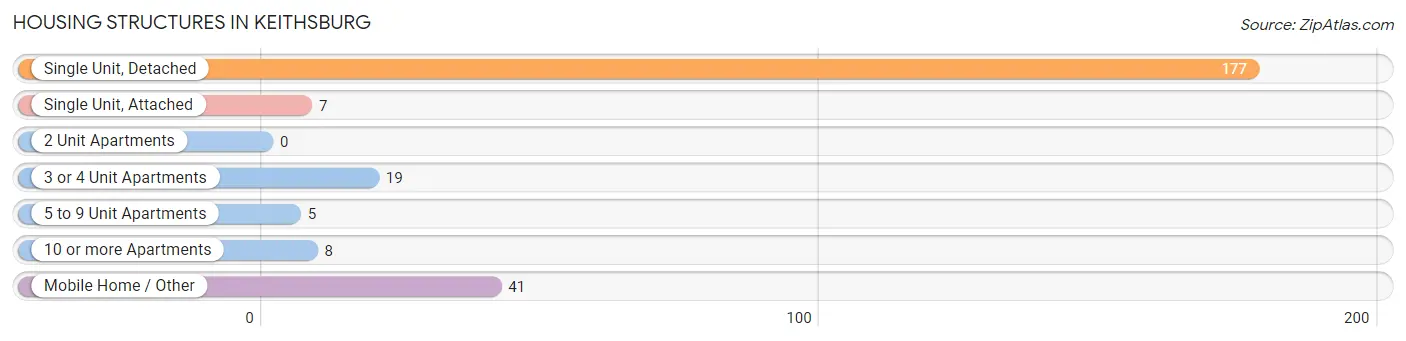
| Structure Type | # Housing Units | % Housing Units |
| Single Unit, Detached | 177 | 68.9% |
| Single Unit, Attached | 7 | 2.7% |
| 2 Unit Apartments | 0 | 0.0% |
| 3 or 4 Unit Apartments | 19 | 7.4% |
| 5 to 9 Unit Apartments | 5 | 1.9% |
| 10 or more Apartments | 8 | 3.1% |
| Mobile Home / Other | 41 | 16.0% |
| Total | 257 | 100.0% |
Housing Structures by Occupancy in Keithsburg
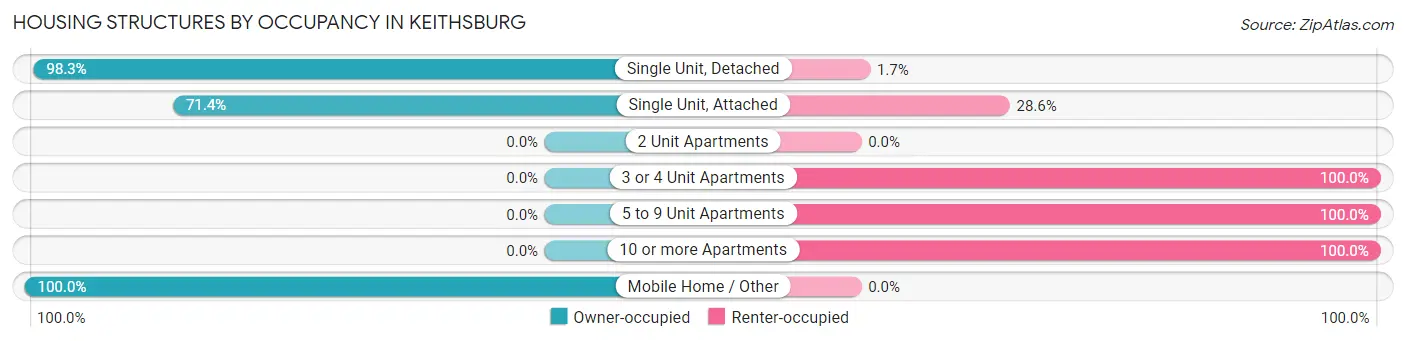
| Structure Type | Owner-occupied | Renter-occupied |
| Single Unit, Detached | 174 (98.3%) | 3 (1.7%) |
| Single Unit, Attached | 5 (71.4%) | 2 (28.6%) |
| 2 Unit Apartments | 0 (0.0%) | 0 (0.0%) |
| 3 or 4 Unit Apartments | 0 (0.0%) | 19 (100.0%) |
| 5 to 9 Unit Apartments | 0 (0.0%) | 5 (100.0%) |
| 10 or more Apartments | 0 (0.0%) | 8 (100.0%) |
| Mobile Home / Other | 41 (100.0%) | 0 (0.0%) |
| Total | 220 (85.6%) | 37 (14.4%) |
Housing Structures by Number of Rooms in Keithsburg
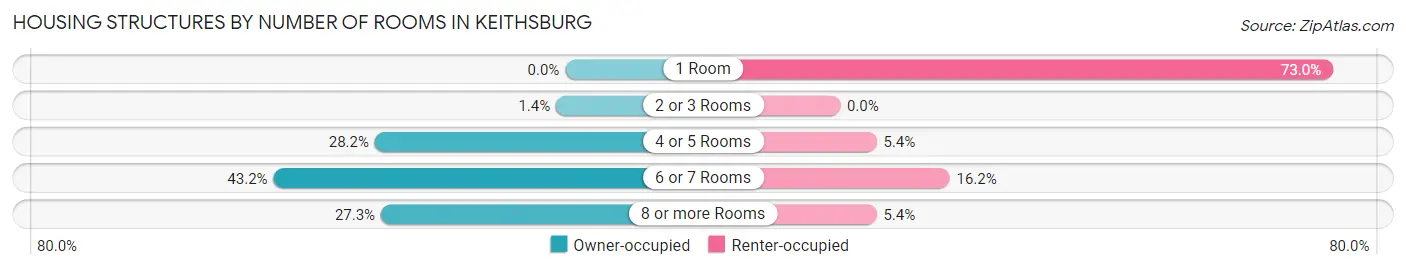
| Number of Rooms | Owner-occupied | Renter-occupied |
| 1 Room | 0 (0.0%) | 27 (73.0%) |
| 2 or 3 Rooms | 3 (1.4%) | 0 (0.0%) |
| 4 or 5 Rooms | 62 (28.2%) | 2 (5.4%) |
| 6 or 7 Rooms | 95 (43.2%) | 6 (16.2%) |
| 8 or more Rooms | 60 (27.3%) | 2 (5.4%) |
| Total | 220 (100.0%) | 37 (100.0%) |
Housing Structure by Heating Type in Keithsburg
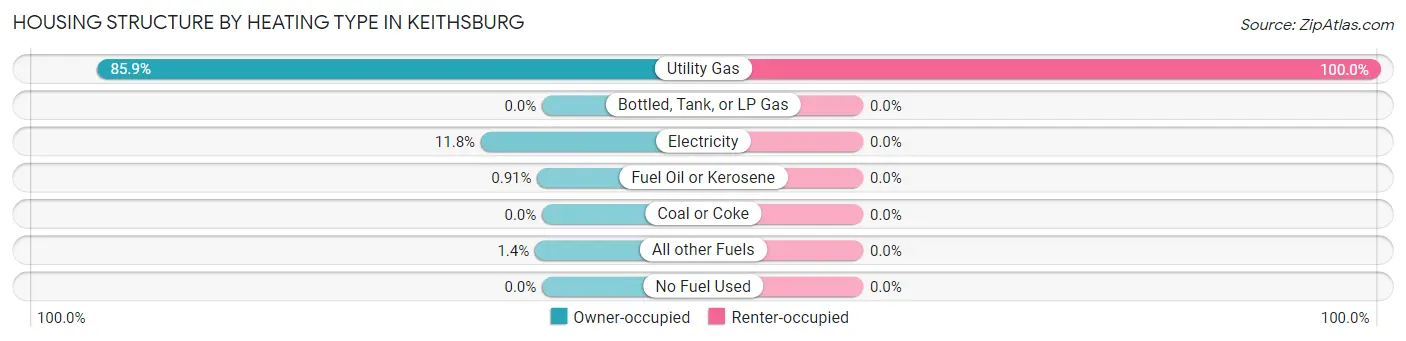
| Heating Type | Owner-occupied | Renter-occupied |
| Utility Gas | 189 (85.9%) | 37 (100.0%) |
| Bottled, Tank, or LP Gas | 0 (0.0%) | 0 (0.0%) |
| Electricity | 26 (11.8%) | 0 (0.0%) |
| Fuel Oil or Kerosene | 2 (0.9%) | 0 (0.0%) |
| Coal or Coke | 0 (0.0%) | 0 (0.0%) |
| All other Fuels | 3 (1.4%) | 0 (0.0%) |
| No Fuel Used | 0 (0.0%) | 0 (0.0%) |
| Total | 220 (100.0%) | 37 (100.0%) |
Household Vehicle Usage in Keithsburg
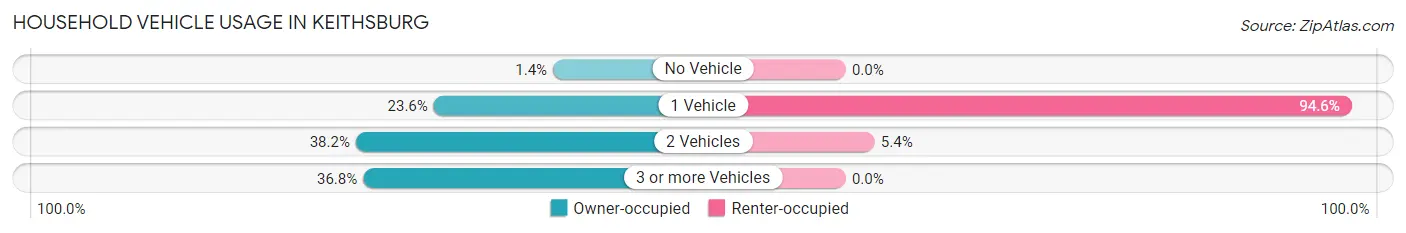
| Vehicles per Household | Owner-occupied | Renter-occupied |
| No Vehicle | 3 (1.4%) | 0 (0.0%) |
| 1 Vehicle | 52 (23.6%) | 35 (94.6%) |
| 2 Vehicles | 84 (38.2%) | 2 (5.4%) |
| 3 or more Vehicles | 81 (36.8%) | 0 (0.0%) |
| Total | 220 (100.0%) | 37 (100.0%) |
Real Estate & Mortgages in Keithsburg
Real Estate and Mortgage Overview in Keithsburg
| Characteristic | Without Mortgage | With Mortgage |
| Housing Units | 119 | 101 |
| Median Property Value | $43,900 | $72,400 |
| Median Household Income | $45,208 | $33 |
| Monthly Housing Costs | $320 | $2 |
| Real Estate Taxes | $581 | $12 |
Property Value by Mortgage Status in Keithsburg
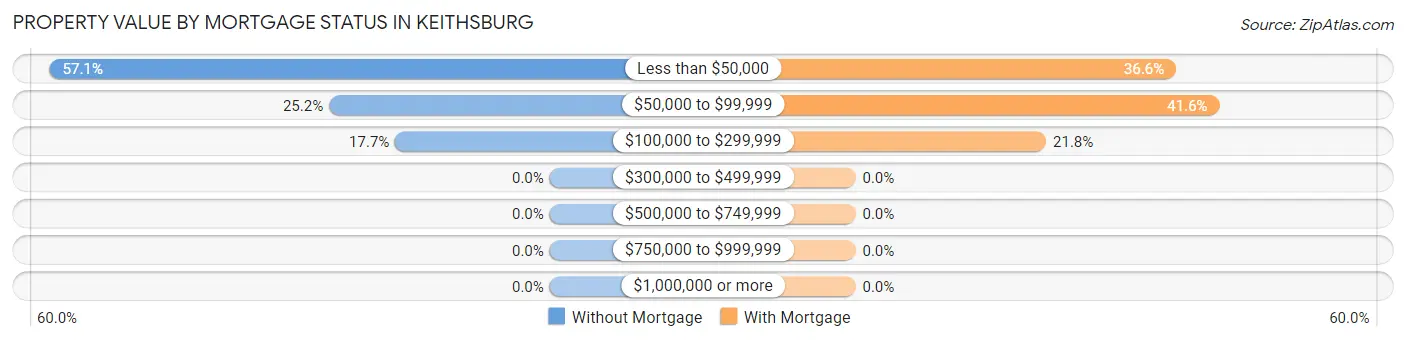
| Property Value | Without Mortgage | With Mortgage |
| Less than $50,000 | 68 (57.1%) | 37 (36.6%) |
| $50,000 to $99,999 | 30 (25.2%) | 42 (41.6%) |
| $100,000 to $299,999 | 21 (17.6%) | 22 (21.8%) |
| $300,000 to $499,999 | 0 (0.0%) | 0 (0.0%) |
| $500,000 to $749,999 | 0 (0.0%) | 0 (0.0%) |
| $750,000 to $999,999 | 0 (0.0%) | 0 (0.0%) |
| $1,000,000 or more | 0 (0.0%) | 0 (0.0%) |
| Total | 119 (100.0%) | 101 (100.0%) |
Household Income by Mortgage Status in Keithsburg
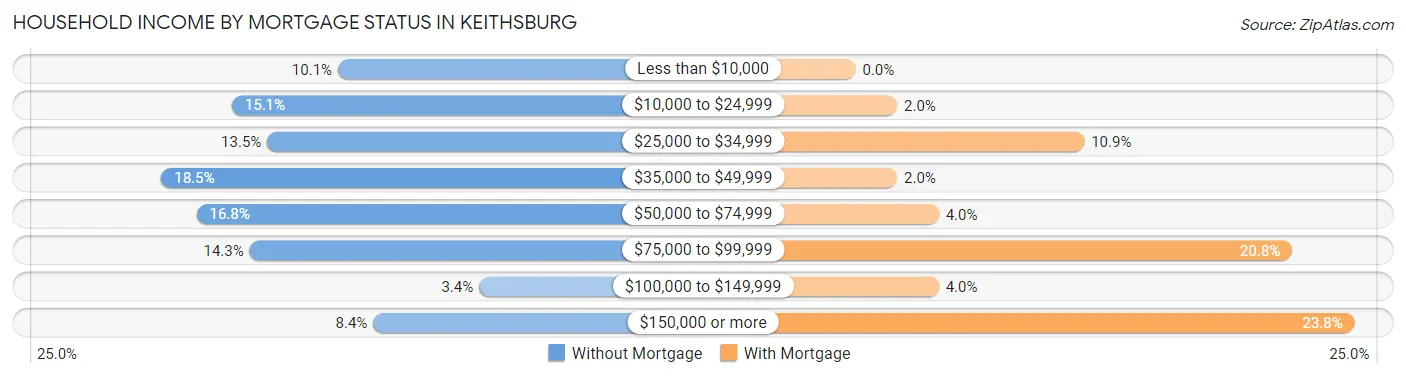
| Household Income | Without Mortgage | With Mortgage |
| Less than $10,000 | 12 (10.1%) | 0 (0.0%) |
| $10,000 to $24,999 | 18 (15.1%) | 2 (2.0%) |
| $25,000 to $34,999 | 16 (13.5%) | 11 (10.9%) |
| $35,000 to $49,999 | 22 (18.5%) | 2 (2.0%) |
| $50,000 to $74,999 | 20 (16.8%) | 4 (4.0%) |
| $75,000 to $99,999 | 17 (14.3%) | 21 (20.8%) |
| $100,000 to $149,999 | 4 (3.4%) | 4 (4.0%) |
| $150,000 or more | 10 (8.4%) | 24 (23.8%) |
| Total | 119 (100.0%) | 101 (100.0%) |
Property Value to Household Income Ratio in Keithsburg
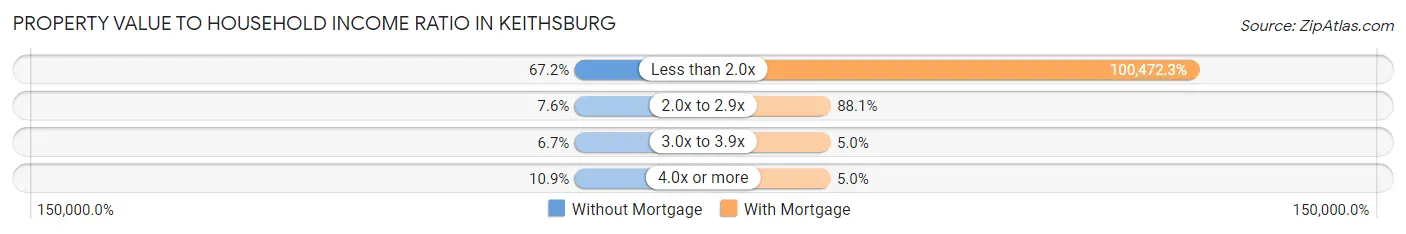
| Value-to-Income Ratio | Without Mortgage | With Mortgage |
| Less than 2.0x | 80 (67.2%) | 101,477 (100,472.3%) |
| 2.0x to 2.9x | 9 (7.6%) | 89 (88.1%) |
| 3.0x to 3.9x | 8 (6.7%) | 5 (5.0%) |
| 4.0x or more | 13 (10.9%) | 5 (5.0%) |
| Total | 119 (100.0%) | 101 (100.0%) |
Real Estate Taxes by Mortgage Status in Keithsburg
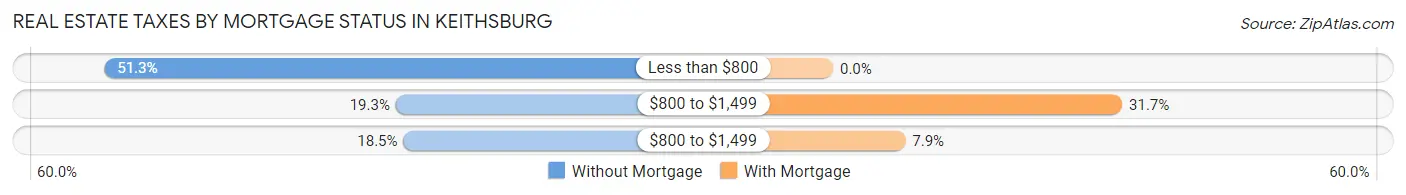
| Property Taxes | Without Mortgage | With Mortgage |
| Less than $800 | 61 (51.3%) | 0 (0.0%) |
| $800 to $1,499 | 23 (19.3%) | 32 (31.7%) |
| $800 to $1,499 | 22 (18.5%) | 8 (7.9%) |
| Total | 119 (100.0%) | 101 (100.0%) |
Health & Disability in Keithsburg
Health Insurance Coverage by Age in Keithsburg
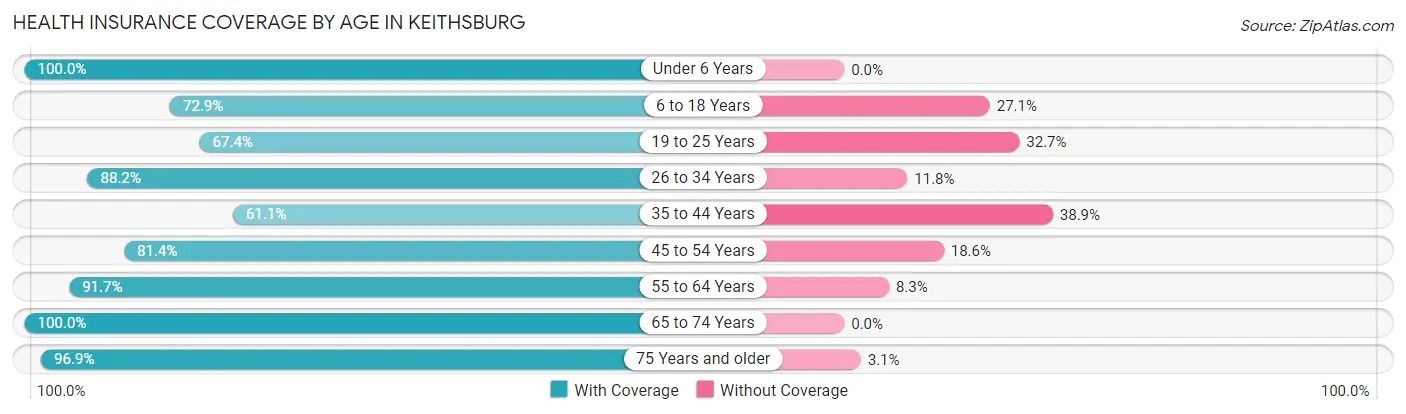
| Age Bracket | With Coverage | Without Coverage |
| Under 6 Years | 30 (100.0%) | 0 (0.0%) |
| 6 to 18 Years | 51 (72.9%) | 19 (27.1%) |
| 19 to 25 Years | 33 (67.3%) | 16 (32.7%) |
| 26 to 34 Years | 45 (88.2%) | 6 (11.8%) |
| 35 to 44 Years | 33 (61.1%) | 21 (38.9%) |
| 45 to 54 Years | 79 (81.4%) | 18 (18.6%) |
| 55 to 64 Years | 66 (91.7%) | 6 (8.3%) |
| 65 to 74 Years | 82 (100.0%) | 0 (0.0%) |
| 75 Years and older | 63 (96.9%) | 2 (3.1%) |
| Total | 482 (84.6%) | 88 (15.4%) |
Health Insurance Coverage by Citizenship Status in Keithsburg
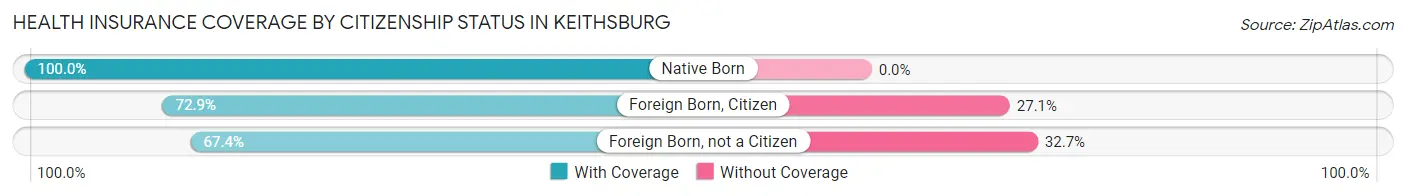
| Citizenship Status | With Coverage | Without Coverage |
| Native Born | 30 (100.0%) | 0 (0.0%) |
| Foreign Born, Citizen | 51 (72.9%) | 19 (27.1%) |
| Foreign Born, not a Citizen | 33 (67.3%) | 16 (32.7%) |
Health Insurance Coverage by Household Income in Keithsburg
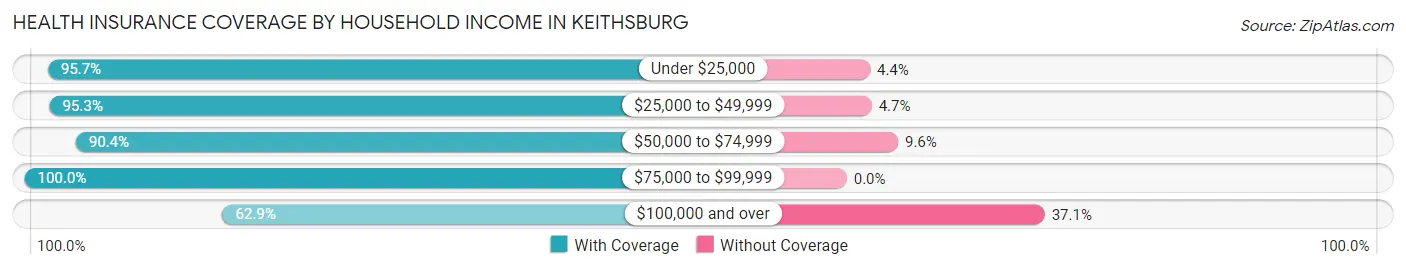
| Household Income | With Coverage | Without Coverage |
| Under $25,000 | 110 (95.7%) | 5 (4.3%) |
| $25,000 to $49,999 | 102 (95.3%) | 5 (4.7%) |
| $50,000 to $74,999 | 113 (90.4%) | 12 (9.6%) |
| $75,000 to $99,999 | 45 (100.0%) | 0 (0.0%) |
| $100,000 and over | 112 (62.9%) | 66 (37.1%) |
Public vs Private Health Insurance Coverage by Age in Keithsburg
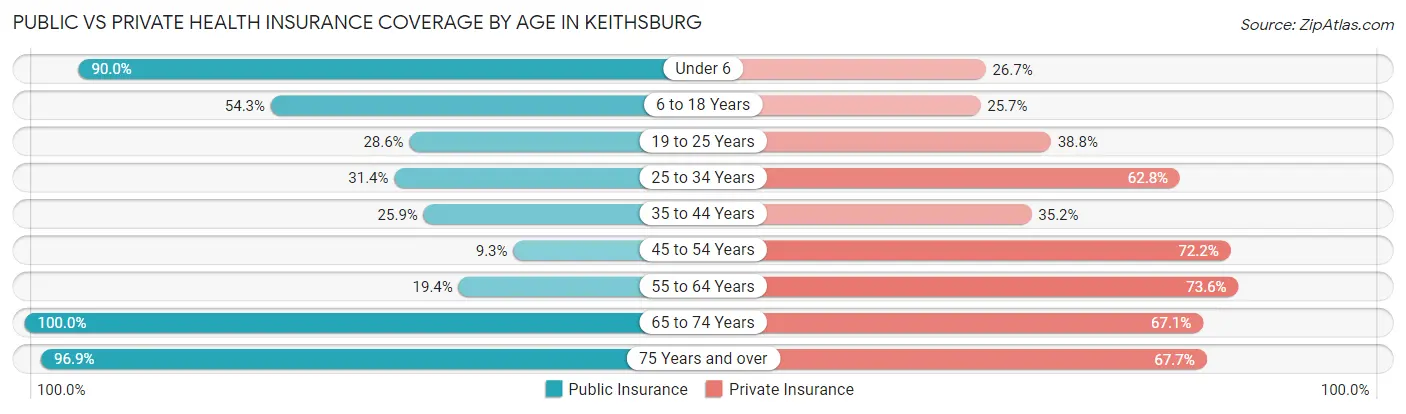
| Age Bracket | Public Insurance | Private Insurance |
| Under 6 | 27 (90.0%) | 8 (26.7%) |
| 6 to 18 Years | 38 (54.3%) | 18 (25.7%) |
| 19 to 25 Years | 14 (28.6%) | 19 (38.8%) |
| 25 to 34 Years | 16 (31.4%) | 32 (62.7%) |
| 35 to 44 Years | 14 (25.9%) | 19 (35.2%) |
| 45 to 54 Years | 9 (9.3%) | 70 (72.2%) |
| 55 to 64 Years | 14 (19.4%) | 53 (73.6%) |
| 65 to 74 Years | 82 (100.0%) | 55 (67.1%) |
| 75 Years and over | 63 (96.9%) | 44 (67.7%) |
| Total | 277 (48.6%) | 318 (55.8%) |
Disability Status by Sex by Age in Keithsburg
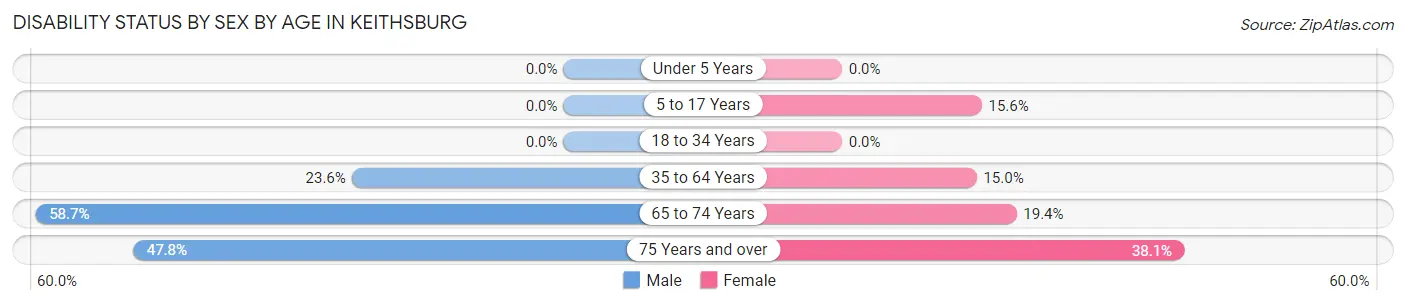
| Age Bracket | Male | Female |
| Under 5 Years | 0 (0.0%) | 0 (0.0%) |
| 5 to 17 Years | 0 (0.0%) | 7 (15.6%) |
| 18 to 34 Years | 0 (0.0%) | 0 (0.0%) |
| 35 to 64 Years | 29 (23.6%) | 15 (15.0%) |
| 65 to 74 Years | 27 (58.7%) | 7 (19.4%) |
| 75 Years and over | 11 (47.8%) | 16 (38.1%) |
Disability Class by Sex by Age in Keithsburg
Disability Class: Hearing Difficulty
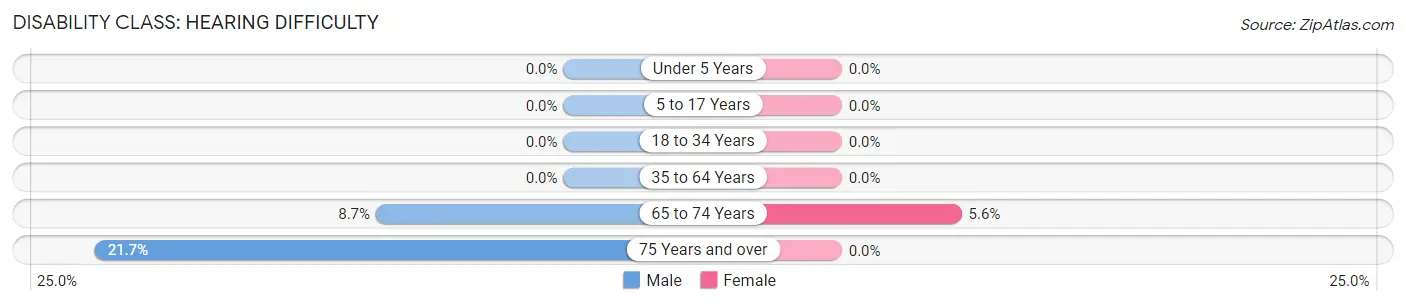
| Age Bracket | Male | Female |
| Under 5 Years | 0 (0.0%) | 0 (0.0%) |
| 5 to 17 Years | 0 (0.0%) | 0 (0.0%) |
| 18 to 34 Years | 0 (0.0%) | 0 (0.0%) |
| 35 to 64 Years | 0 (0.0%) | 0 (0.0%) |
| 65 to 74 Years | 4 (8.7%) | 2 (5.6%) |
| 75 Years and over | 5 (21.7%) | 0 (0.0%) |
Disability Class: Vision Difficulty
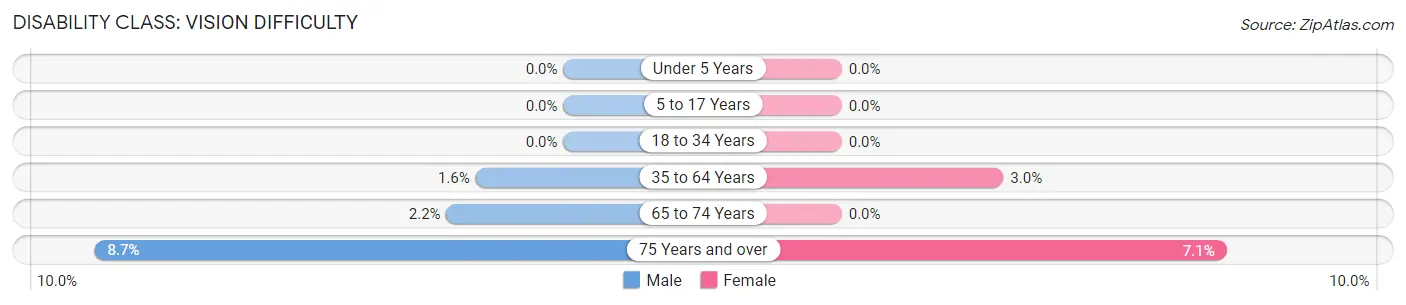
| Age Bracket | Male | Female |
| Under 5 Years | 0 (0.0%) | 0 (0.0%) |
| 5 to 17 Years | 0 (0.0%) | 0 (0.0%) |
| 18 to 34 Years | 0 (0.0%) | 0 (0.0%) |
| 35 to 64 Years | 2 (1.6%) | 3 (3.0%) |
| 65 to 74 Years | 1 (2.2%) | 0 (0.0%) |
| 75 Years and over | 2 (8.7%) | 3 (7.1%) |
Disability Class: Cognitive Difficulty
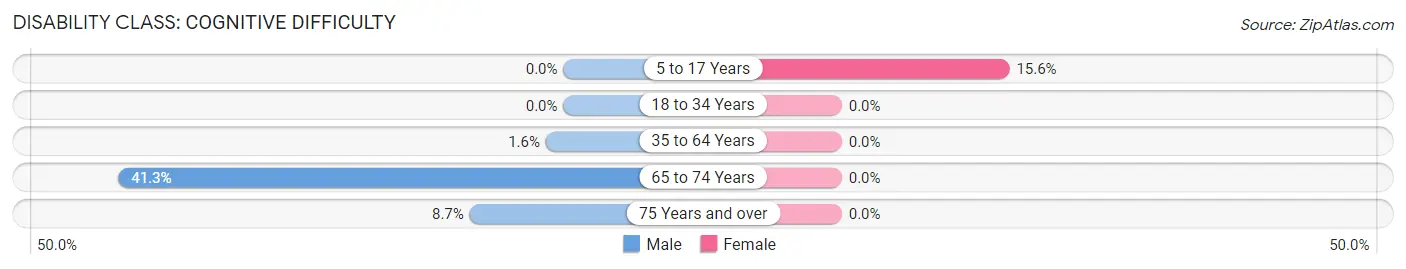
| Age Bracket | Male | Female |
| 5 to 17 Years | 0 (0.0%) | 7 (15.6%) |
| 18 to 34 Years | 0 (0.0%) | 0 (0.0%) |
| 35 to 64 Years | 2 (1.6%) | 0 (0.0%) |
| 65 to 74 Years | 19 (41.3%) | 0 (0.0%) |
| 75 Years and over | 2 (8.7%) | 0 (0.0%) |
Disability Class: Ambulatory Difficulty
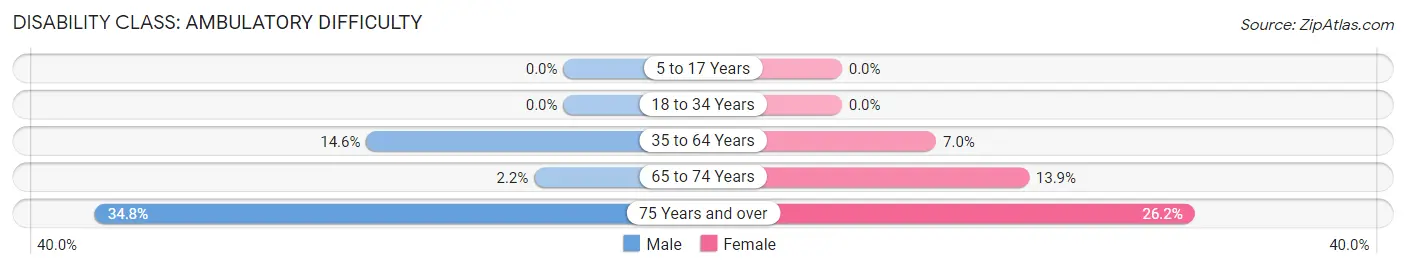
| Age Bracket | Male | Female |
| 5 to 17 Years | 0 (0.0%) | 0 (0.0%) |
| 18 to 34 Years | 0 (0.0%) | 0 (0.0%) |
| 35 to 64 Years | 18 (14.6%) | 7 (7.0%) |
| 65 to 74 Years | 1 (2.2%) | 5 (13.9%) |
| 75 Years and over | 8 (34.8%) | 11 (26.2%) |
Disability Class: Self-Care Difficulty
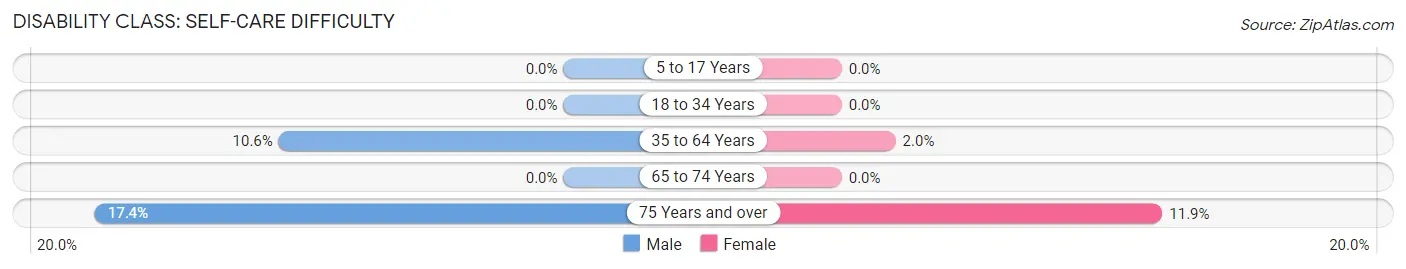
| Age Bracket | Male | Female |
| 5 to 17 Years | 0 (0.0%) | 0 (0.0%) |
| 18 to 34 Years | 0 (0.0%) | 0 (0.0%) |
| 35 to 64 Years | 13 (10.6%) | 2 (2.0%) |
| 65 to 74 Years | 0 (0.0%) | 0 (0.0%) |
| 75 Years and over | 4 (17.4%) | 5 (11.9%) |
Technology Access in Keithsburg
Computing Device Access in Keithsburg
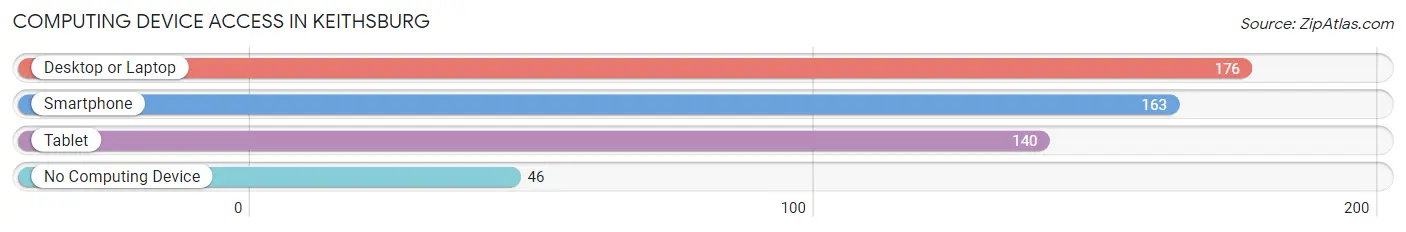
| Device Type | # Households | % Households |
| Desktop or Laptop | 176 | 68.5% |
| Smartphone | 163 | 63.4% |
| Tablet | 140 | 54.5% |
| No Computing Device | 46 | 17.9% |
| Total | 257 | 100.0% |
Internet Access in Keithsburg
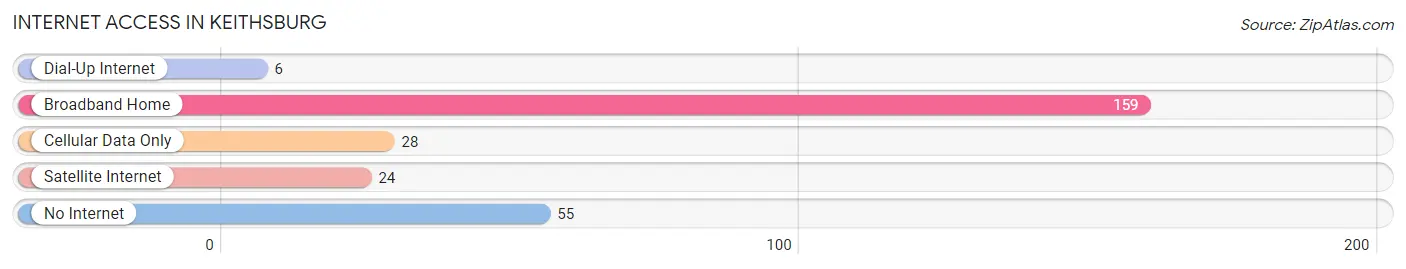
| Internet Type | # Households | % Households |
| Dial-Up Internet | 6 | 2.3% |
| Broadband Home | 159 | 61.9% |
| Cellular Data Only | 28 | 10.9% |
| Satellite Internet | 24 | 9.3% |
| No Internet | 55 | 21.4% |
| Total | 257 | 100.0% |
Keithsburg Summary
History
The small town of Keithsburg, Illinois is located in Mercer County, in the western part of the state. It is situated on the banks of the Mississippi River, and is part of the Quad Cities metropolitan area. The town was founded in 1836 by William Keith, a local farmer and businessman. He named the town after himself, and it quickly grew into a thriving community.
The town was an important stop on the Underground Railroad, and many escaped slaves found refuge in Keithsburg. The town was also a major hub for the lumber industry, and many of the buildings in the town were built with lumber from the surrounding forests.
In the late 19th century, Keithsburg was a popular destination for tourists, and many of the town’s buildings were built in the Victorian style. The town was also home to a number of factories, including a flour mill, a sawmill, and a brickyard.
The town was also home to a number of churches, including the First Presbyterian Church, which was founded in 1837. The church is still active today, and is the oldest church in the town.
Geography
Keithsburg is located in western Illinois, in Mercer County. It is situated on the banks of the Mississippi River, and is part of the Quad Cities metropolitan area. The town is located about 25 miles south of the city of Moline, and about 40 miles west of the city of Davenport.
The town is located in a flat, low-lying area, and is surrounded by farmland. The town is located in the Central Till Plain, which is a region of flat, fertile land that is ideal for farming. The town is also located near the Mississippi River, which provides a source of water for the town.
The climate in Keithsburg is humid continental, with hot summers and cold winters. The average temperature in the summer is around 75 degrees Fahrenheit, and the average temperature in the winter is around 25 degrees Fahrenheit.
Economy
The economy of Keithsburg is largely based on agriculture and manufacturing. The town is home to a number of factories, including a flour mill, a sawmill, and a brickyard. The town is also home to a number of small businesses, including restaurants, shops, and other services.
The town is also home to a number of farms, which produce a variety of crops, including corn, soybeans, and wheat. The town is also home to a number of livestock farms, which produce beef, pork, and poultry.
Demographics
As of the 2010 census, the population of Keithsburg was 1,845. The town is predominantly white, with 92.3% of the population identifying as white. The town is also home to a small Hispanic population, with 4.2% of the population identifying as Hispanic or Latino.
The median household income in Keithsburg is $45,938, and the median home value is $90,000. The town has a poverty rate of 11.3%, and the unemployment rate is 4.2%. The town is served by the Mercer County School District, which includes two elementary schools, one middle school, and one high school.
Common Questions
What is Per Capita Income in Keithsburg?
Per Capita income in Keithsburg is $40,108.
What is the Median Family Income in Keithsburg?
Median Family Income in Keithsburg is $87,813.
What is the Median Household income in Keithsburg?
Median Household Income in Keithsburg is $52,917.
What is Income or Wage Gap in Keithsburg?
Income or Wage Gap in Keithsburg is 25.7%.
Women in Keithsburg earn 74.3 cents for every dollar earned by a man.
What is Family Income Deficit in Keithsburg?
Family Income Deficit in Keithsburg is $10,417.
Families that are below poverty line in Keithsburg earn $10,417 less on average than the poverty threshold level.
What is Inequality or Gini Index in Keithsburg?
Inequality or Gini Index in Keithsburg is 0.55.
What is the Total Population of Keithsburg?
Total Population of Keithsburg is 570.
What is the Total Male Population of Keithsburg?
Total Male Population of Keithsburg is 287.
What is the Total Female Population of Keithsburg?
Total Female Population of Keithsburg is 283.
What is the Ratio of Males per 100 Females in Keithsburg?
There are 101.41 Males per 100 Females in Keithsburg.
What is the Ratio of Females per 100 Males in Keithsburg?
There are 98.61 Females per 100 Males in Keithsburg.
What is the Median Population Age in Keithsburg?
Median Population Age in Keithsburg is 50.4 Years.
What is the Average Family Size in Keithsburg
Average Family Size in Keithsburg is 2.9 People.
What is the Average Household Size in Keithsburg
Average Household Size in Keithsburg is 2.2 People.
How Large is the Labor Force in Keithsburg?
There are 286 People in the Labor Forcein in Keithsburg.
What is the Percentage of People in the Labor Force in Keithsburg?
60.3% of People are in the Labor Force in Keithsburg.
What is the Unemployment Rate in Keithsburg?
Unemployment Rate in Keithsburg is 11.5%.