Orion, IL Map & Demographics
Orion Map
Orion Overview
$36,633
PER CAPITA INCOME
$97,102
AVG FAMILY INCOME
$88,529
AVG HOUSEHOLD INCOME
32.1%
WAGE / INCOME GAP [ % ]
67.9¢/ $1
WAGE / INCOME GAP [ $ ]
0.36
INEQUALITY / GINI INDEX
1,966
TOTAL POPULATION
1,011
MALE POPULATION
955
FEMALE POPULATION
105.86
MALES / 100 FEMALES
94.46
FEMALES / 100 MALES
35.6
MEDIAN AGE
3.4
AVG FAMILY SIZE
2.9
AVG HOUSEHOLD SIZE
987
LABOR FORCE [ PEOPLE ]
67.1%
PERCENT IN LABOR FORCE
3.5%
UNEMPLOYMENT RATE
Orion Zip Codes
Orion Area Codes
Income in Orion
Income Overview in Orion
Per Capita Income in Orion is $36,633, while median incomes of families and households are $97,102 and $88,529 respectively.
| Characteristic | Number | Measure |
| Per Capita Income | 1,966 | $36,633 |
| Median Family Income | 501 | $97,102 |
| Mean Family Income | 501 | $117,829 |
| Median Household Income | 682 | $88,529 |
| Mean Household Income | 682 | $105,460 |
| Income Deficit | 501 | $0 |
| Wage / Income Gap (%) | 1,966 | 32.12% |
| Wage / Income Gap ($) | 1,966 | 67.88¢ per $1 |
| Gini / Inequality Index | 1,966 | 0.36 |
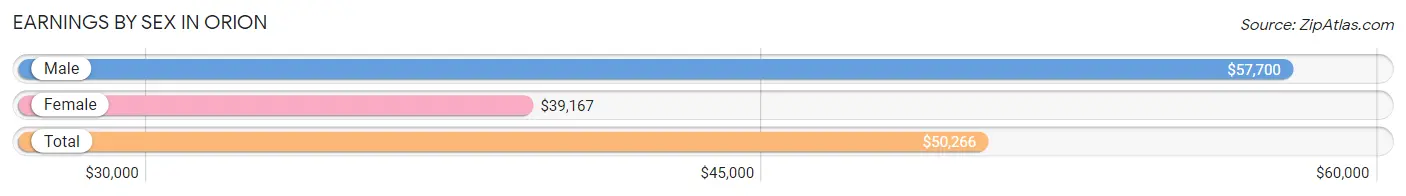
Earnings by Sex in Orion
Average Earnings in Orion are $50,266, $57,700 for men and $39,167 for women, a difference of 32.1%.
| Sex | Number | Average Earnings |
| Male | 560 (53.6%) | $57,700 |
| Female | 484 (46.4%) | $39,167 |
| Total | 1,044 (100.0%) | $50,266 |
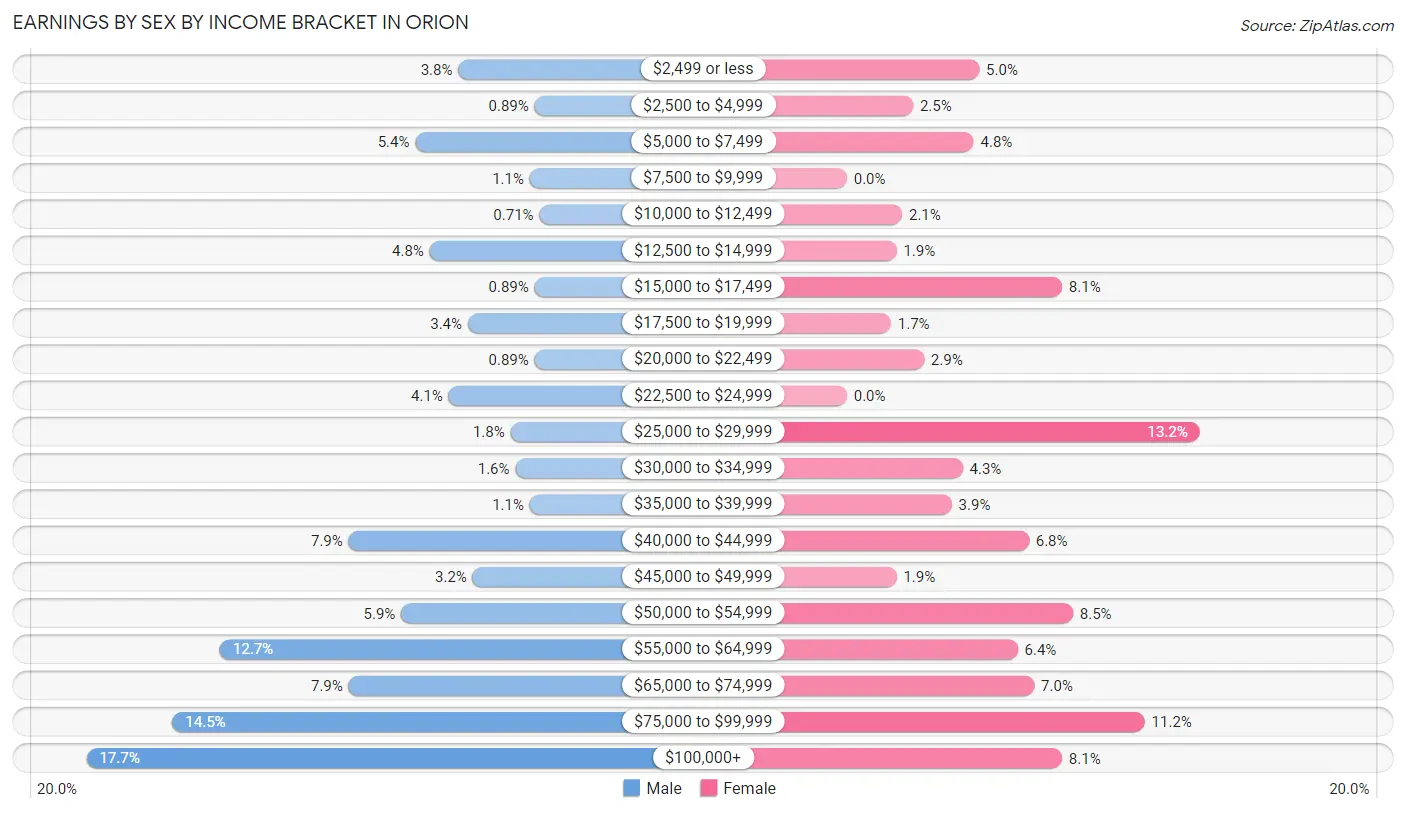
Earnings by Sex by Income Bracket in Orion
The most common earnings brackets in Orion are $100,000+ for men (99 | 17.7%) and $25,000 to $29,999 for women (64 | 13.2%).
| Income | Male | Female |
| $2,499 or less | 21 (3.7%) | 24 (5.0%) |
| $2,500 to $4,999 | 5 (0.9%) | 12 (2.5%) |
| $5,000 to $7,499 | 30 (5.4%) | 23 (4.8%) |
| $7,500 to $9,999 | 6 (1.1%) | 0 (0.0%) |
| $10,000 to $12,499 | 4 (0.7%) | 10 (2.1%) |
| $12,500 to $14,999 | 27 (4.8%) | 9 (1.9%) |
| $15,000 to $17,499 | 5 (0.9%) | 39 (8.1%) |
| $17,500 to $19,999 | 19 (3.4%) | 8 (1.7%) |
| $20,000 to $22,499 | 5 (0.9%) | 14 (2.9%) |
| $22,500 to $24,999 | 23 (4.1%) | 0 (0.0%) |
| $25,000 to $29,999 | 10 (1.8%) | 64 (13.2%) |
| $30,000 to $34,999 | 9 (1.6%) | 21 (4.3%) |
| $35,000 to $39,999 | 6 (1.1%) | 19 (3.9%) |
| $40,000 to $44,999 | 44 (7.9%) | 33 (6.8%) |
| $45,000 to $49,999 | 18 (3.2%) | 9 (1.9%) |
| $50,000 to $54,999 | 33 (5.9%) | 41 (8.5%) |
| $55,000 to $64,999 | 71 (12.7%) | 31 (6.4%) |
| $65,000 to $74,999 | 44 (7.9%) | 34 (7.0%) |
| $75,000 to $99,999 | 81 (14.5%) | 54 (11.2%) |
| $100,000+ | 99 (17.7%) | 39 (8.1%) |
| Total | 560 (100.0%) | 484 (100.0%) |
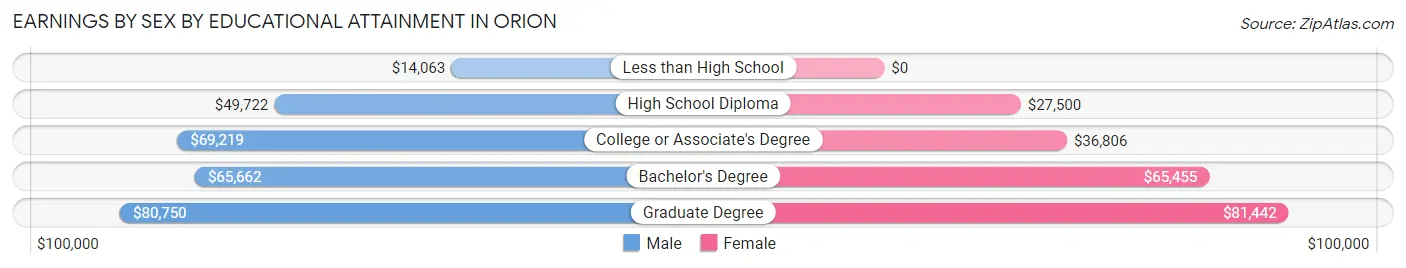
Earnings by Sex by Educational Attainment in Orion
Average earnings in Orion are $60,076 for men and $48,214 for women, a difference of 19.7%. Men with an educational attainment of graduate degree enjoy the highest average annual earnings of $80,750, while those with less than high school education earn the least with $14,063. Women with an educational attainment of graduate degree earn the most with the average annual earnings of $81,442, while those with high school diploma education have the smallest earnings of $27,500.
| Educational Attainment | Male Income | Female Income |
| Less than High School | $14,063 | $0 |
| High School Diploma | $49,722 | $27,500 |
| College or Associate's Degree | $69,219 | $36,806 |
| Bachelor's Degree | $65,662 | $65,455 |
| Graduate Degree | $80,750 | $81,442 |
| Total | $60,076 | $48,214 |
Family Income in Orion
Family Income Brackets in Orion
According to the Orion family income data, there are 151 families falling into the $100,000 to $149,999 income range, which is the most common income bracket and makes up 30.1% of all families.
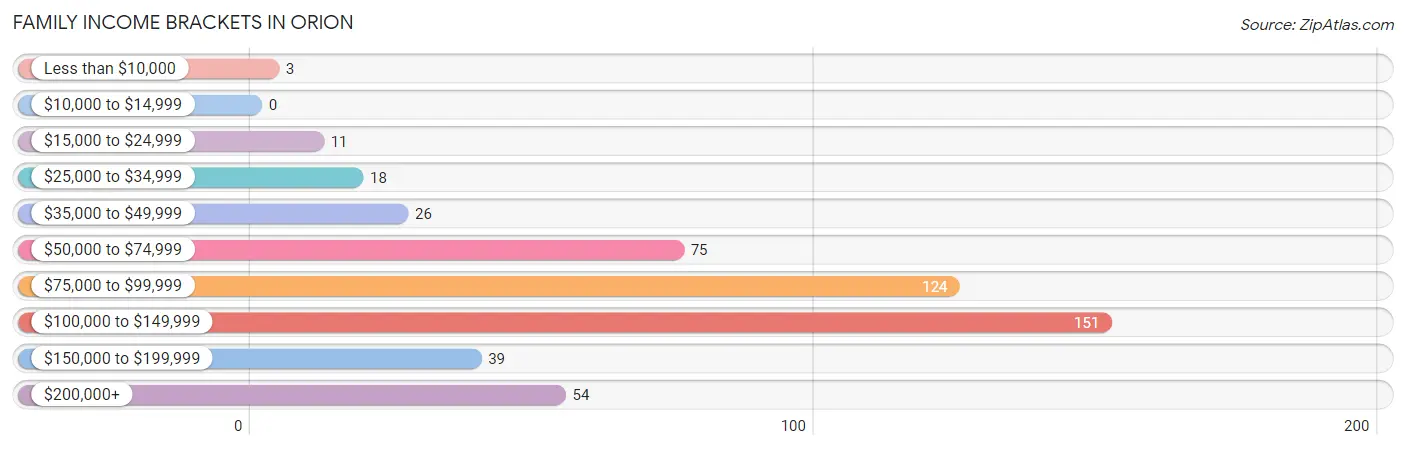
| Income Bracket | # Families | % Families |
| Less than $10,000 | 3 | 0.6% |
| $10,000 to $14,999 | 0 | 0.0% |
| $15,000 to $24,999 | 11 | 2.2% |
| $25,000 to $34,999 | 18 | 3.6% |
| $35,000 to $49,999 | 26 | 5.2% |
| $50,000 to $74,999 | 75 | 15.0% |
| $75,000 to $99,999 | 124 | 24.8% |
| $100,000 to $149,999 | 151 | 30.1% |
| $150,000 to $199,999 | 39 | 7.8% |
| $200,000+ | 54 | 10.8% |
Family Income by Famaliy Size in Orion
5-person families (50 | 10.0%) account for the highest median family income in Orion with $128,056 per family, while 2-person families (184 | 36.7%) have the highest median income of $40,341 per family member.
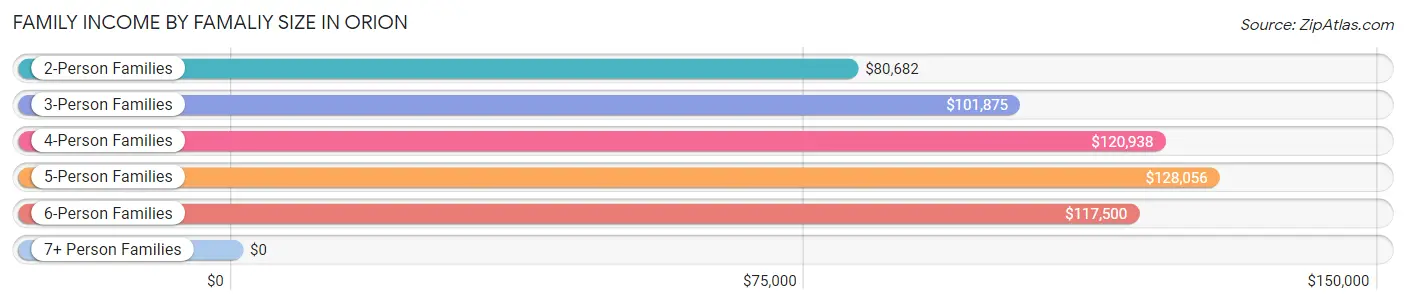
| Income Bracket | # Families | Median Income |
| 2-Person Families | 184 (36.7%) | $80,682 |
| 3-Person Families | 98 (19.6%) | $101,875 |
| 4-Person Families | 149 (29.7%) | $120,938 |
| 5-Person Families | 50 (10.0%) | $128,056 |
| 6-Person Families | 18 (3.6%) | $117,500 |
| 7+ Person Families | 2 (0.4%) | $0 |
| Total | 501 (100.0%) | $97,102 |
Family Income by Number of Earners in Orion
The median family income in Orion is $97,102, with families comprising 3+ earners (60) having the highest median family income of $173,182, while families with no earners (44) have the lowest median family income of $65,556, accounting for 12.0% and 8.8% of families, respectively.
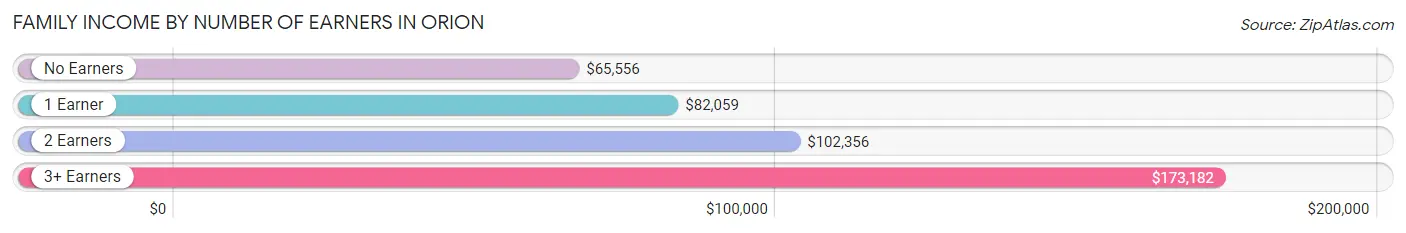
| Number of Earners | # Families | Median Income |
| No Earners | 44 (8.8%) | $65,556 |
| 1 Earner | 152 (30.3%) | $82,059 |
| 2 Earners | 245 (48.9%) | $102,356 |
| 3+ Earners | 60 (12.0%) | $173,182 |
| Total | 501 (100.0%) | $97,102 |
Household Income in Orion
Household Income Brackets in Orion
With 182 households falling in the category, the $100,000 to $149,999 income range is the most frequent in Orion, accounting for 26.7% of all households. In contrast, only 7 households (1.0%) fall into the $10,000 to $14,999 income bracket, making it the least populous group.
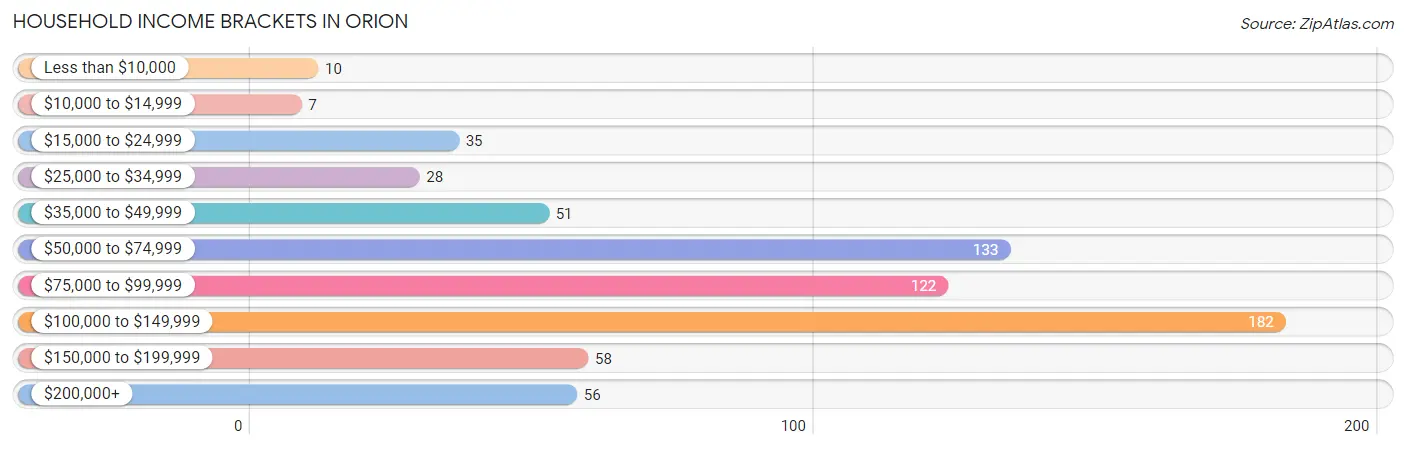
| Income Bracket | # Households | % Households |
| Less than $10,000 | 10 | 1.5% |
| $10,000 to $14,999 | 7 | 1.0% |
| $15,000 to $24,999 | 35 | 5.1% |
| $25,000 to $34,999 | 28 | 4.1% |
| $35,000 to $49,999 | 51 | 7.5% |
| $50,000 to $74,999 | 133 | 19.5% |
| $75,000 to $99,999 | 122 | 17.9% |
| $100,000 to $149,999 | 182 | 26.7% |
| $150,000 to $199,999 | 58 | 8.5% |
| $200,000+ | 56 | 8.2% |
Household Income by Householder Age in Orion
The median household income in Orion is $88,529, with the highest median household income of $100,223 found in the 25 to 44 years age bracket for the primary householder. A total of 291 households (42.7%) fall into this category. Meanwhile, the 15 to 24 years age bracket for the primary householder has the lowest median household income of $0, with 20 households (2.9%) in this group.
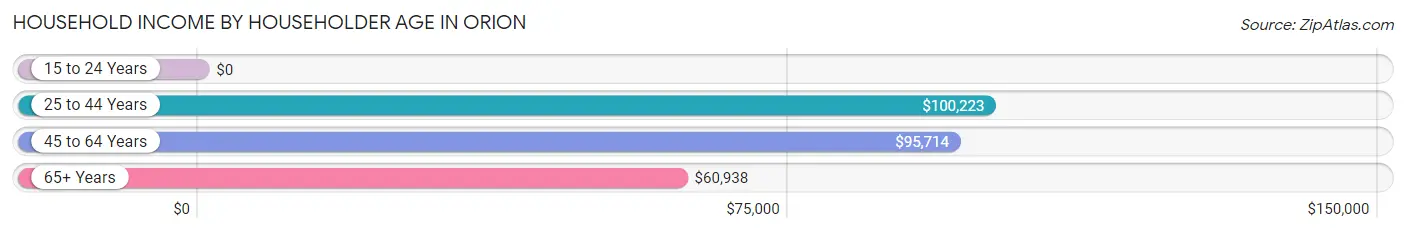
| Income Bracket | # Households | Median Income |
| 15 to 24 Years | 20 (2.9%) | $0 |
| 25 to 44 Years | 291 (42.7%) | $100,223 |
| 45 to 64 Years | 240 (35.2%) | $95,714 |
| 65+ Years | 131 (19.2%) | $60,938 |
| Total | 682 (100.0%) | $88,529 |
Poverty in Orion
Income Below Poverty by Sex and Age in Orion
With 1.1% poverty level for males and 5.8% for females among the residents of Orion, 75 year old and over males and 75 year old and over females are the most vulnerable to poverty, with 6 males (14.0%) and 13 females (20.3%) in their respective age groups living below the poverty level.
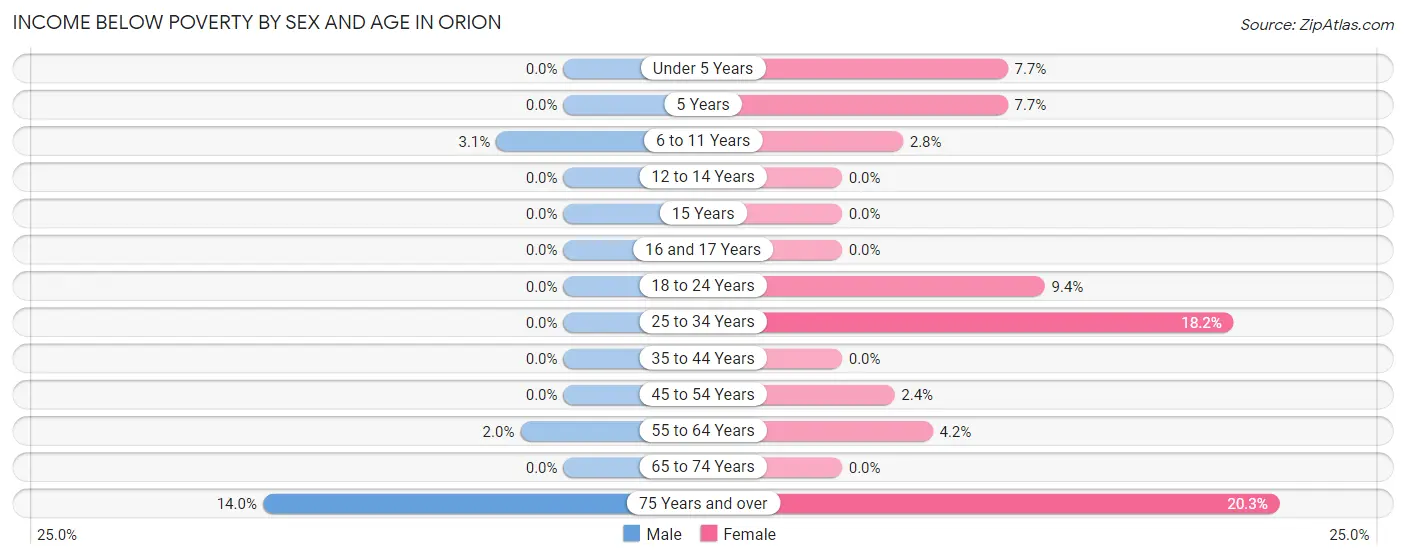
| Age Bracket | Male | Female |
| Under 5 Years | 0 (0.0%) | 6 (7.7%) |
| 5 Years | 0 (0.0%) | 2 (7.7%) |
| 6 to 11 Years | 3 (3.1%) | 3 (2.8%) |
| 12 to 14 Years | 0 (0.0%) | 0 (0.0%) |
| 15 Years | 0 (0.0%) | 0 (0.0%) |
| 16 and 17 Years | 0 (0.0%) | 0 (0.0%) |
| 18 to 24 Years | 0 (0.0%) | 8 (9.4%) |
| 25 to 34 Years | 0 (0.0%) | 16 (18.2%) |
| 35 to 44 Years | 0 (0.0%) | 0 (0.0%) |
| 45 to 54 Years | 0 (0.0%) | 3 (2.4%) |
| 55 to 64 Years | 2 (2.0%) | 4 (4.2%) |
| 65 to 74 Years | 0 (0.0%) | 0 (0.0%) |
| 75 Years and over | 6 (14.0%) | 13 (20.3%) |
| Total | 11 (1.1%) | 55 (5.8%) |
Income Above Poverty by Sex and Age in Orion
According to the poverty statistics in Orion, males aged under 5 years and females aged 12 to 14 years are the age groups that are most secure financially, with 100.0% of males and 100.0% of females in these age groups living above the poverty line.
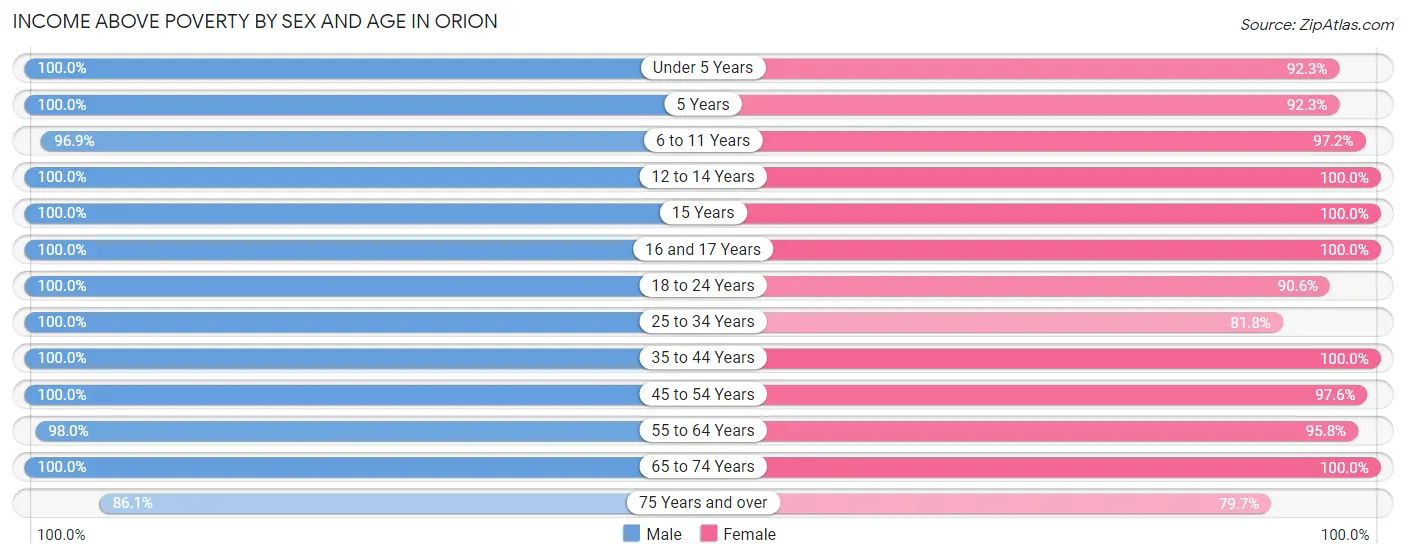
| Age Bracket | Male | Female |
| Under 5 Years | 47 (100.0%) | 72 (92.3%) |
| 5 Years | 5 (100.0%) | 24 (92.3%) |
| 6 to 11 Years | 93 (96.9%) | 103 (97.2%) |
| 12 to 14 Years | 44 (100.0%) | 23 (100.0%) |
| 15 Years | 53 (100.0%) | 7 (100.0%) |
| 16 and 17 Years | 56 (100.0%) | 37 (100.0%) |
| 18 to 24 Years | 89 (100.0%) | 77 (90.6%) |
| 25 to 34 Years | 109 (100.0%) | 72 (81.8%) |
| 35 to 44 Years | 214 (100.0%) | 167 (100.0%) |
| 45 to 54 Years | 95 (100.0%) | 120 (97.6%) |
| 55 to 64 Years | 98 (98.0%) | 91 (95.8%) |
| 65 to 74 Years | 57 (100.0%) | 49 (100.0%) |
| 75 Years and over | 37 (86.1%) | 51 (79.7%) |
| Total | 997 (98.9%) | 893 (94.2%) |
Income Below Poverty Among Married-Couple Families in Orion
The poverty statistics for married-couple families in Orion show that 1.5% or 6 of the total 406 families live below the poverty line. Families with no children have the highest poverty rate of 3.6%, comprising of 6 families. On the other hand, families with 1 or 2 children have the lowest poverty rate of 0.0%, which includes 0 families.
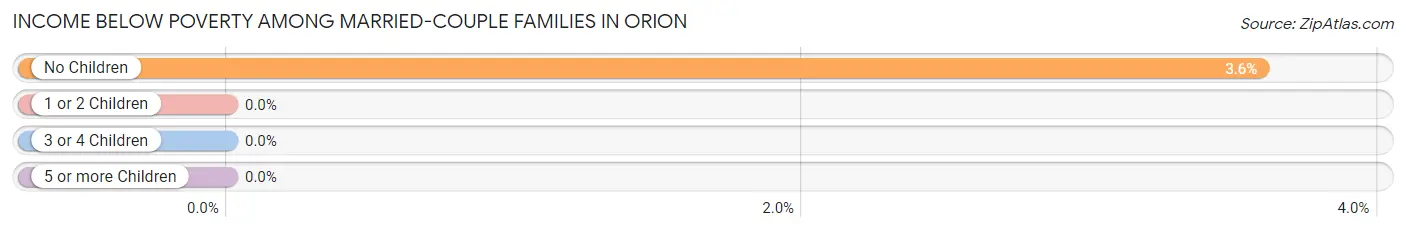
| Children | Above Poverty | Below Poverty |
| No Children | 161 (96.4%) | 6 (3.6%) |
| 1 or 2 Children | 180 (100.0%) | 0 (0.0%) |
| 3 or 4 Children | 57 (100.0%) | 0 (0.0%) |
| 5 or more Children | 2 (100.0%) | 0 (0.0%) |
| Total | 400 (98.5%) | 6 (1.5%) |
Income Below Poverty Among Single-Parent Households in Orion
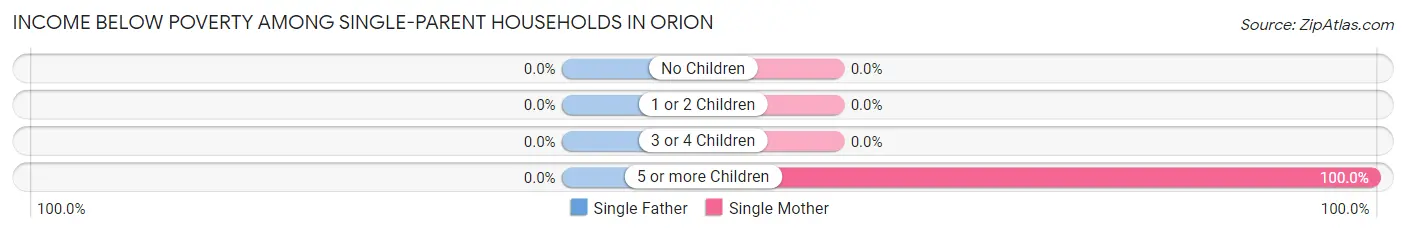
| Children | Single Father | Single Mother |
| No Children | 0 (0.0%) | 0 (0.0%) |
| 1 or 2 Children | 0 (0.0%) | 0 (0.0%) |
| 3 or 4 Children | 0 (0.0%) | 0 (0.0%) |
| 5 or more Children | 0 (0.0%) | 3 (100.0%) |
| Total | 0 (0.0%) | 3 (5.4%) |
Income Below Poverty Among Married-Couple vs Single-Parent Households in Orion
The poverty data for Orion shows that 6 of the married-couple family households (1.5%) and 3 of the single-parent households (3.2%) are living below the poverty level. Within the married-couple family households, those with no children have the highest poverty rate, with 6 households (3.6%) falling below the poverty line. Among the single-parent households, those with 5 or more children have the highest poverty rate, with 3 household (100.0%) living below poverty.
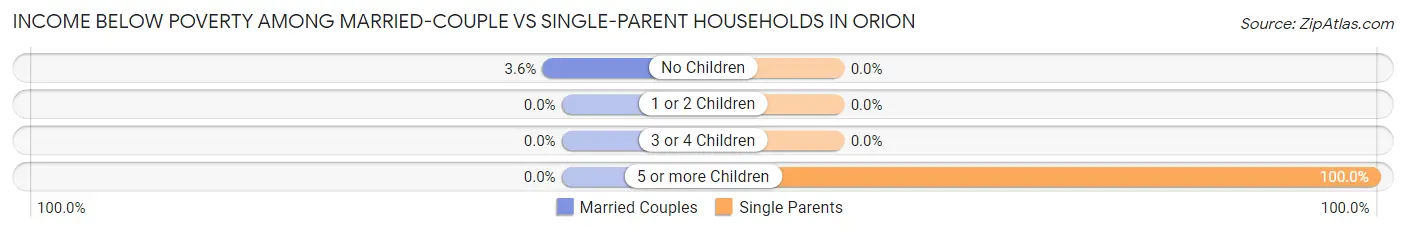
| Children | Married-Couple Families | Single-Parent Households |
| No Children | 6 (3.6%) | 0 (0.0%) |
| 1 or 2 Children | 0 (0.0%) | 0 (0.0%) |
| 3 or 4 Children | 0 (0.0%) | 0 (0.0%) |
| 5 or more Children | 0 (0.0%) | 3 (100.0%) |
| Total | 6 (1.5%) | 3 (3.2%) |
Race in Orion
The most populous races in Orion are White / Caucasian (1,841 | 93.6%), Two or more Races (70 | 3.6%), and Hispanic or Latino (45 | 2.3%).
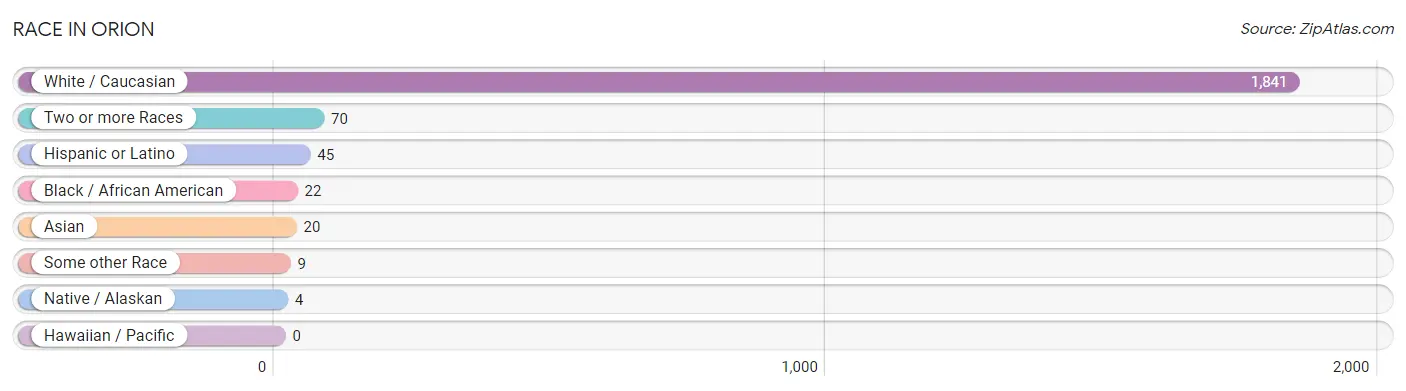
| Race | # Population | % Population |
| Asian | 20 | 1.0% |
| Black / African American | 22 | 1.1% |
| Hawaiian / Pacific | 0 | 0.0% |
| Hispanic or Latino | 45 | 2.3% |
| Native / Alaskan | 4 | 0.2% |
| White / Caucasian | 1,841 | 93.6% |
| Two or more Races | 70 | 3.6% |
| Some other Race | 9 | 0.5% |
| Total | 1,966 | 100.0% |
Ancestry in Orion
The most populous ancestries reported in Orion are German (594 | 30.2%), Irish (272 | 13.8%), Swedish (248 | 12.6%), English (217 | 11.0%), and American (182 | 9.3%), together accounting for 77.0% of all Orion residents.
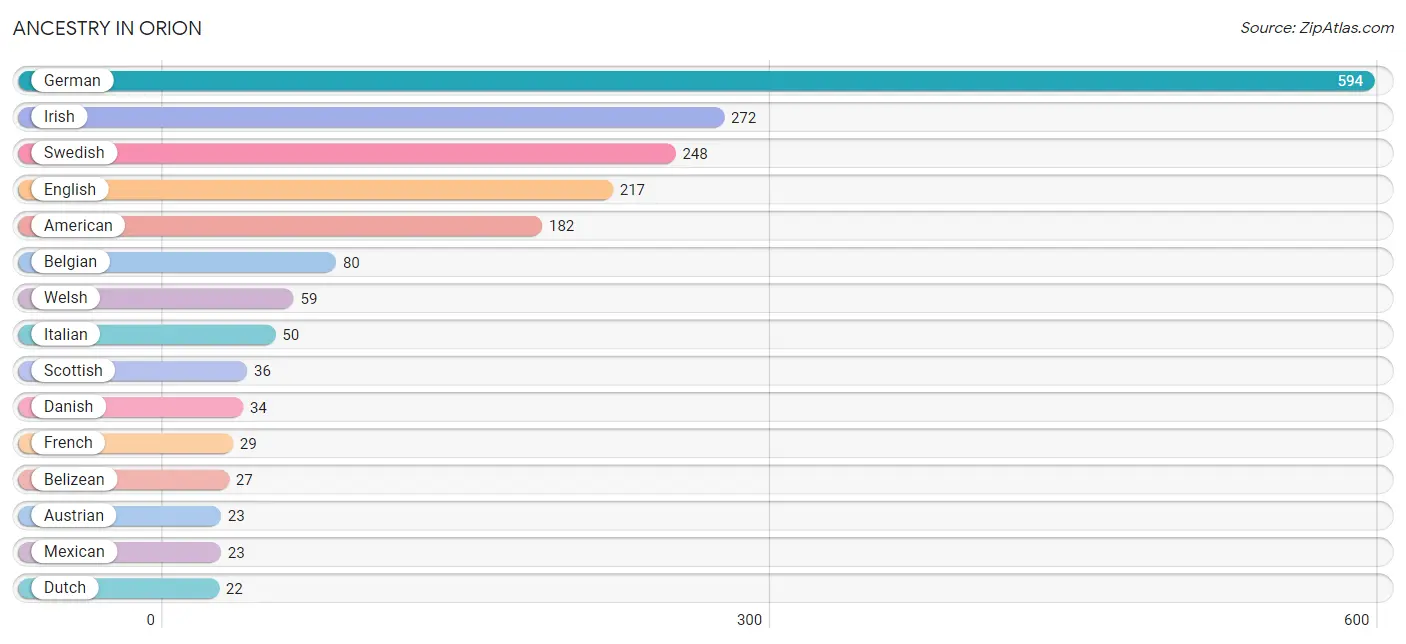
| Ancestry | # Population | % Population |
| American | 182 | 9.3% |
| Australian | 4 | 0.2% |
| Austrian | 23 | 1.2% |
| Belgian | 80 | 4.1% |
| Belizean | 27 | 1.4% |
| Bhutanese | 4 | 0.2% |
| British | 4 | 0.2% |
| Cherokee | 3 | 0.2% |
| Chippewa | 5 | 0.3% |
| Czech | 2 | 0.1% |
| Czechoslovakian | 3 | 0.2% |
| Danish | 34 | 1.7% |
| Dutch | 22 | 1.1% |
| Eastern European | 2 | 0.1% |
| English | 217 | 11.0% |
| European | 6 | 0.3% |
| French | 29 | 1.5% |
| German | 594 | 30.2% |
| Hungarian | 3 | 0.2% |
| Irish | 272 | 13.8% |
| Italian | 50 | 2.5% |
| Korean | 18 | 0.9% |
| Lithuanian | 7 | 0.4% |
| Mexican | 23 | 1.2% |
| Navajo | 1 | 0.1% |
| Norwegian | 2 | 0.1% |
| Polish | 22 | 1.1% |
| Scandinavian | 7 | 0.4% |
| Scotch-Irish | 2 | 0.1% |
| Scottish | 36 | 1.8% |
| Spanish American | 22 | 1.1% |
| Swedish | 248 | 12.6% |
| Welsh | 59 | 3.0% | View All 33 Rows |
Immigrants in Orion
The most numerous immigrant groups reported in Orion came from Belize (7 | 0.4%), Central America (7 | 0.4%), Latin America (7 | 0.4%), Europe (4 | 0.2%), and Northern Europe (4 | 0.2%), together accounting for 1.5% of all Orion residents.
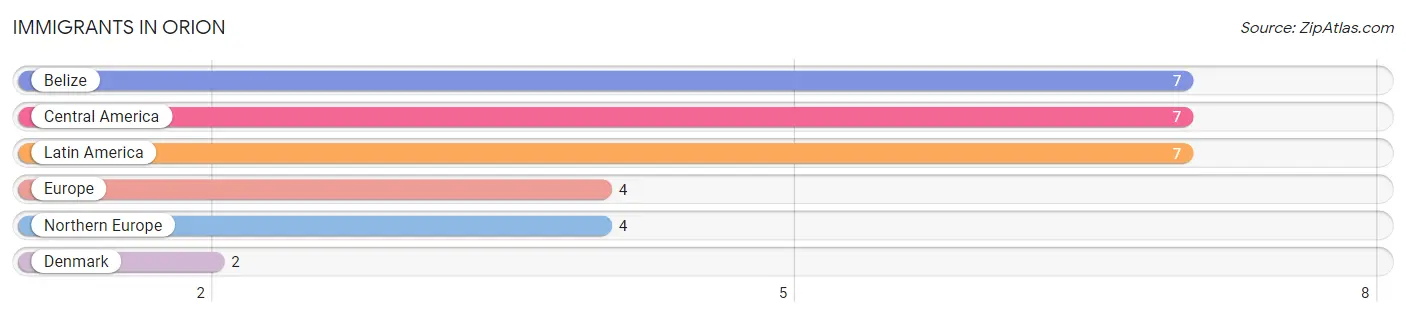
| Immigration Origin | # Population | % Population |
| Belize | 7 | 0.4% |
| Central America | 7 | 0.4% |
| Denmark | 2 | 0.1% |
| Europe | 4 | 0.2% |
| Latin America | 7 | 0.4% |
| Northern Europe | 4 | 0.2% | View All 6 Rows |
Sex and Age in Orion
Sex and Age in Orion
The most populous age groups in Orion are 15 to 19 Years (143 | 14.1%) for men and 5 to 9 Years (114 | 11.9%) for women.
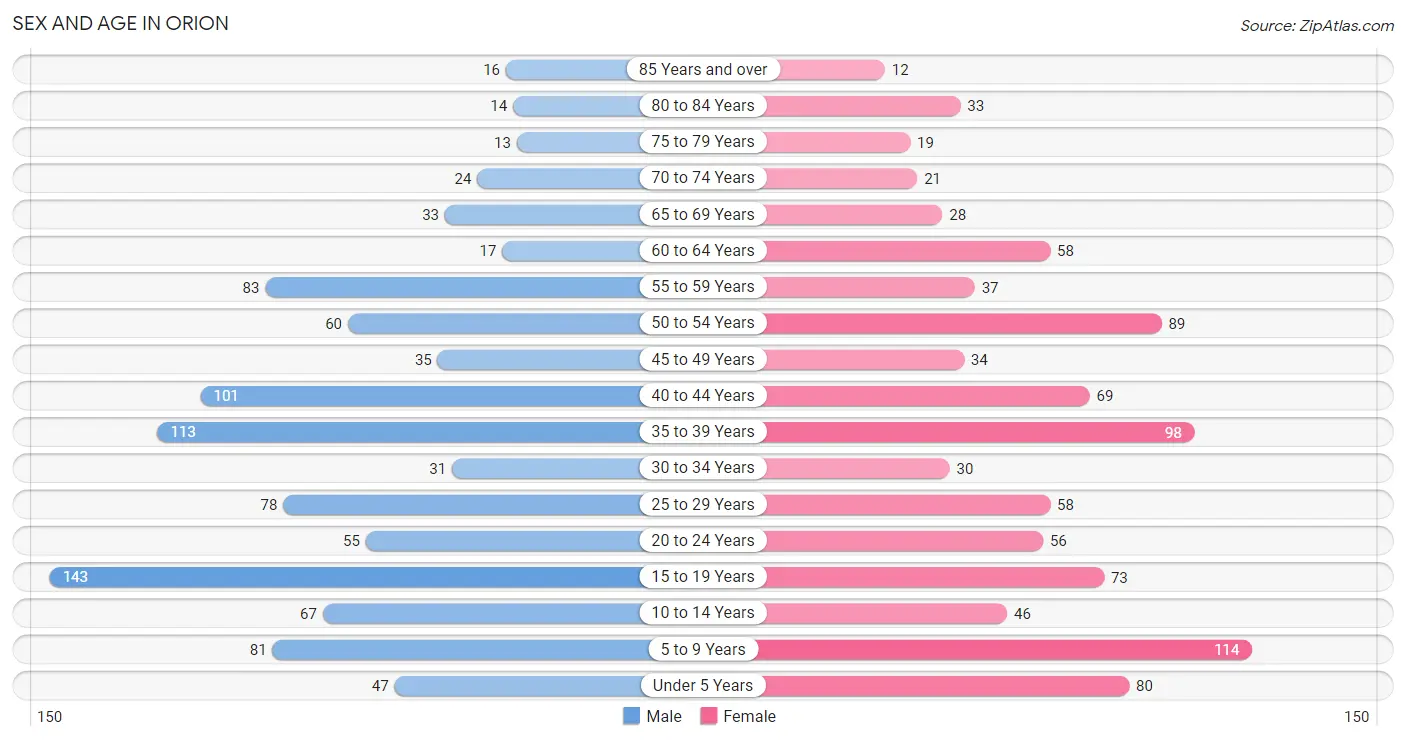
| Age Bracket | Male | Female |
| Under 5 Years | 47 (4.6%) | 80 (8.4%) |
| 5 to 9 Years | 81 (8.0%) | 114 (11.9%) |
| 10 to 14 Years | 67 (6.6%) | 46 (4.8%) |
| 15 to 19 Years | 143 (14.1%) | 73 (7.6%) |
| 20 to 24 Years | 55 (5.4%) | 56 (5.9%) |
| 25 to 29 Years | 78 (7.7%) | 58 (6.1%) |
| 30 to 34 Years | 31 (3.1%) | 30 (3.1%) |
| 35 to 39 Years | 113 (11.2%) | 98 (10.3%) |
| 40 to 44 Years | 101 (10.0%) | 69 (7.2%) |
| 45 to 49 Years | 35 (3.5%) | 34 (3.6%) |
| 50 to 54 Years | 60 (5.9%) | 89 (9.3%) |
| 55 to 59 Years | 83 (8.2%) | 37 (3.9%) |
| 60 to 64 Years | 17 (1.7%) | 58 (6.1%) |
| 65 to 69 Years | 33 (3.3%) | 28 (2.9%) |
| 70 to 74 Years | 24 (2.4%) | 21 (2.2%) |
| 75 to 79 Years | 13 (1.3%) | 19 (2.0%) |
| 80 to 84 Years | 14 (1.4%) | 33 (3.5%) |
| 85 Years and over | 16 (1.6%) | 12 (1.3%) |
| Total | 1,011 (100.0%) | 955 (100.0%) |
Families and Households in Orion
Median Family Size in Orion
The median family size in Orion is 3.39 persons per family, with married-couple families (406 | 81.0%) accounting for the largest median family size of 3.46 persons per family. On the other hand, single male/father families (39 | 7.8%) represent the smallest median family size with 2.64 persons per family.
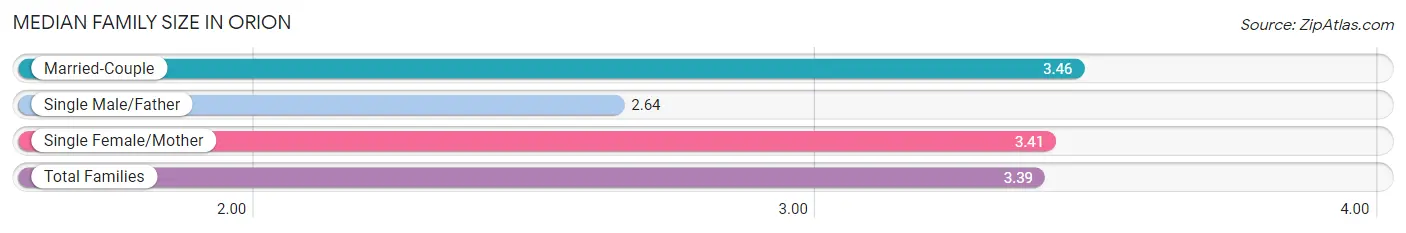
| Family Type | # Families | Family Size |
| Married-Couple | 406 (81.0%) | 3.46 |
| Single Male/Father | 39 (7.8%) | 2.64 |
| Single Female/Mother | 56 (11.2%) | 3.41 |
| Total Families | 501 (100.0%) | 3.39 |
Median Household Size in Orion
The median household size in Orion is 2.88 persons per household, with single female/mother households (56 | 8.2%) accounting for the largest median household size of 3.71 persons per household. non-family households (181 | 26.5%) represent the smallest median household size with 1.18 persons per household.
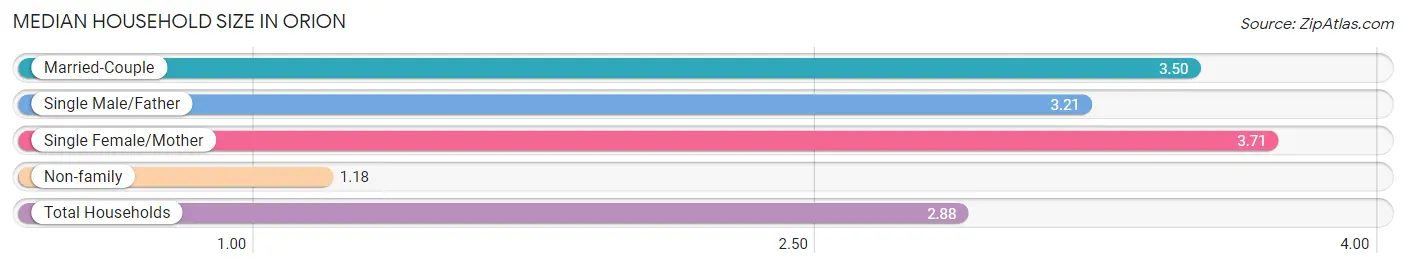
| Household Type | # Households | Household Size |
| Married-Couple | 406 (59.5%) | 3.50 |
| Single Male/Father | 39 (5.7%) | 3.21 |
| Single Female/Mother | 56 (8.2%) | 3.71 |
| Non-family | 181 (26.5%) | 1.18 |
| Total Households | 682 (100.0%) | 2.88 |
Household Size by Marriage Status in Orion
Out of a total of 682 households in Orion, 501 (73.5%) are family households, while 181 (26.5%) are nonfamily households. The most numerous type of family households are 2-person households, comprising 157, and the most common type of nonfamily households are 1-person households, comprising 148.
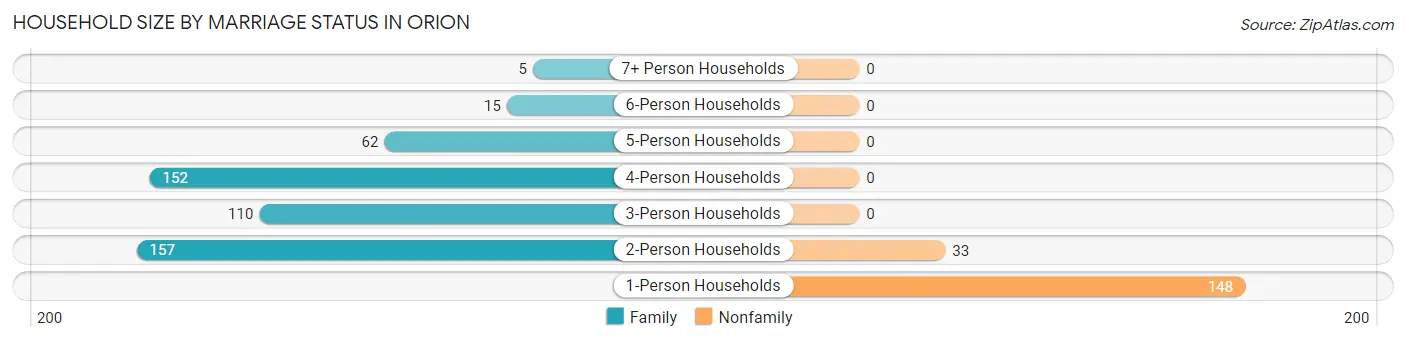
| Household Size | Family Households | Nonfamily Households |
| 1-Person Households | - | 148 (21.7%) |
| 2-Person Households | 157 (23.0%) | 33 (4.8%) |
| 3-Person Households | 110 (16.1%) | 0 (0.0%) |
| 4-Person Households | 152 (22.3%) | 0 (0.0%) |
| 5-Person Households | 62 (9.1%) | 0 (0.0%) |
| 6-Person Households | 15 (2.2%) | 0 (0.0%) |
| 7+ Person Households | 5 (0.7%) | 0 (0.0%) |
| Total | 501 (73.5%) | 181 (26.5%) |
Female Fertility in Orion
Fertility by Age in Orion
Average fertility rate in Orion is 33.0 births per 1,000 women. Women in the age bracket of 20 to 34 years have the highest fertility rate with 97.0 births per 1,000 women. Women in the age bracket of 20 to 34 years acount for 100.0% of all women with births.
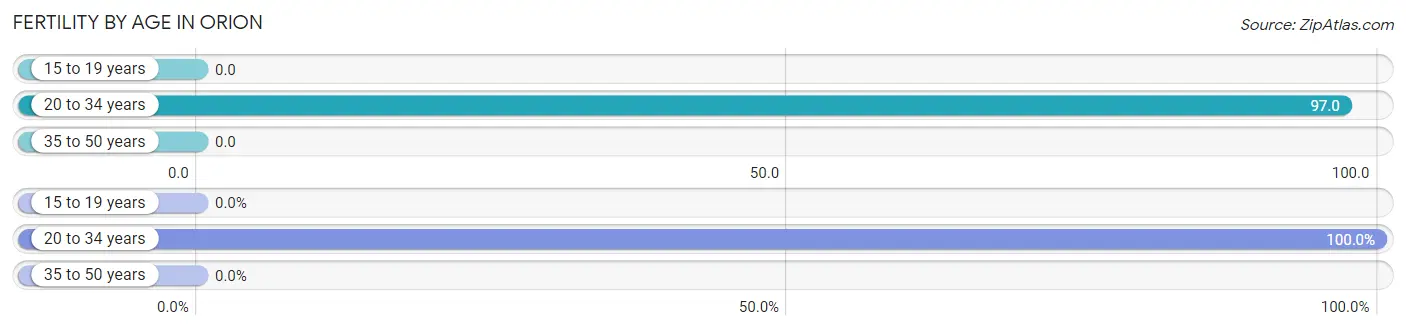
| Age Bracket | Women with Births | Births / 1,000 Women |
| 15 to 19 years | 0 (0.0%) | 0.0 |
| 20 to 34 years | 14 (100.0%) | 97.0 |
| 35 to 50 years | 0 (0.0%) | 0.0 |
| Total | 14 (100.0%) | 33.0 |
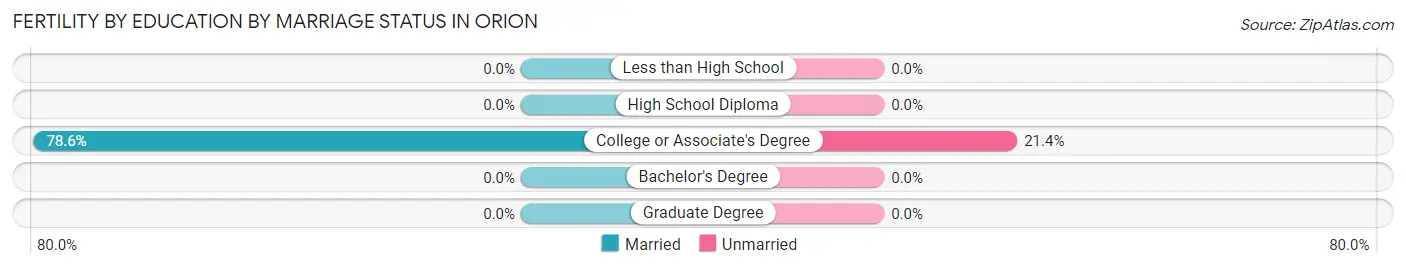
Fertility by Age by Marriage Status in Orion
78.6% of women with births (14) in Orion are married. The highest percentage of unmarried women with births falls into 20 to 34 years age bracket with 21.4% of them unmarried at the time of birth, while the lowest percentage of unmarried women with births belong to 20 to 34 years age bracket with 21.4% of them unmarried.
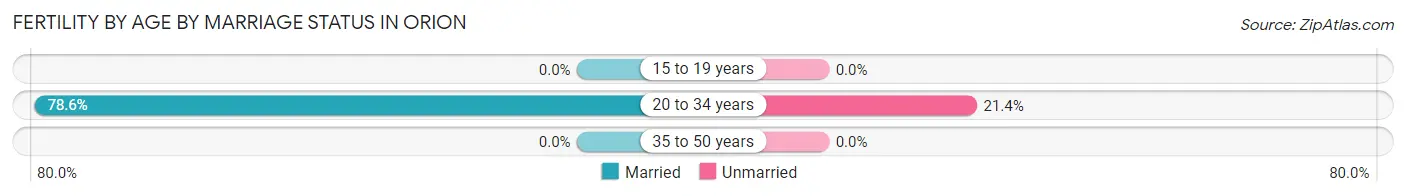
| Age Bracket | Married | Unmarried |
| 15 to 19 years | 0 (0.0%) | 0 (0.0%) |
| 20 to 34 years | 11 (78.6%) | 3 (21.4%) |
| 35 to 50 years | 0 (0.0%) | 0 (0.0%) |
| Total | 11 (78.6%) | 3 (21.4%) |
Fertility by Education in Orion
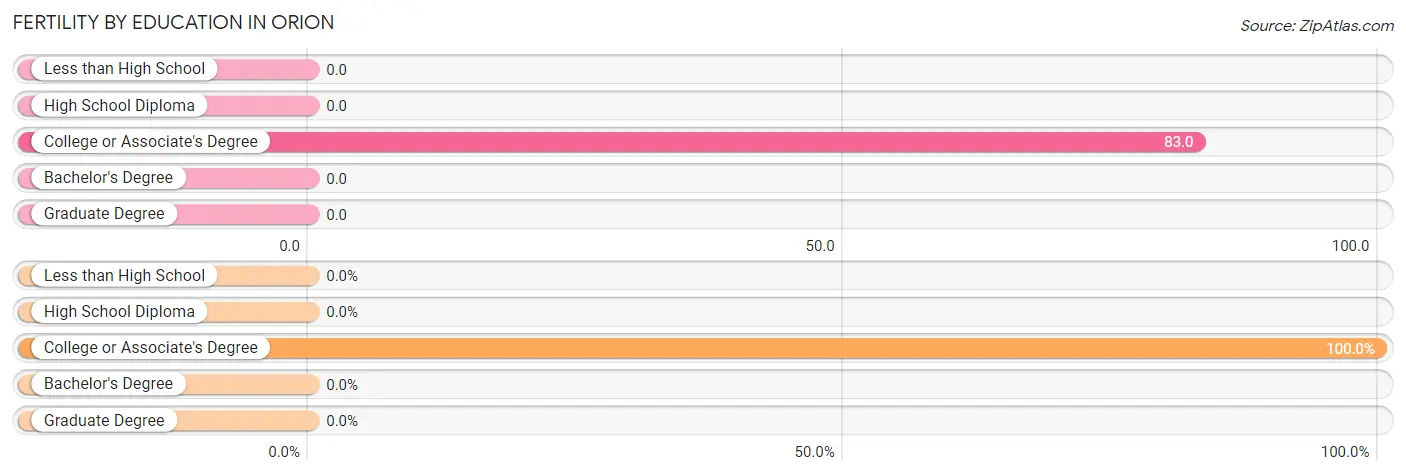
| Educational Attainment | Women with Births | Births / 1,000 Women |
| Less than High School | 0 (0.0%) | 0.0 |
| High School Diploma | 0 (0.0%) | 0.0 |
| College or Associate's Degree | 14 (100.0%) | 83.0 |
| Bachelor's Degree | 0 (0.0%) | 0.0 |
| Graduate Degree | 0 (0.0%) | 0.0 |
| Total | 14 (100.0%) | 33.0 |
Fertility by Education by Marriage Status in Orion
21.4% of women with births in Orion are unmarried. Women with the educational attainment of college or associate's degree are most likely to be married with 78.6% of them married at childbirth, while women with the educational attainment of college or associate's degree are least likely to be married with 21.4% of them unmarried at childbirth.
| Educational Attainment | Married | Unmarried |
| Less than High School | 0 (0.0%) | 0 (0.0%) |
| High School Diploma | 0 (0.0%) | 0 (0.0%) |
| College or Associate's Degree | 11 (78.6%) | 3 (21.4%) |
| Bachelor's Degree | 0 (0.0%) | 0 (0.0%) |
| Graduate Degree | 0 (0.0%) | 0 (0.0%) |
| Total | 11 (78.6%) | 3 (21.4%) |
Employment Characteristics in Orion
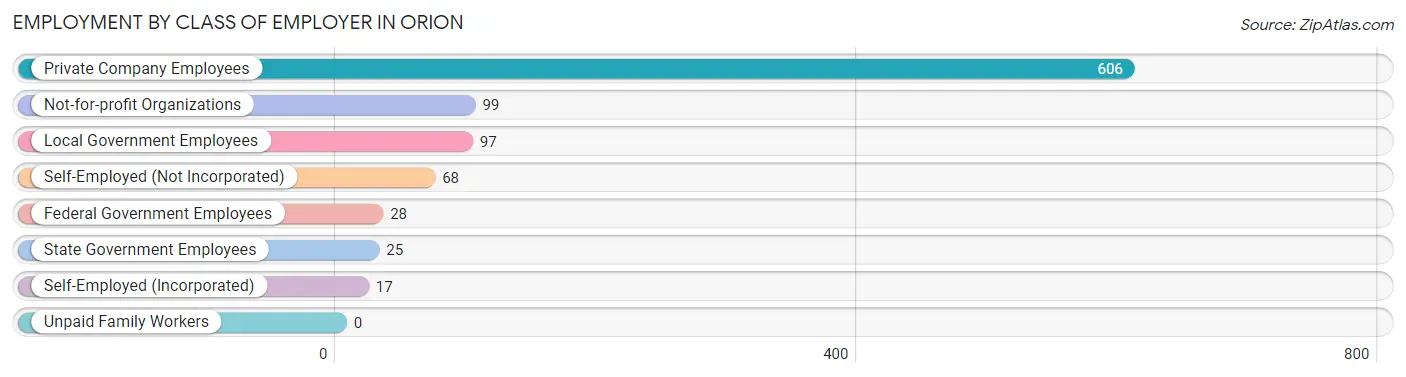
Employment by Class of Employer in Orion
Among the 940 employed individuals in Orion, private company employees (606 | 64.5%), not-for-profit organizations (99 | 10.5%), and local government employees (97 | 10.3%) make up the most common classes of employment.
| Employer Class | # Employees | % Employees |
| Private Company Employees | 606 | 64.5% |
| Self-Employed (Incorporated) | 17 | 1.8% |
| Self-Employed (Not Incorporated) | 68 | 7.2% |
| Not-for-profit Organizations | 99 | 10.5% |
| Local Government Employees | 97 | 10.3% |
| State Government Employees | 25 | 2.7% |
| Federal Government Employees | 28 | 3.0% |
| Unpaid Family Workers | 0 | 0.0% |
| Total | 940 | 100.0% |
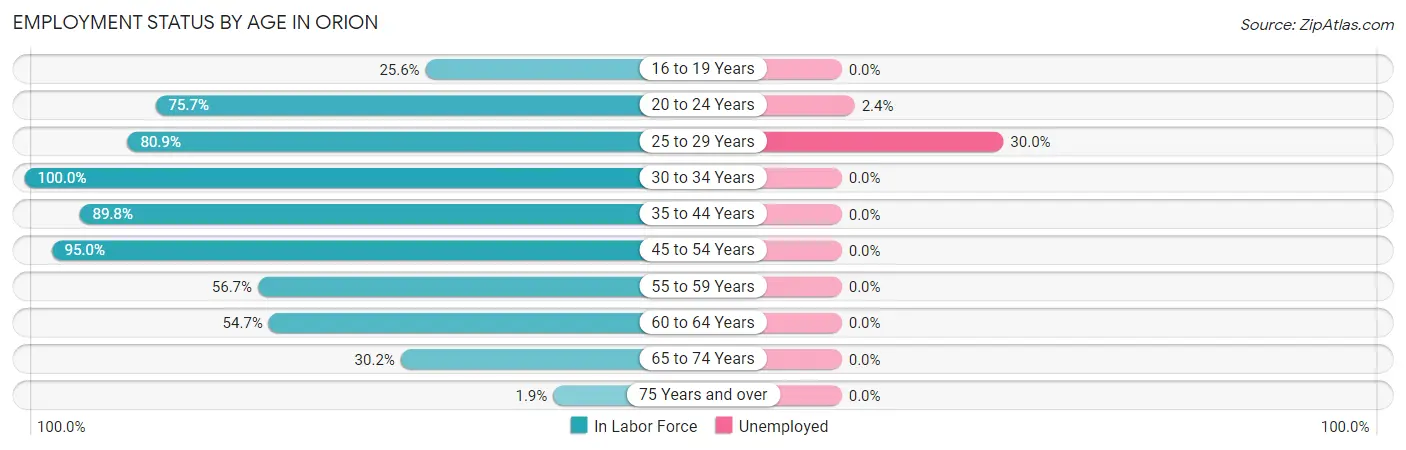
Employment Status by Age in Orion
According to the labor force statistics for Orion, out of the total population over 16 years of age (1,471), 67.1% or 987 individuals are in the labor force, with 3.5% or 35 of them unemployed. The age group with the highest labor force participation rate is 30 to 34 years, with 100.0% or 61 individuals in the labor force. Within the labor force, the 25 to 29 years age range has the highest percentage of unemployed individuals, with 30.0% or 33 of them being unemployed.
| Age Bracket | In Labor Force | Unemployed |
| 16 to 19 Years | 40 (25.6%) | 0 (0.0%) |
| 20 to 24 Years | 84 (75.7%) | 2 (2.4%) |
| 25 to 29 Years | 110 (80.9%) | 33 (30.0%) |
| 30 to 34 Years | 61 (100.0%) | 0 (0.0%) |
| 35 to 44 Years | 342 (89.8%) | 0 (0.0%) |
| 45 to 54 Years | 207 (95.0%) | 0 (0.0%) |
| 55 to 59 Years | 68 (56.7%) | 0 (0.0%) |
| 60 to 64 Years | 41 (54.7%) | 0 (0.0%) |
| 65 to 74 Years | 32 (30.2%) | 0 (0.0%) |
| 75 Years and over | 2 (1.9%) | 0 (0.0%) |
| Total | 987 (67.1%) | 35 (3.5%) |
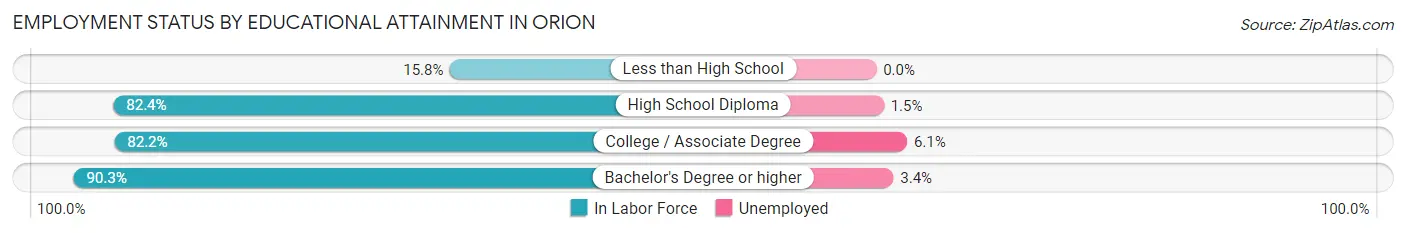
Employment Status by Educational Attainment in Orion
According to labor force statistics for Orion, 83.7% of individuals (829) out of the total population between 25 and 64 years of age (991) are in the labor force, with 4.0% or 33 of them being unemployed. The group with the highest labor force participation rate are those with the educational attainment of bachelor's degree or higher, with 90.3% or 298 individuals in the labor force. Within the labor force, individuals with college / associate degree education have the highest percentage of unemployment, with 6.1% or 20 of them being unemployed.
| Educational Attainment | In Labor Force | Unemployed |
| Less than High School | 3 (15.8%) | 0 (0.0%) |
| High School Diploma | 201 (82.4%) | 4 (1.5%) |
| College / Associate Degree | 327 (82.2%) | 24 (6.1%) |
| Bachelor's Degree or higher | 298 (90.3%) | 11 (3.4%) |
| Total | 829 (83.7%) | 40 (4.0%) |
Employment Occupations by Sex in Orion
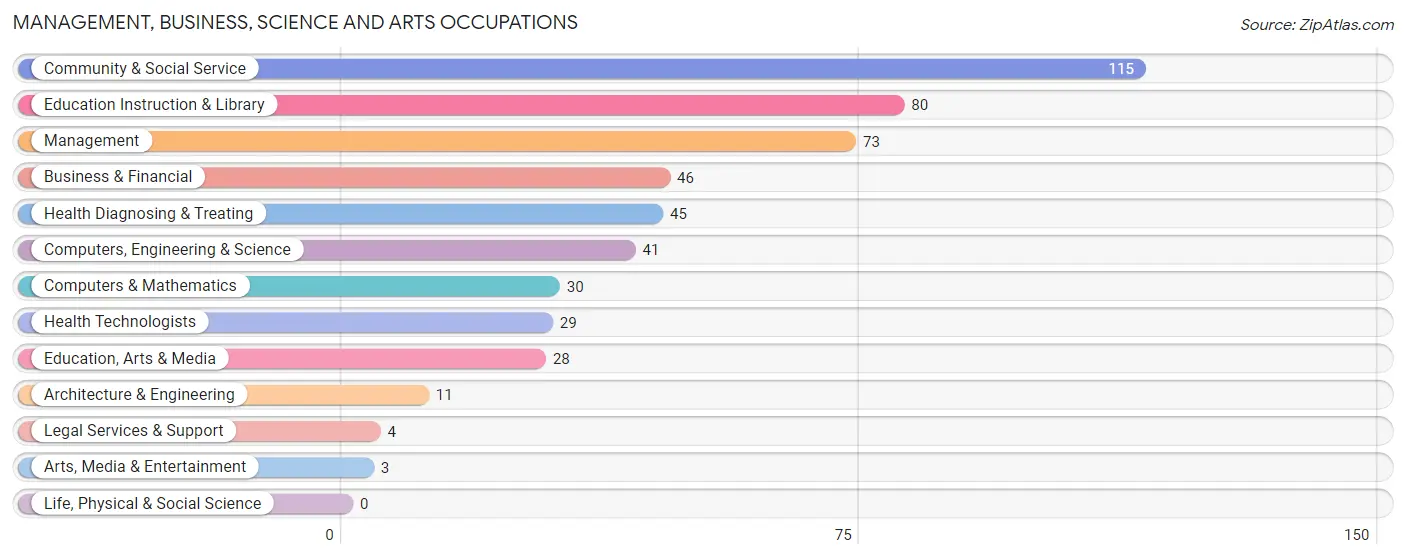
Management, Business, Science and Arts Occupations
The most common Management, Business, Science and Arts occupations in Orion are Community & Social Service (115 | 12.1%), Education Instruction & Library (80 | 8.4%), Management (73 | 7.7%), Business & Financial (46 | 4.8%), and Health Diagnosing & Treating (45 | 4.7%).
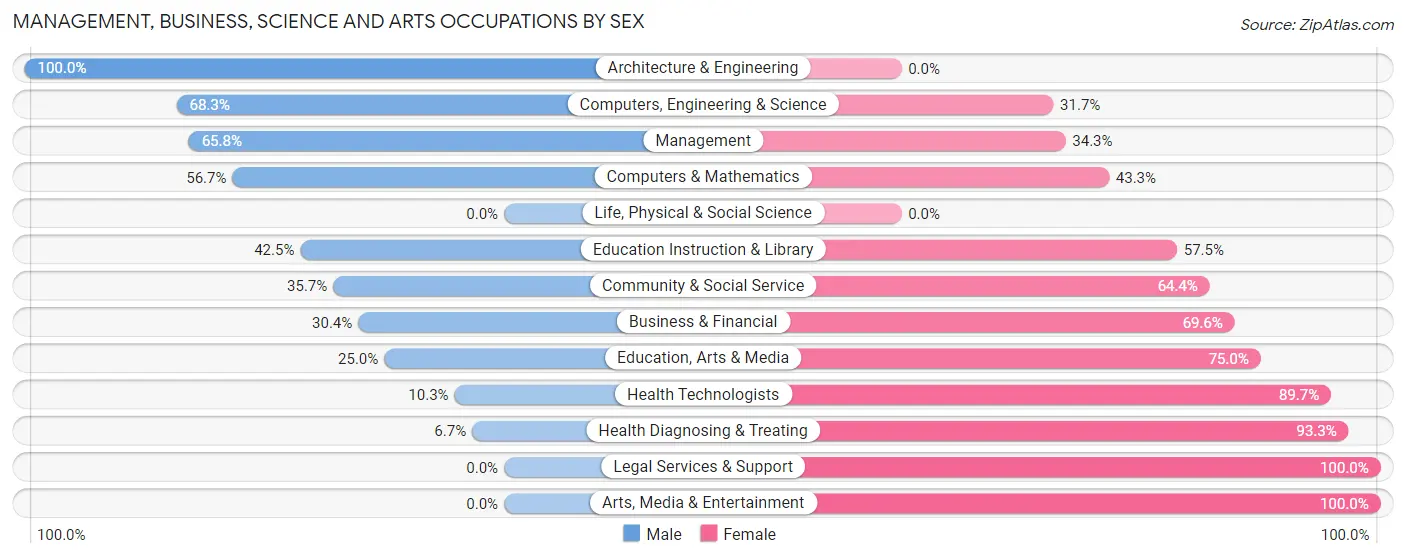
Management, Business, Science and Arts Occupations by Sex
Within the Management, Business, Science and Arts occupations in Orion, the most male-oriented occupations are Architecture & Engineering (100.0%), Computers, Engineering & Science (68.3%), and Management (65.7%), while the most female-oriented occupations are Legal Services & Support (100.0%), Arts, Media & Entertainment (100.0%), and Health Diagnosing & Treating (93.3%).
| Occupation | Male | Female |
| Management | 48 (65.7%) | 25 (34.3%) |
| Business & Financial | 14 (30.4%) | 32 (69.6%) |
| Computers, Engineering & Science | 28 (68.3%) | 13 (31.7%) |
| Computers & Mathematics | 17 (56.7%) | 13 (43.3%) |
| Architecture & Engineering | 11 (100.0%) | 0 (0.0%) |
| Life, Physical & Social Science | 0 (0.0%) | 0 (0.0%) |
| Community & Social Service | 41 (35.6%) | 74 (64.3%) |
| Education, Arts & Media | 7 (25.0%) | 21 (75.0%) |
| Legal Services & Support | 0 (0.0%) | 4 (100.0%) |
| Education Instruction & Library | 34 (42.5%) | 46 (57.5%) |
| Arts, Media & Entertainment | 0 (0.0%) | 3 (100.0%) |
| Health Diagnosing & Treating | 3 (6.7%) | 42 (93.3%) |
| Health Technologists | 3 (10.3%) | 26 (89.7%) |
| Total (Category) | 134 (41.9%) | 186 (58.1%) |
| Total (Overall) | 501 (52.6%) | 451 (47.4%) |
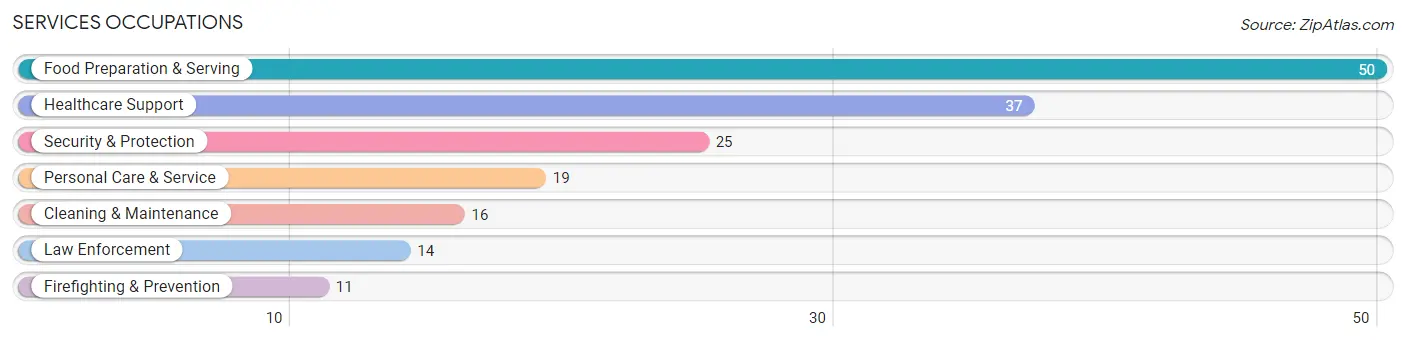
Services Occupations
The most common Services occupations in Orion are Food Preparation & Serving (50 | 5.2%), Healthcare Support (37 | 3.9%), Security & Protection (25 | 2.6%), Personal Care & Service (19 | 2.0%), and Cleaning & Maintenance (16 | 1.7%).
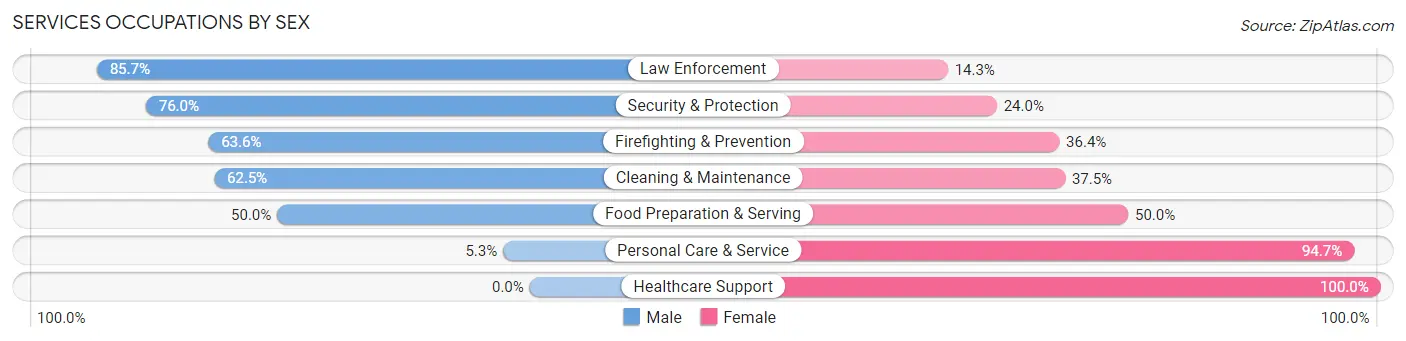
Services Occupations by Sex
Within the Services occupations in Orion, the most male-oriented occupations are Law Enforcement (85.7%), Security & Protection (76.0%), and Firefighting & Prevention (63.6%), while the most female-oriented occupations are Healthcare Support (100.0%), Personal Care & Service (94.7%), and Food Preparation & Serving (50.0%).
| Occupation | Male | Female |
| Healthcare Support | 0 (0.0%) | 37 (100.0%) |
| Security & Protection | 19 (76.0%) | 6 (24.0%) |
| Firefighting & Prevention | 7 (63.6%) | 4 (36.4%) |
| Law Enforcement | 12 (85.7%) | 2 (14.3%) |
| Food Preparation & Serving | 25 (50.0%) | 25 (50.0%) |
| Cleaning & Maintenance | 10 (62.5%) | 6 (37.5%) |
| Personal Care & Service | 1 (5.3%) | 18 (94.7%) |
| Total (Category) | 55 (37.4%) | 92 (62.6%) |
| Total (Overall) | 501 (52.6%) | 451 (47.4%) |
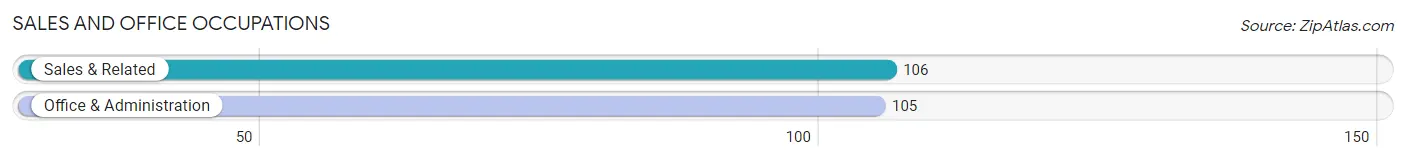
Sales and Office Occupations
The most common Sales and Office occupations in Orion are Sales & Related (106 | 11.1%), and Office & Administration (105 | 11.0%).
Sales and Office Occupations by Sex
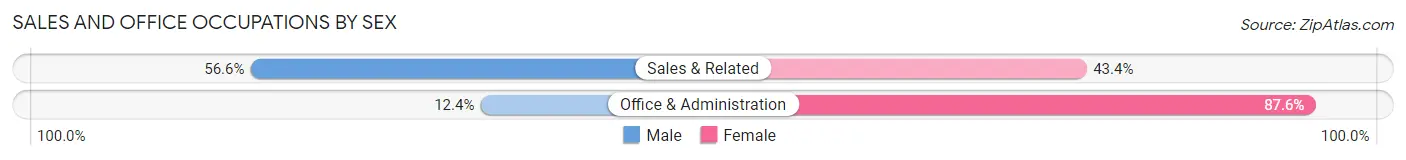
| Occupation | Male | Female |
| Sales & Related | 60 (56.6%) | 46 (43.4%) |
| Office & Administration | 13 (12.4%) | 92 (87.6%) |
| Total (Category) | 73 (34.6%) | 138 (65.4%) |
| Total (Overall) | 501 (52.6%) | 451 (47.4%) |
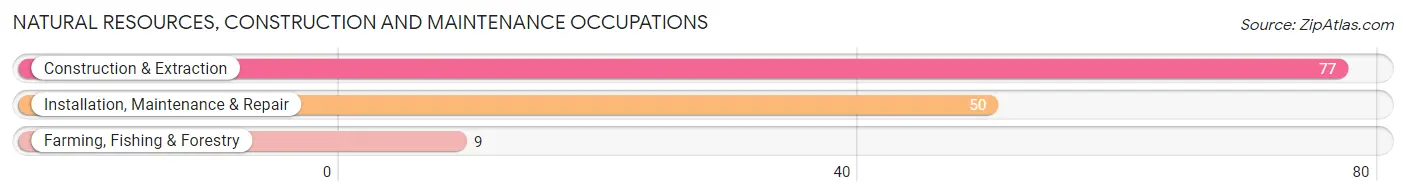
Natural Resources, Construction and Maintenance Occupations
The most common Natural Resources, Construction and Maintenance occupations in Orion are Construction & Extraction (77 | 8.1%), Installation, Maintenance & Repair (50 | 5.2%), and Farming, Fishing & Forestry (9 | 0.9%).
Natural Resources, Construction and Maintenance Occupations by Sex
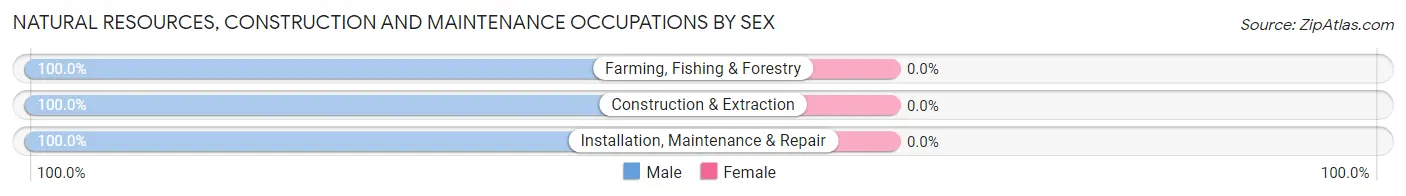
| Occupation | Male | Female |
| Farming, Fishing & Forestry | 9 (100.0%) | 0 (0.0%) |
| Construction & Extraction | 77 (100.0%) | 0 (0.0%) |
| Installation, Maintenance & Repair | 50 (100.0%) | 0 (0.0%) |
| Total (Category) | 136 (100.0%) | 0 (0.0%) |
| Total (Overall) | 501 (52.6%) | 451 (47.4%) |
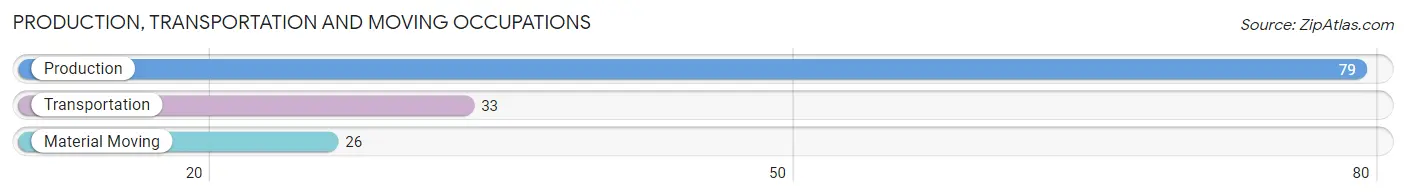
Production, Transportation and Moving Occupations
The most common Production, Transportation and Moving occupations in Orion are Production (79 | 8.3%), Transportation (33 | 3.5%), and Material Moving (26 | 2.7%).
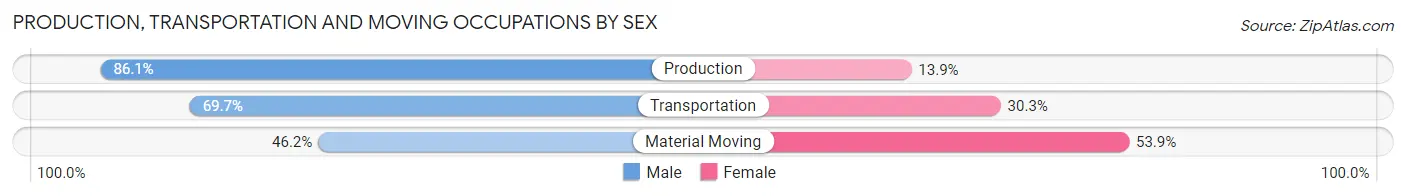
Production, Transportation and Moving Occupations by Sex
| Occupation | Male | Female |
| Production | 68 (86.1%) | 11 (13.9%) |
| Transportation | 23 (69.7%) | 10 (30.3%) |
| Material Moving | 12 (46.2%) | 14 (53.8%) |
| Total (Category) | 103 (74.6%) | 35 (25.4%) |
| Total (Overall) | 501 (52.6%) | 451 (47.4%) |
Employment Industries by Sex in Orion
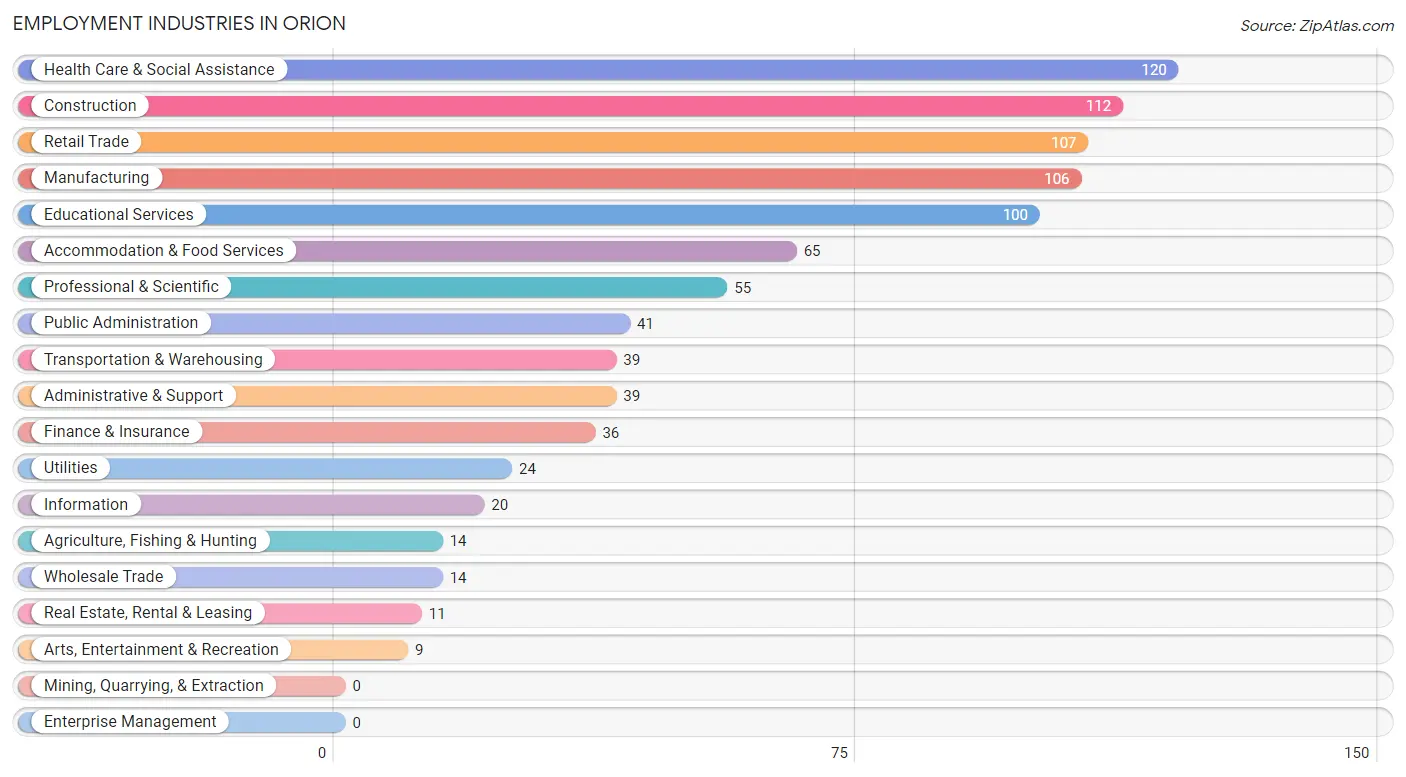
Employment Industries in Orion
The major employment industries in Orion include Health Care & Social Assistance (120 | 12.6%), Construction (112 | 11.8%), Retail Trade (107 | 11.2%), Manufacturing (106 | 11.1%), and Educational Services (100 | 10.5%).
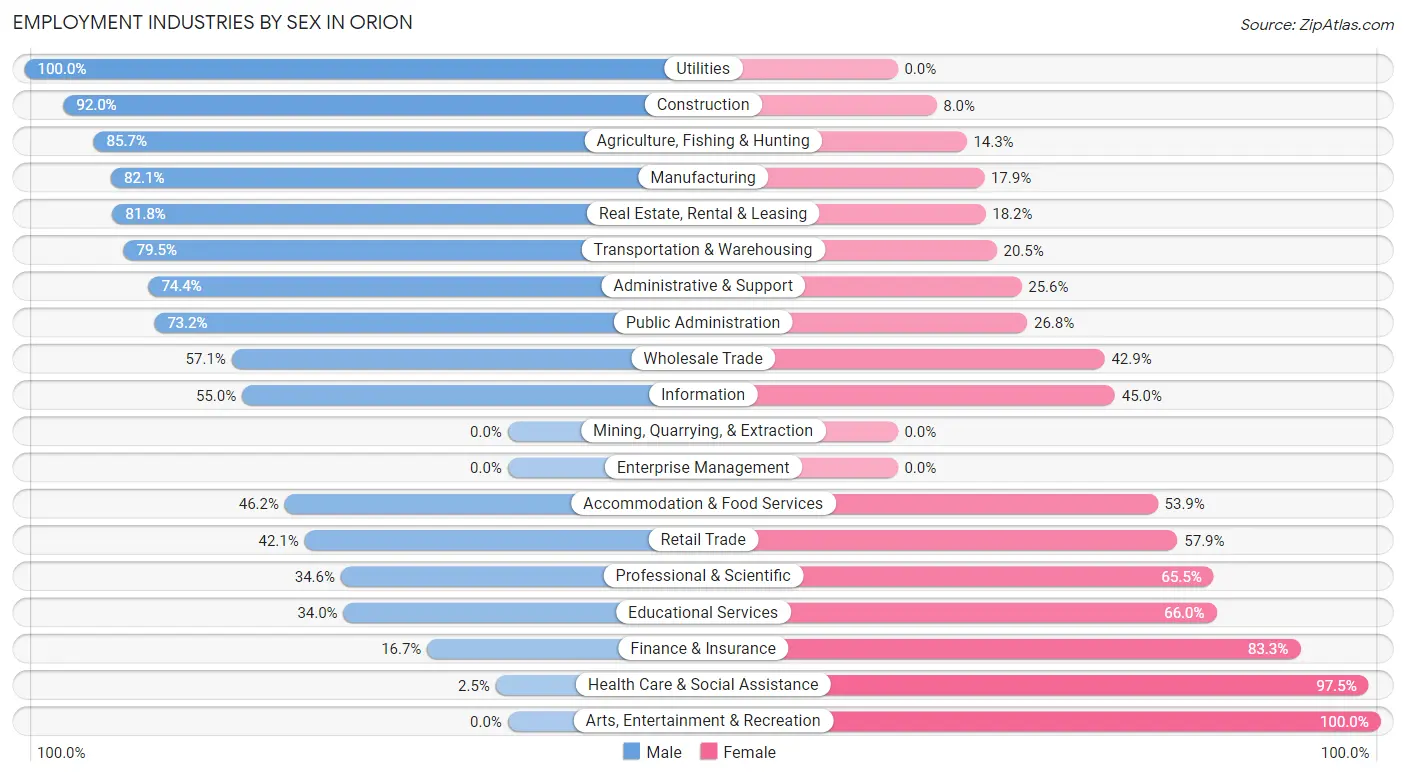
Employment Industries by Sex in Orion
The Orion industries that see more men than women are Utilities (100.0%), Construction (92.0%), and Agriculture, Fishing & Hunting (85.7%), whereas the industries that tend to have a higher number of women are Arts, Entertainment & Recreation (100.0%), Health Care & Social Assistance (97.5%), and Finance & Insurance (83.3%).
| Industry | Male | Female |
| Agriculture, Fishing & Hunting | 12 (85.7%) | 2 (14.3%) |
| Mining, Quarrying, & Extraction | 0 (0.0%) | 0 (0.0%) |
| Construction | 103 (92.0%) | 9 (8.0%) |
| Manufacturing | 87 (82.1%) | 19 (17.9%) |
| Wholesale Trade | 8 (57.1%) | 6 (42.9%) |
| Retail Trade | 45 (42.1%) | 62 (57.9%) |
| Transportation & Warehousing | 31 (79.5%) | 8 (20.5%) |
| Utilities | 24 (100.0%) | 0 (0.0%) |
| Information | 11 (55.0%) | 9 (45.0%) |
| Finance & Insurance | 6 (16.7%) | 30 (83.3%) |
| Real Estate, Rental & Leasing | 9 (81.8%) | 2 (18.2%) |
| Professional & Scientific | 19 (34.5%) | 36 (65.4%) |
| Enterprise Management | 0 (0.0%) | 0 (0.0%) |
| Administrative & Support | 29 (74.4%) | 10 (25.6%) |
| Educational Services | 34 (34.0%) | 66 (66.0%) |
| Health Care & Social Assistance | 3 (2.5%) | 117 (97.5%) |
| Arts, Entertainment & Recreation | 0 (0.0%) | 9 (100.0%) |
| Accommodation & Food Services | 30 (46.2%) | 35 (53.8%) |
| Public Administration | 30 (73.2%) | 11 (26.8%) |
| Total | 501 (52.6%) | 451 (47.4%) |
Education in Orion
School Enrollment in Orion
The most common levels of schooling among the 588 students in Orion are high school (185 | 31.5%), elementary school (119 | 20.2%), and middle school (92 | 15.7%).
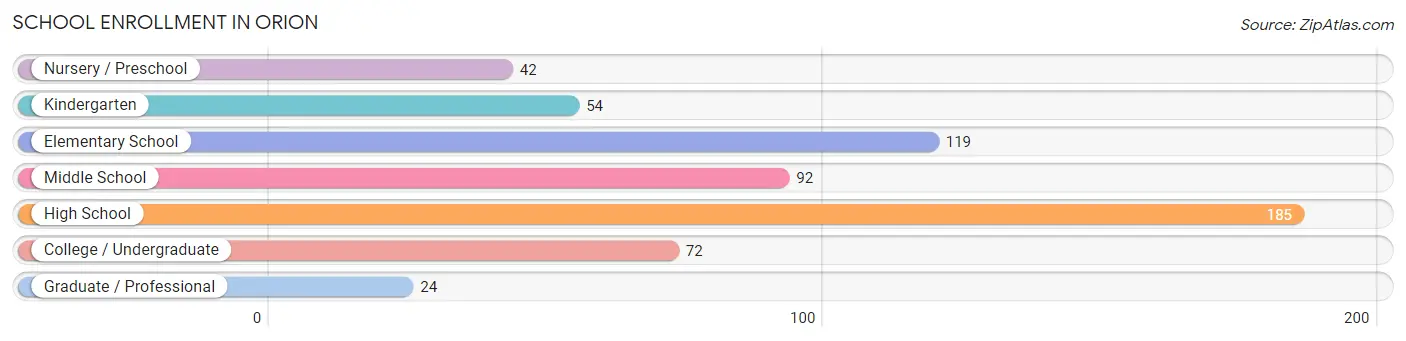
| School Level | # Students | % Students |
| Nursery / Preschool | 42 | 7.1% |
| Kindergarten | 54 | 9.2% |
| Elementary School | 119 | 20.2% |
| Middle School | 92 | 15.7% |
| High School | 185 | 31.5% |
| College / Undergraduate | 72 | 12.2% |
| Graduate / Professional | 24 | 4.1% |
| Total | 588 | 100.0% |
School Enrollment by Age by Funding Source in Orion
Out of a total of 588 students who are enrolled in schools in Orion, 45 (7.7%) attend a private institution, while the remaining 543 (92.3%) are enrolled in public schools. The age group of 3 to 4 year olds has the highest likelihood of being enrolled in private schools, with 9 (60.0% in the age bracket) enrolled. Conversely, the age group of 10 to 14 year olds has the lowest likelihood of being enrolled in a private school, with 112 (100.0% in the age bracket) attending a public institution.
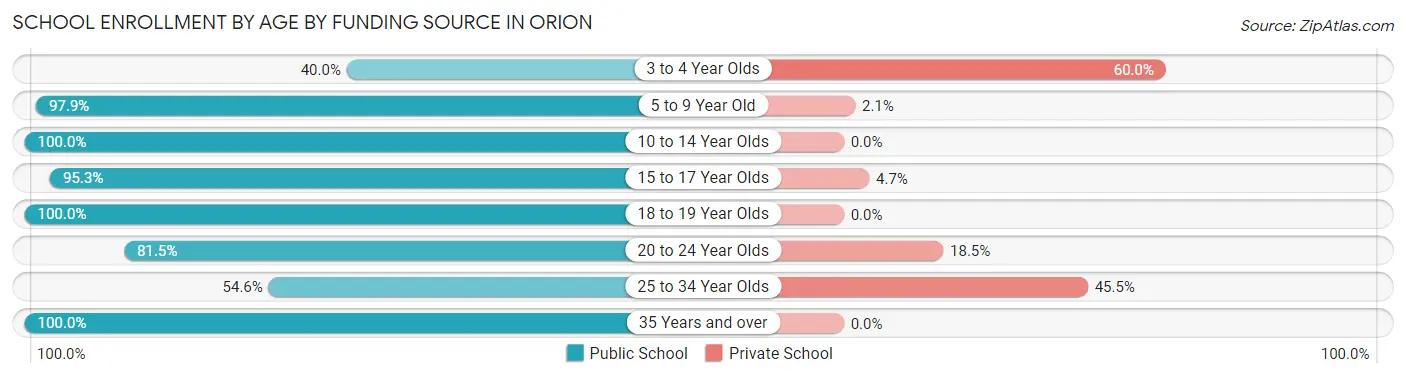
| Age Bracket | Public School | Private School |
| 3 to 4 Year Olds | 6 (40.0%) | 9 (60.0%) |
| 5 to 9 Year Old | 185 (97.9%) | 4 (2.1%) |
| 10 to 14 Year Olds | 112 (100.0%) | 0 (0.0%) |
| 15 to 17 Year Olds | 141 (95.3%) | 7 (4.7%) |
| 18 to 19 Year Olds | 41 (100.0%) | 0 (0.0%) |
| 20 to 24 Year Olds | 22 (81.5%) | 5 (18.5%) |
| 25 to 34 Year Olds | 24 (54.5%) | 20 (45.5%) |
| 35 Years and over | 12 (100.0%) | 0 (0.0%) |
| Total | 543 (92.3%) | 45 (7.7%) |
Educational Attainment by Field of Study in Orion
Business (108 | 25.1%), education (94 | 21.9%), arts & humanities (45 | 10.5%), bio, nature & agricultural (31 | 7.2%), and social sciences (26 | 6.0%) are the most common fields of study among 430 individuals in Orion who have obtained a bachelor's degree or higher.
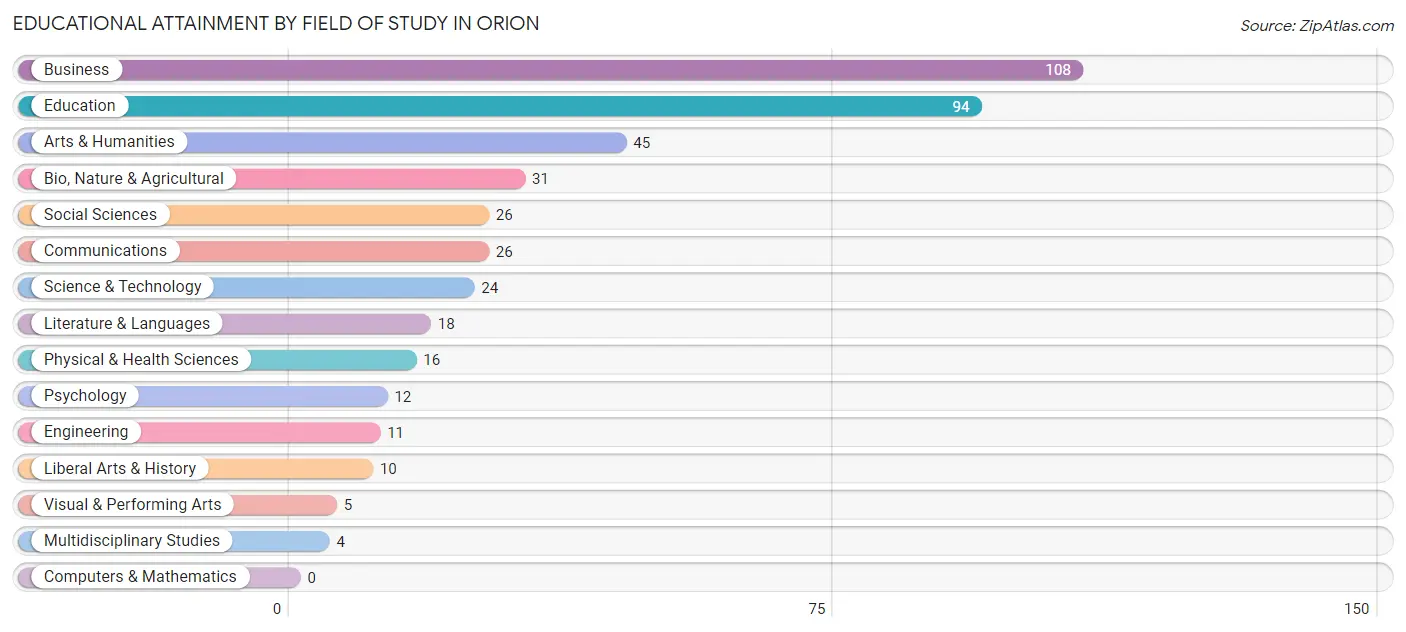
| Field of Study | # Graduates | % Graduates |
| Computers & Mathematics | 0 | 0.0% |
| Bio, Nature & Agricultural | 31 | 7.2% |
| Physical & Health Sciences | 16 | 3.7% |
| Psychology | 12 | 2.8% |
| Social Sciences | 26 | 6.0% |
| Engineering | 11 | 2.6% |
| Multidisciplinary Studies | 4 | 0.9% |
| Science & Technology | 24 | 5.6% |
| Business | 108 | 25.1% |
| Education | 94 | 21.9% |
| Literature & Languages | 18 | 4.2% |
| Liberal Arts & History | 10 | 2.3% |
| Visual & Performing Arts | 5 | 1.2% |
| Communications | 26 | 6.0% |
| Arts & Humanities | 45 | 10.5% |
| Total | 430 | 100.0% |
Transportation & Commute in Orion
Vehicle Availability by Sex in Orion
The most prevalent vehicle ownership categories in Orion are males with 2 vehicles (219, accounting for 44.8%) and females with 2 vehicles (191, making up 48.6%).
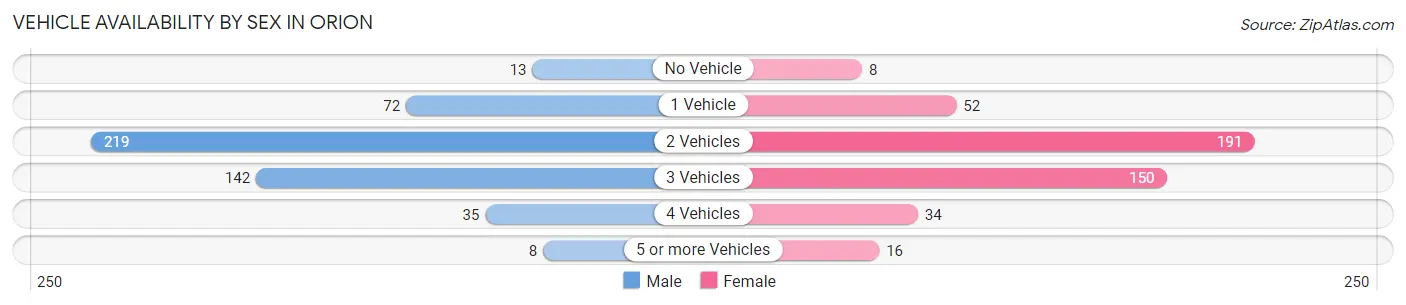
| Vehicles Available | Male | Female |
| No Vehicle | 13 (2.7%) | 8 (1.8%) |
| 1 Vehicle | 72 (14.7%) | 52 (11.5%) |
| 2 Vehicles | 219 (44.8%) | 191 (42.3%) |
| 3 Vehicles | 142 (29.0%) | 150 (33.3%) |
| 4 Vehicles | 35 (7.2%) | 34 (7.5%) |
| 5 or more Vehicles | 8 (1.6%) | 16 (3.5%) |
| Total | 489 (100.0%) | 451 (100.0%) |
Commute Time in Orion
The most frequently occuring commute durations in Orion are 20 to 24 minutes (198 commuters, 22.5%), 30 to 34 minutes (147 commuters, 16.7%), and 25 to 29 minutes (117 commuters, 13.3%).
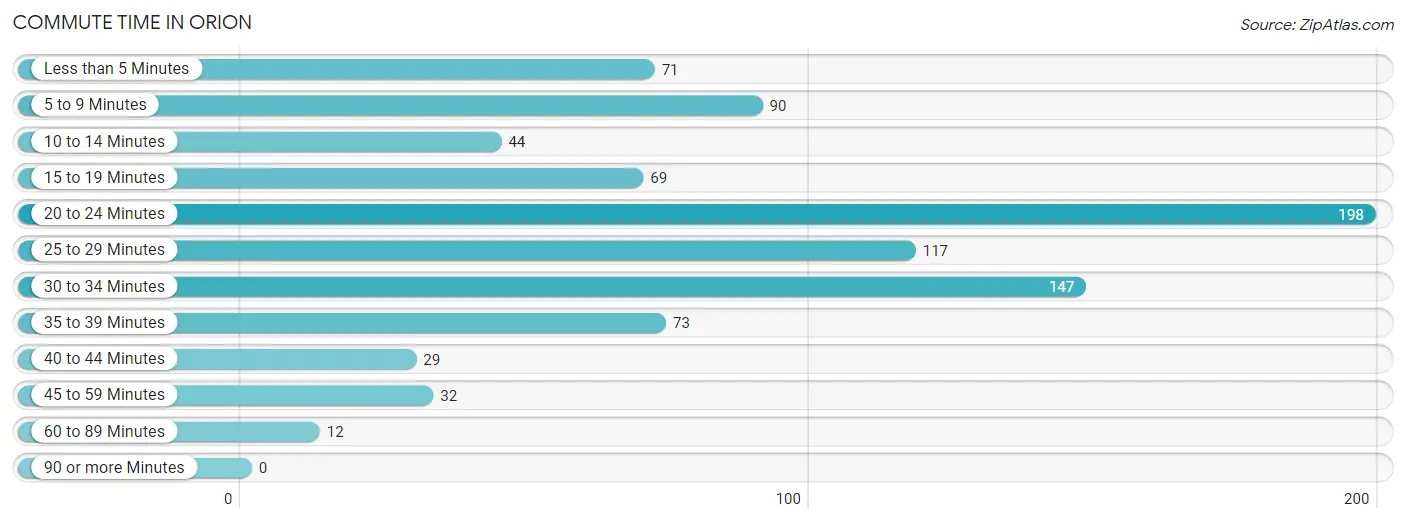
| Commute Time | # Commuters | % Commuters |
| Less than 5 Minutes | 71 | 8.1% |
| 5 to 9 Minutes | 90 | 10.2% |
| 10 to 14 Minutes | 44 | 5.0% |
| 15 to 19 Minutes | 69 | 7.8% |
| 20 to 24 Minutes | 198 | 22.5% |
| 25 to 29 Minutes | 117 | 13.3% |
| 30 to 34 Minutes | 147 | 16.7% |
| 35 to 39 Minutes | 73 | 8.3% |
| 40 to 44 Minutes | 29 | 3.3% |
| 45 to 59 Minutes | 32 | 3.6% |
| 60 to 89 Minutes | 12 | 1.4% |
| 90 or more Minutes | 0 | 0.0% |
Commute Time by Sex in Orion
The most common commute times in Orion are 20 to 24 minutes (127 commuters, 26.6%) for males and 30 to 34 minutes (77 commuters, 19.1%) for females.
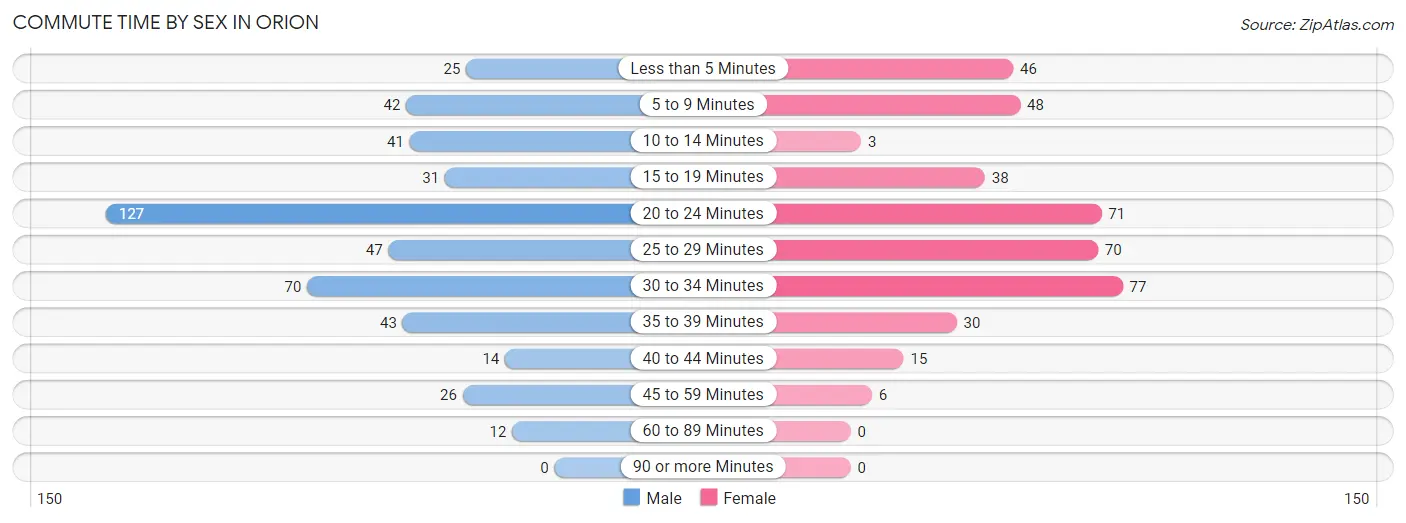
| Commute Time | Male | Female |
| Less than 5 Minutes | 25 (5.2%) | 46 (11.4%) |
| 5 to 9 Minutes | 42 (8.8%) | 48 (11.9%) |
| 10 to 14 Minutes | 41 (8.6%) | 3 (0.7%) |
| 15 to 19 Minutes | 31 (6.5%) | 38 (9.4%) |
| 20 to 24 Minutes | 127 (26.6%) | 71 (17.6%) |
| 25 to 29 Minutes | 47 (9.8%) | 70 (17.3%) |
| 30 to 34 Minutes | 70 (14.6%) | 77 (19.1%) |
| 35 to 39 Minutes | 43 (9.0%) | 30 (7.4%) |
| 40 to 44 Minutes | 14 (2.9%) | 15 (3.7%) |
| 45 to 59 Minutes | 26 (5.4%) | 6 (1.5%) |
| 60 to 89 Minutes | 12 (2.5%) | 0 (0.0%) |
| 90 or more Minutes | 0 (0.0%) | 0 (0.0%) |
Time of Departure to Work by Sex in Orion
The most frequent times of departure to work in Orion are 6:00 AM to 6:29 AM (81, 17.0%) for males and 6:30 AM to 6:59 AM (74, 18.3%) for females.
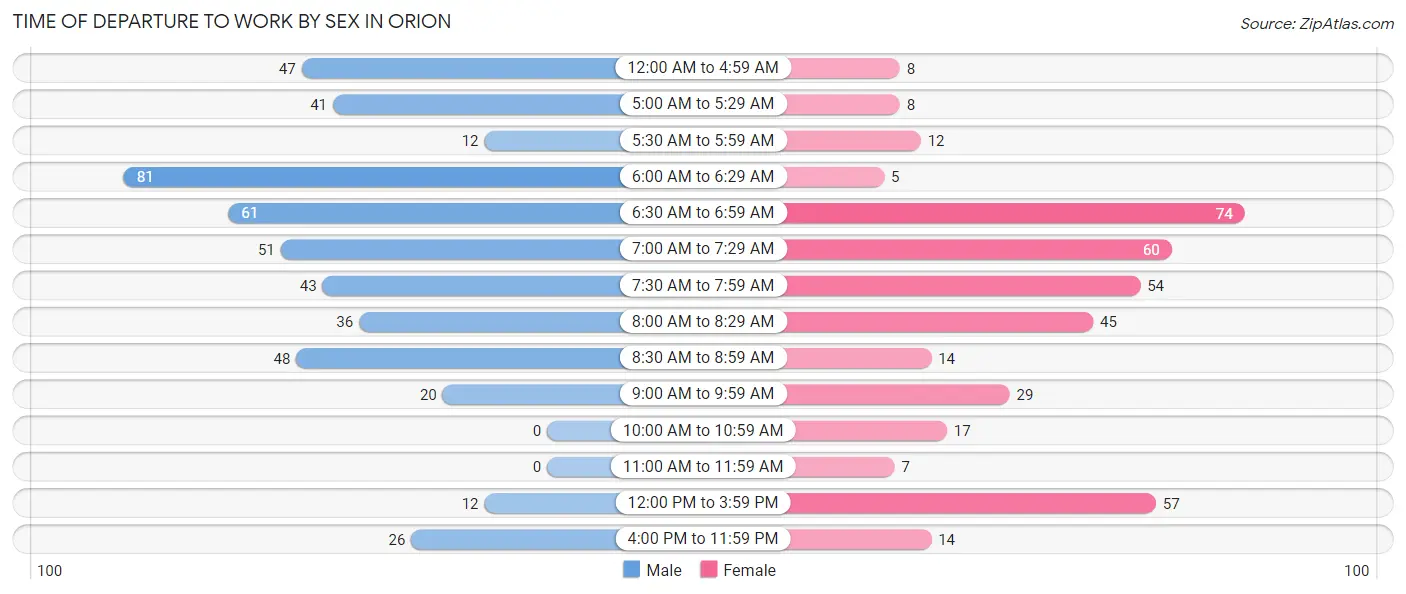
| Time of Departure | Male | Female |
| 12:00 AM to 4:59 AM | 47 (9.8%) | 8 (2.0%) |
| 5:00 AM to 5:29 AM | 41 (8.6%) | 8 (2.0%) |
| 5:30 AM to 5:59 AM | 12 (2.5%) | 12 (3.0%) |
| 6:00 AM to 6:29 AM | 81 (17.0%) | 5 (1.2%) |
| 6:30 AM to 6:59 AM | 61 (12.8%) | 74 (18.3%) |
| 7:00 AM to 7:29 AM | 51 (10.7%) | 60 (14.8%) |
| 7:30 AM to 7:59 AM | 43 (9.0%) | 54 (13.4%) |
| 8:00 AM to 8:29 AM | 36 (7.5%) | 45 (11.1%) |
| 8:30 AM to 8:59 AM | 48 (10.0%) | 14 (3.5%) |
| 9:00 AM to 9:59 AM | 20 (4.2%) | 29 (7.2%) |
| 10:00 AM to 10:59 AM | 0 (0.0%) | 17 (4.2%) |
| 11:00 AM to 11:59 AM | 0 (0.0%) | 7 (1.7%) |
| 12:00 PM to 3:59 PM | 12 (2.5%) | 57 (14.1%) |
| 4:00 PM to 11:59 PM | 26 (5.4%) | 14 (3.5%) |
| Total | 478 (100.0%) | 404 (100.0%) |
Housing Occupancy in Orion
Occupancy by Ownership in Orion
Of the total 682 dwellings in Orion, owner-occupied units account for 534 (78.3%), while renter-occupied units make up 148 (21.7%).
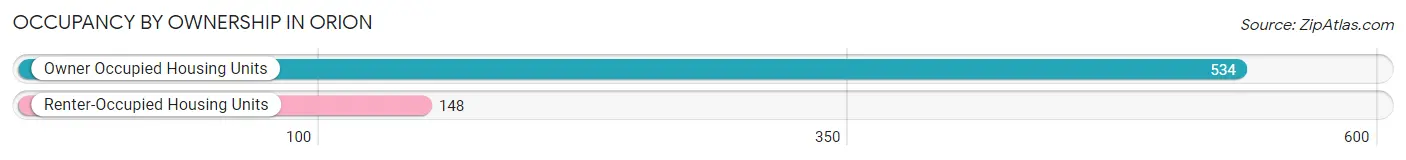
| Occupancy | # Housing Units | % Housing Units |
| Owner Occupied Housing Units | 534 | 78.3% |
| Renter-Occupied Housing Units | 148 | 21.7% |
| Total Occupied Housing Units | 682 | 100.0% |
Occupancy by Household Size in Orion
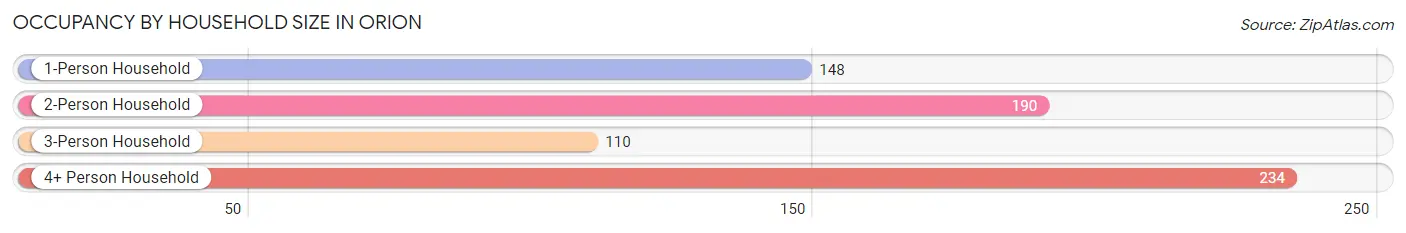
| Household Size | # Housing Units | % Housing Units |
| 1-Person Household | 148 | 21.7% |
| 2-Person Household | 190 | 27.9% |
| 3-Person Household | 110 | 16.1% |
| 4+ Person Household | 234 | 34.3% |
| Total Housing Units | 682 | 100.0% |
Occupancy by Ownership by Household Size in Orion
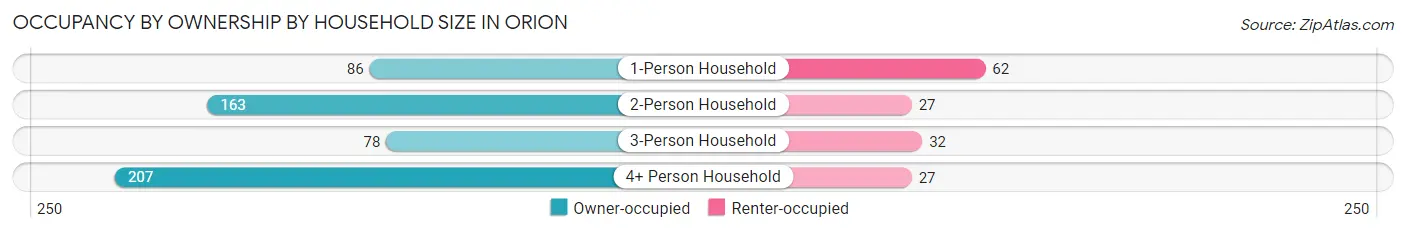
| Household Size | Owner-occupied | Renter-occupied |
| 1-Person Household | 86 (58.1%) | 62 (41.9%) |
| 2-Person Household | 163 (85.8%) | 27 (14.2%) |
| 3-Person Household | 78 (70.9%) | 32 (29.1%) |
| 4+ Person Household | 207 (88.5%) | 27 (11.5%) |
| Total Housing Units | 534 (78.3%) | 148 (21.7%) |
Occupancy by Educational Attainment in Orion
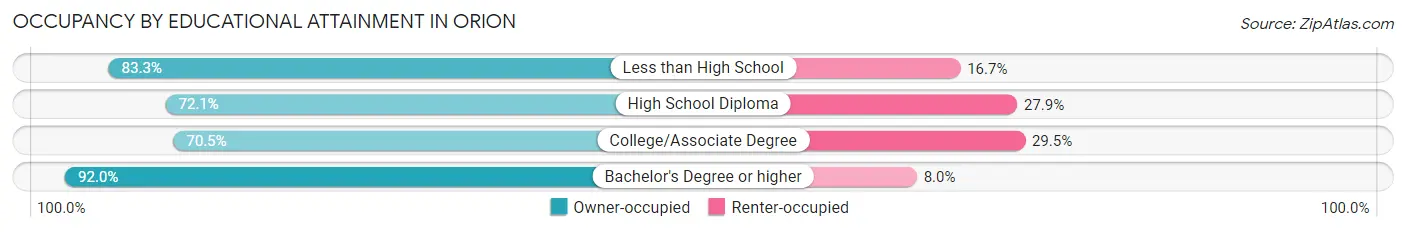
| Household Size | Owner-occupied | Renter-occupied |
| Less than High School | 15 (83.3%) | 3 (16.7%) |
| High School Diploma | 129 (72.1%) | 50 (27.9%) |
| College/Associate Degree | 184 (70.5%) | 77 (29.5%) |
| Bachelor's Degree or higher | 206 (92.0%) | 18 (8.0%) |
Occupancy by Age of Householder in Orion
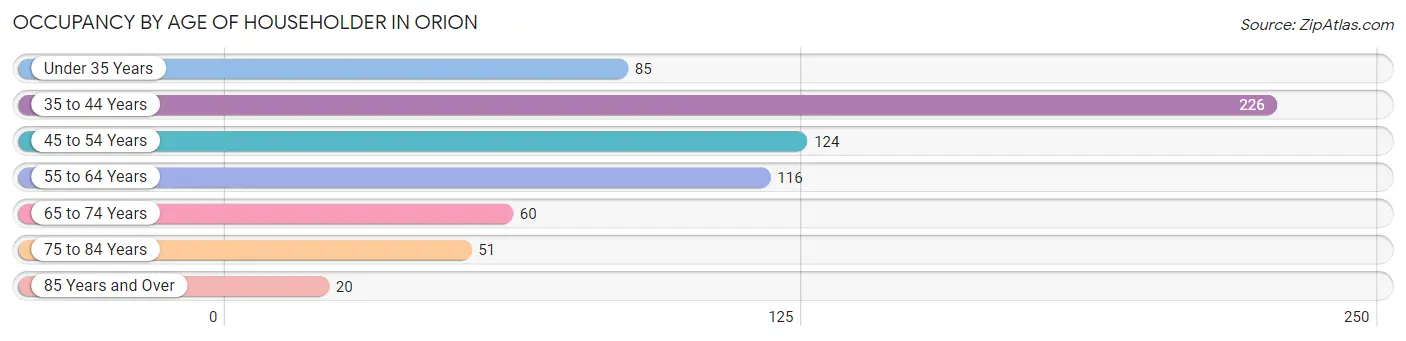
| Age Bracket | # Households | % Households |
| Under 35 Years | 85 | 12.5% |
| 35 to 44 Years | 226 | 33.1% |
| 45 to 54 Years | 124 | 18.2% |
| 55 to 64 Years | 116 | 17.0% |
| 65 to 74 Years | 60 | 8.8% |
| 75 to 84 Years | 51 | 7.5% |
| 85 Years and Over | 20 | 2.9% |
| Total | 682 | 100.0% |
Housing Finances in Orion
Median Income by Occupancy in Orion
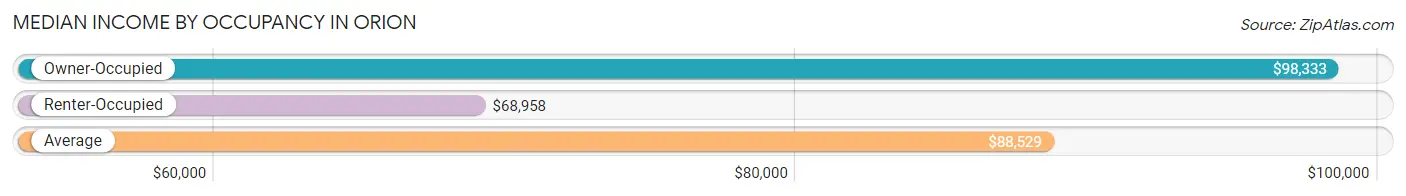
| Occupancy Type | # Households | Median Income |
| Owner-Occupied | 534 (78.3%) | $98,333 |
| Renter-Occupied | 148 (21.7%) | $68,958 |
| Average | 682 (100.0%) | $88,529 |
Occupancy by Householder Income Bracket in Orion
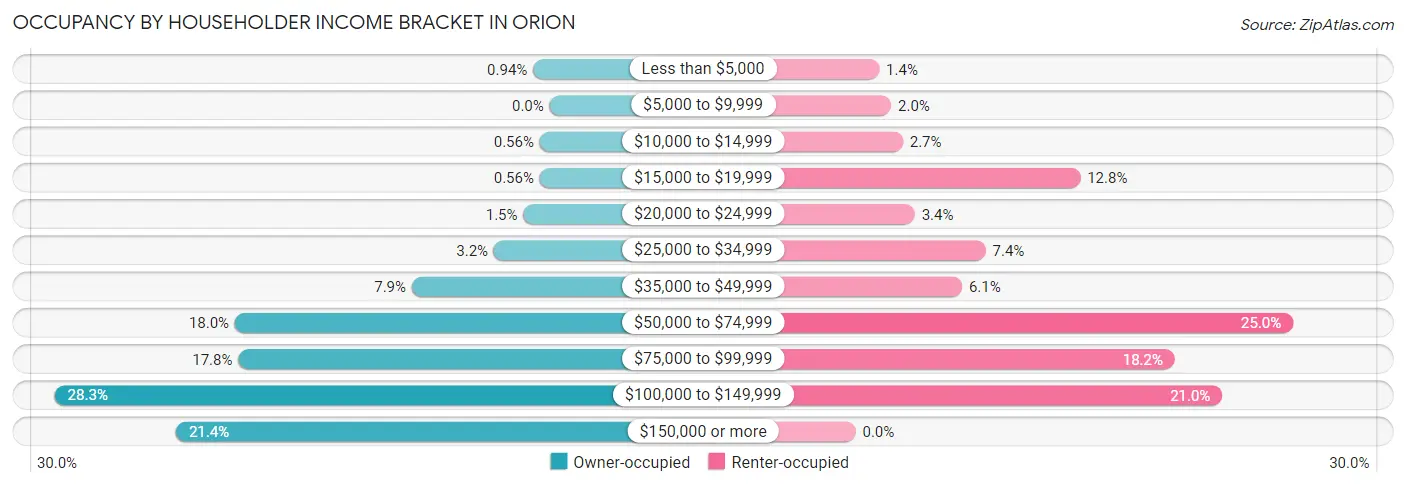
| Income Bracket | Owner-occupied | Renter-occupied |
| Less than $5,000 | 5 (0.9%) | 2 (1.3%) |
| $5,000 to $9,999 | 0 (0.0%) | 3 (2.0%) |
| $10,000 to $14,999 | 3 (0.6%) | 4 (2.7%) |
| $15,000 to $19,999 | 3 (0.6%) | 19 (12.8%) |
| $20,000 to $24,999 | 8 (1.5%) | 5 (3.4%) |
| $25,000 to $34,999 | 17 (3.2%) | 11 (7.4%) |
| $35,000 to $49,999 | 42 (7.9%) | 9 (6.1%) |
| $50,000 to $74,999 | 96 (18.0%) | 37 (25.0%) |
| $75,000 to $99,999 | 95 (17.8%) | 27 (18.2%) |
| $100,000 to $149,999 | 151 (28.3%) | 31 (20.9%) |
| $150,000 or more | 114 (21.3%) | 0 (0.0%) |
| Total | 534 (100.0%) | 148 (100.0%) |
Monthly Housing Cost Tiers in Orion
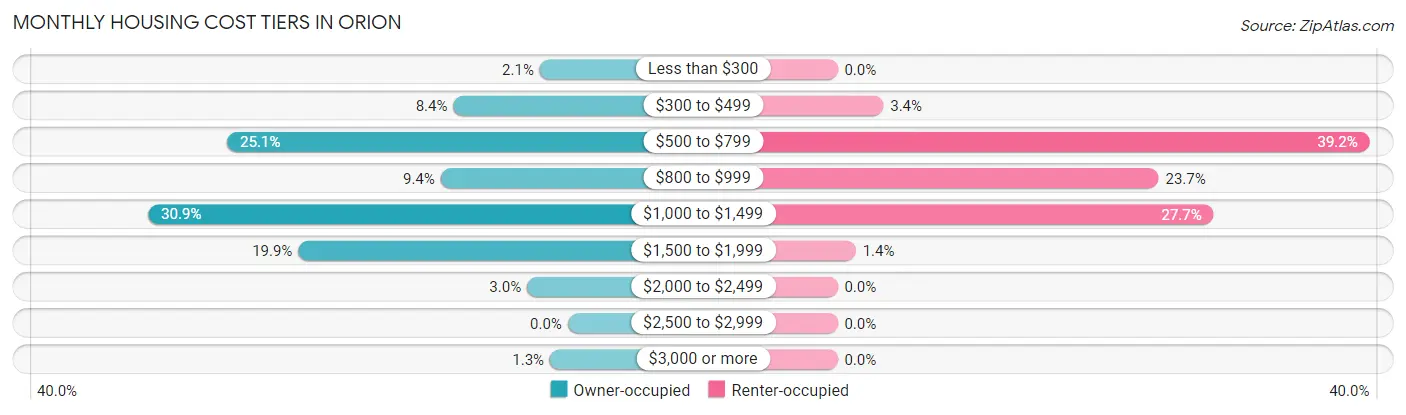
| Monthly Cost | Owner-occupied | Renter-occupied |
| Less than $300 | 11 (2.1%) | 0 (0.0%) |
| $300 to $499 | 45 (8.4%) | 5 (3.4%) |
| $500 to $799 | 134 (25.1%) | 58 (39.2%) |
| $800 to $999 | 50 (9.4%) | 35 (23.6%) |
| $1,000 to $1,499 | 165 (30.9%) | 41 (27.7%) |
| $1,500 to $1,999 | 106 (19.9%) | 2 (1.3%) |
| $2,000 to $2,499 | 16 (3.0%) | 0 (0.0%) |
| $2,500 to $2,999 | 0 (0.0%) | 0 (0.0%) |
| $3,000 or more | 7 (1.3%) | 0 (0.0%) |
| Total | 534 (100.0%) | 148 (100.0%) |
Physical Housing Characteristics in Orion
Housing Structures in Orion
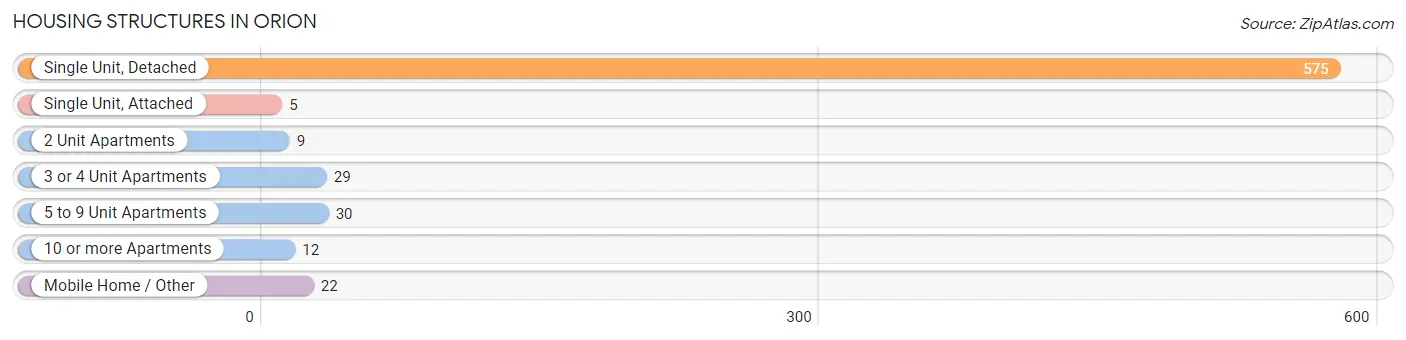
| Structure Type | # Housing Units | % Housing Units |
| Single Unit, Detached | 575 | 84.3% |
| Single Unit, Attached | 5 | 0.7% |
| 2 Unit Apartments | 9 | 1.3% |
| 3 or 4 Unit Apartments | 29 | 4.3% |
| 5 to 9 Unit Apartments | 30 | 4.4% |
| 10 or more Apartments | 12 | 1.8% |
| Mobile Home / Other | 22 | 3.2% |
| Total | 682 | 100.0% |
Housing Structures by Occupancy in Orion
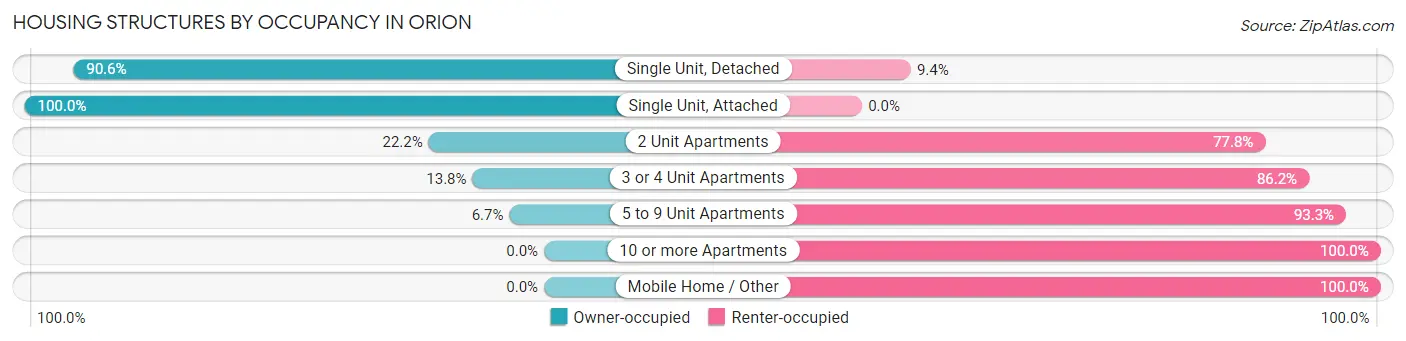
| Structure Type | Owner-occupied | Renter-occupied |
| Single Unit, Detached | 521 (90.6%) | 54 (9.4%) |
| Single Unit, Attached | 5 (100.0%) | 0 (0.0%) |
| 2 Unit Apartments | 2 (22.2%) | 7 (77.8%) |
| 3 or 4 Unit Apartments | 4 (13.8%) | 25 (86.2%) |
| 5 to 9 Unit Apartments | 2 (6.7%) | 28 (93.3%) |
| 10 or more Apartments | 0 (0.0%) | 12 (100.0%) |
| Mobile Home / Other | 0 (0.0%) | 22 (100.0%) |
| Total | 534 (78.3%) | 148 (21.7%) |
Housing Structures by Number of Rooms in Orion
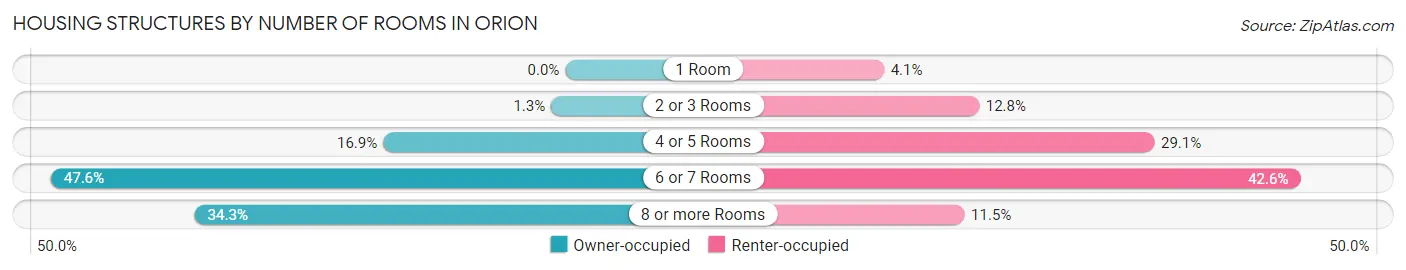
| Number of Rooms | Owner-occupied | Renter-occupied |
| 1 Room | 0 (0.0%) | 6 (4.1%) |
| 2 or 3 Rooms | 7 (1.3%) | 19 (12.8%) |
| 4 or 5 Rooms | 90 (16.9%) | 43 (29.0%) |
| 6 or 7 Rooms | 254 (47.6%) | 63 (42.6%) |
| 8 or more Rooms | 183 (34.3%) | 17 (11.5%) |
| Total | 534 (100.0%) | 148 (100.0%) |
Housing Structure by Heating Type in Orion
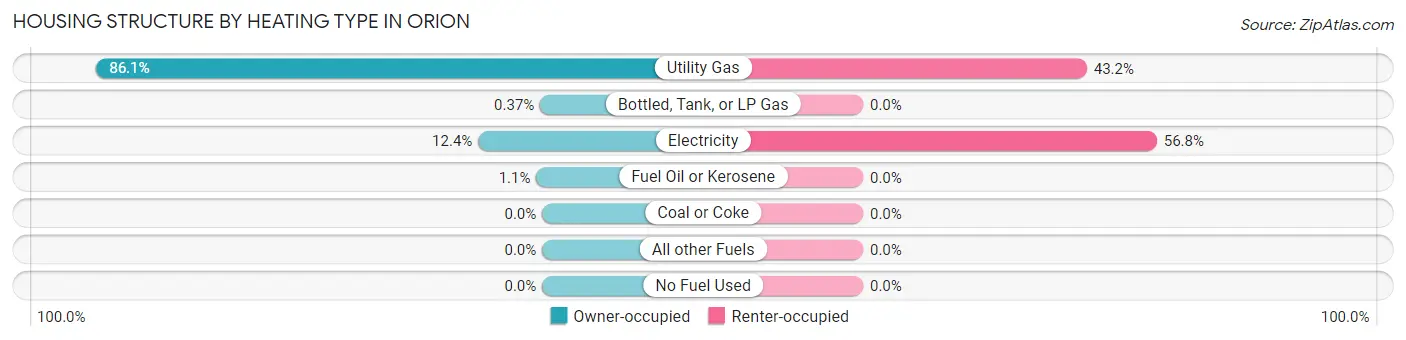
| Heating Type | Owner-occupied | Renter-occupied |
| Utility Gas | 460 (86.1%) | 64 (43.2%) |
| Bottled, Tank, or LP Gas | 2 (0.4%) | 0 (0.0%) |
| Electricity | 66 (12.4%) | 84 (56.8%) |
| Fuel Oil or Kerosene | 6 (1.1%) | 0 (0.0%) |
| Coal or Coke | 0 (0.0%) | 0 (0.0%) |
| All other Fuels | 0 (0.0%) | 0 (0.0%) |
| No Fuel Used | 0 (0.0%) | 0 (0.0%) |
| Total | 534 (100.0%) | 148 (100.0%) |
Household Vehicle Usage in Orion
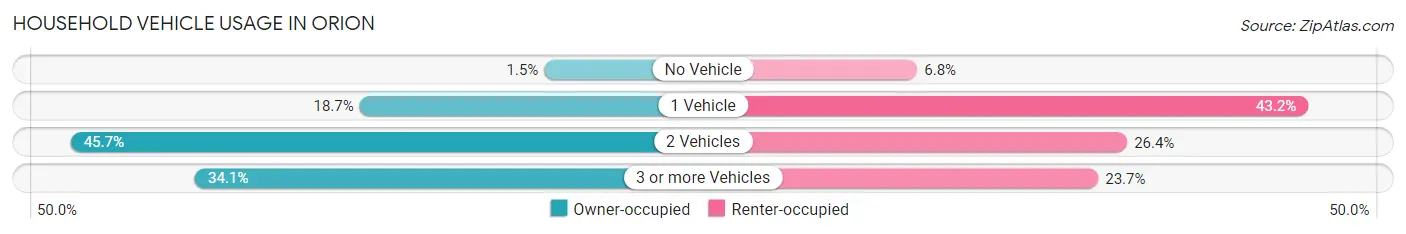
| Vehicles per Household | Owner-occupied | Renter-occupied |
| No Vehicle | 8 (1.5%) | 10 (6.8%) |
| 1 Vehicle | 100 (18.7%) | 64 (43.2%) |
| 2 Vehicles | 244 (45.7%) | 39 (26.4%) |
| 3 or more Vehicles | 182 (34.1%) | 35 (23.6%) |
| Total | 534 (100.0%) | 148 (100.0%) |
Real Estate & Mortgages in Orion
Real Estate and Mortgage Overview in Orion
| Characteristic | Without Mortgage | With Mortgage |
| Housing Units | 196 | 338 |
| Median Property Value | $166,700 | $161,400 |
| Median Household Income | $73,750 | $89 |
| Monthly Housing Costs | $591 | $7 |
| Real Estate Taxes | $3,385 | $13 |
Property Value by Mortgage Status in Orion
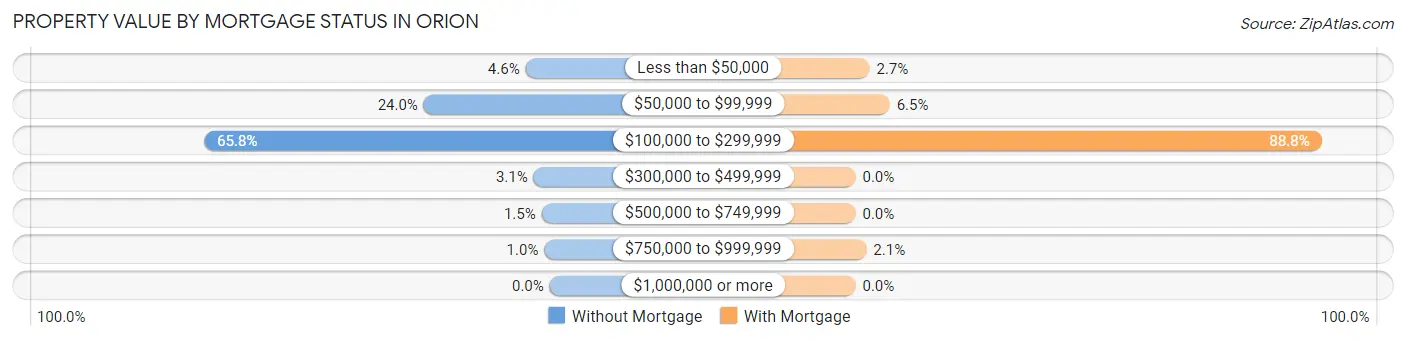
| Property Value | Without Mortgage | With Mortgage |
| Less than $50,000 | 9 (4.6%) | 9 (2.7%) |
| $50,000 to $99,999 | 47 (24.0%) | 22 (6.5%) |
| $100,000 to $299,999 | 129 (65.8%) | 300 (88.8%) |
| $300,000 to $499,999 | 6 (3.1%) | 0 (0.0%) |
| $500,000 to $749,999 | 3 (1.5%) | 0 (0.0%) |
| $750,000 to $999,999 | 2 (1.0%) | 7 (2.1%) |
| $1,000,000 or more | 0 (0.0%) | 0 (0.0%) |
| Total | 196 (100.0%) | 338 (100.0%) |
Household Income by Mortgage Status in Orion
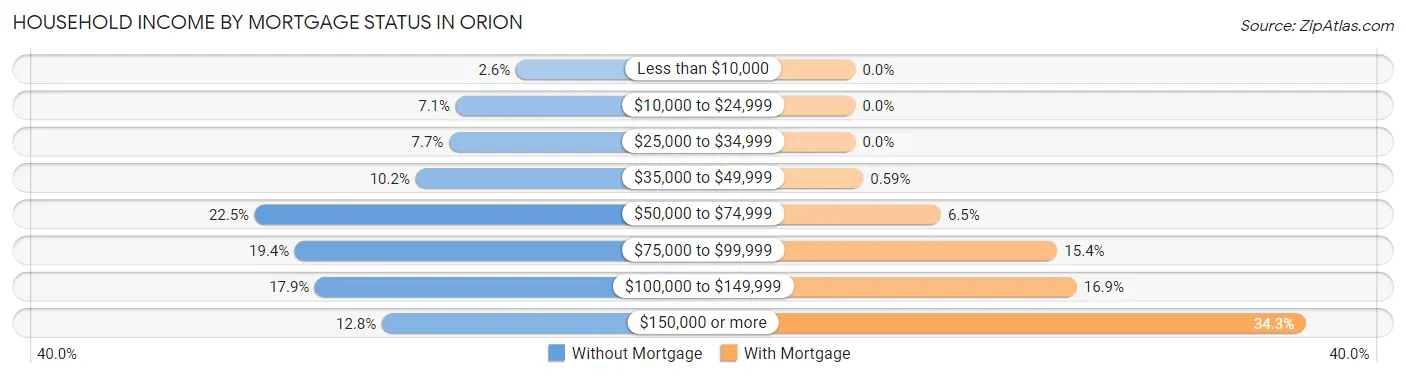
| Household Income | Without Mortgage | With Mortgage |
| Less than $10,000 | 5 (2.5%) | 0 (0.0%) |
| $10,000 to $24,999 | 14 (7.1%) | 0 (0.0%) |
| $25,000 to $34,999 | 15 (7.6%) | 0 (0.0%) |
| $35,000 to $49,999 | 20 (10.2%) | 2 (0.6%) |
| $50,000 to $74,999 | 44 (22.5%) | 22 (6.5%) |
| $75,000 to $99,999 | 38 (19.4%) | 52 (15.4%) |
| $100,000 to $149,999 | 35 (17.9%) | 57 (16.9%) |
| $150,000 or more | 25 (12.8%) | 116 (34.3%) |
| Total | 196 (100.0%) | 338 (100.0%) |
Property Value to Household Income Ratio in Orion
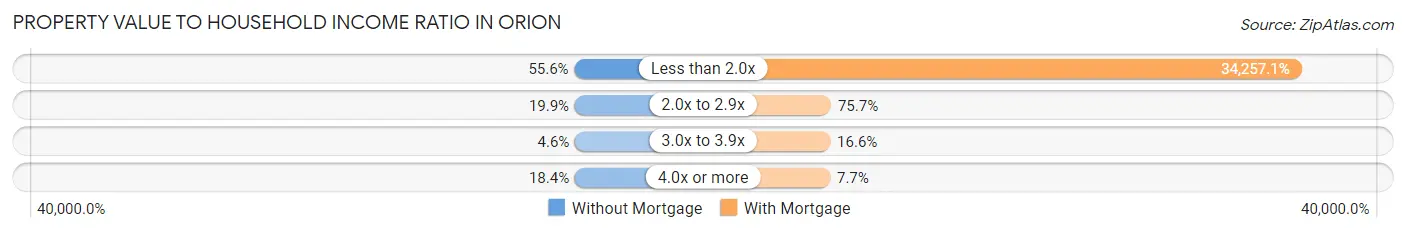
| Value-to-Income Ratio | Without Mortgage | With Mortgage |
| Less than 2.0x | 109 (55.6%) | 115,789 (34,257.1%) |
| 2.0x to 2.9x | 39 (19.9%) | 256 (75.7%) |
| 3.0x to 3.9x | 9 (4.6%) | 56 (16.6%) |
| 4.0x or more | 36 (18.4%) | 26 (7.7%) |
| Total | 196 (100.0%) | 338 (100.0%) |
Real Estate Taxes by Mortgage Status in Orion
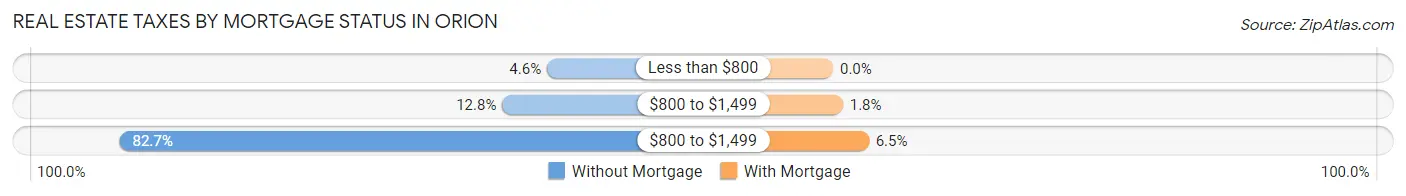
| Property Taxes | Without Mortgage | With Mortgage |
| Less than $800 | 9 (4.6%) | 0 (0.0%) |
| $800 to $1,499 | 25 (12.8%) | 6 (1.8%) |
| $800 to $1,499 | 162 (82.7%) | 22 (6.5%) |
| Total | 196 (100.0%) | 338 (100.0%) |
Health & Disability in Orion
Health Insurance Coverage by Age in Orion
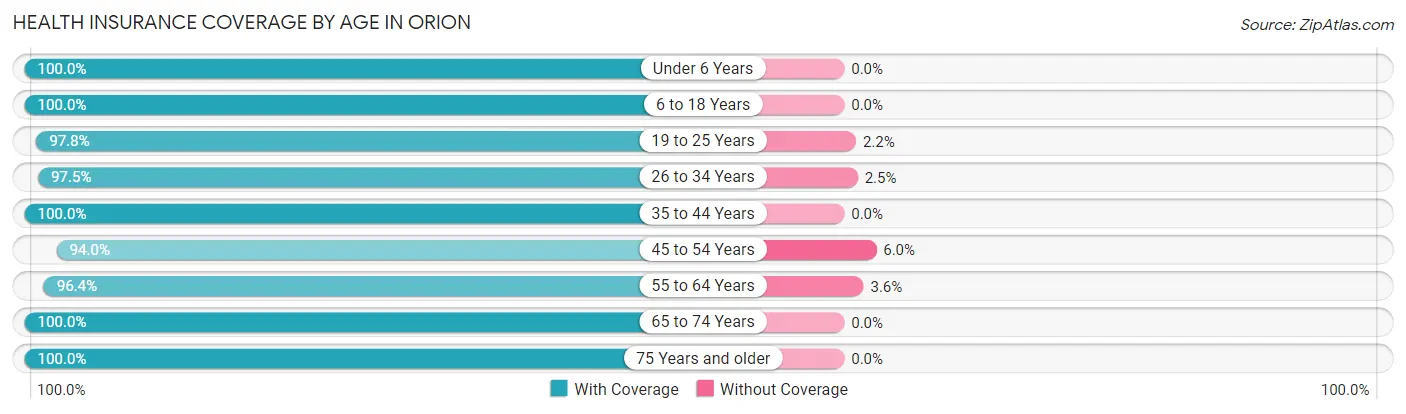
| Age Bracket | With Coverage | Without Coverage |
| Under 6 Years | 163 (100.0%) | 0 (0.0%) |
| 6 to 18 Years | 453 (100.0%) | 0 (0.0%) |
| 19 to 25 Years | 179 (97.8%) | 4 (2.2%) |
| 26 to 34 Years | 156 (97.5%) | 4 (2.5%) |
| 35 to 44 Years | 381 (100.0%) | 0 (0.0%) |
| 45 to 54 Years | 205 (94.0%) | 13 (6.0%) |
| 55 to 64 Years | 188 (96.4%) | 7 (3.6%) |
| 65 to 74 Years | 106 (100.0%) | 0 (0.0%) |
| 75 Years and older | 107 (100.0%) | 0 (0.0%) |
| Total | 1,938 (98.6%) | 28 (1.4%) |
Health Insurance Coverage by Citizenship Status in Orion
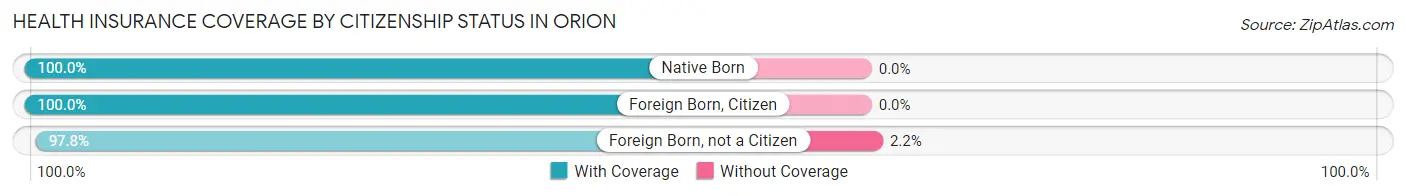
| Citizenship Status | With Coverage | Without Coverage |
| Native Born | 163 (100.0%) | 0 (0.0%) |
| Foreign Born, Citizen | 453 (100.0%) | 0 (0.0%) |
| Foreign Born, not a Citizen | 179 (97.8%) | 4 (2.2%) |
Health Insurance Coverage by Household Income in Orion
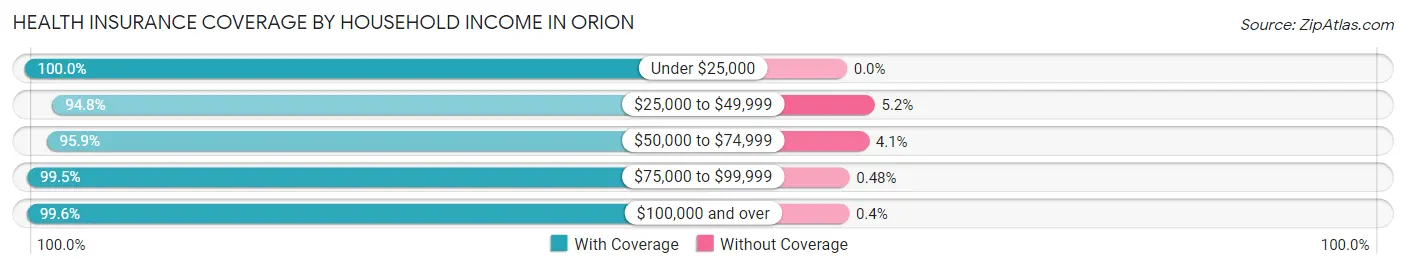
| Household Income | With Coverage | Without Coverage |
| Under $25,000 | 65 (100.0%) | 0 (0.0%) |
| $25,000 to $49,999 | 164 (94.8%) | 9 (5.2%) |
| $50,000 to $74,999 | 302 (95.9%) | 13 (4.1%) |
| $75,000 to $99,999 | 415 (99.5%) | 2 (0.5%) |
| $100,000 and over | 992 (99.6%) | 4 (0.4%) |
Public vs Private Health Insurance Coverage by Age in Orion
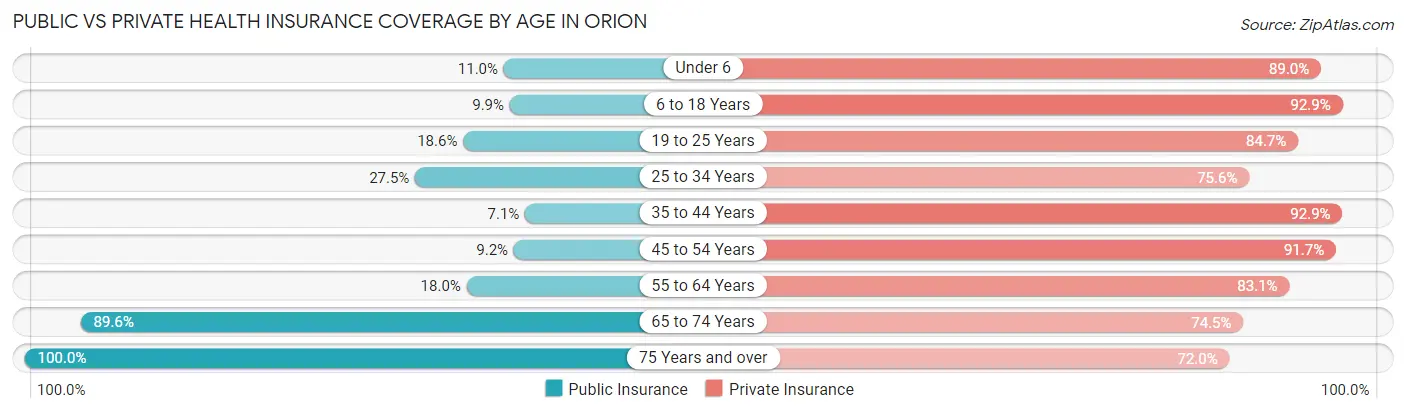
| Age Bracket | Public Insurance | Private Insurance |
| Under 6 | 18 (11.0%) | 145 (89.0%) |
| 6 to 18 Years | 45 (9.9%) | 421 (92.9%) |
| 19 to 25 Years | 34 (18.6%) | 155 (84.7%) |
| 25 to 34 Years | 44 (27.5%) | 121 (75.6%) |
| 35 to 44 Years | 27 (7.1%) | 354 (92.9%) |
| 45 to 54 Years | 20 (9.2%) | 200 (91.7%) |
| 55 to 64 Years | 35 (17.9%) | 162 (83.1%) |
| 65 to 74 Years | 95 (89.6%) | 79 (74.5%) |
| 75 Years and over | 107 (100.0%) | 77 (72.0%) |
| Total | 425 (21.6%) | 1,714 (87.2%) |
Disability Status by Sex by Age in Orion
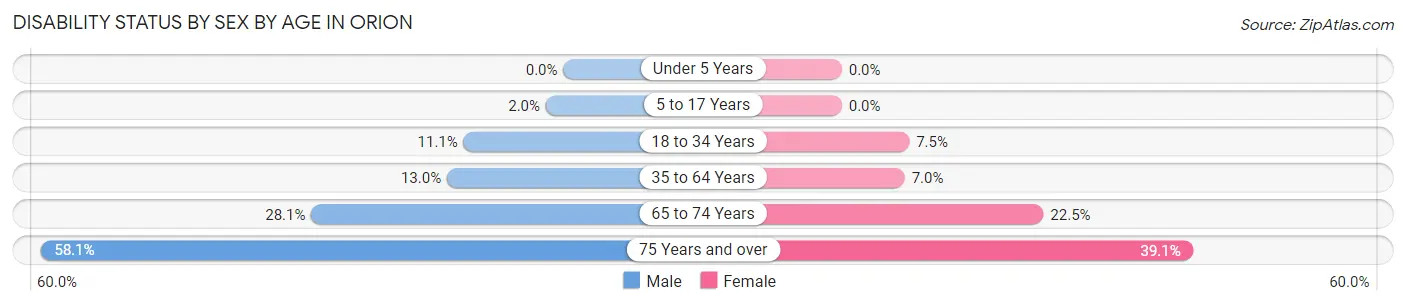
| Age Bracket | Male | Female |
| Under 5 Years | 0 (0.0%) | 0 (0.0%) |
| 5 to 17 Years | 5 (1.9%) | 0 (0.0%) |
| 18 to 34 Years | 22 (11.1%) | 13 (7.5%) |
| 35 to 64 Years | 53 (13.0%) | 27 (7.0%) |
| 65 to 74 Years | 16 (28.1%) | 11 (22.5%) |
| 75 Years and over | 25 (58.1%) | 25 (39.1%) |
Disability Class by Sex by Age in Orion
Disability Class: Hearing Difficulty
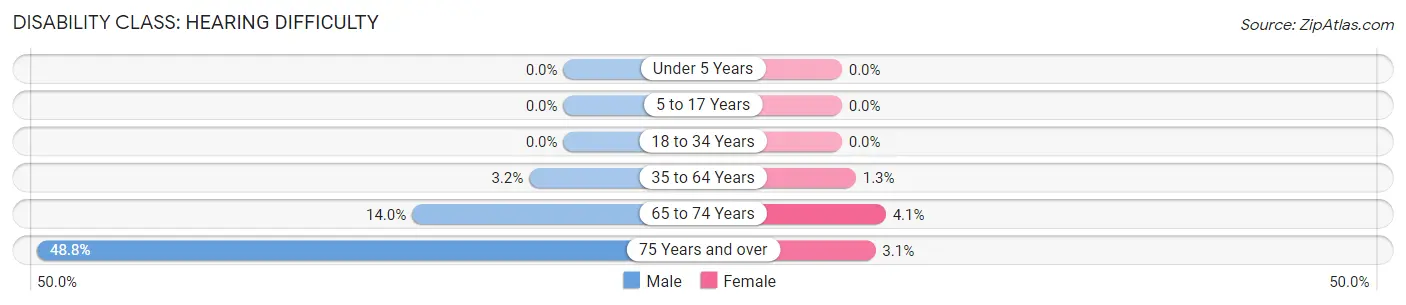
| Age Bracket | Male | Female |
| Under 5 Years | 0 (0.0%) | 0 (0.0%) |
| 5 to 17 Years | 0 (0.0%) | 0 (0.0%) |
| 18 to 34 Years | 0 (0.0%) | 0 (0.0%) |
| 35 to 64 Years | 13 (3.2%) | 5 (1.3%) |
| 65 to 74 Years | 8 (14.0%) | 2 (4.1%) |
| 75 Years and over | 21 (48.8%) | 2 (3.1%) |
Disability Class: Vision Difficulty
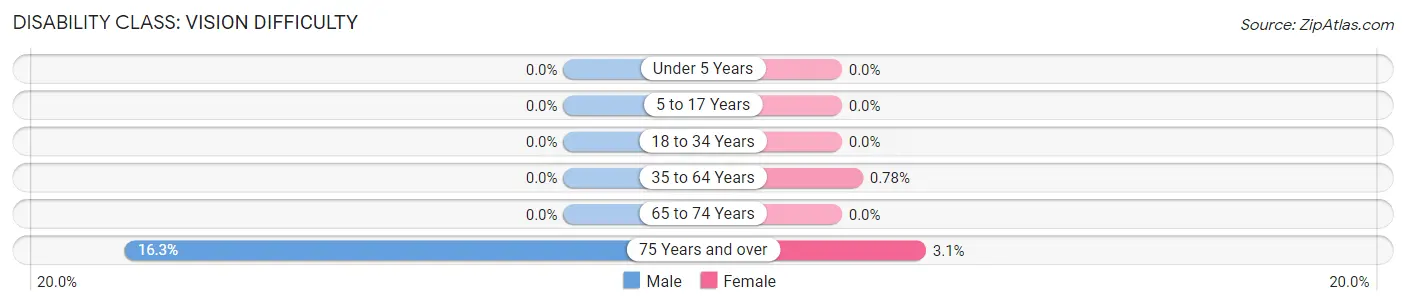
| Age Bracket | Male | Female |
| Under 5 Years | 0 (0.0%) | 0 (0.0%) |
| 5 to 17 Years | 0 (0.0%) | 0 (0.0%) |
| 18 to 34 Years | 0 (0.0%) | 0 (0.0%) |
| 35 to 64 Years | 0 (0.0%) | 3 (0.8%) |
| 65 to 74 Years | 0 (0.0%) | 0 (0.0%) |
| 75 Years and over | 7 (16.3%) | 2 (3.1%) |
Disability Class: Cognitive Difficulty
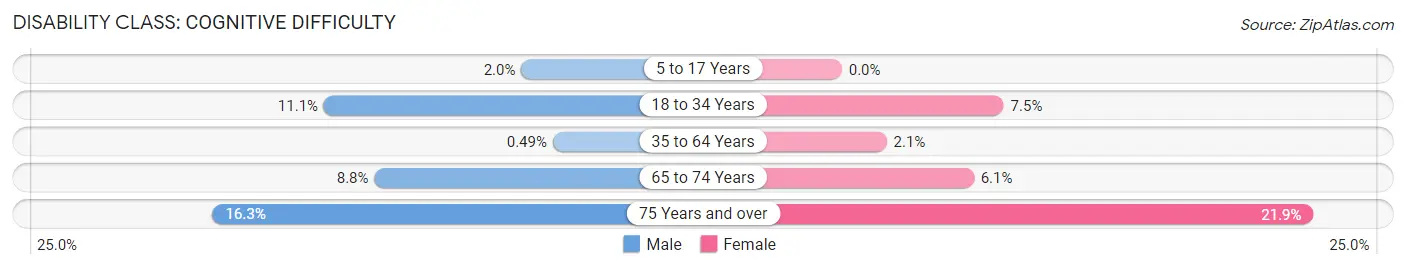
| Age Bracket | Male | Female |
| 5 to 17 Years | 5 (1.9%) | 0 (0.0%) |
| 18 to 34 Years | 22 (11.1%) | 13 (7.5%) |
| 35 to 64 Years | 2 (0.5%) | 8 (2.1%) |
| 65 to 74 Years | 5 (8.8%) | 3 (6.1%) |
| 75 Years and over | 7 (16.3%) | 14 (21.9%) |
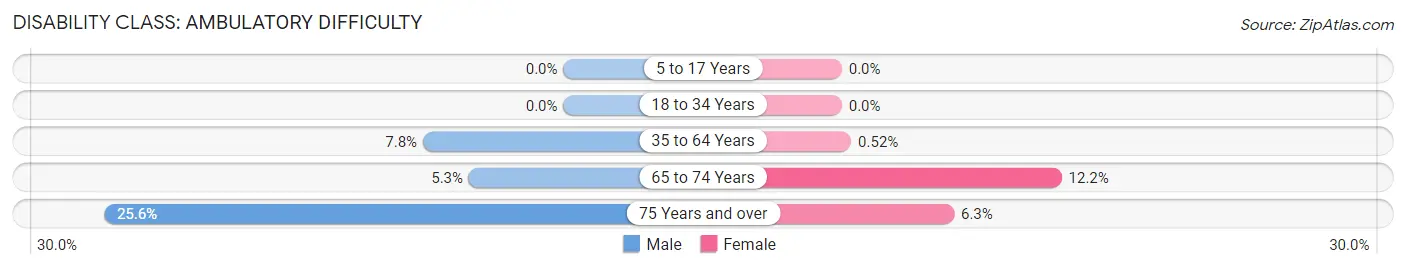
Disability Class: Ambulatory Difficulty
| Age Bracket | Male | Female |
| 5 to 17 Years | 0 (0.0%) | 0 (0.0%) |
| 18 to 34 Years | 0 (0.0%) | 0 (0.0%) |
| 35 to 64 Years | 32 (7.8%) | 2 (0.5%) |
| 65 to 74 Years | 3 (5.3%) | 6 (12.2%) |
| 75 Years and over | 11 (25.6%) | 4 (6.2%) |
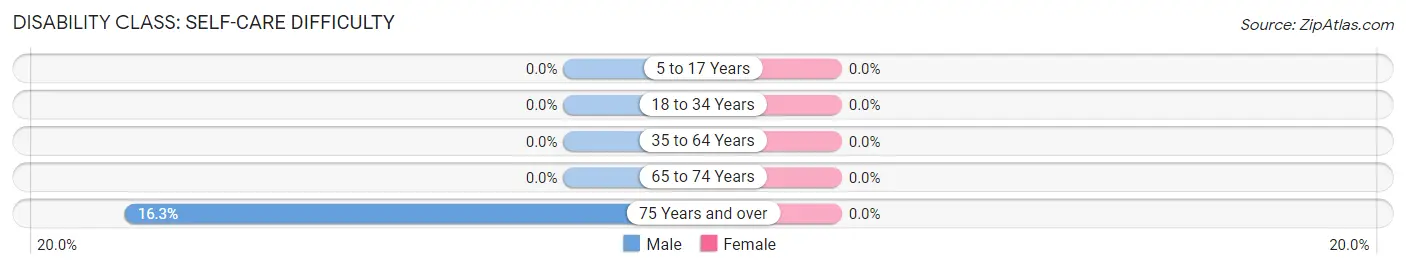
Disability Class: Self-Care Difficulty
| Age Bracket | Male | Female |
| 5 to 17 Years | 0 (0.0%) | 0 (0.0%) |
| 18 to 34 Years | 0 (0.0%) | 0 (0.0%) |
| 35 to 64 Years | 0 (0.0%) | 0 (0.0%) |
| 65 to 74 Years | 0 (0.0%) | 0 (0.0%) |
| 75 Years and over | 7 (16.3%) | 0 (0.0%) |
Technology Access in Orion
Computing Device Access in Orion
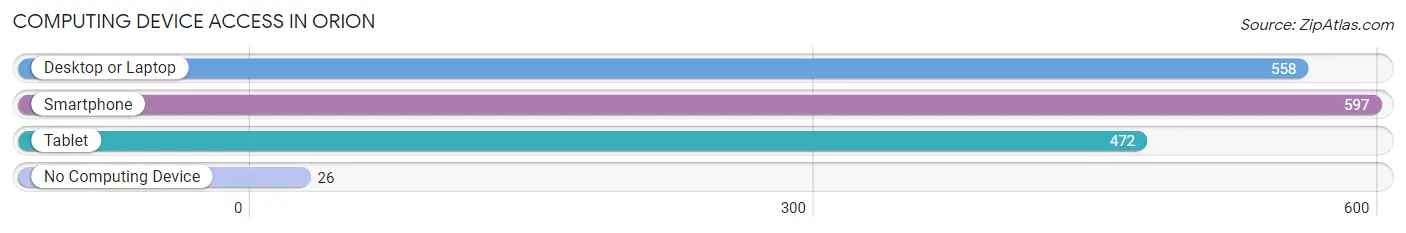
| Device Type | # Households | % Households |
| Desktop or Laptop | 558 | 81.8% |
| Smartphone | 597 | 87.5% |
| Tablet | 472 | 69.2% |
| No Computing Device | 26 | 3.8% |
| Total | 682 | 100.0% |
Internet Access in Orion
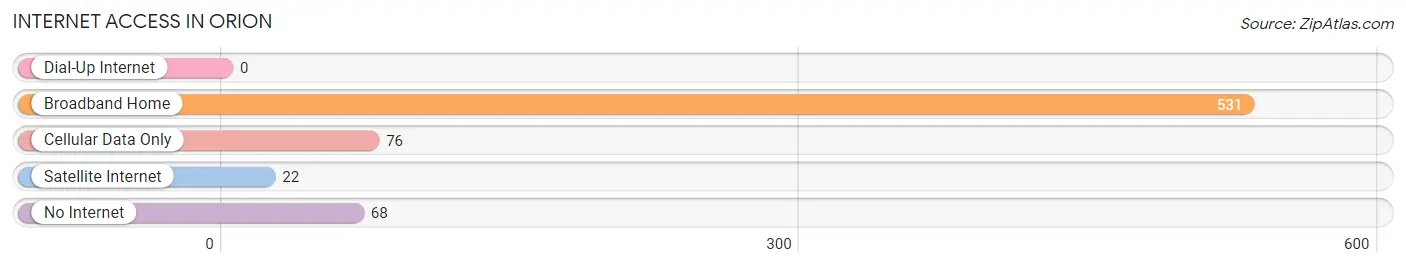
| Internet Type | # Households | % Households |
| Dial-Up Internet | 0 | 0.0% |
| Broadband Home | 531 | 77.9% |
| Cellular Data Only | 76 | 11.1% |
| Satellite Internet | 22 | 3.2% |
| No Internet | 68 | 10.0% |
| Total | 682 | 100.0% |
Orion Summary
Orion, Illinois is a small village located in Henry County, Illinois. It is situated on the banks of the Rock River, approximately 30 miles southwest of the Quad Cities. The village has a population of 1,845 people, according to the 2010 census.
History
The area that is now Orion was first settled in 1835 by a group of settlers from New York. The village was originally known as “New York Settlement”, but was later renamed Orion after the constellation of stars. The village was officially incorporated in 1867.
In the late 19th century, Orion was a thriving agricultural community. The village was home to several grain elevators, a flour mill, and a creamery. The village also had a number of stores, a hotel, and a post office.
In the early 20th century, Orion was a popular tourist destination. The village was home to several resorts, including the Orion Hotel, which was built in 1902. The hotel was a popular destination for visitors from Chicago and other nearby cities.
Geography
Orion is located in Henry County, Illinois. The village is situated on the banks of the Rock River, approximately 30 miles southwest of the Quad Cities. The village is located in the Rock River Valley, which is a major agricultural region.
The village has a total area of 1.2 square miles, all of which is land. The village is located at an elevation of 690 feet above sea level.
Economy
The economy of Orion is largely based on agriculture. The village is home to several grain elevators, a flour mill, and a creamery. The village also has a number of stores, a hotel, and a post office.
The village is also home to several manufacturing companies, including a plastics manufacturer and a metal fabrication company.
Demographics
According to the 2010 census, the population of Orion was 1,845 people. The village has a median household income of $45,000 and a median family income of $51,000. The village has a poverty rate of 11.3%.
The village is predominantly white, with 92.3% of the population identifying as white. The village also has a small Hispanic population, with 4.2% of the population identifying as Hispanic or Latino.
Conclusion
Orion, Illinois is a small village located in Henry County, Illinois. It is situated on the banks of the Rock River, approximately 30 miles southwest of the Quad Cities. The village has a population of 1,845 people, according to the 2010 census. The economy of Orion is largely based on agriculture, with the village also home to several manufacturing companies. The village is predominantly white, with 92.3% of the population identifying as white.
Common Questions
What is Per Capita Income in Orion?
Per Capita income in Orion is $36,633.
What is the Median Family Income in Orion?
Median Family Income in Orion is $97,102.
What is the Median Household income in Orion?
Median Household Income in Orion is $88,529.
What is Income or Wage Gap in Orion?
Income or Wage Gap in Orion is 32.1%.
Women in Orion earn 67.9 cents for every dollar earned by a man.
What is Inequality or Gini Index in Orion?
Inequality or Gini Index in Orion is 0.36.
What is the Total Population of Orion?
Total Population of Orion is 1,966.
What is the Total Male Population of Orion?
Total Male Population of Orion is 1,011.
What is the Total Female Population of Orion?
Total Female Population of Orion is 955.
What is the Ratio of Males per 100 Females in Orion?
There are 105.86 Males per 100 Females in Orion.
What is the Ratio of Females per 100 Males in Orion?
There are 94.46 Females per 100 Males in Orion.
What is the Median Population Age in Orion?
Median Population Age in Orion is 35.6 Years.
What is the Average Family Size in Orion
Average Family Size in Orion is 3.4 People.
What is the Average Household Size in Orion
Average Household Size in Orion is 2.9 People.
How Large is the Labor Force in Orion?
There are 987 People in the Labor Forcein in Orion.
What is the Percentage of People in the Labor Force in Orion?
67.1% of People are in the Labor Force in Orion.
What is the Unemployment Rate in Orion?
Unemployment Rate in Orion is 3.5%.