Jerome, IL Map & Demographics
Jerome Map
Jerome Overview
$32,579
PER CAPITA INCOME
$66,154
AVG FAMILY INCOME
$52,083
AVG HOUSEHOLD INCOME
15.3%
WAGE / INCOME GAP [ % ]
84.7¢/ $1
WAGE / INCOME GAP [ $ ]
0.36
INEQUALITY / GINI INDEX
2,194
TOTAL POPULATION
976
MALE POPULATION
1,218
FEMALE POPULATION
80.13
MALES / 100 FEMALES
124.80
FEMALES / 100 MALES
32.5
MEDIAN AGE
2.8
AVG FAMILY SIZE
2.1
AVG HOUSEHOLD SIZE
1,230
LABOR FORCE [ PEOPLE ]
72.5%
PERCENT IN LABOR FORCE
2.0%
UNEMPLOYMENT RATE
Jerome Area Codes
Income in Jerome
Income Overview in Jerome
Per Capita Income in Jerome is $32,579, while median incomes of families and households are $66,154 and $52,083 respectively.
| Characteristic | Number | Measure |
| Per Capita Income | 2,194 | $32,579 |
| Median Family Income | 582 | $66,154 |
| Mean Family Income | 582 | $78,970 |
| Median Household Income | 1,061 | $52,083 |
| Mean Household Income | 1,061 | $67,935 |
| Income Deficit | 582 | $0 |
| Wage / Income Gap (%) | 2,194 | 15.27% |
| Wage / Income Gap ($) | 2,194 | 84.73¢ per $1 |
| Gini / Inequality Index | 2,194 | 0.36 |
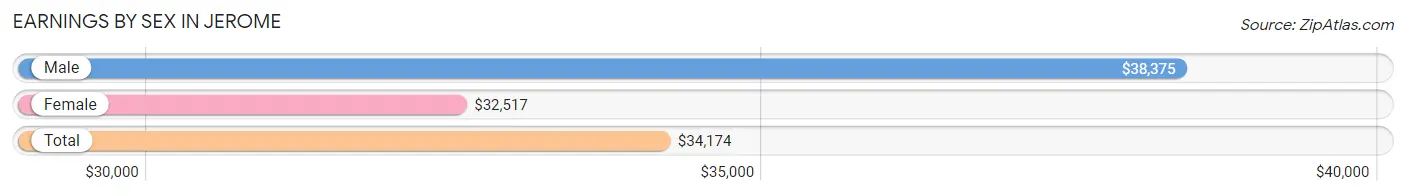
Earnings by Sex in Jerome
Average Earnings in Jerome are $34,174, $38,375 for men and $32,517 for women, a difference of 15.3%.
| Sex | Number | Average Earnings |
| Male | 565 (43.7%) | $38,375 |
| Female | 727 (56.3%) | $32,517 |
| Total | 1,292 (100.0%) | $34,174 |
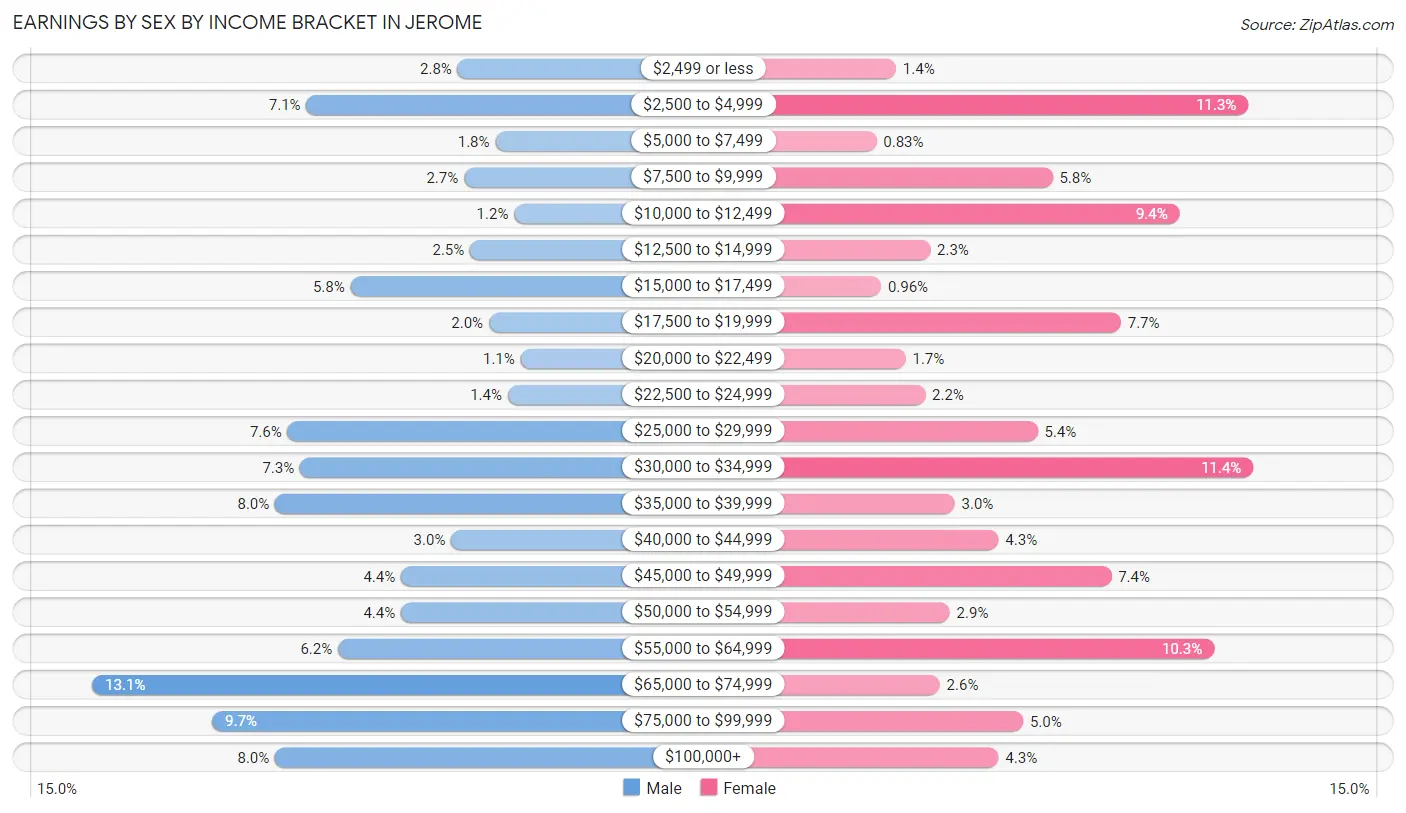
Earnings by Sex by Income Bracket in Jerome
The most common earnings brackets in Jerome are $65,000 to $74,999 for men (74 | 13.1%) and $30,000 to $34,999 for women (83 | 11.4%).
| Income | Male | Female |
| $2,499 or less | 16 (2.8%) | 10 (1.4%) |
| $2,500 to $4,999 | 40 (7.1%) | 82 (11.3%) |
| $5,000 to $7,499 | 10 (1.8%) | 6 (0.8%) |
| $7,500 to $9,999 | 15 (2.6%) | 42 (5.8%) |
| $10,000 to $12,499 | 7 (1.2%) | 68 (9.3%) |
| $12,500 to $14,999 | 14 (2.5%) | 17 (2.3%) |
| $15,000 to $17,499 | 33 (5.8%) | 7 (1.0%) |
| $17,500 to $19,999 | 11 (1.9%) | 56 (7.7%) |
| $20,000 to $22,499 | 6 (1.1%) | 12 (1.7%) |
| $22,500 to $24,999 | 8 (1.4%) | 16 (2.2%) |
| $25,000 to $29,999 | 43 (7.6%) | 39 (5.4%) |
| $30,000 to $34,999 | 41 (7.3%) | 83 (11.4%) |
| $35,000 to $39,999 | 45 (8.0%) | 22 (3.0%) |
| $40,000 to $44,999 | 17 (3.0%) | 31 (4.3%) |
| $45,000 to $49,999 | 25 (4.4%) | 54 (7.4%) |
| $50,000 to $54,999 | 25 (4.4%) | 21 (2.9%) |
| $55,000 to $64,999 | 35 (6.2%) | 75 (10.3%) |
| $65,000 to $74,999 | 74 (13.1%) | 19 (2.6%) |
| $75,000 to $99,999 | 55 (9.7%) | 36 (5.0%) |
| $100,000+ | 45 (8.0%) | 31 (4.3%) |
| Total | 565 (100.0%) | 727 (100.0%) |
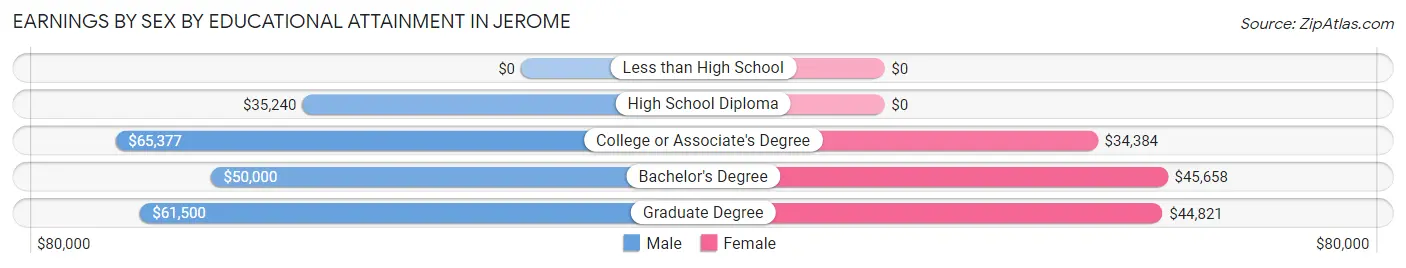
Earnings by Sex by Educational Attainment in Jerome
Average earnings in Jerome are $47,500 for men and $34,550 for women, a difference of 27.3%. Men with an educational attainment of college or associate's degree enjoy the highest average annual earnings of $65,377, while those with high school diploma education earn the least with $35,240. Women with an educational attainment of bachelor's degree earn the most with the average annual earnings of $45,658, while those with college or associate's degree education have the smallest earnings of $34,384.
| Educational Attainment | Male Income | Female Income |
| Less than High School | - | - |
| High School Diploma | $35,240 | $0 |
| College or Associate's Degree | $65,377 | $34,384 |
| Bachelor's Degree | $50,000 | $45,658 |
| Graduate Degree | $61,500 | $44,821 |
| Total | $47,500 | $34,550 |
Family Income in Jerome
Family Income Brackets in Jerome
According to the Jerome family income data, there are 133 families falling into the $75,000 to $99,999 income range, which is the most common income bracket and makes up 22.9% of all families. Conversely, the $150,000 to $199,999 income bracket is the least frequent group with only 10 families (1.7%) belonging to this category.
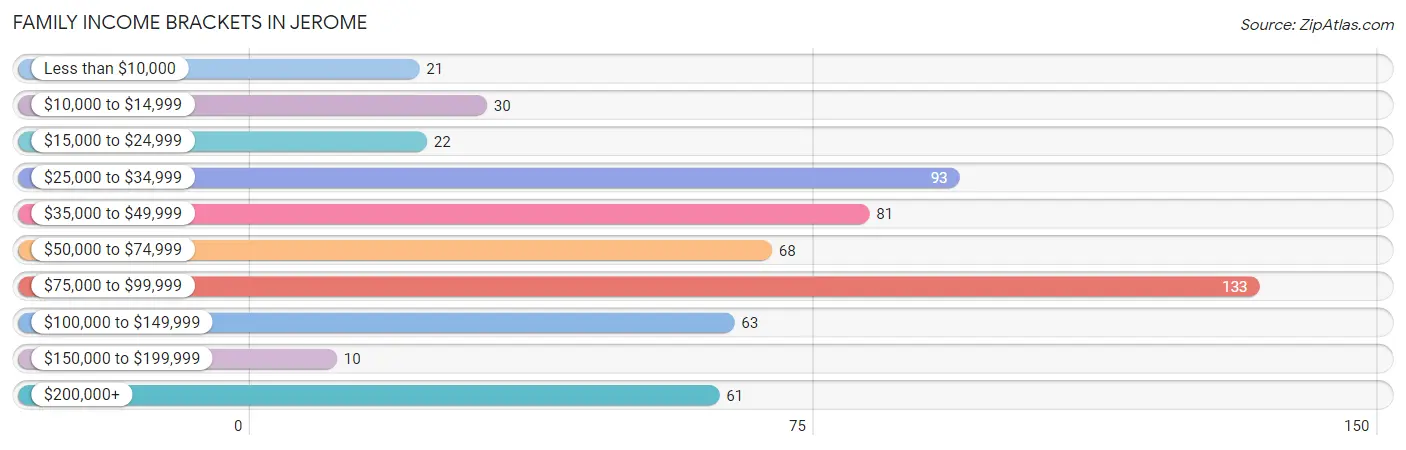
| Income Bracket | # Families | % Families |
| Less than $10,000 | 21 | 3.6% |
| $10,000 to $14,999 | 30 | 5.2% |
| $15,000 to $24,999 | 22 | 3.8% |
| $25,000 to $34,999 | 93 | 16.0% |
| $35,000 to $49,999 | 81 | 13.9% |
| $50,000 to $74,999 | 68 | 11.7% |
| $75,000 to $99,999 | 133 | 22.9% |
| $100,000 to $149,999 | 63 | 10.8% |
| $150,000 to $199,999 | 10 | 1.7% |
| $200,000+ | 61 | 10.5% |
Family Income by Famaliy Size in Jerome
2-person families (351 | 60.3%) account for the highest median family income in Jerome with $75,893 per family, while 2-person families (351 | 60.3%) have the highest median income of $37,946 per family member.
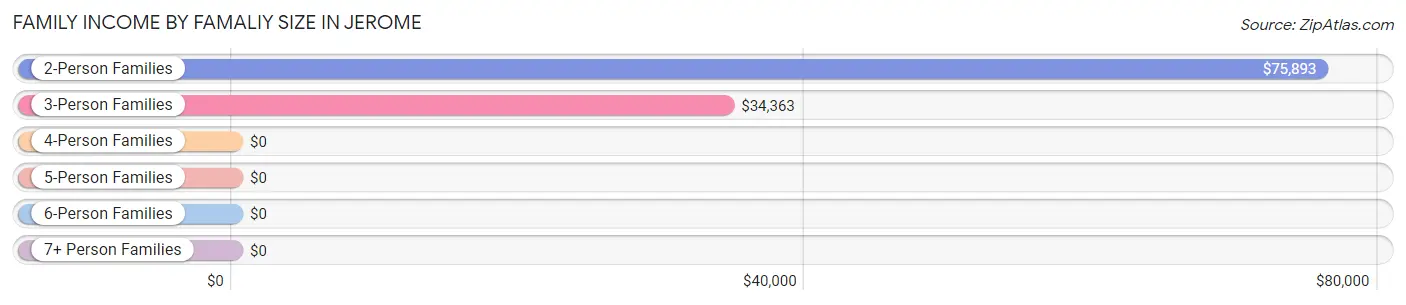
| Income Bracket | # Families | Median Income |
| 2-Person Families | 351 (60.3%) | $75,893 |
| 3-Person Families | 123 (21.1%) | $34,363 |
| 4-Person Families | 61 (10.5%) | $0 |
| 5-Person Families | 38 (6.5%) | $0 |
| 6-Person Families | 0 (0.0%) | $0 |
| 7+ Person Families | 9 (1.5%) | $0 |
| Total | 582 (100.0%) | $66,154 |
Family Income by Number of Earners in Jerome
The median family income in Jerome is $66,154, with families comprising 2 earners (234) having the highest median family income of $86,000, while families with 1 earner (270) have the lowest median family income of $36,071, accounting for 40.2% and 46.4% of families, respectively.
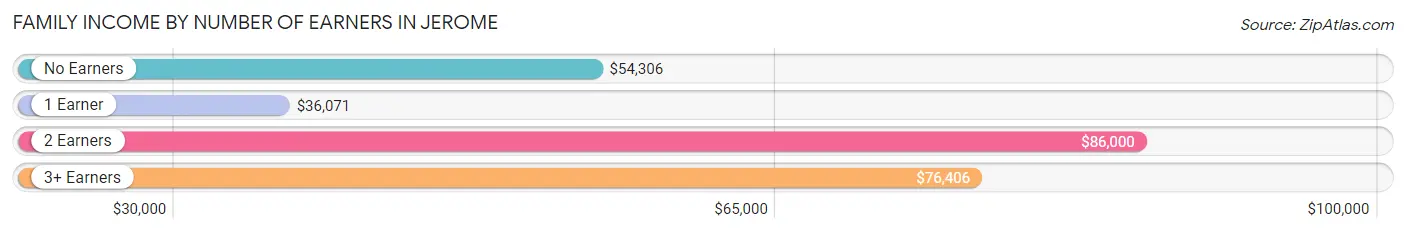
| Number of Earners | # Families | Median Income |
| No Earners | 49 (8.4%) | $54,306 |
| 1 Earner | 270 (46.4%) | $36,071 |
| 2 Earners | 234 (40.2%) | $86,000 |
| 3+ Earners | 29 (5.0%) | $76,406 |
| Total | 582 (100.0%) | $66,154 |
Household Income in Jerome
Household Income Brackets in Jerome
With 249 households falling in the category, the $35,000 to $49,999 income range is the most frequent in Jerome, accounting for 23.5% of all households. In contrast, only 7 households (0.7%) fall into the $10,000 to $14,999 income bracket, making it the least populous group.
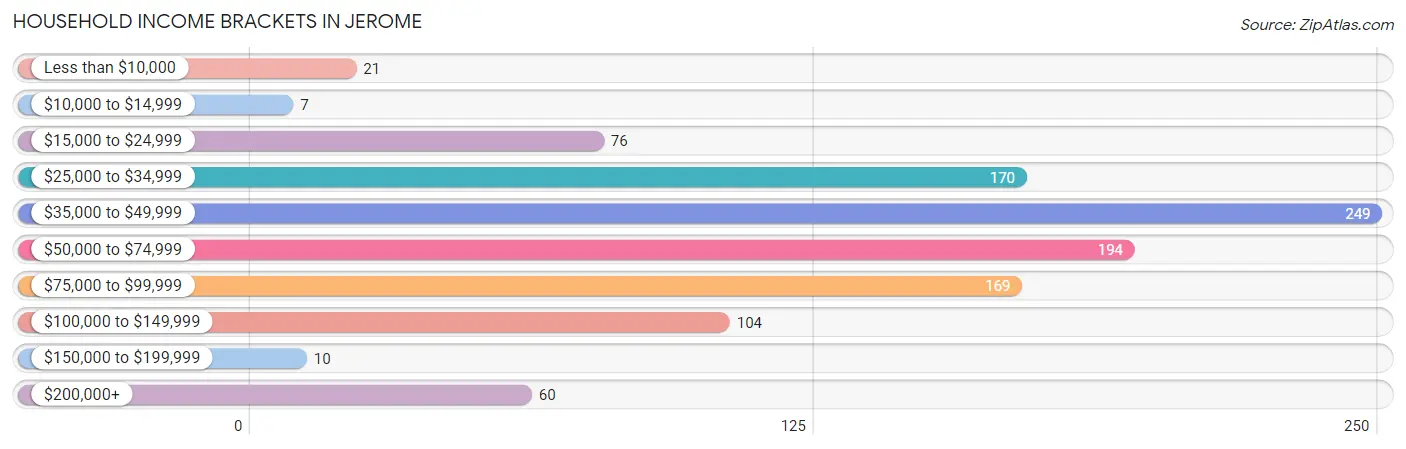
| Income Bracket | # Households | % Households |
| Less than $10,000 | 21 | 2.0% |
| $10,000 to $14,999 | 7 | 0.7% |
| $15,000 to $24,999 | 76 | 7.2% |
| $25,000 to $34,999 | 170 | 16.0% |
| $35,000 to $49,999 | 249 | 23.5% |
| $50,000 to $74,999 | 194 | 18.3% |
| $75,000 to $99,999 | 169 | 15.9% |
| $100,000 to $149,999 | 104 | 9.8% |
| $150,000 to $199,999 | 10 | 0.9% |
| $200,000+ | 60 | 5.7% |
Household Income by Householder Age in Jerome
The median household income in Jerome is $52,083, with the highest median household income of $66,182 found in the 45 to 64 years age bracket for the primary householder. A total of 285 households (26.9%) fall into this category. Meanwhile, the 15 to 24 years age bracket for the primary householder has the lowest median household income of $46,012, with 101 households (9.5%) in this group.
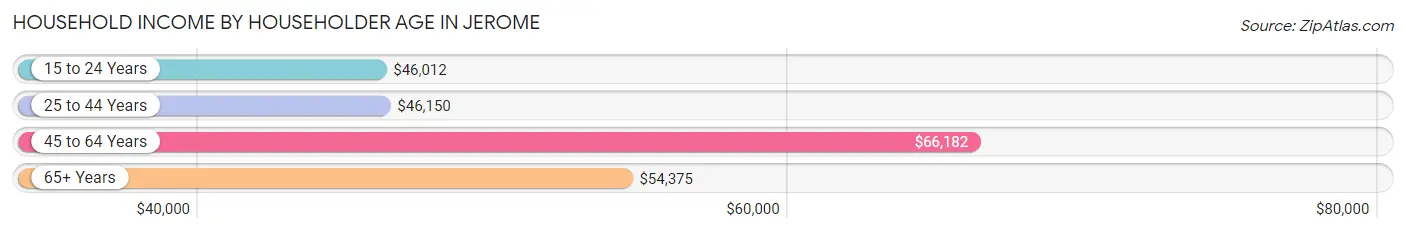
| Income Bracket | # Households | Median Income |
| 15 to 24 Years | 101 (9.5%) | $46,012 |
| 25 to 44 Years | 436 (41.1%) | $46,150 |
| 45 to 64 Years | 285 (26.9%) | $66,182 |
| 65+ Years | 239 (22.5%) | $54,375 |
| Total | 1,061 (100.0%) | $52,083 |
Poverty in Jerome
Income Below Poverty by Sex and Age in Jerome
With 9.1% poverty level for males and 10.0% for females among the residents of Jerome, 6 to 11 year old males and under 5 year old females are the most vulnerable to poverty, with 54 males (38.6%) and 25 females (37.9%) in their respective age groups living below the poverty level.
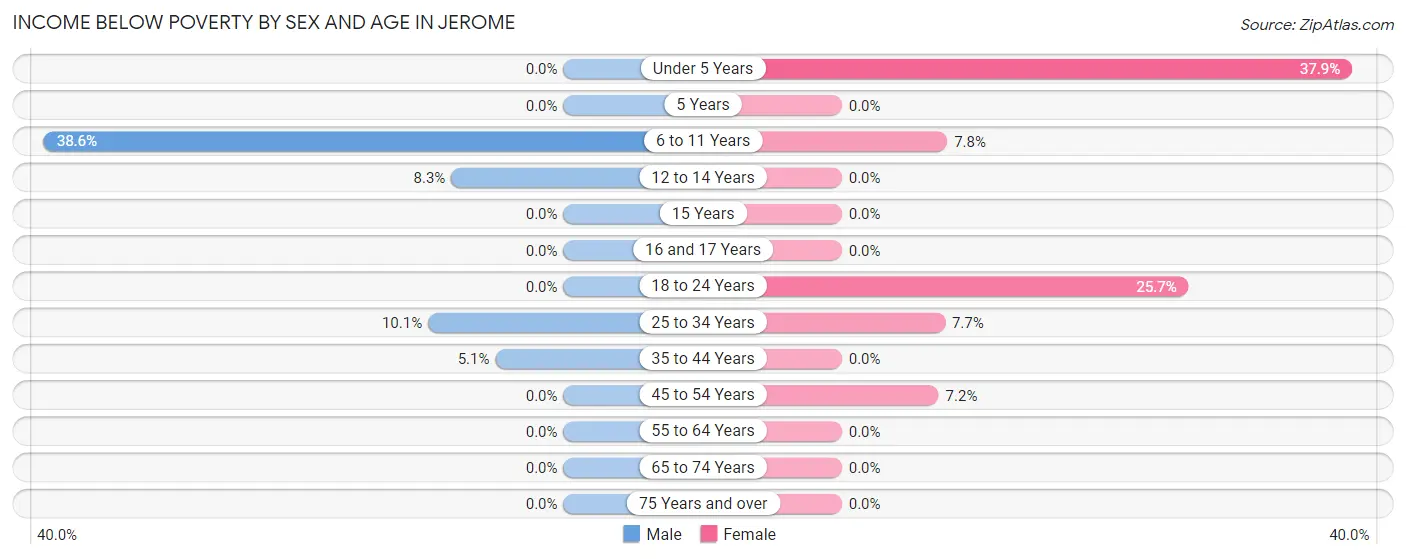
| Age Bracket | Male | Female |
| Under 5 Years | 0 (0.0%) | 25 (37.9%) |
| 5 Years | 0 (0.0%) | 0 (0.0%) |
| 6 to 11 Years | 54 (38.6%) | 9 (7.8%) |
| 12 to 14 Years | 8 (8.3%) | 0 (0.0%) |
| 15 Years | 0 (0.0%) | 0 (0.0%) |
| 16 and 17 Years | 0 (0.0%) | 0 (0.0%) |
| 18 to 24 Years | 0 (0.0%) | 61 (25.7%) |
| 25 to 34 Years | 22 (10.1%) | 17 (7.7%) |
| 35 to 44 Years | 5 (5.1%) | 0 (0.0%) |
| 45 to 54 Years | 0 (0.0%) | 10 (7.2%) |
| 55 to 64 Years | 0 (0.0%) | 0 (0.0%) |
| 65 to 74 Years | 0 (0.0%) | 0 (0.0%) |
| 75 Years and over | 0 (0.0%) | 0 (0.0%) |
| Total | 89 (9.1%) | 122 (10.0%) |
Income Above Poverty by Sex and Age in Jerome
According to the poverty statistics in Jerome, males aged under 5 years and females aged 5 years are the age groups that are most secure financially, with 100.0% of males and 100.0% of females in these age groups living above the poverty line.
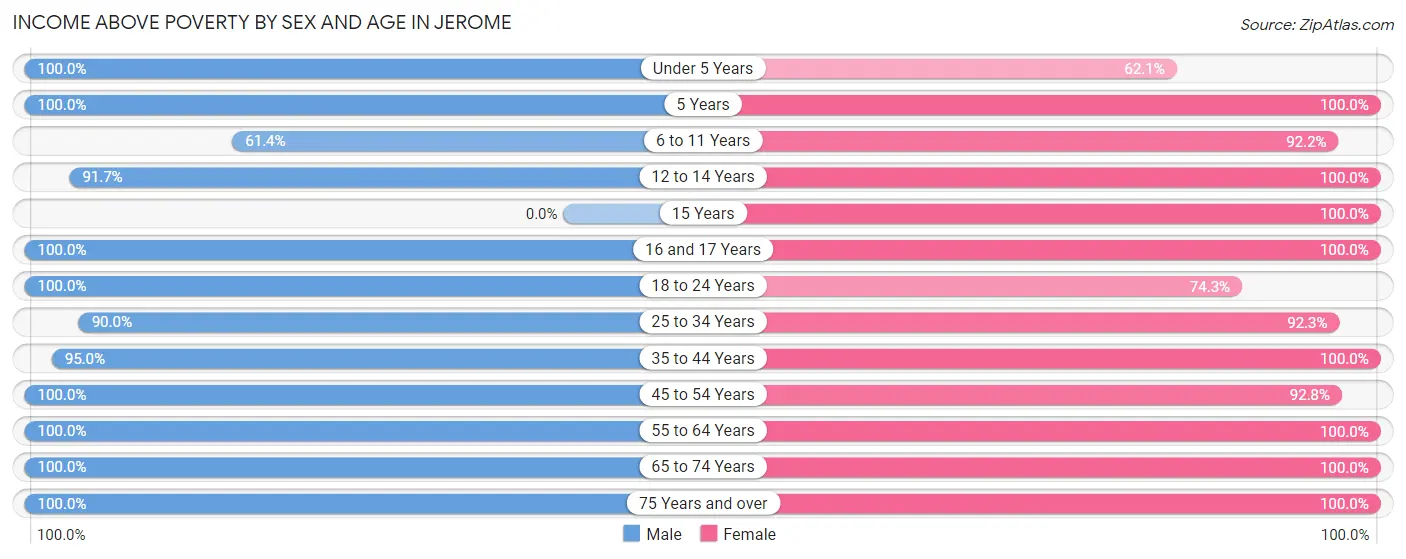
| Age Bracket | Male | Female |
| Under 5 Years | 50 (100.0%) | 41 (62.1%) |
| 5 Years | 5 (100.0%) | 2 (100.0%) |
| 6 to 11 Years | 86 (61.4%) | 106 (92.2%) |
| 12 to 14 Years | 88 (91.7%) | 13 (100.0%) |
| 15 Years | 0 (0.0%) | 11 (100.0%) |
| 16 and 17 Years | 14 (100.0%) | 6 (100.0%) |
| 18 to 24 Years | 59 (100.0%) | 176 (74.3%) |
| 25 to 34 Years | 197 (89.9%) | 205 (92.3%) |
| 35 to 44 Years | 94 (95.0%) | 100 (100.0%) |
| 45 to 54 Years | 60 (100.0%) | 129 (92.8%) |
| 55 to 64 Years | 141 (100.0%) | 85 (100.0%) |
| 65 to 74 Years | 62 (100.0%) | 126 (100.0%) |
| 75 Years and over | 31 (100.0%) | 96 (100.0%) |
| Total | 887 (90.9%) | 1,096 (90.0%) |
Income Below Poverty Among Married-Couple Families in Jerome
The poverty statistics for married-couple families in Jerome show that 7.6% or 22 of the total 291 families live below the poverty line. Families with 1 or 2 children have the highest poverty rate of 23.9%, comprising of 22 families. On the other hand, families with no children have the lowest poverty rate of 0.0%, which includes 0 families.
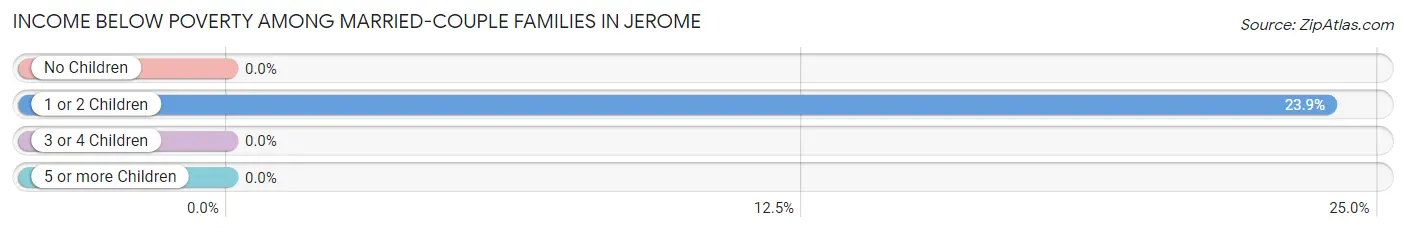
| Children | Above Poverty | Below Poverty |
| No Children | 185 (100.0%) | 0 (0.0%) |
| 1 or 2 Children | 70 (76.1%) | 22 (23.9%) |
| 3 or 4 Children | 14 (100.0%) | 0 (0.0%) |
| 5 or more Children | 0 (0.0%) | 0 (0.0%) |
| Total | 269 (92.4%) | 22 (7.6%) |
Income Below Poverty Among Single-Parent Households in Jerome
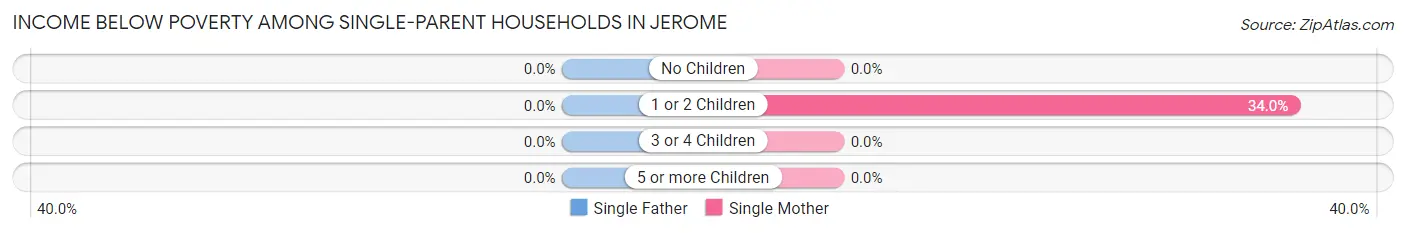
| Children | Single Father | Single Mother |
| No Children | 0 (0.0%) | 0 (0.0%) |
| 1 or 2 Children | 0 (0.0%) | 51 (34.0%) |
| 3 or 4 Children | 0 (0.0%) | 0 (0.0%) |
| 5 or more Children | 0 (0.0%) | 0 (0.0%) |
| Total | 0 (0.0%) | 51 (22.2%) |
Income Below Poverty Among Married-Couple vs Single-Parent Households in Jerome
The poverty data for Jerome shows that 22 of the married-couple family households (7.6%) and 51 of the single-parent households (17.5%) are living below the poverty level. Within the married-couple family households, those with 1 or 2 children have the highest poverty rate, with 22 households (23.9%) falling below the poverty line. Among the single-parent households, those with 1 or 2 children have the highest poverty rate, with 51 household (24.2%) living below poverty.
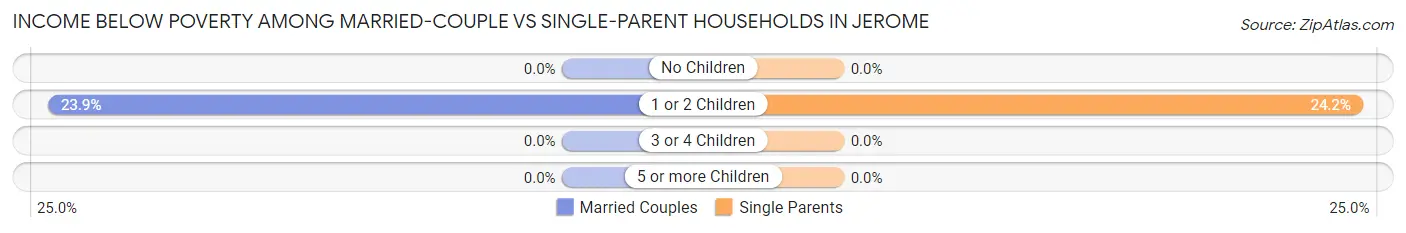
| Children | Married-Couple Families | Single-Parent Households |
| No Children | 0 (0.0%) | 0 (0.0%) |
| 1 or 2 Children | 22 (23.9%) | 51 (24.2%) |
| 3 or 4 Children | 0 (0.0%) | 0 (0.0%) |
| 5 or more Children | 0 (0.0%) | 0 (0.0%) |
| Total | 22 (7.6%) | 51 (17.5%) |
Race in Jerome
The most populous races in Jerome are White / Caucasian (1,790 | 81.6%), Black / African American (205 | 9.3%), and Two or more Races (115 | 5.2%).
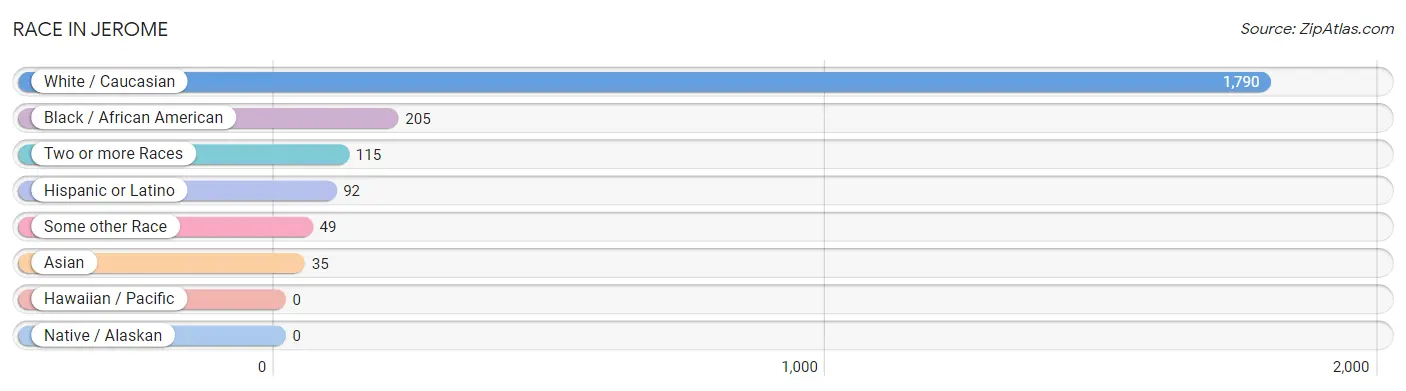
| Race | # Population | % Population |
| Asian | 35 | 1.6% |
| Black / African American | 205 | 9.3% |
| Hawaiian / Pacific | 0 | 0.0% |
| Hispanic or Latino | 92 | 4.2% |
| Native / Alaskan | 0 | 0.0% |
| White / Caucasian | 1,790 | 81.6% |
| Two or more Races | 115 | 5.2% |
| Some other Race | 49 | 2.2% |
| Total | 2,194 | 100.0% |
Ancestry in Jerome
The most populous ancestries reported in Jerome are German (548 | 25.0%), Irish (404 | 18.4%), English (269 | 12.3%), Italian (158 | 7.2%), and European (123 | 5.6%), together accounting for 68.5% of all Jerome residents.
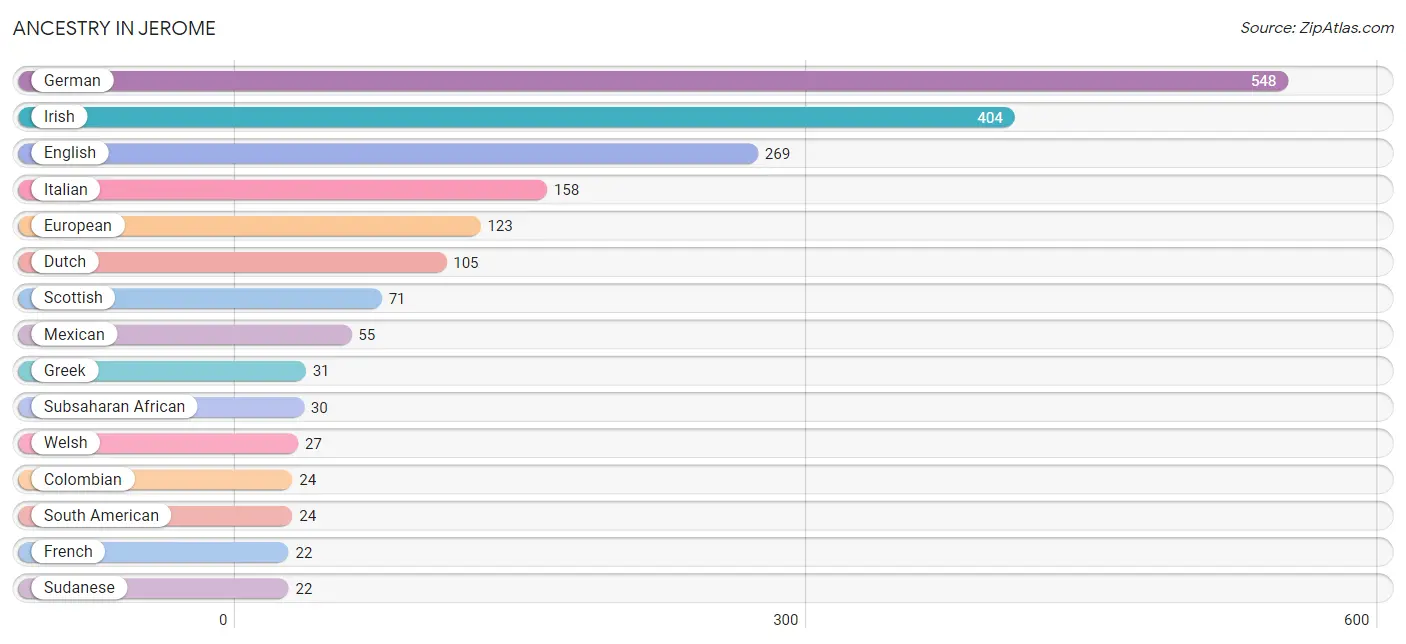
| Ancestry | # Population | % Population |
| American | 2 | 0.1% |
| Arab | 7 | 0.3% |
| Burmese | 13 | 0.6% |
| Canadian | 7 | 0.3% |
| Colombian | 24 | 1.1% |
| Croatian | 13 | 0.6% |
| Cuban | 6 | 0.3% |
| Danish | 8 | 0.4% |
| Dutch | 105 | 4.8% |
| English | 269 | 12.3% |
| European | 123 | 5.6% |
| French | 22 | 1.0% |
| German | 548 | 25.0% |
| Greek | 31 | 1.4% |
| Hungarian | 8 | 0.4% |
| Indian (Asian) | 13 | 0.6% |
| Irish | 404 | 18.4% |
| Italian | 158 | 7.2% |
| Jordanian | 7 | 0.3% |
| Korean | 2 | 0.1% |
| Lithuanian | 12 | 0.5% |
| Mexican | 55 | 2.5% |
| Northern European | 10 | 0.5% |
| Norwegian | 11 | 0.5% |
| Pakistani | 8 | 0.4% |
| Polish | 21 | 1.0% |
| Scotch-Irish | 5 | 0.2% |
| Scottish | 71 | 3.2% |
| South American | 24 | 1.1% |
| Subsaharan African | 30 | 1.4% |
| Sudanese | 22 | 1.0% |
| Swedish | 6 | 0.3% |
| Thai | 7 | 0.3% |
| Turkish | 5 | 0.2% |
| Welsh | 27 | 1.2% | View All 35 Rows |
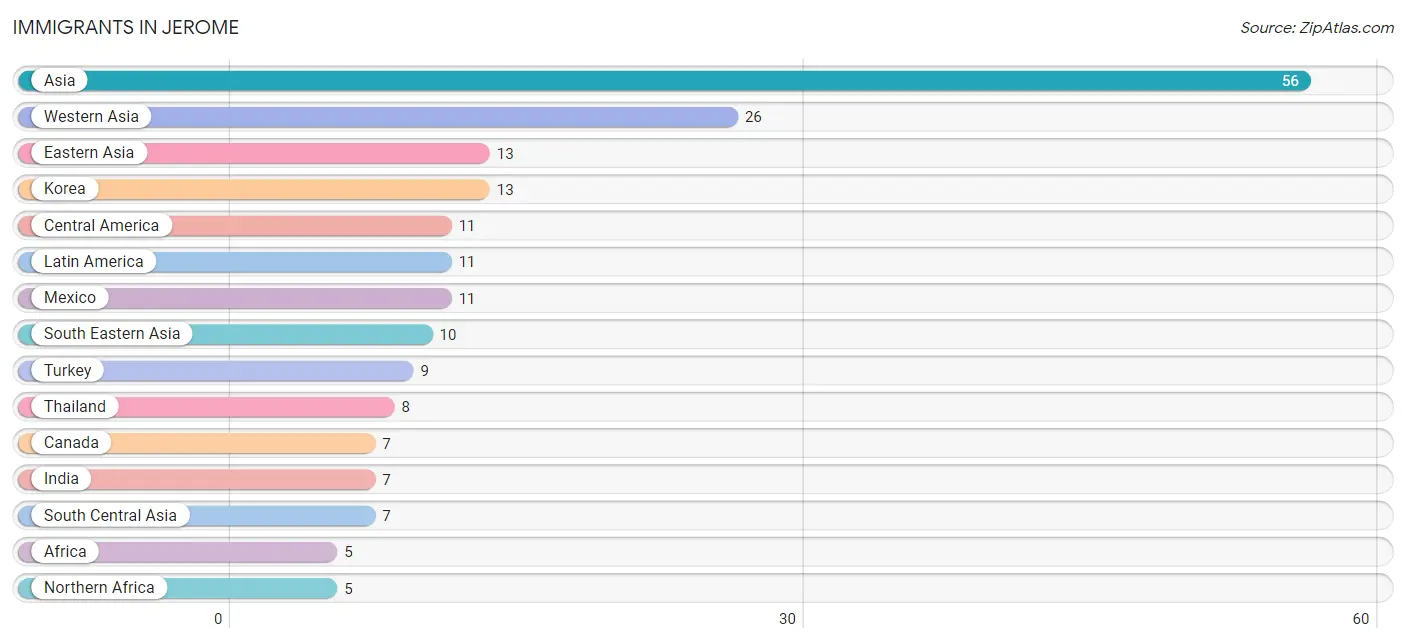
Immigrants in Jerome
The most numerous immigrant groups reported in Jerome came from Asia (56 | 2.5%), Western Asia (26 | 1.2%), Eastern Asia (13 | 0.6%), Korea (13 | 0.6%), and Central America (11 | 0.5%), together accounting for 5.4% of all Jerome residents.
| Immigration Origin | # Population | % Population |
| Africa | 5 | 0.2% |
| Asia | 56 | 2.5% |
| Canada | 7 | 0.3% |
| Central America | 11 | 0.5% |
| Eastern Asia | 13 | 0.6% |
| India | 7 | 0.3% |
| Korea | 13 | 0.6% |
| Latin America | 11 | 0.5% |
| Mexico | 11 | 0.5% |
| Northern Africa | 5 | 0.2% |
| Philippines | 2 | 0.1% |
| Saudi Arabia | 5 | 0.2% |
| South Central Asia | 7 | 0.3% |
| South Eastern Asia | 10 | 0.5% |
| Sudan | 5 | 0.2% |
| Thailand | 8 | 0.4% |
| Turkey | 9 | 0.4% |
| Western Asia | 26 | 1.2% | View All 18 Rows |
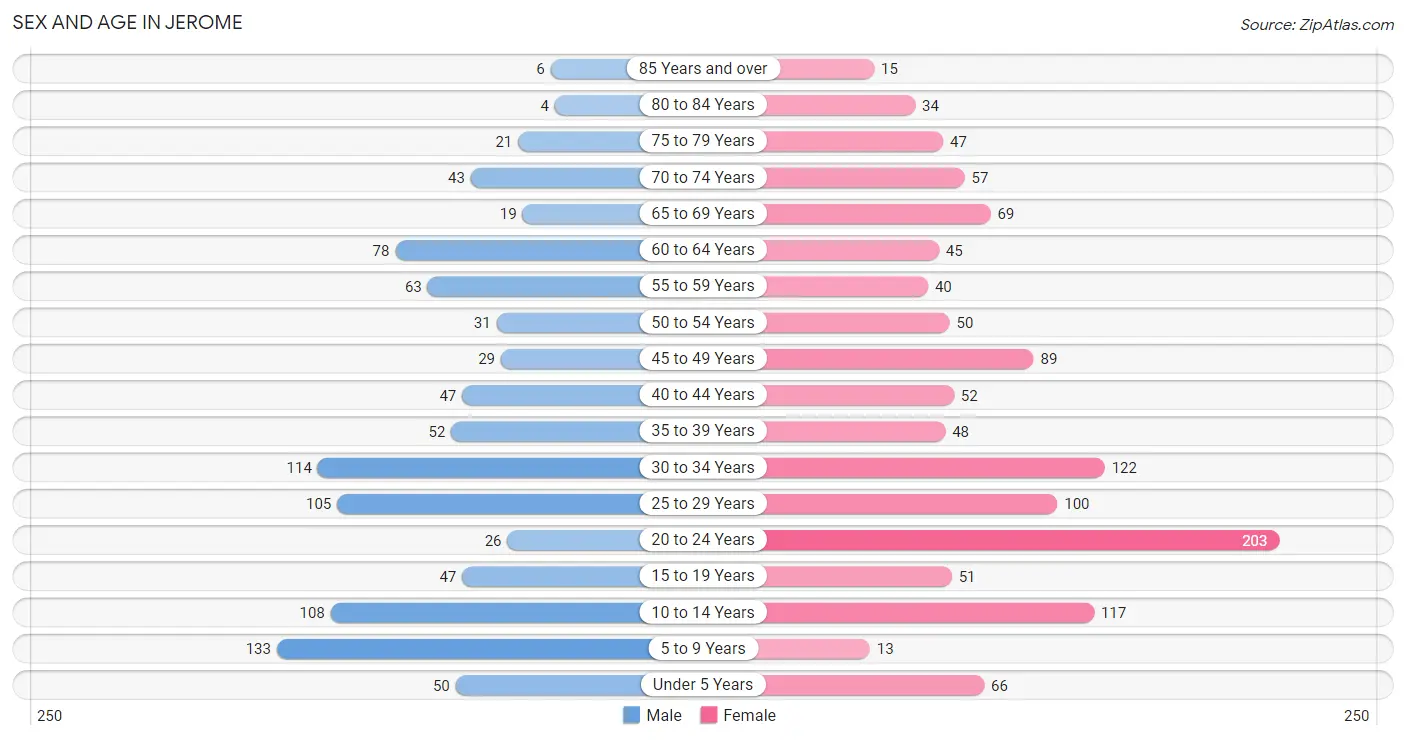
Sex and Age in Jerome
Sex and Age in Jerome
The most populous age groups in Jerome are 5 to 9 Years (133 | 13.6%) for men and 20 to 24 Years (203 | 16.7%) for women.
| Age Bracket | Male | Female |
| Under 5 Years | 50 (5.1%) | 66 (5.4%) |
| 5 to 9 Years | 133 (13.6%) | 13 (1.1%) |
| 10 to 14 Years | 108 (11.1%) | 117 (9.6%) |
| 15 to 19 Years | 47 (4.8%) | 51 (4.2%) |
| 20 to 24 Years | 26 (2.7%) | 203 (16.7%) |
| 25 to 29 Years | 105 (10.8%) | 100 (8.2%) |
| 30 to 34 Years | 114 (11.7%) | 122 (10.0%) |
| 35 to 39 Years | 52 (5.3%) | 48 (3.9%) |
| 40 to 44 Years | 47 (4.8%) | 52 (4.3%) |
| 45 to 49 Years | 29 (3.0%) | 89 (7.3%) |
| 50 to 54 Years | 31 (3.2%) | 50 (4.1%) |
| 55 to 59 Years | 63 (6.5%) | 40 (3.3%) |
| 60 to 64 Years | 78 (8.0%) | 45 (3.7%) |
| 65 to 69 Years | 19 (1.9%) | 69 (5.7%) |
| 70 to 74 Years | 43 (4.4%) | 57 (4.7%) |
| 75 to 79 Years | 21 (2.1%) | 47 (3.9%) |
| 80 to 84 Years | 4 (0.4%) | 34 (2.8%) |
| 85 Years and over | 6 (0.6%) | 15 (1.2%) |
| Total | 976 (100.0%) | 1,218 (100.0%) |
Families and Households in Jerome
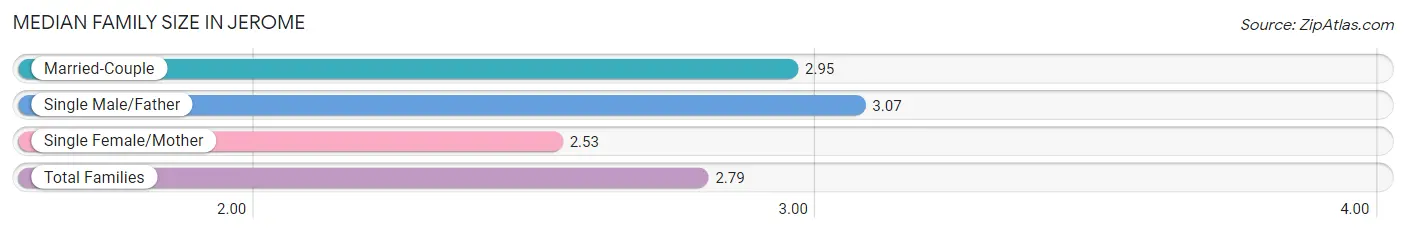
Median Family Size in Jerome
The median family size in Jerome is 2.79 persons per family, with single male/father families (61 | 10.5%) accounting for the largest median family size of 3.07 persons per family. On the other hand, single female/mother families (230 | 39.5%) represent the smallest median family size with 2.53 persons per family.
| Family Type | # Families | Family Size |
| Married-Couple | 291 (50.0%) | 2.95 |
| Single Male/Father | 61 (10.5%) | 3.07 |
| Single Female/Mother | 230 (39.5%) | 2.53 |
| Total Families | 582 (100.0%) | 2.79 |
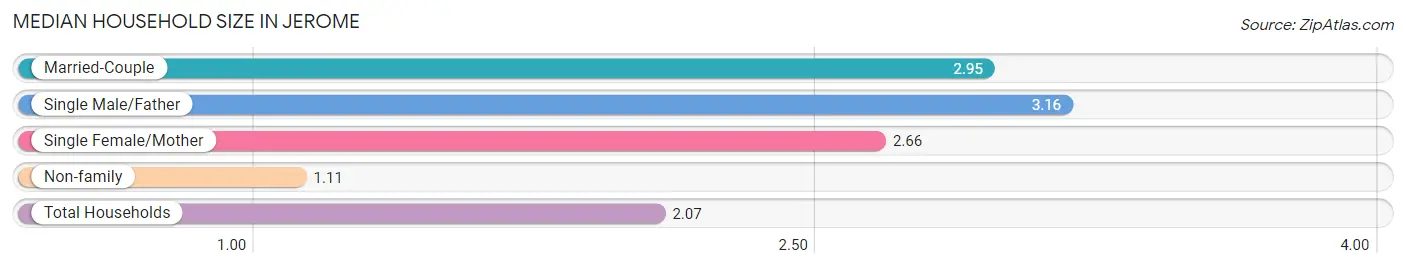
Median Household Size in Jerome
The median household size in Jerome is 2.07 persons per household, with single male/father households (61 | 5.8%) accounting for the largest median household size of 3.16 persons per household. non-family households (479 | 45.2%) represent the smallest median household size with 1.11 persons per household.
| Household Type | # Households | Household Size |
| Married-Couple | 291 (27.4%) | 2.95 |
| Single Male/Father | 61 (5.8%) | 3.16 |
| Single Female/Mother | 230 (21.7%) | 2.66 |
| Non-family | 479 (45.2%) | 1.11 |
| Total Households | 1,061 (100.0%) | 2.07 |
Household Size by Marriage Status in Jerome
Out of a total of 1,061 households in Jerome, 582 (54.8%) are family households, while 479 (45.2%) are nonfamily households. The most numerous type of family households are 2-person households, comprising 321, and the most common type of nonfamily households are 1-person households, comprising 414.
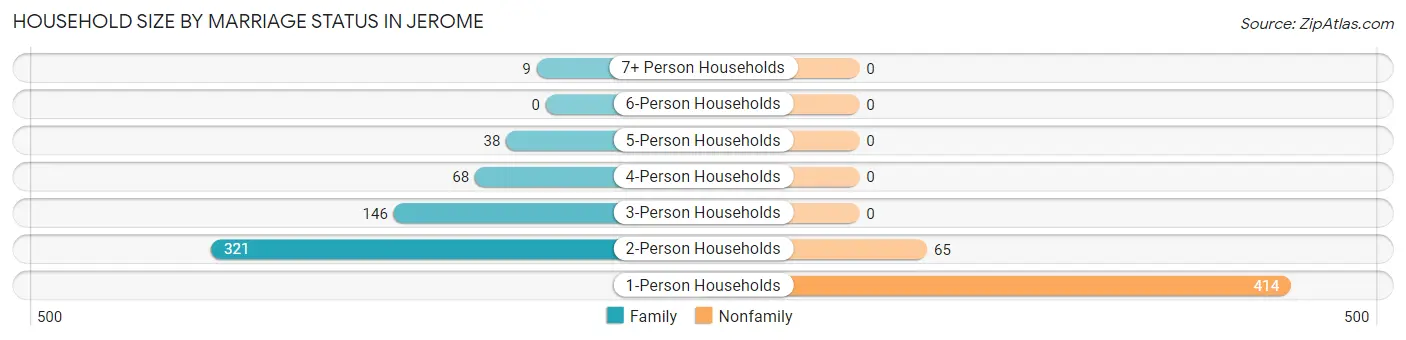
| Household Size | Family Households | Nonfamily Households |
| 1-Person Households | - | 414 (39.0%) |
| 2-Person Households | 321 (30.2%) | 65 (6.1%) |
| 3-Person Households | 146 (13.8%) | 0 (0.0%) |
| 4-Person Households | 68 (6.4%) | 0 (0.0%) |
| 5-Person Households | 38 (3.6%) | 0 (0.0%) |
| 6-Person Households | 0 (0.0%) | 0 (0.0%) |
| 7+ Person Households | 9 (0.9%) | 0 (0.0%) |
| Total | 582 (54.8%) | 479 (45.2%) |
Female Fertility in Jerome
Fertility by Age in Jerome
Average fertility rate in Jerome is 73.0 births per 1,000 women. Women in the age bracket of 20 to 34 years have the highest fertility rate with 94.0 births per 1,000 women. Women in the age bracket of 20 to 34 years acount for 81.6% of all women with births.
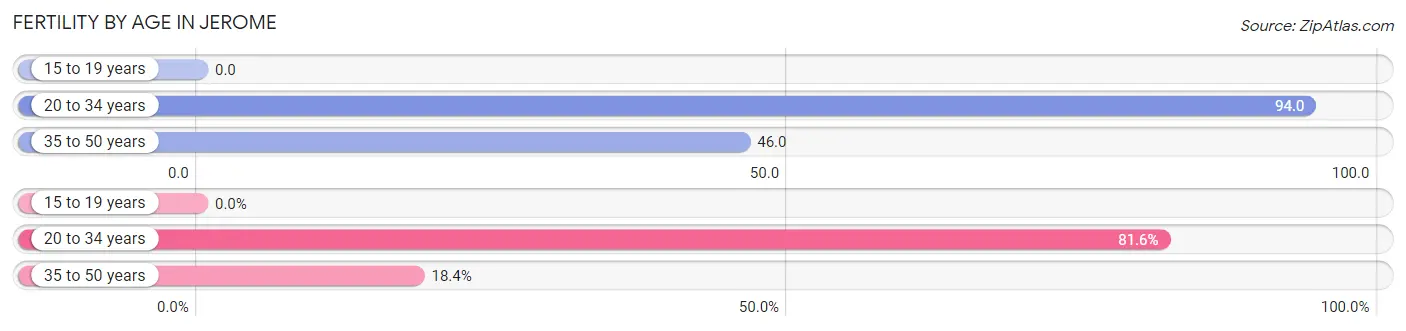
| Age Bracket | Women with Births | Births / 1,000 Women |
| 15 to 19 years | 0 (0.0%) | 0.0 |
| 20 to 34 years | 40 (81.6%) | 94.0 |
| 35 to 50 years | 9 (18.4%) | 46.0 |
| Total | 49 (100.0%) | 73.0 |
Fertility by Age by Marriage Status in Jerome
40.8% of women with births (49) in Jerome are married. The highest percentage of unmarried women with births falls into 20 to 34 years age bracket with 72.5% of them unmarried at the time of birth, while the lowest percentage of unmarried women with births belong to 35 to 50 years age bracket with 0.0% of them unmarried.
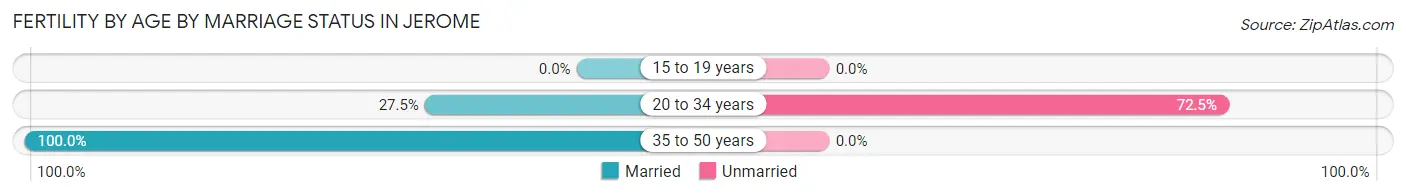
| Age Bracket | Married | Unmarried |
| 15 to 19 years | 0 (0.0%) | 0 (0.0%) |
| 20 to 34 years | 11 (27.5%) | 29 (72.5%) |
| 35 to 50 years | 9 (100.0%) | 0 (0.0%) |
| Total | 20 (40.8%) | 29 (59.2%) |
Fertility by Education in Jerome
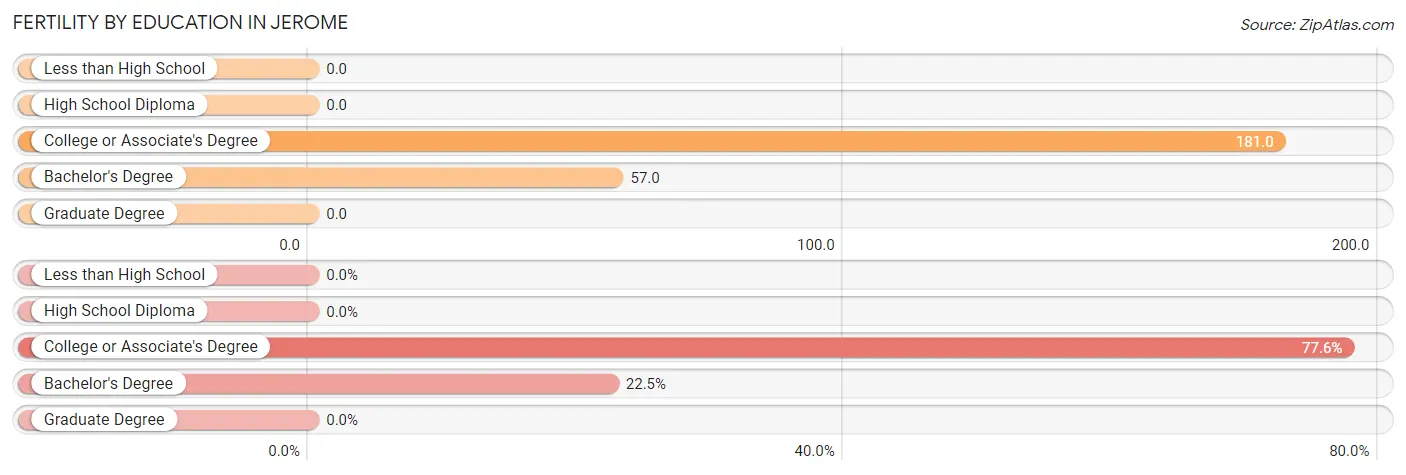
| Educational Attainment | Women with Births | Births / 1,000 Women |
| Less than High School | 0 (0.0%) | 0.0 |
| High School Diploma | 0 (0.0%) | 0.0 |
| College or Associate's Degree | 38 (77.5%) | 181.0 |
| Bachelor's Degree | 11 (22.5%) | 57.0 |
| Graduate Degree | 0 (0.0%) | 0.0 |
| Total | 49 (100.0%) | 73.0 |
Fertility by Education by Marriage Status in Jerome
59.2% of women with births in Jerome are unmarried. Women with the educational attainment of bachelor's degree are most likely to be married with 100.0% of them married at childbirth, while women with the educational attainment of college or associate's degree are least likely to be married with 76.3% of them unmarried at childbirth.
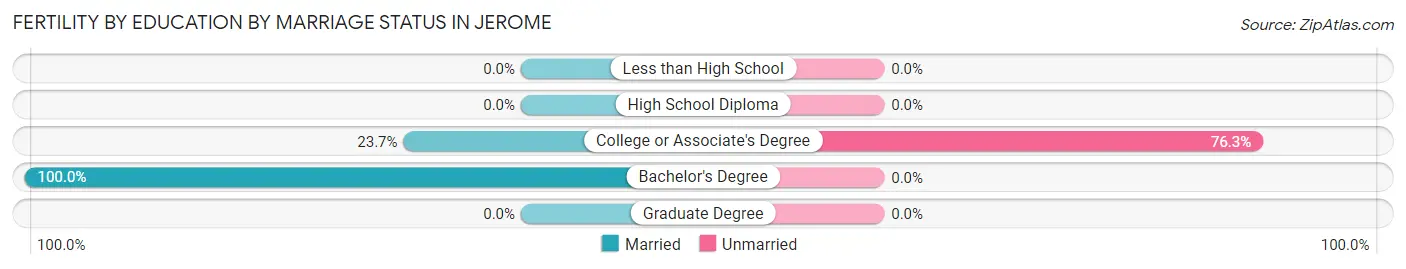
| Educational Attainment | Married | Unmarried |
| Less than High School | 0 (0.0%) | 0 (0.0%) |
| High School Diploma | 0 (0.0%) | 0 (0.0%) |
| College or Associate's Degree | 9 (23.7%) | 29 (76.3%) |
| Bachelor's Degree | 11 (100.0%) | 0 (0.0%) |
| Graduate Degree | 0 (0.0%) | 0 (0.0%) |
| Total | 20 (40.8%) | 29 (59.2%) |
Employment Characteristics in Jerome
Employment by Class of Employer in Jerome
Among the 1,198 employed individuals in Jerome, private company employees (711 | 59.4%), state government employees (212 | 17.7%), and self-employed (not incorporated) (100 | 8.4%) make up the most common classes of employment.
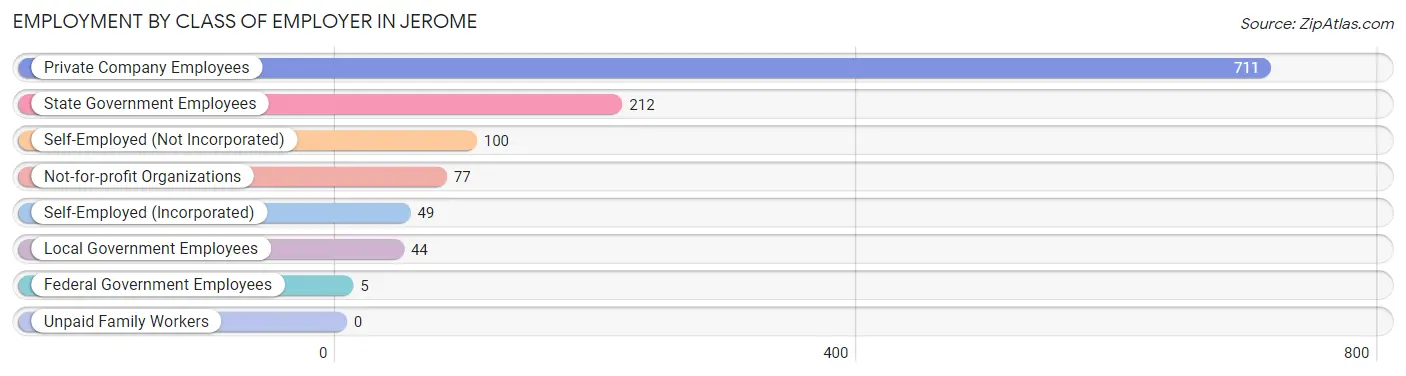
| Employer Class | # Employees | % Employees |
| Private Company Employees | 711 | 59.4% |
| Self-Employed (Incorporated) | 49 | 4.1% |
| Self-Employed (Not Incorporated) | 100 | 8.4% |
| Not-for-profit Organizations | 77 | 6.4% |
| Local Government Employees | 44 | 3.7% |
| State Government Employees | 212 | 17.7% |
| Federal Government Employees | 5 | 0.4% |
| Unpaid Family Workers | 0 | 0.0% |
| Total | 1,198 | 100.0% |
Employment Status by Age in Jerome
According to the labor force statistics for Jerome, out of the total population over 16 years of age (1,696), 72.5% or 1,230 individuals are in the labor force, with 2.0% or 25 of them unemployed. The age group with the highest labor force participation rate is 16 to 19 years, with 96.6% or 84 individuals in the labor force. Within the labor force, the 55 to 59 years age range has the highest percentage of unemployed individuals, with 8.0% or 7 of them being unemployed.
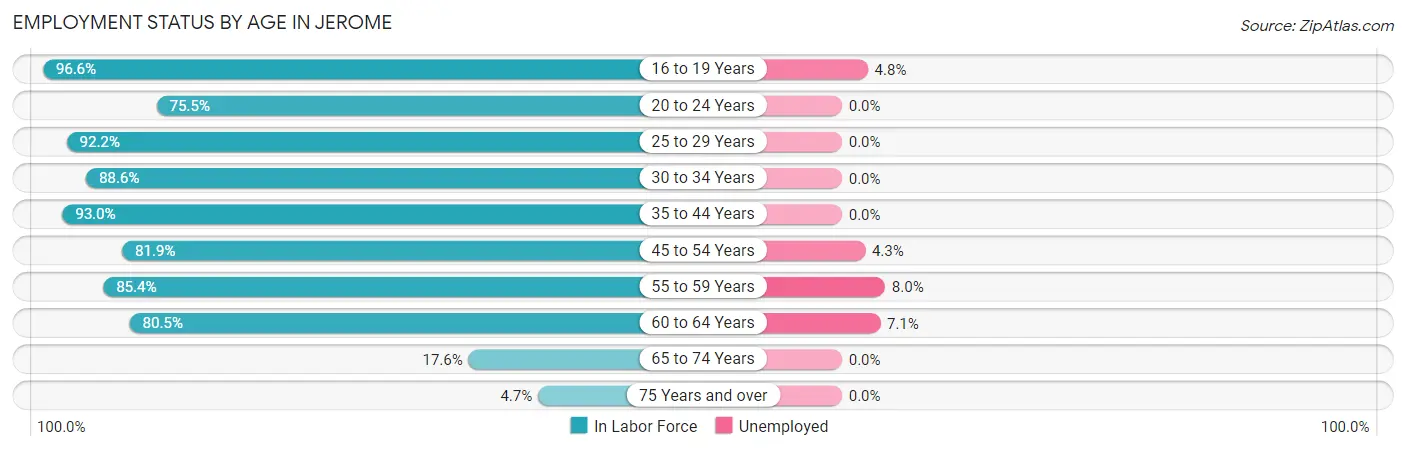
| Age Bracket | In Labor Force | Unemployed |
| 16 to 19 Years | 84 (96.6%) | 4 (4.8%) |
| 20 to 24 Years | 173 (75.5%) | 0 (0.0%) |
| 25 to 29 Years | 189 (92.2%) | 0 (0.0%) |
| 30 to 34 Years | 209 (88.6%) | 0 (0.0%) |
| 35 to 44 Years | 185 (93.0%) | 0 (0.0%) |
| 45 to 54 Years | 163 (81.9%) | 7 (4.3%) |
| 55 to 59 Years | 88 (85.4%) | 7 (8.0%) |
| 60 to 64 Years | 99 (80.5%) | 7 (7.1%) |
| 65 to 74 Years | 33 (17.6%) | 0 (0.0%) |
| 75 Years and over | 6 (4.7%) | 0 (0.0%) |
| Total | 1,230 (72.5%) | 25 (2.0%) |
Employment Status by Educational Attainment in Jerome
According to labor force statistics for Jerome, 87.6% of individuals (933) out of the total population between 25 and 64 years of age (1,065) are in the labor force, with 2.3% or 21 of them being unemployed. The group with the highest labor force participation rate are those with the educational attainment of bachelor's degree or higher, with 93.3% or 308 individuals in the labor force. Within the labor force, individuals with bachelor's degree or higher education have the highest percentage of unemployment, with 4.5% or 14 of them being unemployed.
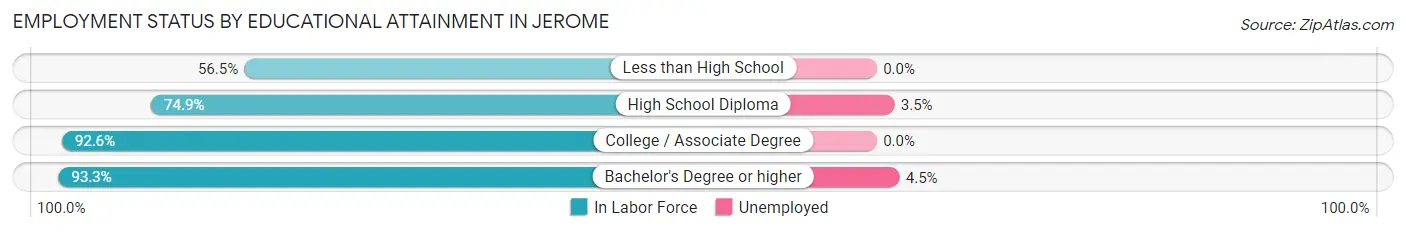
| Educational Attainment | In Labor Force | Unemployed |
| Less than High School | 13 (56.5%) | 0 (0.0%) |
| High School Diploma | 200 (74.9%) | 9 (3.5%) |
| College / Associate Degree | 412 (92.6%) | 0 (0.0%) |
| Bachelor's Degree or higher | 308 (93.3%) | 15 (4.5%) |
| Total | 933 (87.6%) | 24 (2.3%) |
Employment Occupations by Sex in Jerome
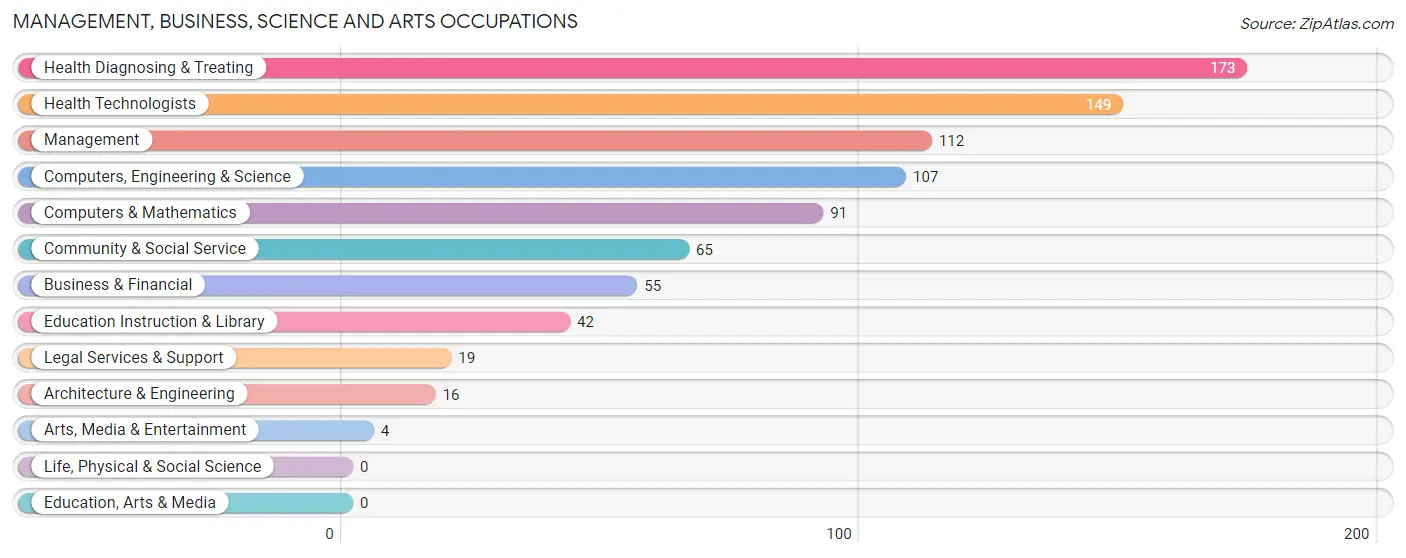
Management, Business, Science and Arts Occupations
The most common Management, Business, Science and Arts occupations in Jerome are Health Diagnosing & Treating (173 | 14.4%), Health Technologists (149 | 12.4%), Management (112 | 9.3%), Computers, Engineering & Science (107 | 8.9%), and Computers & Mathematics (91 | 7.6%).
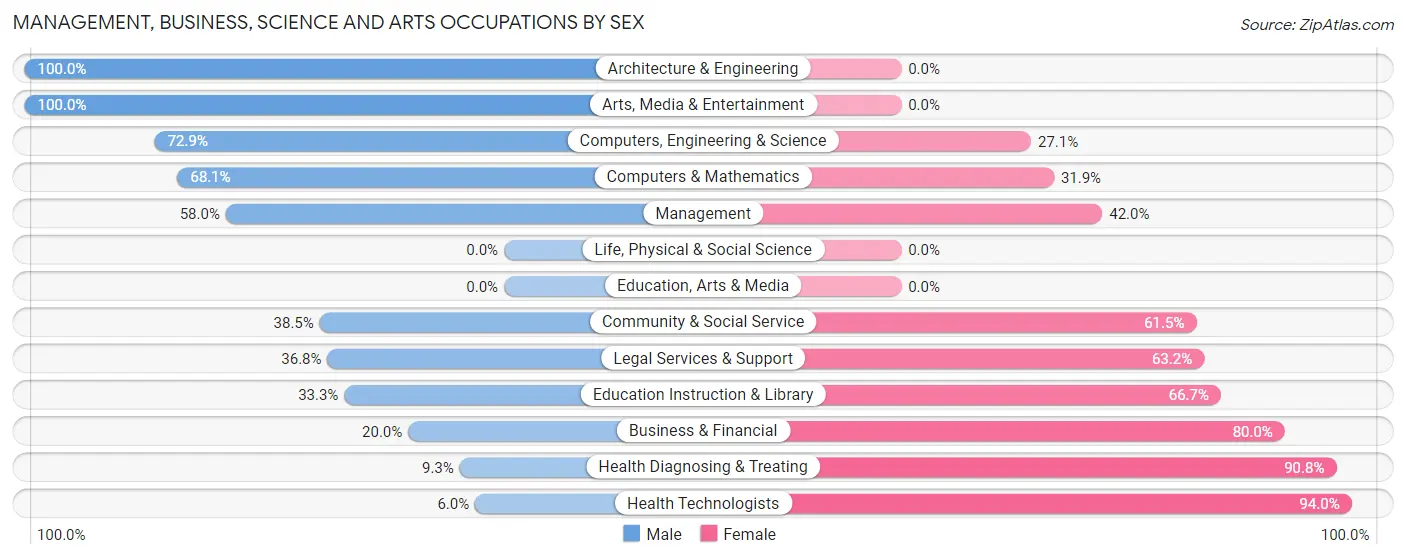
Management, Business, Science and Arts Occupations by Sex
Within the Management, Business, Science and Arts occupations in Jerome, the most male-oriented occupations are Architecture & Engineering (100.0%), Arts, Media & Entertainment (100.0%), and Computers, Engineering & Science (72.9%), while the most female-oriented occupations are Health Technologists (94.0%), Health Diagnosing & Treating (90.7%), and Business & Financial (80.0%).
| Occupation | Male | Female |
| Management | 65 (58.0%) | 47 (42.0%) |
| Business & Financial | 11 (20.0%) | 44 (80.0%) |
| Computers, Engineering & Science | 78 (72.9%) | 29 (27.1%) |
| Computers & Mathematics | 62 (68.1%) | 29 (31.9%) |
| Architecture & Engineering | 16 (100.0%) | 0 (0.0%) |
| Life, Physical & Social Science | 0 (0.0%) | 0 (0.0%) |
| Community & Social Service | 25 (38.5%) | 40 (61.5%) |
| Education, Arts & Media | 0 (0.0%) | 0 (0.0%) |
| Legal Services & Support | 7 (36.8%) | 12 (63.2%) |
| Education Instruction & Library | 14 (33.3%) | 28 (66.7%) |
| Arts, Media & Entertainment | 4 (100.0%) | 0 (0.0%) |
| Health Diagnosing & Treating | 16 (9.2%) | 157 (90.7%) |
| Health Technologists | 9 (6.0%) | 140 (94.0%) |
| Total (Category) | 195 (38.1%) | 317 (61.9%) |
| Total (Overall) | 530 (44.0%) | 674 (56.0%) |
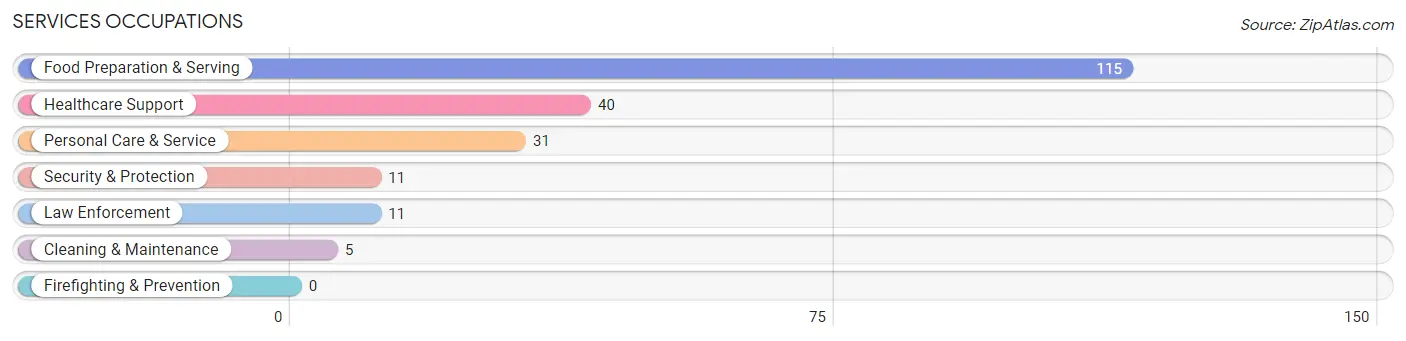
Services Occupations
The most common Services occupations in Jerome are Food Preparation & Serving (115 | 9.6%), Healthcare Support (40 | 3.3%), Personal Care & Service (31 | 2.6%), Security & Protection (11 | 0.9%), and Law Enforcement (11 | 0.9%).
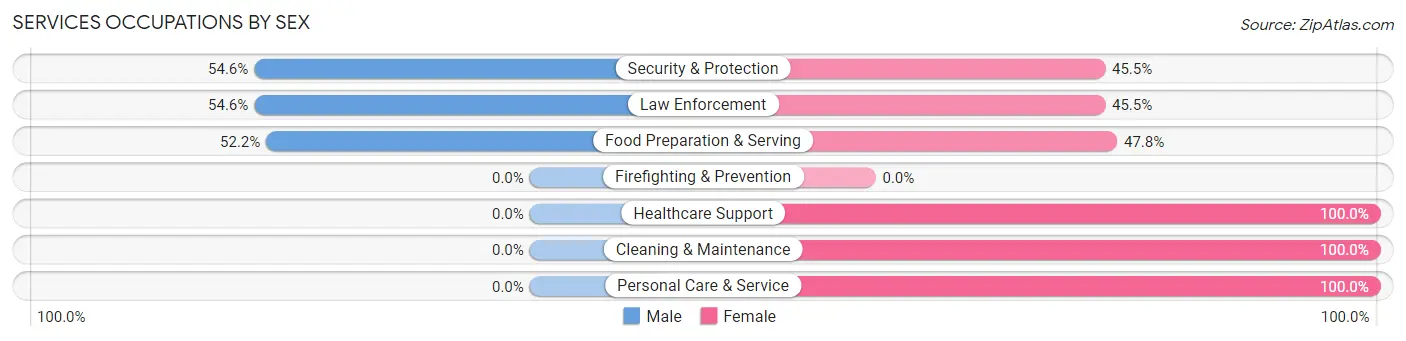
Services Occupations by Sex
Within the Services occupations in Jerome, the most male-oriented occupations are Security & Protection (54.5%), Law Enforcement (54.5%), and Food Preparation & Serving (52.2%), while the most female-oriented occupations are Healthcare Support (100.0%), Cleaning & Maintenance (100.0%), and Personal Care & Service (100.0%).
| Occupation | Male | Female |
| Healthcare Support | 0 (0.0%) | 40 (100.0%) |
| Security & Protection | 6 (54.5%) | 5 (45.5%) |
| Firefighting & Prevention | 0 (0.0%) | 0 (0.0%) |
| Law Enforcement | 6 (54.5%) | 5 (45.5%) |
| Food Preparation & Serving | 60 (52.2%) | 55 (47.8%) |
| Cleaning & Maintenance | 0 (0.0%) | 5 (100.0%) |
| Personal Care & Service | 0 (0.0%) | 31 (100.0%) |
| Total (Category) | 66 (32.7%) | 136 (67.3%) |
| Total (Overall) | 530 (44.0%) | 674 (56.0%) |
Sales and Office Occupations
The most common Sales and Office occupations in Jerome are Office & Administration (196 | 16.3%), and Sales & Related (116 | 9.6%).
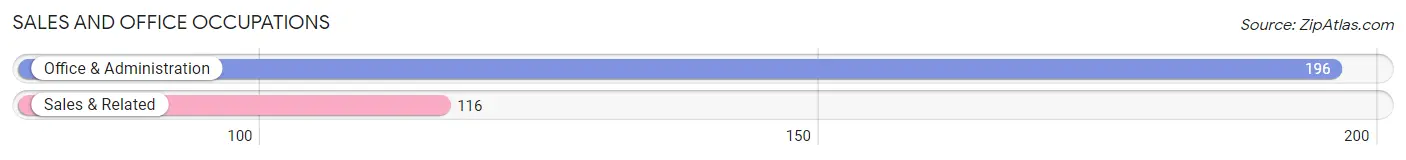
Sales and Office Occupations by Sex
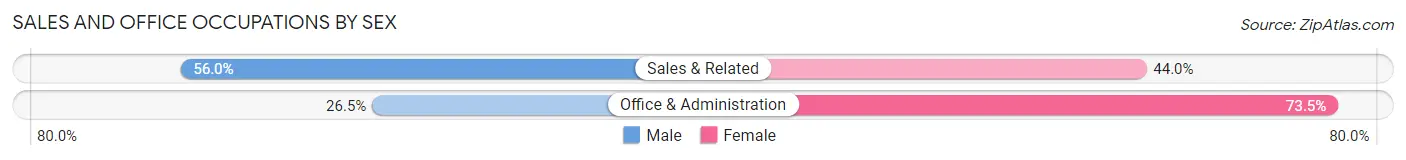
| Occupation | Male | Female |
| Sales & Related | 65 (56.0%) | 51 (44.0%) |
| Office & Administration | 52 (26.5%) | 144 (73.5%) |
| Total (Category) | 117 (37.5%) | 195 (62.5%) |
| Total (Overall) | 530 (44.0%) | 674 (56.0%) |
Natural Resources, Construction and Maintenance Occupations
The most common Natural Resources, Construction and Maintenance occupations in Jerome are Installation, Maintenance & Repair (68 | 5.7%), and Construction & Extraction (7 | 0.6%).
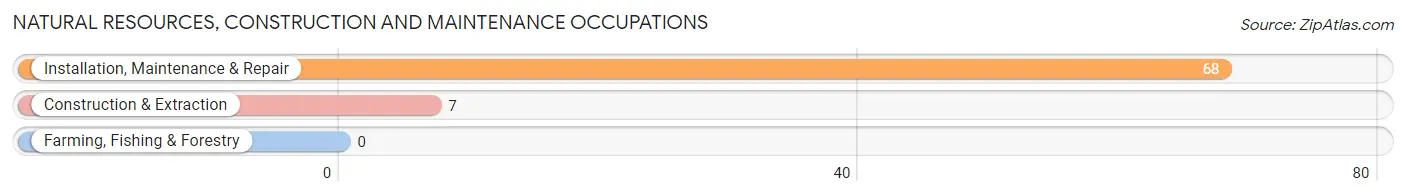
Natural Resources, Construction and Maintenance Occupations by Sex
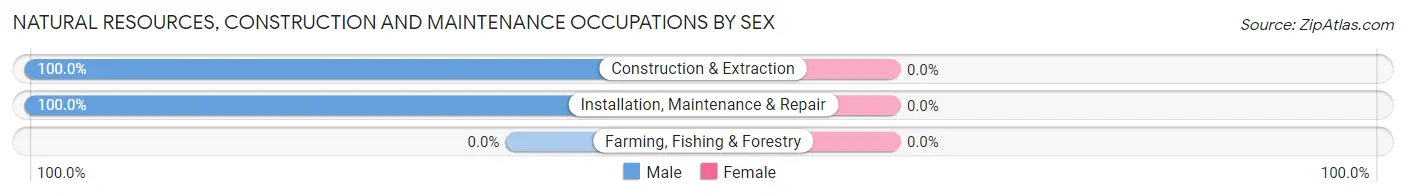
| Occupation | Male | Female |
| Farming, Fishing & Forestry | 0 (0.0%) | 0 (0.0%) |
| Construction & Extraction | 7 (100.0%) | 0 (0.0%) |
| Installation, Maintenance & Repair | 68 (100.0%) | 0 (0.0%) |
| Total (Category) | 75 (100.0%) | 0 (0.0%) |
| Total (Overall) | 530 (44.0%) | 674 (56.0%) |
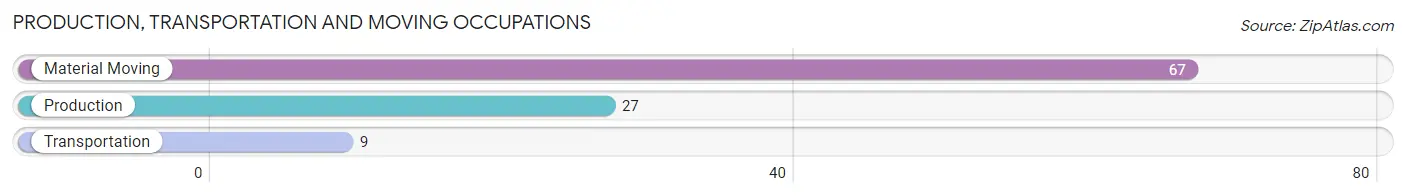
Production, Transportation and Moving Occupations
The most common Production, Transportation and Moving occupations in Jerome are Material Moving (67 | 5.6%), Production (27 | 2.2%), and Transportation (9 | 0.7%).
Production, Transportation and Moving Occupations by Sex
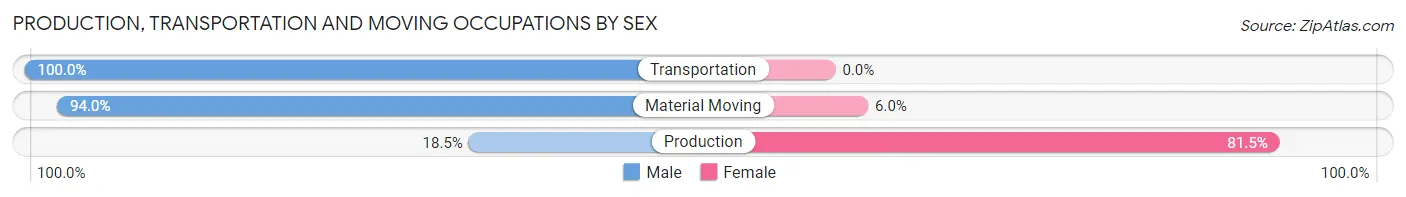
| Occupation | Male | Female |
| Production | 5 (18.5%) | 22 (81.5%) |
| Transportation | 9 (100.0%) | 0 (0.0%) |
| Material Moving | 63 (94.0%) | 4 (6.0%) |
| Total (Category) | 77 (74.8%) | 26 (25.2%) |
| Total (Overall) | 530 (44.0%) | 674 (56.0%) |
Employment Industries by Sex in Jerome
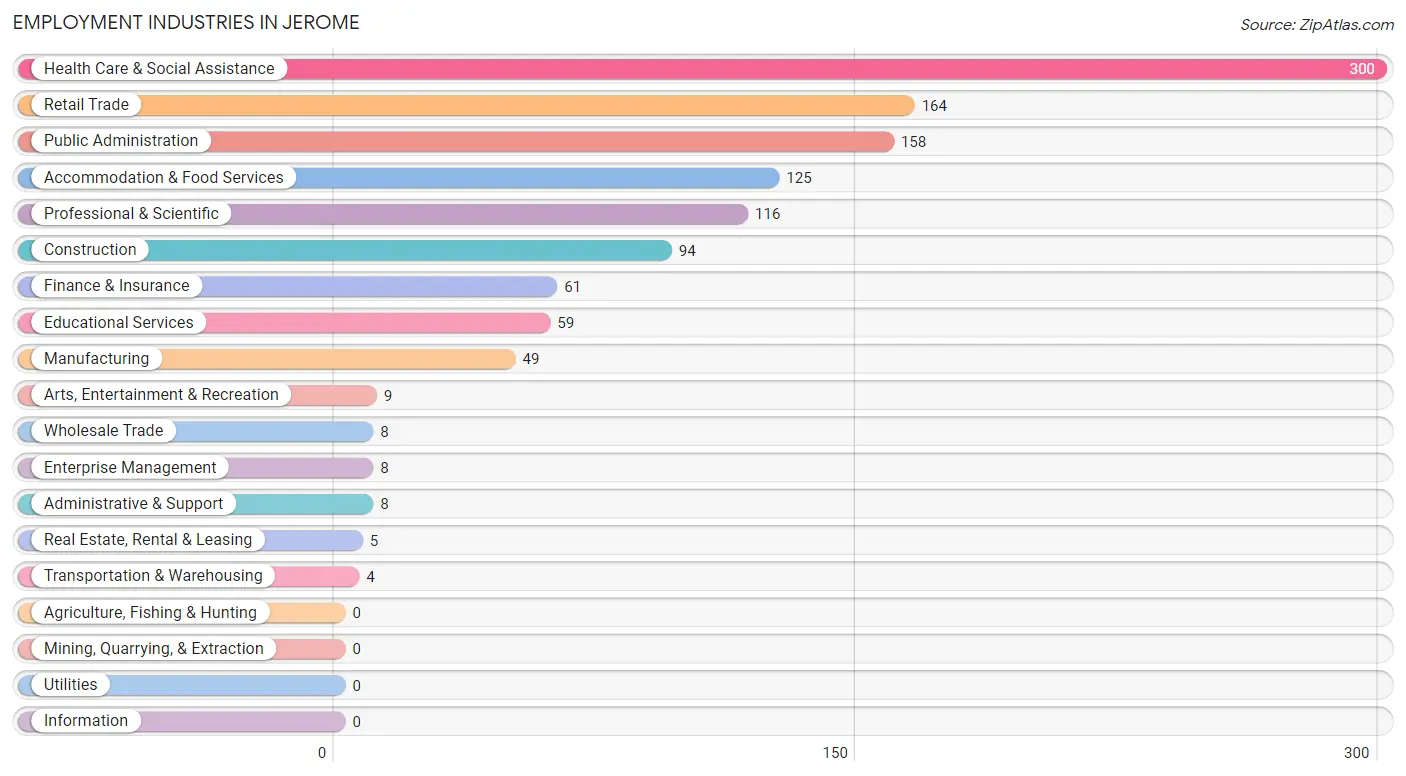
Employment Industries in Jerome
The major employment industries in Jerome include Health Care & Social Assistance (300 | 24.9%), Retail Trade (164 | 13.6%), Public Administration (158 | 13.1%), Accommodation & Food Services (125 | 10.4%), and Professional & Scientific (116 | 9.6%).
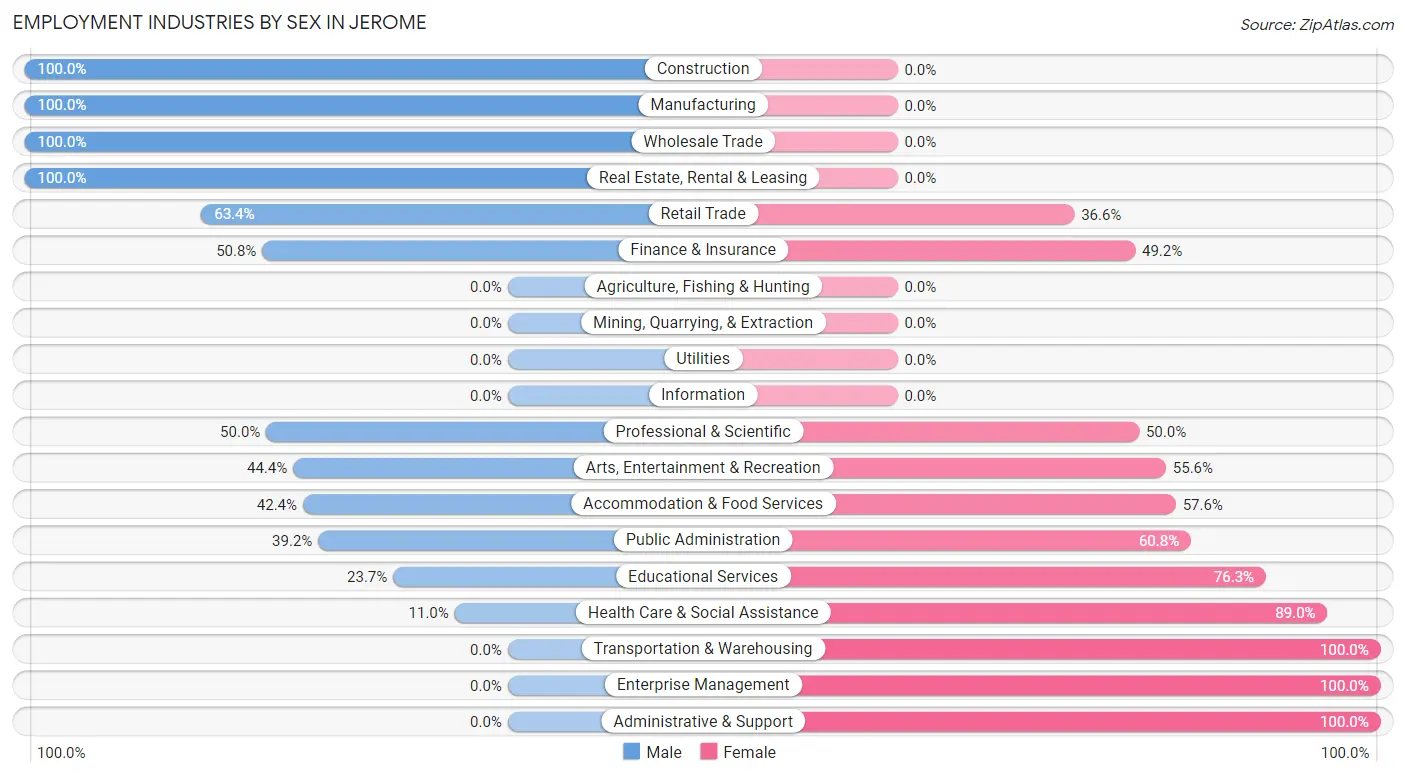
Employment Industries by Sex in Jerome
The Jerome industries that see more men than women are Construction (100.0%), Manufacturing (100.0%), and Wholesale Trade (100.0%), whereas the industries that tend to have a higher number of women are Transportation & Warehousing (100.0%), Enterprise Management (100.0%), and Administrative & Support (100.0%).
| Industry | Male | Female |
| Agriculture, Fishing & Hunting | 0 (0.0%) | 0 (0.0%) |
| Mining, Quarrying, & Extraction | 0 (0.0%) | 0 (0.0%) |
| Construction | 94 (100.0%) | 0 (0.0%) |
| Manufacturing | 49 (100.0%) | 0 (0.0%) |
| Wholesale Trade | 8 (100.0%) | 0 (0.0%) |
| Retail Trade | 104 (63.4%) | 60 (36.6%) |
| Transportation & Warehousing | 0 (0.0%) | 4 (100.0%) |
| Utilities | 0 (0.0%) | 0 (0.0%) |
| Information | 0 (0.0%) | 0 (0.0%) |
| Finance & Insurance | 31 (50.8%) | 30 (49.2%) |
| Real Estate, Rental & Leasing | 5 (100.0%) | 0 (0.0%) |
| Professional & Scientific | 58 (50.0%) | 58 (50.0%) |
| Enterprise Management | 0 (0.0%) | 8 (100.0%) |
| Administrative & Support | 0 (0.0%) | 8 (100.0%) |
| Educational Services | 14 (23.7%) | 45 (76.3%) |
| Health Care & Social Assistance | 33 (11.0%) | 267 (89.0%) |
| Arts, Entertainment & Recreation | 4 (44.4%) | 5 (55.6%) |
| Accommodation & Food Services | 53 (42.4%) | 72 (57.6%) |
| Public Administration | 62 (39.2%) | 96 (60.8%) |
| Total | 530 (44.0%) | 674 (56.0%) |
Education in Jerome
School Enrollment in Jerome
The most common levels of schooling among the 551 students in Jerome are middle school (232 | 42.1%), elementary school (115 | 20.9%), and college / undergraduate (76 | 13.8%).
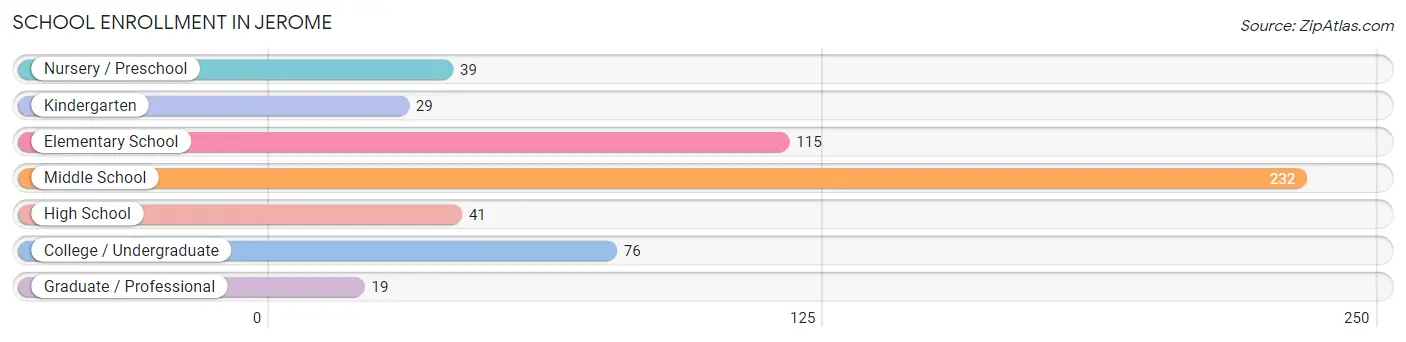
| School Level | # Students | % Students |
| Nursery / Preschool | 39 | 7.1% |
| Kindergarten | 29 | 5.3% |
| Elementary School | 115 | 20.9% |
| Middle School | 232 | 42.1% |
| High School | 41 | 7.4% |
| College / Undergraduate | 76 | 13.8% |
| Graduate / Professional | 19 | 3.5% |
| Total | 551 | 100.0% |
School Enrollment by Age by Funding Source in Jerome
Out of a total of 551 students who are enrolled in schools in Jerome, 83 (15.1%) attend a private institution, while the remaining 468 (84.9%) are enrolled in public schools. The age group of 25 to 34 year olds has the highest likelihood of being enrolled in private schools, with 5 (100.0% in the age bracket) enrolled. Conversely, the age group of 15 to 17 year olds has the lowest likelihood of being enrolled in a private school, with 31 (100.0% in the age bracket) attending a public institution.
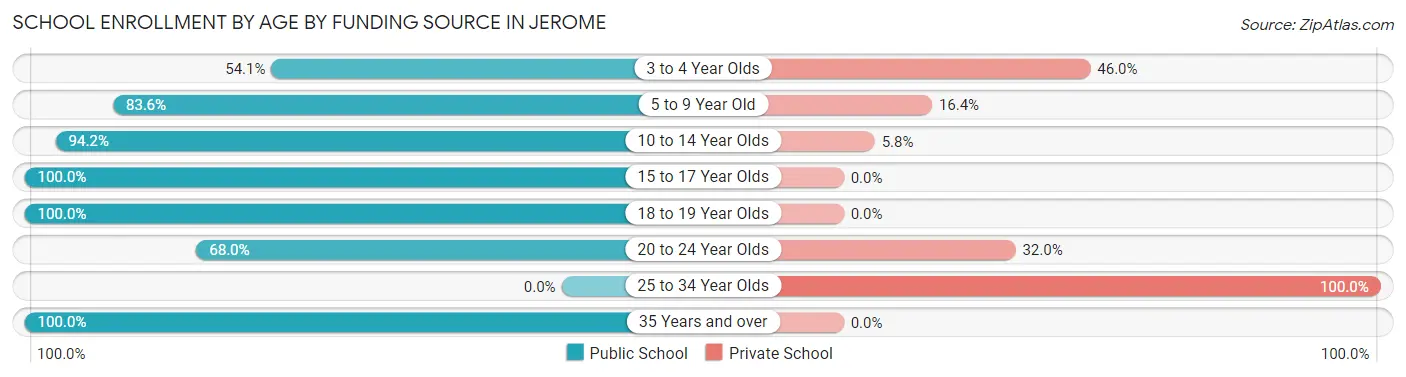
| Age Bracket | Public School | Private School |
| 3 to 4 Year Olds | 20 (54.0%) | 17 (46.0%) |
| 5 to 9 Year Old | 122 (83.6%) | 24 (16.4%) |
| 10 to 14 Year Olds | 212 (94.2%) | 13 (5.8%) |
| 15 to 17 Year Olds | 31 (100.0%) | 0 (0.0%) |
| 18 to 19 Year Olds | 18 (100.0%) | 0 (0.0%) |
| 20 to 24 Year Olds | 51 (68.0%) | 24 (32.0%) |
| 25 to 34 Year Olds | 0 (0.0%) | 5 (100.0%) |
| 35 Years and over | 14 (100.0%) | 0 (0.0%) |
| Total | 468 (84.9%) | 83 (15.1%) |
Educational Attainment by Field of Study in Jerome
Science & technology (104 | 21.4%), social sciences (60 | 12.3%), bio, nature & agricultural (57 | 11.7%), business (56 | 11.5%), and education (44 | 9.0%) are the most common fields of study among 486 individuals in Jerome who have obtained a bachelor's degree or higher.
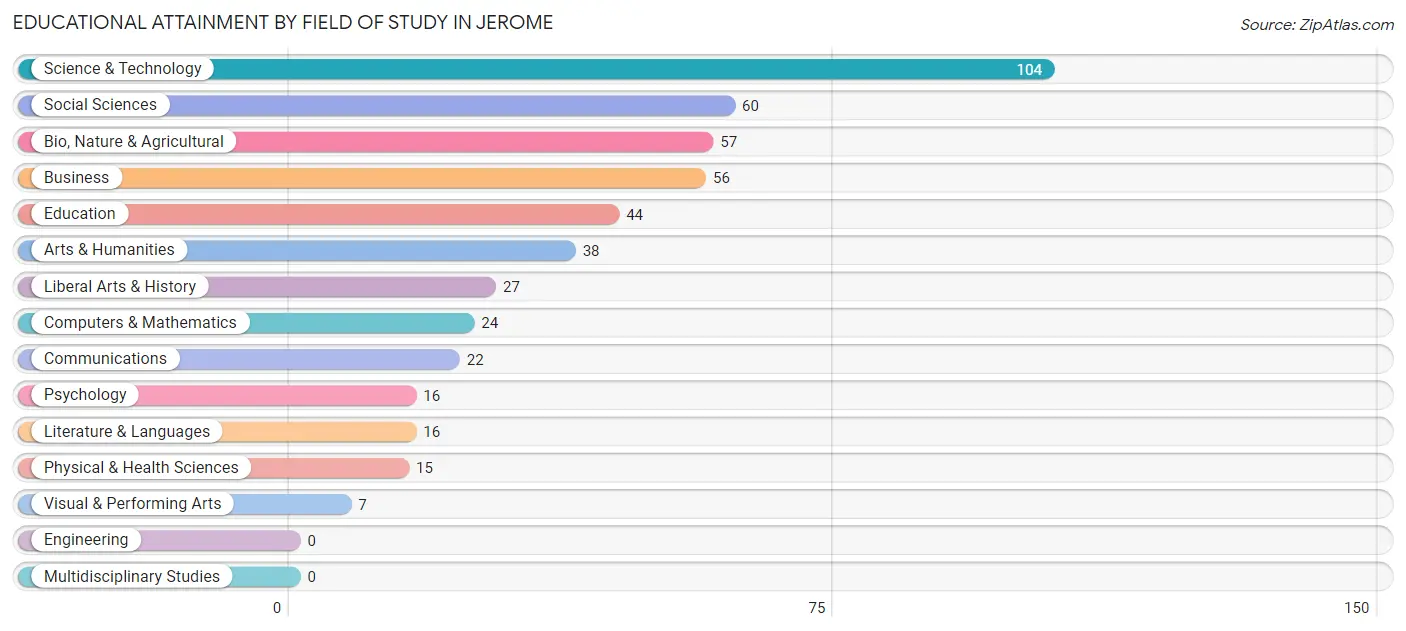
| Field of Study | # Graduates | % Graduates |
| Computers & Mathematics | 24 | 4.9% |
| Bio, Nature & Agricultural | 57 | 11.7% |
| Physical & Health Sciences | 15 | 3.1% |
| Psychology | 16 | 3.3% |
| Social Sciences | 60 | 12.3% |
| Engineering | 0 | 0.0% |
| Multidisciplinary Studies | 0 | 0.0% |
| Science & Technology | 104 | 21.4% |
| Business | 56 | 11.5% |
| Education | 44 | 9.0% |
| Literature & Languages | 16 | 3.3% |
| Liberal Arts & History | 27 | 5.6% |
| Visual & Performing Arts | 7 | 1.4% |
| Communications | 22 | 4.5% |
| Arts & Humanities | 38 | 7.8% |
| Total | 486 | 100.0% |
Transportation & Commute in Jerome
Vehicle Availability by Sex in Jerome
The most prevalent vehicle ownership categories in Jerome are males with 2 vehicles (263, accounting for 50.2%) and females with 2 vehicles (260, making up 39.0%).
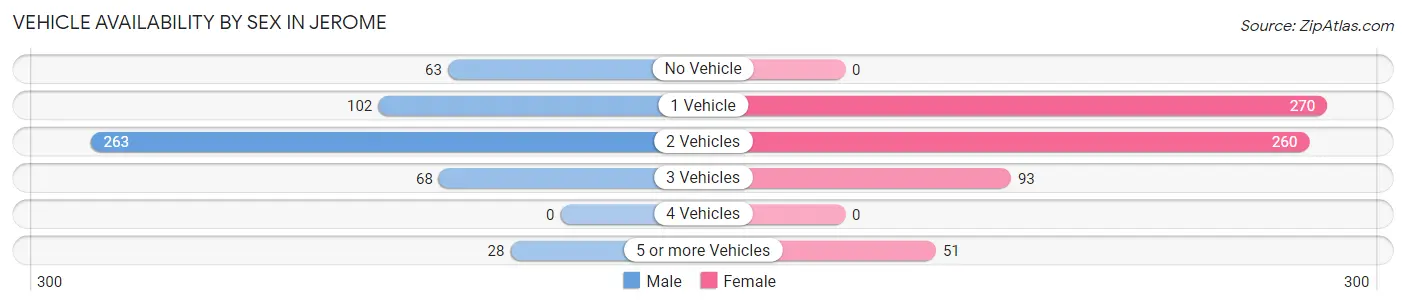
| Vehicles Available | Male | Female |
| No Vehicle | 63 (12.0%) | 0 (0.0%) |
| 1 Vehicle | 102 (19.5%) | 270 (40.1%) |
| 2 Vehicles | 263 (50.2%) | 260 (38.6%) |
| 3 Vehicles | 68 (13.0%) | 93 (13.8%) |
| 4 Vehicles | 0 (0.0%) | 0 (0.0%) |
| 5 or more Vehicles | 28 (5.3%) | 51 (7.6%) |
| Total | 524 (100.0%) | 674 (100.0%) |
Commute Time in Jerome
The most frequently occuring commute durations in Jerome are 10 to 14 minutes (382 commuters, 33.8%), 15 to 19 minutes (316 commuters, 27.9%), and 5 to 9 minutes (195 commuters, 17.2%).
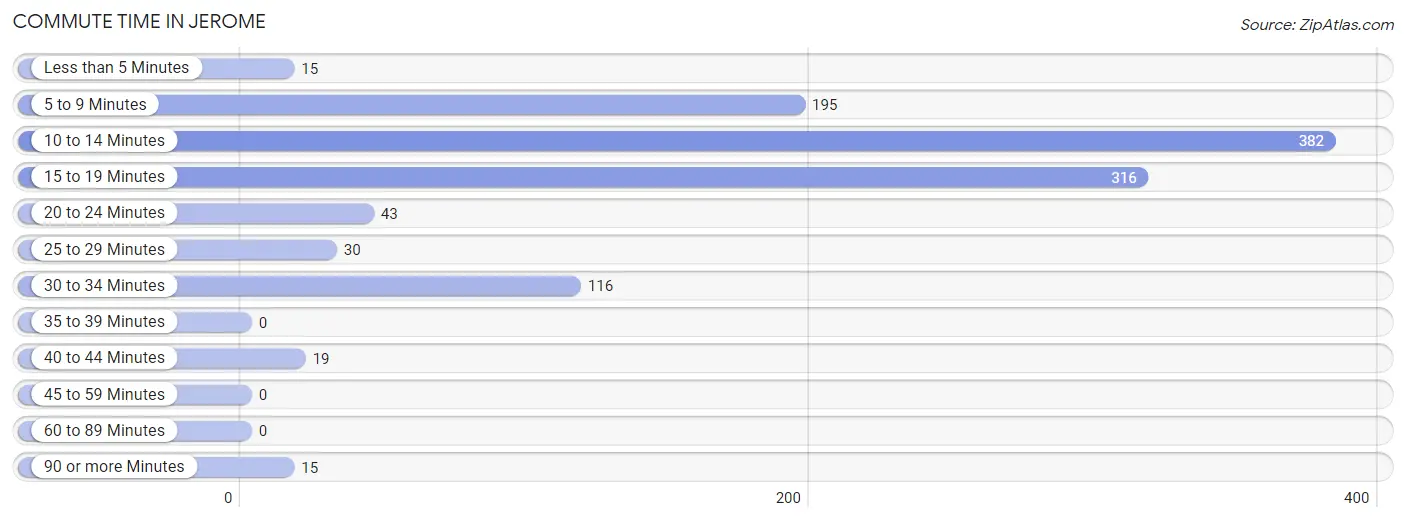
| Commute Time | # Commuters | % Commuters |
| Less than 5 Minutes | 15 | 1.3% |
| 5 to 9 Minutes | 195 | 17.2% |
| 10 to 14 Minutes | 382 | 33.8% |
| 15 to 19 Minutes | 316 | 27.9% |
| 20 to 24 Minutes | 43 | 3.8% |
| 25 to 29 Minutes | 30 | 2.6% |
| 30 to 34 Minutes | 116 | 10.3% |
| 35 to 39 Minutes | 0 | 0.0% |
| 40 to 44 Minutes | 19 | 1.7% |
| 45 to 59 Minutes | 0 | 0.0% |
| 60 to 89 Minutes | 0 | 0.0% |
| 90 or more Minutes | 15 | 1.3% |
Commute Time by Sex in Jerome
The most common commute times in Jerome are 10 to 14 minutes (129 commuters, 24.6%) for males and 10 to 14 minutes (253 commuters, 41.7%) for females.
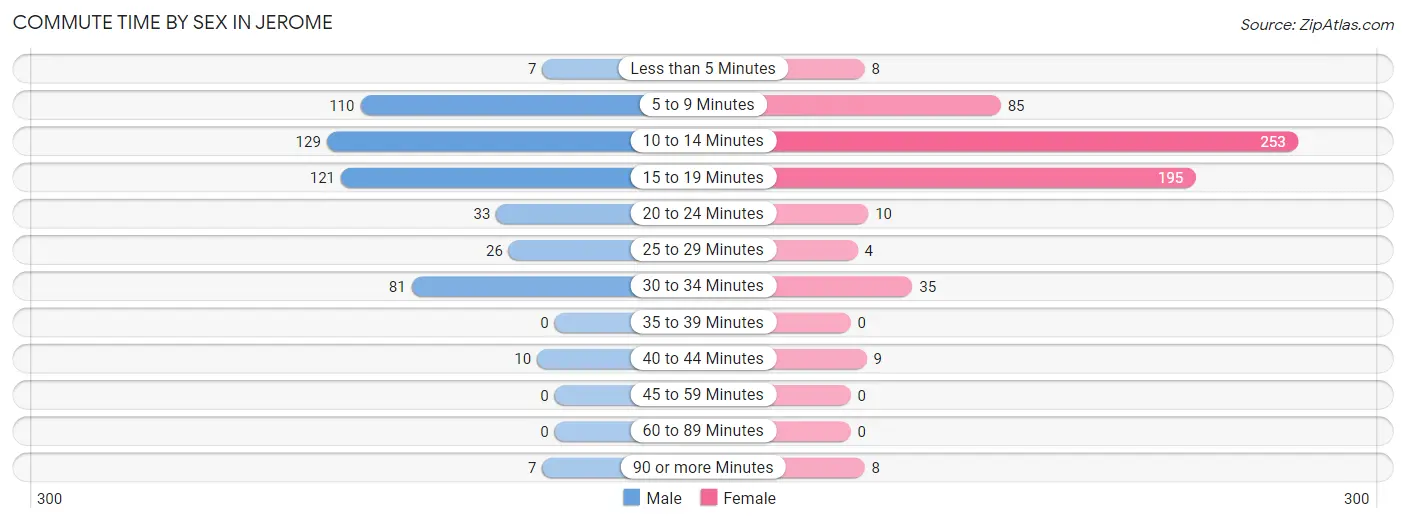
| Commute Time | Male | Female |
| Less than 5 Minutes | 7 (1.3%) | 8 (1.3%) |
| 5 to 9 Minutes | 110 (21.0%) | 85 (14.0%) |
| 10 to 14 Minutes | 129 (24.6%) | 253 (41.7%) |
| 15 to 19 Minutes | 121 (23.1%) | 195 (32.1%) |
| 20 to 24 Minutes | 33 (6.3%) | 10 (1.7%) |
| 25 to 29 Minutes | 26 (5.0%) | 4 (0.7%) |
| 30 to 34 Minutes | 81 (15.5%) | 35 (5.8%) |
| 35 to 39 Minutes | 0 (0.0%) | 0 (0.0%) |
| 40 to 44 Minutes | 10 (1.9%) | 9 (1.5%) |
| 45 to 59 Minutes | 0 (0.0%) | 0 (0.0%) |
| 60 to 89 Minutes | 0 (0.0%) | 0 (0.0%) |
| 90 or more Minutes | 7 (1.3%) | 8 (1.3%) |
Time of Departure to Work by Sex in Jerome
The most frequent times of departure to work in Jerome are 7:30 AM to 7:59 AM (97, 18.5%) for males and 8:00 AM to 8:29 AM (117, 19.3%) for females.
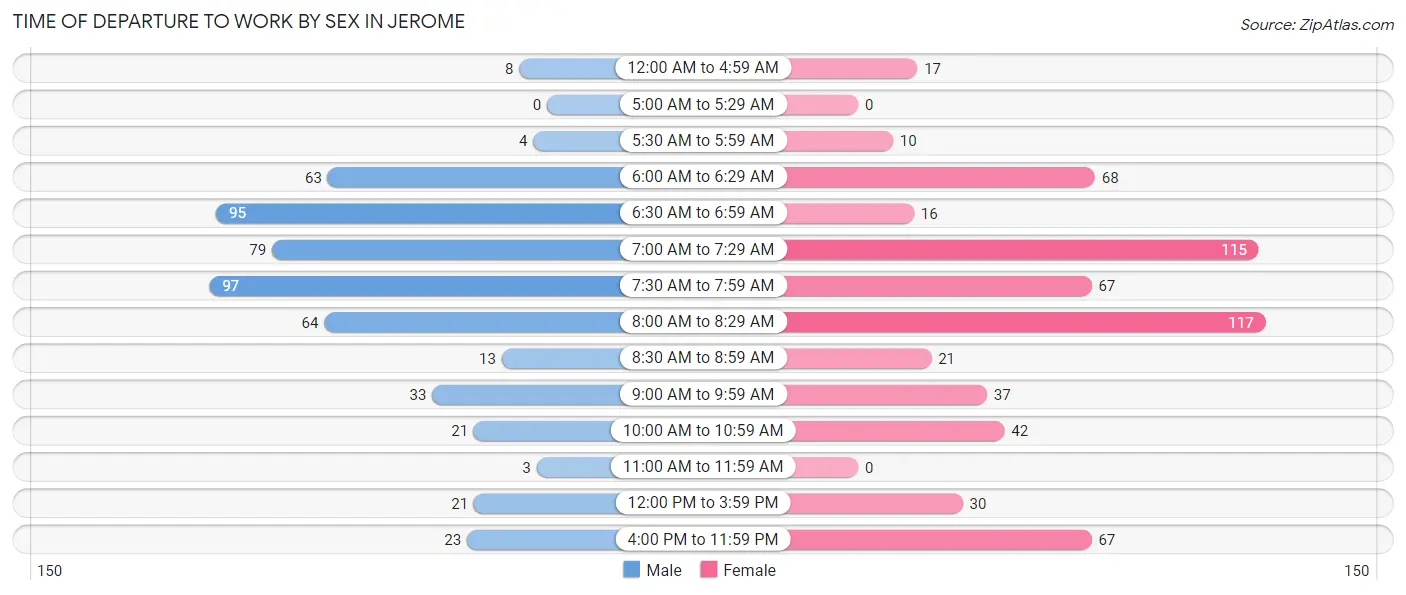
| Time of Departure | Male | Female |
| 12:00 AM to 4:59 AM | 8 (1.5%) | 17 (2.8%) |
| 5:00 AM to 5:29 AM | 0 (0.0%) | 0 (0.0%) |
| 5:30 AM to 5:59 AM | 4 (0.8%) | 10 (1.7%) |
| 6:00 AM to 6:29 AM | 63 (12.0%) | 68 (11.2%) |
| 6:30 AM to 6:59 AM | 95 (18.1%) | 16 (2.6%) |
| 7:00 AM to 7:29 AM | 79 (15.1%) | 115 (19.0%) |
| 7:30 AM to 7:59 AM | 97 (18.5%) | 67 (11.0%) |
| 8:00 AM to 8:29 AM | 64 (12.2%) | 117 (19.3%) |
| 8:30 AM to 8:59 AM | 13 (2.5%) | 21 (3.5%) |
| 9:00 AM to 9:59 AM | 33 (6.3%) | 37 (6.1%) |
| 10:00 AM to 10:59 AM | 21 (4.0%) | 42 (6.9%) |
| 11:00 AM to 11:59 AM | 3 (0.6%) | 0 (0.0%) |
| 12:00 PM to 3:59 PM | 21 (4.0%) | 30 (4.9%) |
| 4:00 PM to 11:59 PM | 23 (4.4%) | 67 (11.0%) |
| Total | 524 (100.0%) | 607 (100.0%) |
Housing Occupancy in Jerome
Occupancy by Ownership in Jerome
Of the total 1,061 dwellings in Jerome, owner-occupied units account for 725 (68.3%), while renter-occupied units make up 336 (31.7%).
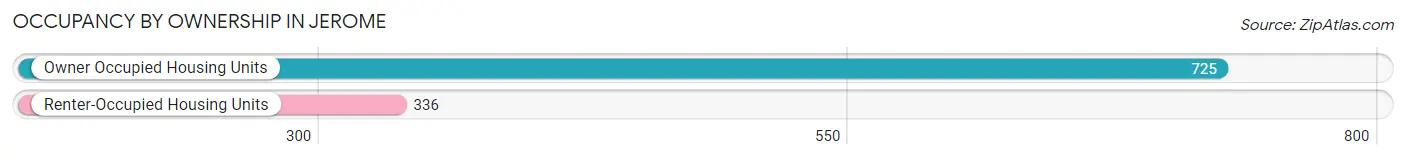
| Occupancy | # Housing Units | % Housing Units |
| Owner Occupied Housing Units | 725 | 68.3% |
| Renter-Occupied Housing Units | 336 | 31.7% |
| Total Occupied Housing Units | 1,061 | 100.0% |
Occupancy by Household Size in Jerome
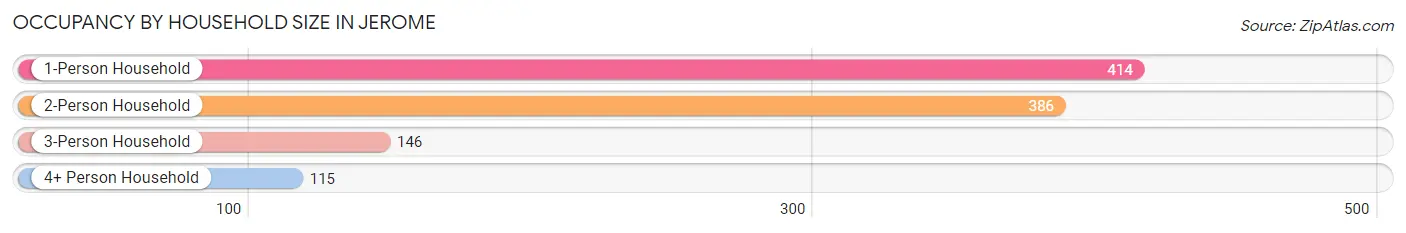
| Household Size | # Housing Units | % Housing Units |
| 1-Person Household | 414 | 39.0% |
| 2-Person Household | 386 | 36.4% |
| 3-Person Household | 146 | 13.8% |
| 4+ Person Household | 115 | 10.8% |
| Total Housing Units | 1,061 | 100.0% |
Occupancy by Ownership by Household Size in Jerome
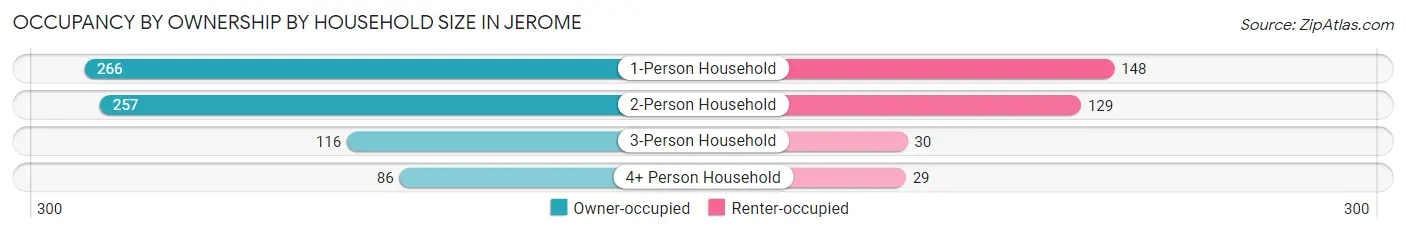
| Household Size | Owner-occupied | Renter-occupied |
| 1-Person Household | 266 (64.2%) | 148 (35.7%) |
| 2-Person Household | 257 (66.6%) | 129 (33.4%) |
| 3-Person Household | 116 (79.4%) | 30 (20.5%) |
| 4+ Person Household | 86 (74.8%) | 29 (25.2%) |
| Total Housing Units | 725 (68.3%) | 336 (31.7%) |
Occupancy by Educational Attainment in Jerome
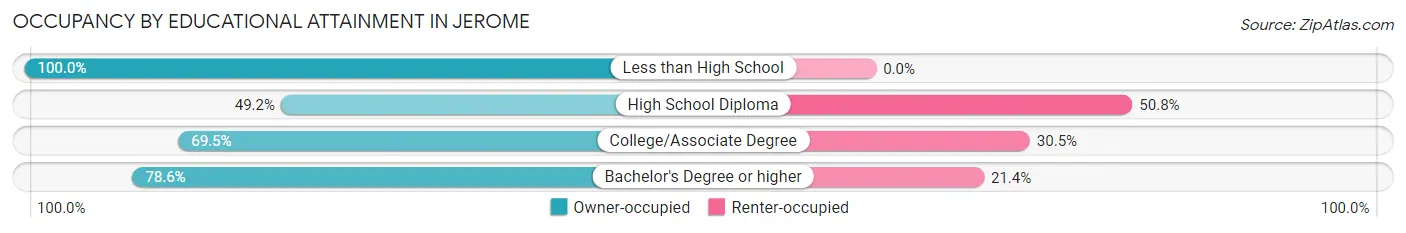
| Household Size | Owner-occupied | Renter-occupied |
| Less than High School | 18 (100.0%) | 0 (0.0%) |
| High School Diploma | 123 (49.2%) | 127 (50.8%) |
| College/Associate Degree | 301 (69.5%) | 132 (30.5%) |
| Bachelor's Degree or higher | 283 (78.6%) | 77 (21.4%) |
Occupancy by Age of Householder in Jerome
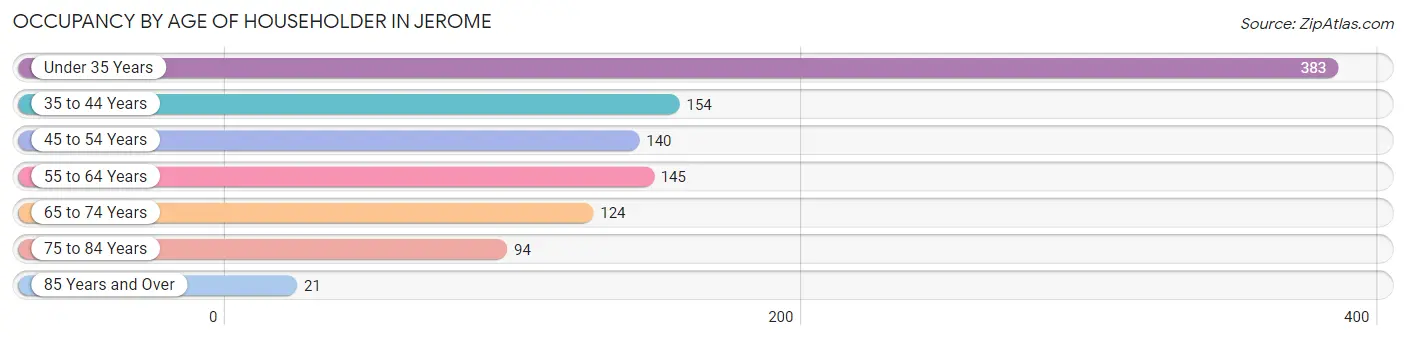
| Age Bracket | # Households | % Households |
| Under 35 Years | 383 | 36.1% |
| 35 to 44 Years | 154 | 14.5% |
| 45 to 54 Years | 140 | 13.2% |
| 55 to 64 Years | 145 | 13.7% |
| 65 to 74 Years | 124 | 11.7% |
| 75 to 84 Years | 94 | 8.9% |
| 85 Years and Over | 21 | 2.0% |
| Total | 1,061 | 100.0% |
Housing Finances in Jerome
Median Income by Occupancy in Jerome
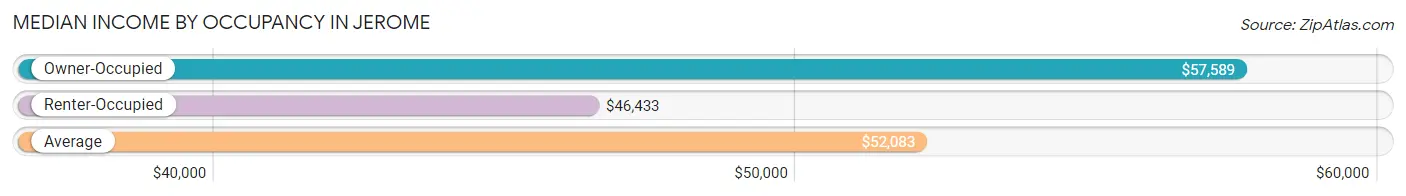
| Occupancy Type | # Households | Median Income |
| Owner-Occupied | 725 (68.3%) | $57,589 |
| Renter-Occupied | 336 (31.7%) | $46,433 |
| Average | 1,061 (100.0%) | $52,083 |
Occupancy by Householder Income Bracket in Jerome
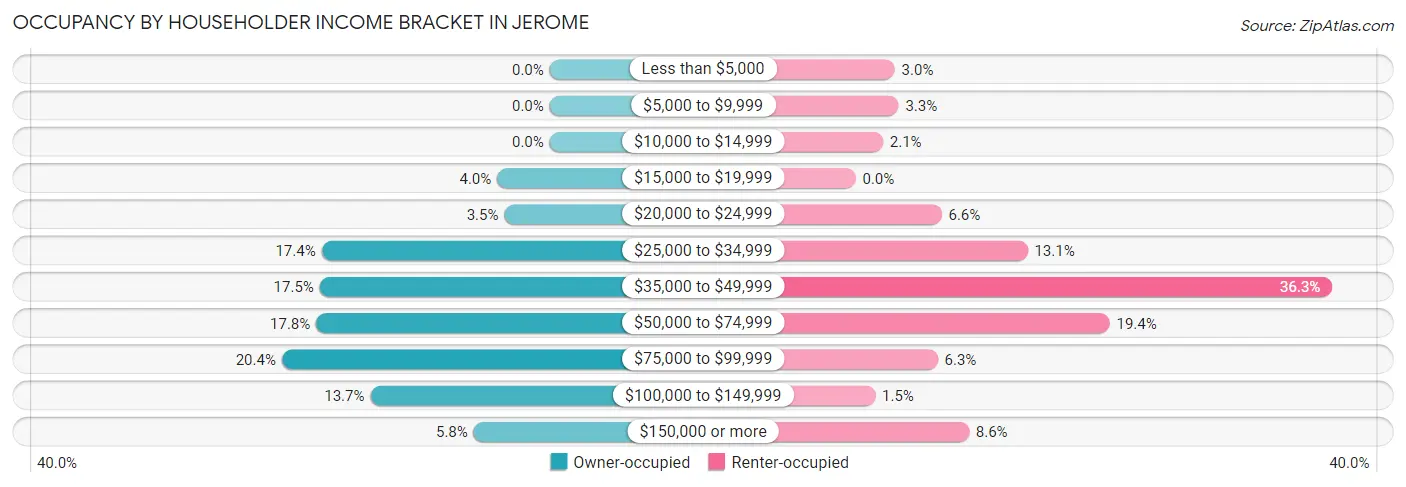
| Income Bracket | Owner-occupied | Renter-occupied |
| Less than $5,000 | 0 (0.0%) | 10 (3.0%) |
| $5,000 to $9,999 | 0 (0.0%) | 11 (3.3%) |
| $10,000 to $14,999 | 0 (0.0%) | 7 (2.1%) |
| $15,000 to $19,999 | 29 (4.0%) | 0 (0.0%) |
| $20,000 to $24,999 | 25 (3.5%) | 22 (6.6%) |
| $25,000 to $34,999 | 126 (17.4%) | 44 (13.1%) |
| $35,000 to $49,999 | 127 (17.5%) | 122 (36.3%) |
| $50,000 to $74,999 | 129 (17.8%) | 65 (19.4%) |
| $75,000 to $99,999 | 148 (20.4%) | 21 (6.2%) |
| $100,000 to $149,999 | 99 (13.7%) | 5 (1.5%) |
| $150,000 or more | 42 (5.8%) | 29 (8.6%) |
| Total | 725 (100.0%) | 336 (100.0%) |
Monthly Housing Cost Tiers in Jerome
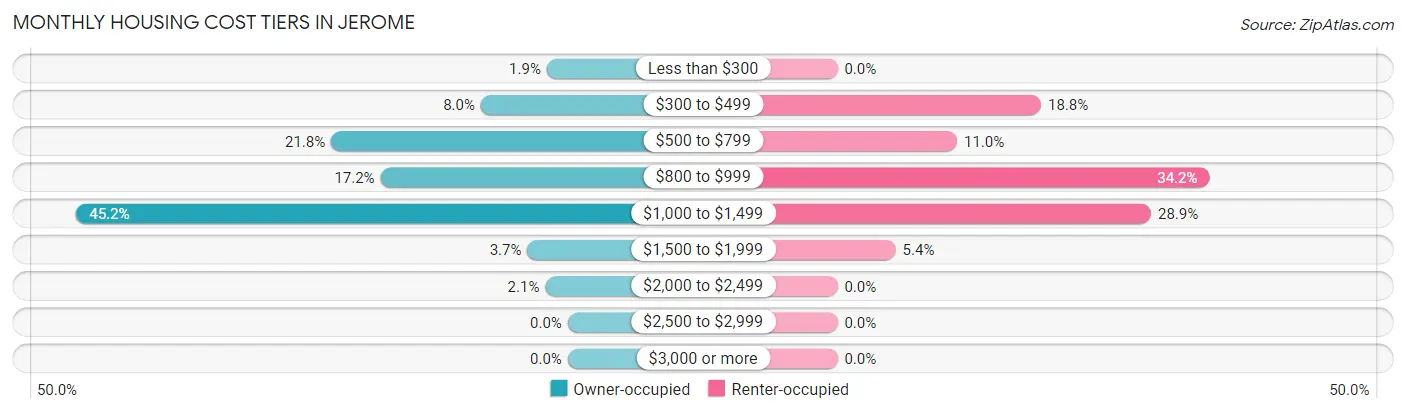
| Monthly Cost | Owner-occupied | Renter-occupied |
| Less than $300 | 14 (1.9%) | 0 (0.0%) |
| $300 to $499 | 58 (8.0%) | 63 (18.8%) |
| $500 to $799 | 158 (21.8%) | 37 (11.0%) |
| $800 to $999 | 125 (17.2%) | 115 (34.2%) |
| $1,000 to $1,499 | 328 (45.2%) | 97 (28.9%) |
| $1,500 to $1,999 | 27 (3.7%) | 18 (5.4%) |
| $2,000 to $2,499 | 15 (2.1%) | 0 (0.0%) |
| $2,500 to $2,999 | 0 (0.0%) | 0 (0.0%) |
| $3,000 or more | 0 (0.0%) | 0 (0.0%) |
| Total | 725 (100.0%) | 336 (100.0%) |
Physical Housing Characteristics in Jerome
Housing Structures in Jerome
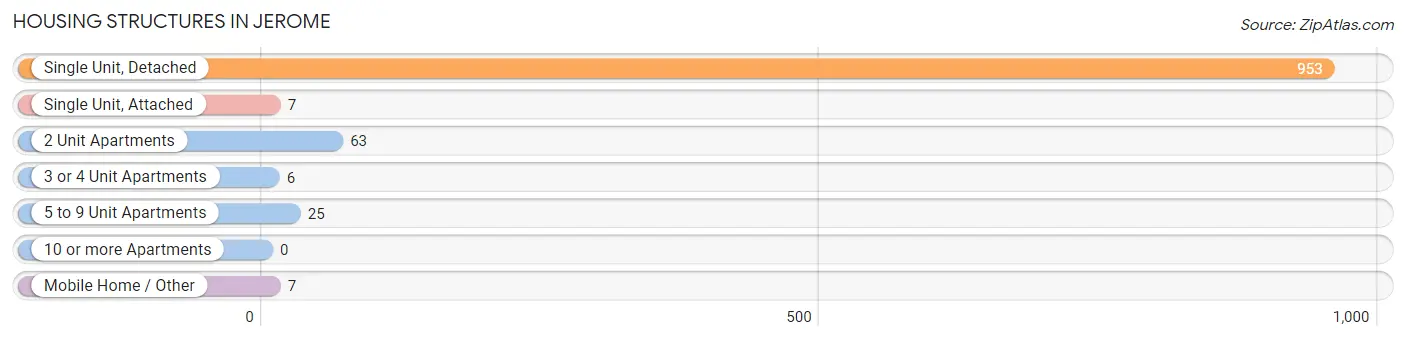
| Structure Type | # Housing Units | % Housing Units |
| Single Unit, Detached | 953 | 89.8% |
| Single Unit, Attached | 7 | 0.7% |
| 2 Unit Apartments | 63 | 5.9% |
| 3 or 4 Unit Apartments | 6 | 0.6% |
| 5 to 9 Unit Apartments | 25 | 2.4% |
| 10 or more Apartments | 0 | 0.0% |
| Mobile Home / Other | 7 | 0.7% |
| Total | 1,061 | 100.0% |
Housing Structures by Occupancy in Jerome
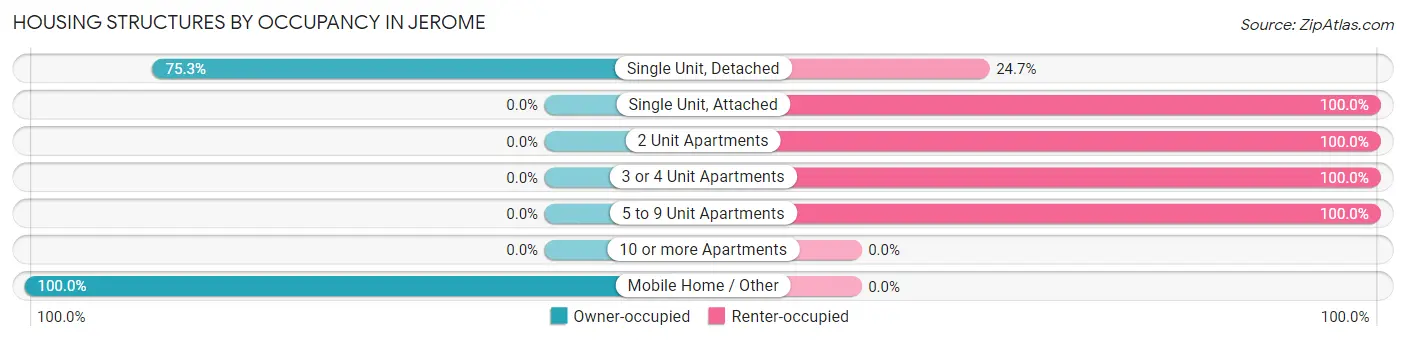
| Structure Type | Owner-occupied | Renter-occupied |
| Single Unit, Detached | 718 (75.3%) | 235 (24.7%) |
| Single Unit, Attached | 0 (0.0%) | 7 (100.0%) |
| 2 Unit Apartments | 0 (0.0%) | 63 (100.0%) |
| 3 or 4 Unit Apartments | 0 (0.0%) | 6 (100.0%) |
| 5 to 9 Unit Apartments | 0 (0.0%) | 25 (100.0%) |
| 10 or more Apartments | 0 (0.0%) | 0 (0.0%) |
| Mobile Home / Other | 7 (100.0%) | 0 (0.0%) |
| Total | 725 (68.3%) | 336 (31.7%) |
Housing Structures by Number of Rooms in Jerome
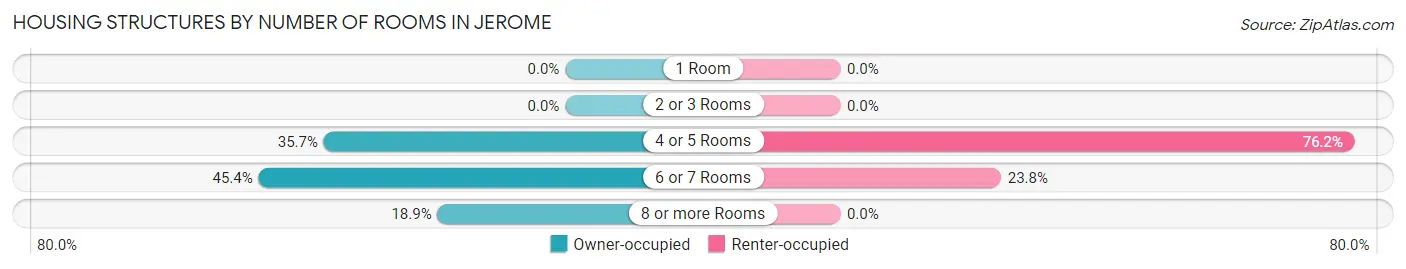
| Number of Rooms | Owner-occupied | Renter-occupied |
| 1 Room | 0 (0.0%) | 0 (0.0%) |
| 2 or 3 Rooms | 0 (0.0%) | 0 (0.0%) |
| 4 or 5 Rooms | 259 (35.7%) | 256 (76.2%) |
| 6 or 7 Rooms | 329 (45.4%) | 80 (23.8%) |
| 8 or more Rooms | 137 (18.9%) | 0 (0.0%) |
| Total | 725 (100.0%) | 336 (100.0%) |
Housing Structure by Heating Type in Jerome
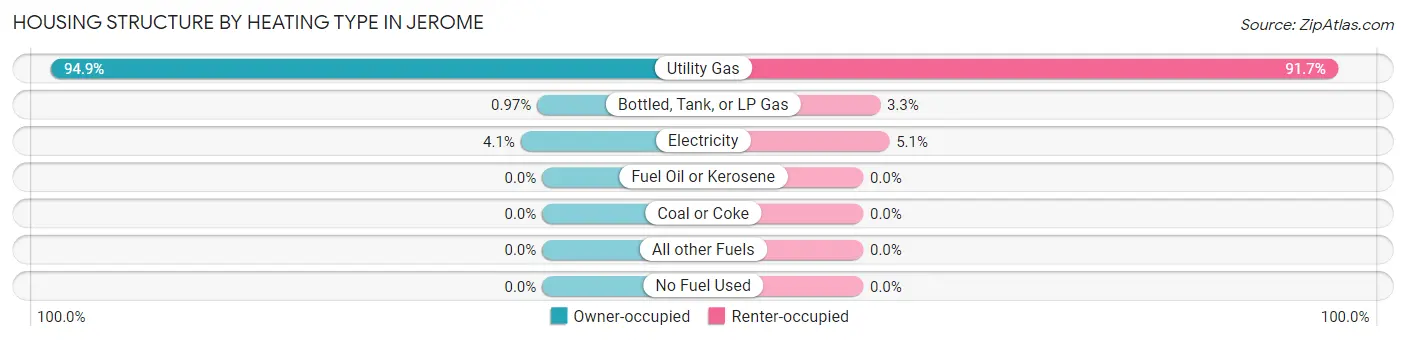
| Heating Type | Owner-occupied | Renter-occupied |
| Utility Gas | 688 (94.9%) | 308 (91.7%) |
| Bottled, Tank, or LP Gas | 7 (1.0%) | 11 (3.3%) |
| Electricity | 30 (4.1%) | 17 (5.1%) |
| Fuel Oil or Kerosene | 0 (0.0%) | 0 (0.0%) |
| Coal or Coke | 0 (0.0%) | 0 (0.0%) |
| All other Fuels | 0 (0.0%) | 0 (0.0%) |
| No Fuel Used | 0 (0.0%) | 0 (0.0%) |
| Total | 725 (100.0%) | 336 (100.0%) |
Household Vehicle Usage in Jerome
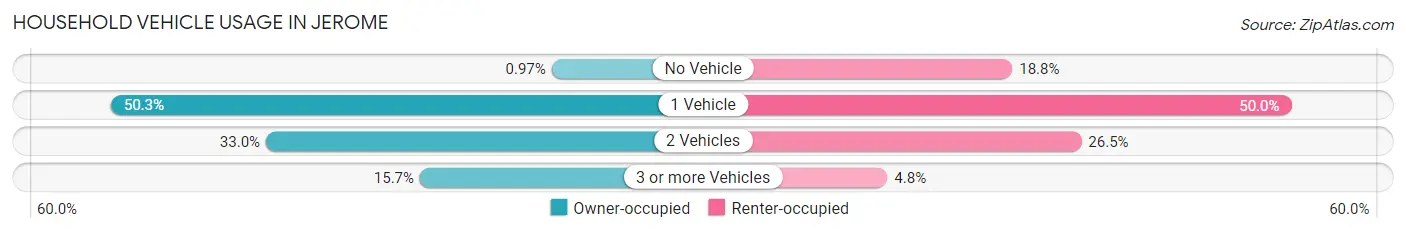
| Vehicles per Household | Owner-occupied | Renter-occupied |
| No Vehicle | 7 (1.0%) | 63 (18.8%) |
| 1 Vehicle | 365 (50.3%) | 168 (50.0%) |
| 2 Vehicles | 239 (33.0%) | 89 (26.5%) |
| 3 or more Vehicles | 114 (15.7%) | 16 (4.8%) |
| Total | 725 (100.0%) | 336 (100.0%) |
Real Estate & Mortgages in Jerome
Real Estate and Mortgage Overview in Jerome
| Characteristic | Without Mortgage | With Mortgage |
| Housing Units | 205 | 520 |
| Median Property Value | $114,400 | $115,100 |
| Median Household Income | $65,125 | $38 |
| Monthly Housing Costs | $548 | $0 |
| Real Estate Taxes | $2,347 | $5 |
Property Value by Mortgage Status in Jerome
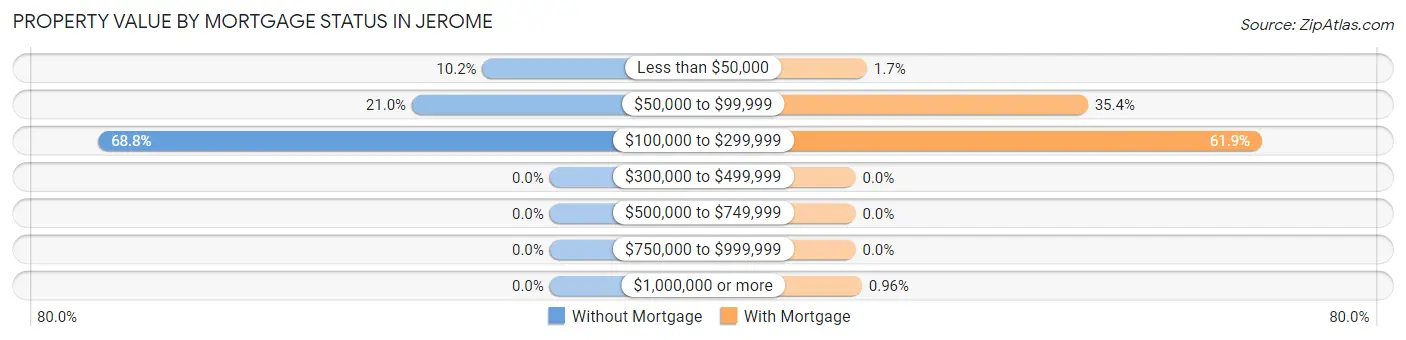
| Property Value | Without Mortgage | With Mortgage |
| Less than $50,000 | 21 (10.2%) | 9 (1.7%) |
| $50,000 to $99,999 | 43 (21.0%) | 184 (35.4%) |
| $100,000 to $299,999 | 141 (68.8%) | 322 (61.9%) |
| $300,000 to $499,999 | 0 (0.0%) | 0 (0.0%) |
| $500,000 to $749,999 | 0 (0.0%) | 0 (0.0%) |
| $750,000 to $999,999 | 0 (0.0%) | 0 (0.0%) |
| $1,000,000 or more | 0 (0.0%) | 5 (1.0%) |
| Total | 205 (100.0%) | 520 (100.0%) |
Household Income by Mortgage Status in Jerome
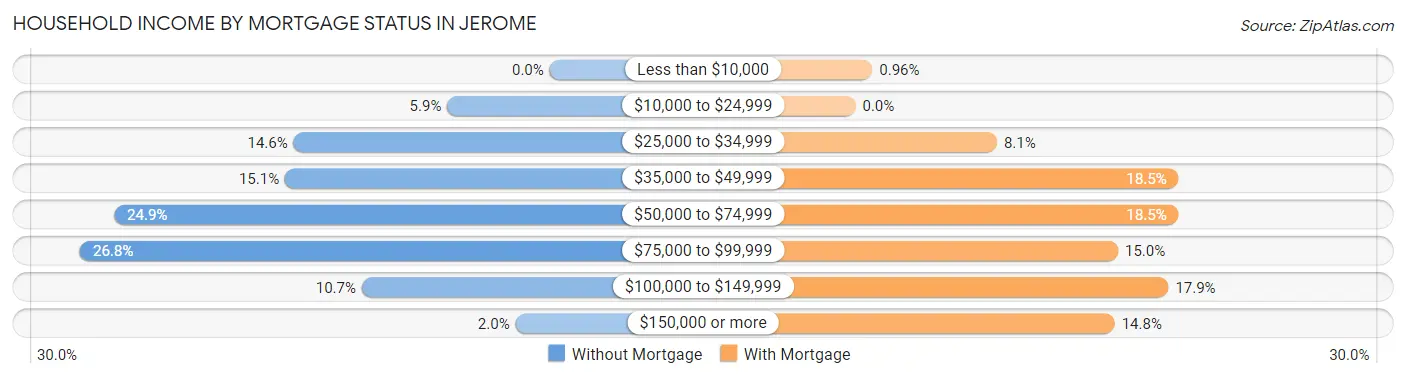
| Household Income | Without Mortgage | With Mortgage |
| Less than $10,000 | 0 (0.0%) | 5 (1.0%) |
| $10,000 to $24,999 | 12 (5.9%) | 0 (0.0%) |
| $25,000 to $34,999 | 30 (14.6%) | 42 (8.1%) |
| $35,000 to $49,999 | 31 (15.1%) | 96 (18.5%) |
| $50,000 to $74,999 | 51 (24.9%) | 96 (18.5%) |
| $75,000 to $99,999 | 55 (26.8%) | 78 (15.0%) |
| $100,000 to $149,999 | 22 (10.7%) | 93 (17.9%) |
| $150,000 or more | 4 (1.9%) | 77 (14.8%) |
| Total | 205 (100.0%) | 520 (100.0%) |
Property Value to Household Income Ratio in Jerome
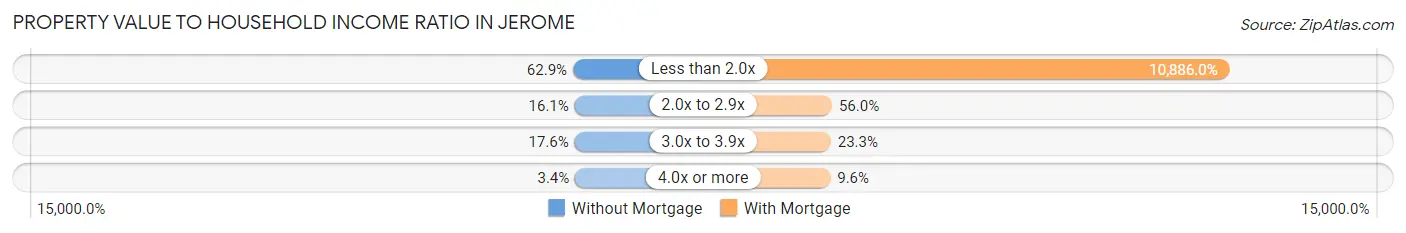
| Value-to-Income Ratio | Without Mortgage | With Mortgage |
| Less than 2.0x | 129 (62.9%) | 56,607 (10,886.0%) |
| 2.0x to 2.9x | 33 (16.1%) | 291 (56.0%) |
| 3.0x to 3.9x | 36 (17.6%) | 121 (23.3%) |
| 4.0x or more | 7 (3.4%) | 50 (9.6%) |
| Total | 205 (100.0%) | 520 (100.0%) |
Real Estate Taxes by Mortgage Status in Jerome
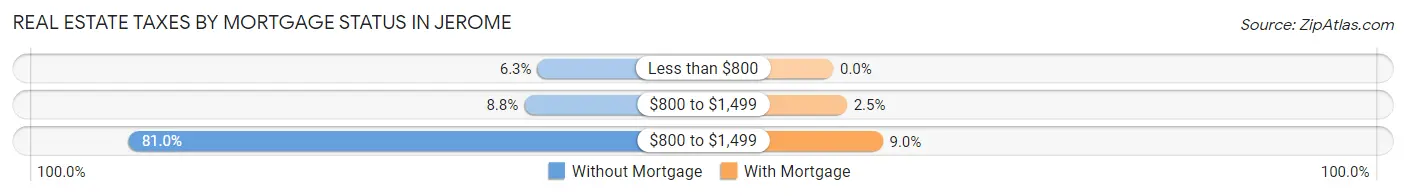
| Property Taxes | Without Mortgage | With Mortgage |
| Less than $800 | 13 (6.3%) | 0 (0.0%) |
| $800 to $1,499 | 18 (8.8%) | 13 (2.5%) |
| $800 to $1,499 | 166 (81.0%) | 47 (9.0%) |
| Total | 205 (100.0%) | 520 (100.0%) |
Health & Disability in Jerome
Health Insurance Coverage by Age in Jerome
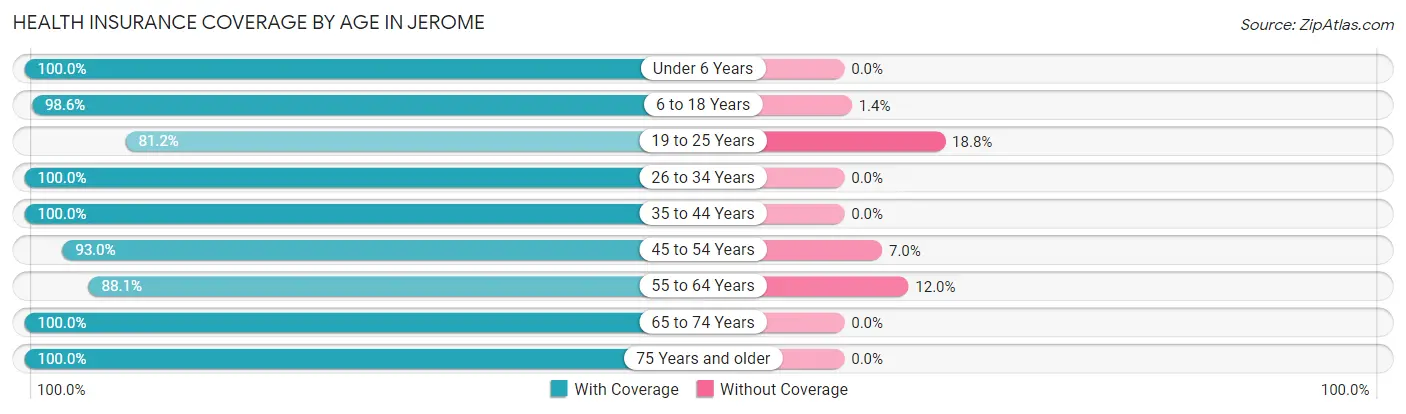
| Age Bracket | With Coverage | Without Coverage |
| Under 6 Years | 123 (100.0%) | 0 (0.0%) |
| 6 to 18 Years | 428 (98.6%) | 6 (1.4%) |
| 19 to 25 Years | 246 (81.2%) | 57 (18.8%) |
| 26 to 34 Years | 395 (100.0%) | 0 (0.0%) |
| 35 to 44 Years | 199 (100.0%) | 0 (0.0%) |
| 45 to 54 Years | 185 (93.0%) | 14 (7.0%) |
| 55 to 64 Years | 199 (88.0%) | 27 (11.9%) |
| 65 to 74 Years | 188 (100.0%) | 0 (0.0%) |
| 75 Years and older | 127 (100.0%) | 0 (0.0%) |
| Total | 2,090 (95.3%) | 104 (4.7%) |
Health Insurance Coverage by Citizenship Status in Jerome
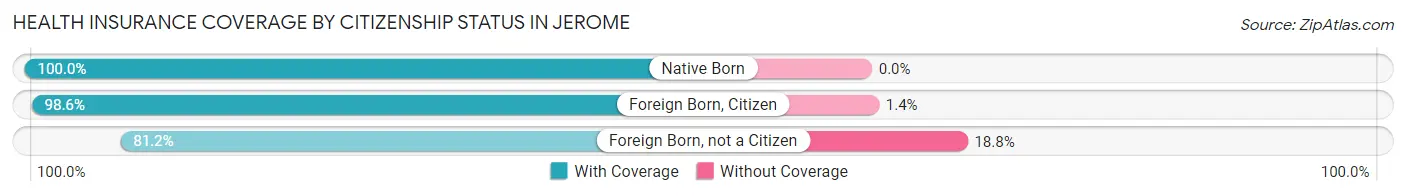
| Citizenship Status | With Coverage | Without Coverage |
| Native Born | 123 (100.0%) | 0 (0.0%) |
| Foreign Born, Citizen | 428 (98.6%) | 6 (1.4%) |
| Foreign Born, not a Citizen | 246 (81.2%) | 57 (18.8%) |
Health Insurance Coverage by Household Income in Jerome
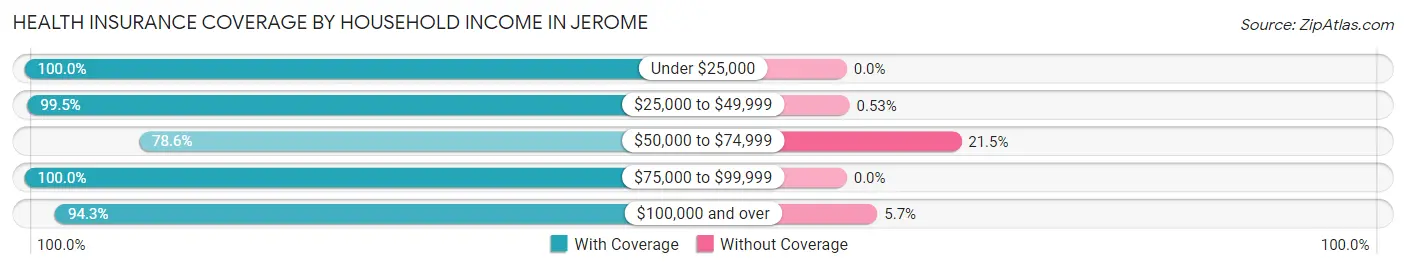
| Household Income | With Coverage | Without Coverage |
| Under $25,000 | 207 (100.0%) | 0 (0.0%) |
| $25,000 to $49,999 | 747 (99.5%) | 4 (0.5%) |
| $50,000 to $74,999 | 260 (78.5%) | 71 (21.4%) |
| $75,000 to $99,999 | 398 (100.0%) | 0 (0.0%) |
| $100,000 and over | 478 (94.3%) | 29 (5.7%) |
Public vs Private Health Insurance Coverage by Age in Jerome
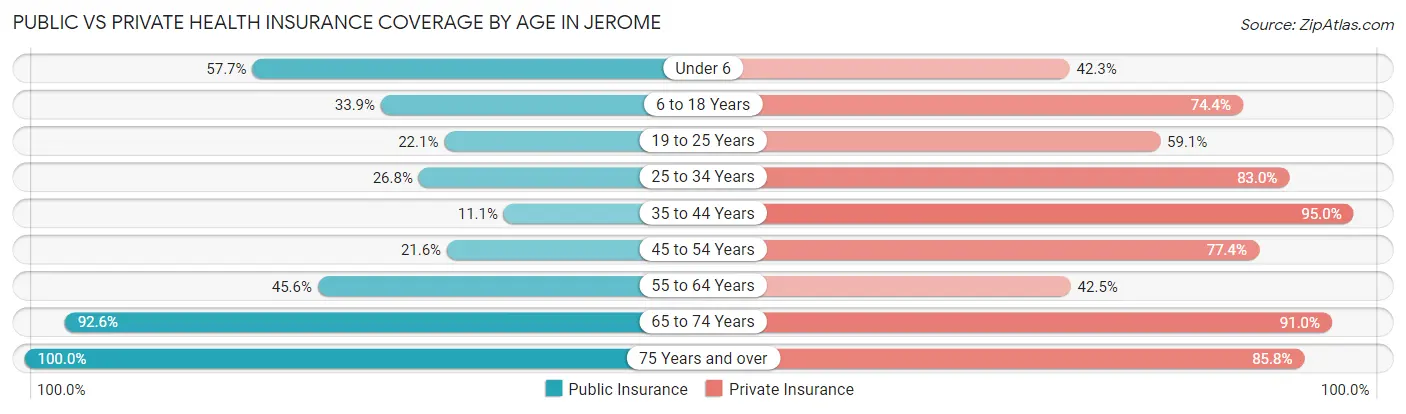
| Age Bracket | Public Insurance | Private Insurance |
| Under 6 | 71 (57.7%) | 52 (42.3%) |
| 6 to 18 Years | 147 (33.9%) | 323 (74.4%) |
| 19 to 25 Years | 67 (22.1%) | 179 (59.1%) |
| 25 to 34 Years | 106 (26.8%) | 328 (83.0%) |
| 35 to 44 Years | 22 (11.1%) | 189 (95.0%) |
| 45 to 54 Years | 43 (21.6%) | 154 (77.4%) |
| 55 to 64 Years | 103 (45.6%) | 96 (42.5%) |
| 65 to 74 Years | 174 (92.5%) | 171 (91.0%) |
| 75 Years and over | 127 (100.0%) | 109 (85.8%) |
| Total | 860 (39.2%) | 1,601 (73.0%) |
Disability Status by Sex by Age in Jerome
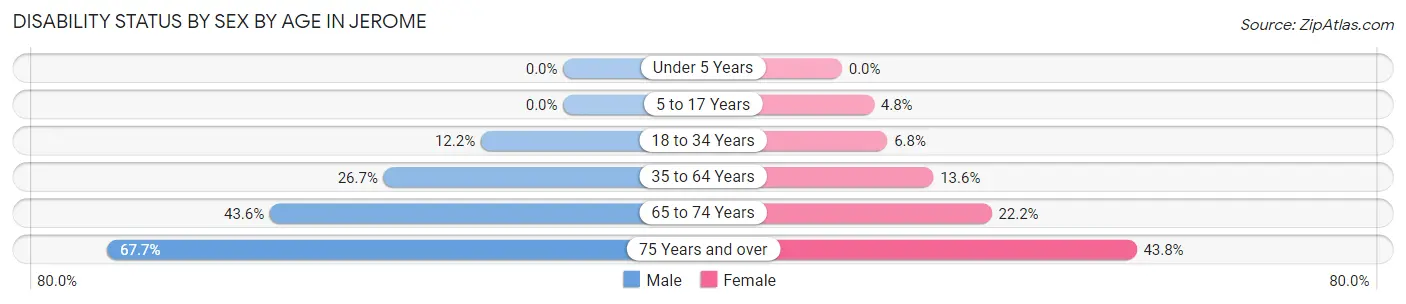
| Age Bracket | Male | Female |
| Under 5 Years | 0 (0.0%) | 0 (0.0%) |
| 5 to 17 Years | 0 (0.0%) | 7 (4.8%) |
| 18 to 34 Years | 34 (12.2%) | 31 (6.8%) |
| 35 to 64 Years | 80 (26.7%) | 44 (13.6%) |
| 65 to 74 Years | 27 (43.5%) | 28 (22.2%) |
| 75 Years and over | 21 (67.7%) | 42 (43.8%) |
Disability Class by Sex by Age in Jerome
Disability Class: Hearing Difficulty
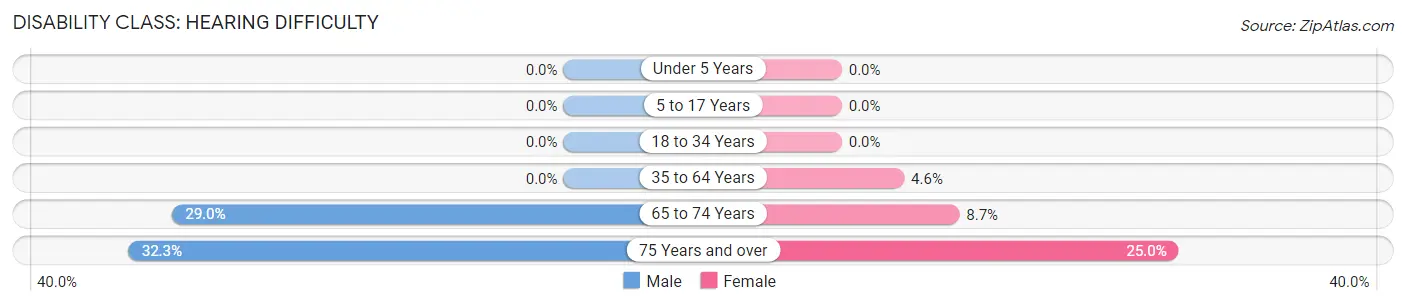
| Age Bracket | Male | Female |
| Under 5 Years | 0 (0.0%) | 0 (0.0%) |
| 5 to 17 Years | 0 (0.0%) | 0 (0.0%) |
| 18 to 34 Years | 0 (0.0%) | 0 (0.0%) |
| 35 to 64 Years | 0 (0.0%) | 15 (4.6%) |
| 65 to 74 Years | 18 (29.0%) | 11 (8.7%) |
| 75 Years and over | 10 (32.3%) | 24 (25.0%) |
Disability Class: Vision Difficulty
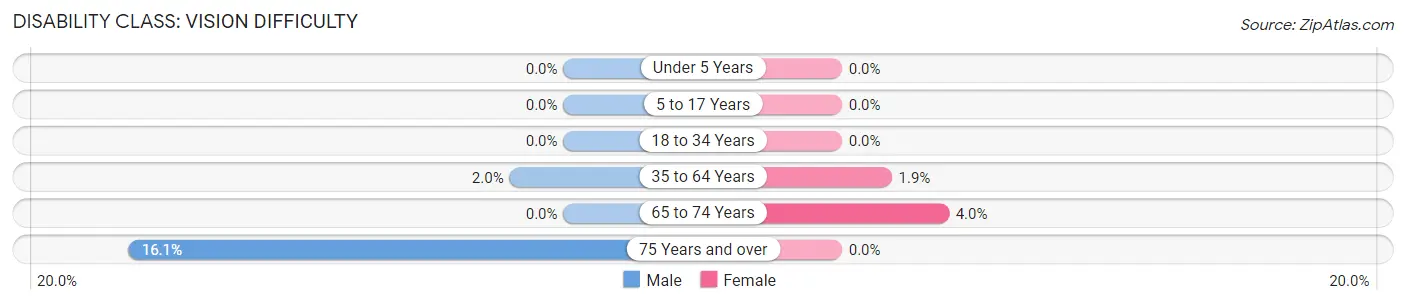
| Age Bracket | Male | Female |
| Under 5 Years | 0 (0.0%) | 0 (0.0%) |
| 5 to 17 Years | 0 (0.0%) | 0 (0.0%) |
| 18 to 34 Years | 0 (0.0%) | 0 (0.0%) |
| 35 to 64 Years | 6 (2.0%) | 6 (1.8%) |
| 65 to 74 Years | 0 (0.0%) | 5 (4.0%) |
| 75 Years and over | 5 (16.1%) | 0 (0.0%) |
Disability Class: Cognitive Difficulty
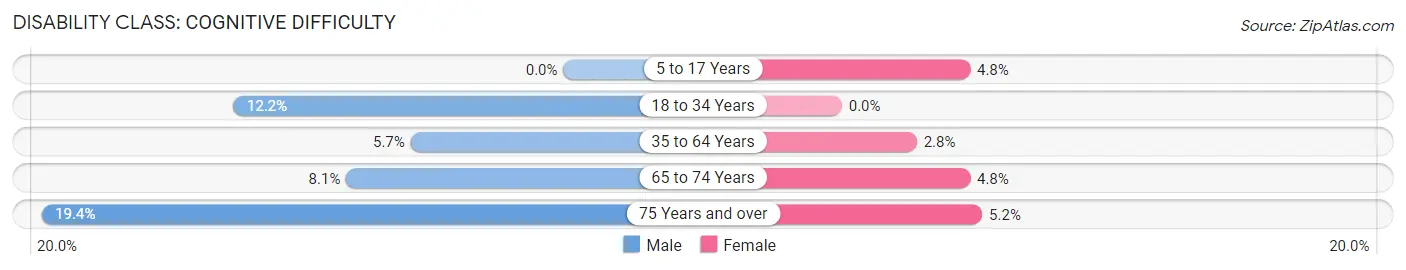
| Age Bracket | Male | Female |
| 5 to 17 Years | 0 (0.0%) | 7 (4.8%) |
| 18 to 34 Years | 34 (12.2%) | 0 (0.0%) |
| 35 to 64 Years | 17 (5.7%) | 9 (2.8%) |
| 65 to 74 Years | 5 (8.1%) | 6 (4.8%) |
| 75 Years and over | 6 (19.4%) | 5 (5.2%) |
Disability Class: Ambulatory Difficulty
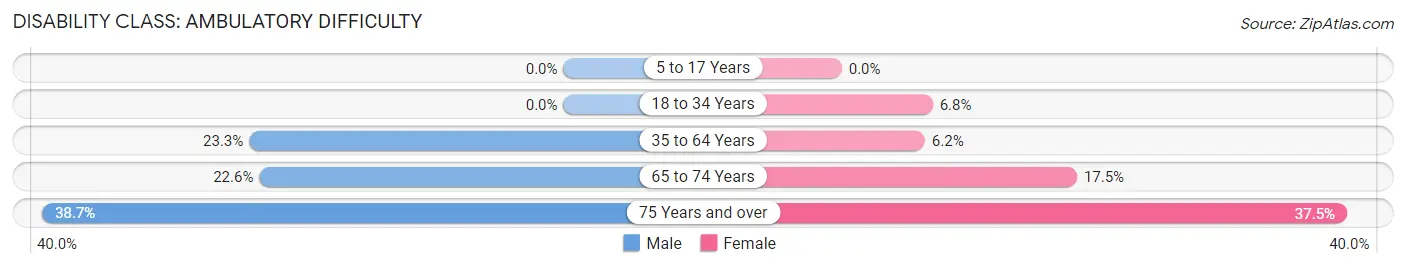
| Age Bracket | Male | Female |
| 5 to 17 Years | 0 (0.0%) | 0 (0.0%) |
| 18 to 34 Years | 0 (0.0%) | 31 (6.8%) |
| 35 to 64 Years | 70 (23.3%) | 20 (6.2%) |
| 65 to 74 Years | 14 (22.6%) | 22 (17.5%) |
| 75 Years and over | 12 (38.7%) | 36 (37.5%) |
Disability Class: Self-Care Difficulty
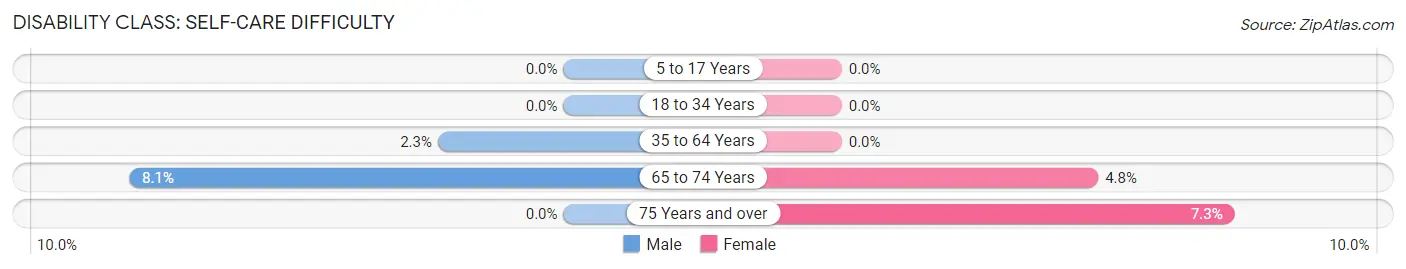
| Age Bracket | Male | Female |
| 5 to 17 Years | 0 (0.0%) | 0 (0.0%) |
| 18 to 34 Years | 0 (0.0%) | 0 (0.0%) |
| 35 to 64 Years | 7 (2.3%) | 0 (0.0%) |
| 65 to 74 Years | 5 (8.1%) | 6 (4.8%) |
| 75 Years and over | 0 (0.0%) | 7 (7.3%) |
Technology Access in Jerome
Computing Device Access in Jerome
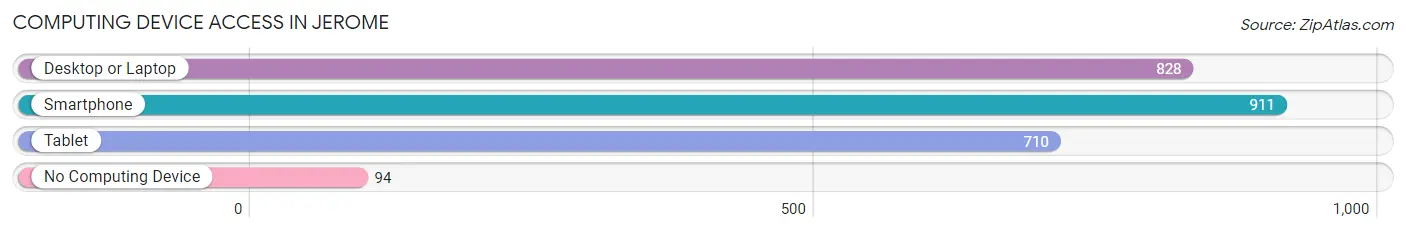
| Device Type | # Households | % Households |
| Desktop or Laptop | 828 | 78.0% |
| Smartphone | 911 | 85.9% |
| Tablet | 710 | 66.9% |
| No Computing Device | 94 | 8.9% |
| Total | 1,061 | 100.0% |
Internet Access in Jerome
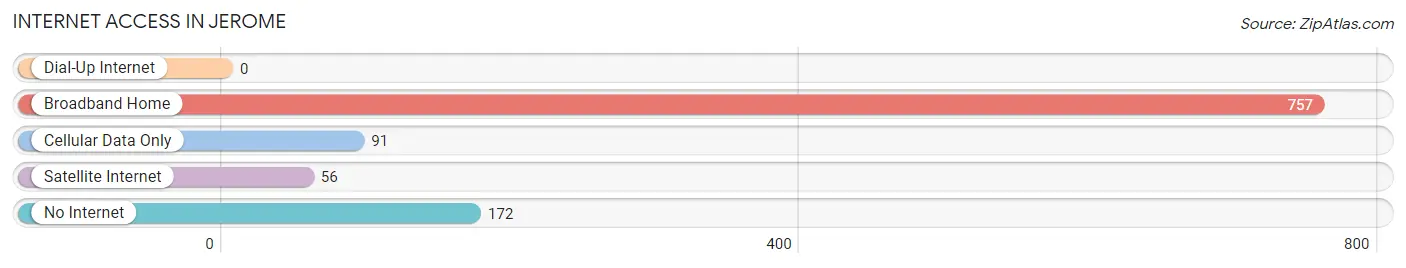
| Internet Type | # Households | % Households |
| Dial-Up Internet | 0 | 0.0% |
| Broadband Home | 757 | 71.4% |
| Cellular Data Only | 91 | 8.6% |
| Satellite Internet | 56 | 5.3% |
| No Internet | 172 | 16.2% |
| Total | 1,061 | 100.0% |
Jerome Summary
Jerome, Illinois is a small village located in the northern part of the state, in the county of Macon. It is situated on the banks of the Sangamon River, and is part of the Decatur Metropolitan Statistical Area. The village has a population of just over 1,000 people, and is known for its rural charm and small-town atmosphere.
History
The area that is now Jerome was first settled in the early 1800s by a group of settlers from Kentucky. The village was originally known as “Mud Creek”, and was later renamed after the first postmaster, Jerome B. Smith. The village was officially incorporated in 1867.
In the late 1800s, Jerome was a thriving agricultural community, with a variety of crops being grown in the area. The village was also home to a number of businesses, including a flour mill, a sawmill, a blacksmith shop, and a general store.
In the early 1900s, the village began to experience a decline in population, as many of the residents moved away in search of better economic opportunities. However, the village was able to remain relatively stable throughout the 20th century, and today it is still a small, rural community.
Geography
Jerome is located in the northern part of the state, in the county of Macon. It is situated on the banks of the Sangamon River, and is part of the Decatur Metropolitan Statistical Area. The village has a total area of 0.7 square miles, all of which is land.
The village is located in a rural area, and is surrounded by farmland and wooded areas. The nearest major city is Decatur, which is located about 20 miles to the south.
Economy
The economy of Jerome is largely based on agriculture. The village is home to a number of farms, which produce a variety of crops, including corn, soybeans, and wheat. The village also has a number of small businesses, including a grocery store, a hardware store, and a few restaurants.
Demographics
As of the 2010 census, the population of Jerome was 1,072. The racial makeup of the village was 97.3% White, 0.7% African American, 0.3% Native American, 0.2% Asian, and 1.5% from other races. The median household income was $41,250, and the median family income was $50,000.
The village has a relatively low crime rate, and is considered to be a safe place to live. The village is served by the Macon County Sheriff’s Office, and the Macon County Fire Department.
Conclusion
Jerome, Illinois is a small village located in the northern part of the state, in the county of Macon. It is situated on the banks of the Sangamon River, and is part of the Decatur Metropolitan Statistical Area. The village has a population of just over 1,000 people, and is known for its rural charm and small-town atmosphere. The economy of Jerome is largely based on agriculture, and the village is home to a number of farms, which produce a variety of crops. The village also has a number of small businesses, including a grocery store, a hardware store, and a few restaurants. The village has a relatively low crime rate, and is considered to be a safe place to live.
Common Questions
What is Per Capita Income in Jerome?
Per Capita income in Jerome is $32,579.
What is the Median Family Income in Jerome?
Median Family Income in Jerome is $66,154.
What is the Median Household income in Jerome?
Median Household Income in Jerome is $52,083.
What is Income or Wage Gap in Jerome?
Income or Wage Gap in Jerome is 15.3%.
Women in Jerome earn 84.7 cents for every dollar earned by a man.
What is Inequality or Gini Index in Jerome?
Inequality or Gini Index in Jerome is 0.36.
What is the Total Population of Jerome?
Total Population of Jerome is 2,194.
What is the Total Male Population of Jerome?
Total Male Population of Jerome is 976.
What is the Total Female Population of Jerome?
Total Female Population of Jerome is 1,218.
What is the Ratio of Males per 100 Females in Jerome?
There are 80.13 Males per 100 Females in Jerome.
What is the Ratio of Females per 100 Males in Jerome?
There are 124.80 Females per 100 Males in Jerome.
What is the Median Population Age in Jerome?
Median Population Age in Jerome is 32.5 Years.
What is the Average Family Size in Jerome
Average Family Size in Jerome is 2.8 People.
What is the Average Household Size in Jerome
Average Household Size in Jerome is 2.1 People.
How Large is the Labor Force in Jerome?
There are 1,230 People in the Labor Forcein in Jerome.
What is the Percentage of People in the Labor Force in Jerome?
72.5% of People are in the Labor Force in Jerome.
What is the Unemployment Rate in Jerome?
Unemployment Rate in Jerome is 2.0%.