Pingree Grove, IL Map & Demographics
Pingree Grove Map
Pingree Grove Overview
$51,430
PER CAPITA INCOME
$112,332
AVG FAMILY INCOME
$106,597
AVG HOUSEHOLD INCOME
37.2%
WAGE / INCOME GAP [ % ]
62.8¢/ $1
WAGE / INCOME GAP [ $ ]
0.44
INEQUALITY / GINI INDEX
10,213
TOTAL POPULATION
5,521
MALE POPULATION
4,692
FEMALE POPULATION
117.67
MALES / 100 FEMALES
84.98
FEMALES / 100 MALES
36.9
MEDIAN AGE
3.4
AVG FAMILY SIZE
3.0
AVG HOUSEHOLD SIZE
5,441
LABOR FORCE [ PEOPLE ]
72.6%
PERCENT IN LABOR FORCE
3.5%
UNEMPLOYMENT RATE
Income in Pingree Grove
Income Overview in Pingree Grove
Per Capita Income in Pingree Grove is $51,430, while median incomes of families and households are $112,332 and $106,597 respectively.
| Characteristic | Number | Measure |
| Per Capita Income | 10,213 | $51,430 |
| Median Family Income | 2,742 | $112,332 |
| Mean Family Income | 2,742 | $160,187 |
| Median Household Income | 3,412 | $106,597 |
| Mean Household Income | 3,412 | $146,227 |
| Income Deficit | 2,742 | $0 |
| Wage / Income Gap (%) | 10,213 | 37.18% |
| Wage / Income Gap ($) | 10,213 | 62.82¢ per $1 |
| Gini / Inequality Index | 10,213 | 0.44 |
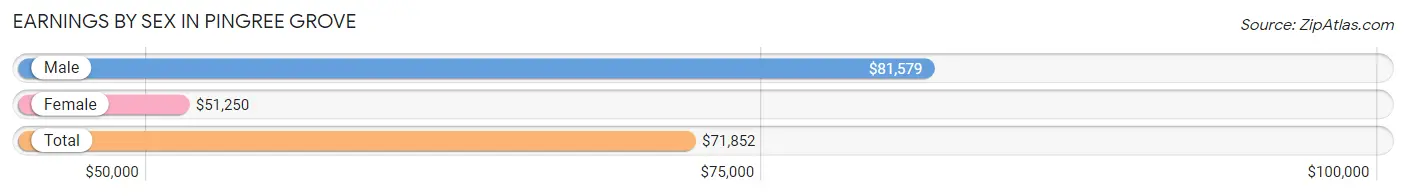
Earnings by Sex in Pingree Grove
Average Earnings in Pingree Grove are $71,852, $81,579 for men and $51,250 for women, a difference of 37.2%.
| Sex | Number | Average Earnings |
| Male | 2,768 (51.3%) | $81,579 |
| Female | 2,622 (48.6%) | $51,250 |
| Total | 5,390 (100.0%) | $71,852 |
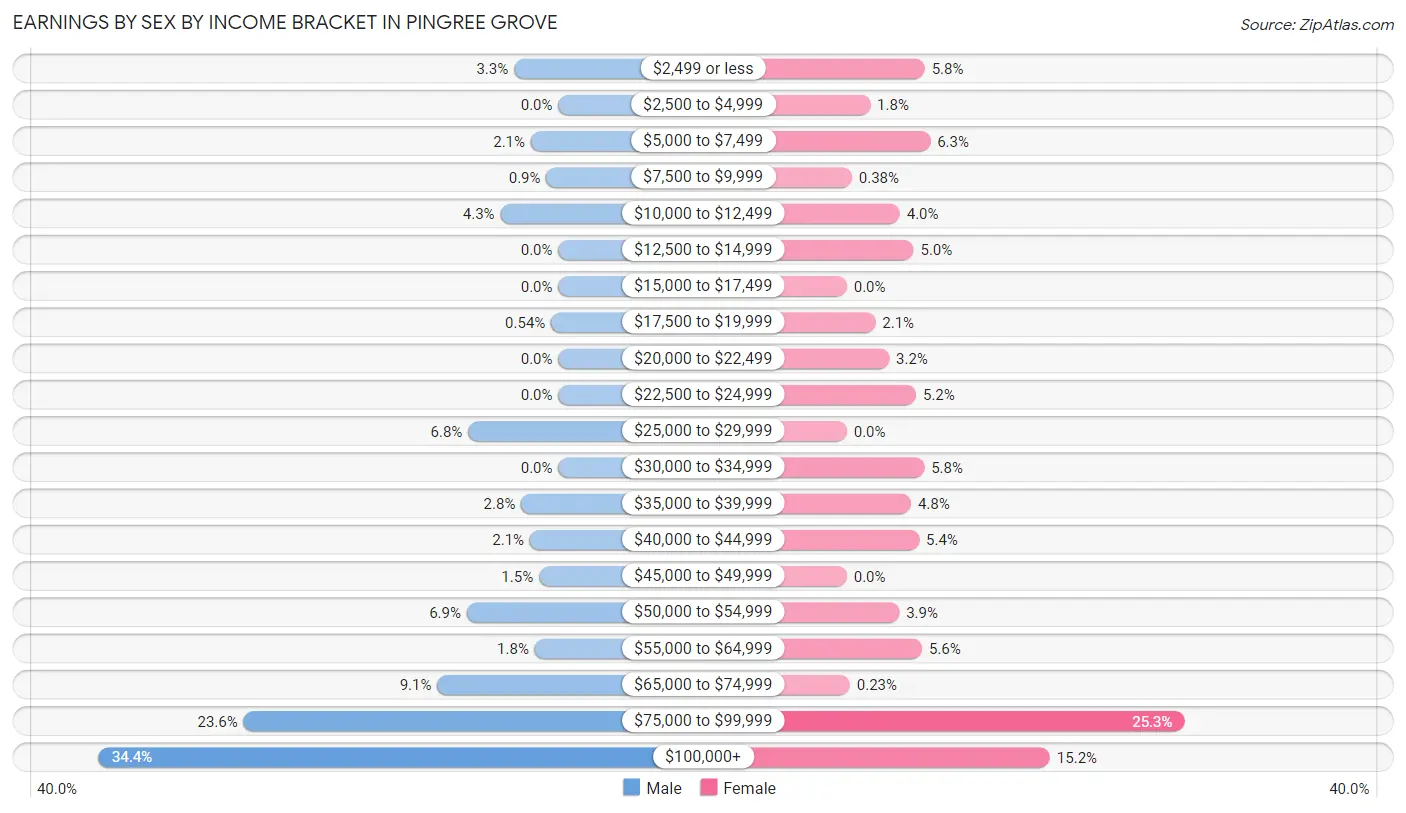
Earnings by Sex by Income Bracket in Pingree Grove
The most common earnings brackets in Pingree Grove are $100,000+ for men (953 | 34.4%) and $75,000 to $99,999 for women (663 | 25.3%).
| Income | Male | Female |
| $2,499 or less | 92 (3.3%) | 153 (5.8%) |
| $2,500 to $4,999 | 0 (0.0%) | 46 (1.8%) |
| $5,000 to $7,499 | 57 (2.1%) | 164 (6.2%) |
| $7,500 to $9,999 | 25 (0.9%) | 10 (0.4%) |
| $10,000 to $12,499 | 120 (4.3%) | 104 (4.0%) |
| $12,500 to $14,999 | 0 (0.0%) | 131 (5.0%) |
| $15,000 to $17,499 | 0 (0.0%) | 0 (0.0%) |
| $17,500 to $19,999 | 15 (0.5%) | 56 (2.1%) |
| $20,000 to $22,499 | 0 (0.0%) | 83 (3.2%) |
| $22,500 to $24,999 | 0 (0.0%) | 136 (5.2%) |
| $25,000 to $29,999 | 187 (6.8%) | 0 (0.0%) |
| $30,000 to $34,999 | 0 (0.0%) | 152 (5.8%) |
| $35,000 to $39,999 | 77 (2.8%) | 126 (4.8%) |
| $40,000 to $44,999 | 59 (2.1%) | 142 (5.4%) |
| $45,000 to $49,999 | 40 (1.5%) | 0 (0.0%) |
| $50,000 to $54,999 | 190 (6.9%) | 103 (3.9%) |
| $55,000 to $64,999 | 49 (1.8%) | 148 (5.6%) |
| $65,000 to $74,999 | 251 (9.1%) | 6 (0.2%) |
| $75,000 to $99,999 | 653 (23.6%) | 663 (25.3%) |
| $100,000+ | 953 (34.4%) | 399 (15.2%) |
| Total | 2,768 (100.0%) | 2,622 (100.0%) |
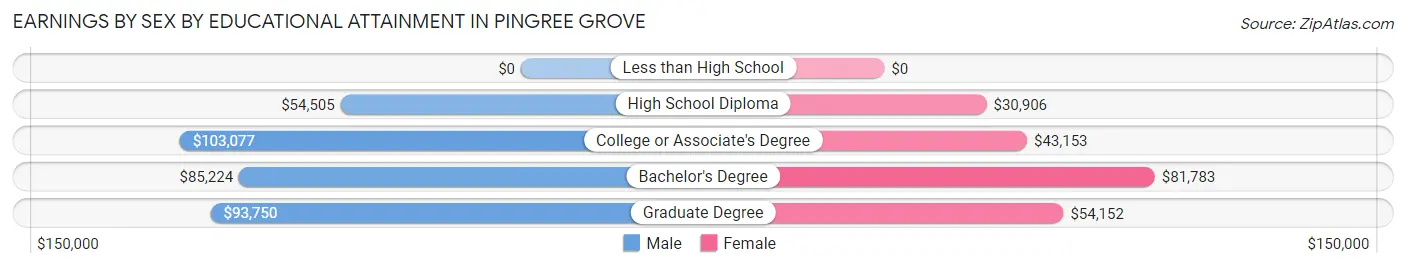
Earnings by Sex by Educational Attainment in Pingree Grove
Average earnings in Pingree Grove are $86,148 for men and $57,162 for women, a difference of 33.7%. Men with an educational attainment of college or associate's degree enjoy the highest average annual earnings of $103,077, while those with high school diploma education earn the least with $54,505. Women with an educational attainment of bachelor's degree earn the most with the average annual earnings of $81,783, while those with high school diploma education have the smallest earnings of $30,906.
| Educational Attainment | Male Income | Female Income |
| Less than High School | - | - |
| High School Diploma | $54,505 | $30,906 |
| College or Associate's Degree | $103,077 | $43,153 |
| Bachelor's Degree | $85,224 | $81,783 |
| Graduate Degree | $93,750 | $54,152 |
| Total | $86,148 | $57,162 |
Family Income in Pingree Grove
Family Income Brackets in Pingree Grove
According to the Pingree Grove family income data, there are 866 families falling into the $100,000 to $149,999 income range, which is the most common income bracket and makes up 31.6% of all families.
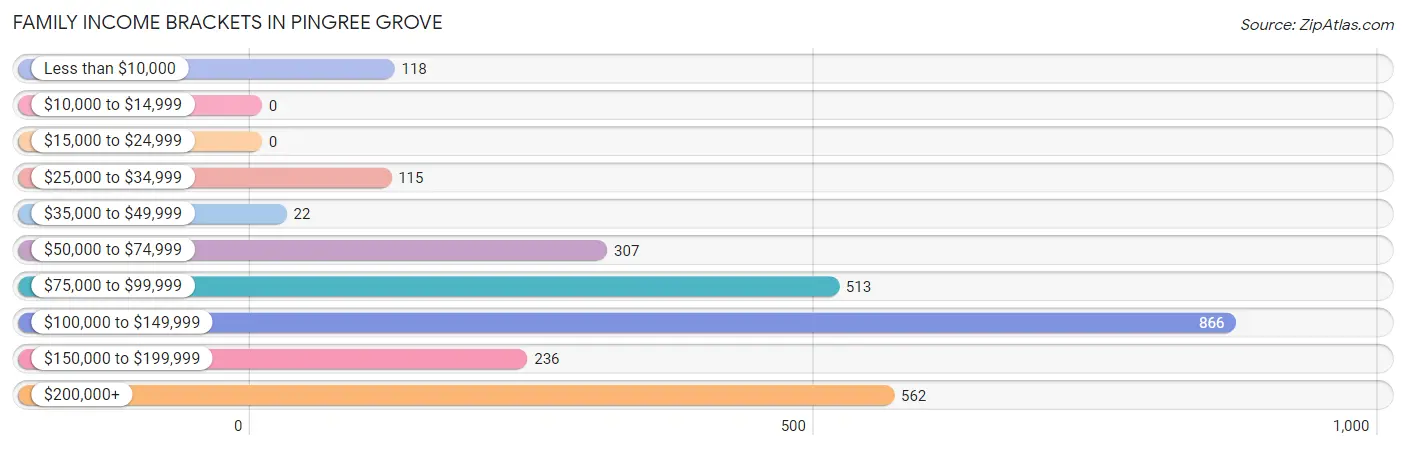
| Income Bracket | # Families | % Families |
| Less than $10,000 | 118 | 4.3% |
| $10,000 to $14,999 | 0 | 0.0% |
| $15,000 to $24,999 | 0 | 0.0% |
| $25,000 to $34,999 | 115 | 4.2% |
| $35,000 to $49,999 | 22 | 0.8% |
| $50,000 to $74,999 | 307 | 11.2% |
| $75,000 to $99,999 | 513 | 18.7% |
| $100,000 to $149,999 | 866 | 31.6% |
| $150,000 to $199,999 | 236 | 8.6% |
| $200,000+ | 562 | 20.5% |
Family Income by Famaliy Size in Pingree Grove
3-person families (496 | 18.1%) account for the highest median family income in Pingree Grove with $117,157 per family, while 2-person families (1,037 | 37.8%) have the highest median income of $41,225 per family member.
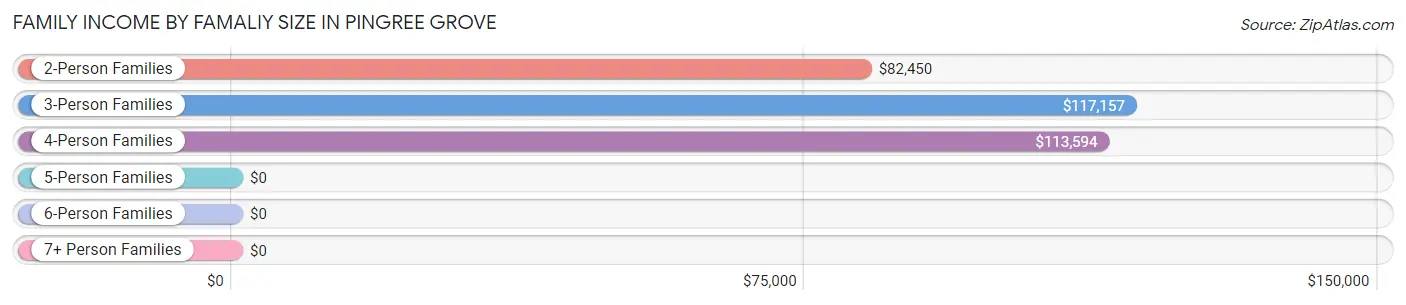
| Income Bracket | # Families | Median Income |
| 2-Person Families | 1,037 (37.8%) | $82,450 |
| 3-Person Families | 496 (18.1%) | $117,157 |
| 4-Person Families | 718 (26.2%) | $113,594 |
| 5-Person Families | 421 (15.3%) | $0 |
| 6-Person Families | 44 (1.6%) | $0 |
| 7+ Person Families | 26 (0.9%) | $0 |
| Total | 2,742 (100.0%) | $112,332 |
Family Income by Number of Earners in Pingree Grove
The median family income in Pingree Grove is $112,332, with families comprising 2 earners (1,176) having the highest median family income of $142,000, while families with no earners (575) have the lowest median family income of $64,238, accounting for 42.9% and 21.0% of families, respectively.
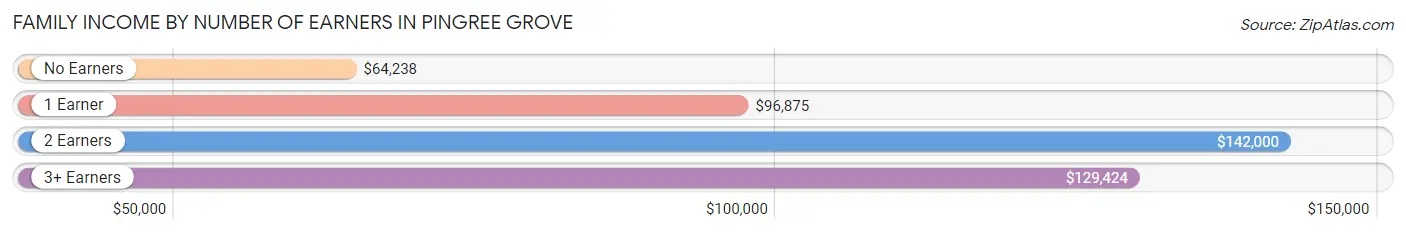
| Number of Earners | # Families | Median Income |
| No Earners | 575 (21.0%) | $64,238 |
| 1 Earner | 564 (20.6%) | $96,875 |
| 2 Earners | 1,176 (42.9%) | $142,000 |
| 3+ Earners | 427 (15.6%) | $129,424 |
| Total | 2,742 (100.0%) | $112,332 |
Household Income in Pingree Grove
Household Income Brackets in Pingree Grove
With 962 households falling in the category, the $100,000 to $149,999 income range is the most frequent in Pingree Grove, accounting for 28.2% of all households.
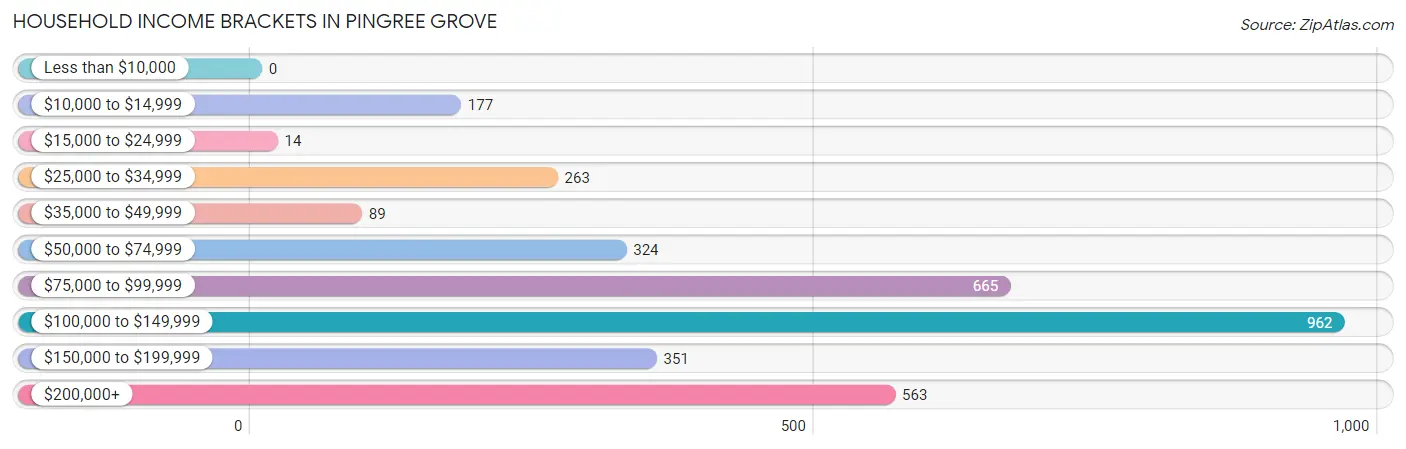
| Income Bracket | # Households | % Households |
| Less than $10,000 | 0 | 0.0% |
| $10,000 to $14,999 | 177 | 5.2% |
| $15,000 to $24,999 | 14 | 0.4% |
| $25,000 to $34,999 | 263 | 7.7% |
| $35,000 to $49,999 | 89 | 2.6% |
| $50,000 to $74,999 | 324 | 9.5% |
| $75,000 to $99,999 | 665 | 19.5% |
| $100,000 to $149,999 | 962 | 28.2% |
| $150,000 to $199,999 | 351 | 10.3% |
| $200,000+ | 563 | 16.5% |
Household Income by Householder Age in Pingree Grove
The median household income in Pingree Grove is $106,597, with the highest median household income of $113,424 found in the 25 to 44 years age bracket for the primary householder. A total of 1,468 households (43.0%) fall into this category. Meanwhile, the 15 to 24 years age bracket for the primary householder has the lowest median household income of $0, with 46 households (1.3%) in this group.
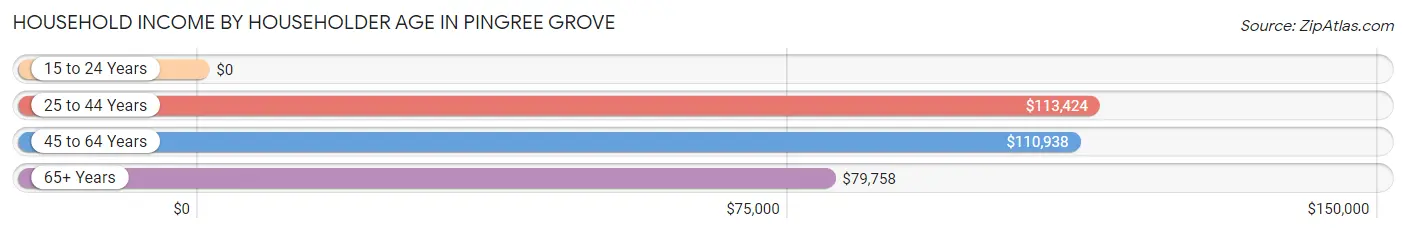
| Income Bracket | # Households | Median Income |
| 15 to 24 Years | 46 (1.3%) | $0 |
| 25 to 44 Years | 1,468 (43.0%) | $113,424 |
| 45 to 64 Years | 1,197 (35.1%) | $110,938 |
| 65+ Years | 701 (20.5%) | $79,758 |
| Total | 3,412 (100.0%) | $106,597 |
Poverty in Pingree Grove
Income Below Poverty by Sex and Age in Pingree Grove
With 4.7% poverty level for males and 4.2% for females among the residents of Pingree Grove, under 5 year old males and 25 to 34 year old females are the most vulnerable to poverty, with 113 males (17.8%) and 119 females (18.1%) in their respective age groups living below the poverty level.
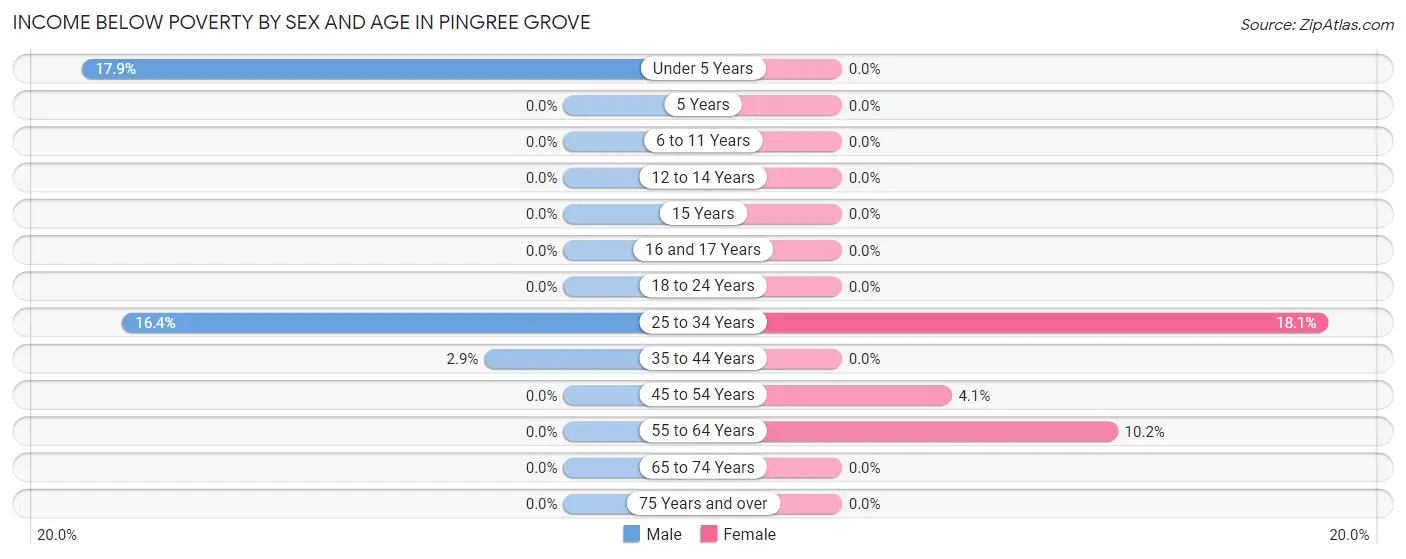
| Age Bracket | Male | Female |
| Under 5 Years | 113 (17.8%) | 0 (0.0%) |
| 5 Years | 0 (0.0%) | 0 (0.0%) |
| 6 to 11 Years | 0 (0.0%) | 0 (0.0%) |
| 12 to 14 Years | 0 (0.0%) | 0 (0.0%) |
| 15 Years | 0 (0.0%) | 0 (0.0%) |
| 16 and 17 Years | 0 (0.0%) | 0 (0.0%) |
| 18 to 24 Years | 0 (0.0%) | 0 (0.0%) |
| 25 to 34 Years | 120 (16.4%) | 119 (18.1%) |
| 35 to 44 Years | 27 (2.9%) | 0 (0.0%) |
| 45 to 54 Years | 0 (0.0%) | 19 (4.1%) |
| 55 to 64 Years | 0 (0.0%) | 60 (10.2%) |
| 65 to 74 Years | 0 (0.0%) | 0 (0.0%) |
| 75 Years and over | 0 (0.0%) | 0 (0.0%) |
| Total | 260 (4.7%) | 198 (4.2%) |
Income Above Poverty by Sex and Age in Pingree Grove
According to the poverty statistics in Pingree Grove, males aged 5 years and females aged under 5 years are the age groups that are most secure financially, with 100.0% of males and 100.0% of females in these age groups living above the poverty line.
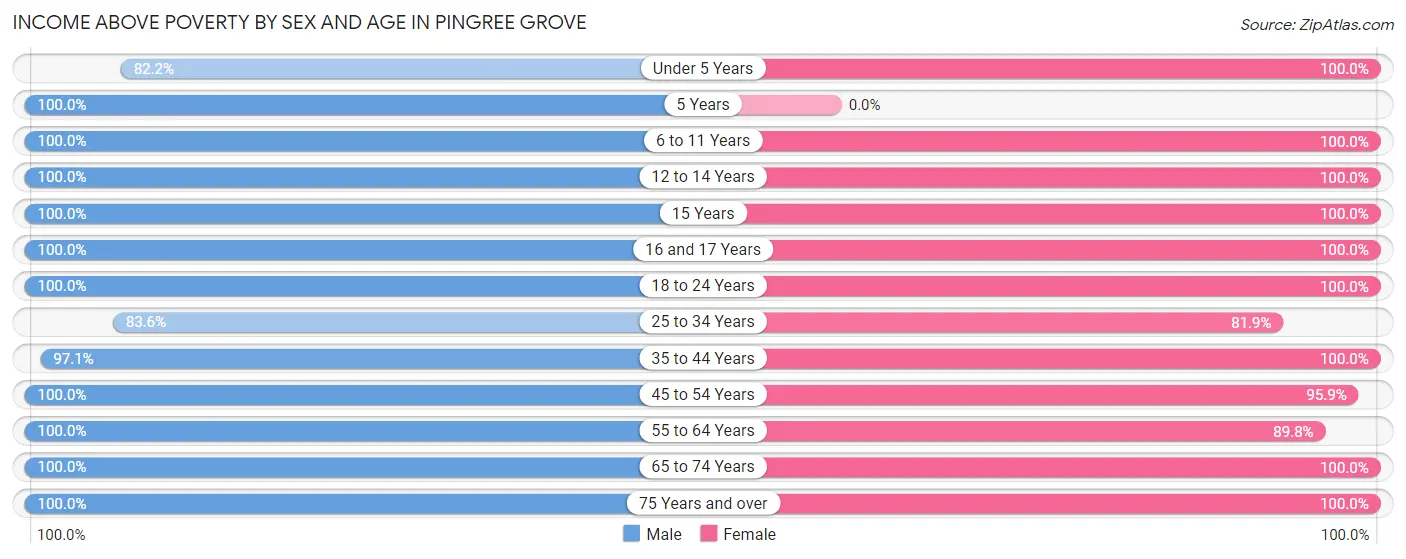
| Age Bracket | Male | Female |
| Under 5 Years | 520 (82.2%) | 121 (100.0%) |
| 5 Years | 23 (100.0%) | 0 (0.0%) |
| 6 to 11 Years | 312 (100.0%) | 460 (100.0%) |
| 12 to 14 Years | 639 (100.0%) | 292 (100.0%) |
| 15 Years | 192 (100.0%) | 47 (100.0%) |
| 16 and 17 Years | 153 (100.0%) | 82 (100.0%) |
| 18 to 24 Years | 147 (100.0%) | 429 (100.0%) |
| 25 to 34 Years | 613 (83.6%) | 540 (81.9%) |
| 35 to 44 Years | 892 (97.1%) | 975 (100.0%) |
| 45 to 54 Years | 698 (100.0%) | 448 (95.9%) |
| 55 to 64 Years | 513 (100.0%) | 526 (89.8%) |
| 65 to 74 Years | 412 (100.0%) | 525 (100.0%) |
| 75 Years and over | 145 (100.0%) | 49 (100.0%) |
| Total | 5,259 (95.3%) | 4,494 (95.8%) |
Income Below Poverty Among Married-Couple Families in Pingree Grove
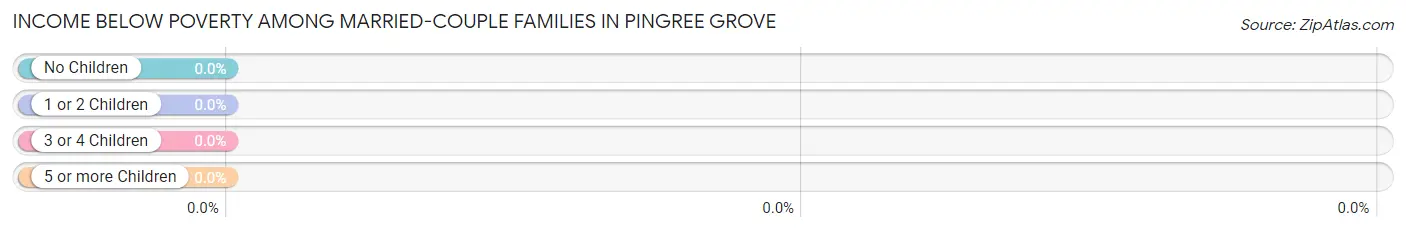
| Children | Above Poverty | Below Poverty |
| No Children | 1,049 (100.0%) | 0 (0.0%) |
| 1 or 2 Children | 1,086 (100.0%) | 0 (0.0%) |
| 3 or 4 Children | 336 (100.0%) | 0 (0.0%) |
| 5 or more Children | 0 (0.0%) | 0 (0.0%) |
| Total | 2,471 (100.0%) | 0 (0.0%) |
Income Below Poverty Among Single-Parent Households in Pingree Grove
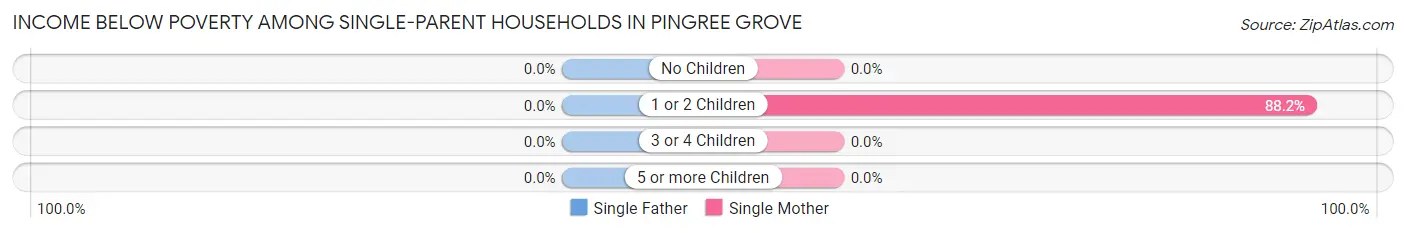
| Children | Single Father | Single Mother |
| No Children | 0 (0.0%) | 0 (0.0%) |
| 1 or 2 Children | 0 (0.0%) | 119 (88.1%) |
| 3 or 4 Children | 0 (0.0%) | 0 (0.0%) |
| 5 or more Children | 0 (0.0%) | 0 (0.0%) |
| Total | 0 (0.0%) | 119 (52.6%) |
Income Below Poverty Among Married-Couple vs Single-Parent Households in Pingree Grove
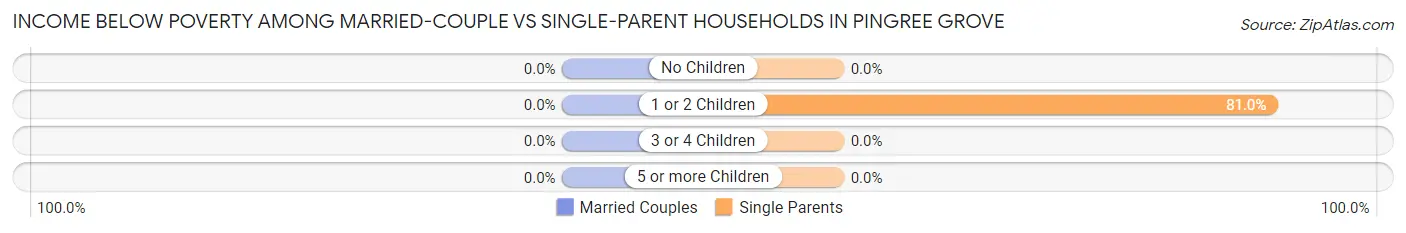
| Children | Married-Couple Families | Single-Parent Households |
| No Children | 0 (0.0%) | 0 (0.0%) |
| 1 or 2 Children | 0 (0.0%) | 119 (80.9%) |
| 3 or 4 Children | 0 (0.0%) | 0 (0.0%) |
| 5 or more Children | 0 (0.0%) | 0 (0.0%) |
| Total | 0 (0.0%) | 119 (43.9%) |
Race in Pingree Grove
The most populous races in Pingree Grove are White / Caucasian (6,990 | 68.4%), Hispanic or Latino (1,580 | 15.5%), and Black / African American (1,506 | 14.7%).
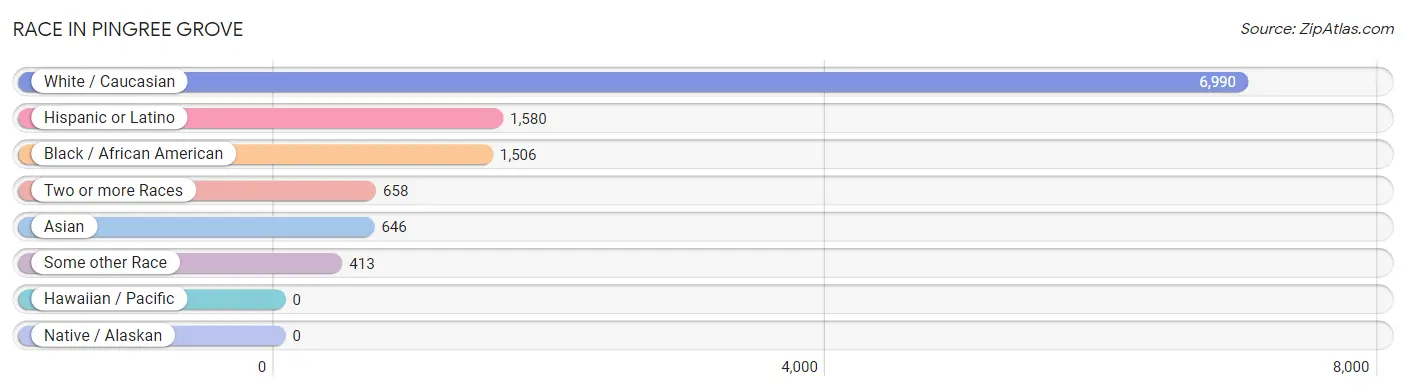
| Race | # Population | % Population |
| Asian | 646 | 6.3% |
| Black / African American | 1,506 | 14.7% |
| Hawaiian / Pacific | 0 | 0.0% |
| Hispanic or Latino | 1,580 | 15.5% |
| Native / Alaskan | 0 | 0.0% |
| White / Caucasian | 6,990 | 68.4% |
| Two or more Races | 658 | 6.4% |
| Some other Race | 413 | 4.0% |
| Total | 10,213 | 100.0% |
Ancestry in Pingree Grove
The most populous ancestries reported in Pingree Grove are German (1,988 | 19.5%), American (1,311 | 12.8%), Italian (1,193 | 11.7%), Mexican (1,078 | 10.6%), and Polish (902 | 8.8%), together accounting for 63.4% of all Pingree Grove residents.
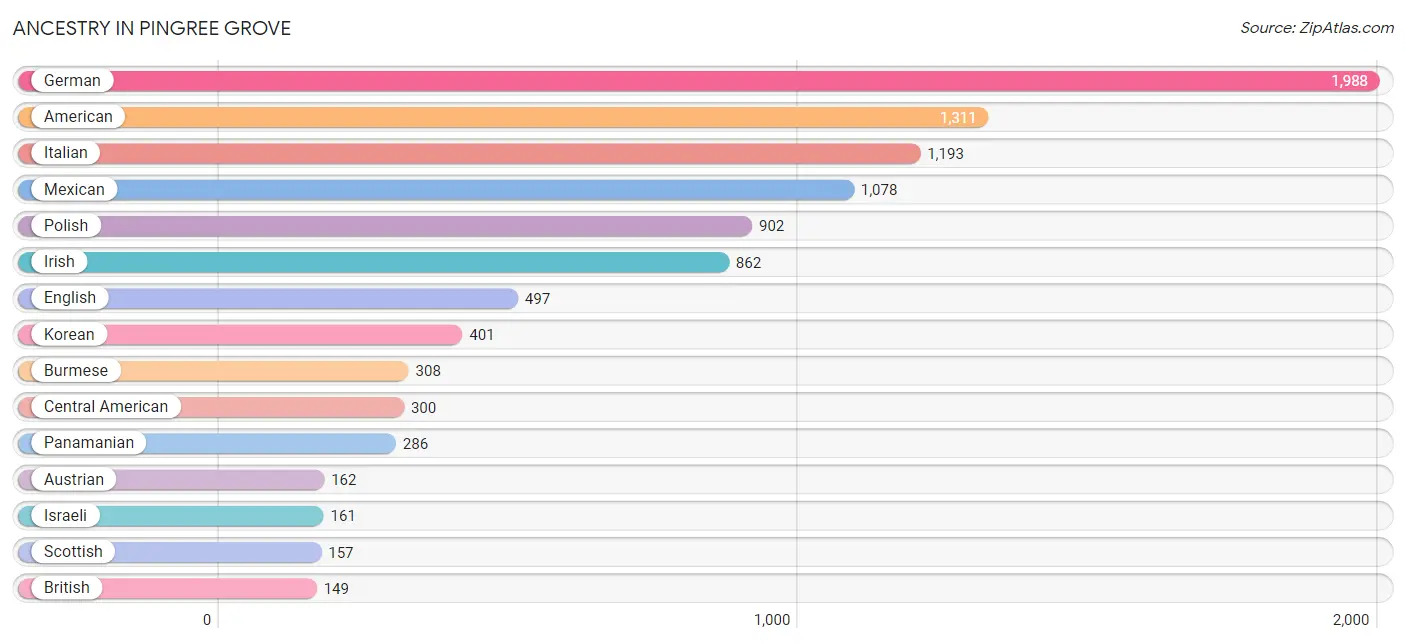
| Ancestry | # Population | % Population |
| American | 1,311 | 12.8% |
| Austrian | 162 | 1.6% |
| British | 149 | 1.5% |
| Burmese | 308 | 3.0% |
| Canadian | 106 | 1.0% |
| Central American | 300 | 2.9% |
| Croatian | 61 | 0.6% |
| Dutch | 46 | 0.4% |
| Eastern European | 1 | 0.0% |
| Ecuadorian | 139 | 1.4% |
| English | 497 | 4.9% |
| European | 110 | 1.1% |
| French | 73 | 0.7% |
| German | 1,988 | 19.5% |
| Hungarian | 107 | 1.1% |
| Irish | 862 | 8.4% |
| Israeli | 161 | 1.6% |
| Italian | 1,193 | 11.7% |
| Korean | 401 | 3.9% |
| Lithuanian | 51 | 0.5% |
| Luxembourger | 4 | 0.0% |
| Mexican | 1,078 | 10.6% |
| Norwegian | 44 | 0.4% |
| Panamanian | 286 | 2.8% |
| Polish | 902 | 8.8% |
| Portuguese | 23 | 0.2% |
| Puerto Rican | 63 | 0.6% |
| Russian | 18 | 0.2% |
| Salvadoran | 14 | 0.1% |
| Scandinavian | 60 | 0.6% |
| Scottish | 157 | 1.5% |
| Slovak | 59 | 0.6% |
| Slovene | 24 | 0.2% |
| South American | 139 | 1.4% |
| Swedish | 42 | 0.4% |
| Swiss | 42 | 0.4% |
| Turkish | 44 | 0.4% | View All 37 Rows |
Immigrants in Pingree Grove
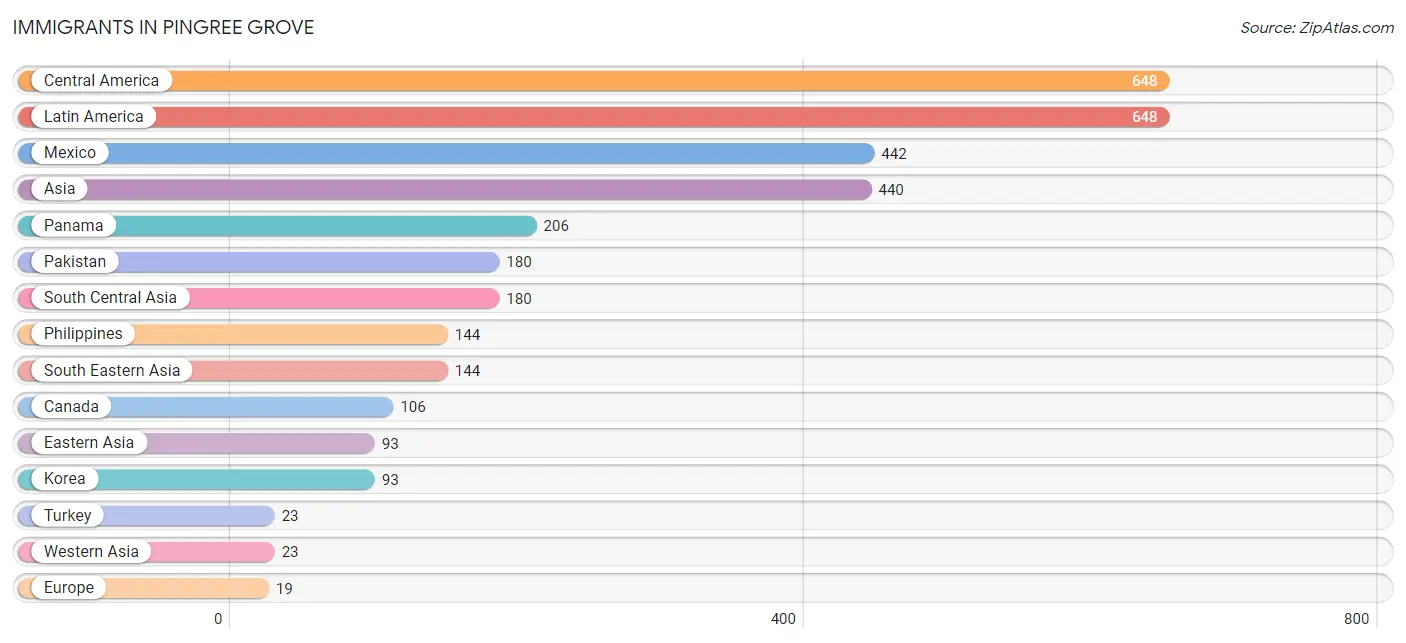
The most numerous immigrant groups reported in Pingree Grove came from Central America (648 | 6.3%), Latin America (648 | 6.3%), Mexico (442 | 4.3%), Asia (440 | 4.3%), and Panama (206 | 2.0%), together accounting for 23.3% of all Pingree Grove residents.
| Immigration Origin | # Population | % Population |
| Asia | 440 | 4.3% |
| Canada | 106 | 1.0% |
| Central America | 648 | 6.3% |
| Eastern Asia | 93 | 0.9% |
| Europe | 19 | 0.2% |
| Germany | 19 | 0.2% |
| Korea | 93 | 0.9% |
| Latin America | 648 | 6.3% |
| Mexico | 442 | 4.3% |
| Pakistan | 180 | 1.8% |
| Panama | 206 | 2.0% |
| Philippines | 144 | 1.4% |
| South Central Asia | 180 | 1.8% |
| South Eastern Asia | 144 | 1.4% |
| Turkey | 23 | 0.2% |
| Western Asia | 23 | 0.2% |
| Western Europe | 19 | 0.2% | View All 17 Rows |
Sex and Age in Pingree Grove
Sex and Age in Pingree Grove
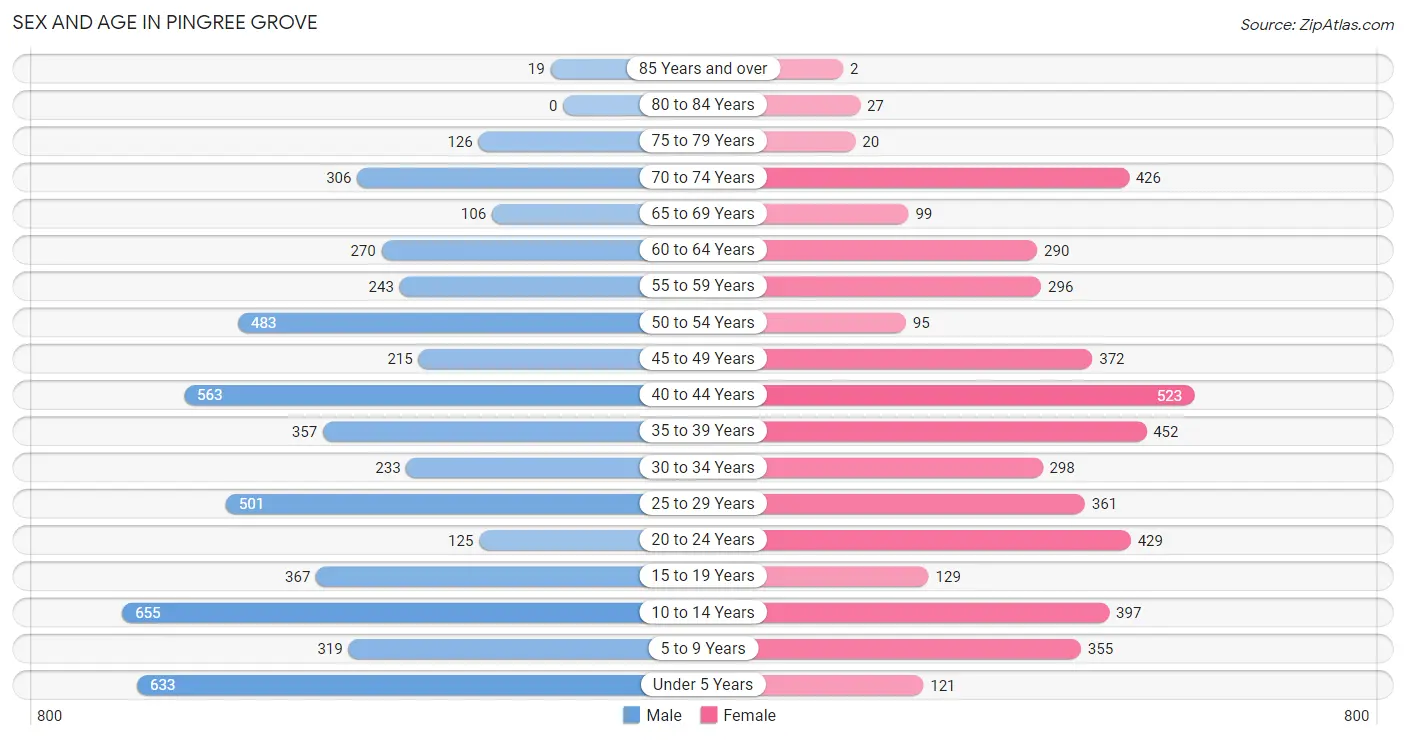
The most populous age groups in Pingree Grove are 10 to 14 Years (655 | 11.9%) for men and 40 to 44 Years (523 | 11.2%) for women.
| Age Bracket | Male | Female |
| Under 5 Years | 633 (11.5%) | 121 (2.6%) |
| 5 to 9 Years | 319 (5.8%) | 355 (7.6%) |
| 10 to 14 Years | 655 (11.9%) | 397 (8.5%) |
| 15 to 19 Years | 367 (6.7%) | 129 (2.8%) |
| 20 to 24 Years | 125 (2.3%) | 429 (9.1%) |
| 25 to 29 Years | 501 (9.1%) | 361 (7.7%) |
| 30 to 34 Years | 233 (4.2%) | 298 (6.4%) |
| 35 to 39 Years | 357 (6.5%) | 452 (9.6%) |
| 40 to 44 Years | 563 (10.2%) | 523 (11.2%) |
| 45 to 49 Years | 215 (3.9%) | 372 (7.9%) |
| 50 to 54 Years | 483 (8.7%) | 95 (2.0%) |
| 55 to 59 Years | 243 (4.4%) | 296 (6.3%) |
| 60 to 64 Years | 270 (4.9%) | 290 (6.2%) |
| 65 to 69 Years | 106 (1.9%) | 99 (2.1%) |
| 70 to 74 Years | 306 (5.5%) | 426 (9.1%) |
| 75 to 79 Years | 126 (2.3%) | 20 (0.4%) |
| 80 to 84 Years | 0 (0.0%) | 27 (0.6%) |
| 85 Years and over | 19 (0.3%) | 2 (0.0%) |
| Total | 5,521 (100.0%) | 4,692 (100.0%) |
Families and Households in Pingree Grove
Median Family Size in Pingree Grove
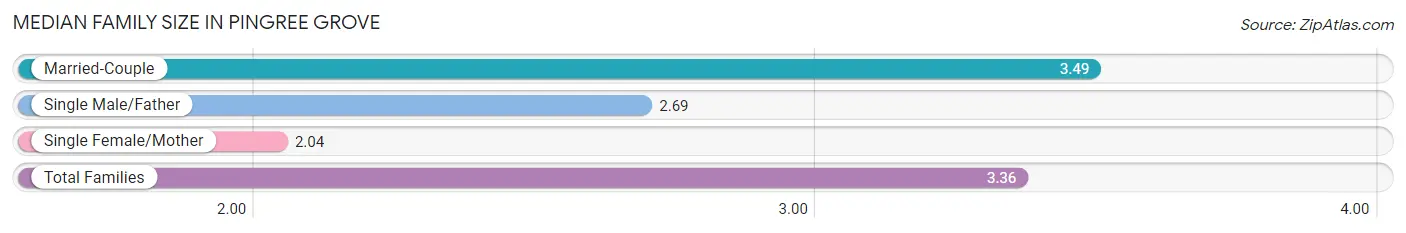
The median family size in Pingree Grove is 3.36 persons per family, with married-couple families (2,471 | 90.1%) accounting for the largest median family size of 3.49 persons per family. On the other hand, single female/mother families (226 | 8.2%) represent the smallest median family size with 2.04 persons per family.
| Family Type | # Families | Family Size |
| Married-Couple | 2,471 (90.1%) | 3.49 |
| Single Male/Father | 45 (1.6%) | 2.69 |
| Single Female/Mother | 226 (8.2%) | 2.04 |
| Total Families | 2,742 (100.0%) | 3.36 |
Median Household Size in Pingree Grove
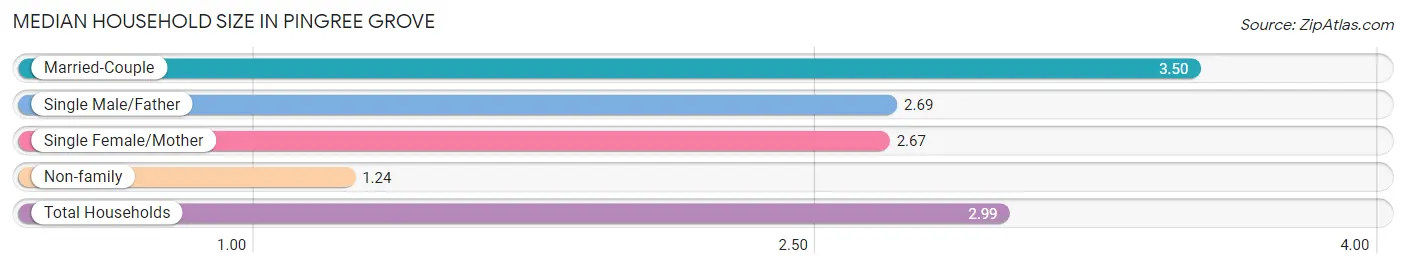
The median household size in Pingree Grove is 2.99 persons per household, with married-couple households (2,471 | 72.4%) accounting for the largest median household size of 3.5 persons per household. non-family households (670 | 19.6%) represent the smallest median household size with 1.24 persons per household.
| Household Type | # Households | Household Size |
| Married-Couple | 2,471 (72.4%) | 3.50 |
| Single Male/Father | 45 (1.3%) | 2.69 |
| Single Female/Mother | 226 (6.6%) | 2.67 |
| Non-family | 670 (19.6%) | 1.24 |
| Total Households | 3,412 (100.0%) | 2.99 |
Household Size by Marriage Status in Pingree Grove
Out of a total of 3,412 households in Pingree Grove, 2,742 (80.4%) are family households, while 670 (19.6%) are nonfamily households. The most numerous type of family households are 2-person households, comprising 918, and the most common type of nonfamily households are 1-person households, comprising 501.
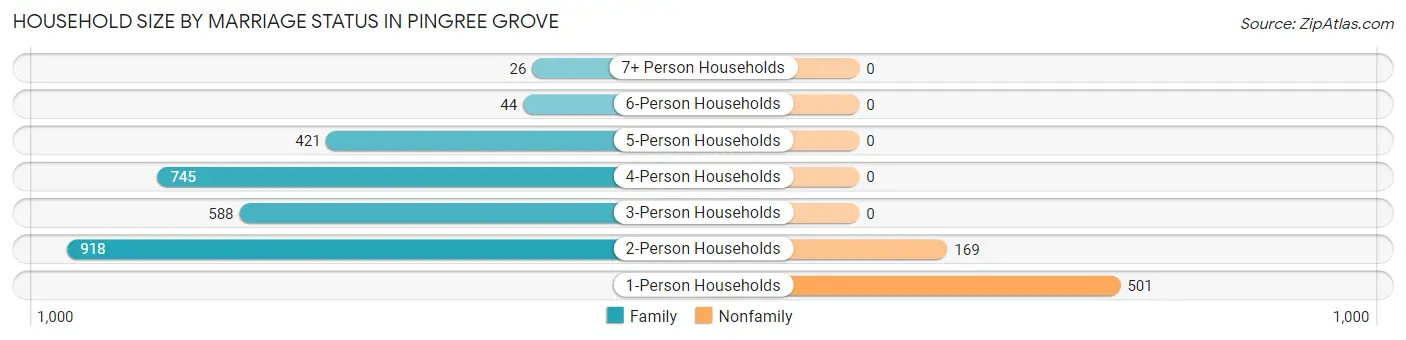
| Household Size | Family Households | Nonfamily Households |
| 1-Person Households | - | 501 (14.7%) |
| 2-Person Households | 918 (26.9%) | 169 (5.0%) |
| 3-Person Households | 588 (17.2%) | 0 (0.0%) |
| 4-Person Households | 745 (21.8%) | 0 (0.0%) |
| 5-Person Households | 421 (12.3%) | 0 (0.0%) |
| 6-Person Households | 44 (1.3%) | 0 (0.0%) |
| 7+ Person Households | 26 (0.8%) | 0 (0.0%) |
| Total | 2,742 (80.4%) | 670 (19.6%) |
Female Fertility in Pingree Grove
Fertility by Age in Pingree Grove
Average fertility rate in Pingree Grove is 50.0 births per 1,000 women. Women in the age bracket of 20 to 34 years have the highest fertility rate with 66.0 births per 1,000 women. Women in the age bracket of 20 to 34 years acount for 56.7% of all women with births.
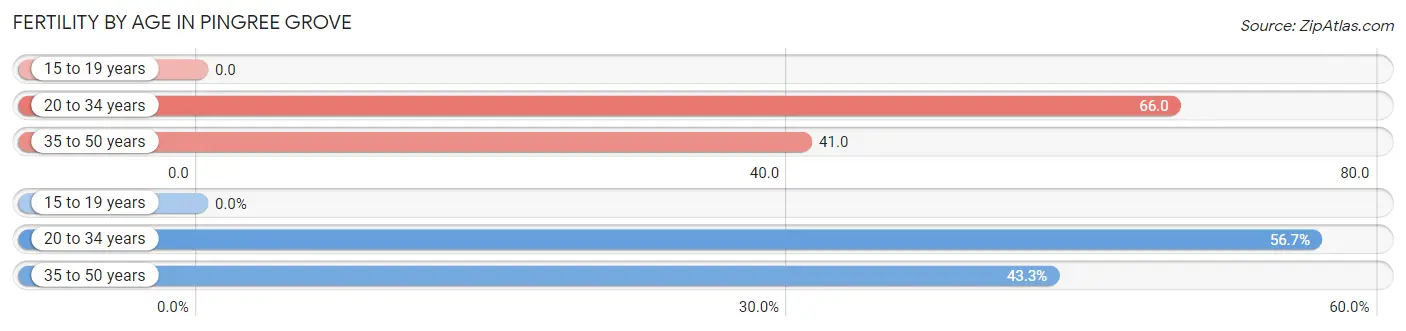
| Age Bracket | Women with Births | Births / 1,000 Women |
| 15 to 19 years | 0 (0.0%) | 0.0 |
| 20 to 34 years | 72 (56.7%) | 66.0 |
| 35 to 50 years | 55 (43.3%) | 41.0 |
| Total | 127 (100.0%) | 50.0 |
Fertility by Age by Marriage Status in Pingree Grove
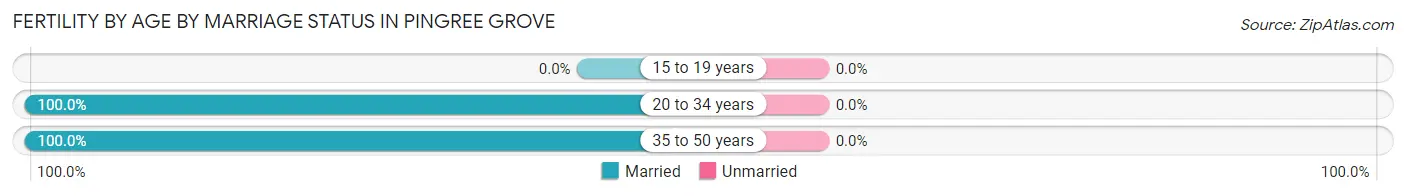
| Age Bracket | Married | Unmarried |
| 15 to 19 years | 0 (0.0%) | 0 (0.0%) |
| 20 to 34 years | 72 (100.0%) | 0 (0.0%) |
| 35 to 50 years | 55 (100.0%) | 0 (0.0%) |
| Total | 127 (100.0%) | 0 (0.0%) |
Fertility by Education in Pingree Grove
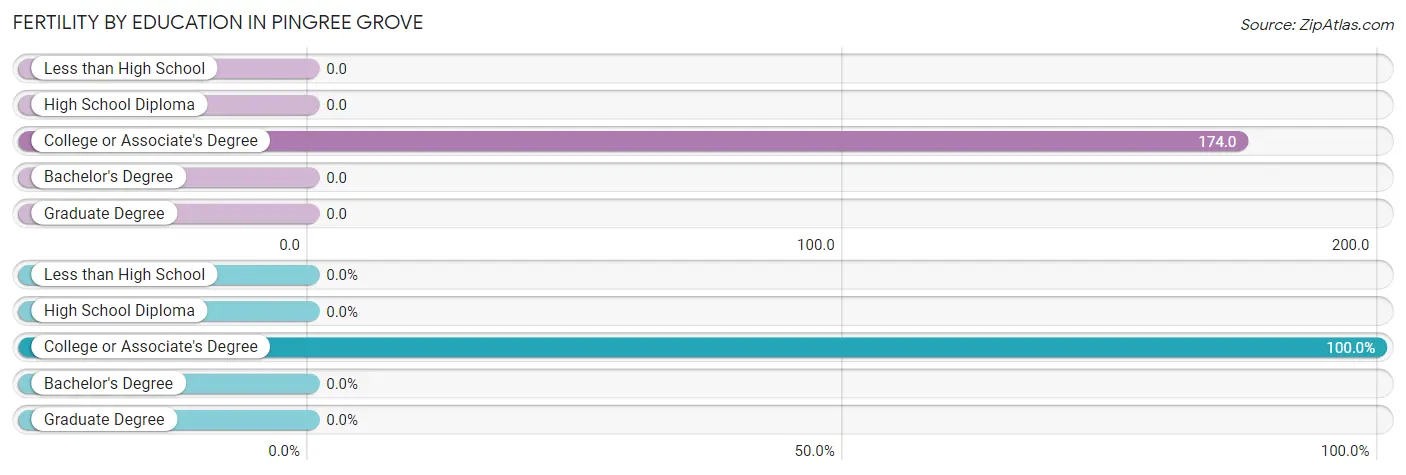
| Educational Attainment | Women with Births | Births / 1,000 Women |
| Less than High School | 0 (0.0%) | 0.0 |
| High School Diploma | 0 (0.0%) | 0.0 |
| College or Associate's Degree | 127 (100.0%) | 174.0 |
| Bachelor's Degree | 0 (0.0%) | 0.0 |
| Graduate Degree | 0 (0.0%) | 0.0 |
| Total | 127 (100.0%) | 50.0 |
Fertility by Education by Marriage Status in Pingree Grove
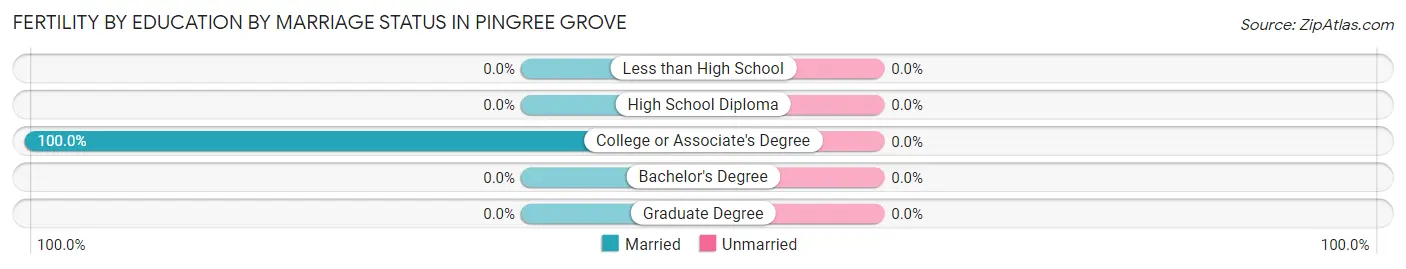
| Educational Attainment | Married | Unmarried |
| Less than High School | 0 (0.0%) | 0 (0.0%) |
| High School Diploma | 0 (0.0%) | 0 (0.0%) |
| College or Associate's Degree | 127 (100.0%) | 0 (0.0%) |
| Bachelor's Degree | 0 (0.0%) | 0 (0.0%) |
| Graduate Degree | 0 (0.0%) | 0 (0.0%) |
| Total | 127 (100.0%) | 0 (0.0%) |
Employment Characteristics in Pingree Grove
Employment by Class of Employer in Pingree Grove
Among the 5,180 employed individuals in Pingree Grove, private company employees (3,744 | 72.3%), self-employed (incorporated) (461 | 8.9%), and not-for-profit organizations (439 | 8.5%) make up the most common classes of employment.
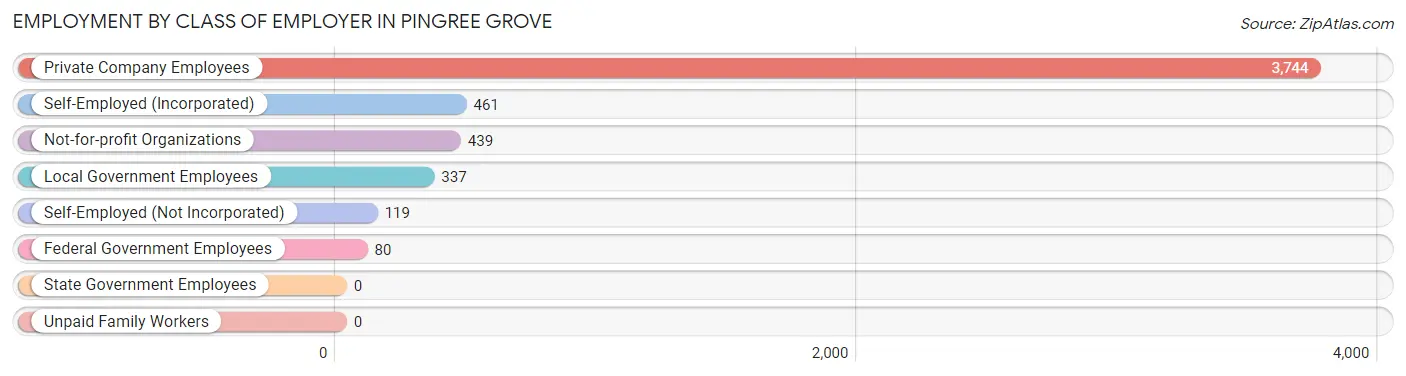
| Employer Class | # Employees | % Employees |
| Private Company Employees | 3,744 | 72.3% |
| Self-Employed (Incorporated) | 461 | 8.9% |
| Self-Employed (Not Incorporated) | 119 | 2.3% |
| Not-for-profit Organizations | 439 | 8.5% |
| Local Government Employees | 337 | 6.5% |
| State Government Employees | 0 | 0.0% |
| Federal Government Employees | 80 | 1.5% |
| Unpaid Family Workers | 0 | 0.0% |
| Total | 5,180 | 100.0% |
Employment Status by Age in Pingree Grove
According to the labor force statistics for Pingree Grove, out of the total population over 16 years of age (7,494), 72.6% or 5,441 individuals are in the labor force, with 3.5% or 190 of them unemployed. The age group with the highest labor force participation rate is 20 to 24 years, with 98.2% or 544 individuals in the labor force. Within the labor force, the 45 to 54 years age range has the highest percentage of unemployed individuals, with 16.7% or 159 of them being unemployed.
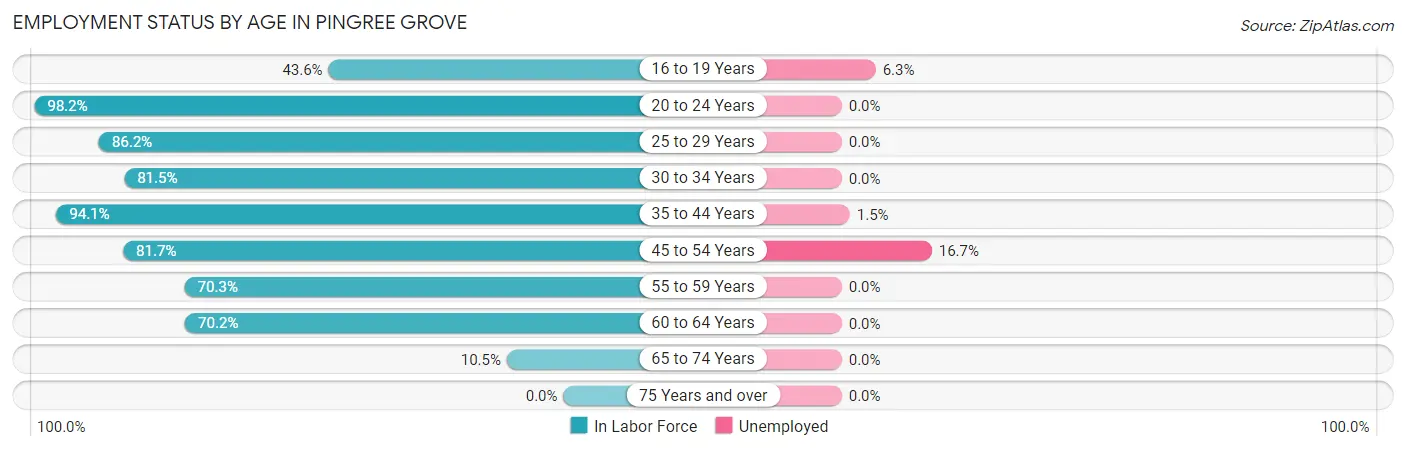
| Age Bracket | In Labor Force | Unemployed |
| 16 to 19 Years | 112 (43.6%) | 7 (6.3%) |
| 20 to 24 Years | 544 (98.2%) | 0 (0.0%) |
| 25 to 29 Years | 743 (86.2%) | 0 (0.0%) |
| 30 to 34 Years | 433 (81.5%) | 0 (0.0%) |
| 35 to 44 Years | 1,783 (94.1%) | 27 (1.5%) |
| 45 to 54 Years | 952 (81.7%) | 159 (16.7%) |
| 55 to 59 Years | 379 (70.3%) | 0 (0.0%) |
| 60 to 64 Years | 393 (70.2%) | 0 (0.0%) |
| 65 to 74 Years | 98 (10.5%) | 0 (0.0%) |
| 75 Years and over | 0 (0.0%) | 0 (0.0%) |
| Total | 5,441 (72.6%) | 190 (3.5%) |
Employment Status by Educational Attainment in Pingree Grove
According to labor force statistics for Pingree Grove, 84.3% of individuals (4,680) out of the total population between 25 and 64 years of age (5,552) are in the labor force, with 4.0% or 187 of them being unemployed. The group with the highest labor force participation rate are those with the educational attainment of bachelor's degree or higher, with 88.8% or 2,574 individuals in the labor force. Within the labor force, individuals with high school diploma education have the highest percentage of unemployment, with 24.3% or 159 of them being unemployed.
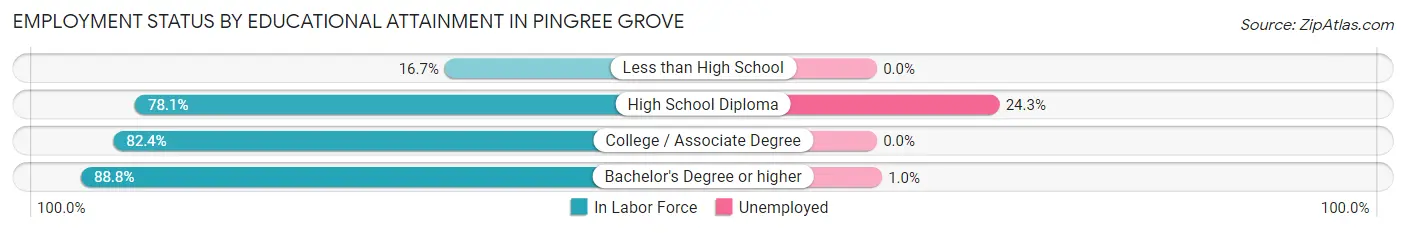
| Educational Attainment | In Labor Force | Unemployed |
| Less than High School | 10 (16.7%) | 0 (0.0%) |
| High School Diploma | 655 (78.1%) | 204 (24.3%) |
| College / Associate Degree | 1,445 (82.4%) | 0 (0.0%) |
| Bachelor's Degree or higher | 2,574 (88.8%) | 29 (1.0%) |
| Total | 4,680 (84.3%) | 222 (4.0%) |
Employment Occupations by Sex in Pingree Grove
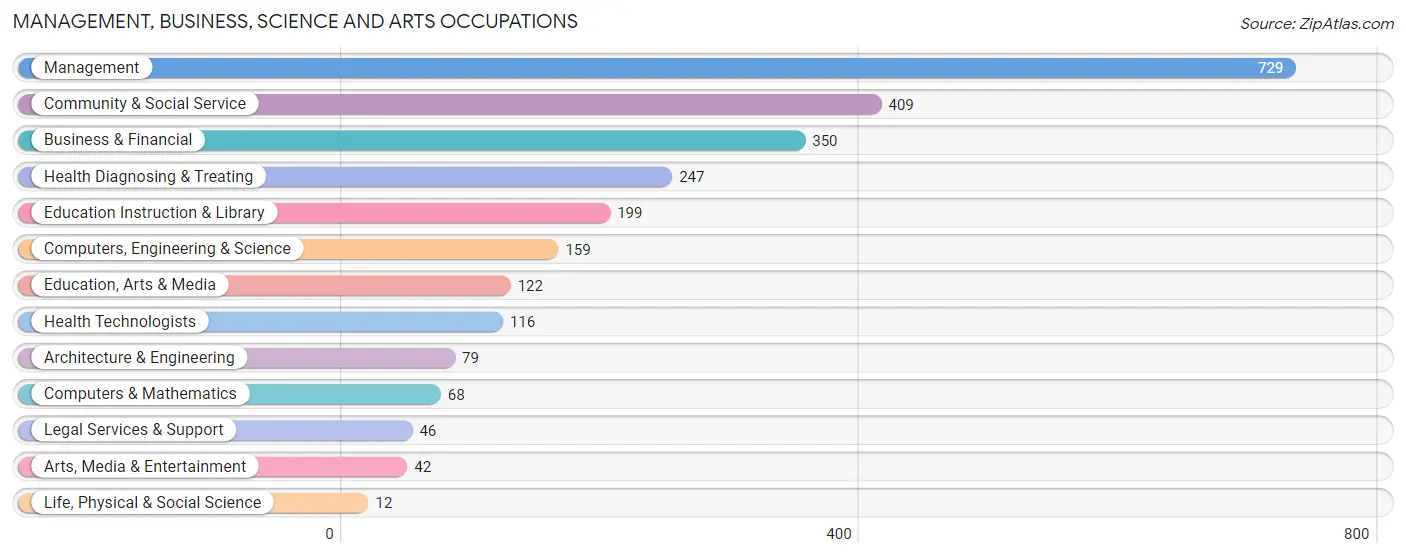
Management, Business, Science and Arts Occupations
The most common Management, Business, Science and Arts occupations in Pingree Grove are Management (729 | 13.9%), Community & Social Service (409 | 7.8%), Business & Financial (350 | 6.7%), Health Diagnosing & Treating (247 | 4.7%), and Education Instruction & Library (199 | 3.8%).
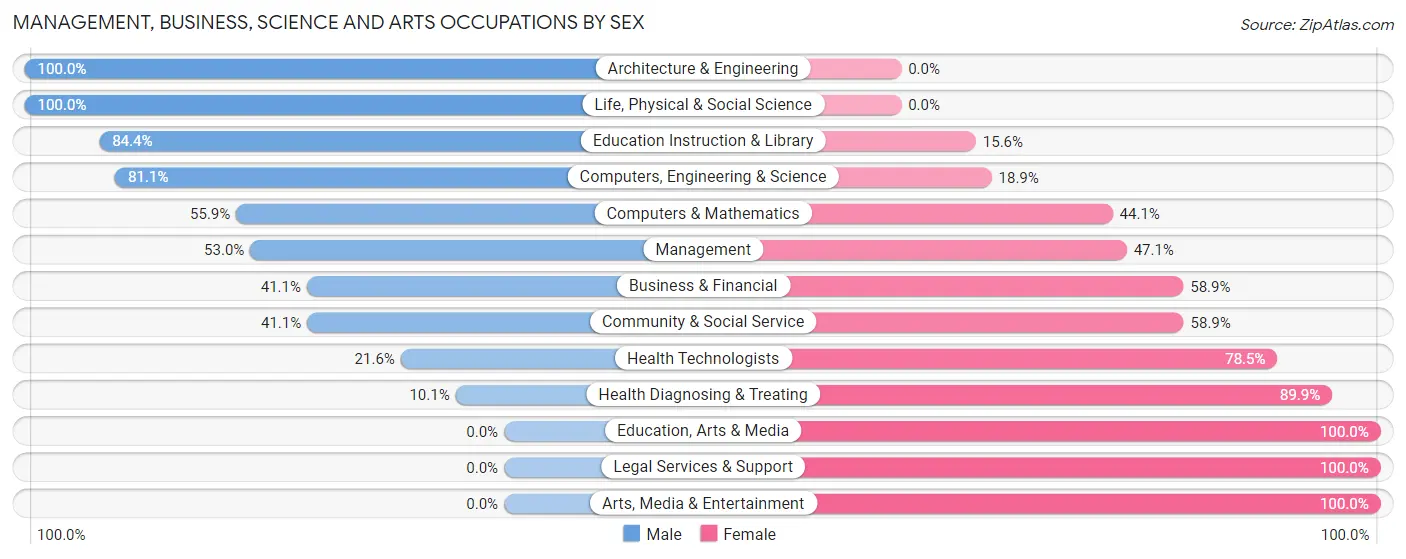
Management, Business, Science and Arts Occupations by Sex
Within the Management, Business, Science and Arts occupations in Pingree Grove, the most male-oriented occupations are Architecture & Engineering (100.0%), Life, Physical & Social Science (100.0%), and Education Instruction & Library (84.4%), while the most female-oriented occupations are Education, Arts & Media (100.0%), Legal Services & Support (100.0%), and Arts, Media & Entertainment (100.0%).
| Occupation | Male | Female |
| Management | 386 (52.9%) | 343 (47.0%) |
| Business & Financial | 144 (41.1%) | 206 (58.9%) |
| Computers, Engineering & Science | 129 (81.1%) | 30 (18.9%) |
| Computers & Mathematics | 38 (55.9%) | 30 (44.1%) |
| Architecture & Engineering | 79 (100.0%) | 0 (0.0%) |
| Life, Physical & Social Science | 12 (100.0%) | 0 (0.0%) |
| Community & Social Service | 168 (41.1%) | 241 (58.9%) |
| Education, Arts & Media | 0 (0.0%) | 122 (100.0%) |
| Legal Services & Support | 0 (0.0%) | 46 (100.0%) |
| Education Instruction & Library | 168 (84.4%) | 31 (15.6%) |
| Arts, Media & Entertainment | 0 (0.0%) | 42 (100.0%) |
| Health Diagnosing & Treating | 25 (10.1%) | 222 (89.9%) |
| Health Technologists | 25 (21.5%) | 91 (78.4%) |
| Total (Category) | 852 (45.0%) | 1,042 (55.0%) |
| Total (Overall) | 2,734 (52.1%) | 2,510 (47.9%) |
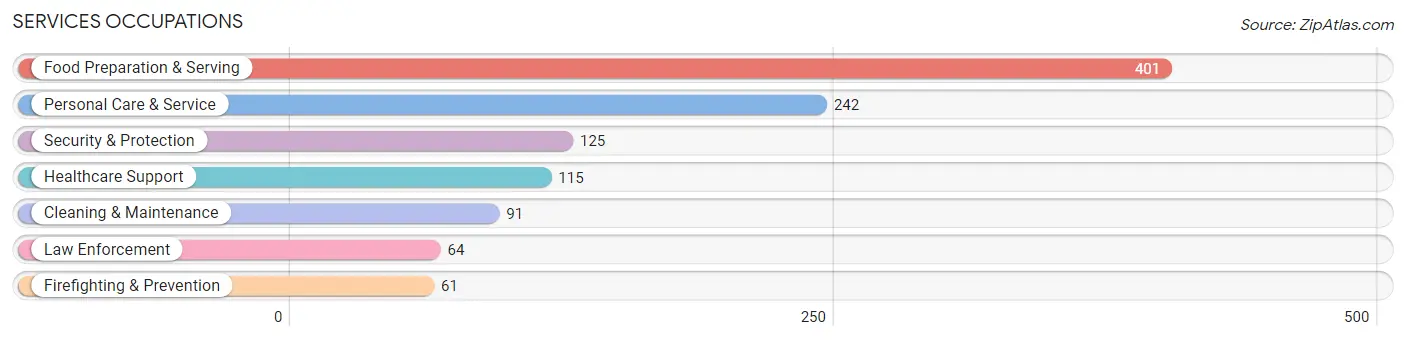
Services Occupations
The most common Services occupations in Pingree Grove are Food Preparation & Serving (401 | 7.6%), Personal Care & Service (242 | 4.6%), Security & Protection (125 | 2.4%), Healthcare Support (115 | 2.2%), and Cleaning & Maintenance (91 | 1.7%).
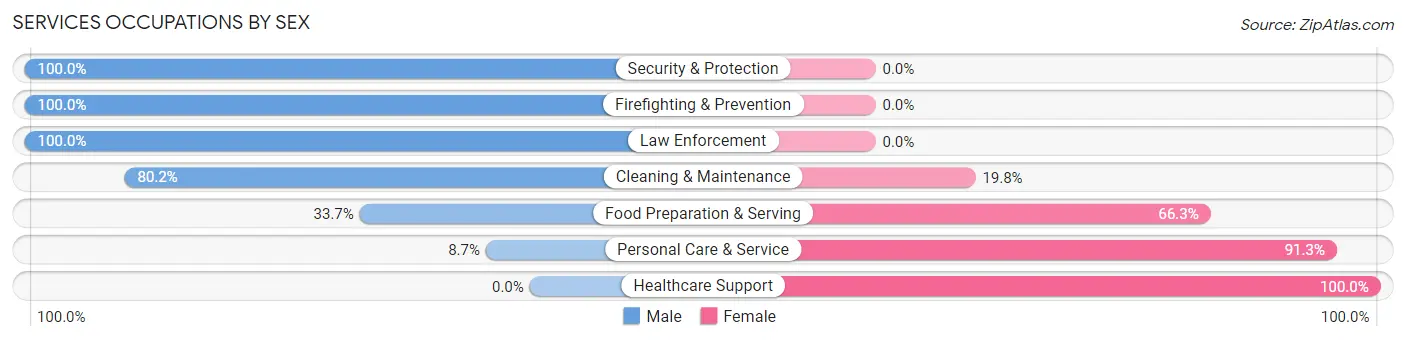
Services Occupations by Sex
Within the Services occupations in Pingree Grove, the most male-oriented occupations are Security & Protection (100.0%), Firefighting & Prevention (100.0%), and Law Enforcement (100.0%), while the most female-oriented occupations are Healthcare Support (100.0%), Personal Care & Service (91.3%), and Food Preparation & Serving (66.3%).
| Occupation | Male | Female |
| Healthcare Support | 0 (0.0%) | 115 (100.0%) |
| Security & Protection | 125 (100.0%) | 0 (0.0%) |
| Firefighting & Prevention | 61 (100.0%) | 0 (0.0%) |
| Law Enforcement | 64 (100.0%) | 0 (0.0%) |
| Food Preparation & Serving | 135 (33.7%) | 266 (66.3%) |
| Cleaning & Maintenance | 73 (80.2%) | 18 (19.8%) |
| Personal Care & Service | 21 (8.7%) | 221 (91.3%) |
| Total (Category) | 354 (36.3%) | 620 (63.7%) |
| Total (Overall) | 2,734 (52.1%) | 2,510 (47.9%) |
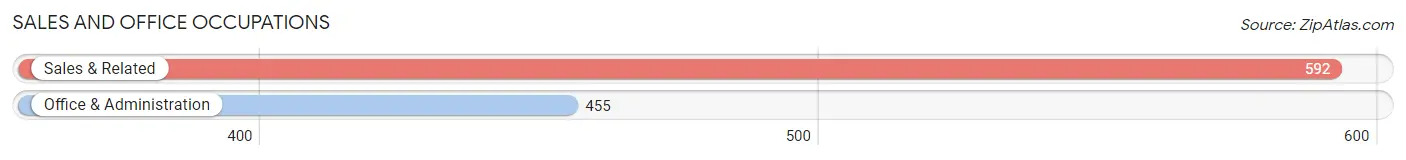
Sales and Office Occupations
The most common Sales and Office occupations in Pingree Grove are Sales & Related (592 | 11.3%), and Office & Administration (455 | 8.7%).
Sales and Office Occupations by Sex
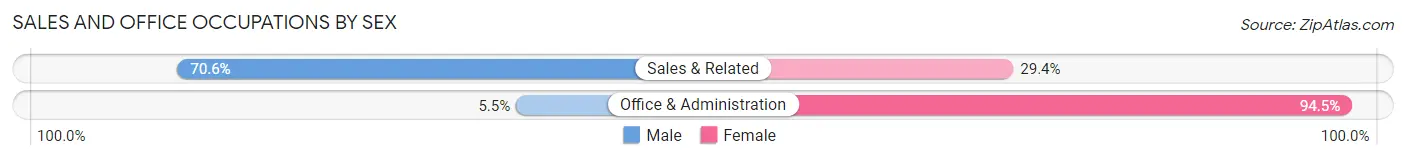
| Occupation | Male | Female |
| Sales & Related | 418 (70.6%) | 174 (29.4%) |
| Office & Administration | 25 (5.5%) | 430 (94.5%) |
| Total (Category) | 443 (42.3%) | 604 (57.7%) |
| Total (Overall) | 2,734 (52.1%) | 2,510 (47.9%) |
Natural Resources, Construction and Maintenance Occupations
The most common Natural Resources, Construction and Maintenance occupations in Pingree Grove are Construction & Extraction (685 | 13.1%), and Installation, Maintenance & Repair (112 | 2.1%).

Natural Resources, Construction and Maintenance Occupations by Sex

| Occupation | Male | Female |
| Farming, Fishing & Forestry | 0 (0.0%) | 0 (0.0%) |
| Construction & Extraction | 685 (100.0%) | 0 (0.0%) |
| Installation, Maintenance & Repair | 112 (100.0%) | 0 (0.0%) |
| Total (Category) | 797 (100.0%) | 0 (0.0%) |
| Total (Overall) | 2,734 (52.1%) | 2,510 (47.9%) |
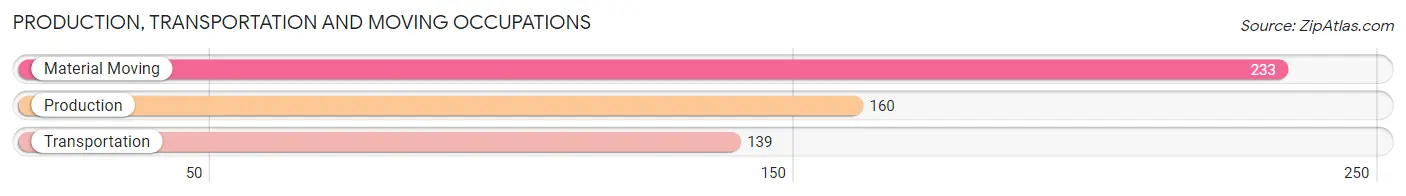
Production, Transportation and Moving Occupations
The most common Production, Transportation and Moving occupations in Pingree Grove are Material Moving (233 | 4.4%), Production (160 | 3.0%), and Transportation (139 | 2.6%).
Production, Transportation and Moving Occupations by Sex
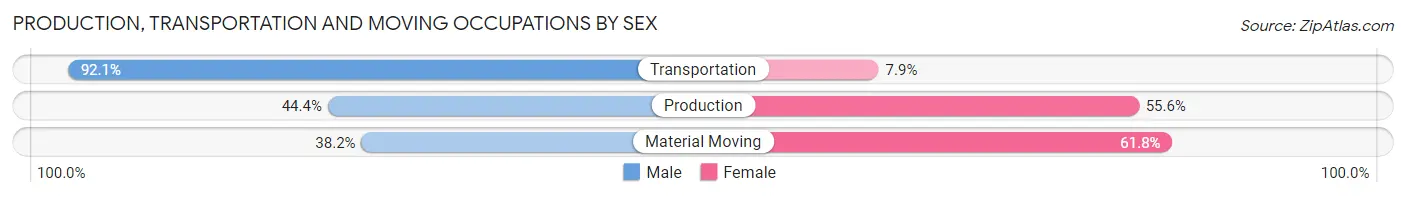
| Occupation | Male | Female |
| Production | 71 (44.4%) | 89 (55.6%) |
| Transportation | 128 (92.1%) | 11 (7.9%) |
| Material Moving | 89 (38.2%) | 144 (61.8%) |
| Total (Category) | 288 (54.1%) | 244 (45.9%) |
| Total (Overall) | 2,734 (52.1%) | 2,510 (47.9%) |
Employment Industries by Sex in Pingree Grove
Employment Industries in Pingree Grove
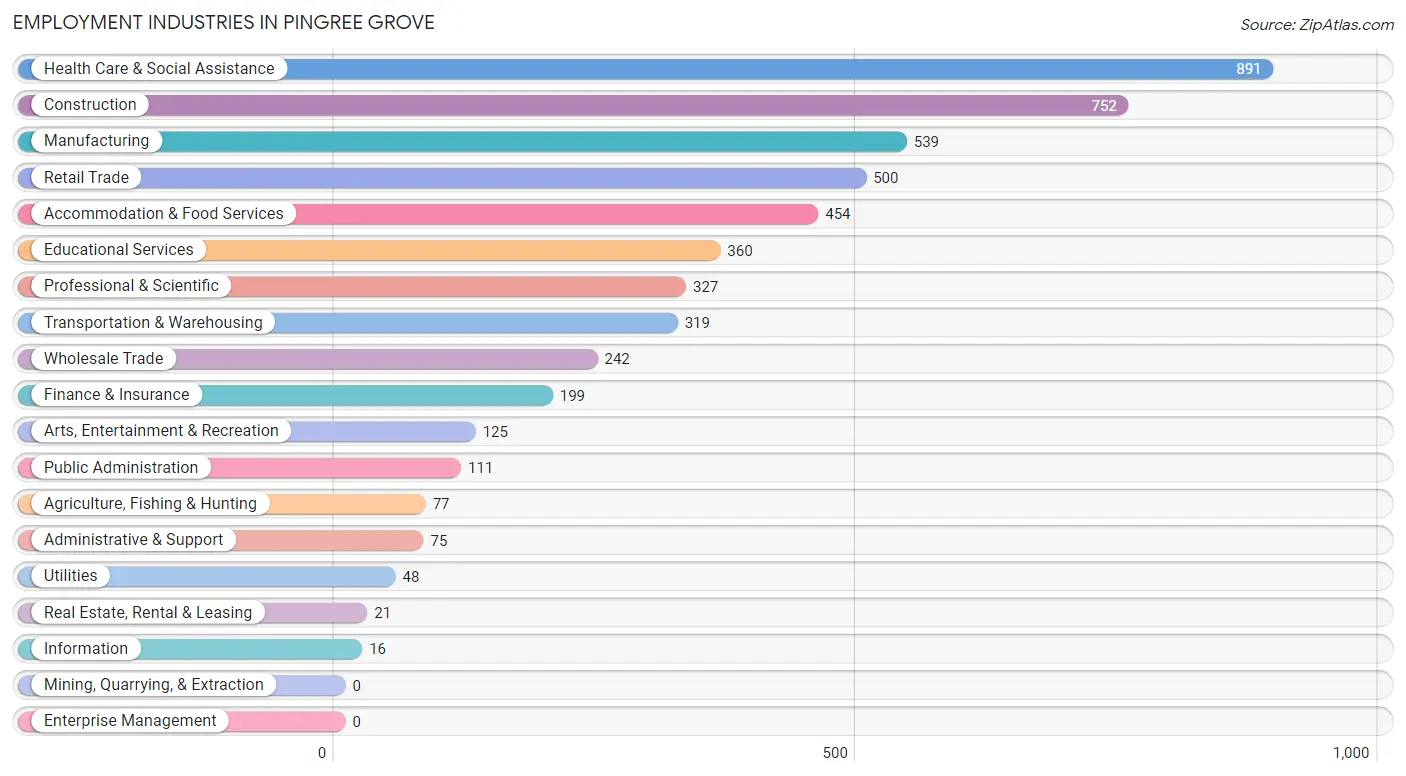
The major employment industries in Pingree Grove include Health Care & Social Assistance (891 | 17.0%), Construction (752 | 14.3%), Manufacturing (539 | 10.3%), Retail Trade (500 | 9.5%), and Accommodation & Food Services (454 | 8.7%).
Employment Industries by Sex in Pingree Grove
The Pingree Grove industries that see more men than women are Agriculture, Fishing & Hunting (100.0%), Utilities (100.0%), and Information (100.0%), whereas the industries that tend to have a higher number of women are Finance & Insurance (90.9%), Administrative & Support (81.3%), and Health Care & Social Assistance (68.6%).
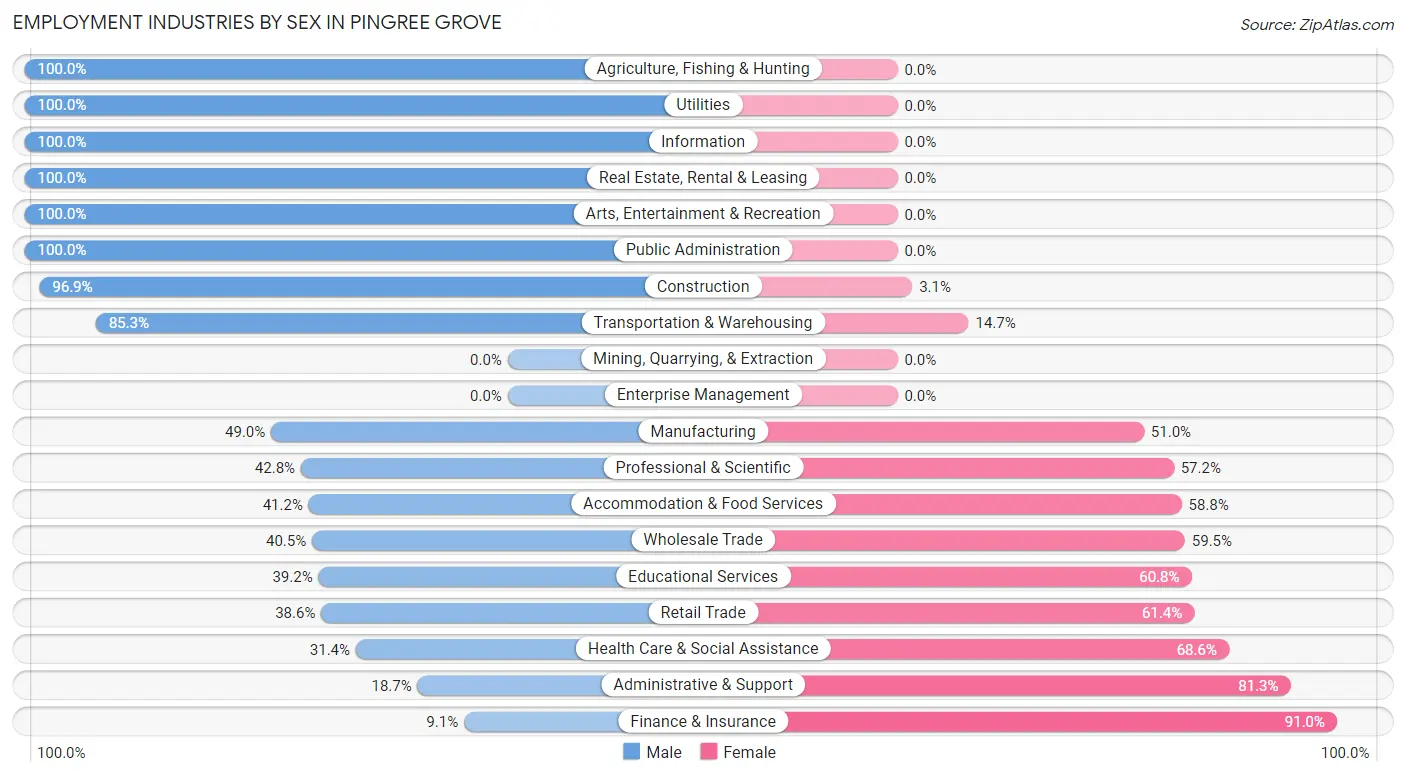
| Industry | Male | Female |
| Agriculture, Fishing & Hunting | 77 (100.0%) | 0 (0.0%) |
| Mining, Quarrying, & Extraction | 0 (0.0%) | 0 (0.0%) |
| Construction | 729 (96.9%) | 23 (3.1%) |
| Manufacturing | 264 (49.0%) | 275 (51.0%) |
| Wholesale Trade | 98 (40.5%) | 144 (59.5%) |
| Retail Trade | 193 (38.6%) | 307 (61.4%) |
| Transportation & Warehousing | 272 (85.3%) | 47 (14.7%) |
| Utilities | 48 (100.0%) | 0 (0.0%) |
| Information | 16 (100.0%) | 0 (0.0%) |
| Finance & Insurance | 18 (9.0%) | 181 (90.9%) |
| Real Estate, Rental & Leasing | 21 (100.0%) | 0 (0.0%) |
| Professional & Scientific | 140 (42.8%) | 187 (57.2%) |
| Enterprise Management | 0 (0.0%) | 0 (0.0%) |
| Administrative & Support | 14 (18.7%) | 61 (81.3%) |
| Educational Services | 141 (39.2%) | 219 (60.8%) |
| Health Care & Social Assistance | 280 (31.4%) | 611 (68.6%) |
| Arts, Entertainment & Recreation | 125 (100.0%) | 0 (0.0%) |
| Accommodation & Food Services | 187 (41.2%) | 267 (58.8%) |
| Public Administration | 111 (100.0%) | 0 (0.0%) |
| Total | 2,734 (52.1%) | 2,510 (47.9%) |
Education in Pingree Grove
School Enrollment in Pingree Grove
The most common levels of schooling among the 2,667 students in Pingree Grove are high school (794 | 29.8%), middle school (732 | 27.5%), and elementary school (485 | 18.2%).
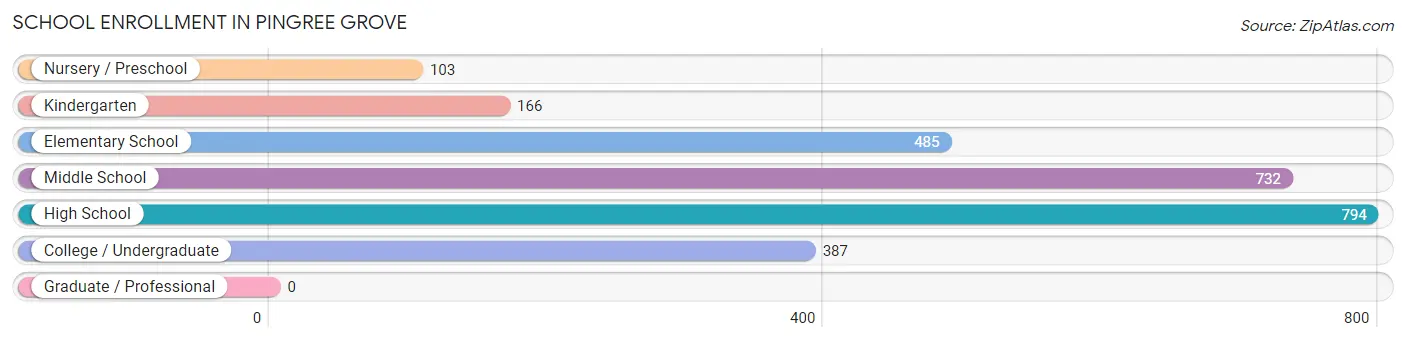
| School Level | # Students | % Students |
| Nursery / Preschool | 103 | 3.9% |
| Kindergarten | 166 | 6.2% |
| Elementary School | 485 | 18.2% |
| Middle School | 732 | 27.5% |
| High School | 794 | 29.8% |
| College / Undergraduate | 387 | 14.5% |
| Graduate / Professional | 0 | 0.0% |
| Total | 2,667 | 100.0% |
School Enrollment by Age by Funding Source in Pingree Grove
Out of a total of 2,667 students who are enrolled in schools in Pingree Grove, 56 (2.1%) attend a private institution, while the remaining 2,611 (97.9%) are enrolled in public schools. The age group of 35 years and over has the highest likelihood of being enrolled in private schools, with 37 (100.0% in the age bracket) enrolled. Conversely, the age group of 5 to 9 year old has the lowest likelihood of being enrolled in a private school, with 629 (100.0% in the age bracket) attending a public institution.
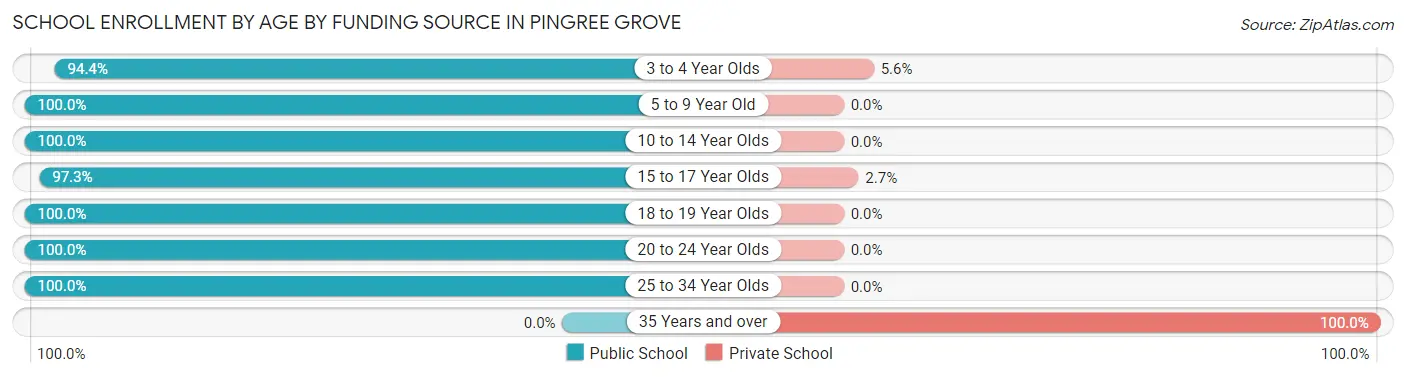
| Age Bracket | Public School | Private School |
| 3 to 4 Year Olds | 118 (94.4%) | 7 (5.6%) |
| 5 to 9 Year Old | 629 (100.0%) | 0 (0.0%) |
| 10 to 14 Year Olds | 1,052 (100.0%) | 0 (0.0%) |
| 15 to 17 Year Olds | 461 (97.3%) | 13 (2.7%) |
| 18 to 19 Year Olds | 7 (100.0%) | 0 (0.0%) |
| 20 to 24 Year Olds | 277 (100.0%) | 0 (0.0%) |
| 25 to 34 Year Olds | 66 (100.0%) | 0 (0.0%) |
| 35 Years and over | 0 (0.0%) | 37 (100.0%) |
| Total | 2,611 (97.9%) | 56 (2.1%) |
Educational Attainment by Field of Study in Pingree Grove
Business (1,100 | 32.5%), science & technology (561 | 16.6%), education (332 | 9.8%), physical & health sciences (301 | 8.9%), and psychology (205 | 6.1%) are the most common fields of study among 3,383 individuals in Pingree Grove who have obtained a bachelor's degree or higher.
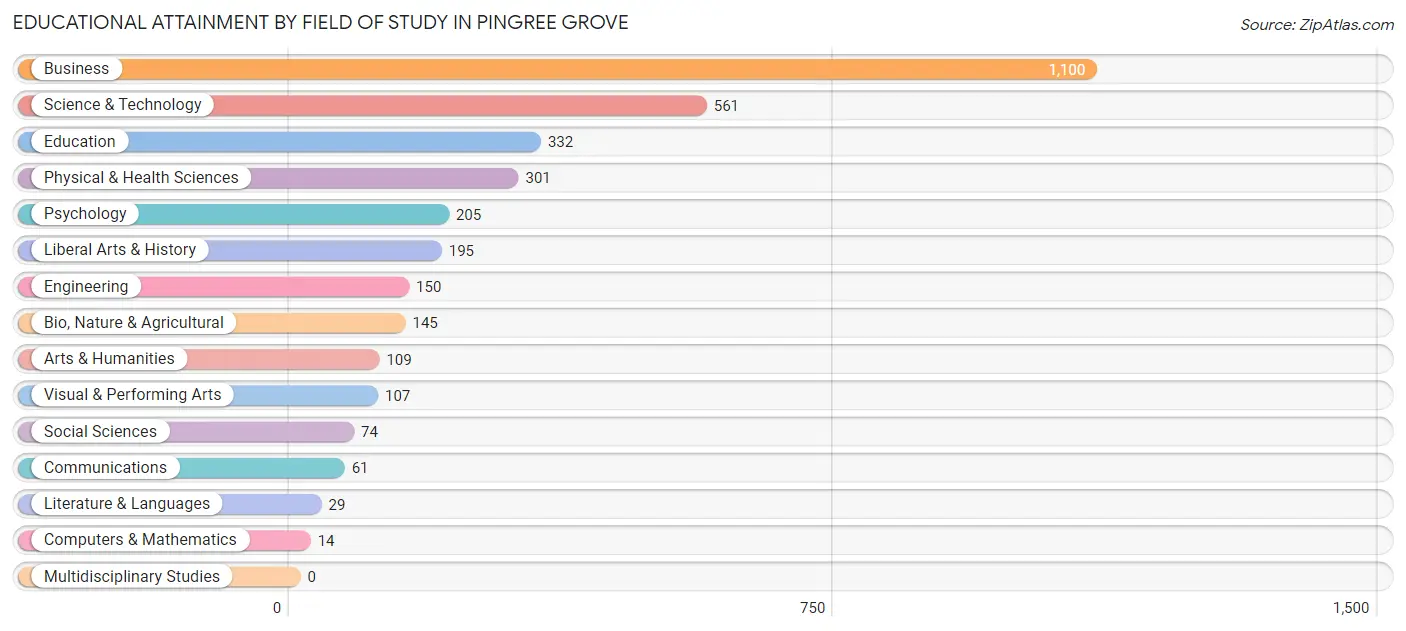
| Field of Study | # Graduates | % Graduates |
| Computers & Mathematics | 14 | 0.4% |
| Bio, Nature & Agricultural | 145 | 4.3% |
| Physical & Health Sciences | 301 | 8.9% |
| Psychology | 205 | 6.1% |
| Social Sciences | 74 | 2.2% |
| Engineering | 150 | 4.4% |
| Multidisciplinary Studies | 0 | 0.0% |
| Science & Technology | 561 | 16.6% |
| Business | 1,100 | 32.5% |
| Education | 332 | 9.8% |
| Literature & Languages | 29 | 0.9% |
| Liberal Arts & History | 195 | 5.8% |
| Visual & Performing Arts | 107 | 3.2% |
| Communications | 61 | 1.8% |
| Arts & Humanities | 109 | 3.2% |
| Total | 3,383 | 100.0% |
Transportation & Commute in Pingree Grove
Vehicle Availability by Sex in Pingree Grove
The most prevalent vehicle ownership categories in Pingree Grove are males with 2 vehicles (1,543, accounting for 57.8%) and females with 2 vehicles (1,448, making up 61.5%).
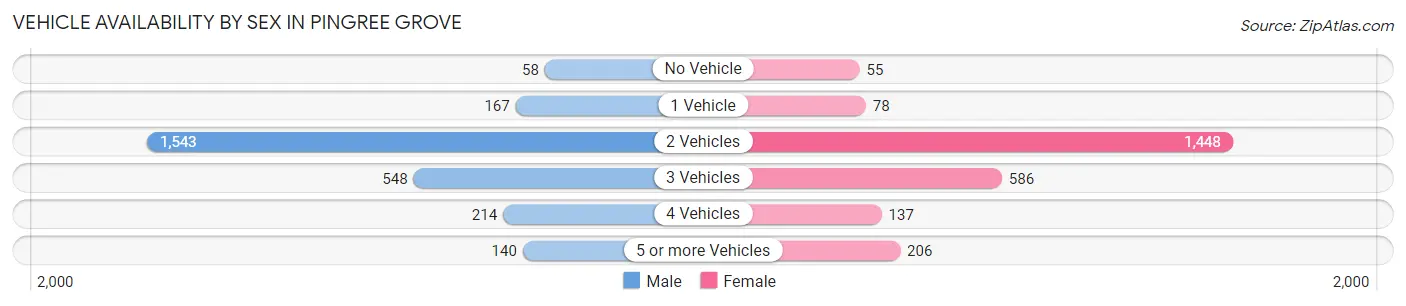
| Vehicles Available | Male | Female |
| No Vehicle | 58 (2.2%) | 55 (2.2%) |
| 1 Vehicle | 167 (6.2%) | 78 (3.1%) |
| 2 Vehicles | 1,543 (57.8%) | 1,448 (57.7%) |
| 3 Vehicles | 548 (20.5%) | 586 (23.4%) |
| 4 Vehicles | 214 (8.0%) | 137 (5.5%) |
| 5 or more Vehicles | 140 (5.2%) | 206 (8.2%) |
| Total | 2,670 (100.0%) | 2,510 (100.0%) |
Commute Time in Pingree Grove
The most frequently occuring commute durations in Pingree Grove are 45 to 59 minutes (1,306 commuters, 28.2%), 15 to 19 minutes (690 commuters, 14.9%), and 20 to 24 minutes (577 commuters, 12.5%).
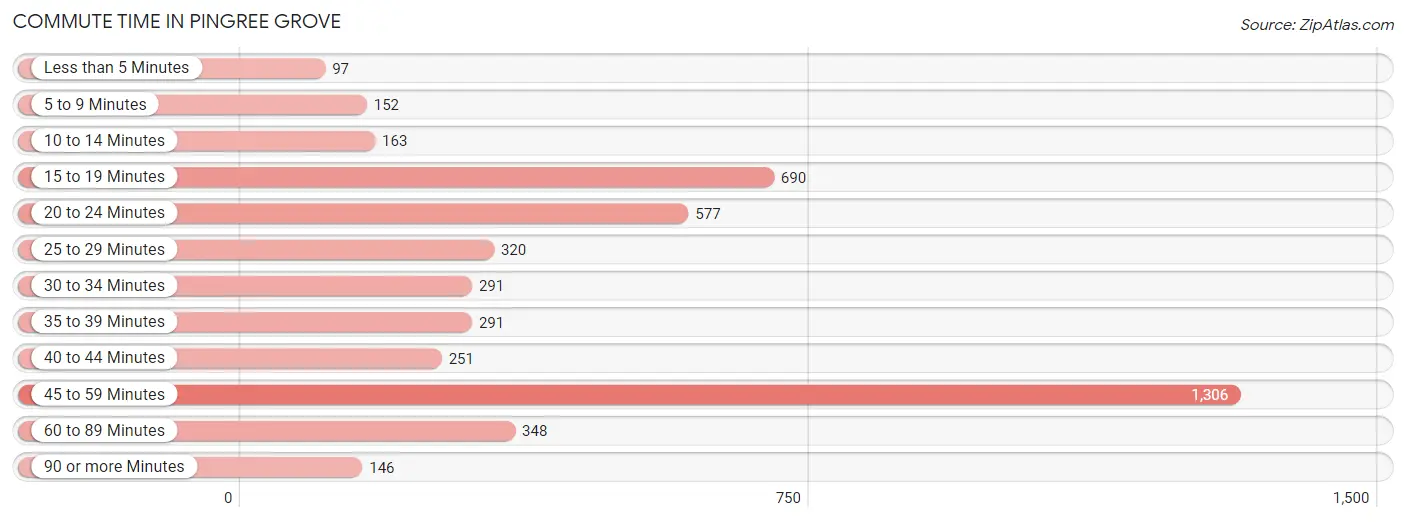
| Commute Time | # Commuters | % Commuters |
| Less than 5 Minutes | 97 | 2.1% |
| 5 to 9 Minutes | 152 | 3.3% |
| 10 to 14 Minutes | 163 | 3.5% |
| 15 to 19 Minutes | 690 | 14.9% |
| 20 to 24 Minutes | 577 | 12.5% |
| 25 to 29 Minutes | 320 | 6.9% |
| 30 to 34 Minutes | 291 | 6.3% |
| 35 to 39 Minutes | 291 | 6.3% |
| 40 to 44 Minutes | 251 | 5.4% |
| 45 to 59 Minutes | 1,306 | 28.2% |
| 60 to 89 Minutes | 348 | 7.5% |
| 90 or more Minutes | 146 | 3.2% |
Commute Time by Sex in Pingree Grove
The most common commute times in Pingree Grove are 45 to 59 minutes (902 commuters, 38.5%) for males and 15 to 19 minutes (465 commuters, 20.3%) for females.
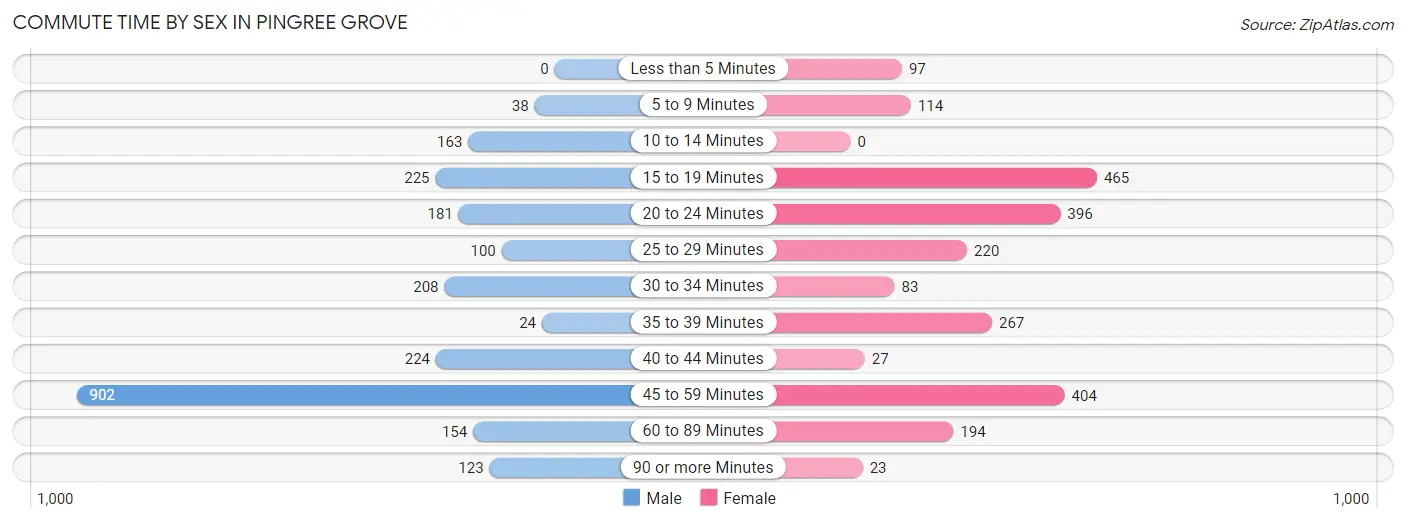
| Commute Time | Male | Female |
| Less than 5 Minutes | 0 (0.0%) | 97 (4.2%) |
| 5 to 9 Minutes | 38 (1.6%) | 114 (5.0%) |
| 10 to 14 Minutes | 163 (7.0%) | 0 (0.0%) |
| 15 to 19 Minutes | 225 (9.6%) | 465 (20.3%) |
| 20 to 24 Minutes | 181 (7.7%) | 396 (17.3%) |
| 25 to 29 Minutes | 100 (4.3%) | 220 (9.6%) |
| 30 to 34 Minutes | 208 (8.9%) | 83 (3.6%) |
| 35 to 39 Minutes | 24 (1.0%) | 267 (11.7%) |
| 40 to 44 Minutes | 224 (9.6%) | 27 (1.2%) |
| 45 to 59 Minutes | 902 (38.5%) | 404 (17.6%) |
| 60 to 89 Minutes | 154 (6.6%) | 194 (8.5%) |
| 90 or more Minutes | 123 (5.2%) | 23 (1.0%) |
Time of Departure to Work by Sex in Pingree Grove
The most frequent times of departure to work in Pingree Grove are 6:00 AM to 6:29 AM (614, 26.2%) for males and 6:00 AM to 6:29 AM (546, 23.8%) for females.
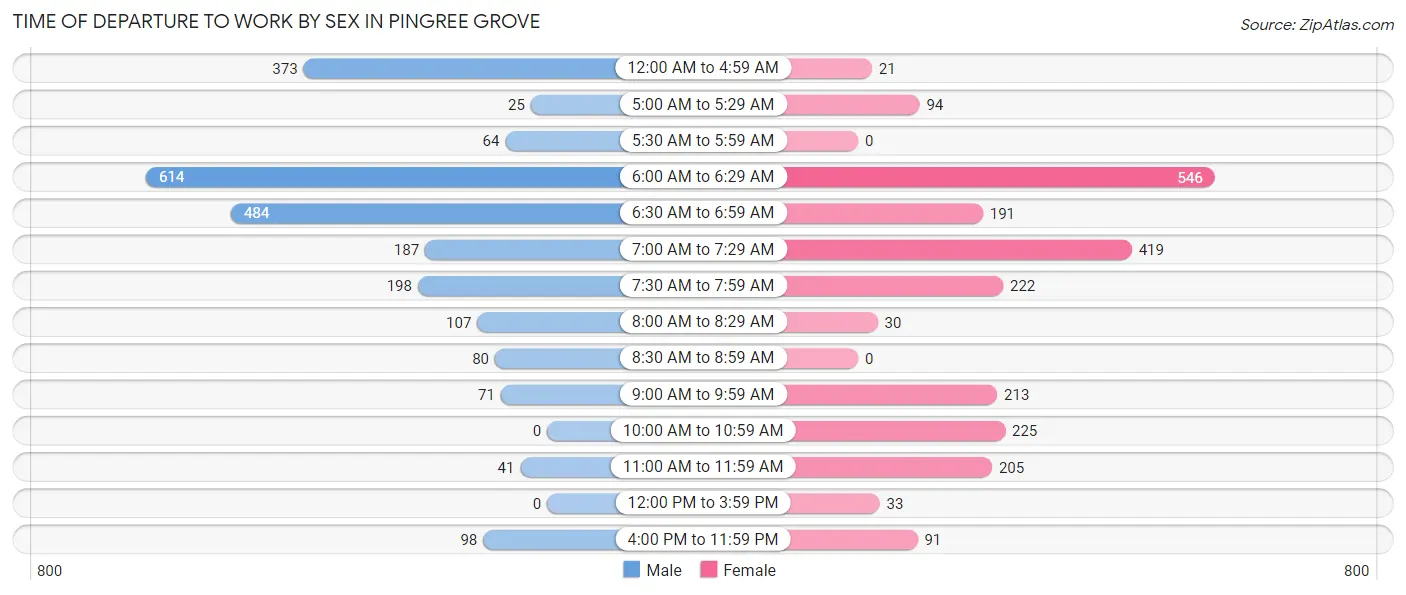
| Time of Departure | Male | Female |
| 12:00 AM to 4:59 AM | 373 (15.9%) | 21 (0.9%) |
| 5:00 AM to 5:29 AM | 25 (1.1%) | 94 (4.1%) |
| 5:30 AM to 5:59 AM | 64 (2.7%) | 0 (0.0%) |
| 6:00 AM to 6:29 AM | 614 (26.2%) | 546 (23.8%) |
| 6:30 AM to 6:59 AM | 484 (20.7%) | 191 (8.3%) |
| 7:00 AM to 7:29 AM | 187 (8.0%) | 419 (18.3%) |
| 7:30 AM to 7:59 AM | 198 (8.5%) | 222 (9.7%) |
| 8:00 AM to 8:29 AM | 107 (4.6%) | 30 (1.3%) |
| 8:30 AM to 8:59 AM | 80 (3.4%) | 0 (0.0%) |
| 9:00 AM to 9:59 AM | 71 (3.0%) | 213 (9.3%) |
| 10:00 AM to 10:59 AM | 0 (0.0%) | 225 (9.8%) |
| 11:00 AM to 11:59 AM | 41 (1.8%) | 205 (8.9%) |
| 12:00 PM to 3:59 PM | 0 (0.0%) | 33 (1.4%) |
| 4:00 PM to 11:59 PM | 98 (4.2%) | 91 (4.0%) |
| Total | 2,342 (100.0%) | 2,290 (100.0%) |
Housing Occupancy in Pingree Grove
Occupancy by Ownership in Pingree Grove
Of the total 3,412 dwellings in Pingree Grove, owner-occupied units account for 3,092 (90.6%), while renter-occupied units make up 320 (9.4%).
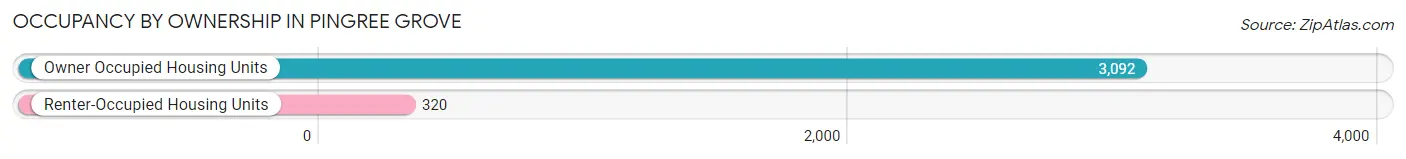
| Occupancy | # Housing Units | % Housing Units |
| Owner Occupied Housing Units | 3,092 | 90.6% |
| Renter-Occupied Housing Units | 320 | 9.4% |
| Total Occupied Housing Units | 3,412 | 100.0% |
Occupancy by Household Size in Pingree Grove
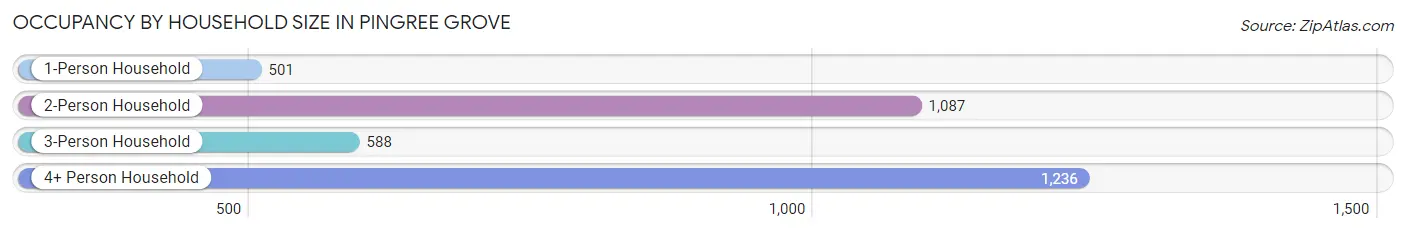
| Household Size | # Housing Units | % Housing Units |
| 1-Person Household | 501 | 14.7% |
| 2-Person Household | 1,087 | 31.9% |
| 3-Person Household | 588 | 17.2% |
| 4+ Person Household | 1,236 | 36.2% |
| Total Housing Units | 3,412 | 100.0% |
Occupancy by Ownership by Household Size in Pingree Grove
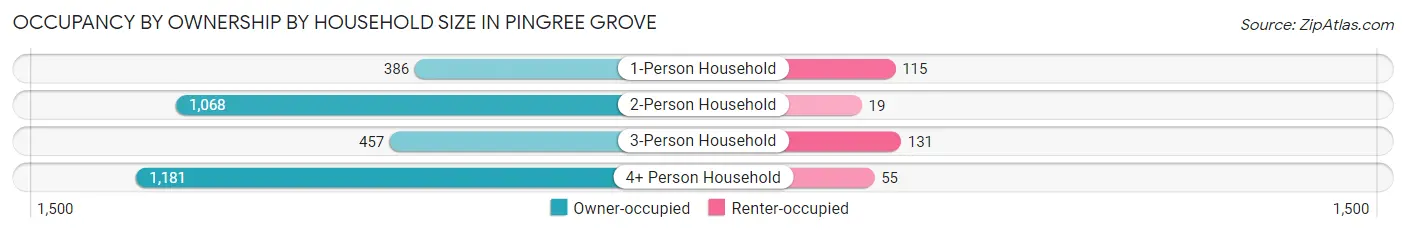
| Household Size | Owner-occupied | Renter-occupied |
| 1-Person Household | 386 (77.0%) | 115 (23.0%) |
| 2-Person Household | 1,068 (98.3%) | 19 (1.8%) |
| 3-Person Household | 457 (77.7%) | 131 (22.3%) |
| 4+ Person Household | 1,181 (95.6%) | 55 (4.4%) |
| Total Housing Units | 3,092 (90.6%) | 320 (9.4%) |
Occupancy by Educational Attainment in Pingree Grove
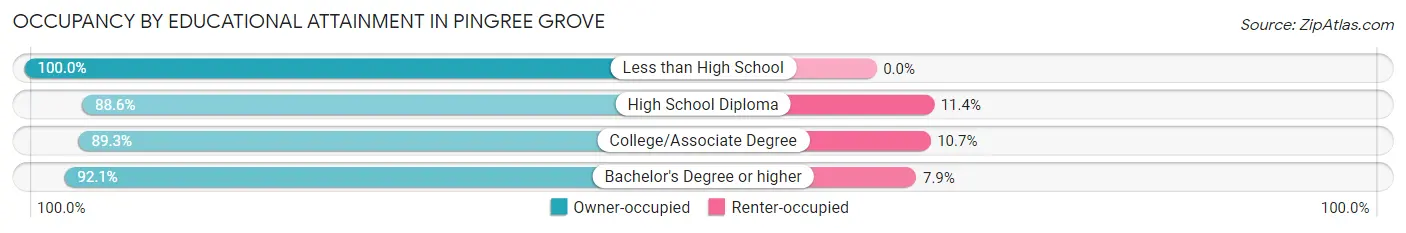
| Household Size | Owner-occupied | Renter-occupied |
| Less than High School | 22 (100.0%) | 0 (0.0%) |
| High School Diploma | 427 (88.6%) | 55 (11.4%) |
| College/Associate Degree | 1,116 (89.3%) | 134 (10.7%) |
| Bachelor's Degree or higher | 1,527 (92.1%) | 131 (7.9%) |
Occupancy by Age of Householder in Pingree Grove
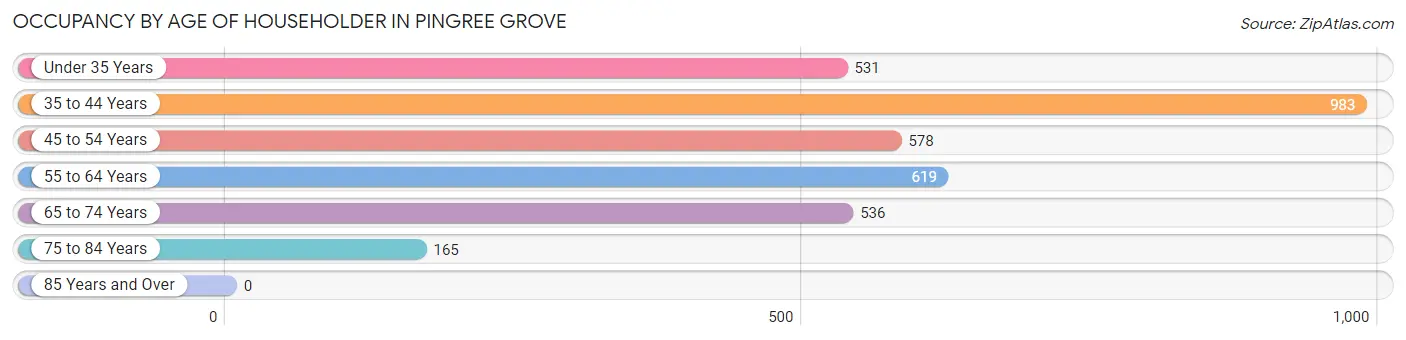
| Age Bracket | # Households | % Households |
| Under 35 Years | 531 | 15.6% |
| 35 to 44 Years | 983 | 28.8% |
| 45 to 54 Years | 578 | 16.9% |
| 55 to 64 Years | 619 | 18.1% |
| 65 to 74 Years | 536 | 15.7% |
| 75 to 84 Years | 165 | 4.8% |
| 85 Years and Over | 0 | 0.0% |
| Total | 3,412 | 100.0% |
Housing Finances in Pingree Grove
Median Income by Occupancy in Pingree Grove
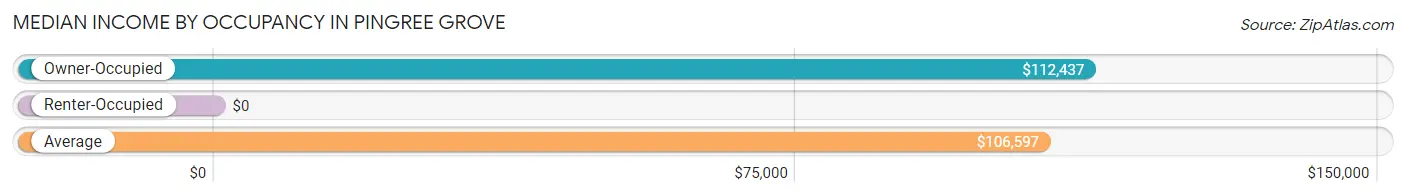
| Occupancy Type | # Households | Median Income |
| Owner-Occupied | 3,092 (90.6%) | $112,437 |
| Renter-Occupied | 320 (9.4%) | $0 |
| Average | 3,412 (100.0%) | $106,597 |
Occupancy by Householder Income Bracket in Pingree Grove
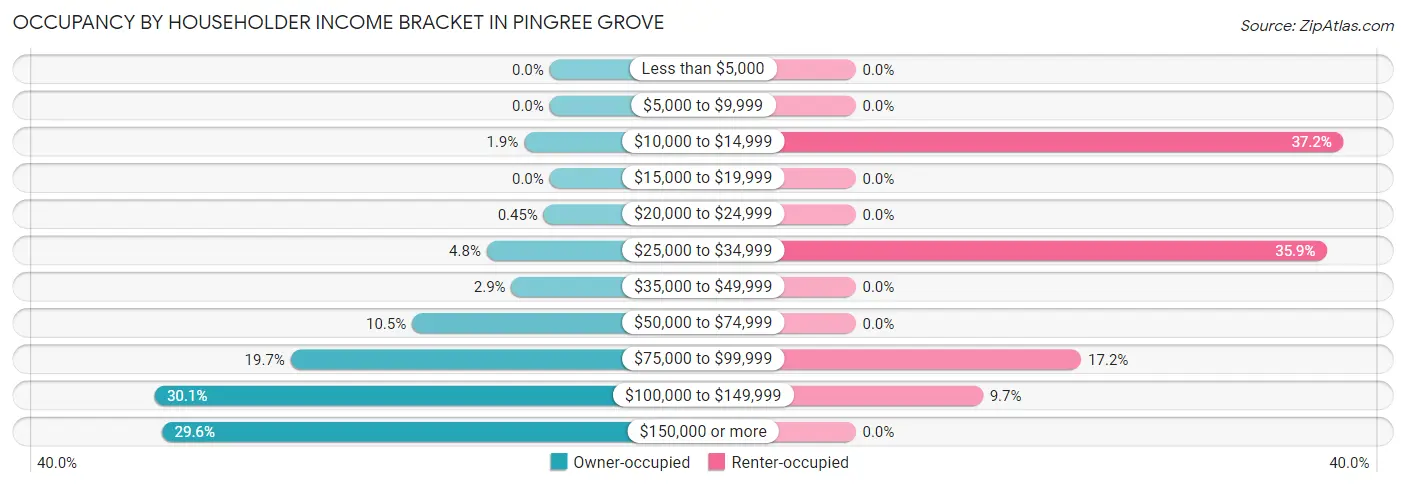
| Income Bracket | Owner-occupied | Renter-occupied |
| Less than $5,000 | 0 (0.0%) | 0 (0.0%) |
| $5,000 to $9,999 | 0 (0.0%) | 0 (0.0%) |
| $10,000 to $14,999 | 60 (1.9%) | 119 (37.2%) |
| $15,000 to $19,999 | 0 (0.0%) | 0 (0.0%) |
| $20,000 to $24,999 | 14 (0.4%) | 0 (0.0%) |
| $25,000 to $34,999 | 148 (4.8%) | 115 (35.9%) |
| $35,000 to $49,999 | 90 (2.9%) | 0 (0.0%) |
| $50,000 to $74,999 | 324 (10.5%) | 0 (0.0%) |
| $75,000 to $99,999 | 610 (19.7%) | 55 (17.2%) |
| $100,000 to $149,999 | 932 (30.1%) | 31 (9.7%) |
| $150,000 or more | 914 (29.6%) | 0 (0.0%) |
| Total | 3,092 (100.0%) | 320 (100.0%) |
Monthly Housing Cost Tiers in Pingree Grove
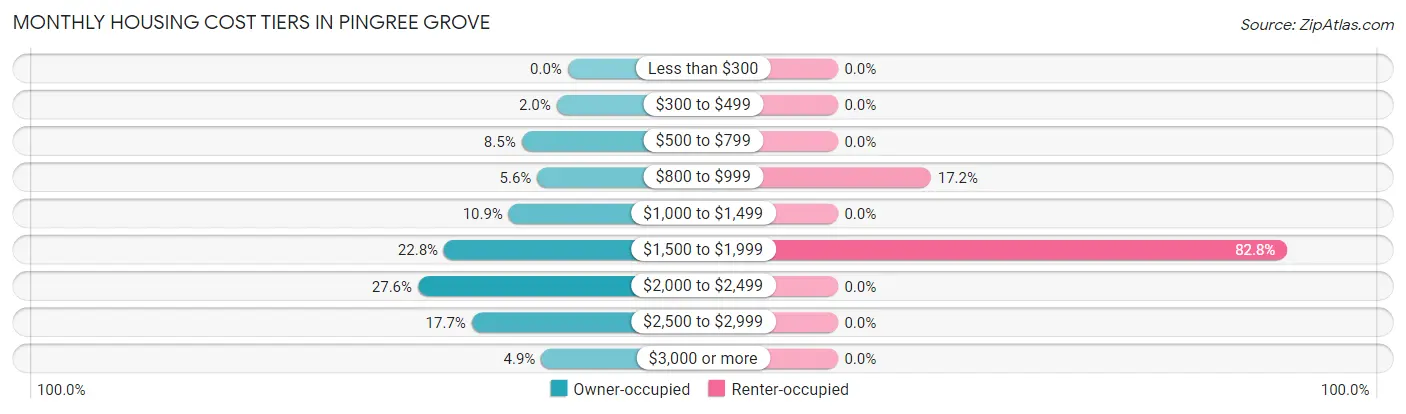
| Monthly Cost | Owner-occupied | Renter-occupied |
| Less than $300 | 0 (0.0%) | 0 (0.0%) |
| $300 to $499 | 63 (2.0%) | 0 (0.0%) |
| $500 to $799 | 263 (8.5%) | 0 (0.0%) |
| $800 to $999 | 174 (5.6%) | 55 (17.2%) |
| $1,000 to $1,499 | 336 (10.9%) | 0 (0.0%) |
| $1,500 to $1,999 | 705 (22.8%) | 265 (82.8%) |
| $2,000 to $2,499 | 853 (27.6%) | 0 (0.0%) |
| $2,500 to $2,999 | 547 (17.7%) | 0 (0.0%) |
| $3,000 or more | 151 (4.9%) | 0 (0.0%) |
| Total | 3,092 (100.0%) | 320 (100.0%) |
Physical Housing Characteristics in Pingree Grove
Housing Structures in Pingree Grove
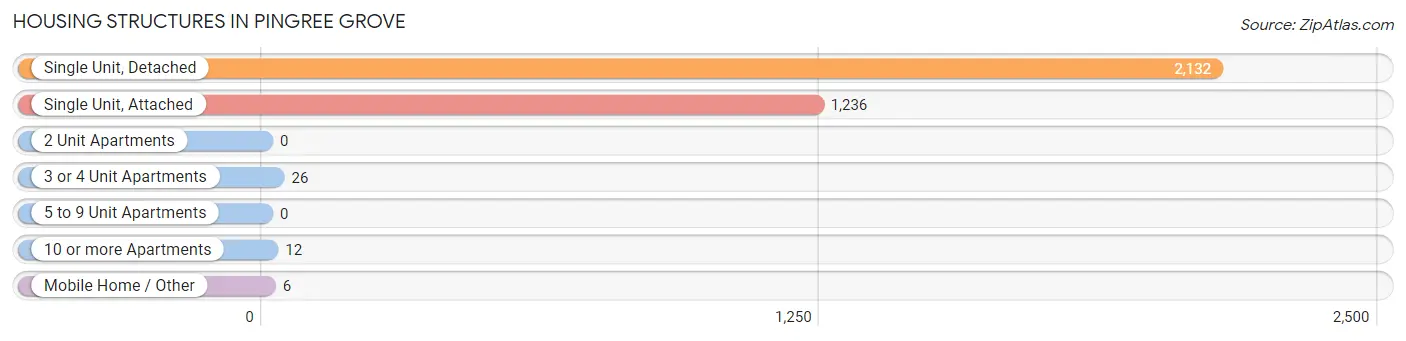
| Structure Type | # Housing Units | % Housing Units |
| Single Unit, Detached | 2,132 | 62.5% |
| Single Unit, Attached | 1,236 | 36.2% |
| 2 Unit Apartments | 0 | 0.0% |
| 3 or 4 Unit Apartments | 26 | 0.8% |
| 5 to 9 Unit Apartments | 0 | 0.0% |
| 10 or more Apartments | 12 | 0.4% |
| Mobile Home / Other | 6 | 0.2% |
| Total | 3,412 | 100.0% |
Housing Structures by Occupancy in Pingree Grove
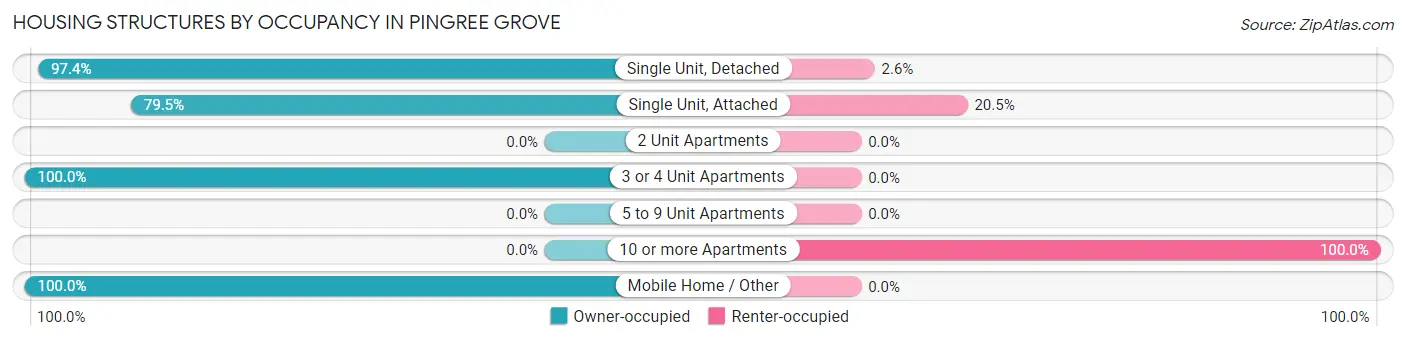
| Structure Type | Owner-occupied | Renter-occupied |
| Single Unit, Detached | 2,077 (97.4%) | 55 (2.6%) |
| Single Unit, Attached | 983 (79.5%) | 253 (20.5%) |
| 2 Unit Apartments | 0 (0.0%) | 0 (0.0%) |
| 3 or 4 Unit Apartments | 26 (100.0%) | 0 (0.0%) |
| 5 to 9 Unit Apartments | 0 (0.0%) | 0 (0.0%) |
| 10 or more Apartments | 0 (0.0%) | 12 (100.0%) |
| Mobile Home / Other | 6 (100.0%) | 0 (0.0%) |
| Total | 3,092 (90.6%) | 320 (9.4%) |
Housing Structures by Number of Rooms in Pingree Grove
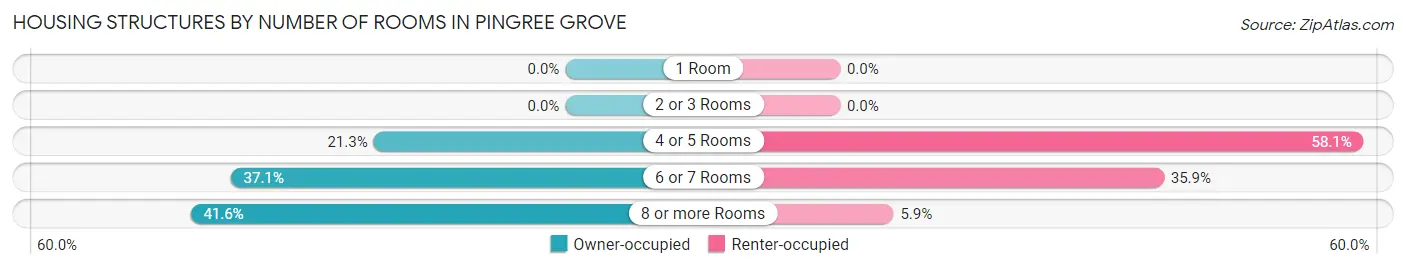
| Number of Rooms | Owner-occupied | Renter-occupied |
| 1 Room | 0 (0.0%) | 0 (0.0%) |
| 2 or 3 Rooms | 0 (0.0%) | 0 (0.0%) |
| 4 or 5 Rooms | 658 (21.3%) | 186 (58.1%) |
| 6 or 7 Rooms | 1,148 (37.1%) | 115 (35.9%) |
| 8 or more Rooms | 1,286 (41.6%) | 19 (5.9%) |
| Total | 3,092 (100.0%) | 320 (100.0%) |
Housing Structure by Heating Type in Pingree Grove
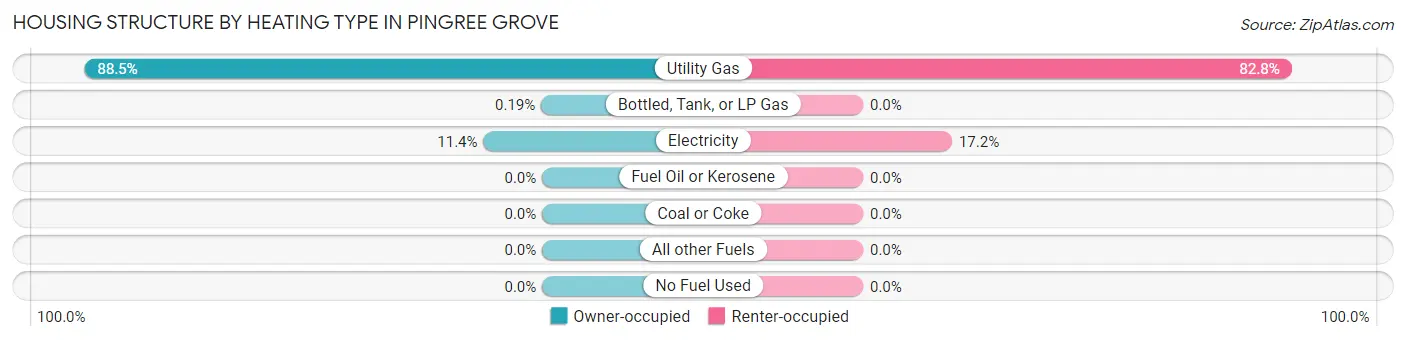
| Heating Type | Owner-occupied | Renter-occupied |
| Utility Gas | 2,735 (88.4%) | 265 (82.8%) |
| Bottled, Tank, or LP Gas | 6 (0.2%) | 0 (0.0%) |
| Electricity | 351 (11.4%) | 55 (17.2%) |
| Fuel Oil or Kerosene | 0 (0.0%) | 0 (0.0%) |
| Coal or Coke | 0 (0.0%) | 0 (0.0%) |
| All other Fuels | 0 (0.0%) | 0 (0.0%) |
| No Fuel Used | 0 (0.0%) | 0 (0.0%) |
| Total | 3,092 (100.0%) | 320 (100.0%) |
Household Vehicle Usage in Pingree Grove
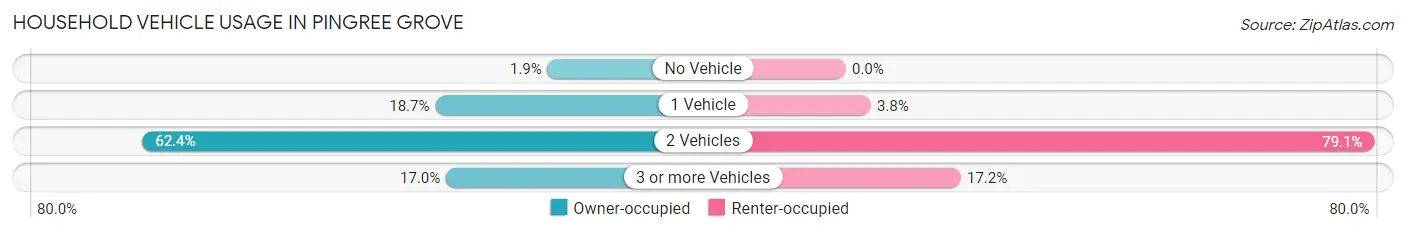
| Vehicles per Household | Owner-occupied | Renter-occupied |
| No Vehicle | 58 (1.9%) | 0 (0.0%) |
| 1 Vehicle | 577 (18.7%) | 12 (3.7%) |
| 2 Vehicles | 1,930 (62.4%) | 253 (79.1%) |
| 3 or more Vehicles | 527 (17.0%) | 55 (17.2%) |
| Total | 3,092 (100.0%) | 320 (100.0%) |
Real Estate & Mortgages in Pingree Grove
Real Estate and Mortgage Overview in Pingree Grove
| Characteristic | Without Mortgage | With Mortgage |
| Housing Units | 812 | 2,280 |
| Median Property Value | $271,400 | $298,600 |
| Median Household Income | $69,921 | $881 |
| Monthly Housing Costs | $908 | $151 |
| Real Estate Taxes | $6,160 | $125 |
Property Value by Mortgage Status in Pingree Grove
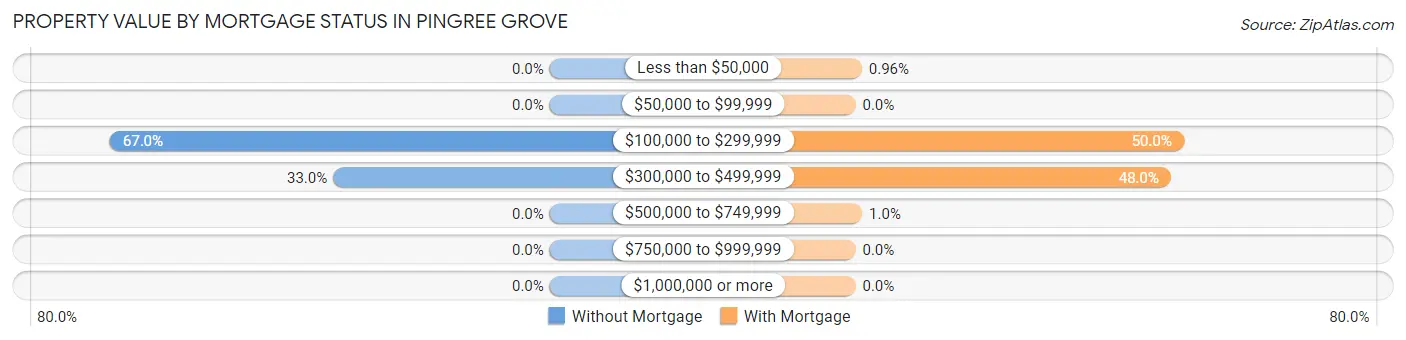
| Property Value | Without Mortgage | With Mortgage |
| Less than $50,000 | 0 (0.0%) | 22 (1.0%) |
| $50,000 to $99,999 | 0 (0.0%) | 0 (0.0%) |
| $100,000 to $299,999 | 544 (67.0%) | 1,140 (50.0%) |
| $300,000 to $499,999 | 268 (33.0%) | 1,095 (48.0%) |
| $500,000 to $749,999 | 0 (0.0%) | 23 (1.0%) |
| $750,000 to $999,999 | 0 (0.0%) | 0 (0.0%) |
| $1,000,000 or more | 0 (0.0%) | 0 (0.0%) |
| Total | 812 (100.0%) | 2,280 (100.0%) |
Household Income by Mortgage Status in Pingree Grove
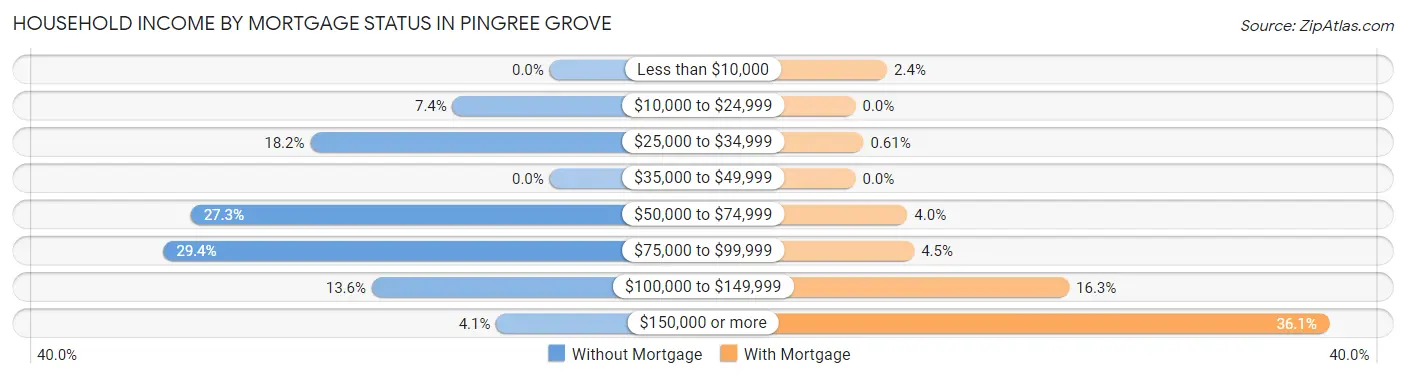
| Household Income | Without Mortgage | With Mortgage |
| Less than $10,000 | 0 (0.0%) | 55 (2.4%) |
| $10,000 to $24,999 | 60 (7.4%) | 0 (0.0%) |
| $25,000 to $34,999 | 148 (18.2%) | 14 (0.6%) |
| $35,000 to $49,999 | 0 (0.0%) | 0 (0.0%) |
| $50,000 to $74,999 | 222 (27.3%) | 90 (4.0%) |
| $75,000 to $99,999 | 239 (29.4%) | 102 (4.5%) |
| $100,000 to $149,999 | 110 (13.6%) | 371 (16.3%) |
| $150,000 or more | 33 (4.1%) | 822 (36.0%) |
| Total | 812 (100.0%) | 2,280 (100.0%) |
Property Value to Household Income Ratio in Pingree Grove
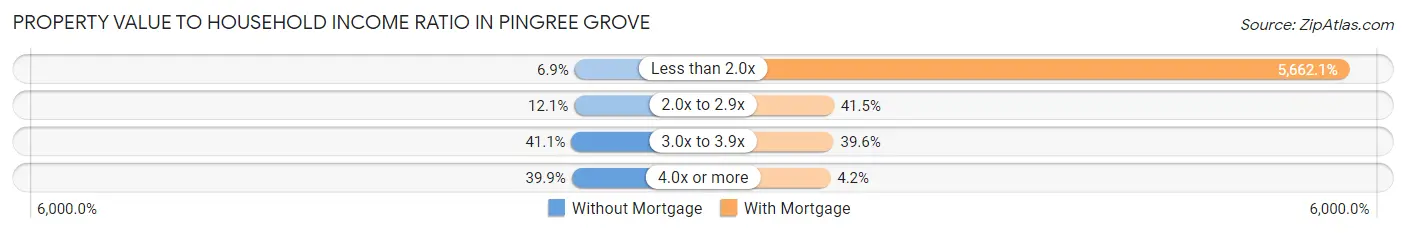
| Value-to-Income Ratio | Without Mortgage | With Mortgage |
| Less than 2.0x | 56 (6.9%) | 129,096 (5,662.1%) |
| 2.0x to 2.9x | 98 (12.1%) | 947 (41.5%) |
| 3.0x to 3.9x | 334 (41.1%) | 903 (39.6%) |
| 4.0x or more | 324 (39.9%) | 96 (4.2%) |
| Total | 812 (100.0%) | 2,280 (100.0%) |
Real Estate Taxes by Mortgage Status in Pingree Grove
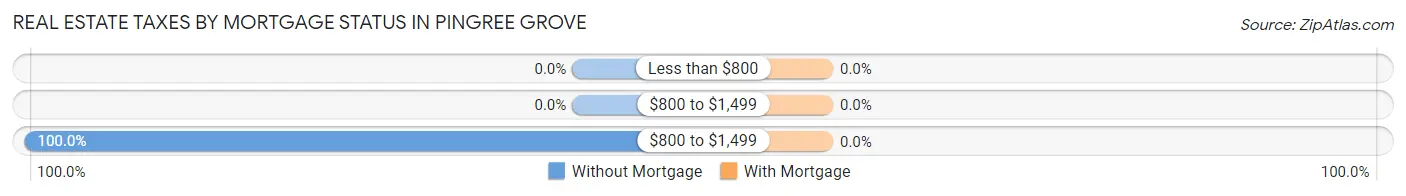
| Property Taxes | Without Mortgage | With Mortgage |
| Less than $800 | 0 (0.0%) | 0 (0.0%) |
| $800 to $1,499 | 0 (0.0%) | 0 (0.0%) |
| $800 to $1,499 | 812 (100.0%) | 0 (0.0%) |
| Total | 812 (100.0%) | 2,280 (100.0%) |
Health & Disability in Pingree Grove
Health Insurance Coverage by Age in Pingree Grove
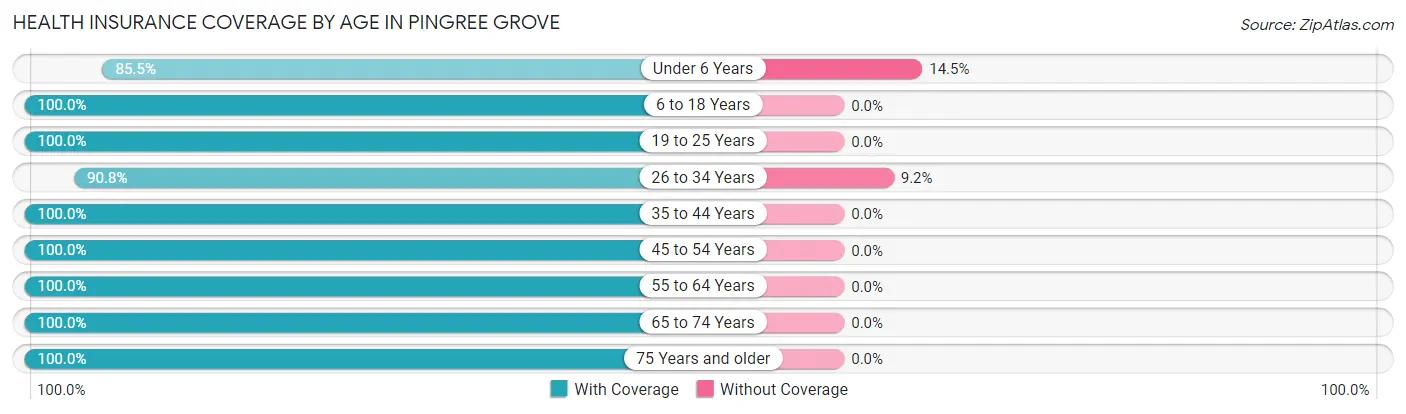
| Age Bracket | With Coverage | Without Coverage |
| Under 6 Years | 664 (85.5%) | 113 (14.5%) |
| 6 to 18 Years | 2,177 (100.0%) | 0 (0.0%) |
| 19 to 25 Years | 679 (100.0%) | 0 (0.0%) |
| 26 to 34 Years | 1,170 (90.8%) | 119 (9.2%) |
| 35 to 44 Years | 1,894 (100.0%) | 0 (0.0%) |
| 45 to 54 Years | 1,165 (100.0%) | 0 (0.0%) |
| 55 to 64 Years | 1,099 (100.0%) | 0 (0.0%) |
| 65 to 74 Years | 937 (100.0%) | 0 (0.0%) |
| 75 Years and older | 194 (100.0%) | 0 (0.0%) |
| Total | 9,979 (97.7%) | 232 (2.3%) |
Health Insurance Coverage by Citizenship Status in Pingree Grove

| Citizenship Status | With Coverage | Without Coverage |
| Native Born | 664 (85.5%) | 113 (14.5%) |
| Foreign Born, Citizen | 2,177 (100.0%) | 0 (0.0%) |
| Foreign Born, not a Citizen | 679 (100.0%) | 0 (0.0%) |
Health Insurance Coverage by Household Income in Pingree Grove
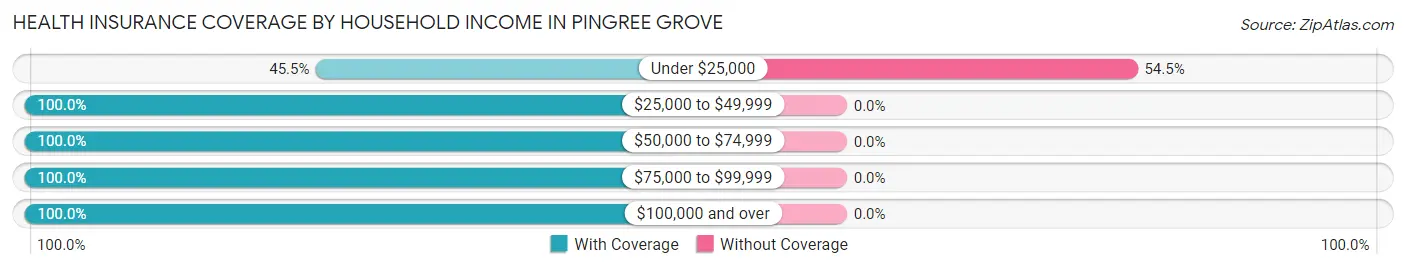
| Household Income | With Coverage | Without Coverage |
| Under $25,000 | 194 (45.5%) | 232 (54.5%) |
| $25,000 to $49,999 | 457 (100.0%) | 0 (0.0%) |
| $50,000 to $74,999 | 931 (100.0%) | 0 (0.0%) |
| $75,000 to $99,999 | 1,755 (100.0%) | 0 (0.0%) |
| $100,000 and over | 6,642 (100.0%) | 0 (0.0%) |
Public vs Private Health Insurance Coverage by Age in Pingree Grove
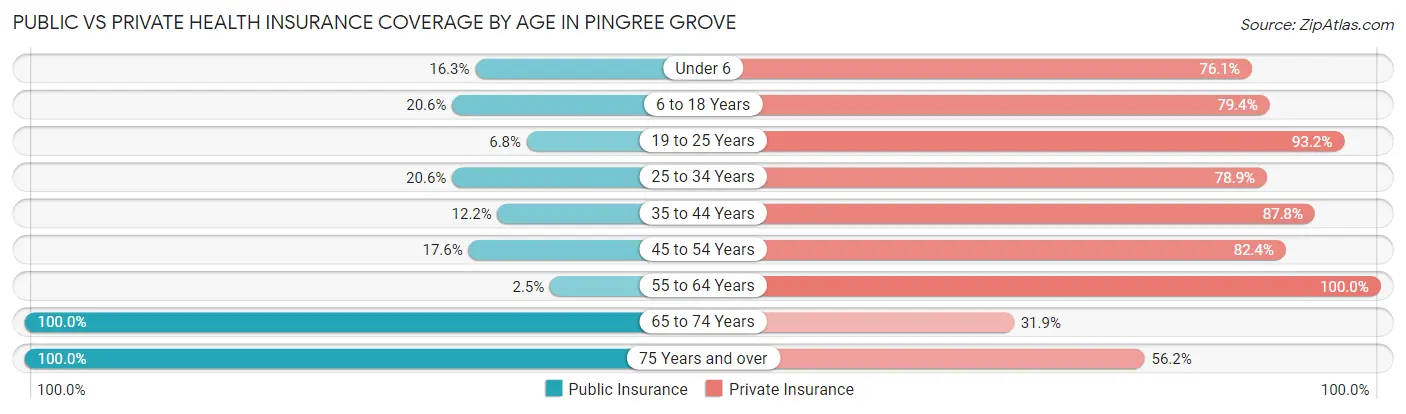
| Age Bracket | Public Insurance | Private Insurance |
| Under 6 | 127 (16.3%) | 591 (76.1%) |
| 6 to 18 Years | 449 (20.6%) | 1,728 (79.4%) |
| 19 to 25 Years | 46 (6.8%) | 633 (93.2%) |
| 25 to 34 Years | 266 (20.6%) | 1,017 (78.9%) |
| 35 to 44 Years | 231 (12.2%) | 1,663 (87.8%) |
| 45 to 54 Years | 205 (17.6%) | 960 (82.4%) |
| 55 to 64 Years | 27 (2.5%) | 1,099 (100.0%) |
| 65 to 74 Years | 937 (100.0%) | 299 (31.9%) |
| 75 Years and over | 194 (100.0%) | 109 (56.2%) |
| Total | 2,482 (24.3%) | 8,099 (79.3%) |
Disability Status by Sex by Age in Pingree Grove
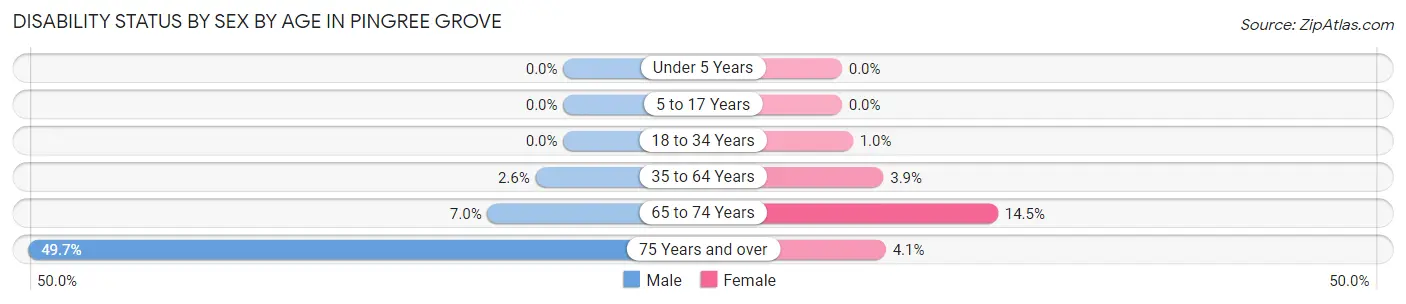
| Age Bracket | Male | Female |
| Under 5 Years | 0 (0.0%) | 0 (0.0%) |
| 5 to 17 Years | 0 (0.0%) | 0 (0.0%) |
| 18 to 34 Years | 0 (0.0%) | 11 (1.0%) |
| 35 to 64 Years | 55 (2.6%) | 78 (3.8%) |
| 65 to 74 Years | 29 (7.0%) | 76 (14.5%) |
| 75 Years and over | 72 (49.7%) | 2 (4.1%) |
Disability Class by Sex by Age in Pingree Grove
Disability Class: Hearing Difficulty
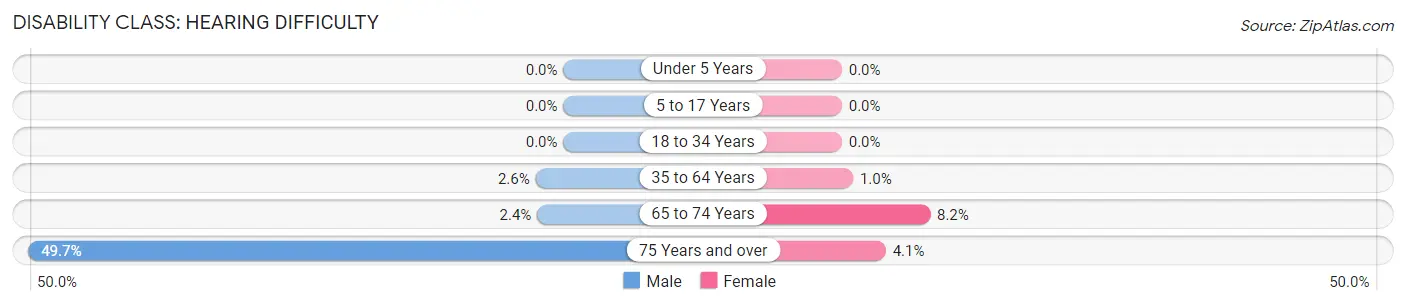
| Age Bracket | Male | Female |
| Under 5 Years | 0 (0.0%) | 0 (0.0%) |
| 5 to 17 Years | 0 (0.0%) | 0 (0.0%) |
| 18 to 34 Years | 0 (0.0%) | 0 (0.0%) |
| 35 to 64 Years | 55 (2.6%) | 21 (1.0%) |
| 65 to 74 Years | 10 (2.4%) | 43 (8.2%) |
| 75 Years and over | 72 (49.7%) | 2 (4.1%) |
Disability Class: Vision Difficulty
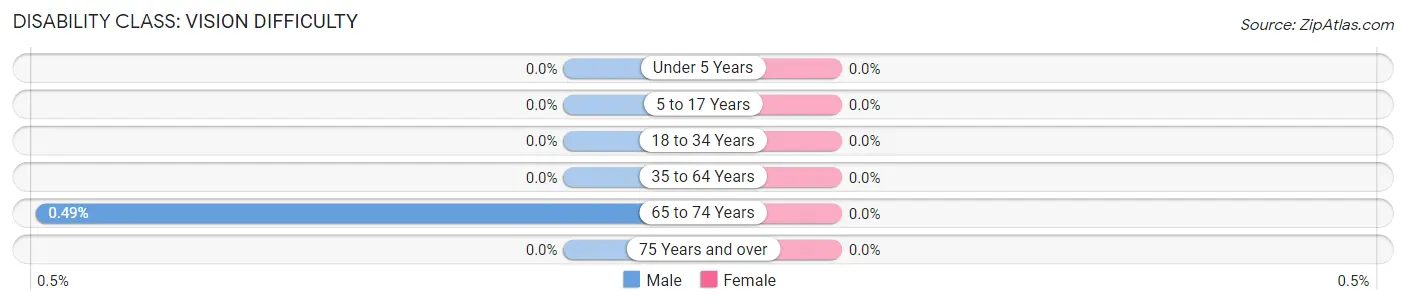
| Age Bracket | Male | Female |
| Under 5 Years | 0 (0.0%) | 0 (0.0%) |
| 5 to 17 Years | 0 (0.0%) | 0 (0.0%) |
| 18 to 34 Years | 0 (0.0%) | 0 (0.0%) |
| 35 to 64 Years | 0 (0.0%) | 0 (0.0%) |
| 65 to 74 Years | 2 (0.5%) | 0 (0.0%) |
| 75 Years and over | 0 (0.0%) | 0 (0.0%) |
Disability Class: Cognitive Difficulty
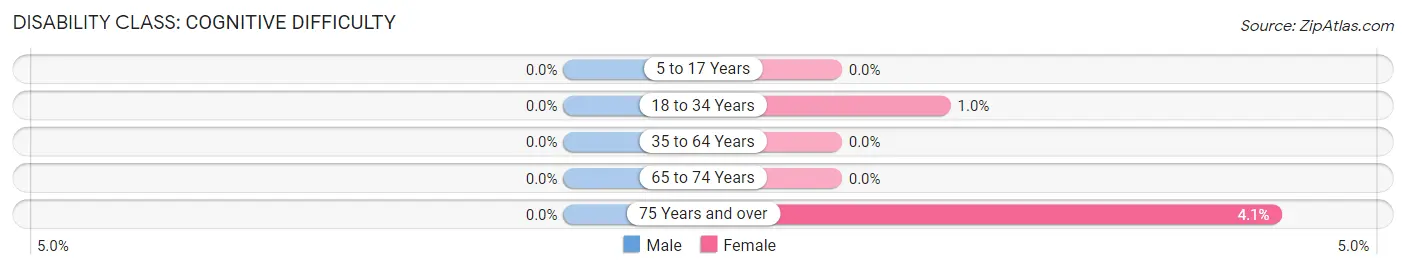
| Age Bracket | Male | Female |
| 5 to 17 Years | 0 (0.0%) | 0 (0.0%) |
| 18 to 34 Years | 0 (0.0%) | 11 (1.0%) |
| 35 to 64 Years | 0 (0.0%) | 0 (0.0%) |
| 65 to 74 Years | 0 (0.0%) | 0 (0.0%) |
| 75 Years and over | 0 (0.0%) | 2 (4.1%) |
Disability Class: Ambulatory Difficulty
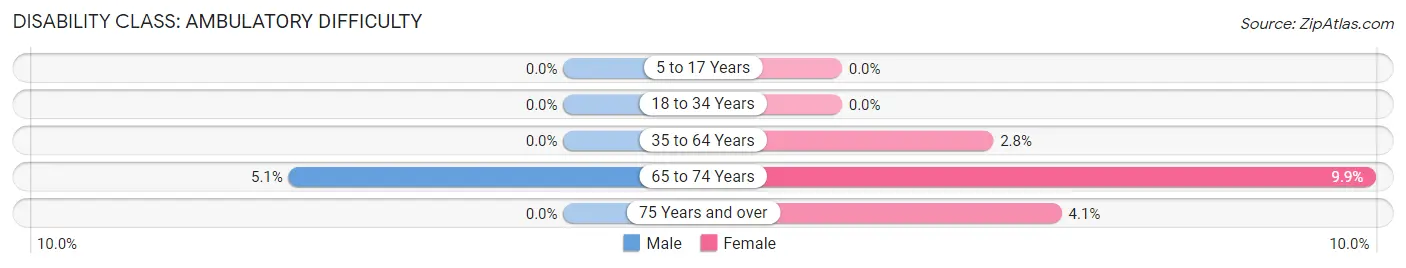
| Age Bracket | Male | Female |
| 5 to 17 Years | 0 (0.0%) | 0 (0.0%) |
| 18 to 34 Years | 0 (0.0%) | 0 (0.0%) |
| 35 to 64 Years | 0 (0.0%) | 57 (2.8%) |
| 65 to 74 Years | 21 (5.1%) | 52 (9.9%) |
| 75 Years and over | 0 (0.0%) | 2 (4.1%) |
Disability Class: Self-Care Difficulty
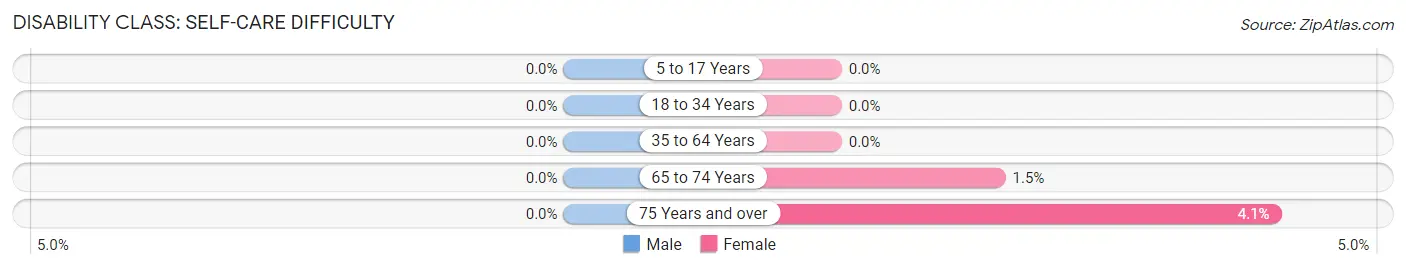
| Age Bracket | Male | Female |
| 5 to 17 Years | 0 (0.0%) | 0 (0.0%) |
| 18 to 34 Years | 0 (0.0%) | 0 (0.0%) |
| 35 to 64 Years | 0 (0.0%) | 0 (0.0%) |
| 65 to 74 Years | 0 (0.0%) | 8 (1.5%) |
| 75 Years and over | 0 (0.0%) | 2 (4.1%) |
Technology Access in Pingree Grove
Computing Device Access in Pingree Grove
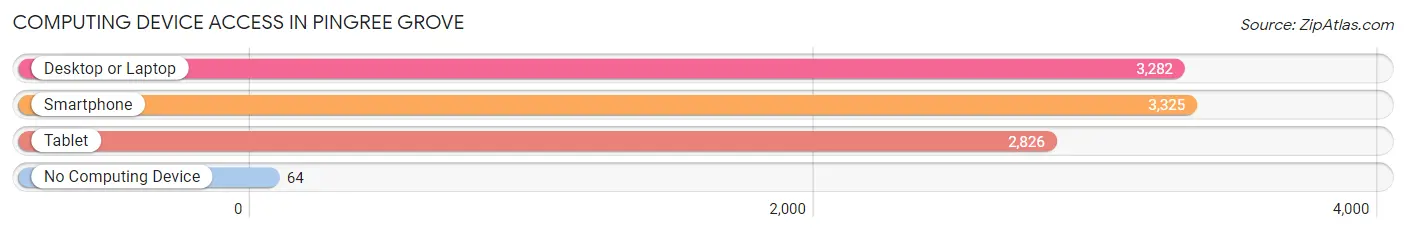
| Device Type | # Households | % Households |
| Desktop or Laptop | 3,282 | 96.2% |
| Smartphone | 3,325 | 97.5% |
| Tablet | 2,826 | 82.8% |
| No Computing Device | 64 | 1.9% |
| Total | 3,412 | 100.0% |
Internet Access in Pingree Grove
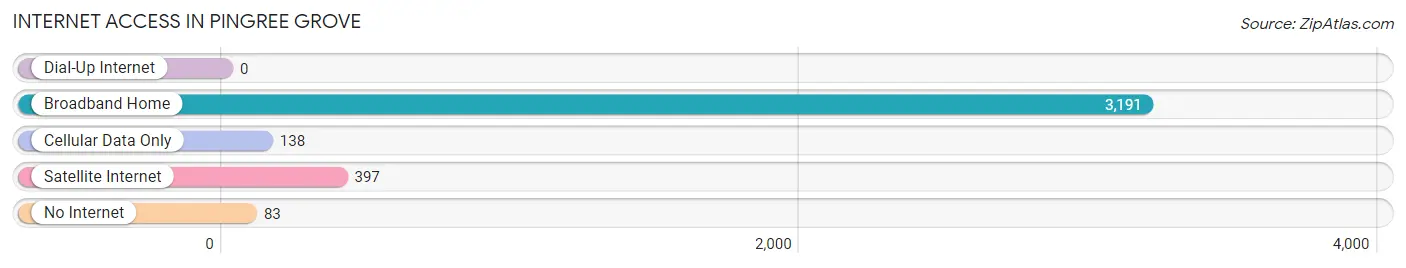
| Internet Type | # Households | % Households |
| Dial-Up Internet | 0 | 0.0% |
| Broadband Home | 3,191 | 93.5% |
| Cellular Data Only | 138 | 4.0% |
| Satellite Internet | 397 | 11.6% |
| No Internet | 83 | 2.4% |
| Total | 3,412 | 100.0% |
Pingree Grove Summary
History
The history of Pingree Grove, Illinois dates back to the early 1800s when the area was first settled by European immigrants. The first settlers were primarily of German and Irish descent, and the area was known as “Pingree’s Grove” after the first settler, William Pingree. The area was originally part of the Northwest Territory, and was later annexed by the state of Illinois in 1818.
The area was primarily agricultural in nature, with the main crops being corn, wheat, and oats. The area was also known for its dairy farms, which provided milk and other dairy products to the local population. The area was also home to a number of small businesses, including a blacksmith, a general store, and a post office.
In the late 1800s, the area began to experience a population boom as more people moved to the area. This was due in part to the construction of the Chicago and Northwestern Railroad, which ran through the area and provided easy access to the city of Chicago. This influx of people led to the establishment of a number of new businesses, including a hotel, a bank, and a newspaper.
The area continued to grow throughout the early 1900s, and by the 1950s, the population had grown to over 1,000 people. This growth was largely due to the construction of the Elgin-O’Hare Expressway, which provided easy access to the city of Chicago. The area also experienced a population boom in the 1970s and 1980s due to the construction of the nearby Randall Road corridor.
Geography
Pingree Grove is located in Kane County, Illinois, approximately 40 miles west of Chicago. The village is situated on the Fox River, and is bordered by the towns of Elgin, South Elgin, and Gilberts. The village covers an area of approximately 4.5 square miles, and has a population of approximately 5,000 people.
The village is located in a flat, open area, with the Fox River providing the main source of water. The area is mostly rural, with a few small businesses located in the village. The village is also home to a number of parks, including the Pingree Grove Park, which features a playground, picnic areas, and a fishing pond.
Economy
The economy of Pingree Grove is largely based on agriculture and small businesses. The village is home to a number of small businesses, including restaurants, retail stores, and service providers. The village is also home to a number of industrial businesses, including a manufacturing plant and a distribution center.
The village is also home to a number of agricultural businesses, including dairy farms, grain farms, and vegetable farms. The village is also home to a number of wineries, which produce a variety of wines.
Demographics
As of the 2010 census, the population of Pingree Grove was 5,068. The population is primarily white (90.2%), with a small percentage of African Americans (2.3%), Asians (2.2%), and Hispanics (2.1%). The median household income is $76,945, and the median age is 37.7 years. The village is home to a number of churches, including the Pingree Grove United Methodist Church and the Pingree Grove Baptist Church.
Common Questions
What is Per Capita Income in Pingree Grove?
Per Capita income in Pingree Grove is $51,430.
What is the Median Family Income in Pingree Grove?
Median Family Income in Pingree Grove is $112,332.
What is the Median Household income in Pingree Grove?
Median Household Income in Pingree Grove is $106,597.
What is Income or Wage Gap in Pingree Grove?
Income or Wage Gap in Pingree Grove is 37.2%.
Women in Pingree Grove earn 62.8 cents for every dollar earned by a man.
What is Inequality or Gini Index in Pingree Grove?
Inequality or Gini Index in Pingree Grove is 0.44.
What is the Total Population of Pingree Grove?
Total Population of Pingree Grove is 10,213.
What is the Total Male Population of Pingree Grove?
Total Male Population of Pingree Grove is 5,521.
What is the Total Female Population of Pingree Grove?
Total Female Population of Pingree Grove is 4,692.
What is the Ratio of Males per 100 Females in Pingree Grove?
There are 117.67 Males per 100 Females in Pingree Grove.
What is the Ratio of Females per 100 Males in Pingree Grove?
There are 84.98 Females per 100 Males in Pingree Grove.
What is the Median Population Age in Pingree Grove?
Median Population Age in Pingree Grove is 36.9 Years.
What is the Average Family Size in Pingree Grove
Average Family Size in Pingree Grove is 3.4 People.
What is the Average Household Size in Pingree Grove
Average Household Size in Pingree Grove is 3.0 People.
How Large is the Labor Force in Pingree Grove?
There are 5,441 People in the Labor Forcein in Pingree Grove.
What is the Percentage of People in the Labor Force in Pingree Grove?
72.6% of People are in the Labor Force in Pingree Grove.
What is the Unemployment Rate in Pingree Grove?
Unemployment Rate in Pingree Grove is 3.5%.