Coal City, IL Map & Demographics
Coal City Map
Coal City Overview
$42,317
PER CAPITA INCOME
$95,147
AVG FAMILY INCOME
$77,939
AVG HOUSEHOLD INCOME
41.3%
WAGE / INCOME GAP [ % ]
58.7¢/ $1
WAGE / INCOME GAP [ $ ]
0.41
INEQUALITY / GINI INDEX
5,218
TOTAL POPULATION
2,633
MALE POPULATION
2,585
FEMALE POPULATION
101.86
MALES / 100 FEMALES
98.18
FEMALES / 100 MALES
40.5
MEDIAN AGE
3.0
AVG FAMILY SIZE
2.6
AVG HOUSEHOLD SIZE
2,644
LABOR FORCE [ PEOPLE ]
63.5%
PERCENT IN LABOR FORCE
3.9%
UNEMPLOYMENT RATE
Coal City Zip Codes
Coal City Area Codes
Income in Coal City
Income Overview in Coal City
Per Capita Income in Coal City is $42,317, while median incomes of families and households are $95,147 and $77,939 respectively.
| Characteristic | Number | Measure |
| Per Capita Income | 5,218 | $42,317 |
| Median Family Income | 1,336 | $95,147 |
| Mean Family Income | 1,336 | $119,595 |
| Median Household Income | 1,995 | $77,939 |
| Mean Household Income | 1,995 | $104,642 |
| Income Deficit | 1,336 | $0 |
| Wage / Income Gap (%) | 5,218 | 41.30% |
| Wage / Income Gap ($) | 5,218 | 58.70¢ per $1 |
| Gini / Inequality Index | 5,218 | 0.41 |
Earnings by Sex in Coal City
Average Earnings in Coal City are $52,004, $70,032 for men and $41,108 for women, a difference of 41.3%.
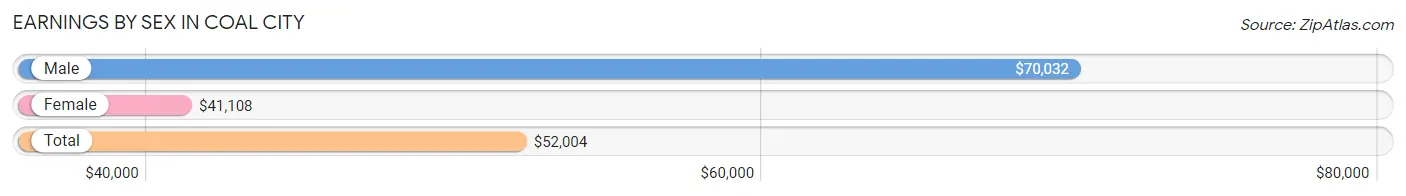
| Sex | Number | Average Earnings |
| Male | 1,448 (50.4%) | $70,032 |
| Female | 1,426 (49.6%) | $41,108 |
| Total | 2,874 (100.0%) | $52,004 |
Earnings by Sex by Income Bracket in Coal City
The most common earnings brackets in Coal City are $100,000+ for men (373 | 25.8%) and $100,000+ for women (222 | 15.6%).
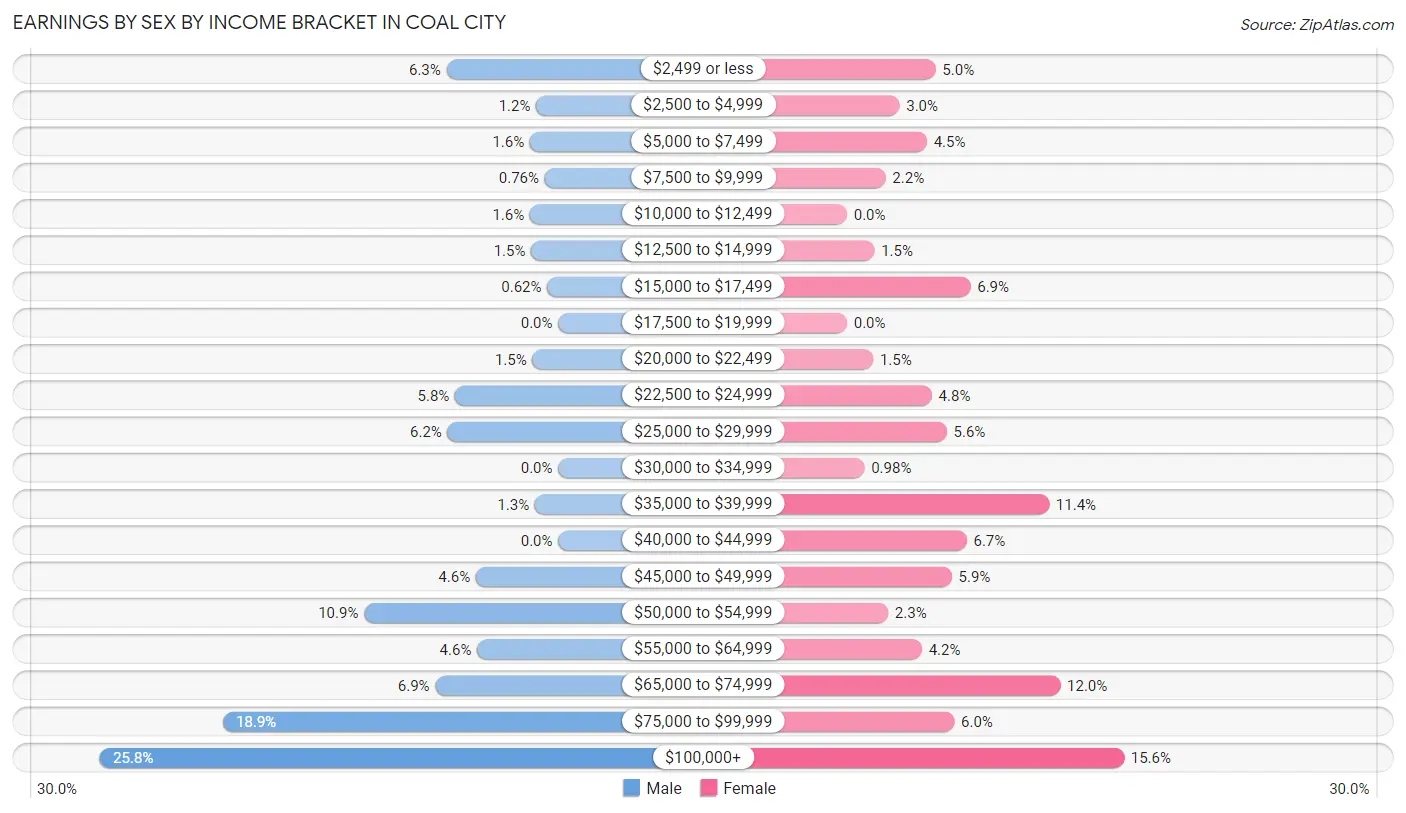
| Income | Male | Female |
| $2,499 or less | 91 (6.3%) | 71 (5.0%) |
| $2,500 to $4,999 | 18 (1.2%) | 42 (2.9%) |
| $5,000 to $7,499 | 23 (1.6%) | 64 (4.5%) |
| $7,500 to $9,999 | 11 (0.8%) | 31 (2.2%) |
| $10,000 to $12,499 | 23 (1.6%) | 0 (0.0%) |
| $12,500 to $14,999 | 22 (1.5%) | 22 (1.5%) |
| $15,000 to $17,499 | 9 (0.6%) | 99 (6.9%) |
| $17,500 to $19,999 | 0 (0.0%) | 0 (0.0%) |
| $20,000 to $22,499 | 21 (1.5%) | 21 (1.5%) |
| $22,500 to $24,999 | 84 (5.8%) | 68 (4.8%) |
| $25,000 to $29,999 | 90 (6.2%) | 80 (5.6%) |
| $30,000 to $34,999 | 0 (0.0%) | 14 (1.0%) |
| $35,000 to $39,999 | 19 (1.3%) | 162 (11.4%) |
| $40,000 to $44,999 | 0 (0.0%) | 96 (6.7%) |
| $45,000 to $49,999 | 67 (4.6%) | 84 (5.9%) |
| $50,000 to $54,999 | 158 (10.9%) | 33 (2.3%) |
| $55,000 to $64,999 | 66 (4.6%) | 60 (4.2%) |
| $65,000 to $74,999 | 100 (6.9%) | 171 (12.0%) |
| $75,000 to $99,999 | 273 (18.9%) | 86 (6.0%) |
| $100,000+ | 373 (25.8%) | 222 (15.6%) |
| Total | 1,448 (100.0%) | 1,426 (100.0%) |
Earnings by Sex by Educational Attainment in Coal City
Average earnings in Coal City are $79,444 for men and $46,541 for women, a difference of 41.4%. Men with an educational attainment of graduate degree enjoy the highest average annual earnings of $100,938, while those with less than high school education earn the least with $50,795. Women with an educational attainment of bachelor's degree earn the most with the average annual earnings of $117,632, while those with college or associate's degree education have the smallest earnings of $36,395.
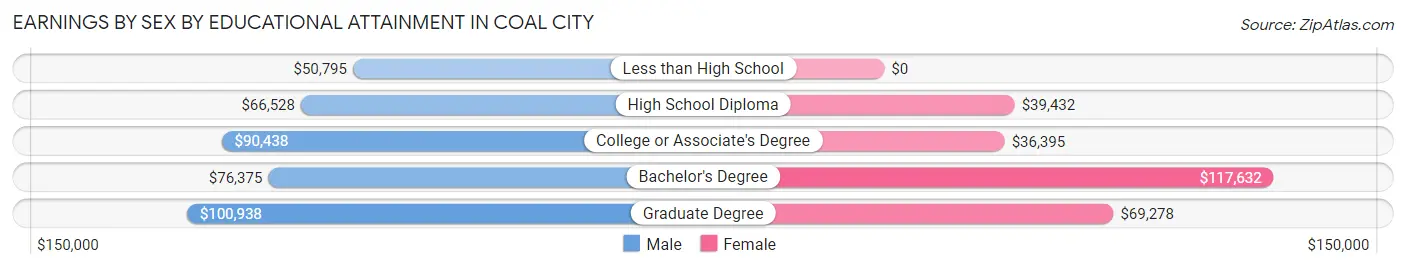
| Educational Attainment | Male Income | Female Income |
| Less than High School | $50,795 | $0 |
| High School Diploma | $66,528 | $39,432 |
| College or Associate's Degree | $90,438 | $36,395 |
| Bachelor's Degree | $76,375 | $117,632 |
| Graduate Degree | $100,938 | $69,278 |
| Total | $79,444 | $46,541 |
Family Income in Coal City
Family Income Brackets in Coal City
According to the Coal City family income data, there are 262 families falling into the $150,000 to $199,999 income range, which is the most common income bracket and makes up 19.6% of all families. Conversely, the $10,000 to $14,999 income bracket is the least frequent group with only 16 families (1.2%) belonging to this category.
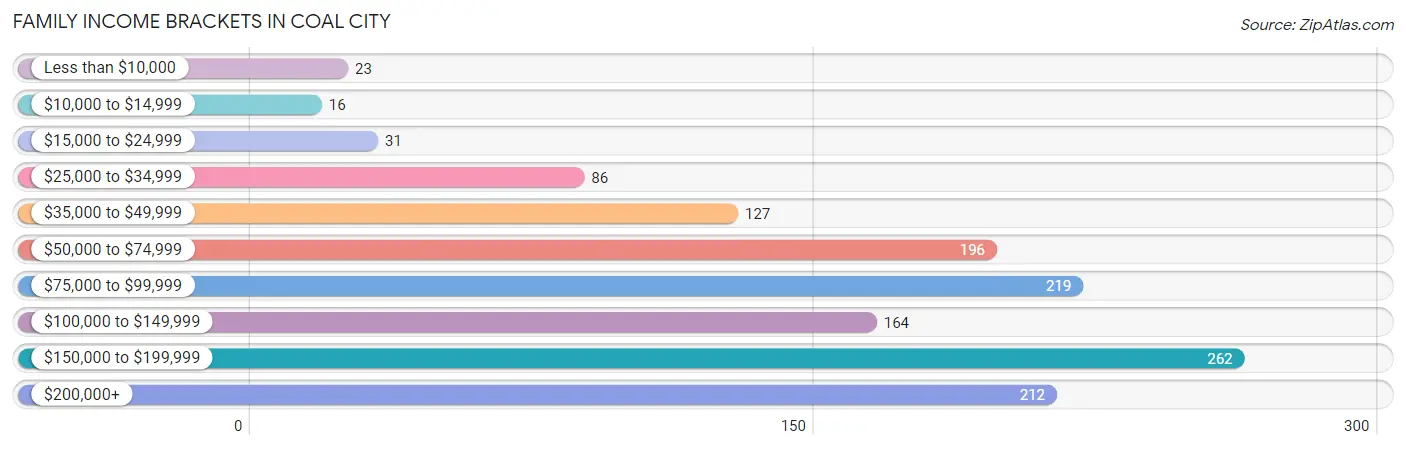
| Income Bracket | # Families | % Families |
| Less than $10,000 | 23 | 1.7% |
| $10,000 to $14,999 | 16 | 1.2% |
| $15,000 to $24,999 | 31 | 2.3% |
| $25,000 to $34,999 | 86 | 6.4% |
| $35,000 to $49,999 | 127 | 9.5% |
| $50,000 to $74,999 | 196 | 14.7% |
| $75,000 to $99,999 | 219 | 16.4% |
| $100,000 to $149,999 | 164 | 12.3% |
| $150,000 to $199,999 | 262 | 19.6% |
| $200,000+ | 212 | 15.9% |
Family Income by Famaliy Size in Coal City
4-person families (333 | 24.9%) account for the highest median family income in Coal City with $162,676 per family, while 3-person families (201 | 15.0%) have the highest median income of $46,745 per family member.
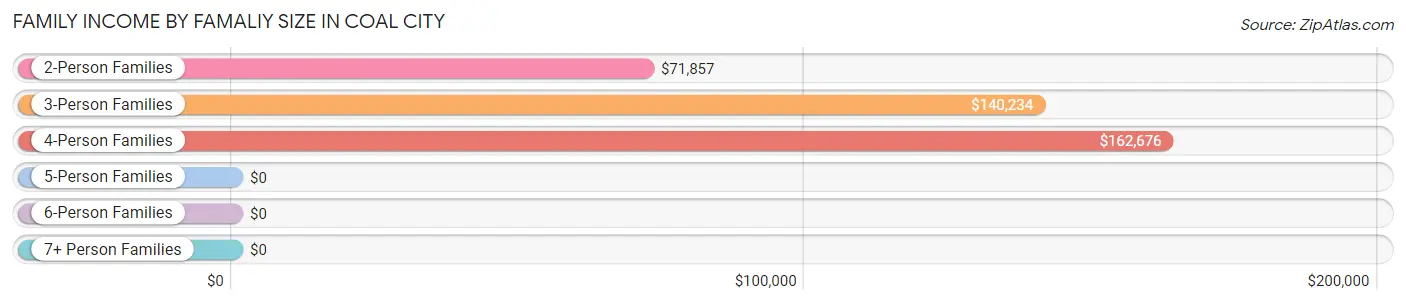
| Income Bracket | # Families | Median Income |
| 2-Person Families | 656 (49.1%) | $71,857 |
| 3-Person Families | 201 (15.0%) | $140,234 |
| 4-Person Families | 333 (24.9%) | $162,676 |
| 5-Person Families | 102 (7.6%) | $0 |
| 6-Person Families | 44 (3.3%) | $0 |
| 7+ Person Families | 0 (0.0%) | $0 |
| Total | 1,336 (100.0%) | $95,147 |
Family Income by Number of Earners in Coal City
The median family income in Coal City is $95,147, with families comprising 3+ earners (173) having the highest median family income of $193,988, while families with no earners (261) have the lowest median family income of $42,305, accounting for 13.0% and 19.5% of families, respectively.
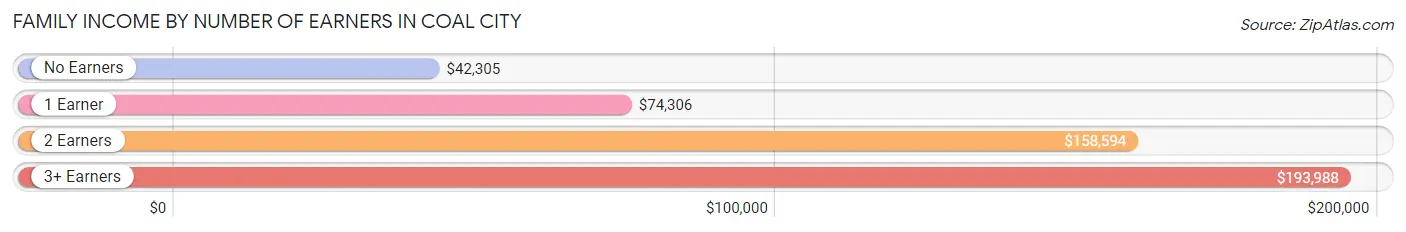
| Number of Earners | # Families | Median Income |
| No Earners | 261 (19.5%) | $42,305 |
| 1 Earner | 350 (26.2%) | $74,306 |
| 2 Earners | 552 (41.3%) | $158,594 |
| 3+ Earners | 173 (13.0%) | $193,988 |
| Total | 1,336 (100.0%) | $95,147 |
Household Income in Coal City
Household Income Brackets in Coal City
With 357 households falling in the category, the $50,000 to $74,999 income range is the most frequent in Coal City, accounting for 17.9% of all households. In contrast, only 26 households (1.3%) fall into the $10,000 to $14,999 income bracket, making it the least populous group.
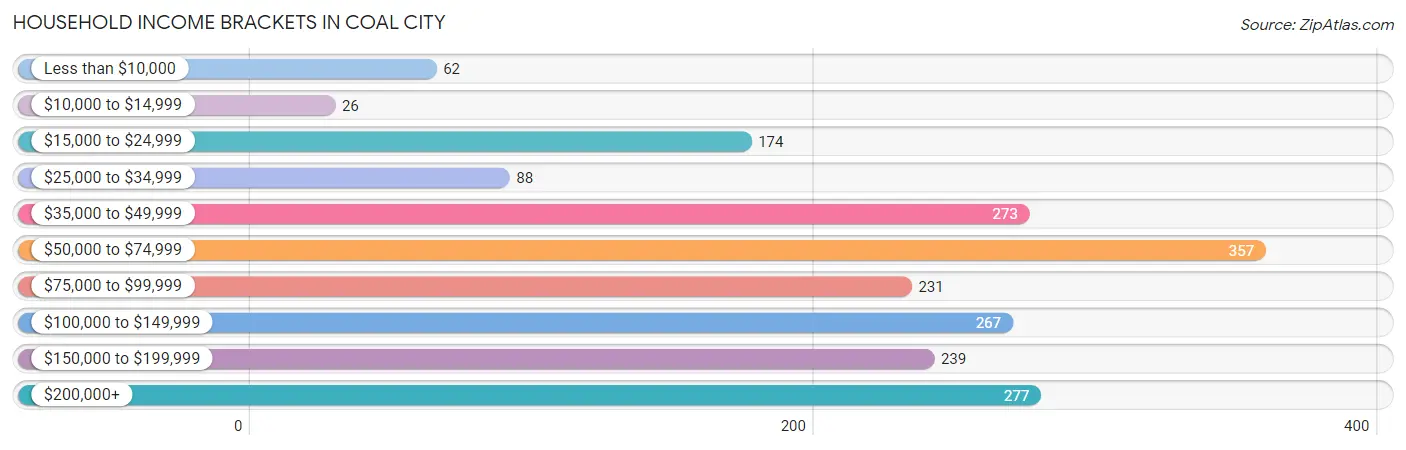
| Income Bracket | # Households | % Households |
| Less than $10,000 | 62 | 3.1% |
| $10,000 to $14,999 | 26 | 1.3% |
| $15,000 to $24,999 | 174 | 8.7% |
| $25,000 to $34,999 | 88 | 4.4% |
| $35,000 to $49,999 | 273 | 13.7% |
| $50,000 to $74,999 | 357 | 17.9% |
| $75,000 to $99,999 | 231 | 11.6% |
| $100,000 to $149,999 | 267 | 13.4% |
| $150,000 to $199,999 | 239 | 12.0% |
| $200,000+ | 277 | 13.9% |
Household Income by Householder Age in Coal City
The median household income in Coal City is $77,939, with the highest median household income of $123,906 found in the 25 to 44 years age bracket for the primary householder. A total of 597 households (29.9%) fall into this category. Meanwhile, the 15 to 24 years age bracket for the primary householder has the lowest median household income of $0, with 39 households (1.9%) in this group.
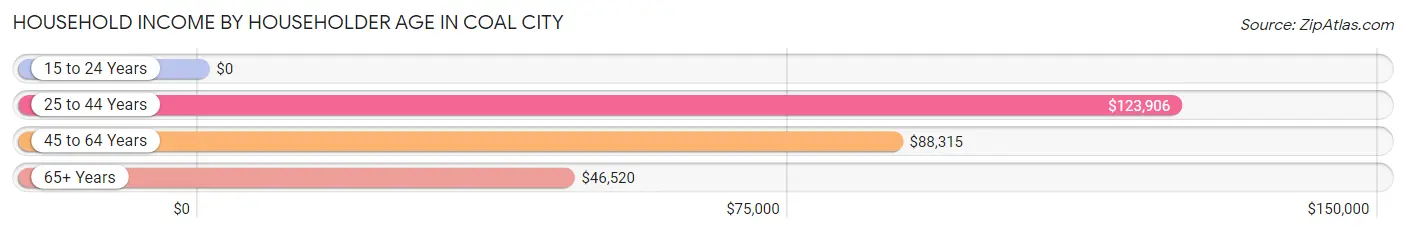
| Income Bracket | # Households | Median Income |
| 15 to 24 Years | 39 (1.9%) | $0 |
| 25 to 44 Years | 597 (29.9%) | $123,906 |
| 45 to 64 Years | 787 (39.5%) | $88,315 |
| 65+ Years | 572 (28.7%) | $46,520 |
| Total | 1,995 (100.0%) | $77,939 |
Poverty in Coal City
Income Below Poverty by Sex and Age in Coal City
With 3.7% poverty level for males and 6.9% for females among the residents of Coal City, under 5 year old males and 35 to 44 year old females are the most vulnerable to poverty, with 30 males (37.0%) and 77 females (15.8%) in their respective age groups living below the poverty level.
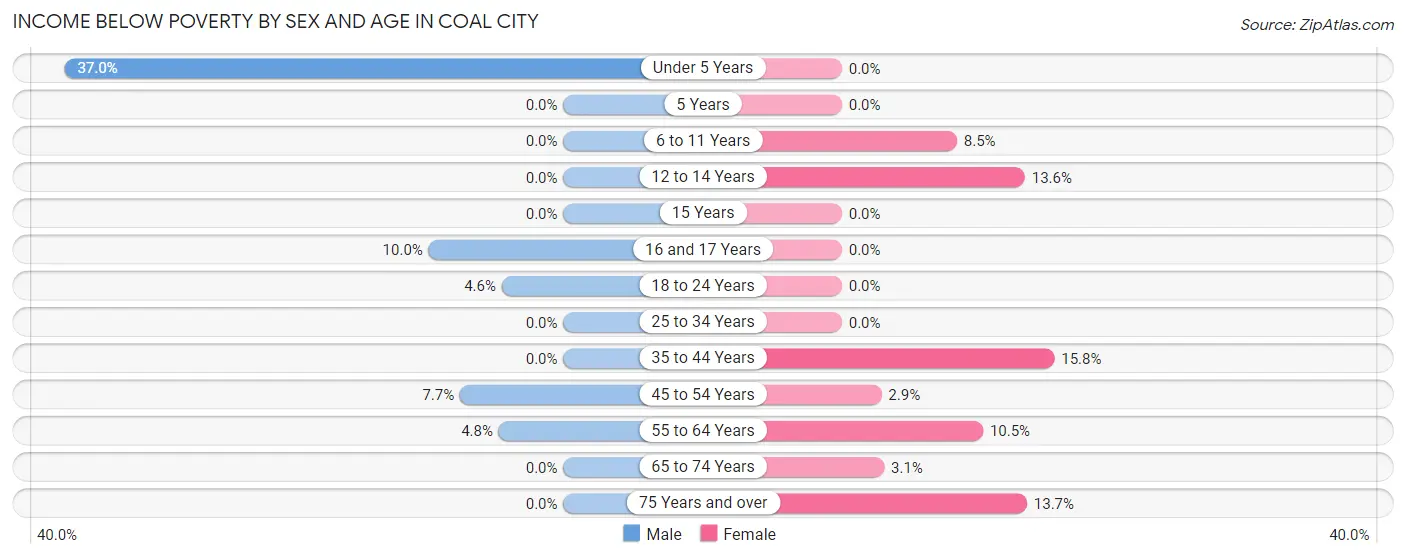
| Age Bracket | Male | Female |
| Under 5 Years | 30 (37.0%) | 0 (0.0%) |
| 5 Years | 0 (0.0%) | 0 (0.0%) |
| 6 to 11 Years | 0 (0.0%) | 14 (8.5%) |
| 12 to 14 Years | 0 (0.0%) | 14 (13.6%) |
| 15 Years | 0 (0.0%) | 0 (0.0%) |
| 16 and 17 Years | 15 (10.0%) | 0 (0.0%) |
| 18 to 24 Years | 10 (4.6%) | 0 (0.0%) |
| 25 to 34 Years | 0 (0.0%) | 0 (0.0%) |
| 35 to 44 Years | 0 (0.0%) | 77 (15.8%) |
| 45 to 54 Years | 23 (7.7%) | 9 (2.9%) |
| 55 to 64 Years | 17 (4.8%) | 37 (10.5%) |
| 65 to 74 Years | 0 (0.0%) | 9 (3.1%) |
| 75 Years and over | 0 (0.0%) | 18 (13.7%) |
| Total | 95 (3.7%) | 178 (6.9%) |
Income Above Poverty by Sex and Age in Coal City
According to the poverty statistics in Coal City, males aged 5 years and females aged under 5 years are the age groups that are most secure financially, with 100.0% of males and 100.0% of females in these age groups living above the poverty line.
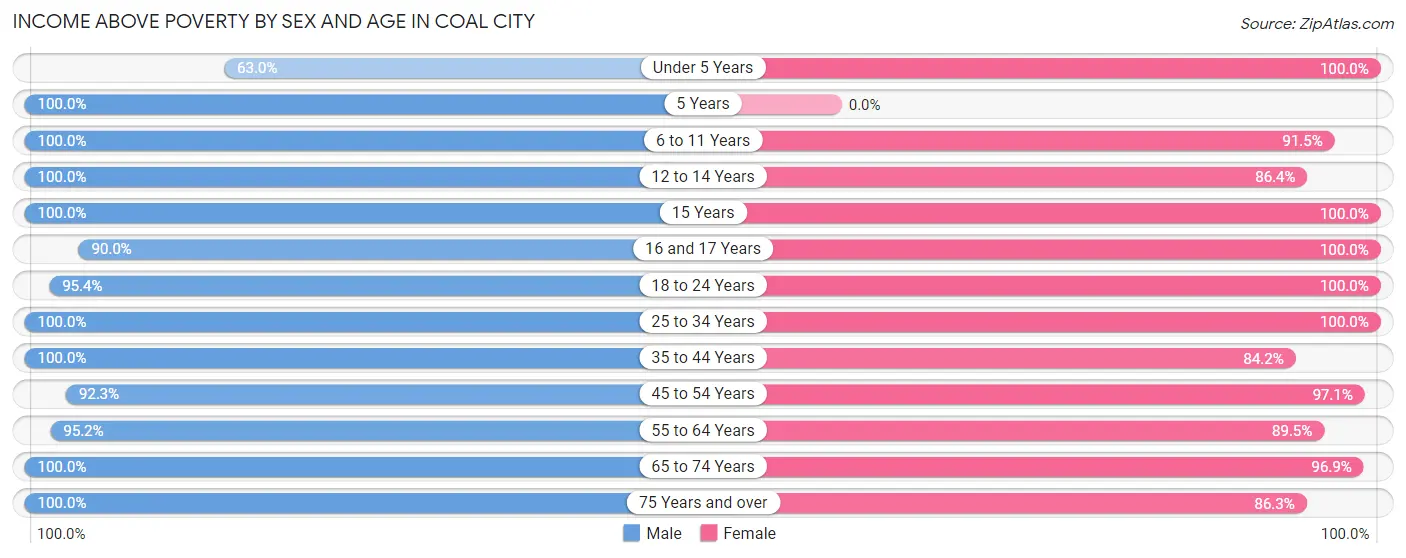
| Age Bracket | Male | Female |
| Under 5 Years | 51 (63.0%) | 136 (100.0%) |
| 5 Years | 36 (100.0%) | 0 (0.0%) |
| 6 to 11 Years | 272 (100.0%) | 150 (91.5%) |
| 12 to 14 Years | 22 (100.0%) | 89 (86.4%) |
| 15 Years | 82 (100.0%) | 93 (100.0%) |
| 16 and 17 Years | 135 (90.0%) | 66 (100.0%) |
| 18 to 24 Years | 209 (95.4%) | 235 (100.0%) |
| 25 to 34 Years | 272 (100.0%) | 208 (100.0%) |
| 35 to 44 Years | 324 (100.0%) | 411 (84.2%) |
| 45 to 54 Years | 277 (92.3%) | 297 (97.1%) |
| 55 to 64 Years | 338 (95.2%) | 316 (89.5%) |
| 65 to 74 Years | 361 (100.0%) | 278 (96.9%) |
| 75 Years and over | 108 (100.0%) | 113 (86.3%) |
| Total | 2,487 (96.3%) | 2,392 (93.1%) |
Income Below Poverty Among Married-Couple Families in Coal City
The poverty statistics for married-couple families in Coal City show that 3.7% or 39 of the total 1,049 families live below the poverty line. Families with 3 or 4 children have the highest poverty rate of 20.0%, comprising of 23 families. On the other hand, families with 1 or 2 children have the lowest poverty rate of 0.0%, which includes 0 families.
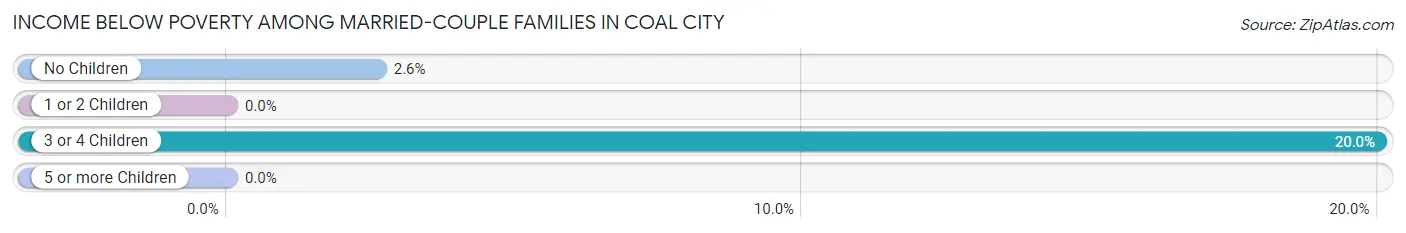
| Children | Above Poverty | Below Poverty |
| No Children | 601 (97.4%) | 16 (2.6%) |
| 1 or 2 Children | 317 (100.0%) | 0 (0.0%) |
| 3 or 4 Children | 92 (80.0%) | 23 (20.0%) |
| 5 or more Children | 0 (0.0%) | 0 (0.0%) |
| Total | 1,010 (96.3%) | 39 (3.7%) |
Income Below Poverty Among Single-Parent Households in Coal City
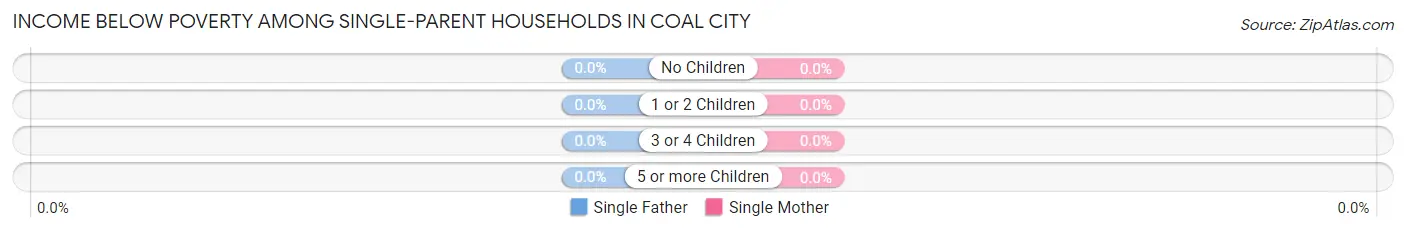
| Children | Single Father | Single Mother |
| No Children | 0 (0.0%) | 0 (0.0%) |
| 1 or 2 Children | 0 (0.0%) | 0 (0.0%) |
| 3 or 4 Children | 0 (0.0%) | 0 (0.0%) |
| 5 or more Children | 0 (0.0%) | 0 (0.0%) |
| Total | 0 (0.0%) | 0 (0.0%) |
Income Below Poverty Among Married-Couple vs Single-Parent Households in Coal City
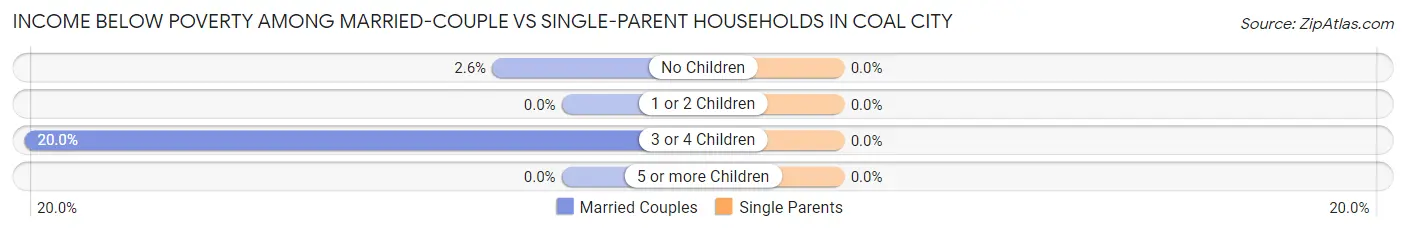
| Children | Married-Couple Families | Single-Parent Households |
| No Children | 16 (2.6%) | 0 (0.0%) |
| 1 or 2 Children | 0 (0.0%) | 0 (0.0%) |
| 3 or 4 Children | 23 (20.0%) | 0 (0.0%) |
| 5 or more Children | 0 (0.0%) | 0 (0.0%) |
| Total | 39 (3.7%) | 0 (0.0%) |
Race in Coal City
The most populous races in Coal City are White / Caucasian (4,903 | 94.0%), Hispanic or Latino (331 | 6.3%), and Two or more Races (154 | 2.9%).
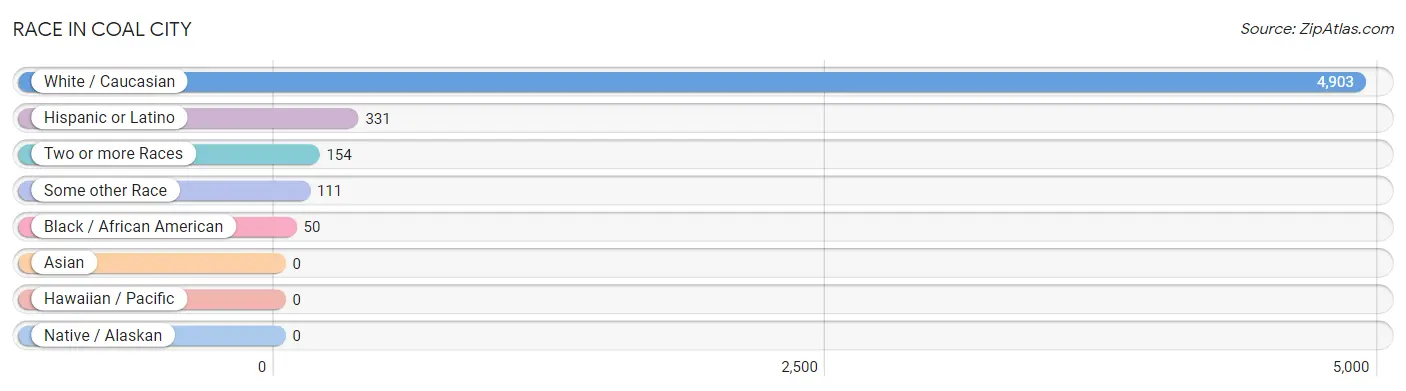
| Race | # Population | % Population |
| Asian | 0 | 0.0% |
| Black / African American | 50 | 1.0% |
| Hawaiian / Pacific | 0 | 0.0% |
| Hispanic or Latino | 331 | 6.3% |
| Native / Alaskan | 0 | 0.0% |
| White / Caucasian | 4,903 | 94.0% |
| Two or more Races | 154 | 2.9% |
| Some other Race | 111 | 2.1% |
| Total | 5,218 | 100.0% |
Ancestry in Coal City
The most populous ancestries reported in Coal City are German (1,042 | 20.0%), Italian (901 | 17.3%), Irish (810 | 15.5%), Polish (756 | 14.5%), and English (637 | 12.2%), together accounting for 79.5% of all Coal City residents.
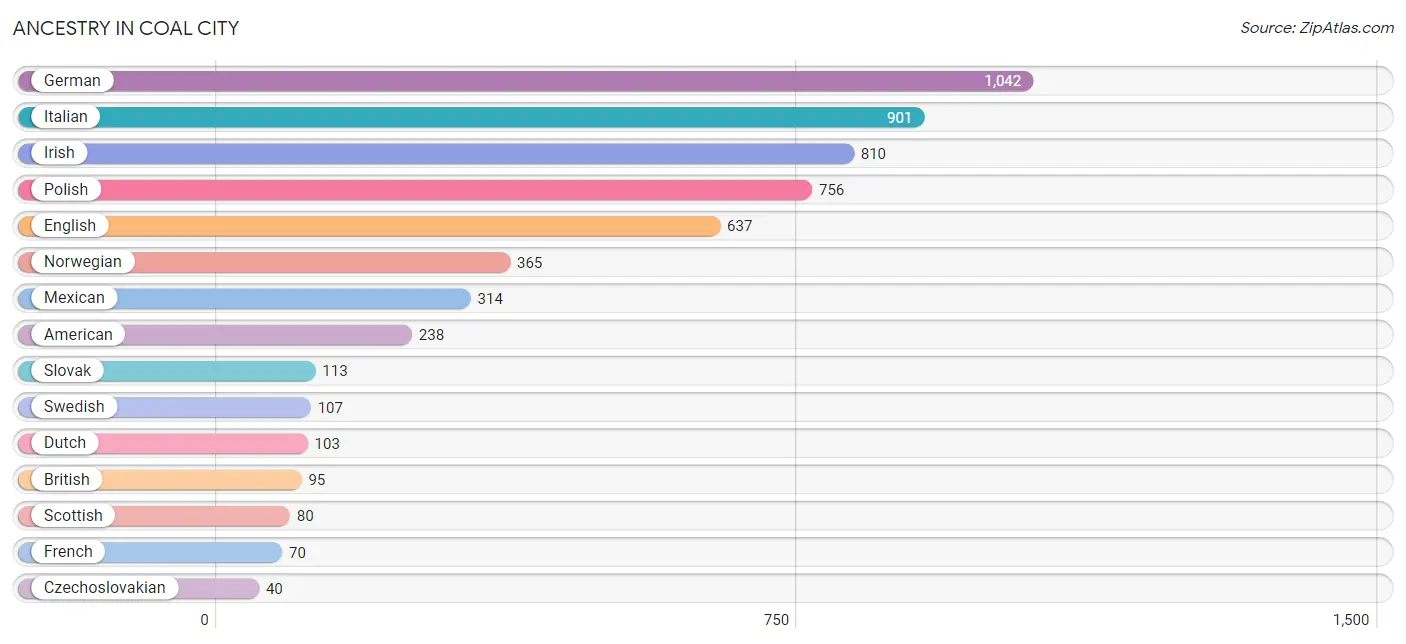
| Ancestry | # Population | % Population |
| Albanian | 18 | 0.3% |
| American | 238 | 4.6% |
| British | 95 | 1.8% |
| Central American | 17 | 0.3% |
| Czech | 24 | 0.5% |
| Czechoslovakian | 40 | 0.8% |
| Dutch | 103 | 2.0% |
| English | 637 | 12.2% |
| Ethiopian | 11 | 0.2% |
| Finnish | 9 | 0.2% |
| French | 70 | 1.3% |
| French Canadian | 9 | 0.2% |
| German | 1,042 | 20.0% |
| Haitian | 15 | 0.3% |
| Hungarian | 17 | 0.3% |
| Irish | 810 | 15.5% |
| Italian | 901 | 17.3% |
| Mexican | 314 | 6.0% |
| Nicaraguan | 17 | 0.3% |
| Norwegian | 365 | 7.0% |
| Polish | 756 | 14.5% |
| Scandinavian | 13 | 0.3% |
| Scotch-Irish | 12 | 0.2% |
| Scottish | 80 | 1.5% |
| Slovak | 113 | 2.2% |
| Subsaharan African | 11 | 0.2% |
| Swedish | 107 | 2.1% |
| Welsh | 10 | 0.2% | View All 28 Rows |
Immigrants in Coal City
The most numerous immigrant groups reported in Coal City came from Latin America (32 | 0.6%), Eastern Europe (30 | 0.6%), Europe (30 | 0.6%), North Macedonia (18 | 0.3%), and Central America (17 | 0.3%), together accounting for 2.4% of all Coal City residents.
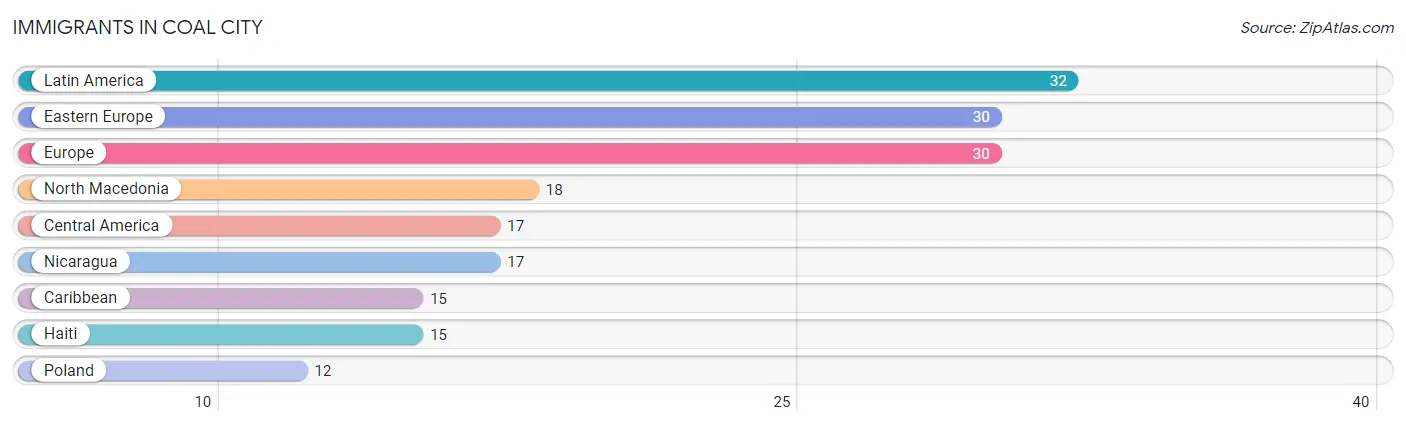
| Immigration Origin | # Population | % Population |
| Caribbean | 15 | 0.3% |
| Central America | 17 | 0.3% |
| Eastern Europe | 30 | 0.6% |
| Europe | 30 | 0.6% |
| Haiti | 15 | 0.3% |
| Latin America | 32 | 0.6% |
| Nicaragua | 17 | 0.3% |
| North Macedonia | 18 | 0.3% |
| Poland | 12 | 0.2% | View All 9 Rows |
Sex and Age in Coal City
Sex and Age in Coal City
The most populous age groups in Coal City are 15 to 19 Years (286 | 10.9%) for men and 40 to 44 Years (254 | 9.8%) for women.
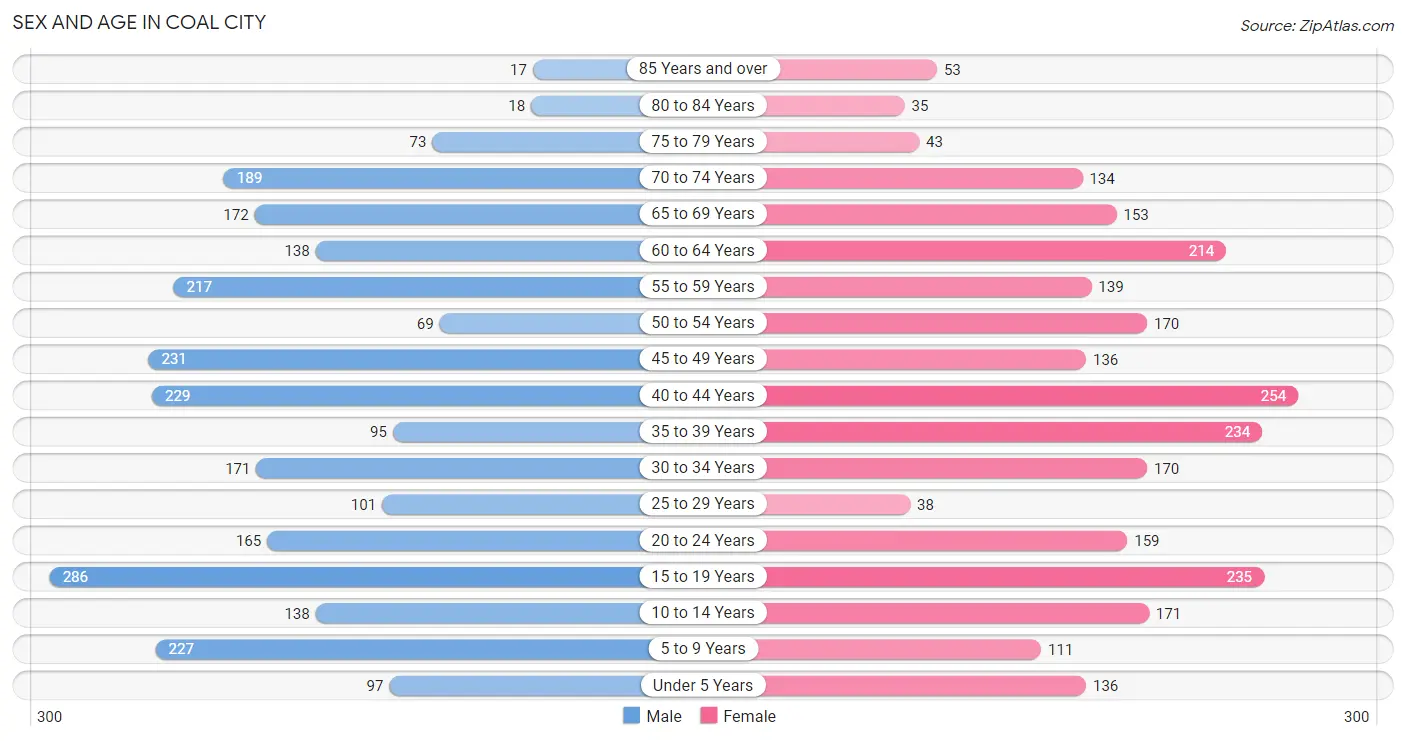
| Age Bracket | Male | Female |
| Under 5 Years | 97 (3.7%) | 136 (5.3%) |
| 5 to 9 Years | 227 (8.6%) | 111 (4.3%) |
| 10 to 14 Years | 138 (5.2%) | 171 (6.6%) |
| 15 to 19 Years | 286 (10.9%) | 235 (9.1%) |
| 20 to 24 Years | 165 (6.3%) | 159 (6.1%) |
| 25 to 29 Years | 101 (3.8%) | 38 (1.5%) |
| 30 to 34 Years | 171 (6.5%) | 170 (6.6%) |
| 35 to 39 Years | 95 (3.6%) | 234 (9.0%) |
| 40 to 44 Years | 229 (8.7%) | 254 (9.8%) |
| 45 to 49 Years | 231 (8.8%) | 136 (5.3%) |
| 50 to 54 Years | 69 (2.6%) | 170 (6.6%) |
| 55 to 59 Years | 217 (8.2%) | 139 (5.4%) |
| 60 to 64 Years | 138 (5.2%) | 214 (8.3%) |
| 65 to 69 Years | 172 (6.5%) | 153 (5.9%) |
| 70 to 74 Years | 189 (7.2%) | 134 (5.2%) |
| 75 to 79 Years | 73 (2.8%) | 43 (1.7%) |
| 80 to 84 Years | 18 (0.7%) | 35 (1.3%) |
| 85 Years and over | 17 (0.6%) | 53 (2.1%) |
| Total | 2,633 (100.0%) | 2,585 (100.0%) |
Families and Households in Coal City
Median Family Size in Coal City
The median family size in Coal City is 3.04 persons per family, with single male/father families (121 | 9.1%) accounting for the largest median family size of 3.6 persons per family. On the other hand, single female/mother families (166 | 12.4%) represent the smallest median family size with 2.14 persons per family.
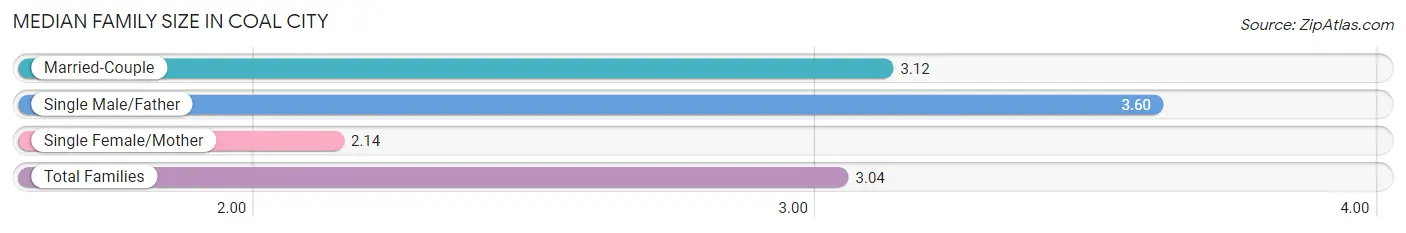
| Family Type | # Families | Family Size |
| Married-Couple | 1,049 (78.5%) | 3.12 |
| Single Male/Father | 121 (9.1%) | 3.60 |
| Single Female/Mother | 166 (12.4%) | 2.14 |
| Total Families | 1,336 (100.0%) | 3.04 |
Median Household Size in Coal City
The median household size in Coal City is 2.62 persons per household, with single male/father households (121 | 6.1%) accounting for the largest median household size of 4.9 persons per household. non-family households (659 | 33.0%) represent the smallest median household size with 1.29 persons per household.
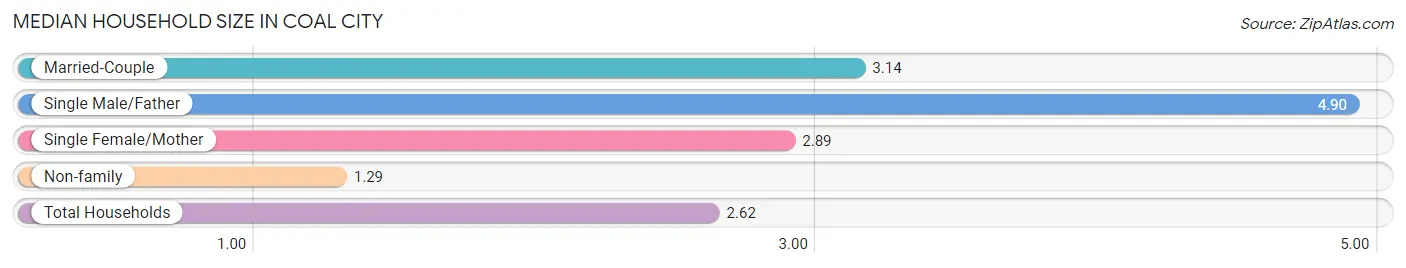
| Household Type | # Households | Household Size |
| Married-Couple | 1,049 (52.6%) | 3.14 |
| Single Male/Father | 121 (6.1%) | 4.90 |
| Single Female/Mother | 166 (8.3%) | 2.89 |
| Non-family | 659 (33.0%) | 1.29 |
| Total Households | 1,995 (100.0%) | 2.62 |
Household Size by Marriage Status in Coal City
Out of a total of 1,995 households in Coal City, 1,336 (67.0%) are family households, while 659 (33.0%) are nonfamily households. The most numerous type of family households are 2-person households, comprising 543, and the most common type of nonfamily households are 1-person households, comprising 541.
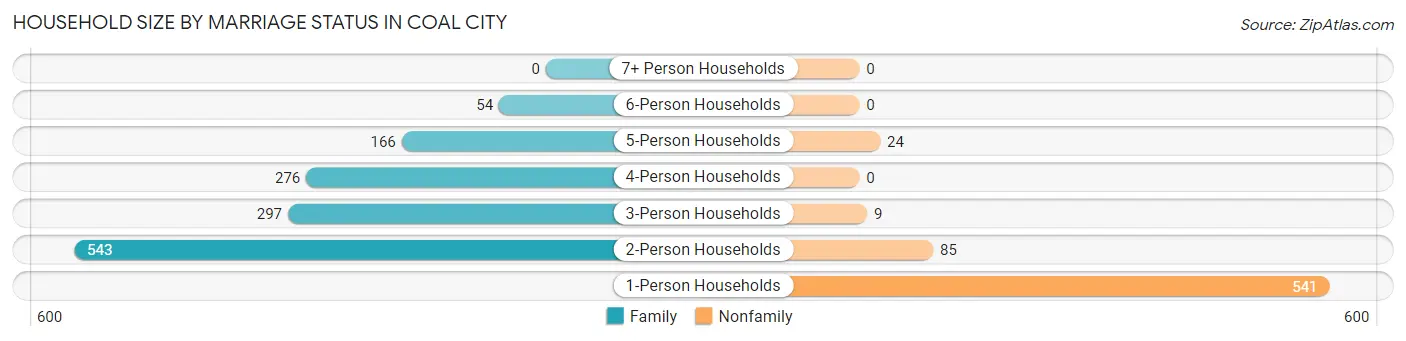
| Household Size | Family Households | Nonfamily Households |
| 1-Person Households | - | 541 (27.1%) |
| 2-Person Households | 543 (27.2%) | 85 (4.3%) |
| 3-Person Households | 297 (14.9%) | 9 (0.4%) |
| 4-Person Households | 276 (13.8%) | 0 (0.0%) |
| 5-Person Households | 166 (8.3%) | 24 (1.2%) |
| 6-Person Households | 54 (2.7%) | 0 (0.0%) |
| 7+ Person Households | 0 (0.0%) | 0 (0.0%) |
| Total | 1,336 (67.0%) | 659 (33.0%) |
Female Fertility in Coal City
Fertility by Age in Coal City
Average fertility rate in Coal City is 26.0 births per 1,000 women. Women in the age bracket of 20 to 34 years have the highest fertility rate with 90.0 births per 1,000 women. Women in the age bracket of 20 to 34 years acount for 100.0% of all women with births.
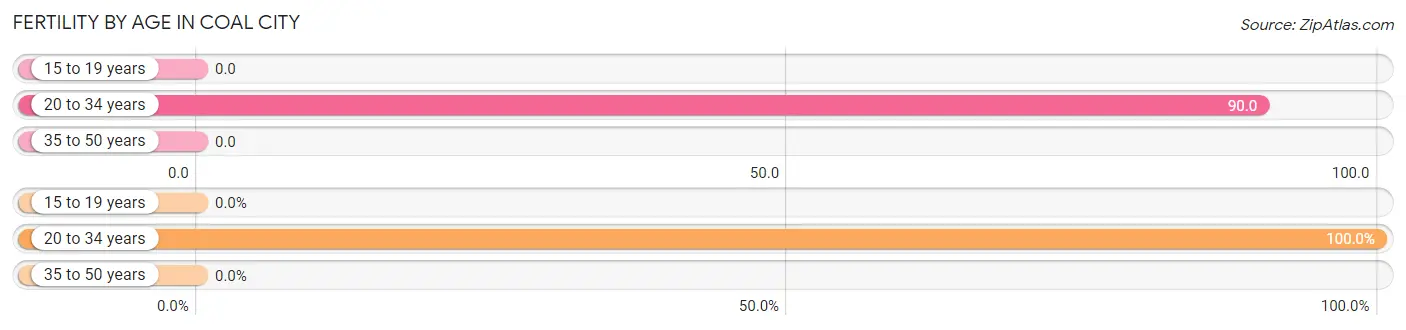
| Age Bracket | Women with Births | Births / 1,000 Women |
| 15 to 19 years | 0 (0.0%) | 0.0 |
| 20 to 34 years | 33 (100.0%) | 90.0 |
| 35 to 50 years | 0 (0.0%) | 0.0 |
| Total | 33 (100.0%) | 26.0 |
Fertility by Age by Marriage Status in Coal City
51.5% of women with births (33) in Coal City are married. The highest percentage of unmarried women with births falls into 20 to 34 years age bracket with 48.5% of them unmarried at the time of birth, while the lowest percentage of unmarried women with births belong to 20 to 34 years age bracket with 48.5% of them unmarried.
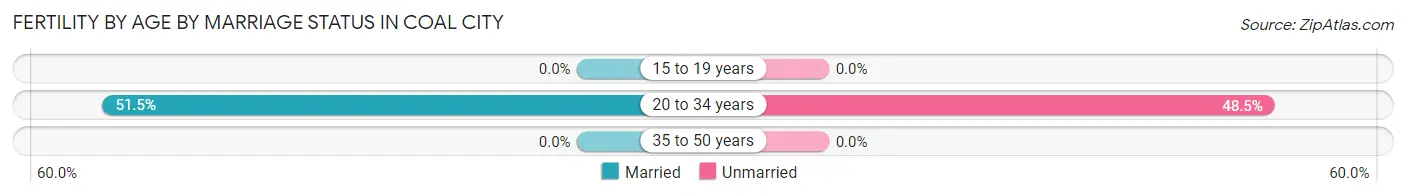
| Age Bracket | Married | Unmarried |
| 15 to 19 years | 0 (0.0%) | 0 (0.0%) |
| 20 to 34 years | 17 (51.5%) | 16 (48.5%) |
| 35 to 50 years | 0 (0.0%) | 0 (0.0%) |
| Total | 17 (51.5%) | 16 (48.5%) |
Fertility by Education in Coal City
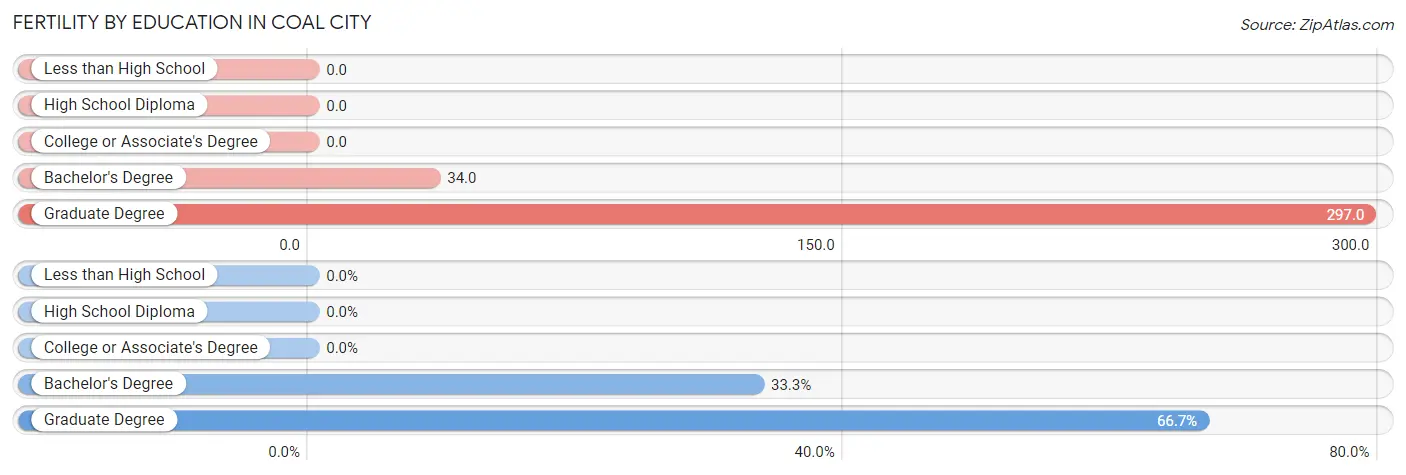
| Educational Attainment | Women with Births | Births / 1,000 Women |
| Less than High School | 0 (0.0%) | 0.0 |
| High School Diploma | 0 (0.0%) | 0.0 |
| College or Associate's Degree | 0 (0.0%) | 0.0 |
| Bachelor's Degree | 11 (33.3%) | 34.0 |
| Graduate Degree | 22 (66.7%) | 297.0 |
| Total | 33 (100.0%) | 26.0 |
Fertility by Education by Marriage Status in Coal City
48.5% of women with births in Coal City are unmarried. Women with the educational attainment of graduate degree are most likely to be married with 77.3% of them married at childbirth, while women with the educational attainment of bachelor's degree are least likely to be married with 100.0% of them unmarried at childbirth.
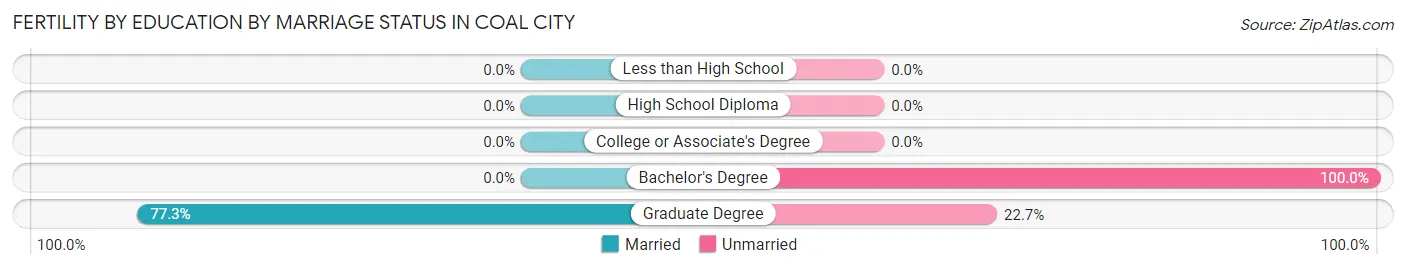
| Educational Attainment | Married | Unmarried |
| Less than High School | 0 (0.0%) | 0 (0.0%) |
| High School Diploma | 0 (0.0%) | 0 (0.0%) |
| College or Associate's Degree | 0 (0.0%) | 0 (0.0%) |
| Bachelor's Degree | 0 (0.0%) | 11 (100.0%) |
| Graduate Degree | 17 (77.3%) | 5 (22.7%) |
| Total | 17 (51.5%) | 16 (48.5%) |
Employment Characteristics in Coal City
Employment by Class of Employer in Coal City
Among the 2,517 employed individuals in Coal City, private company employees (1,922 | 76.4%), local government employees (289 | 11.5%), and not-for-profit organizations (180 | 7.1%) make up the most common classes of employment.
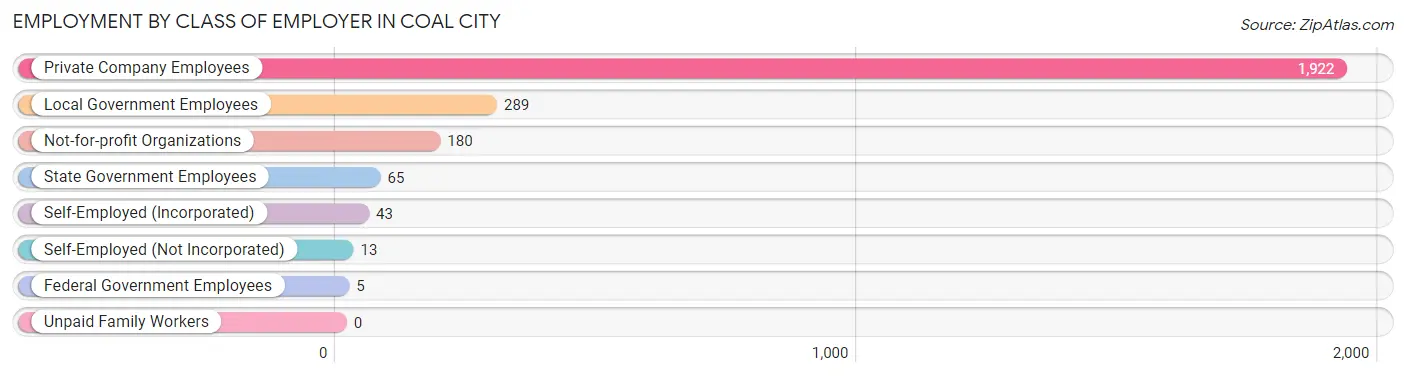
| Employer Class | # Employees | % Employees |
| Private Company Employees | 1,922 | 76.4% |
| Self-Employed (Incorporated) | 43 | 1.7% |
| Self-Employed (Not Incorporated) | 13 | 0.5% |
| Not-for-profit Organizations | 180 | 7.1% |
| Local Government Employees | 289 | 11.5% |
| State Government Employees | 65 | 2.6% |
| Federal Government Employees | 5 | 0.2% |
| Unpaid Family Workers | 0 | 0.0% |
| Total | 2,517 | 100.0% |
Employment Status by Age in Coal City
According to the labor force statistics for Coal City, out of the total population over 16 years of age (4,163), 63.5% or 2,644 individuals are in the labor force, with 3.9% or 103 of them unemployed. The age group with the highest labor force participation rate is 20 to 24 years, with 92.6% or 300 individuals in the labor force. Within the labor force, the 65 to 74 years age range has the highest percentage of unemployed individuals, with 19.4% or 18 of them being unemployed.
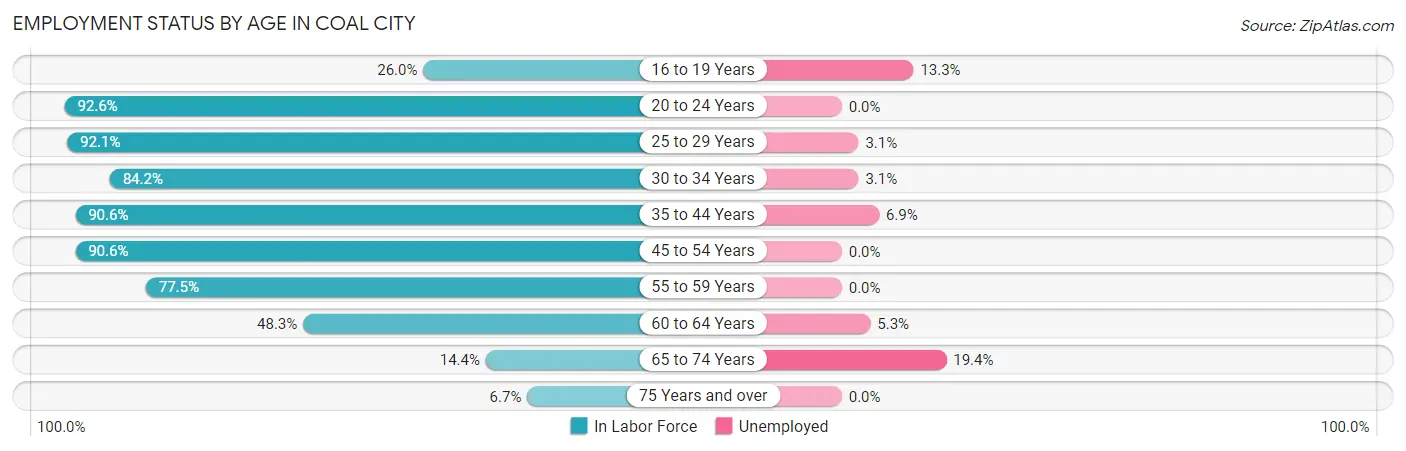
| Age Bracket | In Labor Force | Unemployed |
| 16 to 19 Years | 90 (26.0%) | 12 (13.3%) |
| 20 to 24 Years | 300 (92.6%) | 0 (0.0%) |
| 25 to 29 Years | 128 (92.1%) | 4 (3.1%) |
| 30 to 34 Years | 287 (84.2%) | 9 (3.1%) |
| 35 to 44 Years | 736 (90.6%) | 51 (6.9%) |
| 45 to 54 Years | 549 (90.6%) | 0 (0.0%) |
| 55 to 59 Years | 276 (77.5%) | 0 (0.0%) |
| 60 to 64 Years | 170 (48.3%) | 9 (5.3%) |
| 65 to 74 Years | 93 (14.4%) | 18 (19.4%) |
| 75 Years and over | 16 (6.7%) | 0 (0.0%) |
| Total | 2,644 (63.5%) | 103 (3.9%) |
Employment Status by Educational Attainment in Coal City
According to labor force statistics for Coal City, 82.3% of individuals (2,145) out of the total population between 25 and 64 years of age (2,606) are in the labor force, with 3.4% or 73 of them being unemployed. The group with the highest labor force participation rate are those with the educational attainment of bachelor's degree or higher, with 97.2% or 723 individuals in the labor force. Within the labor force, individuals with college / associate degree education have the highest percentage of unemployment, with 5.9% or 43 of them being unemployed.
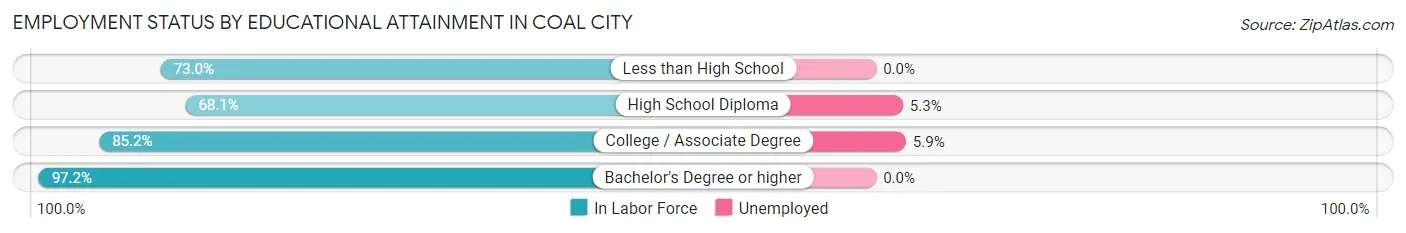
| Educational Attainment | In Labor Force | Unemployed |
| Less than High School | 127 (73.0%) | 0 (0.0%) |
| High School Diploma | 568 (68.1%) | 44 (5.3%) |
| College / Associate Degree | 728 (85.2%) | 50 (5.9%) |
| Bachelor's Degree or higher | 723 (97.2%) | 0 (0.0%) |
| Total | 2,145 (82.3%) | 89 (3.4%) |
Employment Occupations by Sex in Coal City
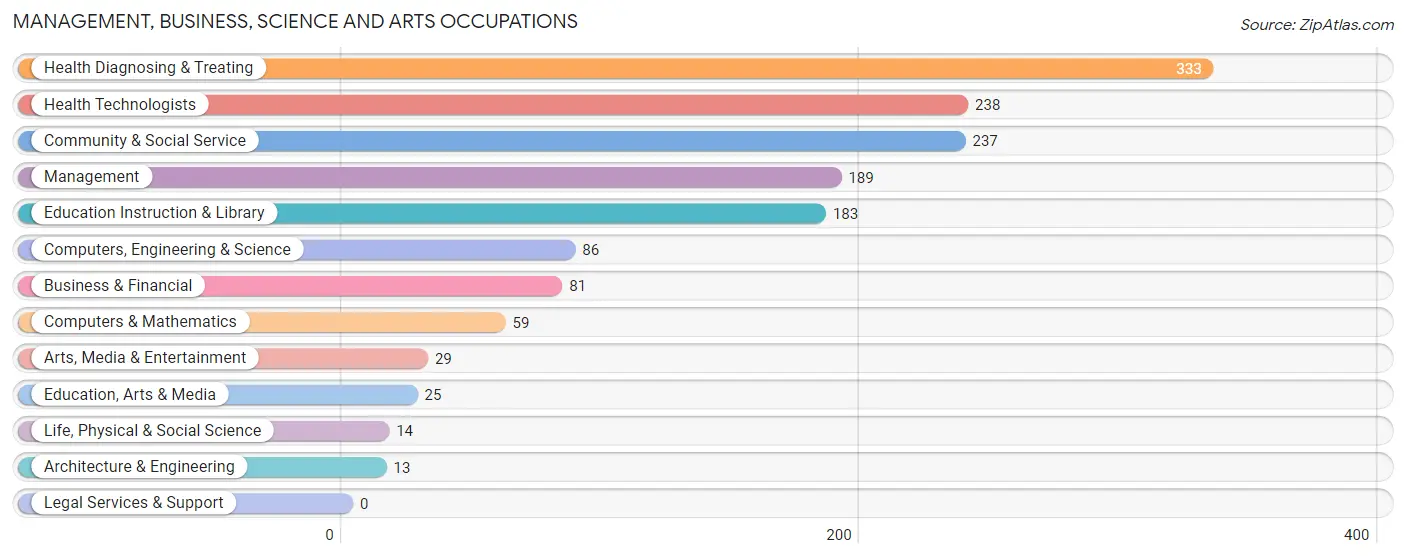
Management, Business, Science and Arts Occupations
The most common Management, Business, Science and Arts occupations in Coal City are Health Diagnosing & Treating (333 | 13.1%), Health Technologists (238 | 9.4%), Community & Social Service (237 | 9.3%), Management (189 | 7.4%), and Education Instruction & Library (183 | 7.2%).
Management, Business, Science and Arts Occupations by Sex
Within the Management, Business, Science and Arts occupations in Coal City, the most male-oriented occupations are Architecture & Engineering (100.0%), Life, Physical & Social Science (100.0%), and Arts, Media & Entertainment (100.0%), while the most female-oriented occupations are Education, Arts & Media (100.0%), Health Diagnosing & Treating (100.0%), and Health Technologists (100.0%).
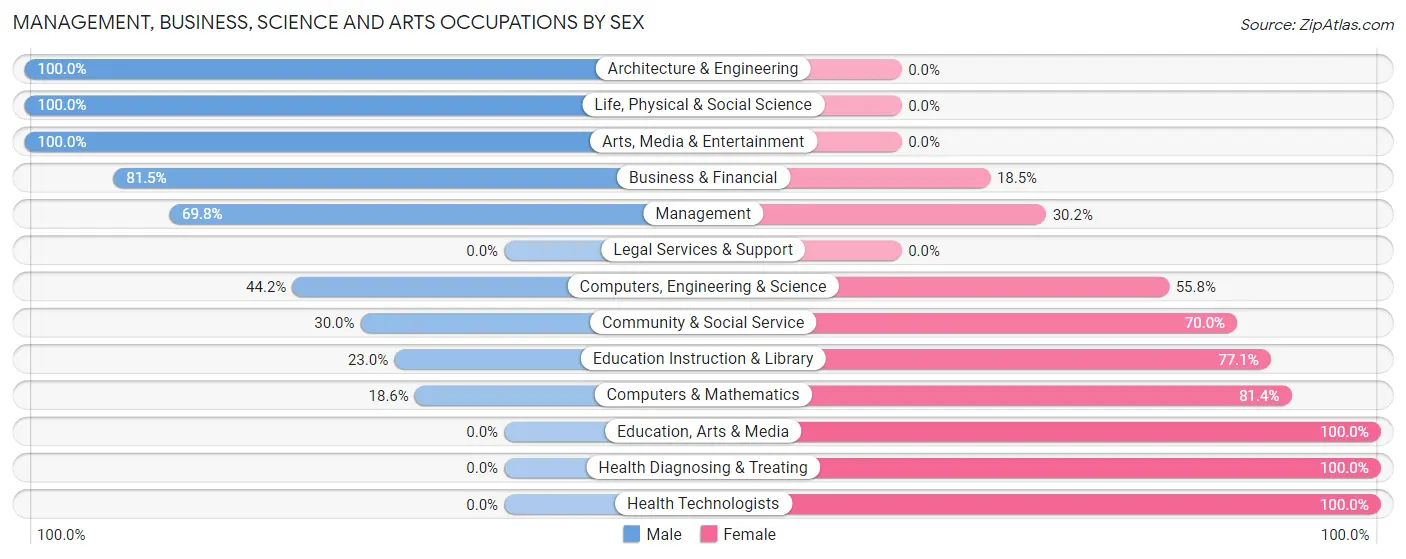
| Occupation | Male | Female |
| Management | 132 (69.8%) | 57 (30.2%) |
| Business & Financial | 66 (81.5%) | 15 (18.5%) |
| Computers, Engineering & Science | 38 (44.2%) | 48 (55.8%) |
| Computers & Mathematics | 11 (18.6%) | 48 (81.4%) |
| Architecture & Engineering | 13 (100.0%) | 0 (0.0%) |
| Life, Physical & Social Science | 14 (100.0%) | 0 (0.0%) |
| Community & Social Service | 71 (30.0%) | 166 (70.0%) |
| Education, Arts & Media | 0 (0.0%) | 25 (100.0%) |
| Legal Services & Support | 0 (0.0%) | 0 (0.0%) |
| Education Instruction & Library | 42 (23.0%) | 141 (77.0%) |
| Arts, Media & Entertainment | 29 (100.0%) | 0 (0.0%) |
| Health Diagnosing & Treating | 0 (0.0%) | 333 (100.0%) |
| Health Technologists | 0 (0.0%) | 238 (100.0%) |
| Total (Category) | 307 (33.2%) | 619 (66.8%) |
| Total (Overall) | 1,244 (48.9%) | 1,298 (51.1%) |
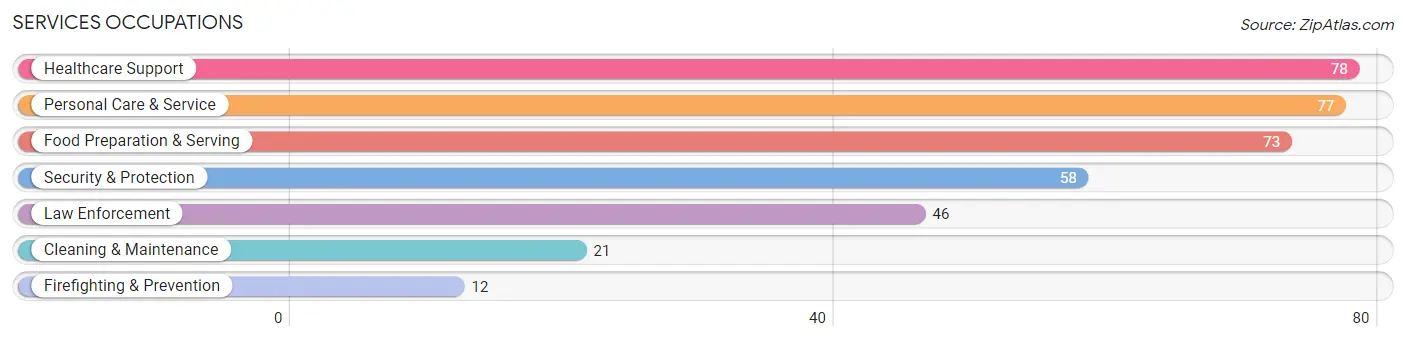
Services Occupations
The most common Services occupations in Coal City are Healthcare Support (78 | 3.1%), Personal Care & Service (77 | 3.0%), Food Preparation & Serving (73 | 2.9%), Security & Protection (58 | 2.3%), and Law Enforcement (46 | 1.8%).
Services Occupations by Sex
Within the Services occupations in Coal City, the most male-oriented occupations are Security & Protection (100.0%), Firefighting & Prevention (100.0%), and Law Enforcement (100.0%), while the most female-oriented occupations are Personal Care & Service (87.0%), Healthcare Support (71.8%), and Food Preparation & Serving (39.7%).
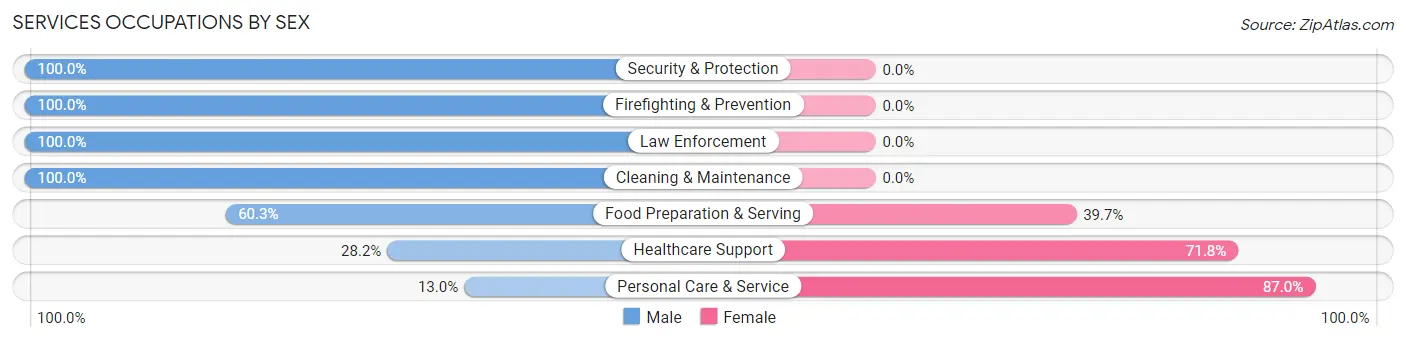
| Occupation | Male | Female |
| Healthcare Support | 22 (28.2%) | 56 (71.8%) |
| Security & Protection | 58 (100.0%) | 0 (0.0%) |
| Firefighting & Prevention | 12 (100.0%) | 0 (0.0%) |
| Law Enforcement | 46 (100.0%) | 0 (0.0%) |
| Food Preparation & Serving | 44 (60.3%) | 29 (39.7%) |
| Cleaning & Maintenance | 21 (100.0%) | 0 (0.0%) |
| Personal Care & Service | 10 (13.0%) | 67 (87.0%) |
| Total (Category) | 155 (50.5%) | 152 (49.5%) |
| Total (Overall) | 1,244 (48.9%) | 1,298 (51.1%) |
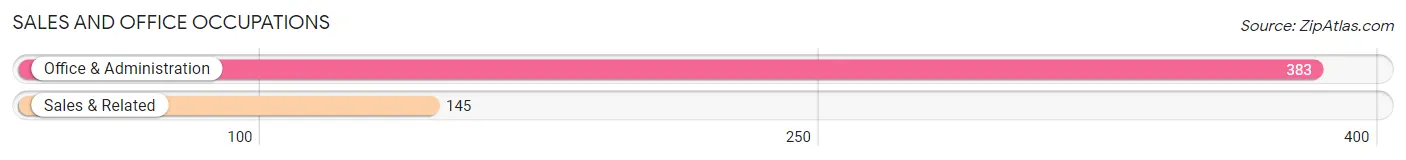
Sales and Office Occupations
The most common Sales and Office occupations in Coal City are Office & Administration (383 | 15.1%), and Sales & Related (145 | 5.7%).
Sales and Office Occupations by Sex

| Occupation | Male | Female |
| Sales & Related | 41 (28.3%) | 104 (71.7%) |
| Office & Administration | 49 (12.8%) | 334 (87.2%) |
| Total (Category) | 90 (17.1%) | 438 (83.0%) |
| Total (Overall) | 1,244 (48.9%) | 1,298 (51.1%) |
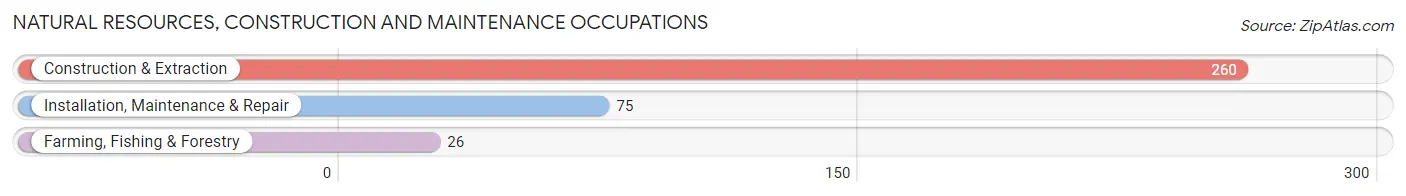
Natural Resources, Construction and Maintenance Occupations
The most common Natural Resources, Construction and Maintenance occupations in Coal City are Construction & Extraction (260 | 10.2%), Installation, Maintenance & Repair (75 | 2.9%), and Farming, Fishing & Forestry (26 | 1.0%).
Natural Resources, Construction and Maintenance Occupations by Sex
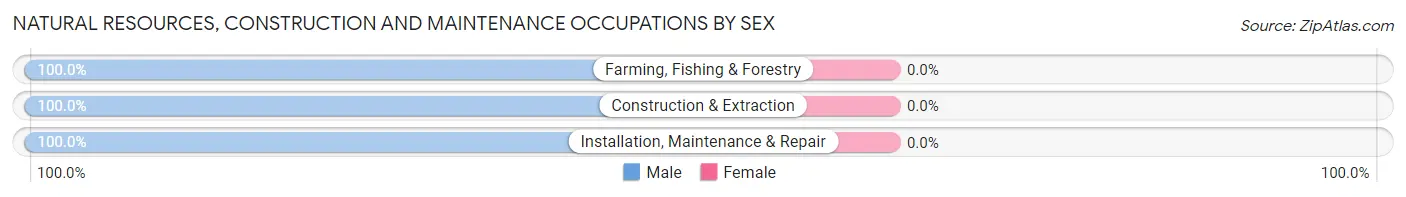
| Occupation | Male | Female |
| Farming, Fishing & Forestry | 26 (100.0%) | 0 (0.0%) |
| Construction & Extraction | 260 (100.0%) | 0 (0.0%) |
| Installation, Maintenance & Repair | 75 (100.0%) | 0 (0.0%) |
| Total (Category) | 361 (100.0%) | 0 (0.0%) |
| Total (Overall) | 1,244 (48.9%) | 1,298 (51.1%) |
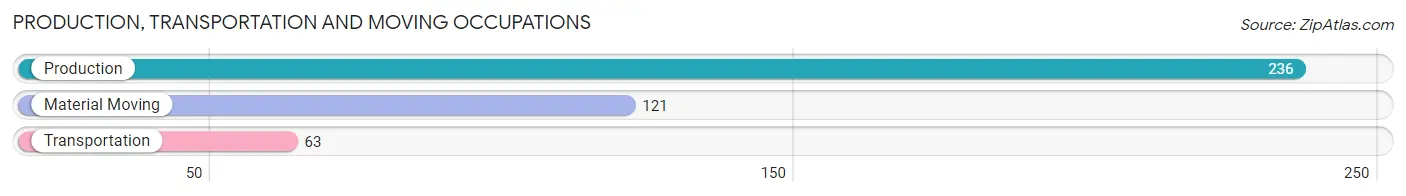
Production, Transportation and Moving Occupations
The most common Production, Transportation and Moving occupations in Coal City are Production (236 | 9.3%), Material Moving (121 | 4.8%), and Transportation (63 | 2.5%).
Production, Transportation and Moving Occupations by Sex
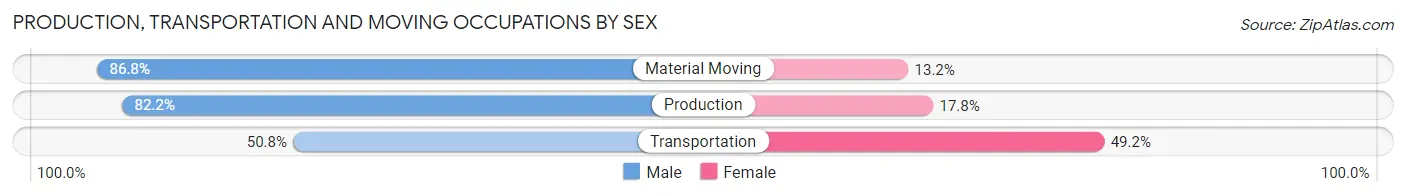
| Occupation | Male | Female |
| Production | 194 (82.2%) | 42 (17.8%) |
| Transportation | 32 (50.8%) | 31 (49.2%) |
| Material Moving | 105 (86.8%) | 16 (13.2%) |
| Total (Category) | 331 (78.8%) | 89 (21.2%) |
| Total (Overall) | 1,244 (48.9%) | 1,298 (51.1%) |
Employment Industries by Sex in Coal City
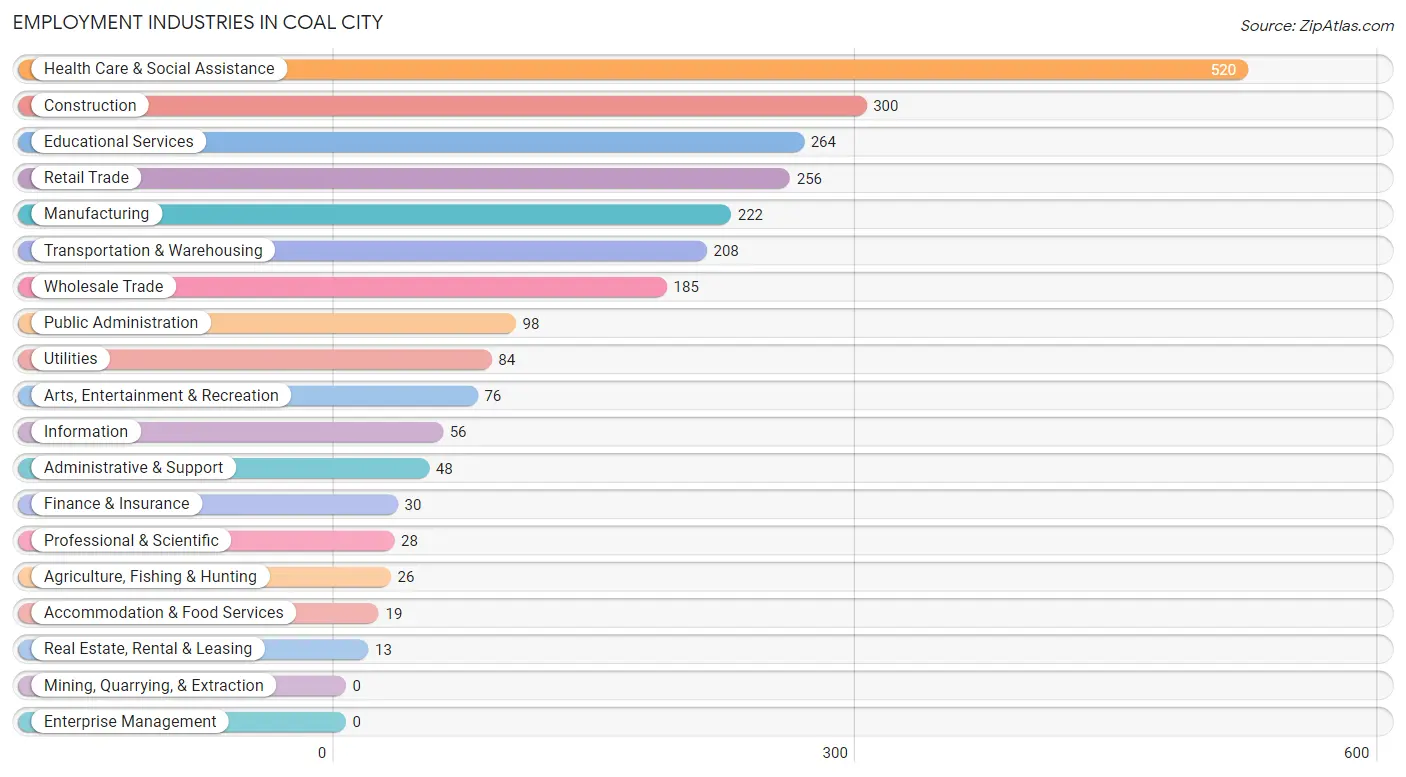
Employment Industries in Coal City
The major employment industries in Coal City include Health Care & Social Assistance (520 | 20.5%), Construction (300 | 11.8%), Educational Services (264 | 10.4%), Retail Trade (256 | 10.1%), and Manufacturing (222 | 8.7%).
Employment Industries by Sex in Coal City
The Coal City industries that see more men than women are Agriculture, Fishing & Hunting (100.0%), Construction (91.3%), and Manufacturing (89.2%), whereas the industries that tend to have a higher number of women are Accommodation & Food Services (100.0%), Educational Services (84.1%), and Health Care & Social Assistance (83.7%).
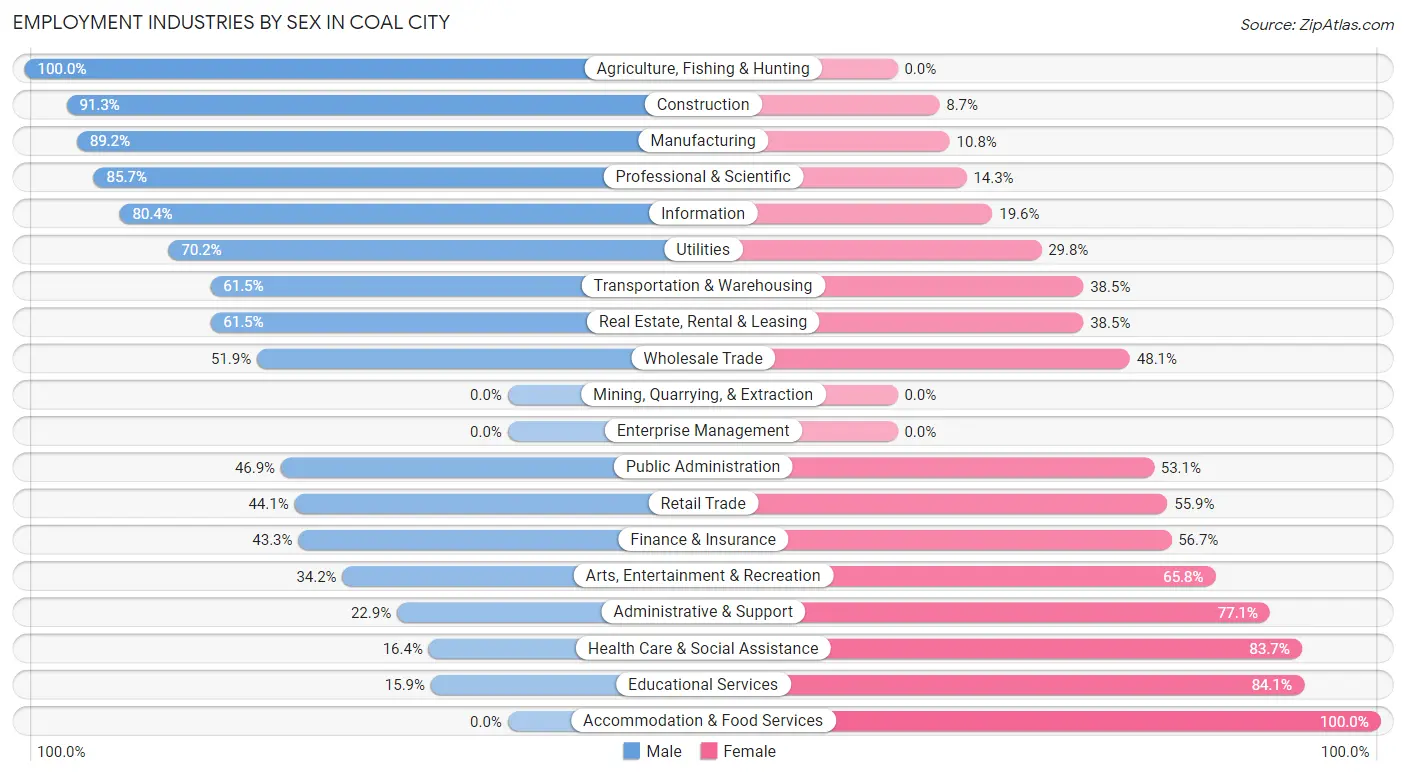
| Industry | Male | Female |
| Agriculture, Fishing & Hunting | 26 (100.0%) | 0 (0.0%) |
| Mining, Quarrying, & Extraction | 0 (0.0%) | 0 (0.0%) |
| Construction | 274 (91.3%) | 26 (8.7%) |
| Manufacturing | 198 (89.2%) | 24 (10.8%) |
| Wholesale Trade | 96 (51.9%) | 89 (48.1%) |
| Retail Trade | 113 (44.1%) | 143 (55.9%) |
| Transportation & Warehousing | 128 (61.5%) | 80 (38.5%) |
| Utilities | 59 (70.2%) | 25 (29.8%) |
| Information | 45 (80.4%) | 11 (19.6%) |
| Finance & Insurance | 13 (43.3%) | 17 (56.7%) |
| Real Estate, Rental & Leasing | 8 (61.5%) | 5 (38.5%) |
| Professional & Scientific | 24 (85.7%) | 4 (14.3%) |
| Enterprise Management | 0 (0.0%) | 0 (0.0%) |
| Administrative & Support | 11 (22.9%) | 37 (77.1%) |
| Educational Services | 42 (15.9%) | 222 (84.1%) |
| Health Care & Social Assistance | 85 (16.4%) | 435 (83.7%) |
| Arts, Entertainment & Recreation | 26 (34.2%) | 50 (65.8%) |
| Accommodation & Food Services | 0 (0.0%) | 19 (100.0%) |
| Public Administration | 46 (46.9%) | 52 (53.1%) |
| Total | 1,244 (48.9%) | 1,298 (51.1%) |
Education in Coal City
School Enrollment in Coal City
The most common levels of schooling among the 1,350 students in Coal City are high school (406 | 30.1%), elementary school (316 | 23.4%), and middle school (280 | 20.7%).
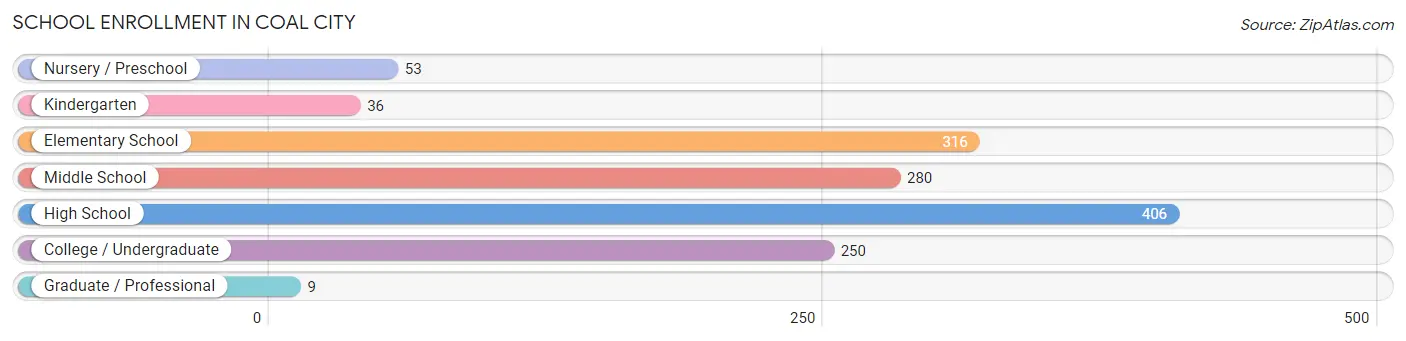
| School Level | # Students | % Students |
| Nursery / Preschool | 53 | 3.9% |
| Kindergarten | 36 | 2.7% |
| Elementary School | 316 | 23.4% |
| Middle School | 280 | 20.7% |
| High School | 406 | 30.1% |
| College / Undergraduate | 250 | 18.5% |
| Graduate / Professional | 9 | 0.7% |
| Total | 1,350 | 100.0% |
School Enrollment by Age by Funding Source in Coal City
Out of a total of 1,350 students who are enrolled in schools in Coal City, 34 (2.5%) attend a private institution, while the remaining 1,316 (97.5%) are enrolled in public schools. The age group of 25 to 34 year olds has the highest likelihood of being enrolled in private schools, with 11 (100.0% in the age bracket) enrolled. Conversely, the age group of 5 to 9 year old has the lowest likelihood of being enrolled in a private school, with 338 (100.0% in the age bracket) attending a public institution.
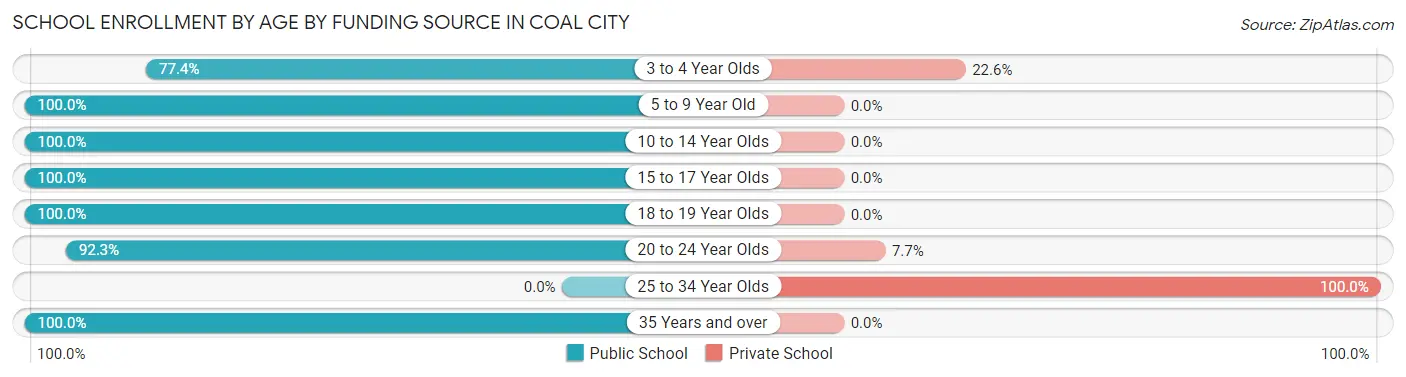
| Age Bracket | Public School | Private School |
| 3 to 4 Year Olds | 41 (77.4%) | 12 (22.6%) |
| 5 to 9 Year Old | 338 (100.0%) | 0 (0.0%) |
| 10 to 14 Year Olds | 309 (100.0%) | 0 (0.0%) |
| 15 to 17 Year Olds | 391 (100.0%) | 0 (0.0%) |
| 18 to 19 Year Olds | 87 (100.0%) | 0 (0.0%) |
| 20 to 24 Year Olds | 132 (92.3%) | 11 (7.7%) |
| 25 to 34 Year Olds | 0 (0.0%) | 11 (100.0%) |
| 35 Years and over | 18 (100.0%) | 0 (0.0%) |
| Total | 1,316 (97.5%) | 34 (2.5%) |
Educational Attainment by Field of Study in Coal City
Science & technology (182 | 20.1%), education (177 | 19.6%), business (123 | 13.6%), arts & humanities (89 | 9.9%), and liberal arts & history (61 | 6.8%) are the most common fields of study among 904 individuals in Coal City who have obtained a bachelor's degree or higher.
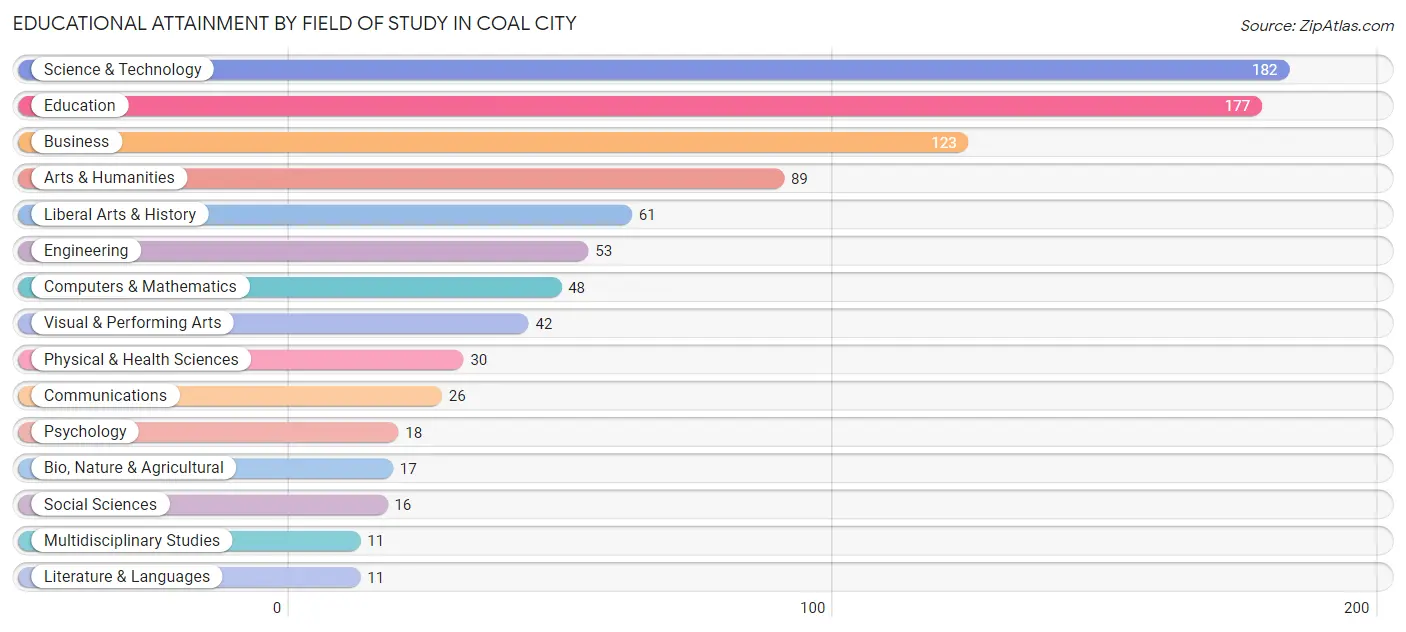
| Field of Study | # Graduates | % Graduates |
| Computers & Mathematics | 48 | 5.3% |
| Bio, Nature & Agricultural | 17 | 1.9% |
| Physical & Health Sciences | 30 | 3.3% |
| Psychology | 18 | 2.0% |
| Social Sciences | 16 | 1.8% |
| Engineering | 53 | 5.9% |
| Multidisciplinary Studies | 11 | 1.2% |
| Science & Technology | 182 | 20.1% |
| Business | 123 | 13.6% |
| Education | 177 | 19.6% |
| Literature & Languages | 11 | 1.2% |
| Liberal Arts & History | 61 | 6.8% |
| Visual & Performing Arts | 42 | 4.6% |
| Communications | 26 | 2.9% |
| Arts & Humanities | 89 | 9.9% |
| Total | 904 | 100.0% |
Transportation & Commute in Coal City
Vehicle Availability by Sex in Coal City
The most prevalent vehicle ownership categories in Coal City are males with 3 vehicles (541, accounting for 43.5%) and females with 3 vehicles (444, making up 42.5%).
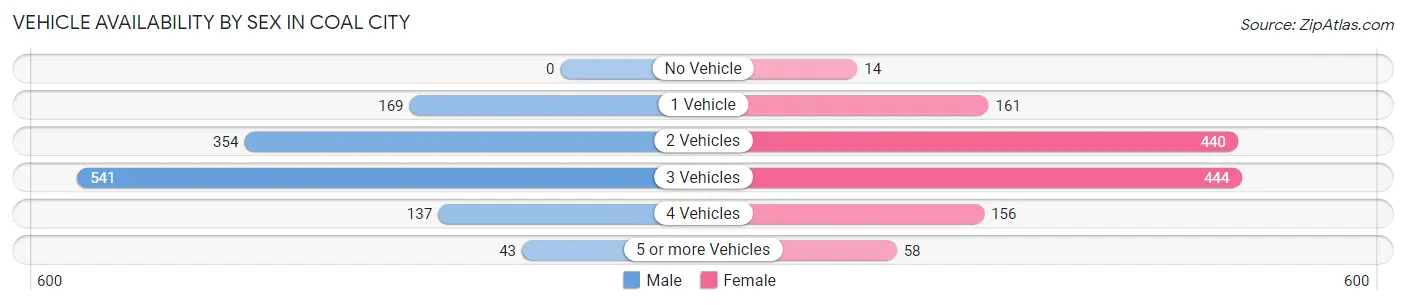
| Vehicles Available | Male | Female |
| No Vehicle | 0 (0.0%) | 14 (1.1%) |
| 1 Vehicle | 169 (13.6%) | 161 (12.7%) |
| 2 Vehicles | 354 (28.5%) | 440 (34.6%) |
| 3 Vehicles | 541 (43.5%) | 444 (34.9%) |
| 4 Vehicles | 137 (11.0%) | 156 (12.2%) |
| 5 or more Vehicles | 43 (3.5%) | 58 (4.6%) |
| Total | 1,244 (100.0%) | 1,273 (100.0%) |
Commute Time in Coal City
The most frequently occuring commute durations in Coal City are 20 to 24 minutes (418 commuters, 18.6%), 5 to 9 minutes (257 commuters, 11.5%), and 45 to 59 minutes (250 commuters, 11.2%).
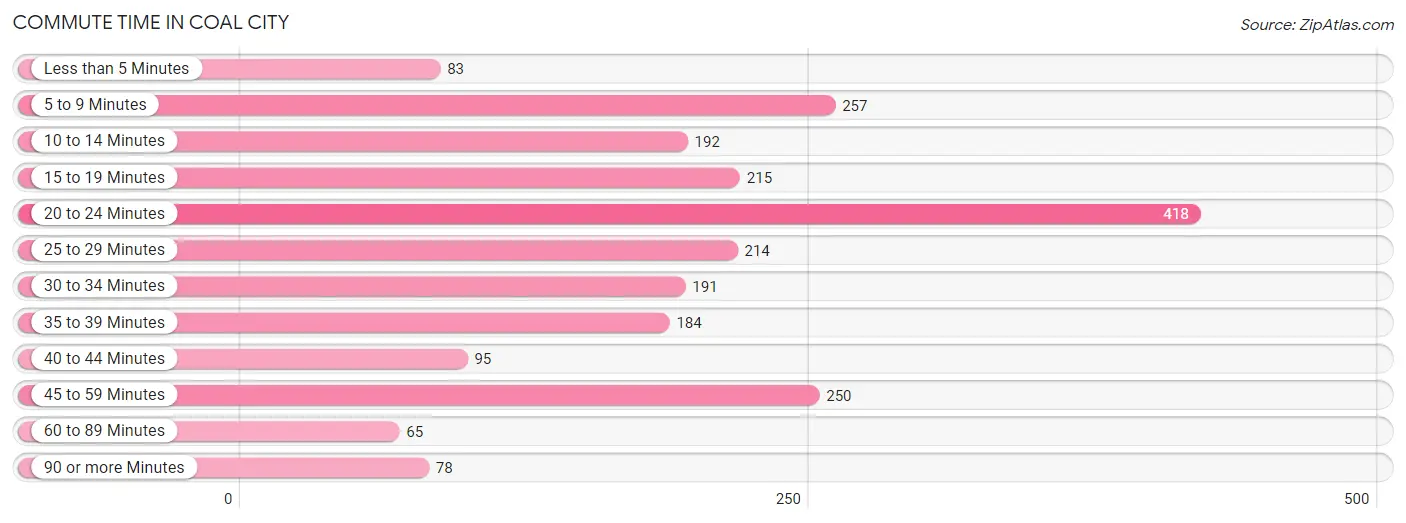
| Commute Time | # Commuters | % Commuters |
| Less than 5 Minutes | 83 | 3.7% |
| 5 to 9 Minutes | 257 | 11.5% |
| 10 to 14 Minutes | 192 | 8.6% |
| 15 to 19 Minutes | 215 | 9.6% |
| 20 to 24 Minutes | 418 | 18.6% |
| 25 to 29 Minutes | 214 | 9.6% |
| 30 to 34 Minutes | 191 | 8.5% |
| 35 to 39 Minutes | 184 | 8.2% |
| 40 to 44 Minutes | 95 | 4.2% |
| 45 to 59 Minutes | 250 | 11.2% |
| 60 to 89 Minutes | 65 | 2.9% |
| 90 or more Minutes | 78 | 3.5% |
Commute Time by Sex in Coal City
The most common commute times in Coal City are 25 to 29 minutes (173 commuters, 16.2%) for males and 20 to 24 minutes (348 commuters, 29.6%) for females.
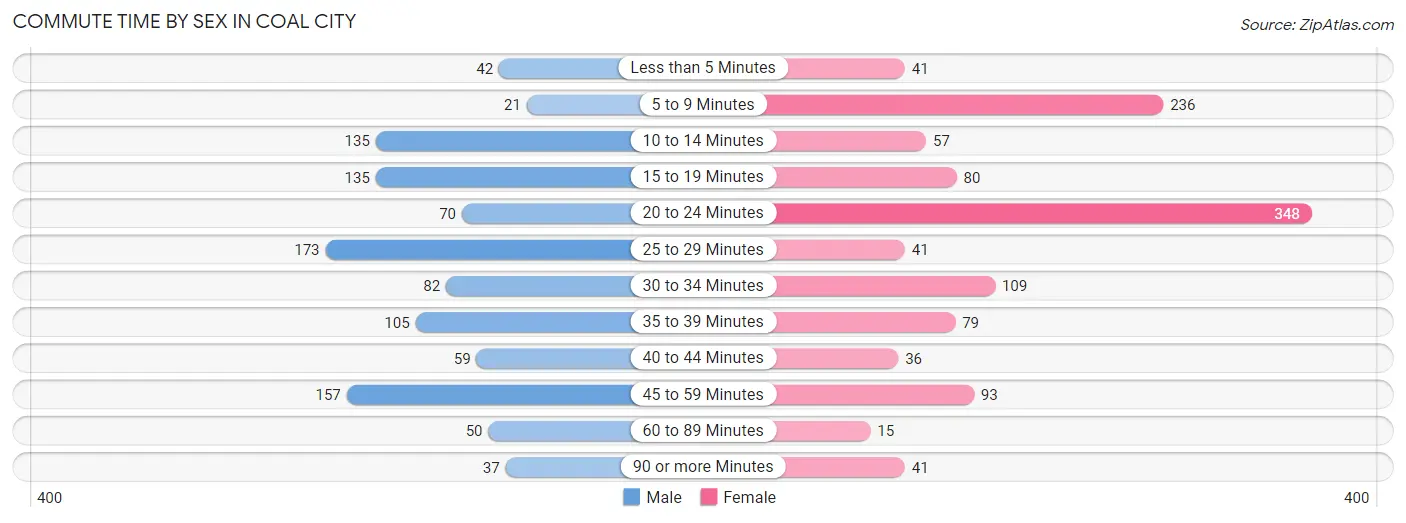
| Commute Time | Male | Female |
| Less than 5 Minutes | 42 (3.9%) | 41 (3.5%) |
| 5 to 9 Minutes | 21 (2.0%) | 236 (20.1%) |
| 10 to 14 Minutes | 135 (12.7%) | 57 (4.9%) |
| 15 to 19 Minutes | 135 (12.7%) | 80 (6.8%) |
| 20 to 24 Minutes | 70 (6.6%) | 348 (29.6%) |
| 25 to 29 Minutes | 173 (16.2%) | 41 (3.5%) |
| 30 to 34 Minutes | 82 (7.7%) | 109 (9.3%) |
| 35 to 39 Minutes | 105 (9.9%) | 79 (6.7%) |
| 40 to 44 Minutes | 59 (5.5%) | 36 (3.1%) |
| 45 to 59 Minutes | 157 (14.7%) | 93 (7.9%) |
| 60 to 89 Minutes | 50 (4.7%) | 15 (1.3%) |
| 90 or more Minutes | 37 (3.5%) | 41 (3.5%) |
Time of Departure to Work by Sex in Coal City
The most frequent times of departure to work in Coal City are 6:00 AM to 6:29 AM (280, 26.3%) for males and 6:30 AM to 6:59 AM (253, 21.5%) for females.
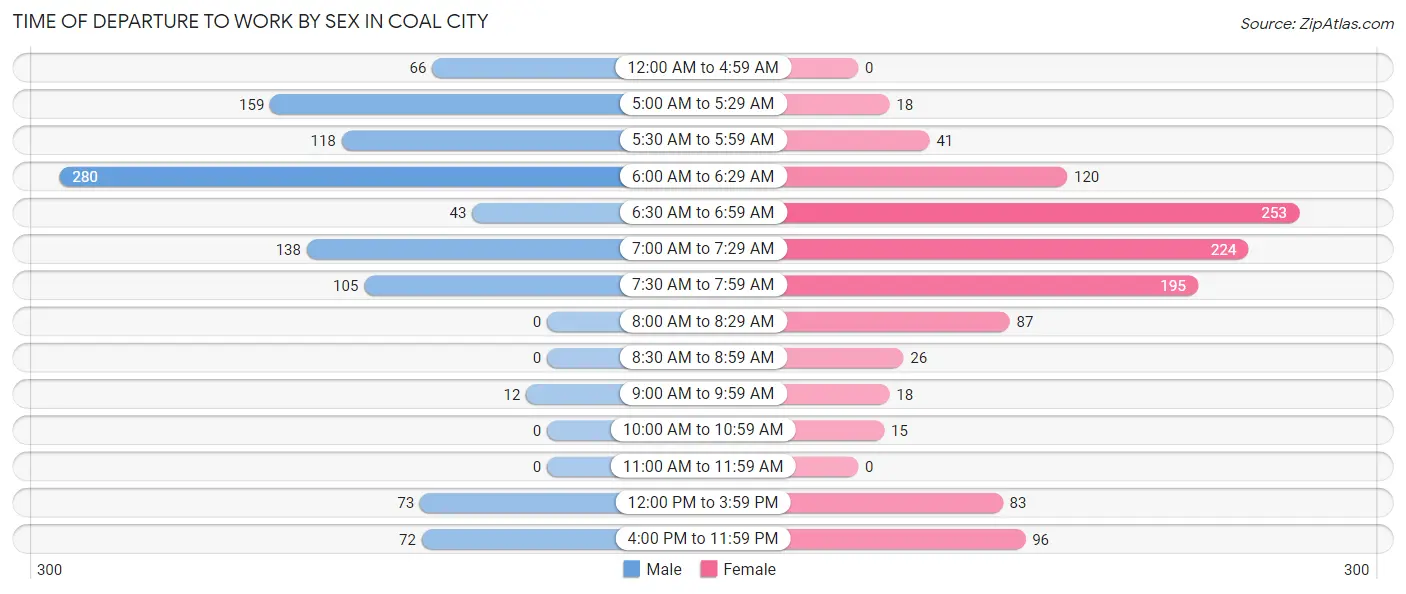
| Time of Departure | Male | Female |
| 12:00 AM to 4:59 AM | 66 (6.2%) | 0 (0.0%) |
| 5:00 AM to 5:29 AM | 159 (14.9%) | 18 (1.5%) |
| 5:30 AM to 5:59 AM | 118 (11.1%) | 41 (3.5%) |
| 6:00 AM to 6:29 AM | 280 (26.3%) | 120 (10.2%) |
| 6:30 AM to 6:59 AM | 43 (4.0%) | 253 (21.5%) |
| 7:00 AM to 7:29 AM | 138 (13.0%) | 224 (19.1%) |
| 7:30 AM to 7:59 AM | 105 (9.9%) | 195 (16.6%) |
| 8:00 AM to 8:29 AM | 0 (0.0%) | 87 (7.4%) |
| 8:30 AM to 8:59 AM | 0 (0.0%) | 26 (2.2%) |
| 9:00 AM to 9:59 AM | 12 (1.1%) | 18 (1.5%) |
| 10:00 AM to 10:59 AM | 0 (0.0%) | 15 (1.3%) |
| 11:00 AM to 11:59 AM | 0 (0.0%) | 0 (0.0%) |
| 12:00 PM to 3:59 PM | 73 (6.9%) | 83 (7.1%) |
| 4:00 PM to 11:59 PM | 72 (6.8%) | 96 (8.2%) |
| Total | 1,066 (100.0%) | 1,176 (100.0%) |
Housing Occupancy in Coal City
Occupancy by Ownership in Coal City
Of the total 1,995 dwellings in Coal City, owner-occupied units account for 1,579 (79.1%), while renter-occupied units make up 416 (20.8%).
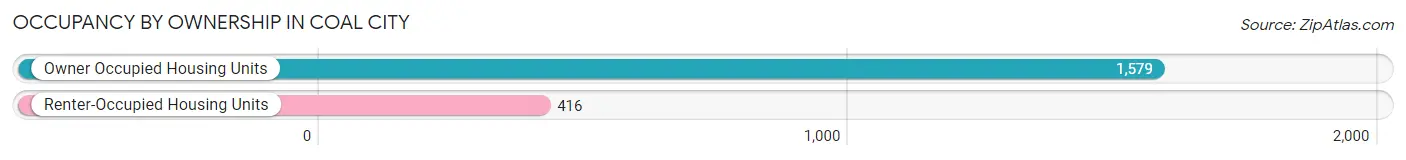
| Occupancy | # Housing Units | % Housing Units |
| Owner Occupied Housing Units | 1,579 | 79.1% |
| Renter-Occupied Housing Units | 416 | 20.8% |
| Total Occupied Housing Units | 1,995 | 100.0% |
Occupancy by Household Size in Coal City
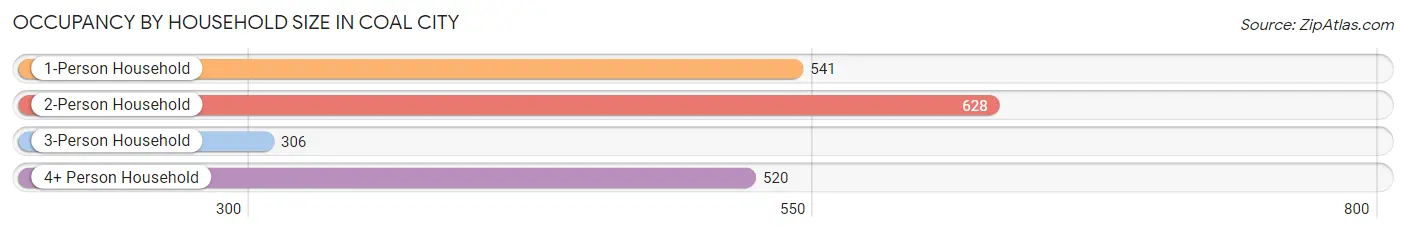
| Household Size | # Housing Units | % Housing Units |
| 1-Person Household | 541 | 27.1% |
| 2-Person Household | 628 | 31.5% |
| 3-Person Household | 306 | 15.3% |
| 4+ Person Household | 520 | 26.1% |
| Total Housing Units | 1,995 | 100.0% |
Occupancy by Ownership by Household Size in Coal City
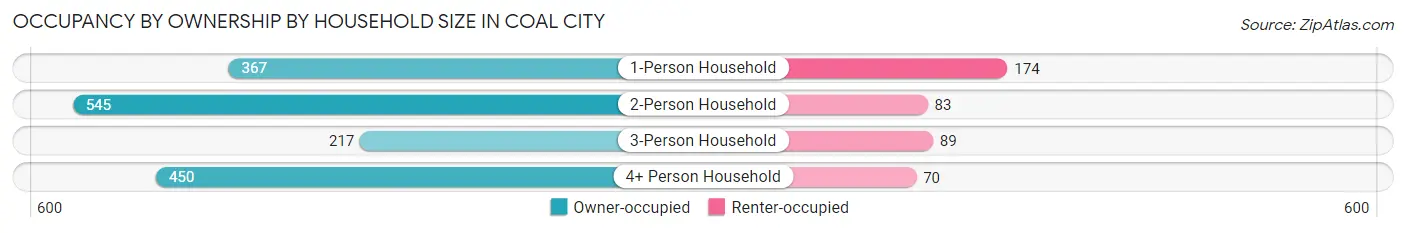
| Household Size | Owner-occupied | Renter-occupied |
| 1-Person Household | 367 (67.8%) | 174 (32.2%) |
| 2-Person Household | 545 (86.8%) | 83 (13.2%) |
| 3-Person Household | 217 (70.9%) | 89 (29.1%) |
| 4+ Person Household | 450 (86.5%) | 70 (13.5%) |
| Total Housing Units | 1,579 (79.1%) | 416 (20.8%) |
Occupancy by Educational Attainment in Coal City
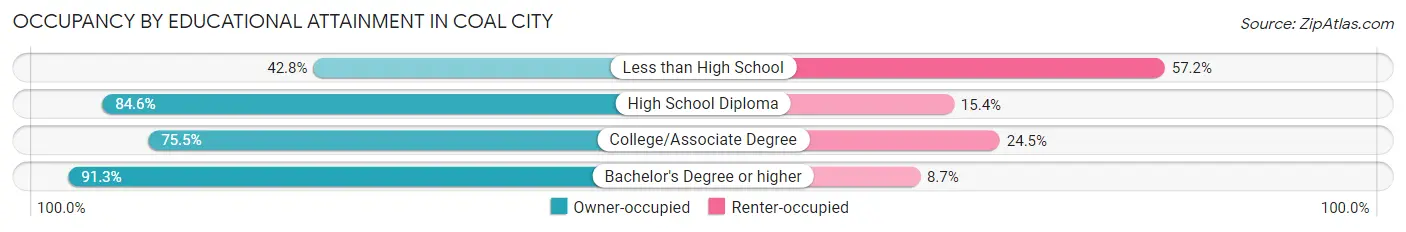
| Household Size | Owner-occupied | Renter-occupied |
| Less than High School | 68 (42.8%) | 91 (57.2%) |
| High School Diploma | 637 (84.6%) | 116 (15.4%) |
| College/Associate Degree | 548 (75.5%) | 178 (24.5%) |
| Bachelor's Degree or higher | 326 (91.3%) | 31 (8.7%) |
Occupancy by Age of Householder in Coal City
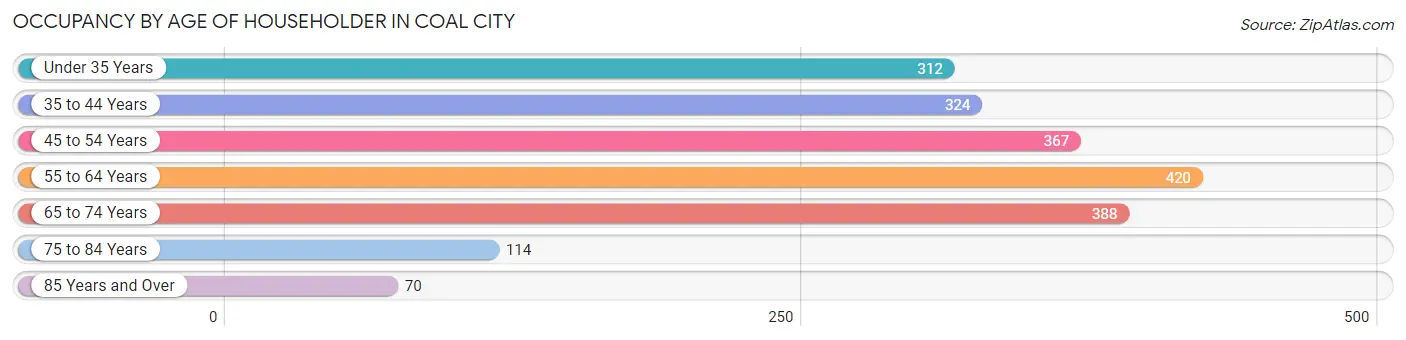
| Age Bracket | # Households | % Households |
| Under 35 Years | 312 | 15.6% |
| 35 to 44 Years | 324 | 16.2% |
| 45 to 54 Years | 367 | 18.4% |
| 55 to 64 Years | 420 | 21.0% |
| 65 to 74 Years | 388 | 19.5% |
| 75 to 84 Years | 114 | 5.7% |
| 85 Years and Over | 70 | 3.5% |
| Total | 1,995 | 100.0% |
Housing Finances in Coal City
Median Income by Occupancy in Coal City
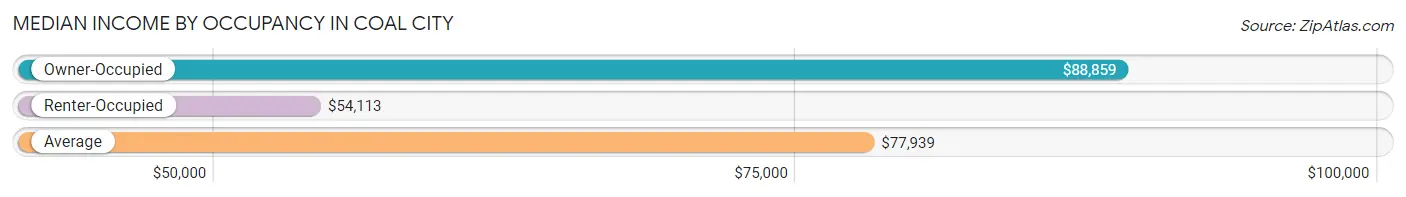
| Occupancy Type | # Households | Median Income |
| Owner-Occupied | 1,579 (79.1%) | $88,859 |
| Renter-Occupied | 416 (20.8%) | $54,113 |
| Average | 1,995 (100.0%) | $77,939 |
Occupancy by Householder Income Bracket in Coal City
| Income Bracket | Owner-occupied | Renter-occupied |
| Less than $5,000 | 5 (0.3%) | 0 (0.0%) |
| $5,000 to $9,999 | 41 (2.6%) | 16 (3.8%) |
| $10,000 to $14,999 | 25 (1.6%) | 0 (0.0%) |
| $15,000 to $19,999 | 57 (3.6%) | 23 (5.5%) |
| $20,000 to $24,999 | 22 (1.4%) | 71 (17.1%) |
| $25,000 to $34,999 | 72 (4.6%) | 16 (3.8%) |
| $35,000 to $49,999 | 255 (16.2%) | 18 (4.3%) |
| $50,000 to $74,999 | 228 (14.4%) | 129 (31.0%) |
| $75,000 to $99,999 | 200 (12.7%) | 32 (7.7%) |
| $100,000 to $149,999 | 196 (12.4%) | 72 (17.3%) |
| $150,000 or more | 478 (30.3%) | 39 (9.4%) |
| Total | 1,579 (100.0%) | 416 (100.0%) |
Monthly Housing Cost Tiers in Coal City
| Monthly Cost | Owner-occupied | Renter-occupied |
| Less than $300 | 42 (2.7%) | 0 (0.0%) |
| $300 to $499 | 44 (2.8%) | 59 (14.2%) |
| $500 to $799 | 475 (30.1%) | 40 (9.6%) |
| $800 to $999 | 130 (8.2%) | 27 (6.5%) |
| $1,000 to $1,499 | 377 (23.9%) | 175 (42.1%) |
| $1,500 to $1,999 | 208 (13.2%) | 93 (22.4%) |
| $2,000 to $2,499 | 150 (9.5%) | 0 (0.0%) |
| $2,500 to $2,999 | 108 (6.8%) | 17 (4.1%) |
| $3,000 or more | 45 (2.9%) | 0 (0.0%) |
| Total | 1,579 (100.0%) | 416 (100.0%) |
Physical Housing Characteristics in Coal City
Housing Structures in Coal City
| Structure Type | # Housing Units | % Housing Units |
| Single Unit, Detached | 1,473 | 73.8% |
| Single Unit, Attached | 290 | 14.5% |
| 2 Unit Apartments | 5 | 0.3% |
| 3 or 4 Unit Apartments | 169 | 8.5% |
| 5 to 9 Unit Apartments | 50 | 2.5% |
| 10 or more Apartments | 0 | 0.0% |
| Mobile Home / Other | 8 | 0.4% |
| Total | 1,995 | 100.0% |
Housing Structures by Occupancy in Coal City
| Structure Type | Owner-occupied | Renter-occupied |
| Single Unit, Detached | 1,370 (93.0%) | 103 (7.0%) |
| Single Unit, Attached | 201 (69.3%) | 89 (30.7%) |
| 2 Unit Apartments | 0 (0.0%) | 5 (100.0%) |
| 3 or 4 Unit Apartments | 0 (0.0%) | 169 (100.0%) |
| 5 to 9 Unit Apartments | 0 (0.0%) | 50 (100.0%) |
| 10 or more Apartments | 0 (0.0%) | 0 (0.0%) |
| Mobile Home / Other | 8 (100.0%) | 0 (0.0%) |
| Total | 1,579 (79.1%) | 416 (20.8%) |
Housing Structures by Number of Rooms in Coal City
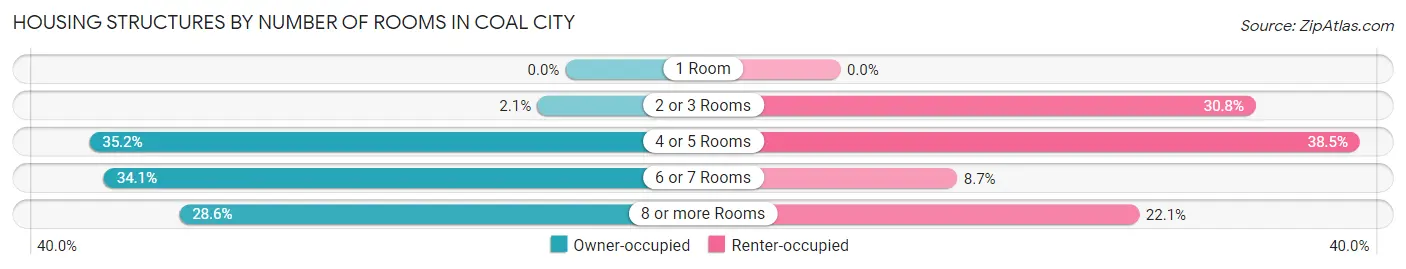
| Number of Rooms | Owner-occupied | Renter-occupied |
| 1 Room | 0 (0.0%) | 0 (0.0%) |
| 2 or 3 Rooms | 33 (2.1%) | 128 (30.8%) |
| 4 or 5 Rooms | 556 (35.2%) | 160 (38.5%) |
| 6 or 7 Rooms | 539 (34.1%) | 36 (8.6%) |
| 8 or more Rooms | 451 (28.6%) | 92 (22.1%) |
| Total | 1,579 (100.0%) | 416 (100.0%) |
Housing Structure by Heating Type in Coal City
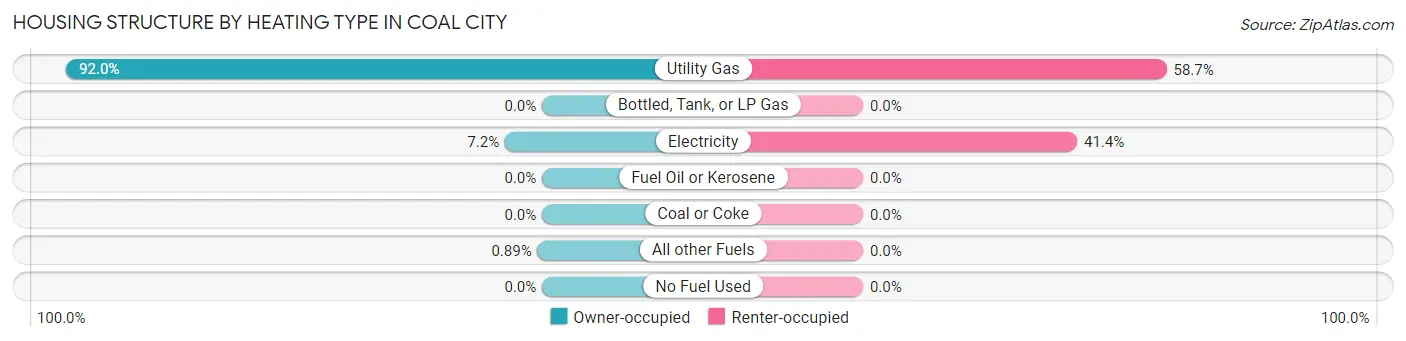
| Heating Type | Owner-occupied | Renter-occupied |
| Utility Gas | 1,452 (92.0%) | 244 (58.7%) |
| Bottled, Tank, or LP Gas | 0 (0.0%) | 0 (0.0%) |
| Electricity | 113 (7.2%) | 172 (41.3%) |
| Fuel Oil or Kerosene | 0 (0.0%) | 0 (0.0%) |
| Coal or Coke | 0 (0.0%) | 0 (0.0%) |
| All other Fuels | 14 (0.9%) | 0 (0.0%) |
| No Fuel Used | 0 (0.0%) | 0 (0.0%) |
| Total | 1,579 (100.0%) | 416 (100.0%) |
Household Vehicle Usage in Coal City
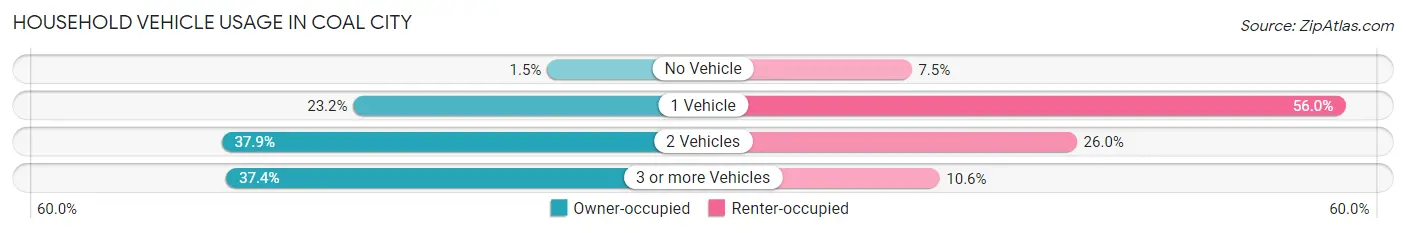
| Vehicles per Household | Owner-occupied | Renter-occupied |
| No Vehicle | 23 (1.5%) | 31 (7.4%) |
| 1 Vehicle | 366 (23.2%) | 233 (56.0%) |
| 2 Vehicles | 599 (37.9%) | 108 (26.0%) |
| 3 or more Vehicles | 591 (37.4%) | 44 (10.6%) |
| Total | 1,579 (100.0%) | 416 (100.0%) |
Real Estate & Mortgages in Coal City
Real Estate and Mortgage Overview in Coal City
| Characteristic | Without Mortgage | With Mortgage |
| Housing Units | 638 | 941 |
| Median Property Value | $208,300 | $221,300 |
| Median Household Income | $65,765 | $325 |
| Monthly Housing Costs | $654 | $45 |
| Real Estate Taxes | $4,094 | $0 |
Property Value by Mortgage Status in Coal City
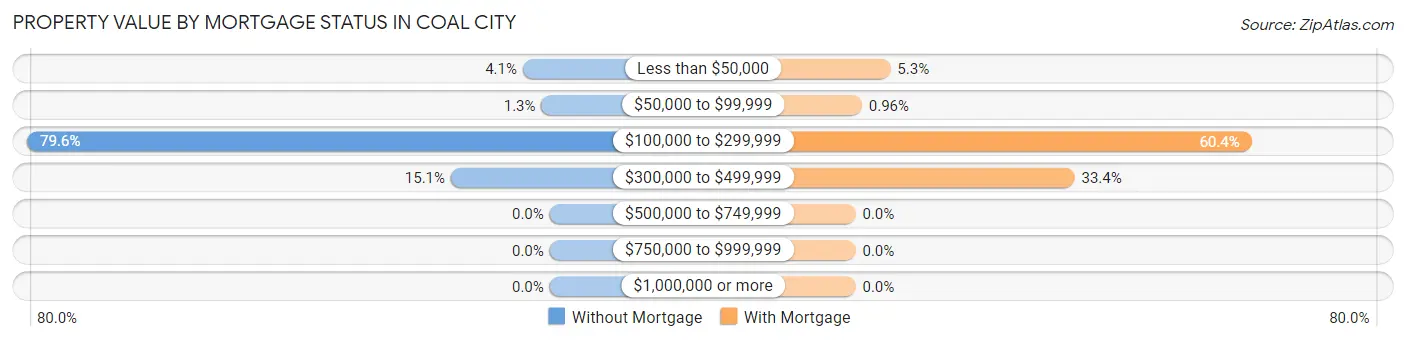
| Property Value | Without Mortgage | With Mortgage |
| Less than $50,000 | 26 (4.1%) | 50 (5.3%) |
| $50,000 to $99,999 | 8 (1.3%) | 9 (1.0%) |
| $100,000 to $299,999 | 508 (79.6%) | 568 (60.4%) |
| $300,000 to $499,999 | 96 (15.0%) | 314 (33.4%) |
| $500,000 to $749,999 | 0 (0.0%) | 0 (0.0%) |
| $750,000 to $999,999 | 0 (0.0%) | 0 (0.0%) |
| $1,000,000 or more | 0 (0.0%) | 0 (0.0%) |
| Total | 638 (100.0%) | 941 (100.0%) |
Household Income by Mortgage Status in Coal City
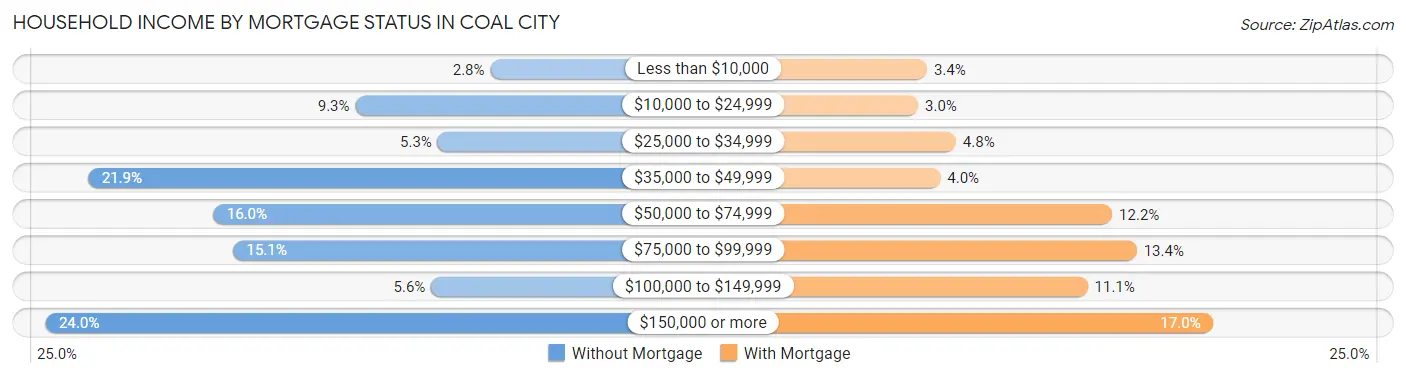
| Household Income | Without Mortgage | With Mortgage |
| Less than $10,000 | 18 (2.8%) | 32 (3.4%) |
| $10,000 to $24,999 | 59 (9.2%) | 28 (3.0%) |
| $25,000 to $34,999 | 34 (5.3%) | 45 (4.8%) |
| $35,000 to $49,999 | 140 (21.9%) | 38 (4.0%) |
| $50,000 to $74,999 | 102 (16.0%) | 115 (12.2%) |
| $75,000 to $99,999 | 96 (15.0%) | 126 (13.4%) |
| $100,000 to $149,999 | 36 (5.6%) | 104 (11.1%) |
| $150,000 or more | 153 (24.0%) | 160 (17.0%) |
| Total | 638 (100.0%) | 941 (100.0%) |
Property Value to Household Income Ratio in Coal City
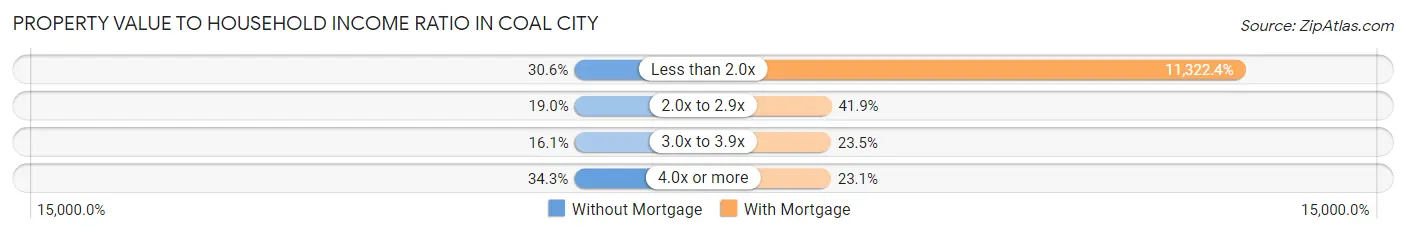
| Value-to-Income Ratio | Without Mortgage | With Mortgage |
| Less than 2.0x | 195 (30.6%) | 106,544 (11,322.4%) |
| 2.0x to 2.9x | 121 (19.0%) | 394 (41.9%) |
| 3.0x to 3.9x | 103 (16.1%) | 221 (23.5%) |
| 4.0x or more | 219 (34.3%) | 217 (23.1%) |
| Total | 638 (100.0%) | 941 (100.0%) |
Real Estate Taxes by Mortgage Status in Coal City
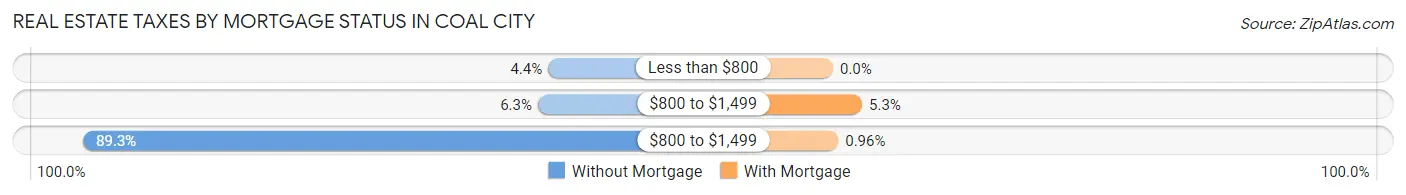
| Property Taxes | Without Mortgage | With Mortgage |
| Less than $800 | 28 (4.4%) | 0 (0.0%) |
| $800 to $1,499 | 40 (6.3%) | 50 (5.3%) |
| $800 to $1,499 | 570 (89.3%) | 9 (1.0%) |
| Total | 638 (100.0%) | 941 (100.0%) |
Health & Disability in Coal City
Health Insurance Coverage by Age in Coal City
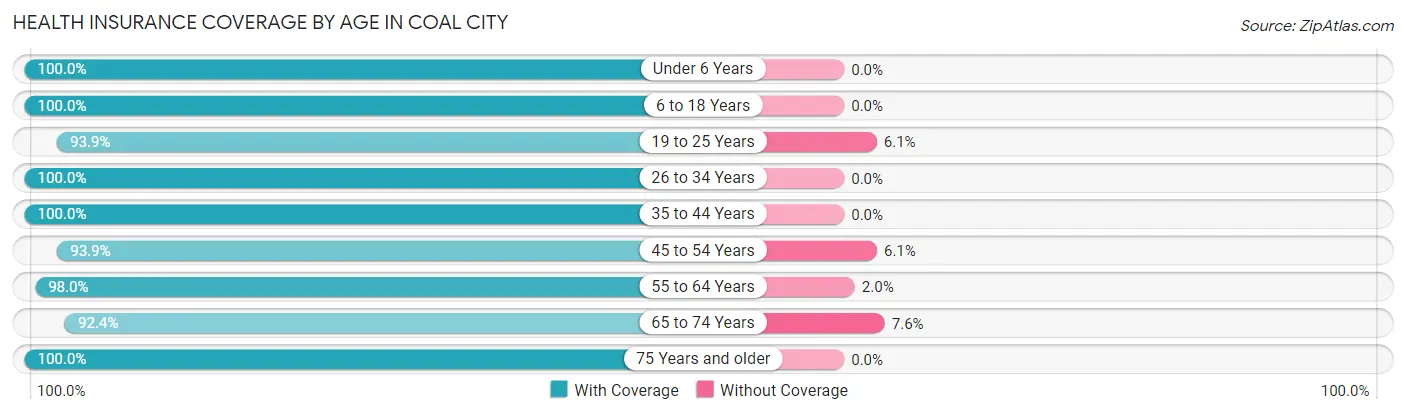
| Age Bracket | With Coverage | Without Coverage |
| Under 6 Years | 269 (100.0%) | 0 (0.0%) |
| 6 to 18 Years | 1,056 (100.0%) | 0 (0.0%) |
| 19 to 25 Years | 418 (93.9%) | 27 (6.1%) |
| 26 to 34 Years | 435 (100.0%) | 0 (0.0%) |
| 35 to 44 Years | 812 (100.0%) | 0 (0.0%) |
| 45 to 54 Years | 569 (93.9%) | 37 (6.1%) |
| 55 to 64 Years | 694 (98.0%) | 14 (2.0%) |
| 65 to 74 Years | 599 (92.4%) | 49 (7.6%) |
| 75 Years and older | 239 (100.0%) | 0 (0.0%) |
| Total | 5,091 (97.6%) | 127 (2.4%) |
Health Insurance Coverage by Citizenship Status in Coal City
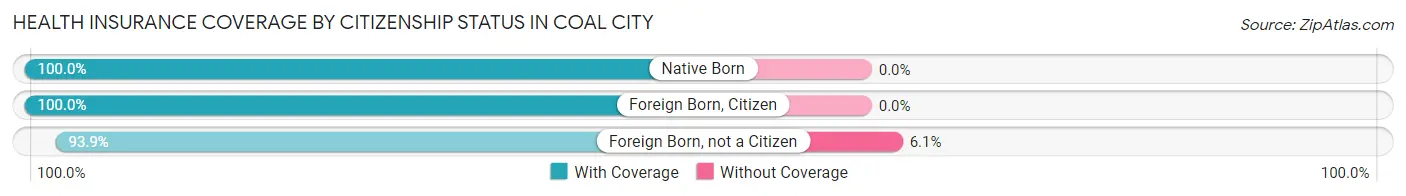
| Citizenship Status | With Coverage | Without Coverage |
| Native Born | 269 (100.0%) | 0 (0.0%) |
| Foreign Born, Citizen | 1,056 (100.0%) | 0 (0.0%) |
| Foreign Born, not a Citizen | 418 (93.9%) | 27 (6.1%) |
Health Insurance Coverage by Household Income in Coal City
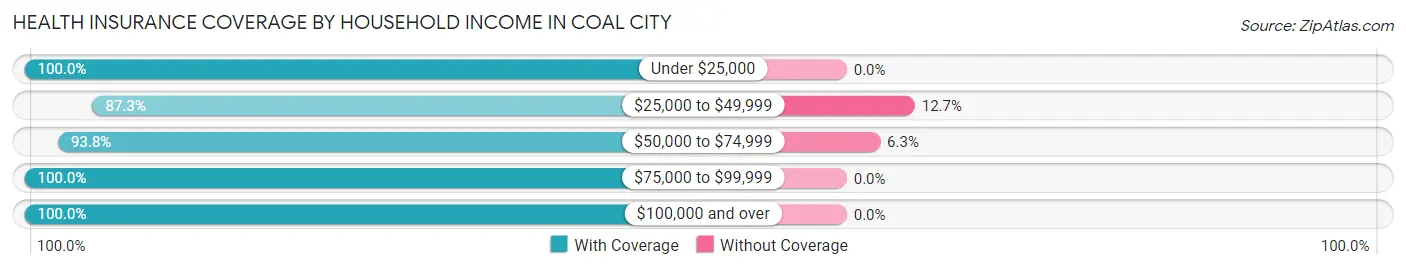
| Household Income | With Coverage | Without Coverage |
| Under $25,000 | 393 (100.0%) | 0 (0.0%) |
| $25,000 to $49,999 | 596 (87.3%) | 87 (12.7%) |
| $50,000 to $74,999 | 600 (93.8%) | 40 (6.2%) |
| $75,000 to $99,999 | 590 (100.0%) | 0 (0.0%) |
| $100,000 and over | 2,912 (100.0%) | 0 (0.0%) |
Public vs Private Health Insurance Coverage by Age in Coal City
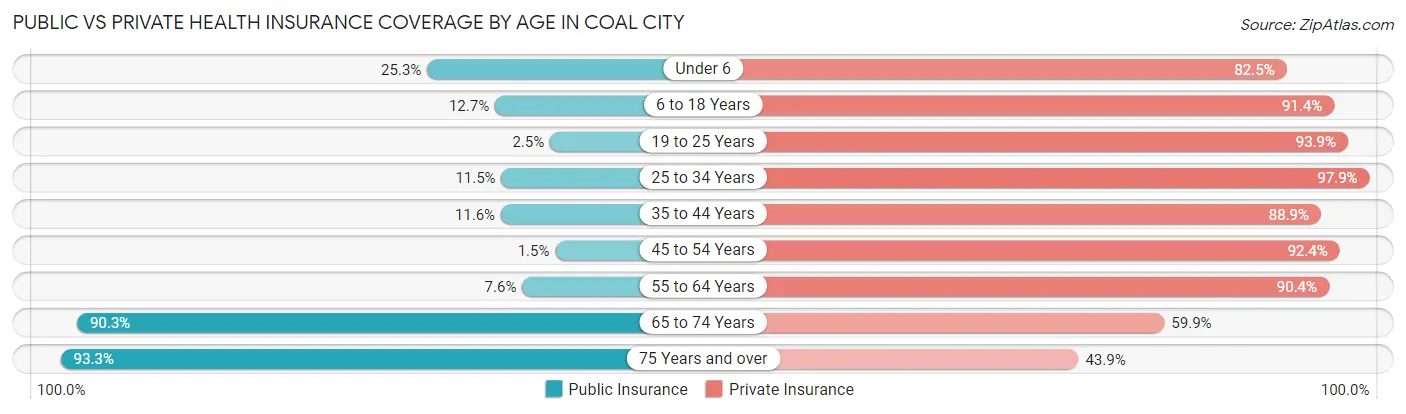
| Age Bracket | Public Insurance | Private Insurance |
| Under 6 | 68 (25.3%) | 222 (82.5%) |
| 6 to 18 Years | 134 (12.7%) | 965 (91.4%) |
| 19 to 25 Years | 11 (2.5%) | 418 (93.9%) |
| 25 to 34 Years | 50 (11.5%) | 426 (97.9%) |
| 35 to 44 Years | 94 (11.6%) | 722 (88.9%) |
| 45 to 54 Years | 9 (1.5%) | 560 (92.4%) |
| 55 to 64 Years | 54 (7.6%) | 640 (90.4%) |
| 65 to 74 Years | 585 (90.3%) | 388 (59.9%) |
| 75 Years and over | 223 (93.3%) | 105 (43.9%) |
| Total | 1,228 (23.5%) | 4,446 (85.2%) |
Disability Status by Sex by Age in Coal City
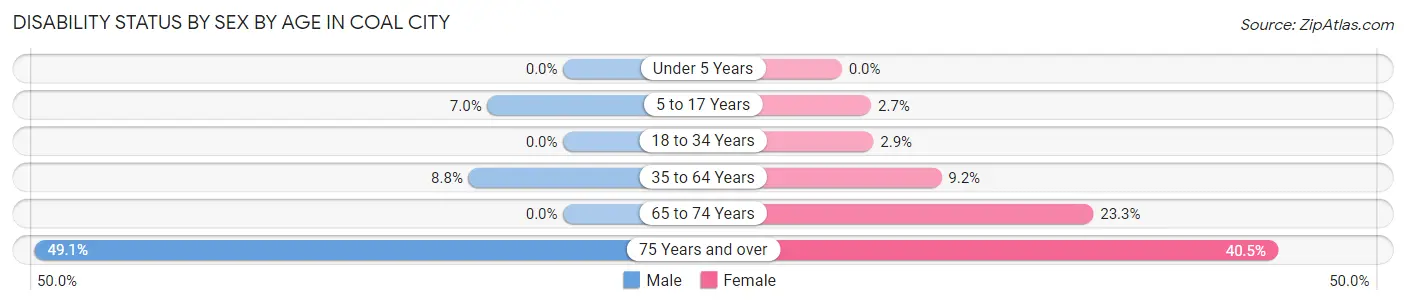
| Age Bracket | Male | Female |
| Under 5 Years | 0 (0.0%) | 0 (0.0%) |
| 5 to 17 Years | 42 (7.0%) | 12 (2.7%) |
| 18 to 34 Years | 0 (0.0%) | 13 (2.9%) |
| 35 to 64 Years | 86 (8.8%) | 106 (9.2%) |
| 65 to 74 Years | 0 (0.0%) | 67 (23.3%) |
| 75 Years and over | 53 (49.1%) | 53 (40.5%) |
Disability Class by Sex by Age in Coal City
Disability Class: Hearing Difficulty
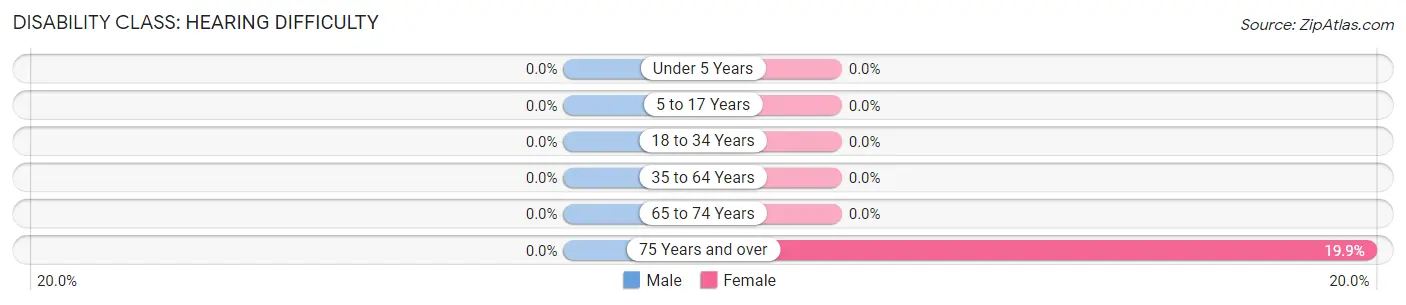
| Age Bracket | Male | Female |
| Under 5 Years | 0 (0.0%) | 0 (0.0%) |
| 5 to 17 Years | 0 (0.0%) | 0 (0.0%) |
| 18 to 34 Years | 0 (0.0%) | 0 (0.0%) |
| 35 to 64 Years | 0 (0.0%) | 0 (0.0%) |
| 65 to 74 Years | 0 (0.0%) | 0 (0.0%) |
| 75 Years and over | 0 (0.0%) | 26 (19.9%) |
Disability Class: Vision Difficulty
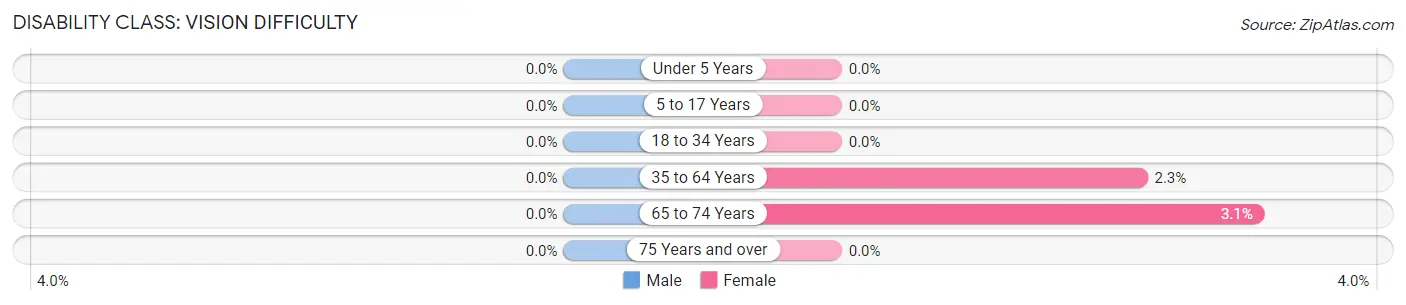
| Age Bracket | Male | Female |
| Under 5 Years | 0 (0.0%) | 0 (0.0%) |
| 5 to 17 Years | 0 (0.0%) | 0 (0.0%) |
| 18 to 34 Years | 0 (0.0%) | 0 (0.0%) |
| 35 to 64 Years | 0 (0.0%) | 26 (2.3%) |
| 65 to 74 Years | 0 (0.0%) | 9 (3.1%) |
| 75 Years and over | 0 (0.0%) | 0 (0.0%) |
Disability Class: Cognitive Difficulty
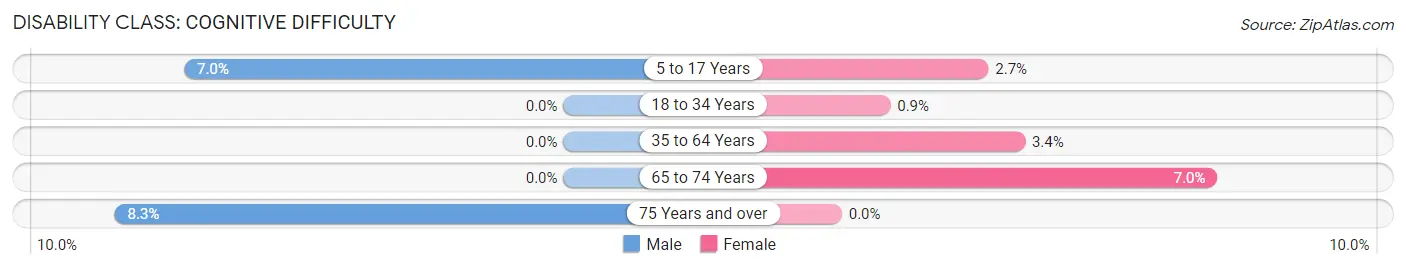
| Age Bracket | Male | Female |
| 5 to 17 Years | 42 (7.0%) | 12 (2.7%) |
| 18 to 34 Years | 0 (0.0%) | 4 (0.9%) |
| 35 to 64 Years | 0 (0.0%) | 39 (3.4%) |
| 65 to 74 Years | 0 (0.0%) | 20 (7.0%) |
| 75 Years and over | 9 (8.3%) | 0 (0.0%) |
Disability Class: Ambulatory Difficulty
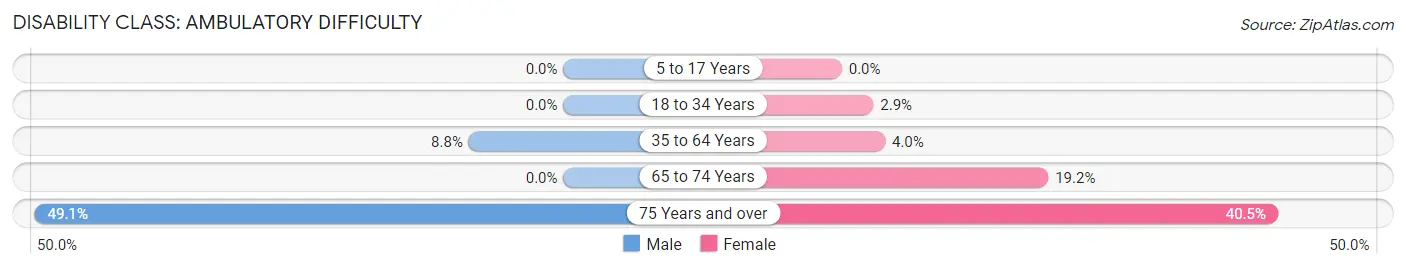
| Age Bracket | Male | Female |
| 5 to 17 Years | 0 (0.0%) | 0 (0.0%) |
| 18 to 34 Years | 0 (0.0%) | 13 (2.9%) |
| 35 to 64 Years | 86 (8.8%) | 46 (4.0%) |
| 65 to 74 Years | 0 (0.0%) | 55 (19.2%) |
| 75 Years and over | 53 (49.1%) | 53 (40.5%) |
Disability Class: Self-Care Difficulty
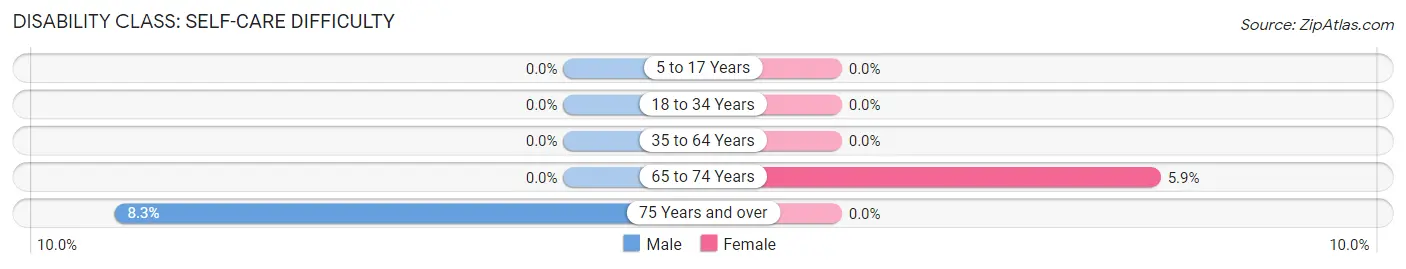
| Age Bracket | Male | Female |
| 5 to 17 Years | 0 (0.0%) | 0 (0.0%) |
| 18 to 34 Years | 0 (0.0%) | 0 (0.0%) |
| 35 to 64 Years | 0 (0.0%) | 0 (0.0%) |
| 65 to 74 Years | 0 (0.0%) | 17 (5.9%) |
| 75 Years and over | 9 (8.3%) | 0 (0.0%) |
Technology Access in Coal City
Computing Device Access in Coal City
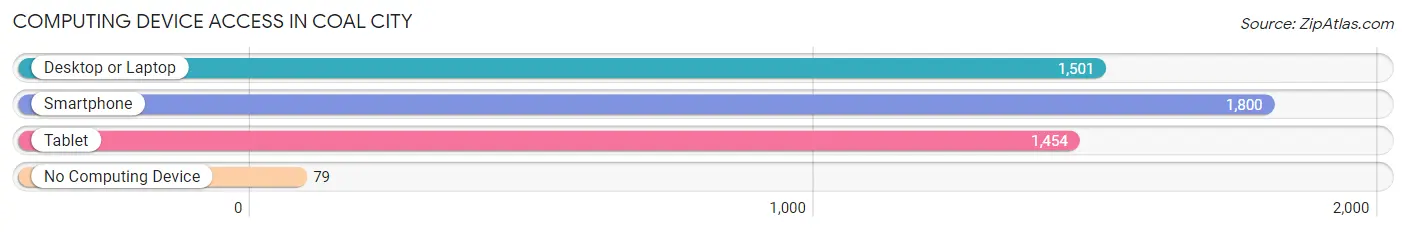
| Device Type | # Households | % Households |
| Desktop or Laptop | 1,501 | 75.2% |
| Smartphone | 1,800 | 90.2% |
| Tablet | 1,454 | 72.9% |
| No Computing Device | 79 | 4.0% |
| Total | 1,995 | 100.0% |
Internet Access in Coal City
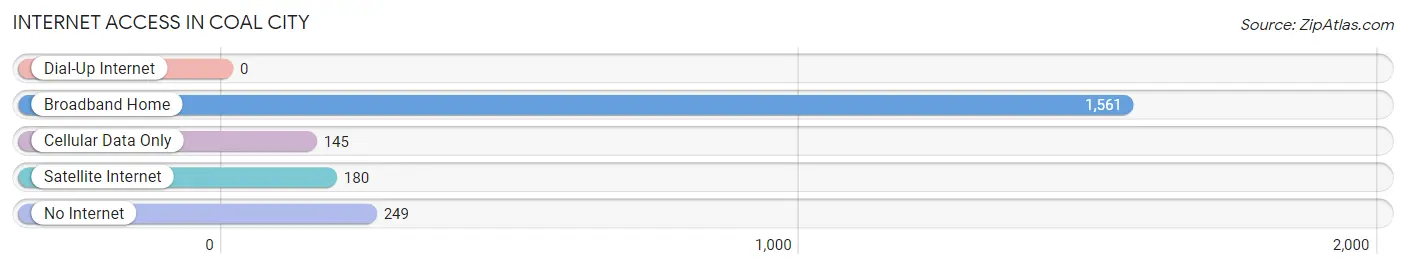
| Internet Type | # Households | % Households |
| Dial-Up Internet | 0 | 0.0% |
| Broadband Home | 1,561 | 78.2% |
| Cellular Data Only | 145 | 7.3% |
| Satellite Internet | 180 | 9.0% |
| No Internet | 249 | 12.5% |
| Total | 1,995 | 100.0% |
Coal City Summary
Coal City, Illinois is a small village located in Grundy County, Illinois. It is situated about 60 miles southwest of Chicago and is part of the Chicago metropolitan area. The village has a population of 5,587 as of the 2010 census.
History
Coal City was founded in 1854 by a group of miners who were looking for coal deposits in the area. The miners found coal in the area and the village was named after the coal deposits. The village was incorporated in 1868 and the first mayor was elected in 1869.
The village grew rapidly in the late 19th century and early 20th century due to the coal mining industry. The coal industry provided jobs for many of the residents and the village became a major coal mining center. The coal industry declined in the mid-20th century and the village began to decline as well.
Geography
Coal City is located in Grundy County, Illinois. It is situated about 60 miles southwest of Chicago and is part of the Chicago metropolitan area. The village has a total area of 2.2 square miles, all of which is land. The village is located in the Kankakee River Valley and is surrounded by rolling hills and farmland.
Economy
The economy of Coal City is largely based on agriculture and manufacturing. The village is home to several manufacturing companies, including a steel mill, a paper mill, and a plastics factory. The village also has several small businesses, including restaurants, retail stores, and service providers.
The village is also home to a number of tourist attractions, including the Coal City Historical Museum, the Coal City Public Library, and the Coal City Park District. The village also hosts several annual events, including the Coal City Festival and the Coal City Car Show.
Demographics
As of the 2010 census, the population of Coal City was 5,587. The racial makeup of the village was 97.3% White, 0.7% African American, 0.2% Native American, 0.3% Asian, 0.1% Pacific Islander, 0.7% from other races, and 0.9% from two or more races. Hispanic or Latino of any race were 2.2% of the population.
The median income for a household in the village was $50,972 and the median income for a family was $60,972. The per capita income for the village was $22,972. About 5.2% of families and 6.7% of the population were below the poverty line, including 8.3% of those under age 18 and 4.2% of those age 65 or over.
Conclusion
Coal City, Illinois is a small village located in Grundy County, Illinois. It is situated about 60 miles southwest of Chicago and is part of the Chicago metropolitan area. The village has a population of 5,587 as of the 2010 census. The economy of Coal City is largely based on agriculture and manufacturing. The village is home to several manufacturing companies, including a steel mill, a paper mill, and a plastics factory. The racial makeup of the village was 97.3% White, 0.7% African American, 0.2% Native American, 0.3% Asian, 0.1% Pacific Islander, 0.7% from other races, and 0.9% from two or more races. The median income for a household in the village was $50,972 and the median income for a family was $60,972. The village is also home to a number of tourist attractions, including the Coal City Historical Museum, the Coal City Public Library, and the Coal City Park District.
Common Questions
What is Per Capita Income in Coal City?
Per Capita income in Coal City is $42,317.
What is the Median Family Income in Coal City?
Median Family Income in Coal City is $95,147.
What is the Median Household income in Coal City?
Median Household Income in Coal City is $77,939.
What is Income or Wage Gap in Coal City?
Income or Wage Gap in Coal City is 41.3%.
Women in Coal City earn 58.7 cents for every dollar earned by a man.
What is Inequality or Gini Index in Coal City?
Inequality or Gini Index in Coal City is 0.41.
What is the Total Population of Coal City?
Total Population of Coal City is 5,218.
What is the Total Male Population of Coal City?
Total Male Population of Coal City is 2,633.
What is the Total Female Population of Coal City?
Total Female Population of Coal City is 2,585.
What is the Ratio of Males per 100 Females in Coal City?
There are 101.86 Males per 100 Females in Coal City.
What is the Ratio of Females per 100 Males in Coal City?
There are 98.18 Females per 100 Males in Coal City.
What is the Median Population Age in Coal City?
Median Population Age in Coal City is 40.5 Years.
What is the Average Family Size in Coal City
Average Family Size in Coal City is 3.0 People.
What is the Average Household Size in Coal City
Average Household Size in Coal City is 2.6 People.
How Large is the Labor Force in Coal City?
There are 2,644 People in the Labor Forcein in Coal City.
What is the Percentage of People in the Labor Force in Coal City?
63.5% of People are in the Labor Force in Coal City.
What is the Unemployment Rate in Coal City?
Unemployment Rate in Coal City is 3.9%.