Holiday Shores, IL Map & Demographics
Holiday Shores Map
Holiday Shores Overview
$42,770
PER CAPITA INCOME
$126,691
AVG FAMILY INCOME
$97,366
AVG HOUSEHOLD INCOME
31.2%
WAGE / INCOME GAP [ % ]
68.8¢/ $1
WAGE / INCOME GAP [ $ ]
0.34
INEQUALITY / GINI INDEX
3,285
TOTAL POPULATION
1,771
MALE POPULATION
1,514
FEMALE POPULATION
116.97
MALES / 100 FEMALES
85.49
FEMALES / 100 MALES
42.7
MEDIAN AGE
3.2
AVG FAMILY SIZE
2.9
AVG HOUSEHOLD SIZE
2,001
LABOR FORCE [ PEOPLE ]
75.7%
PERCENT IN LABOR FORCE
7.3%
UNEMPLOYMENT RATE
Income in Holiday Shores
Income Overview in Holiday Shores
Per Capita Income in Holiday Shores is $42,770, while median incomes of families and households are $126,691 and $97,366 respectively.
| Characteristic | Number | Measure |
| Per Capita Income | 3,285 | $42,770 |
| Median Family Income | 899 | $126,691 |
| Mean Family Income | 899 | $136,238 |
| Median Household Income | 1,120 | $97,366 |
| Mean Household Income | 1,120 | $119,743 |
| Income Deficit | 899 | $0 |
| Wage / Income Gap (%) | 3,285 | 31.16% |
| Wage / Income Gap ($) | 3,285 | 68.84¢ per $1 |
| Gini / Inequality Index | 3,285 | 0.34 |
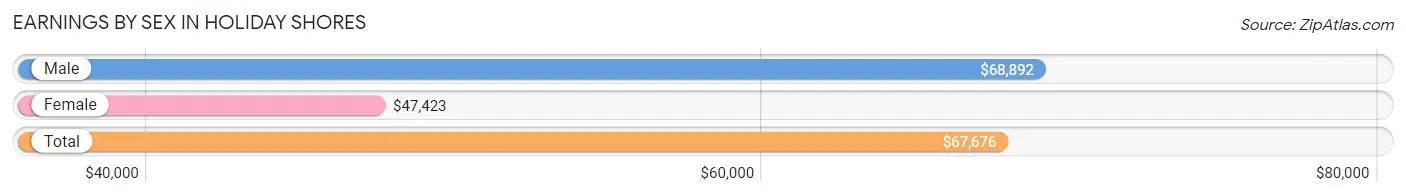
Earnings by Sex in Holiday Shores
Average Earnings in Holiday Shores are $67,676, $68,892 for men and $47,423 for women, a difference of 31.2%.
| Sex | Number | Average Earnings |
| Male | 1,242 (61.4%) | $68,892 |
| Female | 780 (38.6%) | $47,423 |
| Total | 2,022 (100.0%) | $67,676 |
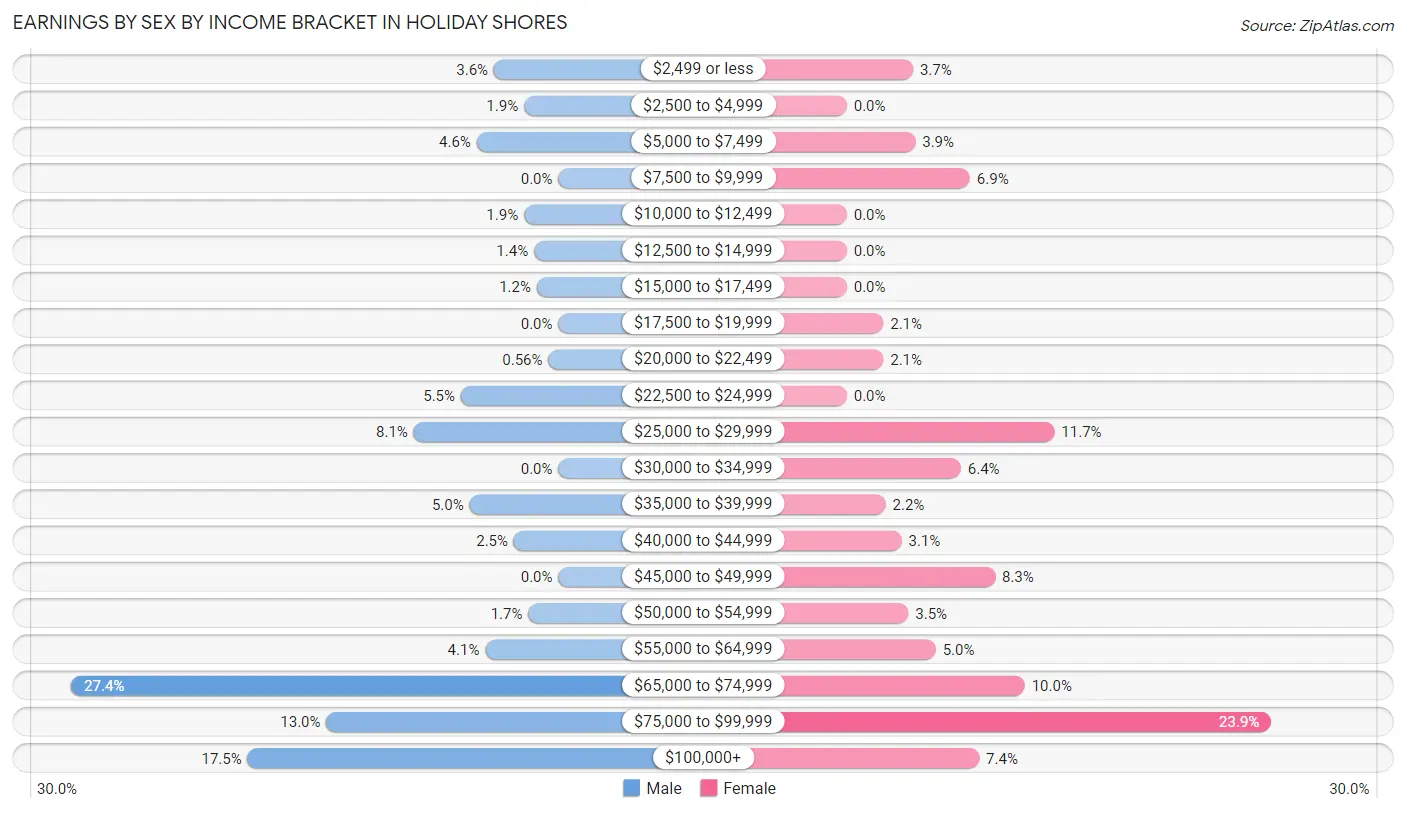
Earnings by Sex by Income Bracket in Holiday Shores
The most common earnings brackets in Holiday Shores are $65,000 to $74,999 for men (340 | 27.4%) and $75,000 to $99,999 for women (186 | 23.8%).
| Income | Male | Female |
| $2,499 or less | 45 (3.6%) | 29 (3.7%) |
| $2,500 to $4,999 | 24 (1.9%) | 0 (0.0%) |
| $5,000 to $7,499 | 57 (4.6%) | 30 (3.8%) |
| $7,500 to $9,999 | 0 (0.0%) | 54 (6.9%) |
| $10,000 to $12,499 | 24 (1.9%) | 0 (0.0%) |
| $12,500 to $14,999 | 17 (1.4%) | 0 (0.0%) |
| $15,000 to $17,499 | 15 (1.2%) | 0 (0.0%) |
| $17,500 to $19,999 | 0 (0.0%) | 16 (2.1%) |
| $20,000 to $22,499 | 7 (0.6%) | 16 (2.1%) |
| $22,500 to $24,999 | 68 (5.5%) | 0 (0.0%) |
| $25,000 to $29,999 | 101 (8.1%) | 91 (11.7%) |
| $30,000 to $34,999 | 0 (0.0%) | 50 (6.4%) |
| $35,000 to $39,999 | 62 (5.0%) | 17 (2.2%) |
| $40,000 to $44,999 | 31 (2.5%) | 24 (3.1%) |
| $45,000 to $49,999 | 0 (0.0%) | 65 (8.3%) |
| $50,000 to $54,999 | 21 (1.7%) | 27 (3.5%) |
| $55,000 to $64,999 | 51 (4.1%) | 39 (5.0%) |
| $65,000 to $74,999 | 340 (27.4%) | 78 (10.0%) |
| $75,000 to $99,999 | 162 (13.0%) | 186 (23.8%) |
| $100,000+ | 217 (17.5%) | 58 (7.4%) |
| Total | 1,242 (100.0%) | 780 (100.0%) |
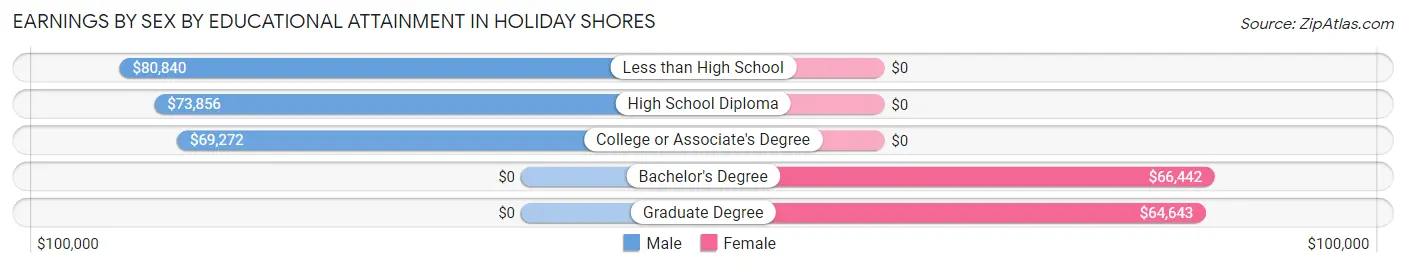
Earnings by Sex by Educational Attainment in Holiday Shores
Average earnings in Holiday Shores are $72,569 for men and $59,650 for women, a difference of 17.8%. Men with an educational attainment of less than high school enjoy the highest average annual earnings of $80,840, while those with college or associate's degree education earn the least with $69,272. Women with an educational attainment of bachelor's degree earn the most with the average annual earnings of $66,442, while those with graduate degree education have the smallest earnings of $64,643.
| Educational Attainment | Male Income | Female Income |
| Less than High School | $80,840 | $0 |
| High School Diploma | $73,856 | $0 |
| College or Associate's Degree | $69,272 | $0 |
| Bachelor's Degree | - | - |
| Graduate Degree | - | - |
| Total | $72,569 | $59,650 |
Family Income in Holiday Shores
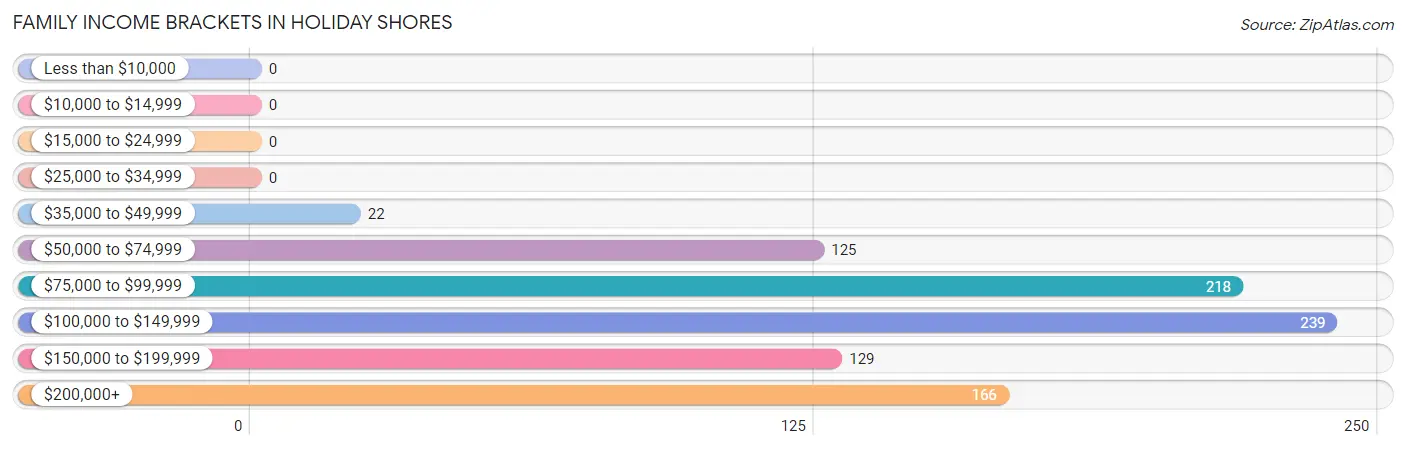
Family Income Brackets in Holiday Shores
According to the Holiday Shores family income data, there are 239 families falling into the $100,000 to $149,999 income range, which is the most common income bracket and makes up 26.6% of all families.
| Income Bracket | # Families | % Families |
| Less than $10,000 | 0 | 0.0% |
| $10,000 to $14,999 | 0 | 0.0% |
| $15,000 to $24,999 | 0 | 0.0% |
| $25,000 to $34,999 | 0 | 0.0% |
| $35,000 to $49,999 | 22 | 2.4% |
| $50,000 to $74,999 | 125 | 13.9% |
| $75,000 to $99,999 | 218 | 24.2% |
| $100,000 to $149,999 | 239 | 26.6% |
| $150,000 to $199,999 | 129 | 14.3% |
| $200,000+ | 166 | 18.5% |
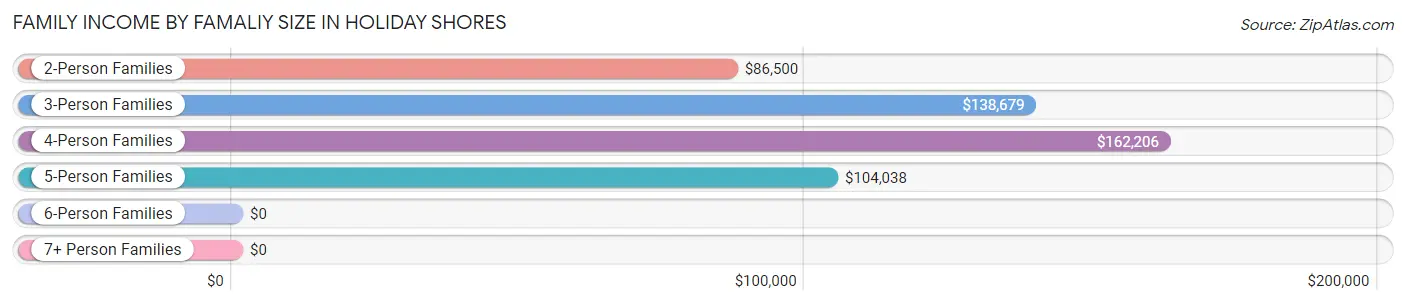
Family Income by Famaliy Size in Holiday Shores
4-person families (220 | 24.5%) account for the highest median family income in Holiday Shores with $162,206 per family, while 3-person families (174 | 19.4%) have the highest median income of $46,226 per family member.
| Income Bracket | # Families | Median Income |
| 2-Person Families | 398 (44.3%) | $86,500 |
| 3-Person Families | 174 (19.4%) | $138,679 |
| 4-Person Families | 220 (24.5%) | $162,206 |
| 5-Person Families | 60 (6.7%) | $104,038 |
| 6-Person Families | 0 (0.0%) | $0 |
| 7+ Person Families | 47 (5.2%) | $0 |
| Total | 899 (100.0%) | $126,691 |
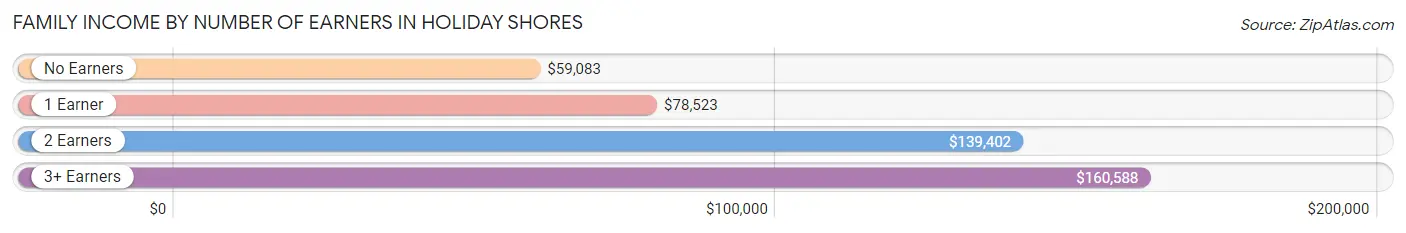
Family Income by Number of Earners in Holiday Shores
The median family income in Holiday Shores is $126,691, with families comprising 3+ earners (258) having the highest median family income of $160,588, while families with no earners (82) have the lowest median family income of $59,083, accounting for 28.7% and 9.1% of families, respectively.
| Number of Earners | # Families | Median Income |
| No Earners | 82 (9.1%) | $59,083 |
| 1 Earner | 214 (23.8%) | $78,523 |
| 2 Earners | 345 (38.4%) | $139,402 |
| 3+ Earners | 258 (28.7%) | $160,588 |
| Total | 899 (100.0%) | $126,691 |
Household Income in Holiday Shores
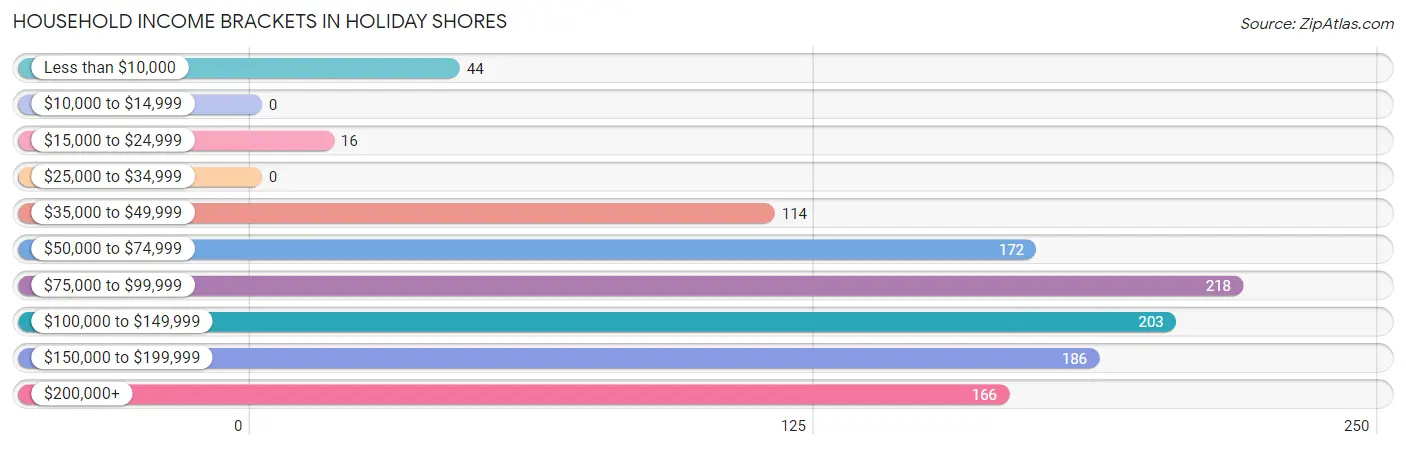
Household Income Brackets in Holiday Shores
With 218 households falling in the category, the $75,000 to $99,999 income range is the most frequent in Holiday Shores, accounting for 19.5% of all households.
| Income Bracket | # Households | % Households |
| Less than $10,000 | 44 | 3.9% |
| $10,000 to $14,999 | 0 | 0.0% |
| $15,000 to $24,999 | 16 | 1.4% |
| $25,000 to $34,999 | 0 | 0.0% |
| $35,000 to $49,999 | 114 | 10.2% |
| $50,000 to $74,999 | 172 | 15.4% |
| $75,000 to $99,999 | 218 | 19.5% |
| $100,000 to $149,999 | 203 | 18.1% |
| $150,000 to $199,999 | 186 | 16.6% |
| $200,000+ | 166 | 14.8% |
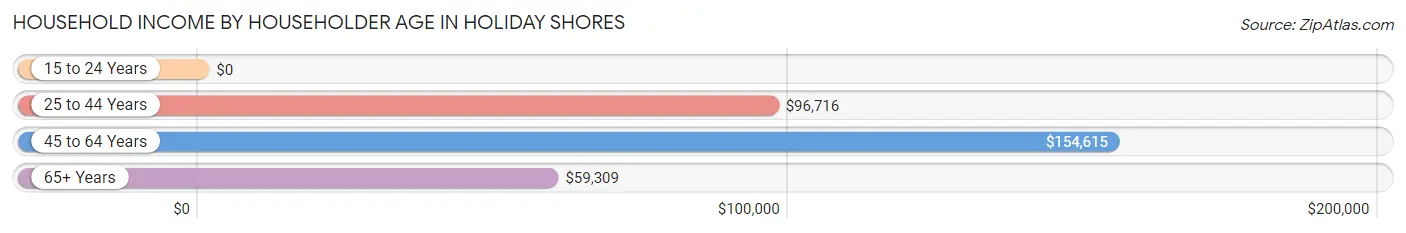
Household Income by Householder Age in Holiday Shores
The median household income in Holiday Shores is $97,366, with the highest median household income of $154,615 found in the 45 to 64 years age bracket for the primary householder. A total of 536 households (47.9%) fall into this category. Meanwhile, the 15 to 24 years age bracket for the primary householder has the lowest median household income of $0, with 15 households (1.3%) in this group.
| Income Bracket | # Households | Median Income |
| 15 to 24 Years | 15 (1.3%) | $0 |
| 25 to 44 Years | 248 (22.1%) | $96,716 |
| 45 to 64 Years | 536 (47.9%) | $154,615 |
| 65+ Years | 321 (28.7%) | $59,309 |
| Total | 1,120 (100.0%) | $97,366 |
Poverty in Holiday Shores
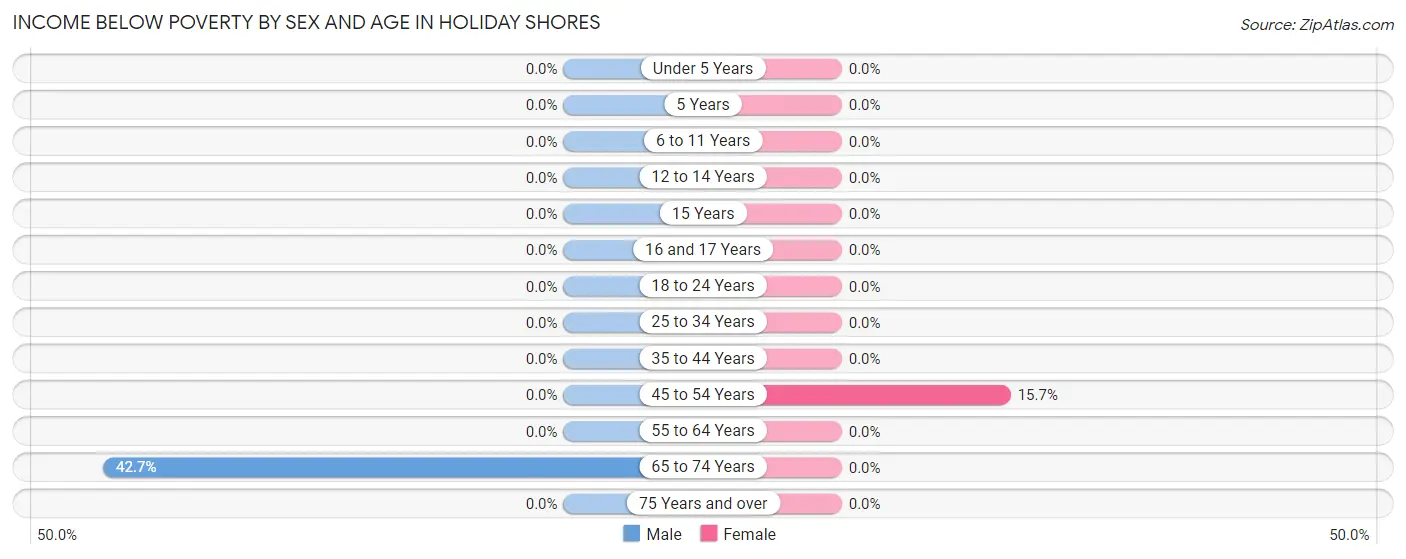
Income Below Poverty by Sex and Age in Holiday Shores
With 2.5% poverty level for males and 3.8% for females among the residents of Holiday Shores, 65 to 74 year old males and 45 to 54 year old females are the most vulnerable to poverty, with 44 males (42.7%) and 58 females (15.7%) in their respective age groups living below the poverty level.
| Age Bracket | Male | Female |
| Under 5 Years | 0 (0.0%) | 0 (0.0%) |
| 5 Years | 0 (0.0%) | 0 (0.0%) |
| 6 to 11 Years | 0 (0.0%) | 0 (0.0%) |
| 12 to 14 Years | 0 (0.0%) | 0 (0.0%) |
| 15 Years | 0 (0.0%) | 0 (0.0%) |
| 16 and 17 Years | 0 (0.0%) | 0 (0.0%) |
| 18 to 24 Years | 0 (0.0%) | 0 (0.0%) |
| 25 to 34 Years | 0 (0.0%) | 0 (0.0%) |
| 35 to 44 Years | 0 (0.0%) | 0 (0.0%) |
| 45 to 54 Years | 0 (0.0%) | 58 (15.7%) |
| 55 to 64 Years | 0 (0.0%) | 0 (0.0%) |
| 65 to 74 Years | 44 (42.7%) | 0 (0.0%) |
| 75 Years and over | 0 (0.0%) | 0 (0.0%) |
| Total | 44 (2.5%) | 58 (3.8%) |
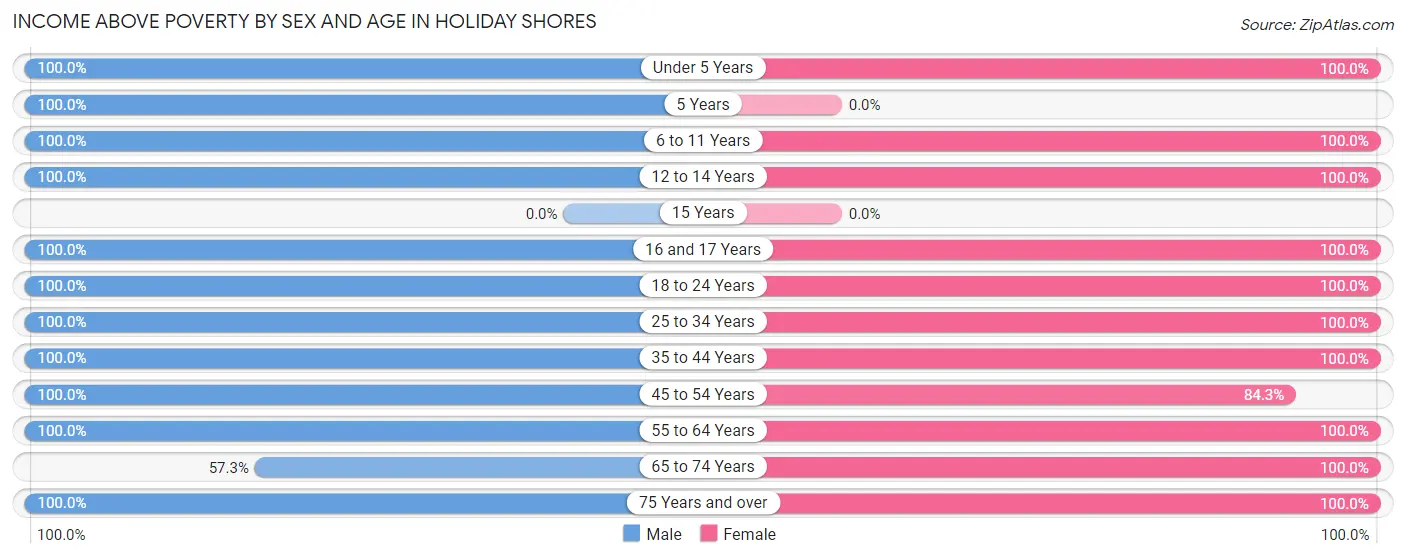
Income Above Poverty by Sex and Age in Holiday Shores
According to the poverty statistics in Holiday Shores, males aged under 5 years and females aged under 5 years are the age groups that are most secure financially, with 100.0% of males and 100.0% of females in these age groups living above the poverty line.
| Age Bracket | Male | Female |
| Under 5 Years | 104 (100.0%) | 59 (100.0%) |
| 5 Years | 25 (100.0%) | 0 (0.0%) |
| 6 to 11 Years | 165 (100.0%) | 88 (100.0%) |
| 12 to 14 Years | 50 (100.0%) | 151 (100.0%) |
| 15 Years | 0 (0.0%) | 0 (0.0%) |
| 16 and 17 Years | 94 (100.0%) | 39 (100.0%) |
| 18 to 24 Years | 114 (100.0%) | 80 (100.0%) |
| 25 to 34 Years | 117 (100.0%) | 171 (100.0%) |
| 35 to 44 Years | 291 (100.0%) | 157 (100.0%) |
| 45 to 54 Years | 171 (100.0%) | 312 (84.3%) |
| 55 to 64 Years | 494 (100.0%) | 137 (100.0%) |
| 65 to 74 Years | 59 (57.3%) | 66 (100.0%) |
| 75 Years and over | 43 (100.0%) | 196 (100.0%) |
| Total | 1,727 (97.5%) | 1,456 (96.2%) |
Income Below Poverty Among Married-Couple Families in Holiday Shores
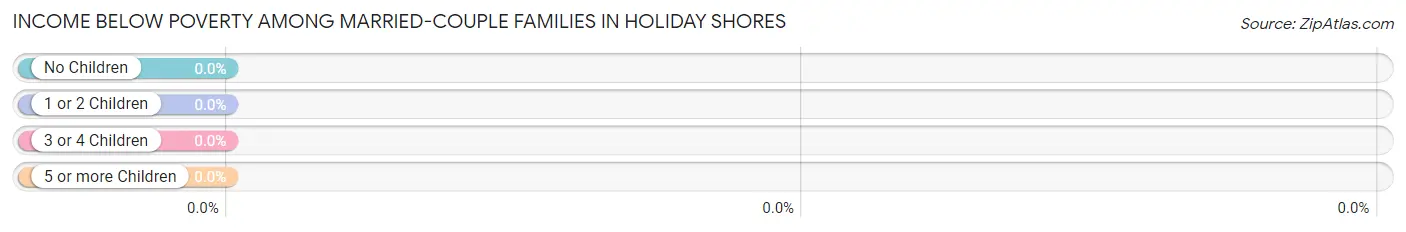
| Children | Above Poverty | Below Poverty |
| No Children | 366 (100.0%) | 0 (0.0%) |
| 1 or 2 Children | 218 (100.0%) | 0 (0.0%) |
| 3 or 4 Children | 60 (100.0%) | 0 (0.0%) |
| 5 or more Children | 0 (0.0%) | 0 (0.0%) |
| Total | 644 (100.0%) | 0 (0.0%) |
Income Below Poverty Among Single-Parent Households in Holiday Shores
| Children | Single Father | Single Mother |
| No Children | 0 (0.0%) | 0 (0.0%) |
| 1 or 2 Children | 0 (0.0%) | 0 (0.0%) |
| 3 or 4 Children | 0 (0.0%) | 0 (0.0%) |
| 5 or more Children | 0 (0.0%) | 0 (0.0%) |
| Total | 0 (0.0%) | 0 (0.0%) |
Income Below Poverty Among Married-Couple vs Single-Parent Households in Holiday Shores
| Children | Married-Couple Families | Single-Parent Households |
| No Children | 0 (0.0%) | 0 (0.0%) |
| 1 or 2 Children | 0 (0.0%) | 0 (0.0%) |
| 3 or 4 Children | 0 (0.0%) | 0 (0.0%) |
| 5 or more Children | 0 (0.0%) | 0 (0.0%) |
| Total | 0 (0.0%) | 0 (0.0%) |
Race in Holiday Shores
The most populous races in Holiday Shores are White / Caucasian (3,121 | 95.0%), Hispanic or Latino (202 | 6.1%), and Two or more Races (124 | 3.8%).
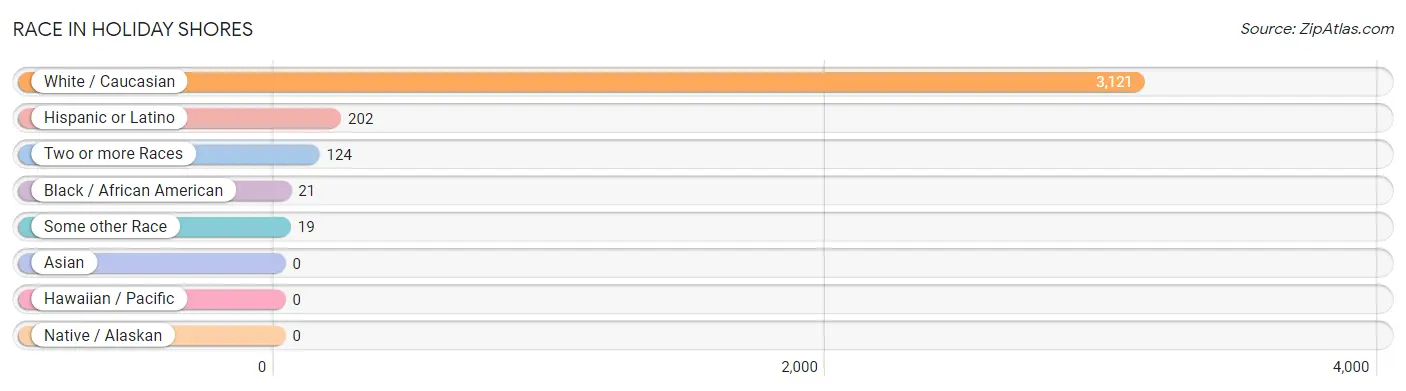
| Race | # Population | % Population |
| Asian | 0 | 0.0% |
| Black / African American | 21 | 0.6% |
| Hawaiian / Pacific | 0 | 0.0% |
| Hispanic or Latino | 202 | 6.1% |
| Native / Alaskan | 0 | 0.0% |
| White / Caucasian | 3,121 | 95.0% |
| Two or more Races | 124 | 3.8% |
| Some other Race | 19 | 0.6% |
| Total | 3,285 | 100.0% |
Ancestry in Holiday Shores
The most populous ancestries reported in Holiday Shores are German (1,070 | 32.6%), English (479 | 14.6%), American (358 | 10.9%), Italian (341 | 10.4%), and Irish (240 | 7.3%), together accounting for 75.7% of all Holiday Shores residents.
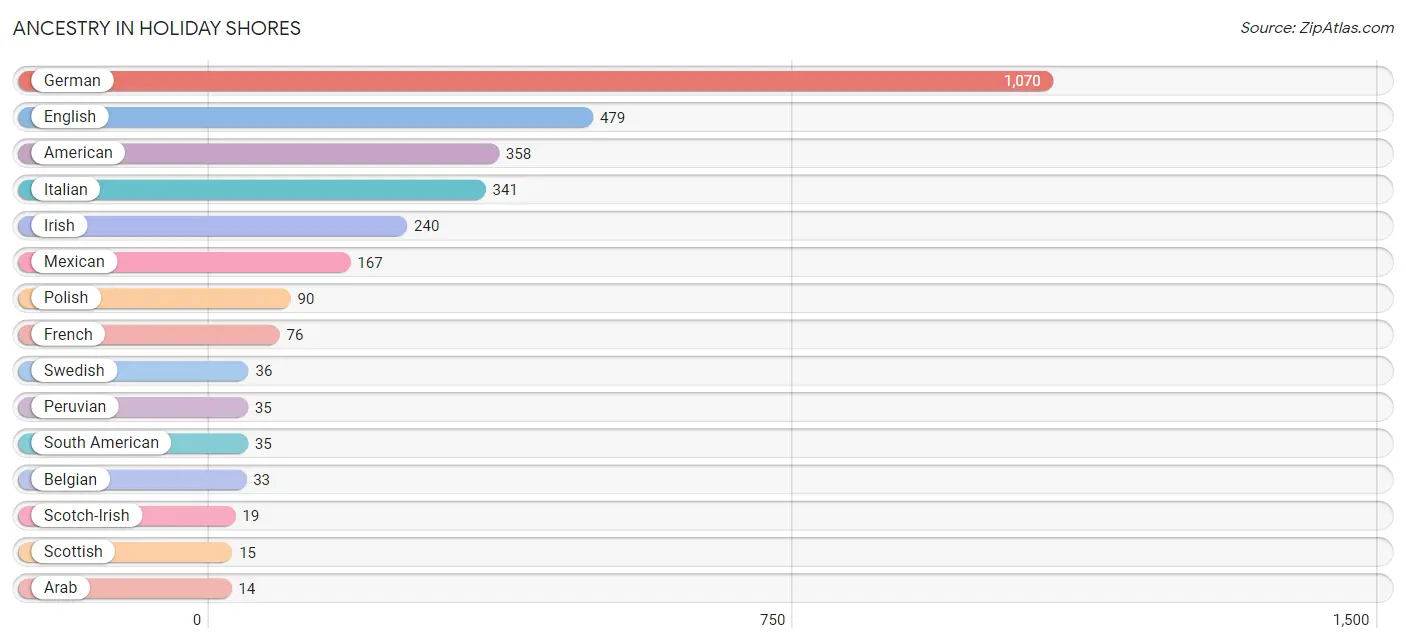
| Ancestry | # Population | % Population |
| American | 358 | 10.9% |
| Arab | 14 | 0.4% |
| Austrian | 11 | 0.3% |
| Belgian | 33 | 1.0% |
| Danish | 13 | 0.4% |
| English | 479 | 14.6% |
| French | 76 | 2.3% |
| German | 1,070 | 32.6% |
| Irish | 240 | 7.3% |
| Italian | 341 | 10.4% |
| Lebanese | 14 | 0.4% |
| Mexican | 167 | 5.1% |
| Peruvian | 35 | 1.1% |
| Polish | 90 | 2.7% |
| Scandinavian | 9 | 0.3% |
| Scotch-Irish | 19 | 0.6% |
| Scottish | 15 | 0.5% |
| South American | 35 | 1.1% |
| Swedish | 36 | 1.1% | View All 19 Rows |
Immigrants in Holiday Shores
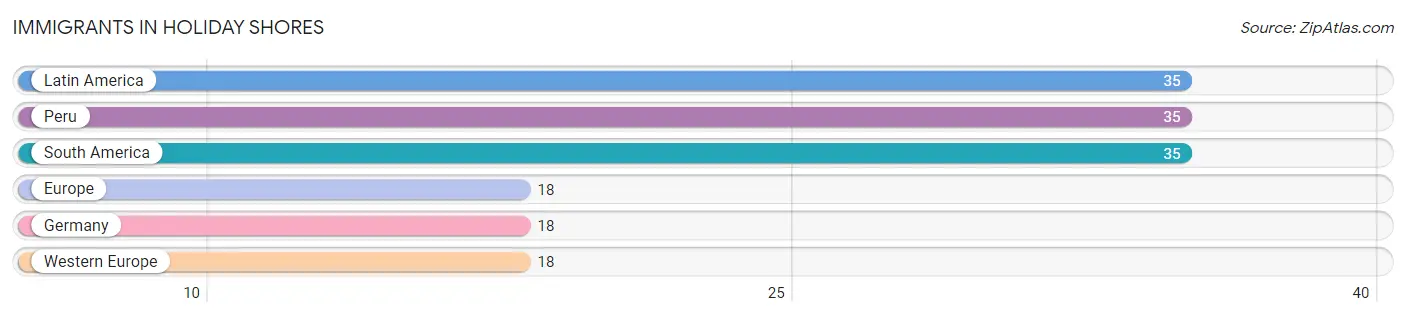
The most numerous immigrant groups reported in Holiday Shores came from Latin America (35 | 1.1%), Peru (35 | 1.1%), South America (35 | 1.1%), Europe (18 | 0.5%), and Germany (18 | 0.5%), together accounting for 4.3% of all Holiday Shores residents.
| Immigration Origin | # Population | % Population |
| Europe | 18 | 0.5% |
| Germany | 18 | 0.5% |
| Latin America | 35 | 1.1% |
| Peru | 35 | 1.1% |
| South America | 35 | 1.1% |
| Western Europe | 18 | 0.5% | View All 6 Rows |
Sex and Age in Holiday Shores
Sex and Age in Holiday Shores
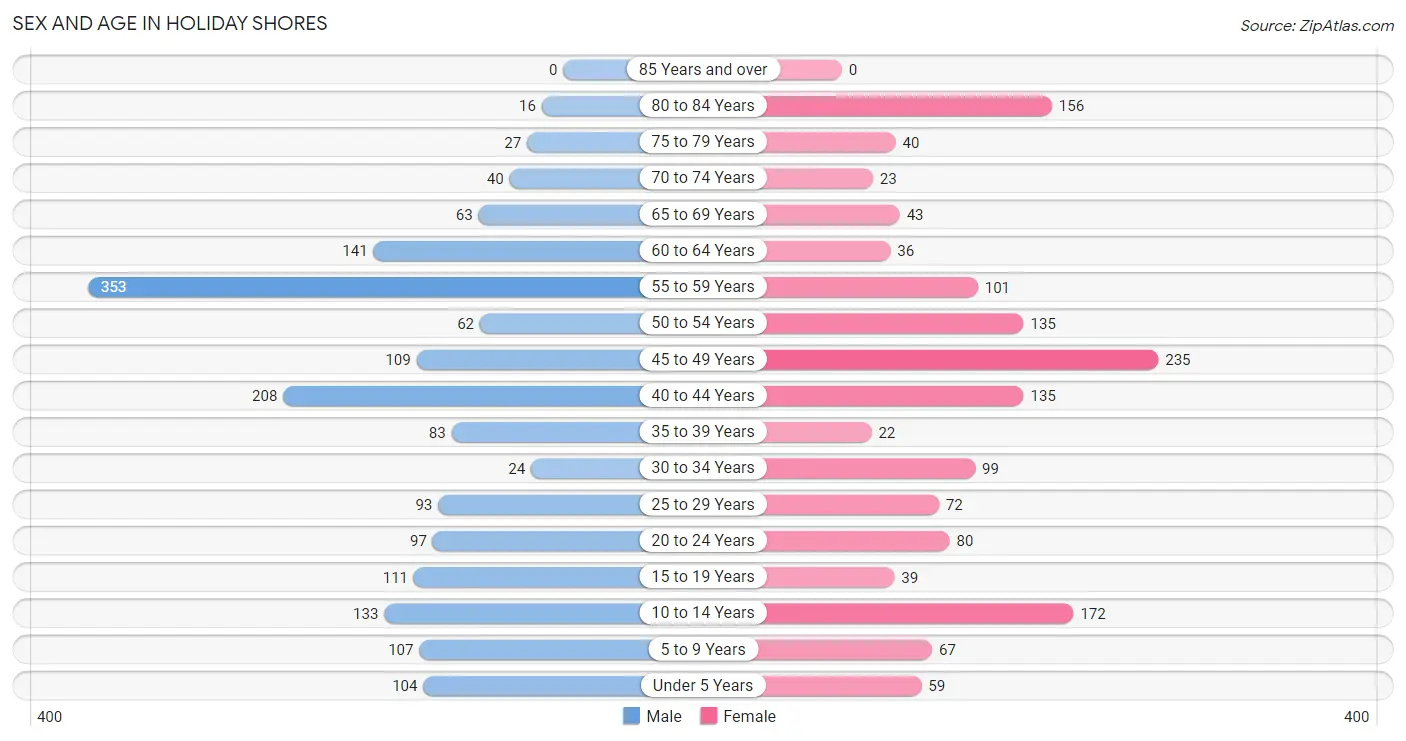
The most populous age groups in Holiday Shores are 55 to 59 Years (353 | 19.9%) for men and 45 to 49 Years (235 | 15.5%) for women.
| Age Bracket | Male | Female |
| Under 5 Years | 104 (5.9%) | 59 (3.9%) |
| 5 to 9 Years | 107 (6.0%) | 67 (4.4%) |
| 10 to 14 Years | 133 (7.5%) | 172 (11.4%) |
| 15 to 19 Years | 111 (6.3%) | 39 (2.6%) |
| 20 to 24 Years | 97 (5.5%) | 80 (5.3%) |
| 25 to 29 Years | 93 (5.2%) | 72 (4.8%) |
| 30 to 34 Years | 24 (1.4%) | 99 (6.5%) |
| 35 to 39 Years | 83 (4.7%) | 22 (1.5%) |
| 40 to 44 Years | 208 (11.7%) | 135 (8.9%) |
| 45 to 49 Years | 109 (6.1%) | 235 (15.5%) |
| 50 to 54 Years | 62 (3.5%) | 135 (8.9%) |
| 55 to 59 Years | 353 (19.9%) | 101 (6.7%) |
| 60 to 64 Years | 141 (8.0%) | 36 (2.4%) |
| 65 to 69 Years | 63 (3.6%) | 43 (2.8%) |
| 70 to 74 Years | 40 (2.3%) | 23 (1.5%) |
| 75 to 79 Years | 27 (1.5%) | 40 (2.6%) |
| 80 to 84 Years | 16 (0.9%) | 156 (10.3%) |
| 85 Years and over | 0 (0.0%) | 0 (0.0%) |
| Total | 1,771 (100.0%) | 1,514 (100.0%) |
Families and Households in Holiday Shores
Median Family Size in Holiday Shores
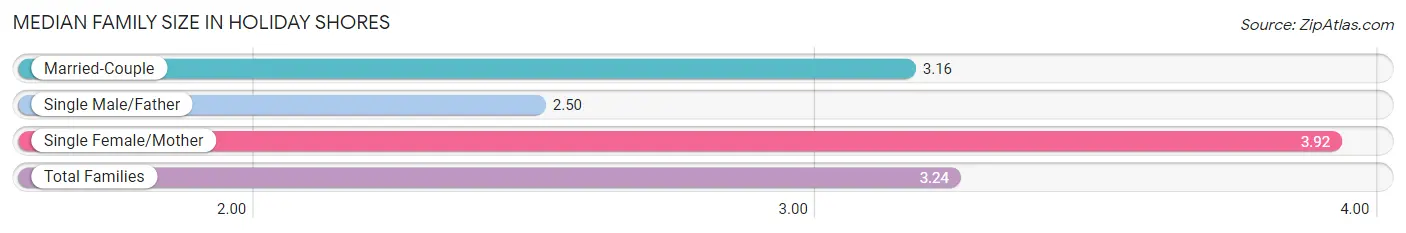
The median family size in Holiday Shores is 3.24 persons per family, with single female/mother families (169 | 18.8%) accounting for the largest median family size of 3.92 persons per family. On the other hand, single male/father families (86 | 9.6%) represent the smallest median family size with 2.50 persons per family.
| Family Type | # Families | Family Size |
| Married-Couple | 644 (71.6%) | 3.16 |
| Single Male/Father | 86 (9.6%) | 2.50 |
| Single Female/Mother | 169 (18.8%) | 3.92 |
| Total Families | 899 (100.0%) | 3.24 |
Median Household Size in Holiday Shores
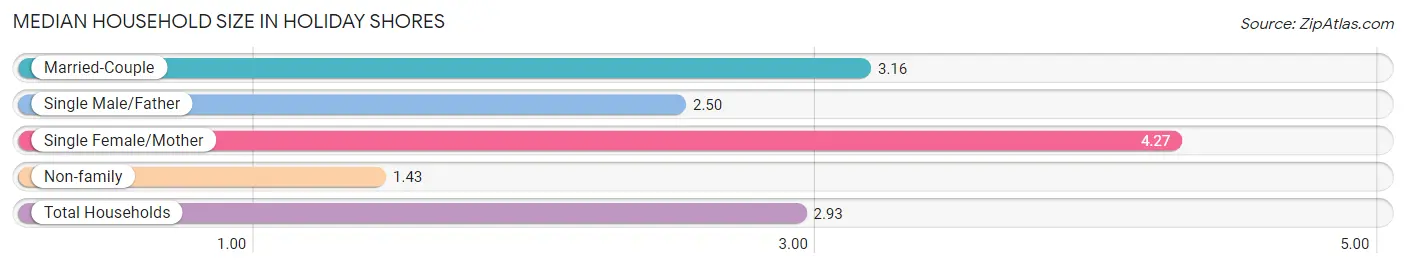
The median household size in Holiday Shores is 2.93 persons per household, with single female/mother households (169 | 15.1%) accounting for the largest median household size of 4.27 persons per household. non-family households (221 | 19.7%) represent the smallest median household size with 1.43 persons per household.
| Household Type | # Households | Household Size |
| Married-Couple | 644 (57.5%) | 3.16 |
| Single Male/Father | 86 (7.7%) | 2.50 |
| Single Female/Mother | 169 (15.1%) | 4.27 |
| Non-family | 221 (19.7%) | 1.43 |
| Total Households | 1,120 (100.0%) | 2.93 |
Household Size by Marriage Status in Holiday Shores
Out of a total of 1,120 households in Holiday Shores, 899 (80.3%) are family households, while 221 (19.7%) are nonfamily households. The most numerous type of family households are 2-person households, comprising 398, and the most common type of nonfamily households are 1-person households, comprising 137.
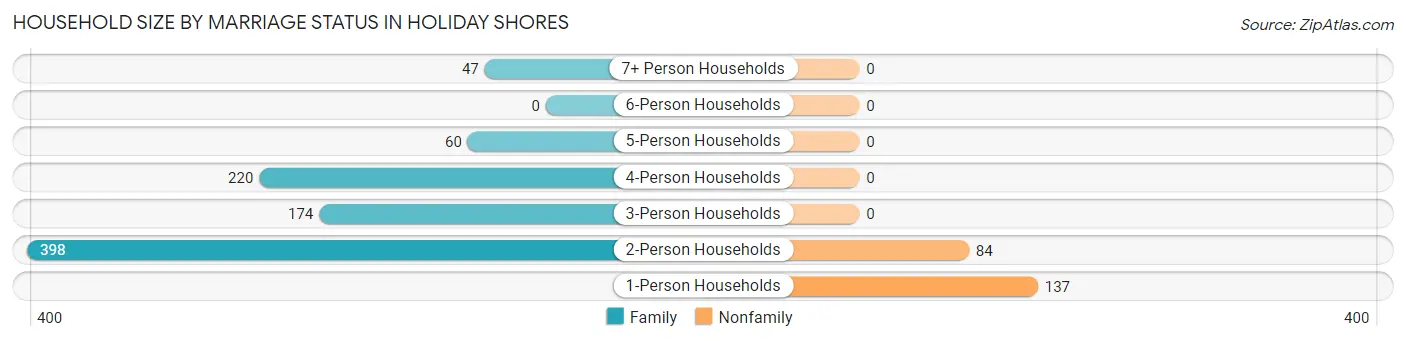
| Household Size | Family Households | Nonfamily Households |
| 1-Person Households | - | 137 (12.2%) |
| 2-Person Households | 398 (35.5%) | 84 (7.5%) |
| 3-Person Households | 174 (15.5%) | 0 (0.0%) |
| 4-Person Households | 220 (19.6%) | 0 (0.0%) |
| 5-Person Households | 60 (5.4%) | 0 (0.0%) |
| 6-Person Households | 0 (0.0%) | 0 (0.0%) |
| 7+ Person Households | 47 (4.2%) | 0 (0.0%) |
| Total | 899 (80.3%) | 221 (19.7%) |
Female Fertility in Holiday Shores
Fertility by Age in Holiday Shores
Average fertility rate in Holiday Shores is 87.0 births per 1,000 women. Women in the age bracket of 35 to 50 years have the highest fertility rate with 115.0 births per 1,000 women. Women in the age bracket of 35 to 50 years acount for 77.0% of all women with births.
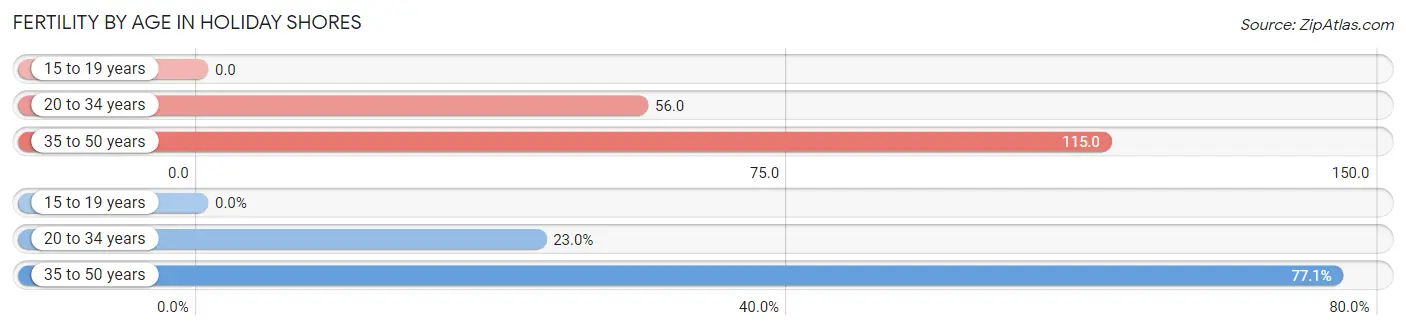
| Age Bracket | Women with Births | Births / 1,000 Women |
| 15 to 19 years | 0 (0.0%) | 0.0 |
| 20 to 34 years | 14 (23.0%) | 56.0 |
| 35 to 50 years | 47 (77.0%) | 115.0 |
| Total | 61 (100.0%) | 87.0 |
Fertility by Age by Marriage Status in Holiday Shores
23.0% of women with births (61) in Holiday Shores are married. The highest percentage of unmarried women with births falls into 35 to 50 years age bracket with 100.0% of them unmarried at the time of birth, while the lowest percentage of unmarried women with births belong to 20 to 34 years age bracket with 0.0% of them unmarried.
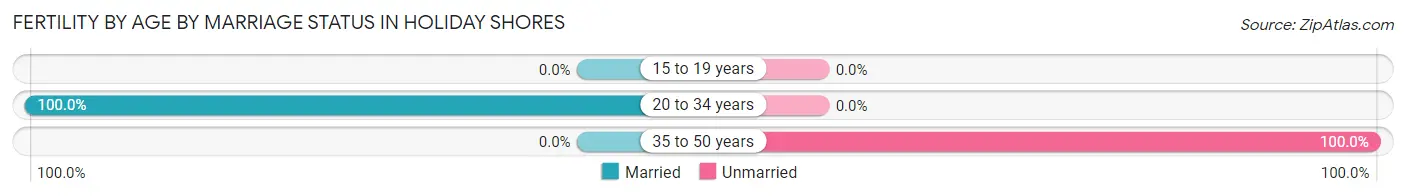
| Age Bracket | Married | Unmarried |
| 15 to 19 years | 0 (0.0%) | 0 (0.0%) |
| 20 to 34 years | 14 (100.0%) | 0 (0.0%) |
| 35 to 50 years | 0 (0.0%) | 47 (100.0%) |
| Total | 14 (23.0%) | 47 (77.0%) |
Fertility by Education in Holiday Shores
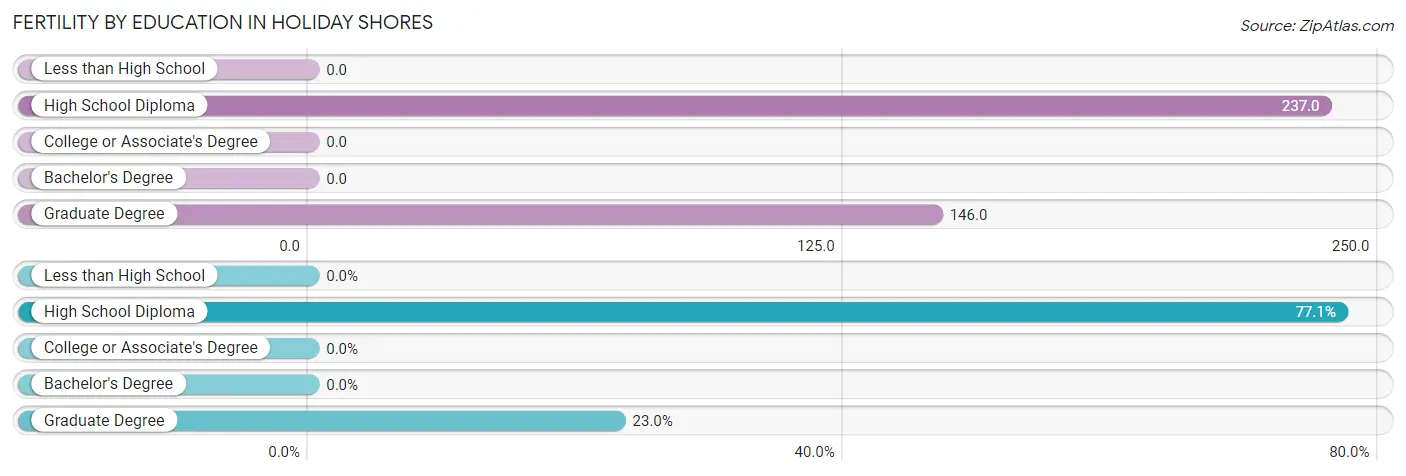
| Educational Attainment | Women with Births | Births / 1,000 Women |
| Less than High School | 0 (0.0%) | 0.0 |
| High School Diploma | 47 (77.0%) | 237.0 |
| College or Associate's Degree | 0 (0.0%) | 0.0 |
| Bachelor's Degree | 0 (0.0%) | 0.0 |
| Graduate Degree | 14 (23.0%) | 146.0 |
| Total | 61 (100.0%) | 87.0 |
Fertility by Education by Marriage Status in Holiday Shores
77.0% of women with births in Holiday Shores are unmarried. Women with the educational attainment of graduate degree are most likely to be married with 100.0% of them married at childbirth, while women with the educational attainment of high school diploma are least likely to be married with 100.0% of them unmarried at childbirth.
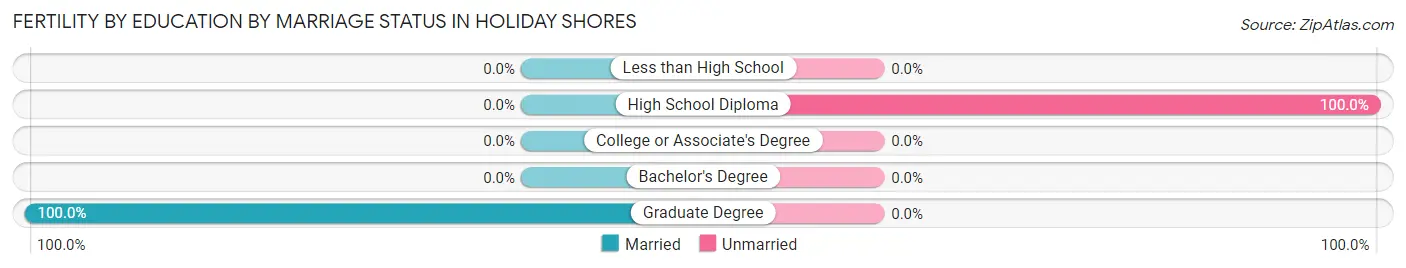
| Educational Attainment | Married | Unmarried |
| Less than High School | 0 (0.0%) | 0 (0.0%) |
| High School Diploma | 0 (0.0%) | 47 (100.0%) |
| College or Associate's Degree | 0 (0.0%) | 0 (0.0%) |
| Bachelor's Degree | 0 (0.0%) | 0 (0.0%) |
| Graduate Degree | 14 (100.0%) | 0 (0.0%) |
| Total | 14 (23.0%) | 47 (77.0%) |
Employment Characteristics in Holiday Shores
Employment by Class of Employer in Holiday Shores
Among the 1,789 employed individuals in Holiday Shores, private company employees (1,313 | 73.4%), state government employees (96 | 5.4%), and federal government employees (91 | 5.1%) make up the most common classes of employment.
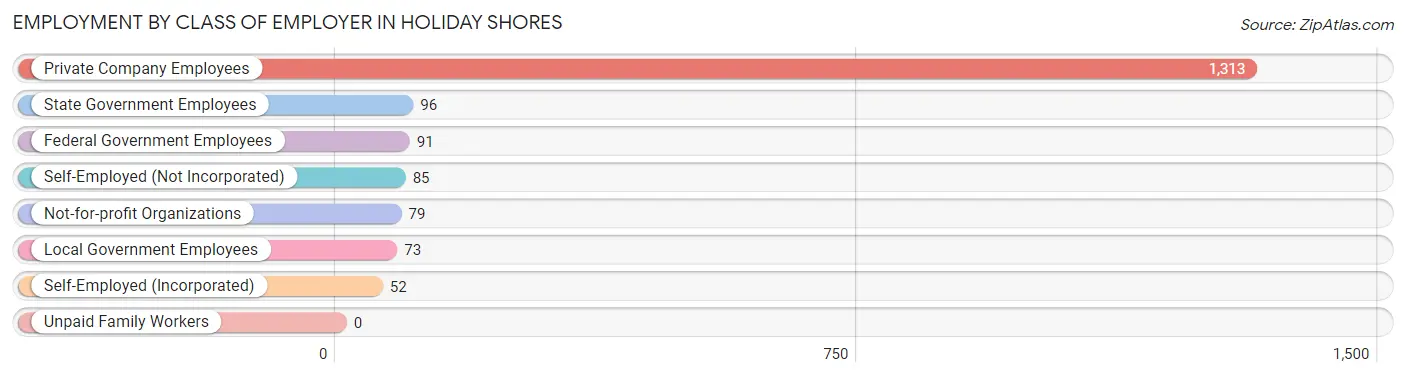
| Employer Class | # Employees | % Employees |
| Private Company Employees | 1,313 | 73.4% |
| Self-Employed (Incorporated) | 52 | 2.9% |
| Self-Employed (Not Incorporated) | 85 | 4.8% |
| Not-for-profit Organizations | 79 | 4.4% |
| Local Government Employees | 73 | 4.1% |
| State Government Employees | 96 | 5.4% |
| Federal Government Employees | 91 | 5.1% |
| Unpaid Family Workers | 0 | 0.0% |
| Total | 1,789 | 100.0% |
Employment Status by Age in Holiday Shores
According to the labor force statistics for Holiday Shores, out of the total population over 16 years of age (2,643), 75.7% or 2,001 individuals are in the labor force, with 7.3% or 146 of them unemployed. The age group with the highest labor force participation rate is 25 to 29 years, with 100.0% or 165 individuals in the labor force. Within the labor force, the 60 to 64 years age range has the highest percentage of unemployed individuals, with 41.4% or 60 of them being unemployed.
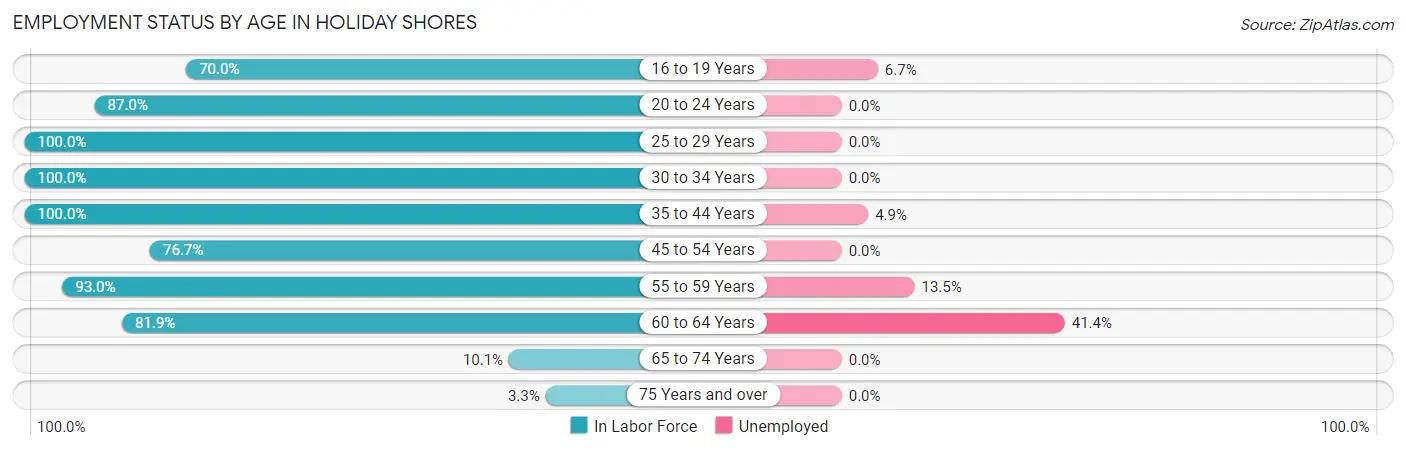
| Age Bracket | In Labor Force | Unemployed |
| 16 to 19 Years | 105 (70.0%) | 7 (6.7%) |
| 20 to 24 Years | 154 (87.0%) | 0 (0.0%) |
| 25 to 29 Years | 165 (100.0%) | 0 (0.0%) |
| 30 to 34 Years | 123 (100.0%) | 0 (0.0%) |
| 35 to 44 Years | 448 (100.0%) | 22 (4.9%) |
| 45 to 54 Years | 415 (76.7%) | 0 (0.0%) |
| 55 to 59 Years | 422 (93.0%) | 57 (13.5%) |
| 60 to 64 Years | 145 (81.9%) | 60 (41.4%) |
| 65 to 74 Years | 17 (10.1%) | 0 (0.0%) |
| 75 Years and over | 8 (3.3%) | 0 (0.0%) |
| Total | 2,001 (75.7%) | 146 (7.3%) |
Employment Status by Educational Attainment in Holiday Shores
According to labor force statistics for Holiday Shores, 90.0% of individuals (1,717) out of the total population between 25 and 64 years of age (1,908) are in the labor force, with 8.1% or 139 of them being unemployed. The group with the highest labor force participation rate are those with the educational attainment of less than high school, with 100.0% or 84 individuals in the labor force. Within the labor force, individuals with high school diploma education have the highest percentage of unemployment, with 16.0% or 57 of them being unemployed.
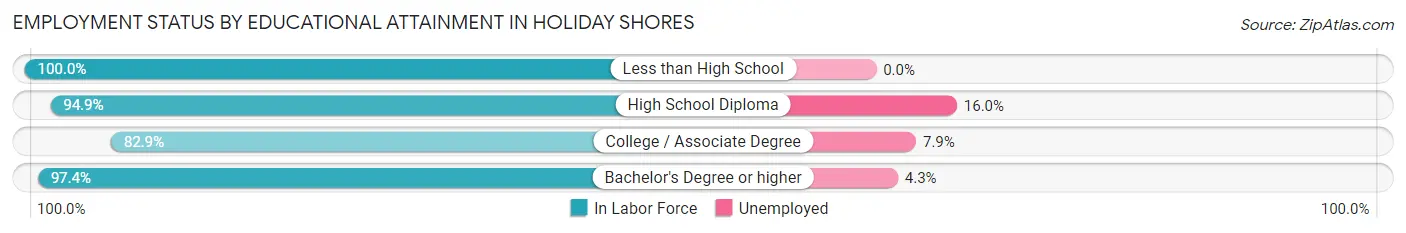
| Educational Attainment | In Labor Force | Unemployed |
| Less than High School | 84 (100.0%) | 0 (0.0%) |
| High School Diploma | 357 (94.9%) | 60 (16.0%) |
| College / Associate Degree | 761 (82.9%) | 73 (7.9%) |
| Bachelor's Degree or higher | 516 (97.4%) | 23 (4.3%) |
| Total | 1,717 (90.0%) | 155 (8.1%) |
Employment Occupations by Sex in Holiday Shores
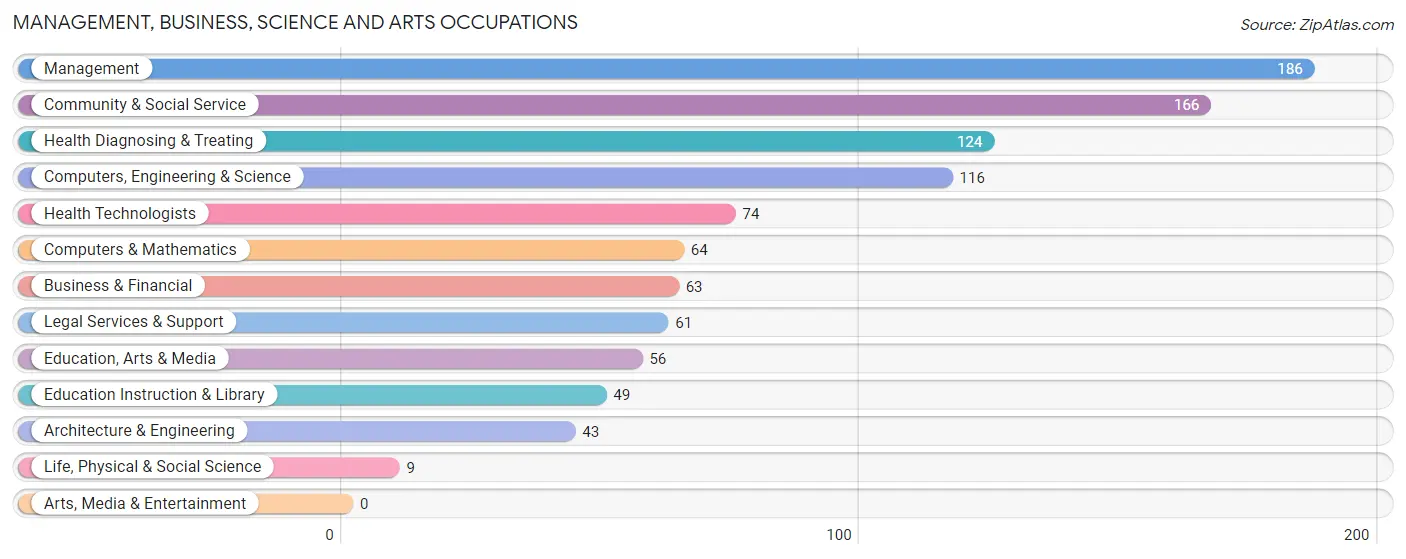
Management, Business, Science and Arts Occupations
The most common Management, Business, Science and Arts occupations in Holiday Shores are Management (186 | 10.0%), Community & Social Service (166 | 8.9%), Health Diagnosing & Treating (124 | 6.7%), Computers, Engineering & Science (116 | 6.2%), and Health Technologists (74 | 4.0%).
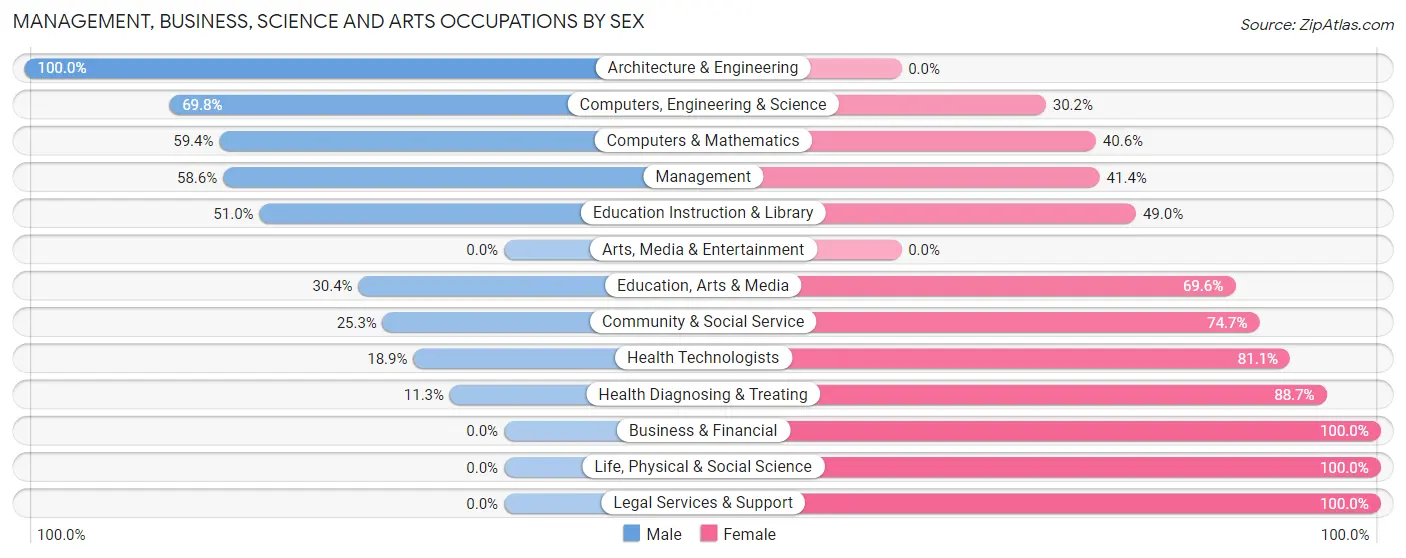
Management, Business, Science and Arts Occupations by Sex
Within the Management, Business, Science and Arts occupations in Holiday Shores, the most male-oriented occupations are Architecture & Engineering (100.0%), Computers, Engineering & Science (69.8%), and Computers & Mathematics (59.4%), while the most female-oriented occupations are Business & Financial (100.0%), Life, Physical & Social Science (100.0%), and Legal Services & Support (100.0%).
| Occupation | Male | Female |
| Management | 109 (58.6%) | 77 (41.4%) |
| Business & Financial | 0 (0.0%) | 63 (100.0%) |
| Computers, Engineering & Science | 81 (69.8%) | 35 (30.2%) |
| Computers & Mathematics | 38 (59.4%) | 26 (40.6%) |
| Architecture & Engineering | 43 (100.0%) | 0 (0.0%) |
| Life, Physical & Social Science | 0 (0.0%) | 9 (100.0%) |
| Community & Social Service | 42 (25.3%) | 124 (74.7%) |
| Education, Arts & Media | 17 (30.4%) | 39 (69.6%) |
| Legal Services & Support | 0 (0.0%) | 61 (100.0%) |
| Education Instruction & Library | 25 (51.0%) | 24 (49.0%) |
| Arts, Media & Entertainment | 0 (0.0%) | 0 (0.0%) |
| Health Diagnosing & Treating | 14 (11.3%) | 110 (88.7%) |
| Health Technologists | 14 (18.9%) | 60 (81.1%) |
| Total (Category) | 246 (37.6%) | 409 (62.4%) |
| Total (Overall) | 1,097 (59.1%) | 759 (40.9%) |
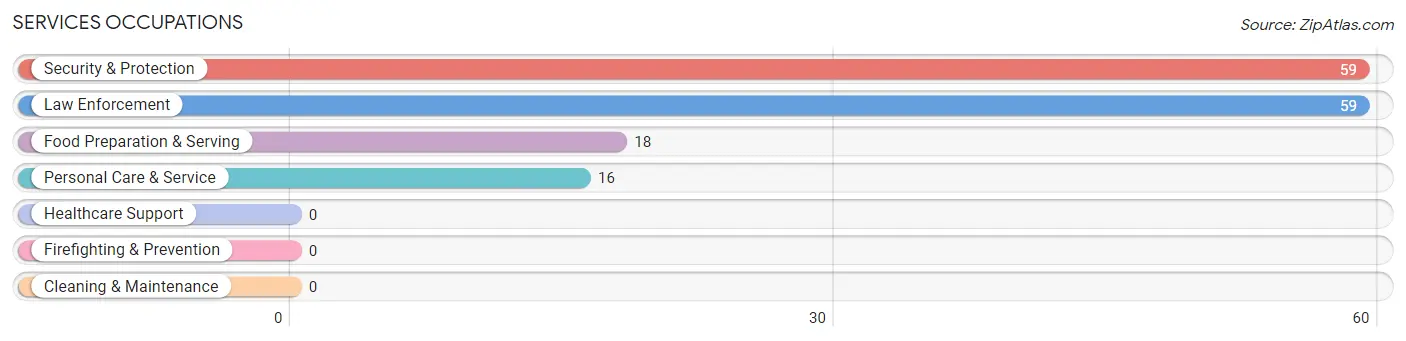
Services Occupations
The most common Services occupations in Holiday Shores are Security & Protection (59 | 3.2%), Law Enforcement (59 | 3.2%), Food Preparation & Serving (18 | 1.0%), and Personal Care & Service (16 | 0.9%).
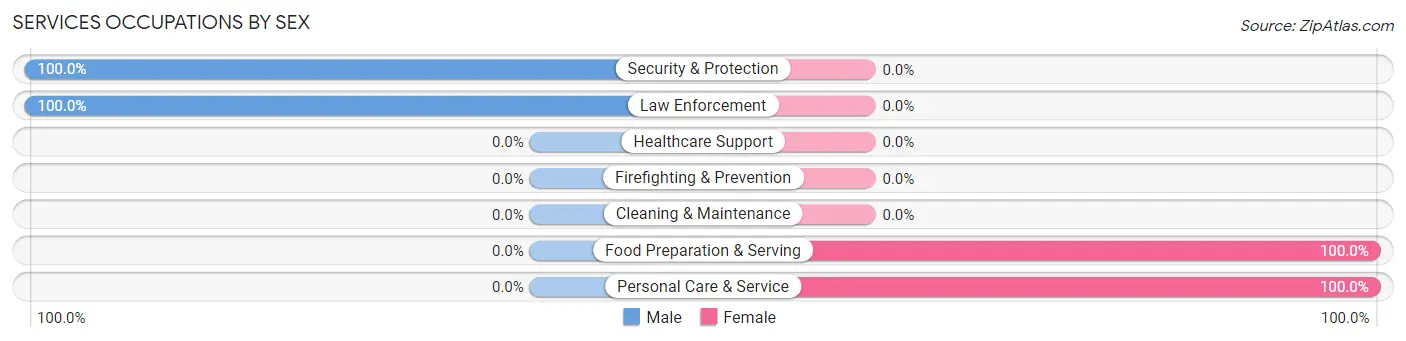
Services Occupations by Sex
Within the Services occupations in Holiday Shores, the most male-oriented occupations are Security & Protection (100.0%), and Law Enforcement (100.0%), while the most female-oriented occupations are Food Preparation & Serving (100.0%), and Personal Care & Service (100.0%).
| Occupation | Male | Female |
| Healthcare Support | 0 (0.0%) | 0 (0.0%) |
| Security & Protection | 59 (100.0%) | 0 (0.0%) |
| Firefighting & Prevention | 0 (0.0%) | 0 (0.0%) |
| Law Enforcement | 59 (100.0%) | 0 (0.0%) |
| Food Preparation & Serving | 0 (0.0%) | 18 (100.0%) |
| Cleaning & Maintenance | 0 (0.0%) | 0 (0.0%) |
| Personal Care & Service | 0 (0.0%) | 16 (100.0%) |
| Total (Category) | 59 (63.4%) | 34 (36.6%) |
| Total (Overall) | 1,097 (59.1%) | 759 (40.9%) |
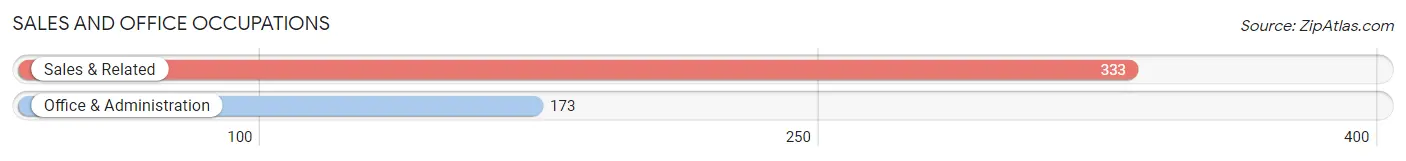
Sales and Office Occupations
The most common Sales and Office occupations in Holiday Shores are Sales & Related (333 | 17.9%), and Office & Administration (173 | 9.3%).
Sales and Office Occupations by Sex
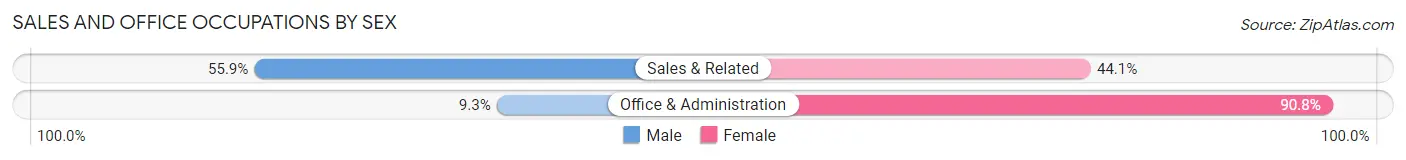
| Occupation | Male | Female |
| Sales & Related | 186 (55.9%) | 147 (44.1%) |
| Office & Administration | 16 (9.2%) | 157 (90.7%) |
| Total (Category) | 202 (39.9%) | 304 (60.1%) |
| Total (Overall) | 1,097 (59.1%) | 759 (40.9%) |
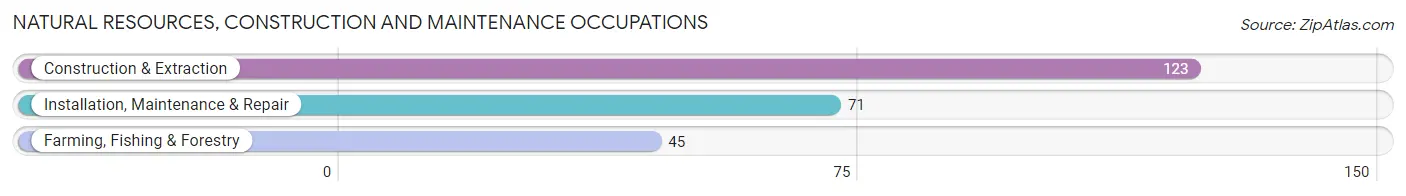
Natural Resources, Construction and Maintenance Occupations
The most common Natural Resources, Construction and Maintenance occupations in Holiday Shores are Construction & Extraction (123 | 6.6%), Installation, Maintenance & Repair (71 | 3.8%), and Farming, Fishing & Forestry (45 | 2.4%).
Natural Resources, Construction and Maintenance Occupations by Sex
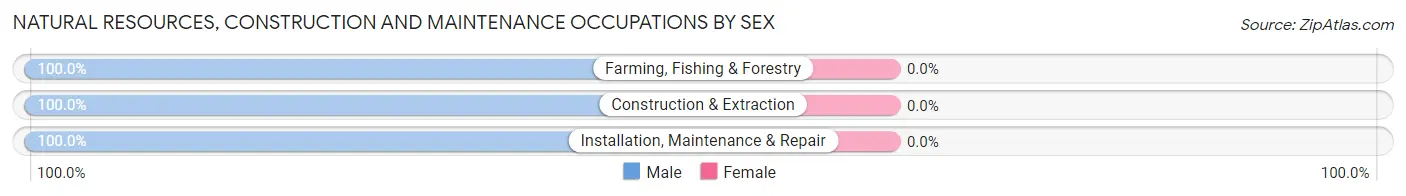
| Occupation | Male | Female |
| Farming, Fishing & Forestry | 45 (100.0%) | 0 (0.0%) |
| Construction & Extraction | 123 (100.0%) | 0 (0.0%) |
| Installation, Maintenance & Repair | 71 (100.0%) | 0 (0.0%) |
| Total (Category) | 239 (100.0%) | 0 (0.0%) |
| Total (Overall) | 1,097 (59.1%) | 759 (40.9%) |
Production, Transportation and Moving Occupations
The most common Production, Transportation and Moving occupations in Holiday Shores are Transportation (154 | 8.3%), Material Moving (108 | 5.8%), and Production (101 | 5.4%).
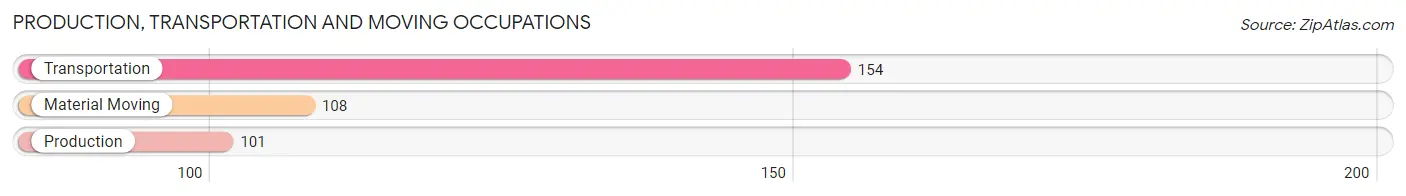
Production, Transportation and Moving Occupations by Sex
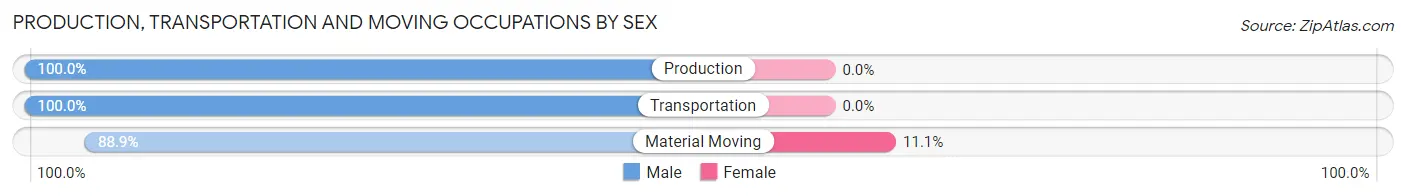
| Occupation | Male | Female |
| Production | 101 (100.0%) | 0 (0.0%) |
| Transportation | 154 (100.0%) | 0 (0.0%) |
| Material Moving | 96 (88.9%) | 12 (11.1%) |
| Total (Category) | 351 (96.7%) | 12 (3.3%) |
| Total (Overall) | 1,097 (59.1%) | 759 (40.9%) |
Employment Industries by Sex in Holiday Shores
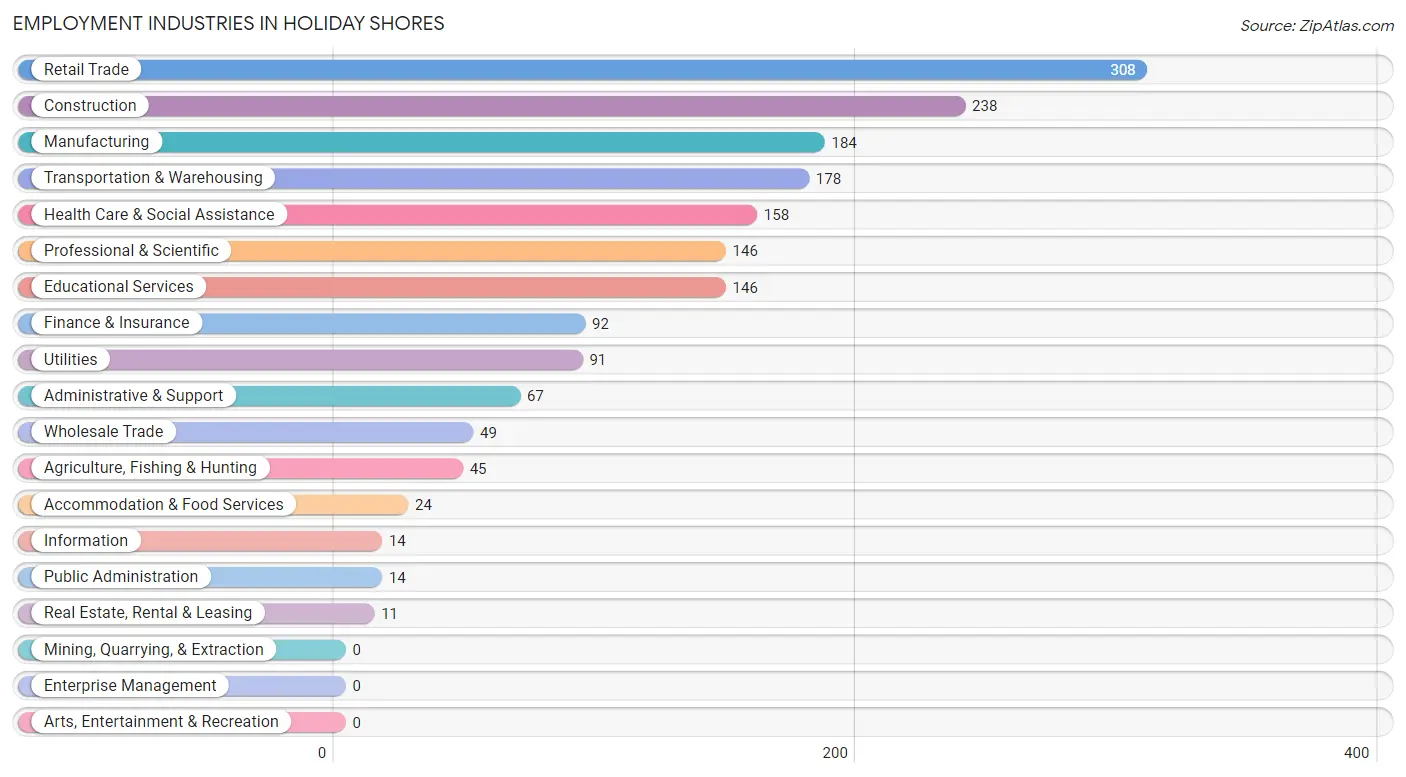
Employment Industries in Holiday Shores
The major employment industries in Holiday Shores include Retail Trade (308 | 16.6%), Construction (238 | 12.8%), Manufacturing (184 | 9.9%), Transportation & Warehousing (178 | 9.6%), and Health Care & Social Assistance (158 | 8.5%).
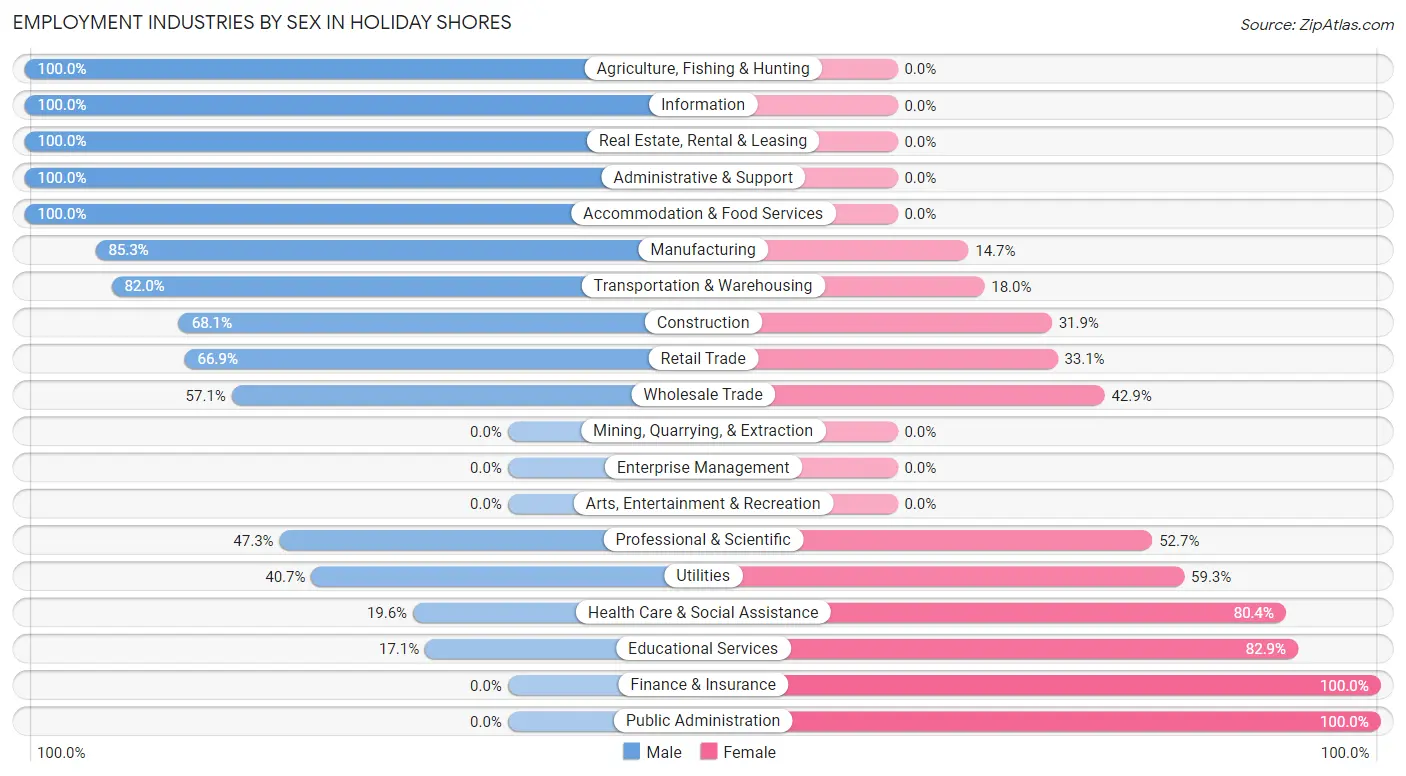
Employment Industries by Sex in Holiday Shores
The Holiday Shores industries that see more men than women are Agriculture, Fishing & Hunting (100.0%), Information (100.0%), and Real Estate, Rental & Leasing (100.0%), whereas the industries that tend to have a higher number of women are Finance & Insurance (100.0%), Public Administration (100.0%), and Educational Services (82.9%).
| Industry | Male | Female |
| Agriculture, Fishing & Hunting | 45 (100.0%) | 0 (0.0%) |
| Mining, Quarrying, & Extraction | 0 (0.0%) | 0 (0.0%) |
| Construction | 162 (68.1%) | 76 (31.9%) |
| Manufacturing | 157 (85.3%) | 27 (14.7%) |
| Wholesale Trade | 28 (57.1%) | 21 (42.9%) |
| Retail Trade | 206 (66.9%) | 102 (33.1%) |
| Transportation & Warehousing | 146 (82.0%) | 32 (18.0%) |
| Utilities | 37 (40.7%) | 54 (59.3%) |
| Information | 14 (100.0%) | 0 (0.0%) |
| Finance & Insurance | 0 (0.0%) | 92 (100.0%) |
| Real Estate, Rental & Leasing | 11 (100.0%) | 0 (0.0%) |
| Professional & Scientific | 69 (47.3%) | 77 (52.7%) |
| Enterprise Management | 0 (0.0%) | 0 (0.0%) |
| Administrative & Support | 67 (100.0%) | 0 (0.0%) |
| Educational Services | 25 (17.1%) | 121 (82.9%) |
| Health Care & Social Assistance | 31 (19.6%) | 127 (80.4%) |
| Arts, Entertainment & Recreation | 0 (0.0%) | 0 (0.0%) |
| Accommodation & Food Services | 24 (100.0%) | 0 (0.0%) |
| Public Administration | 0 (0.0%) | 14 (100.0%) |
| Total | 1,097 (59.1%) | 759 (40.9%) |
Education in Holiday Shores
School Enrollment in Holiday Shores
The most common levels of schooling among the 642 students in Holiday Shores are high school (200 | 31.1%), middle school (193 | 30.1%), and elementary school (148 | 23.1%).
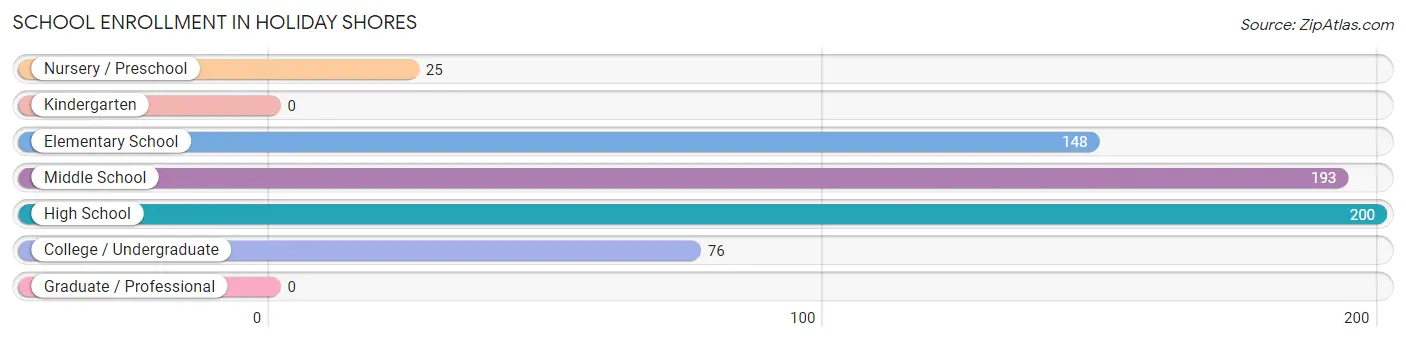
| School Level | # Students | % Students |
| Nursery / Preschool | 25 | 3.9% |
| Kindergarten | 0 | 0.0% |
| Elementary School | 148 | 23.1% |
| Middle School | 193 | 30.1% |
| High School | 200 | 31.1% |
| College / Undergraduate | 76 | 11.8% |
| Graduate / Professional | 0 | 0.0% |
| Total | 642 | 100.0% |
School Enrollment by Age by Funding Source in Holiday Shores
Out of a total of 642 students who are enrolled in schools in Holiday Shores, 335 (52.2%) attend a private institution, while the remaining 307 (47.8%) are enrolled in public schools. The age group of 18 to 19 year olds has the highest likelihood of being enrolled in private schools, with 17 (100.0% in the age bracket) enrolled. Conversely, the age group of 15 to 17 year olds has the lowest likelihood of being enrolled in a private school, with 88 (66.2% in the age bracket) attending a public institution.
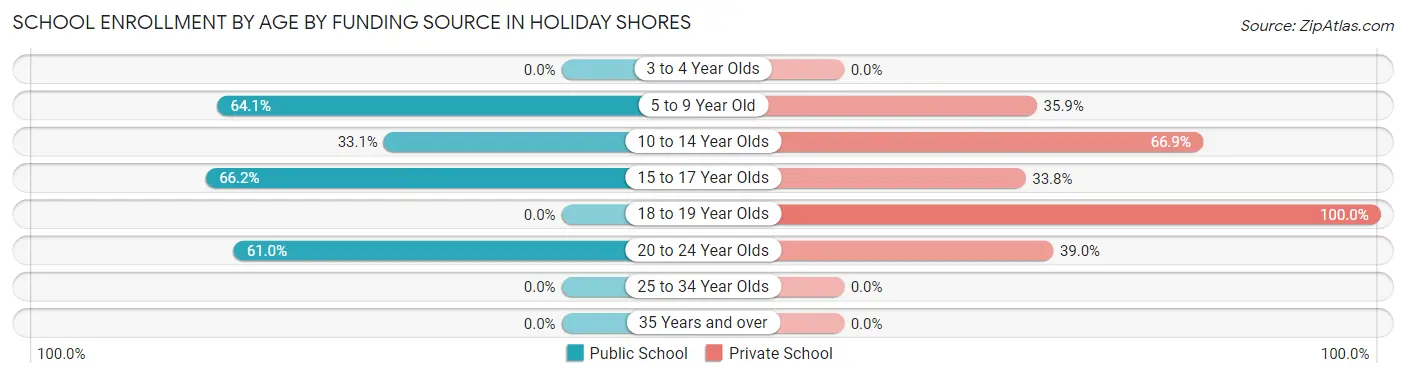
| Age Bracket | Public School | Private School |
| 3 to 4 Year Olds | 0 (0.0%) | 0 (0.0%) |
| 5 to 9 Year Old | 82 (64.1%) | 46 (35.9%) |
| 10 to 14 Year Olds | 101 (33.1%) | 204 (66.9%) |
| 15 to 17 Year Olds | 88 (66.2%) | 45 (33.8%) |
| 18 to 19 Year Olds | 0 (0.0%) | 17 (100.0%) |
| 20 to 24 Year Olds | 36 (61.0%) | 23 (39.0%) |
| 25 to 34 Year Olds | 0 (0.0%) | 0 (0.0%) |
| 35 Years and over | 0 (0.0%) | 0 (0.0%) |
| Total | 307 (47.8%) | 335 (52.2%) |
Educational Attainment by Field of Study in Holiday Shores
Business (191 | 23.4%), visual & performing arts (110 | 13.5%), education (98 | 12.0%), psychology (89 | 10.9%), and engineering (87 | 10.7%) are the most common fields of study among 815 individuals in Holiday Shores who have obtained a bachelor's degree or higher.
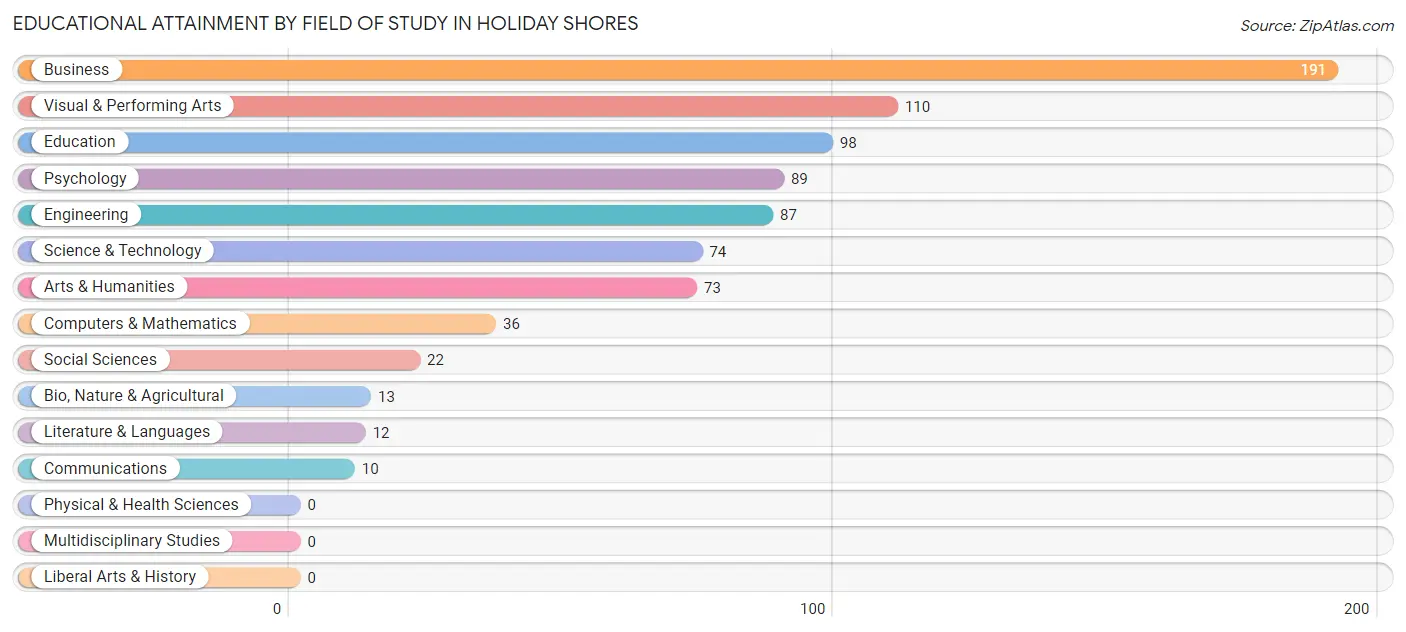
| Field of Study | # Graduates | % Graduates |
| Computers & Mathematics | 36 | 4.4% |
| Bio, Nature & Agricultural | 13 | 1.6% |
| Physical & Health Sciences | 0 | 0.0% |
| Psychology | 89 | 10.9% |
| Social Sciences | 22 | 2.7% |
| Engineering | 87 | 10.7% |
| Multidisciplinary Studies | 0 | 0.0% |
| Science & Technology | 74 | 9.1% |
| Business | 191 | 23.4% |
| Education | 98 | 12.0% |
| Literature & Languages | 12 | 1.5% |
| Liberal Arts & History | 0 | 0.0% |
| Visual & Performing Arts | 110 | 13.5% |
| Communications | 10 | 1.2% |
| Arts & Humanities | 73 | 9.0% |
| Total | 815 | 100.0% |
Transportation & Commute in Holiday Shores
Vehicle Availability by Sex in Holiday Shores
The most prevalent vehicle ownership categories in Holiday Shores are males with 2 vehicles (497, accounting for 48.2%) and females with 2 vehicles (178, making up 65.5%).
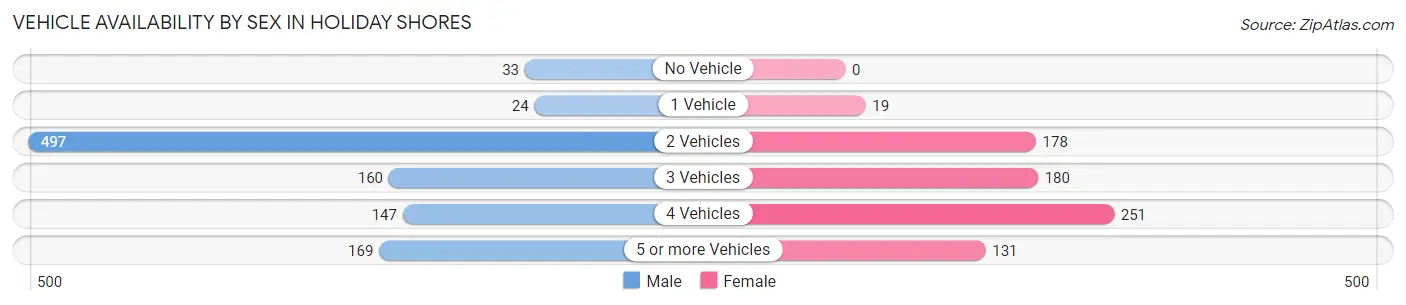
| Vehicles Available | Male | Female |
| No Vehicle | 33 (3.2%) | 0 (0.0%) |
| 1 Vehicle | 24 (2.3%) | 19 (2.5%) |
| 2 Vehicles | 497 (48.2%) | 178 (23.4%) |
| 3 Vehicles | 160 (15.5%) | 180 (23.7%) |
| 4 Vehicles | 147 (14.3%) | 251 (33.1%) |
| 5 or more Vehicles | 169 (16.4%) | 131 (17.3%) |
| Total | 1,030 (100.0%) | 759 (100.0%) |
Commute Time in Holiday Shores
The most frequently occuring commute durations in Holiday Shores are 40 to 44 minutes (269 commuters, 17.9%), 20 to 24 minutes (246 commuters, 16.4%), and 25 to 29 minutes (226 commuters, 15.1%).
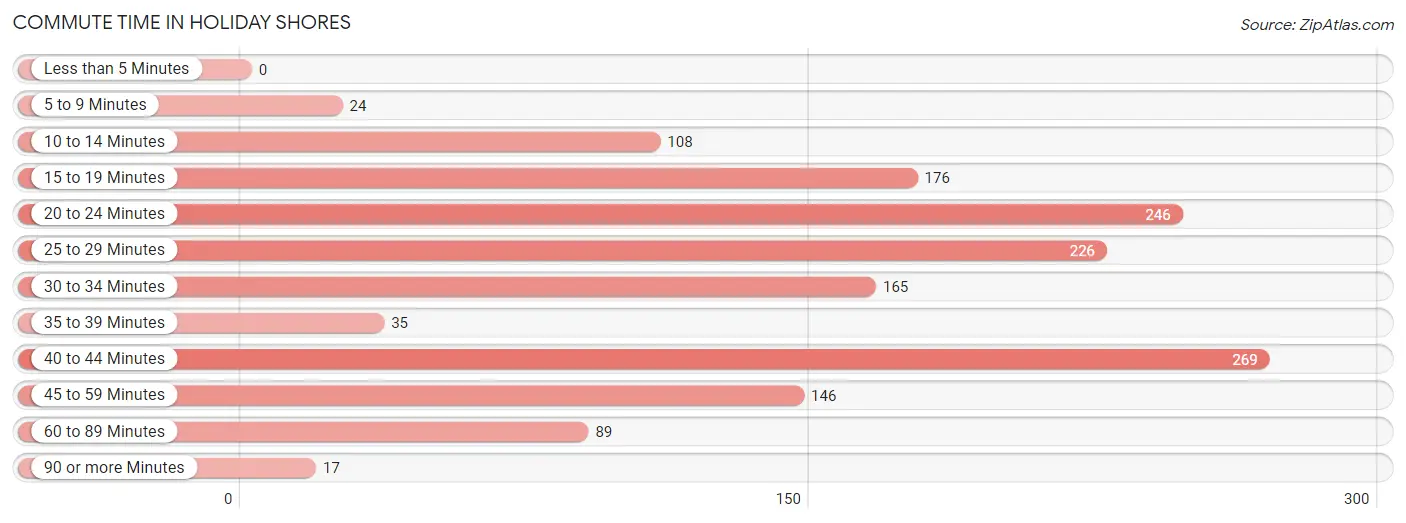
| Commute Time | # Commuters | % Commuters |
| Less than 5 Minutes | 0 | 0.0% |
| 5 to 9 Minutes | 24 | 1.6% |
| 10 to 14 Minutes | 108 | 7.2% |
| 15 to 19 Minutes | 176 | 11.7% |
| 20 to 24 Minutes | 246 | 16.4% |
| 25 to 29 Minutes | 226 | 15.1% |
| 30 to 34 Minutes | 165 | 11.0% |
| 35 to 39 Minutes | 35 | 2.3% |
| 40 to 44 Minutes | 269 | 17.9% |
| 45 to 59 Minutes | 146 | 9.7% |
| 60 to 89 Minutes | 89 | 5.9% |
| 90 or more Minutes | 17 | 1.1% |
Commute Time by Sex in Holiday Shores
The most common commute times in Holiday Shores are 40 to 44 minutes (219 commuters, 24.4%) for males and 20 to 24 minutes (183 commuters, 30.3%) for females.
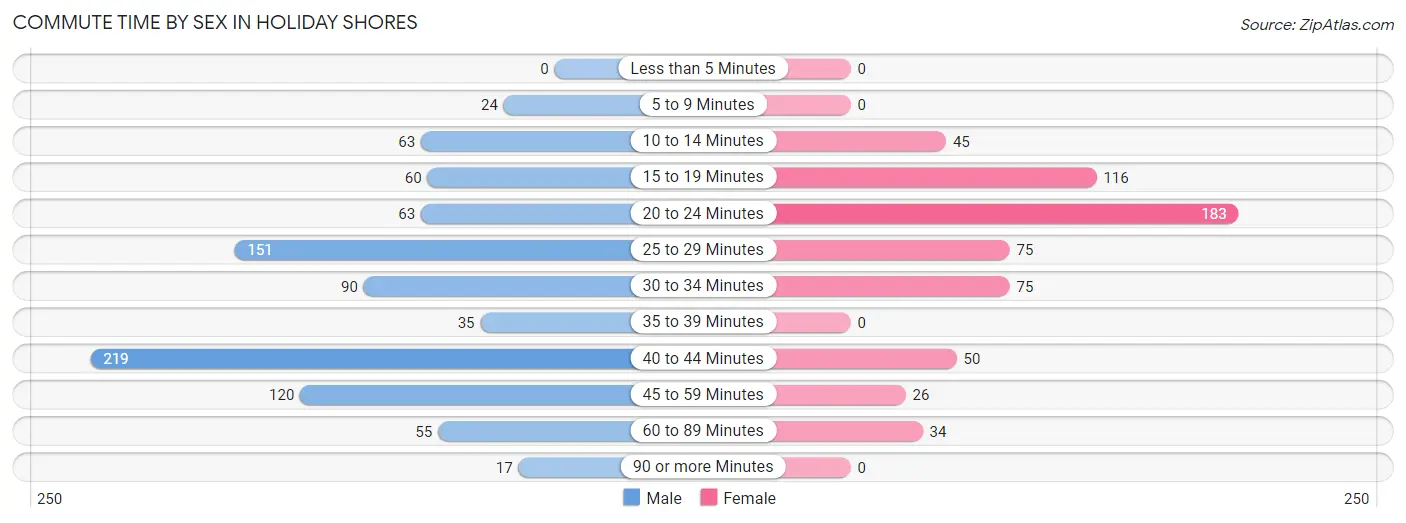
| Commute Time | Male | Female |
| Less than 5 Minutes | 0 (0.0%) | 0 (0.0%) |
| 5 to 9 Minutes | 24 (2.7%) | 0 (0.0%) |
| 10 to 14 Minutes | 63 (7.0%) | 45 (7.4%) |
| 15 to 19 Minutes | 60 (6.7%) | 116 (19.2%) |
| 20 to 24 Minutes | 63 (7.0%) | 183 (30.3%) |
| 25 to 29 Minutes | 151 (16.8%) | 75 (12.4%) |
| 30 to 34 Minutes | 90 (10.0%) | 75 (12.4%) |
| 35 to 39 Minutes | 35 (3.9%) | 0 (0.0%) |
| 40 to 44 Minutes | 219 (24.4%) | 50 (8.3%) |
| 45 to 59 Minutes | 120 (13.4%) | 26 (4.3%) |
| 60 to 89 Minutes | 55 (6.1%) | 34 (5.6%) |
| 90 or more Minutes | 17 (1.9%) | 0 (0.0%) |
Time of Departure to Work by Sex in Holiday Shores
The most frequent times of departure to work in Holiday Shores are 6:30 AM to 6:59 AM (237, 26.4%) for males and 7:30 AM to 7:59 AM (149, 24.7%) for females.
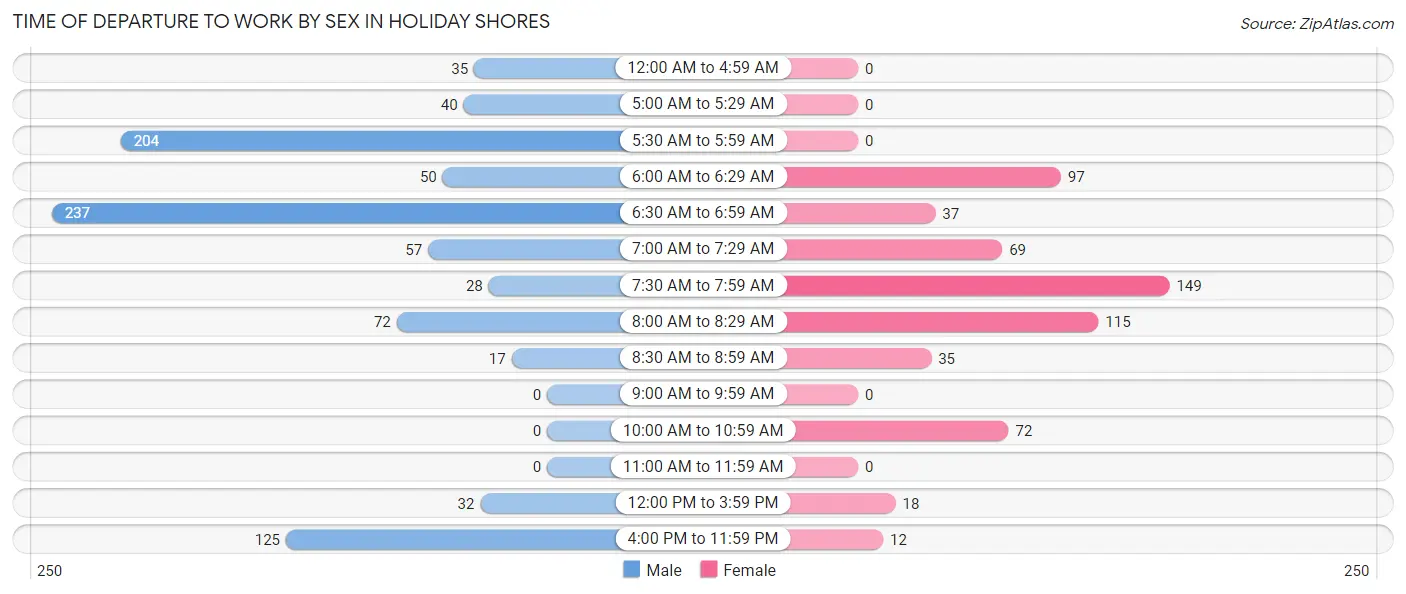
| Time of Departure | Male | Female |
| 12:00 AM to 4:59 AM | 35 (3.9%) | 0 (0.0%) |
| 5:00 AM to 5:29 AM | 40 (4.5%) | 0 (0.0%) |
| 5:30 AM to 5:59 AM | 204 (22.7%) | 0 (0.0%) |
| 6:00 AM to 6:29 AM | 50 (5.6%) | 97 (16.1%) |
| 6:30 AM to 6:59 AM | 237 (26.4%) | 37 (6.1%) |
| 7:00 AM to 7:29 AM | 57 (6.4%) | 69 (11.4%) |
| 7:30 AM to 7:59 AM | 28 (3.1%) | 149 (24.7%) |
| 8:00 AM to 8:29 AM | 72 (8.0%) | 115 (19.0%) |
| 8:30 AM to 8:59 AM | 17 (1.9%) | 35 (5.8%) |
| 9:00 AM to 9:59 AM | 0 (0.0%) | 0 (0.0%) |
| 10:00 AM to 10:59 AM | 0 (0.0%) | 72 (11.9%) |
| 11:00 AM to 11:59 AM | 0 (0.0%) | 0 (0.0%) |
| 12:00 PM to 3:59 PM | 32 (3.6%) | 18 (3.0%) |
| 4:00 PM to 11:59 PM | 125 (13.9%) | 12 (2.0%) |
| Total | 897 (100.0%) | 604 (100.0%) |
Housing Occupancy in Holiday Shores
Occupancy by Ownership in Holiday Shores
Of the total 1,120 dwellings in Holiday Shores, owner-occupied units account for 1,017 (90.8%), while renter-occupied units make up 103 (9.2%).
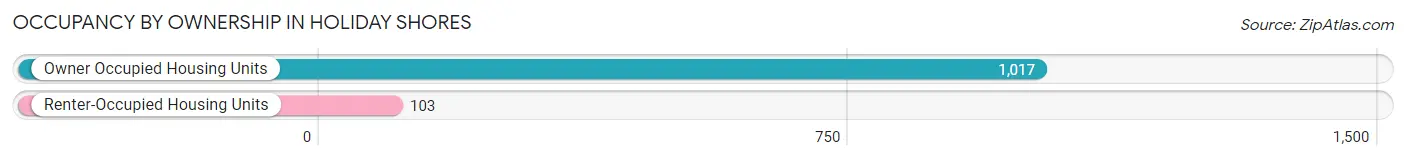
| Occupancy | # Housing Units | % Housing Units |
| Owner Occupied Housing Units | 1,017 | 90.8% |
| Renter-Occupied Housing Units | 103 | 9.2% |
| Total Occupied Housing Units | 1,120 | 100.0% |
Occupancy by Household Size in Holiday Shores
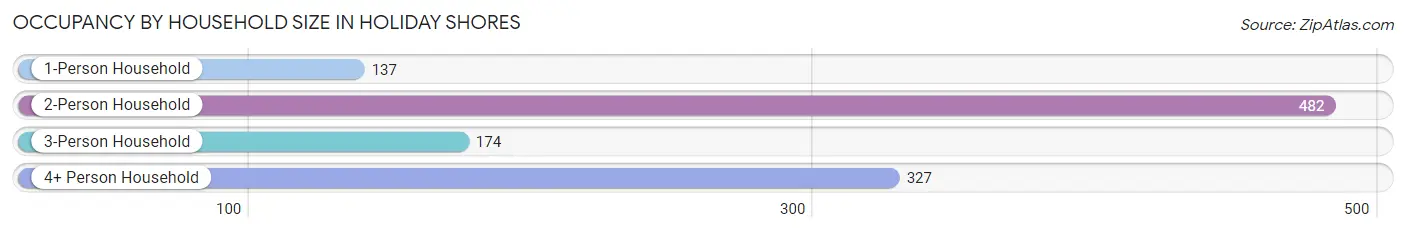
| Household Size | # Housing Units | % Housing Units |
| 1-Person Household | 137 | 12.2% |
| 2-Person Household | 482 | 43.0% |
| 3-Person Household | 174 | 15.5% |
| 4+ Person Household | 327 | 29.2% |
| Total Housing Units | 1,120 | 100.0% |
Occupancy by Ownership by Household Size in Holiday Shores
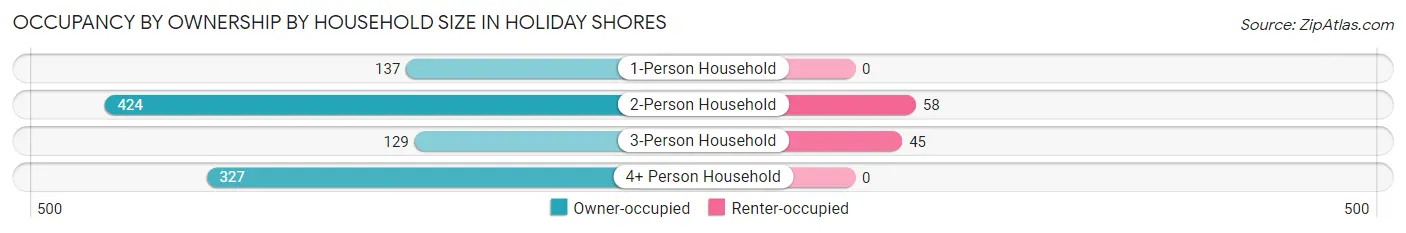
| Household Size | Owner-occupied | Renter-occupied |
| 1-Person Household | 137 (100.0%) | 0 (0.0%) |
| 2-Person Household | 424 (88.0%) | 58 (12.0%) |
| 3-Person Household | 129 (74.1%) | 45 (25.9%) |
| 4+ Person Household | 327 (100.0%) | 0 (0.0%) |
| Total Housing Units | 1,017 (90.8%) | 103 (9.2%) |
Occupancy by Educational Attainment in Holiday Shores
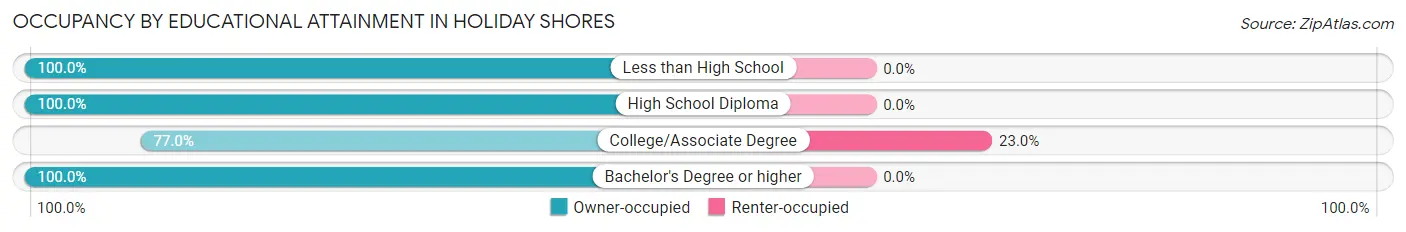
| Household Size | Owner-occupied | Renter-occupied |
| Less than High School | 100 (100.0%) | 0 (0.0%) |
| High School Diploma | 121 (100.0%) | 0 (0.0%) |
| College/Associate Degree | 345 (77.0%) | 103 (23.0%) |
| Bachelor's Degree or higher | 451 (100.0%) | 0 (0.0%) |
Occupancy by Age of Householder in Holiday Shores
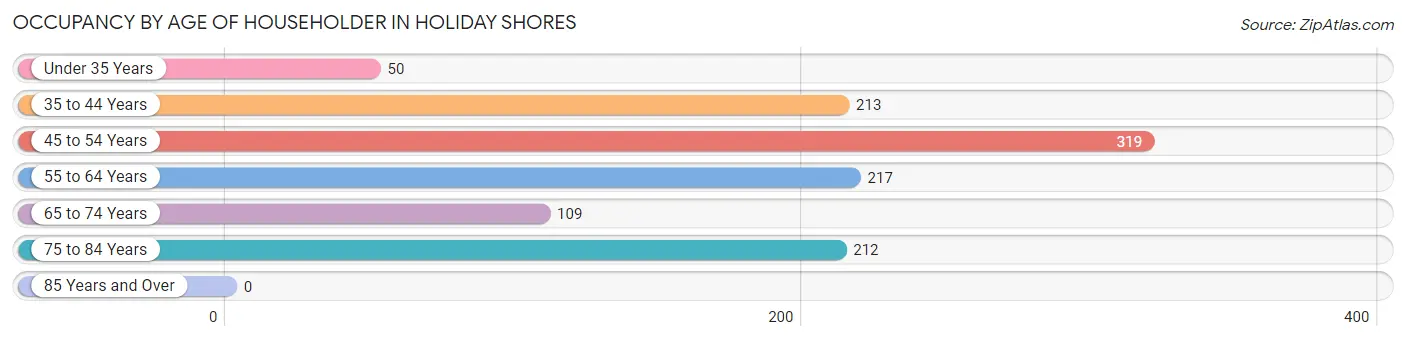
| Age Bracket | # Households | % Households |
| Under 35 Years | 50 | 4.5% |
| 35 to 44 Years | 213 | 19.0% |
| 45 to 54 Years | 319 | 28.5% |
| 55 to 64 Years | 217 | 19.4% |
| 65 to 74 Years | 109 | 9.7% |
| 75 to 84 Years | 212 | 18.9% |
| 85 Years and Over | 0 | 0.0% |
| Total | 1,120 | 100.0% |
Housing Finances in Holiday Shores
Median Income by Occupancy in Holiday Shores
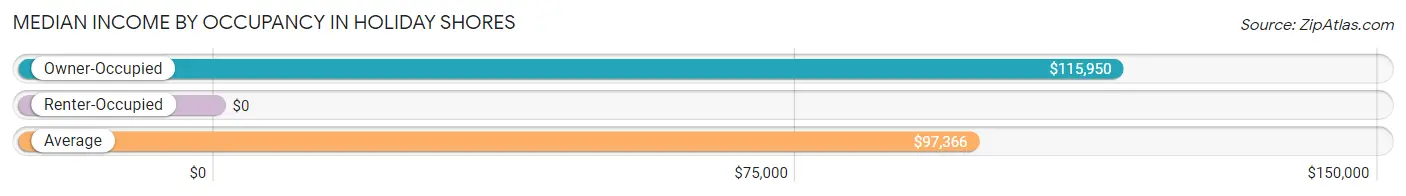
| Occupancy Type | # Households | Median Income |
| Owner-Occupied | 1,017 (90.8%) | $115,950 |
| Renter-Occupied | 103 (9.2%) | $0 |
| Average | 1,120 (100.0%) | $97,366 |
Occupancy by Householder Income Bracket in Holiday Shores
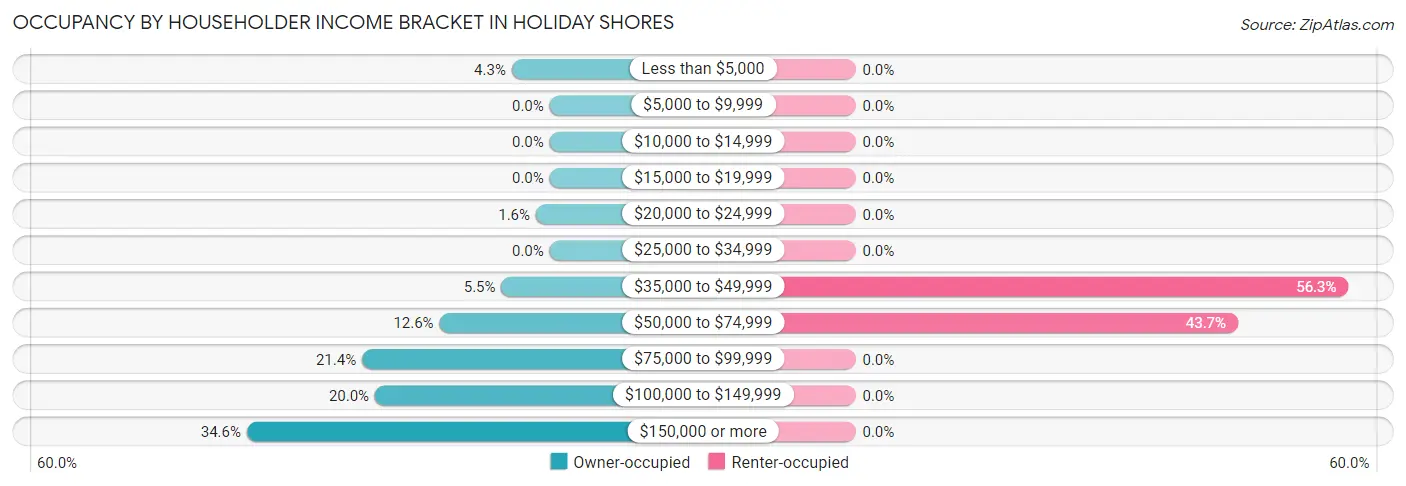
| Income Bracket | Owner-occupied | Renter-occupied |
| Less than $5,000 | 44 (4.3%) | 0 (0.0%) |
| $5,000 to $9,999 | 0 (0.0%) | 0 (0.0%) |
| $10,000 to $14,999 | 0 (0.0%) | 0 (0.0%) |
| $15,000 to $19,999 | 0 (0.0%) | 0 (0.0%) |
| $20,000 to $24,999 | 16 (1.6%) | 0 (0.0%) |
| $25,000 to $34,999 | 0 (0.0%) | 0 (0.0%) |
| $35,000 to $49,999 | 56 (5.5%) | 58 (56.3%) |
| $50,000 to $74,999 | 128 (12.6%) | 45 (43.7%) |
| $75,000 to $99,999 | 218 (21.4%) | 0 (0.0%) |
| $100,000 to $149,999 | 203 (20.0%) | 0 (0.0%) |
| $150,000 or more | 352 (34.6%) | 0 (0.0%) |
| Total | 1,017 (100.0%) | 103 (100.0%) |
Monthly Housing Cost Tiers in Holiday Shores
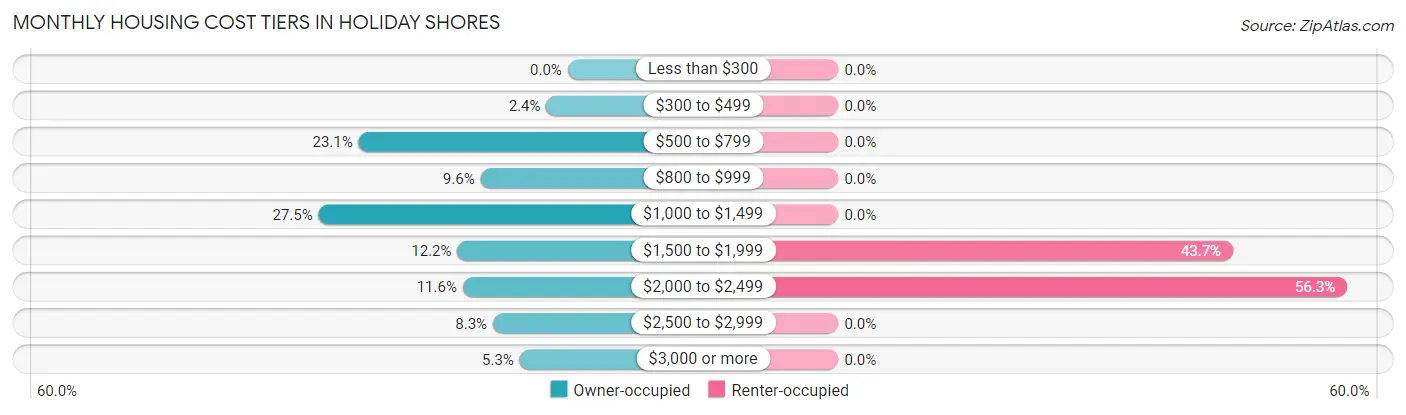
| Monthly Cost | Owner-occupied | Renter-occupied |
| Less than $300 | 0 (0.0%) | 0 (0.0%) |
| $300 to $499 | 24 (2.4%) | 0 (0.0%) |
| $500 to $799 | 235 (23.1%) | 0 (0.0%) |
| $800 to $999 | 98 (9.6%) | 0 (0.0%) |
| $1,000 to $1,499 | 280 (27.5%) | 0 (0.0%) |
| $1,500 to $1,999 | 124 (12.2%) | 45 (43.7%) |
| $2,000 to $2,499 | 118 (11.6%) | 58 (56.3%) |
| $2,500 to $2,999 | 84 (8.3%) | 0 (0.0%) |
| $3,000 or more | 54 (5.3%) | 0 (0.0%) |
| Total | 1,017 (100.0%) | 103 (100.0%) |
Physical Housing Characteristics in Holiday Shores
Housing Structures in Holiday Shores
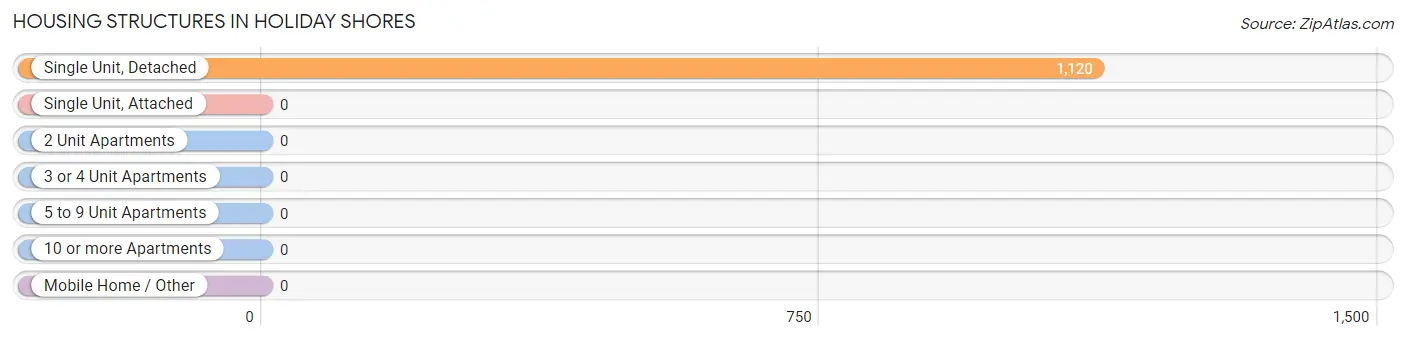
| Structure Type | # Housing Units | % Housing Units |
| Single Unit, Detached | 1,120 | 100.0% |
| Single Unit, Attached | 0 | 0.0% |
| 2 Unit Apartments | 0 | 0.0% |
| 3 or 4 Unit Apartments | 0 | 0.0% |
| 5 to 9 Unit Apartments | 0 | 0.0% |
| 10 or more Apartments | 0 | 0.0% |
| Mobile Home / Other | 0 | 0.0% |
| Total | 1,120 | 100.0% |
Housing Structures by Occupancy in Holiday Shores
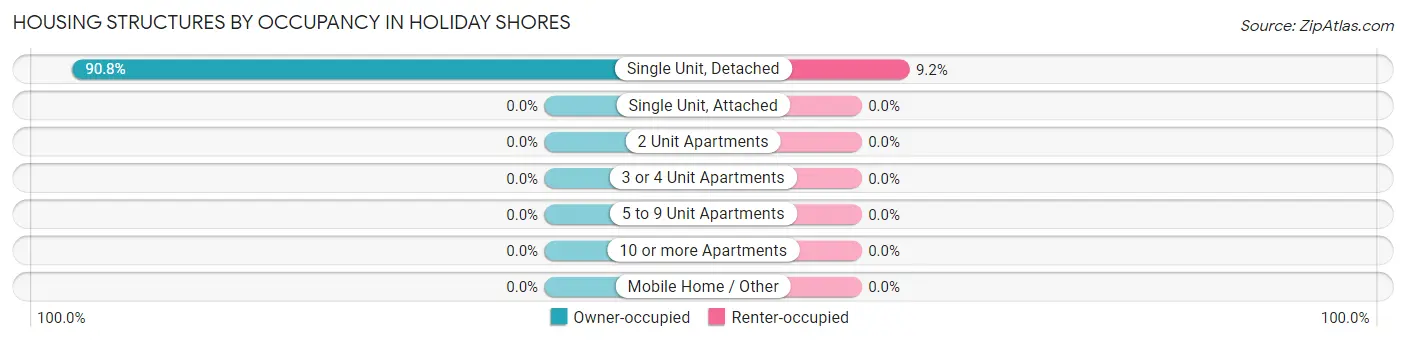
| Structure Type | Owner-occupied | Renter-occupied |
| Single Unit, Detached | 1,017 (90.8%) | 103 (9.2%) |
| Single Unit, Attached | 0 (0.0%) | 0 (0.0%) |
| 2 Unit Apartments | 0 (0.0%) | 0 (0.0%) |
| 3 or 4 Unit Apartments | 0 (0.0%) | 0 (0.0%) |
| 5 to 9 Unit Apartments | 0 (0.0%) | 0 (0.0%) |
| 10 or more Apartments | 0 (0.0%) | 0 (0.0%) |
| Mobile Home / Other | 0 (0.0%) | 0 (0.0%) |
| Total | 1,017 (90.8%) | 103 (9.2%) |
Housing Structures by Number of Rooms in Holiday Shores
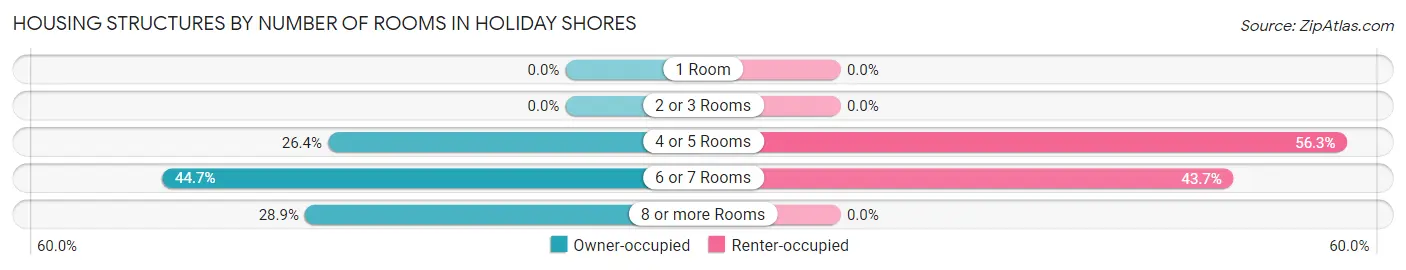
| Number of Rooms | Owner-occupied | Renter-occupied |
| 1 Room | 0 (0.0%) | 0 (0.0%) |
| 2 or 3 Rooms | 0 (0.0%) | 0 (0.0%) |
| 4 or 5 Rooms | 268 (26.4%) | 58 (56.3%) |
| 6 or 7 Rooms | 455 (44.7%) | 45 (43.7%) |
| 8 or more Rooms | 294 (28.9%) | 0 (0.0%) |
| Total | 1,017 (100.0%) | 103 (100.0%) |
Housing Structure by Heating Type in Holiday Shores
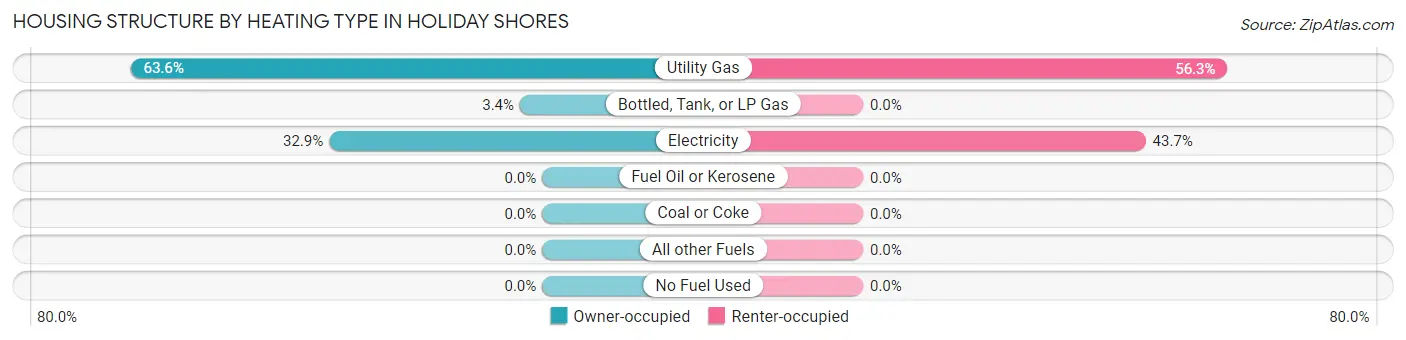
| Heating Type | Owner-occupied | Renter-occupied |
| Utility Gas | 647 (63.6%) | 58 (56.3%) |
| Bottled, Tank, or LP Gas | 35 (3.4%) | 0 (0.0%) |
| Electricity | 335 (32.9%) | 45 (43.7%) |
| Fuel Oil or Kerosene | 0 (0.0%) | 0 (0.0%) |
| Coal or Coke | 0 (0.0%) | 0 (0.0%) |
| All other Fuels | 0 (0.0%) | 0 (0.0%) |
| No Fuel Used | 0 (0.0%) | 0 (0.0%) |
| Total | 1,017 (100.0%) | 103 (100.0%) |
Household Vehicle Usage in Holiday Shores
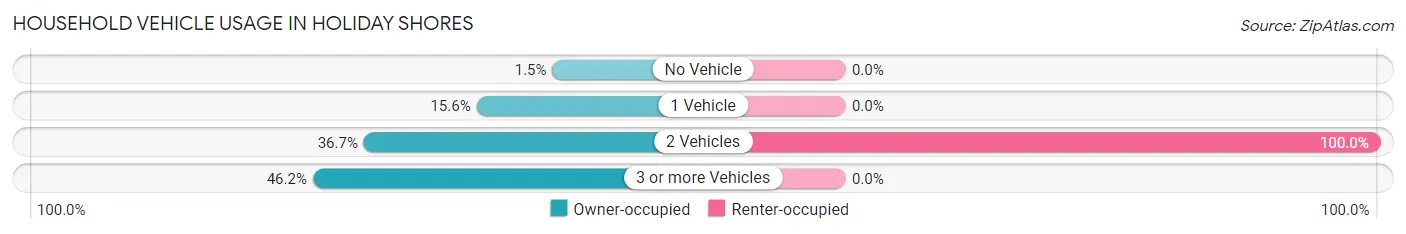
| Vehicles per Household | Owner-occupied | Renter-occupied |
| No Vehicle | 15 (1.5%) | 0 (0.0%) |
| 1 Vehicle | 159 (15.6%) | 0 (0.0%) |
| 2 Vehicles | 373 (36.7%) | 103 (100.0%) |
| 3 or more Vehicles | 470 (46.2%) | 0 (0.0%) |
| Total | 1,017 (100.0%) | 103 (100.0%) |
Real Estate & Mortgages in Holiday Shores
Real Estate and Mortgage Overview in Holiday Shores
| Characteristic | Without Mortgage | With Mortgage |
| Housing Units | 372 | 645 |
| Median Property Value | $181,500 | $213,000 |
| Median Household Income | $78,977 | $258 |
| Monthly Housing Costs | $663 | $54 |
| Real Estate Taxes | $4,021 | $0 |
Property Value by Mortgage Status in Holiday Shores
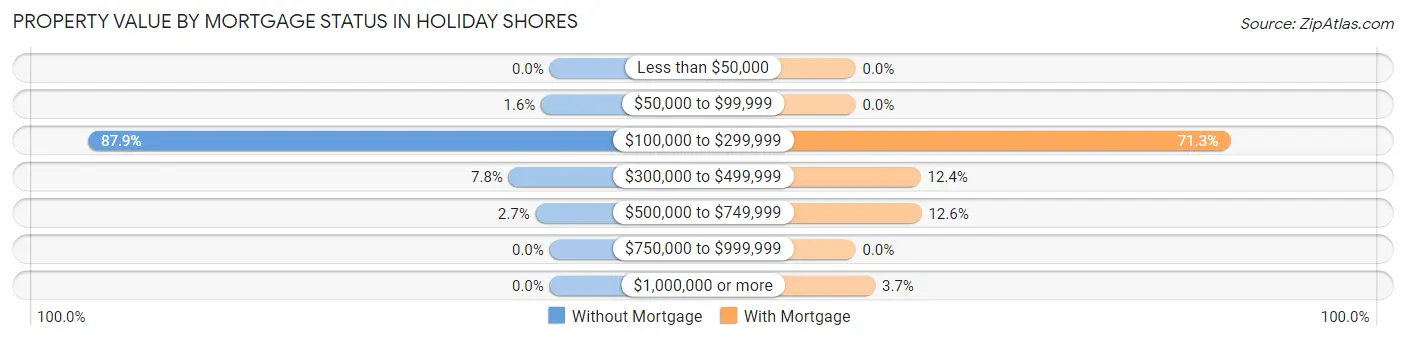
| Property Value | Without Mortgage | With Mortgage |
| Less than $50,000 | 0 (0.0%) | 0 (0.0%) |
| $50,000 to $99,999 | 6 (1.6%) | 0 (0.0%) |
| $100,000 to $299,999 | 327 (87.9%) | 460 (71.3%) |
| $300,000 to $499,999 | 29 (7.8%) | 80 (12.4%) |
| $500,000 to $749,999 | 10 (2.7%) | 81 (12.6%) |
| $750,000 to $999,999 | 0 (0.0%) | 0 (0.0%) |
| $1,000,000 or more | 0 (0.0%) | 24 (3.7%) |
| Total | 372 (100.0%) | 645 (100.0%) |
Household Income by Mortgage Status in Holiday Shores
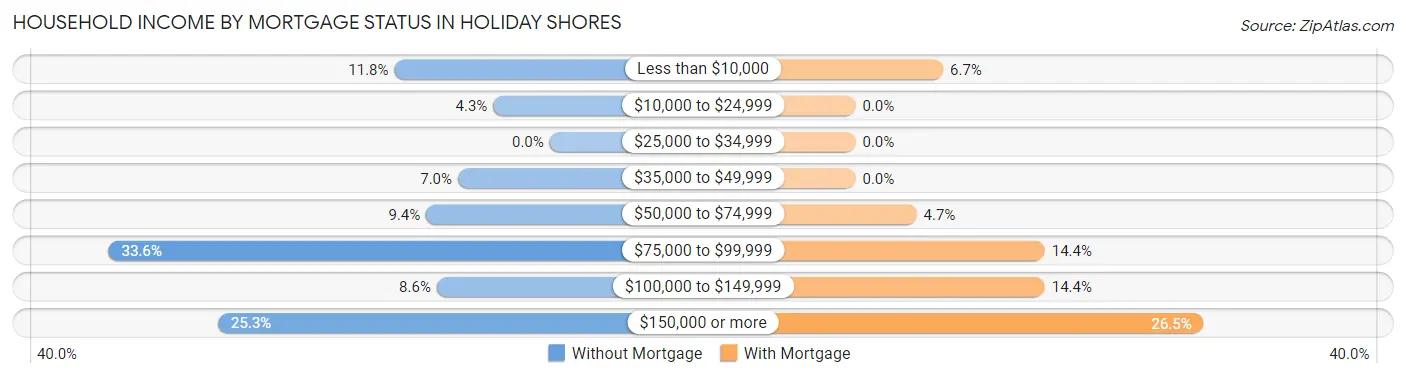
| Household Income | Without Mortgage | With Mortgage |
| Less than $10,000 | 44 (11.8%) | 43 (6.7%) |
| $10,000 to $24,999 | 16 (4.3%) | 0 (0.0%) |
| $25,000 to $34,999 | 0 (0.0%) | 0 (0.0%) |
| $35,000 to $49,999 | 26 (7.0%) | 0 (0.0%) |
| $50,000 to $74,999 | 35 (9.4%) | 30 (4.6%) |
| $75,000 to $99,999 | 125 (33.6%) | 93 (14.4%) |
| $100,000 to $149,999 | 32 (8.6%) | 93 (14.4%) |
| $150,000 or more | 94 (25.3%) | 171 (26.5%) |
| Total | 372 (100.0%) | 645 (100.0%) |
Property Value to Household Income Ratio in Holiday Shores
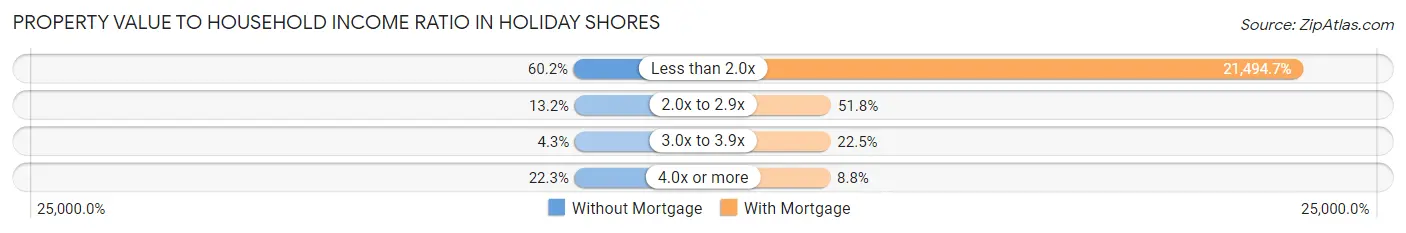
| Value-to-Income Ratio | Without Mortgage | With Mortgage |
| Less than 2.0x | 224 (60.2%) | 138,641 (21,494.7%) |
| 2.0x to 2.9x | 49 (13.2%) | 334 (51.8%) |
| 3.0x to 3.9x | 16 (4.3%) | 145 (22.5%) |
| 4.0x or more | 83 (22.3%) | 57 (8.8%) |
| Total | 372 (100.0%) | 645 (100.0%) |
Real Estate Taxes by Mortgage Status in Holiday Shores
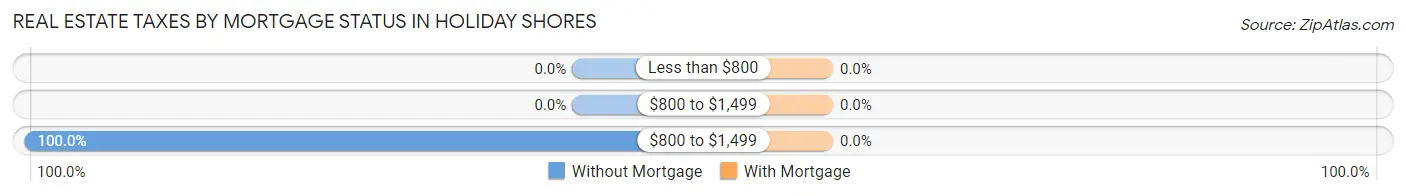
| Property Taxes | Without Mortgage | With Mortgage |
| Less than $800 | 0 (0.0%) | 0 (0.0%) |
| $800 to $1,499 | 0 (0.0%) | 0 (0.0%) |
| $800 to $1,499 | 372 (100.0%) | 0 (0.0%) |
| Total | 372 (100.0%) | 645 (100.0%) |
Health & Disability in Holiday Shores
Health Insurance Coverage by Age in Holiday Shores
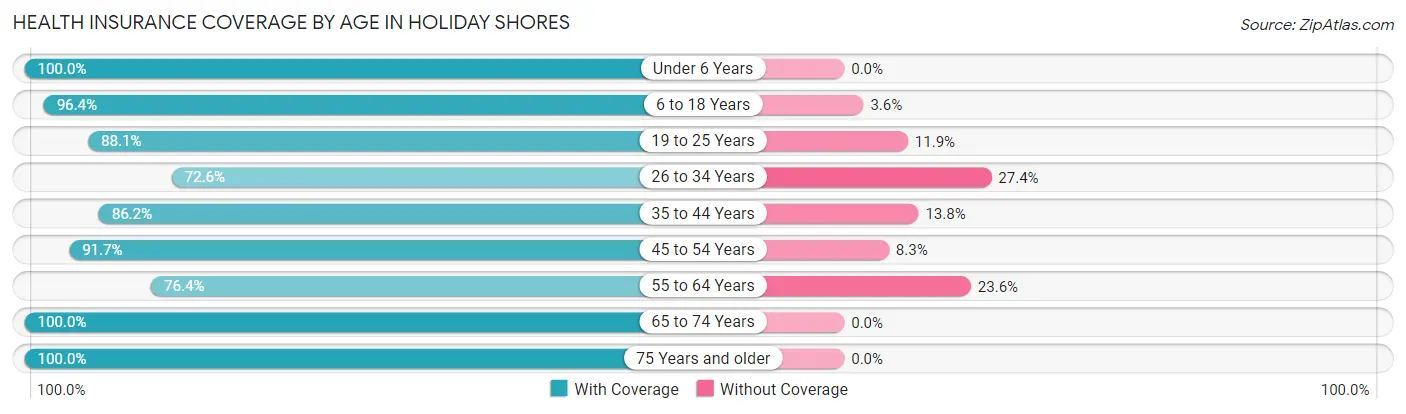
| Age Bracket | With Coverage | Without Coverage |
| Under 6 Years | 188 (100.0%) | 0 (0.0%) |
| 6 to 18 Years | 566 (96.4%) | 21 (3.6%) |
| 19 to 25 Years | 171 (88.1%) | 23 (11.9%) |
| 26 to 34 Years | 209 (72.6%) | 79 (27.4%) |
| 35 to 44 Years | 386 (86.2%) | 62 (13.8%) |
| 45 to 54 Years | 496 (91.7%) | 45 (8.3%) |
| 55 to 64 Years | 482 (76.4%) | 149 (23.6%) |
| 65 to 74 Years | 169 (100.0%) | 0 (0.0%) |
| 75 Years and older | 239 (100.0%) | 0 (0.0%) |
| Total | 2,906 (88.5%) | 379 (11.5%) |
Health Insurance Coverage by Citizenship Status in Holiday Shores
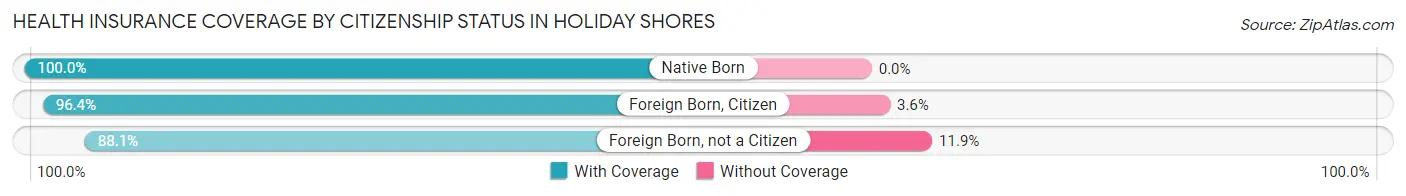
| Citizenship Status | With Coverage | Without Coverage |
| Native Born | 188 (100.0%) | 0 (0.0%) |
| Foreign Born, Citizen | 566 (96.4%) | 21 (3.6%) |
| Foreign Born, not a Citizen | 171 (88.1%) | 23 (11.9%) |
Health Insurance Coverage by Household Income in Holiday Shores
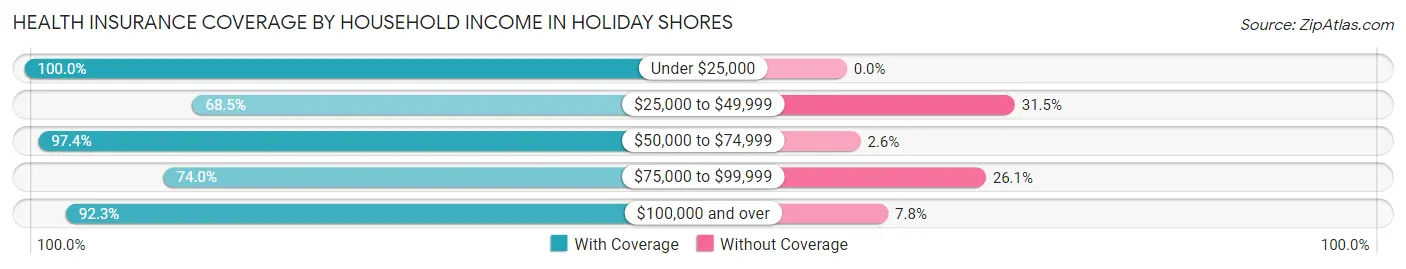
| Household Income | With Coverage | Without Coverage |
| Under $25,000 | 60 (100.0%) | 0 (0.0%) |
| $25,000 to $49,999 | 135 (68.5%) | 62 (31.5%) |
| $50,000 to $74,999 | 418 (97.4%) | 11 (2.6%) |
| $75,000 to $99,999 | 423 (74.0%) | 149 (26.1%) |
| $100,000 and over | 1,870 (92.2%) | 157 (7.7%) |
Public vs Private Health Insurance Coverage by Age in Holiday Shores
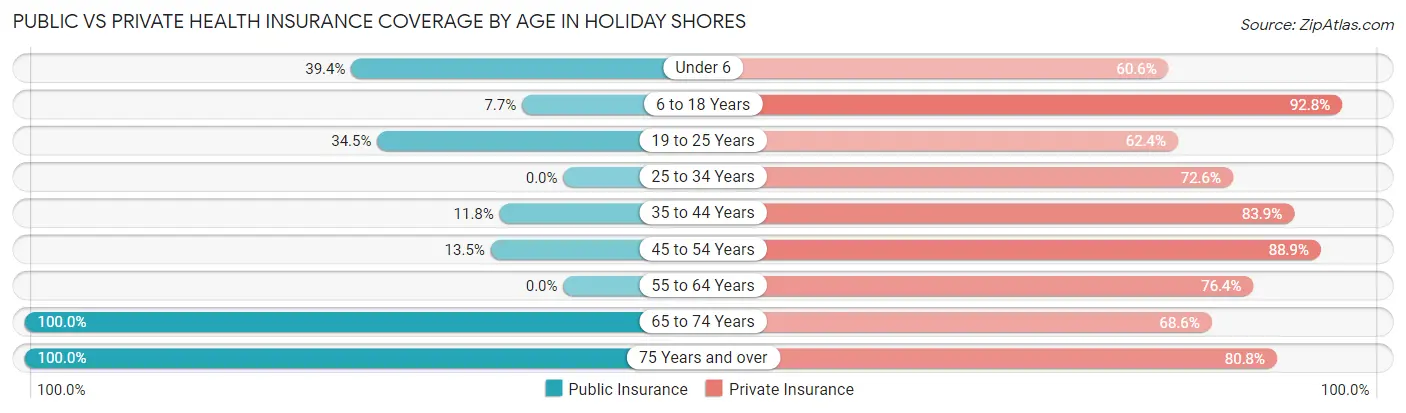
| Age Bracket | Public Insurance | Private Insurance |
| Under 6 | 74 (39.4%) | 114 (60.6%) |
| 6 to 18 Years | 45 (7.7%) | 545 (92.8%) |
| 19 to 25 Years | 67 (34.5%) | 121 (62.4%) |
| 25 to 34 Years | 0 (0.0%) | 209 (72.6%) |
| 35 to 44 Years | 53 (11.8%) | 376 (83.9%) |
| 45 to 54 Years | 73 (13.5%) | 481 (88.9%) |
| 55 to 64 Years | 0 (0.0%) | 482 (76.4%) |
| 65 to 74 Years | 169 (100.0%) | 116 (68.6%) |
| 75 Years and over | 239 (100.0%) | 193 (80.7%) |
| Total | 720 (21.9%) | 2,637 (80.3%) |
Disability Status by Sex by Age in Holiday Shores
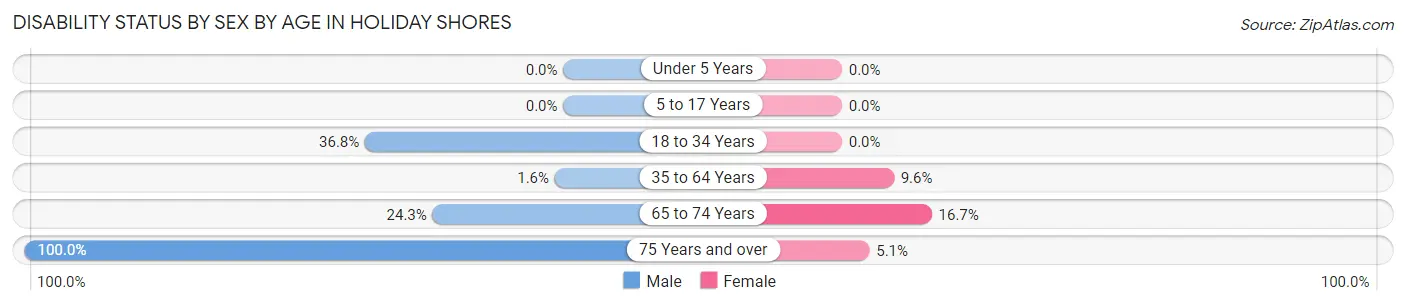
| Age Bracket | Male | Female |
| Under 5 Years | 0 (0.0%) | 0 (0.0%) |
| 5 to 17 Years | 0 (0.0%) | 0 (0.0%) |
| 18 to 34 Years | 85 (36.8%) | 0 (0.0%) |
| 35 to 64 Years | 15 (1.6%) | 64 (9.6%) |
| 65 to 74 Years | 25 (24.3%) | 11 (16.7%) |
| 75 Years and over | 43 (100.0%) | 10 (5.1%) |
Disability Class by Sex by Age in Holiday Shores
Disability Class: Hearing Difficulty
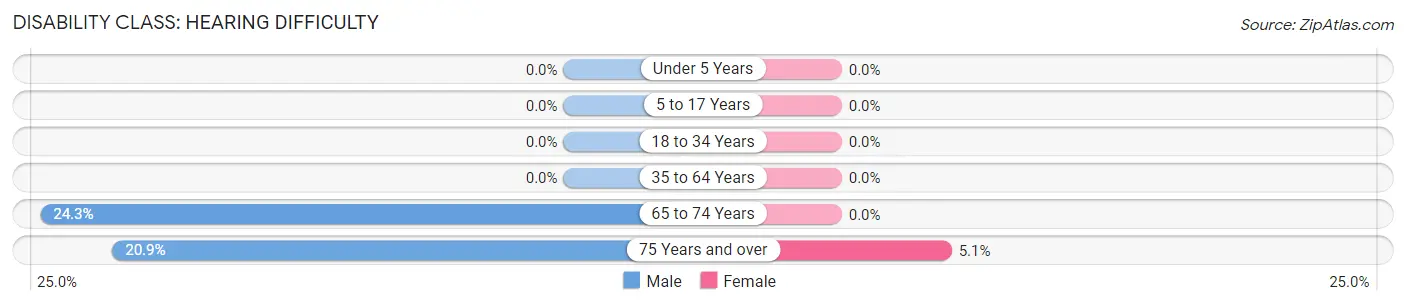
| Age Bracket | Male | Female |
| Under 5 Years | 0 (0.0%) | 0 (0.0%) |
| 5 to 17 Years | 0 (0.0%) | 0 (0.0%) |
| 18 to 34 Years | 0 (0.0%) | 0 (0.0%) |
| 35 to 64 Years | 0 (0.0%) | 0 (0.0%) |
| 65 to 74 Years | 25 (24.3%) | 0 (0.0%) |
| 75 Years and over | 9 (20.9%) | 10 (5.1%) |
Disability Class: Vision Difficulty
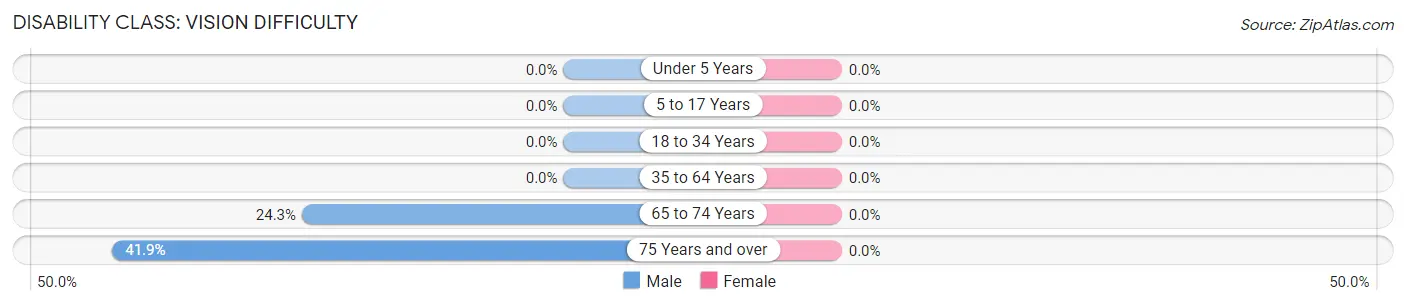
| Age Bracket | Male | Female |
| Under 5 Years | 0 (0.0%) | 0 (0.0%) |
| 5 to 17 Years | 0 (0.0%) | 0 (0.0%) |
| 18 to 34 Years | 0 (0.0%) | 0 (0.0%) |
| 35 to 64 Years | 0 (0.0%) | 0 (0.0%) |
| 65 to 74 Years | 25 (24.3%) | 0 (0.0%) |
| 75 Years and over | 18 (41.9%) | 0 (0.0%) |
Disability Class: Cognitive Difficulty
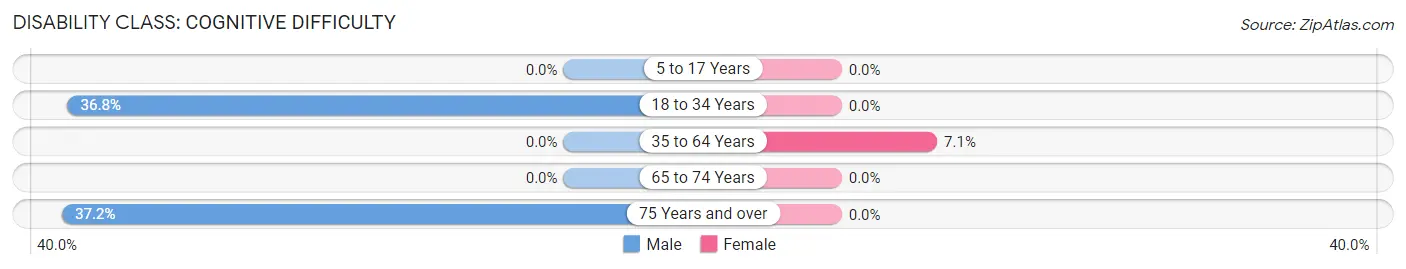
| Age Bracket | Male | Female |
| 5 to 17 Years | 0 (0.0%) | 0 (0.0%) |
| 18 to 34 Years | 85 (36.8%) | 0 (0.0%) |
| 35 to 64 Years | 0 (0.0%) | 47 (7.1%) |
| 65 to 74 Years | 0 (0.0%) | 0 (0.0%) |
| 75 Years and over | 16 (37.2%) | 0 (0.0%) |
Disability Class: Ambulatory Difficulty
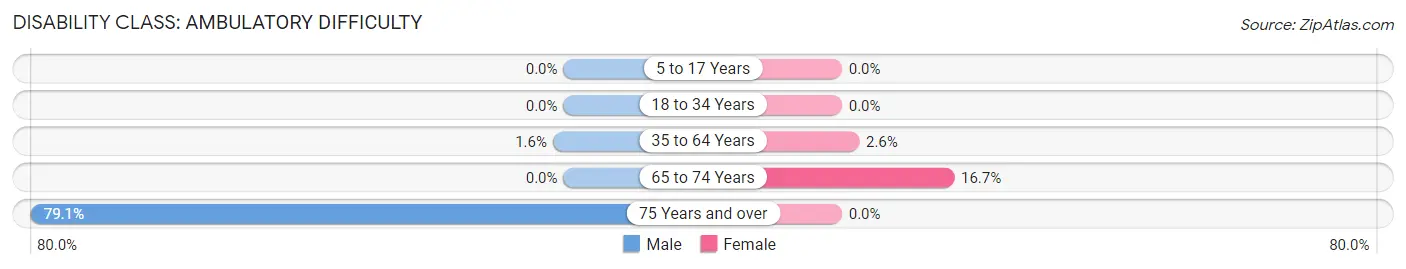
| Age Bracket | Male | Female |
| 5 to 17 Years | 0 (0.0%) | 0 (0.0%) |
| 18 to 34 Years | 0 (0.0%) | 0 (0.0%) |
| 35 to 64 Years | 15 (1.6%) | 17 (2.6%) |
| 65 to 74 Years | 0 (0.0%) | 11 (16.7%) |
| 75 Years and over | 34 (79.1%) | 0 (0.0%) |
Disability Class: Self-Care Difficulty
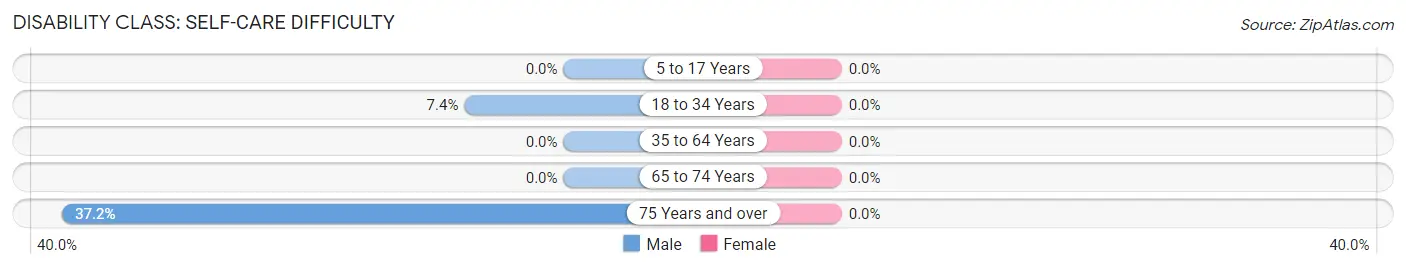
| Age Bracket | Male | Female |
| 5 to 17 Years | 0 (0.0%) | 0 (0.0%) |
| 18 to 34 Years | 17 (7.4%) | 0 (0.0%) |
| 35 to 64 Years | 0 (0.0%) | 0 (0.0%) |
| 65 to 74 Years | 0 (0.0%) | 0 (0.0%) |
| 75 Years and over | 16 (37.2%) | 0 (0.0%) |
Technology Access in Holiday Shores
Computing Device Access in Holiday Shores
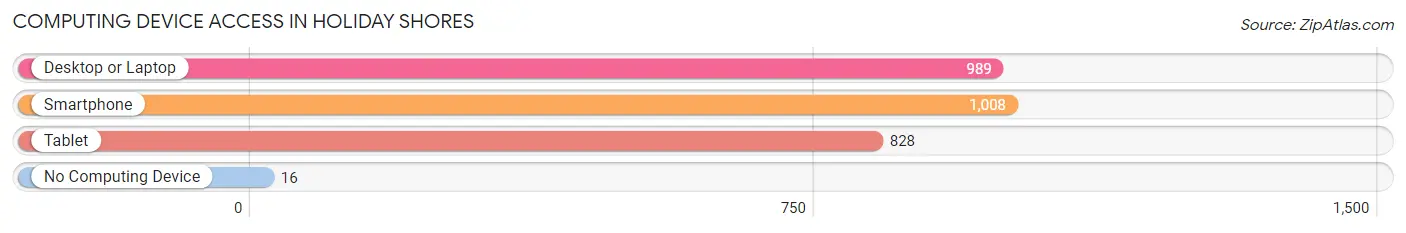
| Device Type | # Households | % Households |
| Desktop or Laptop | 989 | 88.3% |
| Smartphone | 1,008 | 90.0% |
| Tablet | 828 | 73.9% |
| No Computing Device | 16 | 1.4% |
| Total | 1,120 | 100.0% |
Internet Access in Holiday Shores
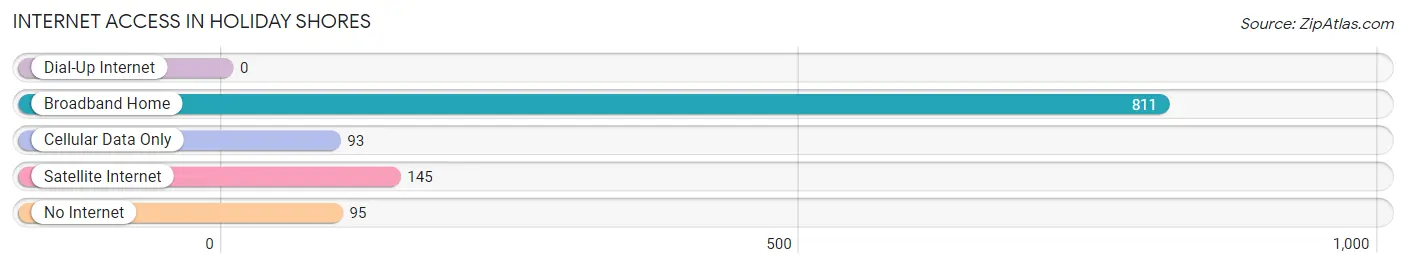
| Internet Type | # Households | % Households |
| Dial-Up Internet | 0 | 0.0% |
| Broadband Home | 811 | 72.4% |
| Cellular Data Only | 93 | 8.3% |
| Satellite Internet | 145 | 13.0% |
| No Internet | 95 | 8.5% |
| Total | 1,120 | 100.0% |
Holiday Shores Summary
Holiday Shores is a small unincorporated community located in Madison County, Illinois. It is situated on the banks of the Mississippi River, just south of the city of Alton. The population of Holiday Shores was estimated to be 1,845 in the year 2000.
History
Holiday Shores was first settled in the early 1800s by a group of German immigrants. The area was originally known as “Holland’s Landing”, named after the first settler, John Holland. The area was later renamed “Holiday Shores” in the late 1800s, after the holiday season.
The area was primarily used for farming and fishing until the early 1900s, when the first vacation homes began to be built. The area quickly became a popular destination for vacationers, and by the 1950s, Holiday Shores had become a popular summer resort.
Geography
Holiday Shores is located in Madison County, Illinois, on the banks of the Mississippi River. The area is bordered by the cities of Alton to the north, Godfrey to the east, and Wood River to the south. The area is mostly flat, with some rolling hills in the northern part of the community.
The climate in Holiday Shores is humid continental, with hot summers and cold winters. The average temperature in the summer is around 80 degrees Fahrenheit, and the average temperature in the winter is around 30 degrees Fahrenheit.
Economy
The economy of Holiday Shores is primarily based on tourism and recreation. The area is home to several resorts, campgrounds, and marinas, which attract visitors from all over the country. The area is also home to several restaurants, bars, and shops, which cater to the tourist population.
In addition to tourism, Holiday Shores is also home to several small businesses, including a grocery store, a hardware store, and a gas station. The area is also home to several manufacturing companies, which produce a variety of products, including furniture, clothing, and electronics.
Demographics
The population of Holiday Shores was estimated to be 1,845 in the year 2000. The population is primarily white (94.3%), with a small percentage of African Americans (2.3%), Hispanics (1.7%), and Asians (1.7%). The median household income in Holiday Shores is $45,000, and the median home value is $150,000.
The majority of the population (90%) is employed in the service industry, with the remaining 10% employed in manufacturing, retail, and other industries. The unemployment rate in Holiday Shores is 4.2%, which is slightly lower than the national average.
Conclusion
Holiday Shores is a small unincorporated community located in Madison County, Illinois. It is situated on the banks of the Mississippi River, just south of the city of Alton. The population of Holiday Shores was estimated to be 1,845 in the year 2000. The economy of Holiday Shores is primarily based on tourism and recreation, and the population is primarily white. The median household income in Holiday Shores is $45,000, and the median home value is $150,000.
Common Questions
What is Per Capita Income in Holiday Shores?
Per Capita income in Holiday Shores is $42,770.
What is the Median Family Income in Holiday Shores?
Median Family Income in Holiday Shores is $126,691.
What is the Median Household income in Holiday Shores?
Median Household Income in Holiday Shores is $97,366.
What is Income or Wage Gap in Holiday Shores?
Income or Wage Gap in Holiday Shores is 31.2%.
Women in Holiday Shores earn 68.8 cents for every dollar earned by a man.
What is Inequality or Gini Index in Holiday Shores?
Inequality or Gini Index in Holiday Shores is 0.34.
What is the Total Population of Holiday Shores?
Total Population of Holiday Shores is 3,285.
What is the Total Male Population of Holiday Shores?
Total Male Population of Holiday Shores is 1,771.
What is the Total Female Population of Holiday Shores?
Total Female Population of Holiday Shores is 1,514.
What is the Ratio of Males per 100 Females in Holiday Shores?
There are 116.97 Males per 100 Females in Holiday Shores.
What is the Ratio of Females per 100 Males in Holiday Shores?
There are 85.49 Females per 100 Males in Holiday Shores.
What is the Median Population Age in Holiday Shores?
Median Population Age in Holiday Shores is 42.7 Years.
What is the Average Family Size in Holiday Shores
Average Family Size in Holiday Shores is 3.2 People.
What is the Average Household Size in Holiday Shores
Average Household Size in Holiday Shores is 2.9 People.
How Large is the Labor Force in Holiday Shores?
There are 2,001 People in the Labor Forcein in Holiday Shores.
What is the Percentage of People in the Labor Force in Holiday Shores?
75.7% of People are in the Labor Force in Holiday Shores.
What is the Unemployment Rate in Holiday Shores?
Unemployment Rate in Holiday Shores is 7.3%.