Cities with the Highest Percentage of Sri Lankan Population in Michigan
RELATED REPORTS & OPTIONS
Sri Lankan
Michigan
Compare Cities
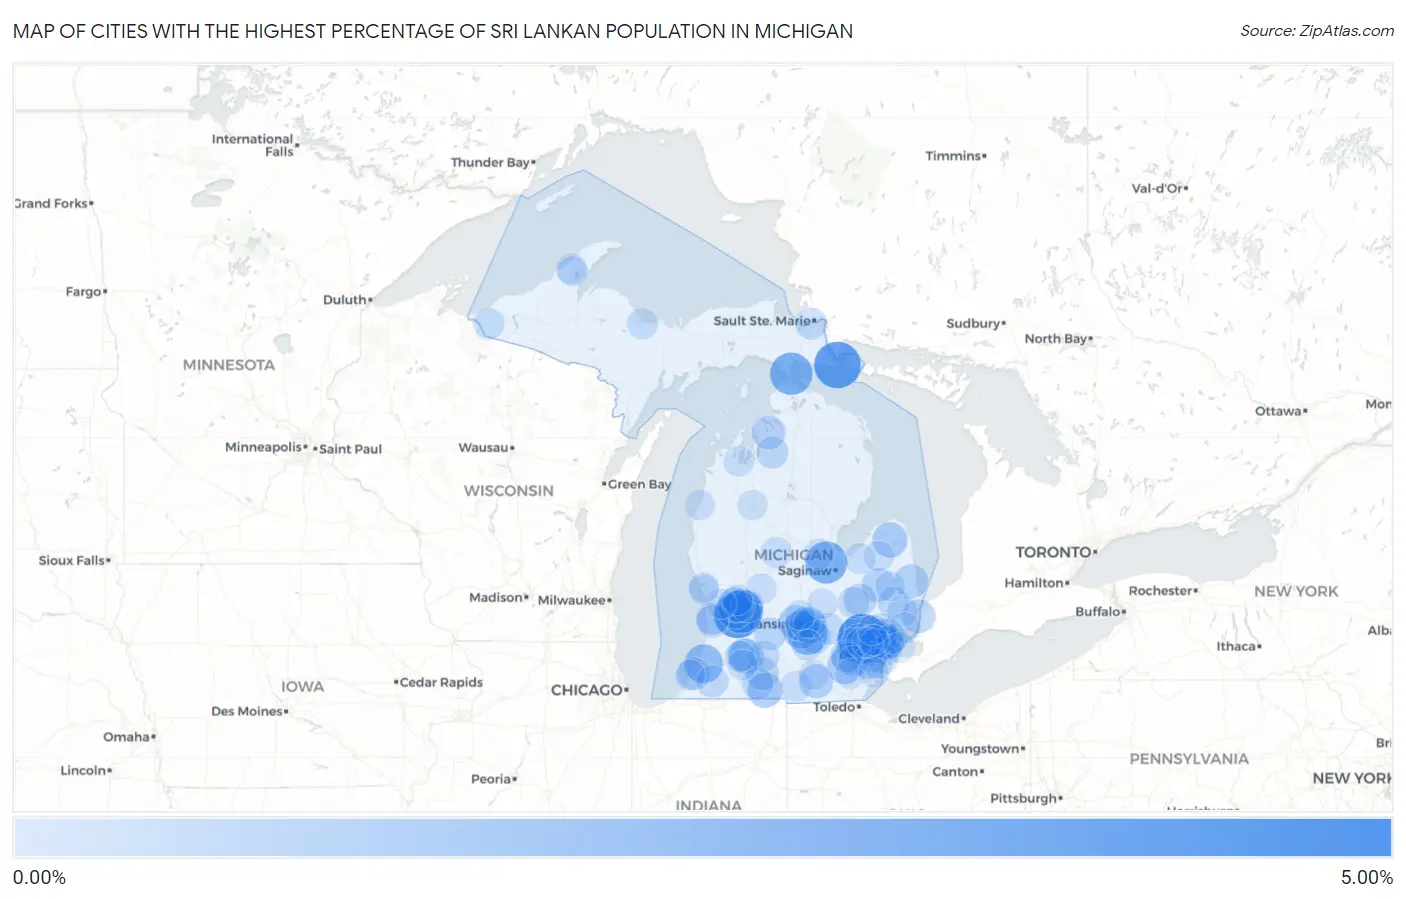
Map of Cities with the Highest Percentage of Sri Lankan Population in Michigan
0.00%
5.00%
Cities with the Highest Percentage of Sri Lankan Population in Michigan
| City | Sri Lankan | vs State | vs National | |
| 1. | Walled Lake | 4.14% | 0.24%(+3.90)#1 | 0.68%(+3.47)#222 |
| 2. | Cutlerville | 3.55% | 0.24%(+3.31)#2 | 0.68%(+2.87)#295 |
| 3. | De Tour Village | 3.54% | 0.24%(+3.30)#3 | 0.68%(+2.86)#298 |
| 4. | Kentwood | 2.89% | 0.24%(+2.65)#4 | 0.68%(+2.21)#411 |
| 5. | St Ignace | 2.64% | 0.24%(+2.40)#5 | 0.68%(+1.96)#468 |
| 6. | Freeland | 2.57% | 0.24%(+2.33)#6 | 0.68%(+1.89)#480 |
| 7. | Mason | 2.08% | 0.24%(+1.84)#7 | 0.68%(+1.40)#650 |
| 8. | Paw Paw Lake | 1.87% | 0.24%(+1.63)#8 | 0.68%(+1.19)#748 |
| 9. | Holt | 1.52% | 0.24%(+1.28)#9 | 0.68%(+0.843)#985 |
| 10. | Oak Park | 1.31% | 0.24%(+1.07)#10 | 0.68%(+0.634)#1,175 |
| 11. | Bronson | 1.26% | 0.24%(+1.01)#11 | 0.68%(+0.577)#1,250 |
| 12. | Saline | 1.25% | 0.24%(+1.01)#12 | 0.68%(+0.570)#1,261 |
| 13. | Bad Axe | 1.19% | 0.24%(+0.949)#13 | 0.68%(+0.512)#1,326 |
| 14. | Comstock Northwest | 1.19% | 0.24%(+0.948)#14 | 0.68%(+0.510)#1,328 |
| 15. | Wyoming | 1.12% | 0.24%(+0.880)#15 | 0.68%(+0.442)#1,403 |
| 16. | Waverly | 1.11% | 0.24%(+0.868)#16 | 0.68%(+0.430)#1,420 |
| 17. | Walker | 1.08% | 0.24%(+0.840)#17 | 0.68%(+0.402)#1,452 |
| 18. | Okemos | 1.05% | 0.24%(+0.812)#18 | 0.68%(+0.374)#1,498 |
| 19. | Madison Heights | 1.01% | 0.24%(+0.772)#19 | 0.68%(+0.335)#1,546 |
| 20. | Northville | 0.97% | 0.24%(+0.728)#20 | 0.68%(+0.291)#1,609 |
| 21. | Manitou Beach Devils Lake | 0.94% | 0.24%(+0.700)#21 | 0.68%(+0.262)#1,659 |
| 22. | Croswell | 0.92% | 0.24%(+0.676)#22 | 0.68%(+0.239)#1,711 |
| 23. | North Branch | 0.90% | 0.24%(+0.660)#23 | 0.68%(+0.222)#1,745 |
| 24. | East Jordan | 0.85% | 0.24%(+0.612)#24 | 0.68%(+0.174)#1,817 |
| 25. | South Lyon | 0.85% | 0.24%(+0.607)#25 | 0.68%(+0.170)#1,824 |
| 26. | St Clair | 0.84% | 0.24%(+0.596)#26 | 0.68%(+0.158)#1,849 |
| 27. | Romulus | 0.81% | 0.24%(+0.569)#27 | 0.68%(+0.132)#1,906 |
| 28. | Warren | 0.75% | 0.24%(+0.507)#28 | 0.68%(+0.069)#2,039 |
| 29. | Athens | 0.73% | 0.24%(+0.484)#29 | 0.68%(+0.047)#2,088 |
| 30. | Davison | 0.68% | 0.24%(+0.443)#30 | 0.68%(+0.006)#2,204 |
| 31. | Lansing | 0.68% | 0.24%(+0.441)#31 | 0.68%(+0.004)#2,211 |
| 32. | Troy | 0.66% | 0.24%(+0.421)#32 | 0.68%(-0.017)#2,272 |
| 33. | Fair Plain | 0.65% | 0.24%(+0.413)#33 | 0.68%(-0.025)#2,283 |
| 34. | Sterling Heights | 0.65% | 0.24%(+0.409)#34 | 0.68%(-0.029)#2,296 |
| 35. | Parchment | 0.64% | 0.24%(+0.396)#35 | 0.68%(-0.042)#2,334 |
| 36. | Center Line | 0.64% | 0.24%(+0.395)#36 | 0.68%(-0.043)#2,337 |
| 37. | Nashville | 0.63% | 0.24%(+0.384)#37 | 0.68%(-0.053)#2,368 |
| 38. | Clawson | 0.62% | 0.24%(+0.383)#38 | 0.68%(-0.055)#2,374 |
| 39. | Holland | 0.62% | 0.24%(+0.376)#39 | 0.68%(-0.061)#2,388 |
| 40. | Beechwood | 0.61% | 0.24%(+0.366)#40 | 0.68%(-0.072)#2,415 |
| 41. | Forest Hills | 0.59% | 0.24%(+0.354)#41 | 0.68%(-0.084)#2,451 |
| 42. | Dansville | 0.57% | 0.24%(+0.325)#42 | 0.68%(-0.112)#2,533 |
| 43. | Mancelona | 0.55% | 0.24%(+0.314)#43 | 0.68%(-0.124)#2,569 |
| 44. | Sault Ste Marie | 0.53% | 0.24%(+0.289)#44 | 0.68%(-0.149)#2,646 |
| 45. | Dowagiac | 0.53% | 0.24%(+0.287)#45 | 0.68%(-0.150)#2,652 |
| 46. | Capac | 0.52% | 0.24%(+0.280)#46 | 0.68%(-0.158)#2,679 |
| 47. | Livonia | 0.51% | 0.24%(+0.272)#47 | 0.68%(-0.165)#2,707 |
| 48. | Wixom | 0.51% | 0.24%(+0.271)#48 | 0.68%(-0.167)#2,711 |
| 49. | Colon | 0.50% | 0.24%(+0.262)#49 | 0.68%(-0.175)#2,739 |
| 50. | Ann Arbor | 0.50% | 0.24%(+0.260)#50 | 0.68%(-0.178)#2,749 |
| 51. | Grand Rapids | 0.49% | 0.24%(+0.252)#51 | 0.68%(-0.185)#2,777 |
| 52. | Burton | 0.46% | 0.24%(+0.216)#52 | 0.68%(-0.222)#2,907 |
| 53. | Barton Hills | 0.45% | 0.24%(+0.210)#53 | 0.68%(-0.228)#2,933 |
| 54. | Fowlerville | 0.44% | 0.24%(+0.200)#54 | 0.68%(-0.238)#2,967 |
| 55. | Haslett | 0.43% | 0.24%(+0.194)#55 | 0.68%(-0.244)#2,993 |
| 56. | Bessemer | 0.41% | 0.24%(+0.169)#56 | 0.68%(-0.269)#3,104 |
| 57. | Battle Creek | 0.41% | 0.24%(+0.165)#57 | 0.68%(-0.273)#3,126 |
| 58. | Lake Isabella | 0.39% | 0.24%(+0.146)#58 | 0.68%(-0.291)#3,221 |
| 59. | Harvey | 0.36% | 0.24%(+0.119)#59 | 0.68%(-0.319)#3,346 |
| 60. | East Lansing | 0.36% | 0.24%(+0.118)#60 | 0.68%(-0.319)#3,348 |
| 61. | Rochester Hills | 0.36% | 0.24%(+0.115)#61 | 0.68%(-0.322)#3,371 |
| 62. | Memphis | 0.35% | 0.24%(+0.107)#62 | 0.68%(-0.331)#3,422 |
| 63. | River Rouge | 0.35% | 0.24%(+0.106)#63 | 0.68%(-0.331)#3,423 |
| 64. | Westwood | 0.34% | 0.24%(+0.103)#64 | 0.68%(-0.335)#3,433 |
| 65. | Leslie | 0.32% | 0.24%(+0.084)#65 | 0.68%(-0.354)#3,529 |
| 66. | Ypsilanti | 0.32% | 0.24%(+0.081)#66 | 0.68%(-0.357)#3,543 |
| 67. | Hillsdale | 0.31% | 0.24%(+0.071)#67 | 0.68%(-0.366)#3,588 |
| 68. | Akron | 0.30% | 0.24%(+0.062)#68 | 0.68%(-0.375)#3,639 |
| 69. | Franklin | 0.30% | 0.24%(+0.061)#69 | 0.68%(-0.377)#3,646 |
| 70. | Inkster | 0.30% | 0.24%(+0.057)#70 | 0.68%(-0.380)#3,660 |
| 71. | New Baltimore | 0.30% | 0.24%(+0.057)#71 | 0.68%(-0.381)#3,664 |
| 72. | Greenville | 0.29% | 0.24%(+0.052)#72 | 0.68%(-0.385)#3,690 |
| 73. | Hancock | 0.29% | 0.24%(+0.046)#73 | 0.68%(-0.391)#3,712 |
| 74. | Greilickville | 0.27% | 0.24%(+0.032)#74 | 0.68%(-0.406)#3,791 |
| 75. | Hamtramck | 0.27% | 0.24%(+0.025)#75 | 0.68%(-0.413)#3,832 |
| 76. | Cass City | 0.26% | 0.24%(+0.023)#76 | 0.68%(-0.415)#3,844 |
| 77. | Owosso | 0.25% | 0.24%(+0.011)#77 | 0.68%(-0.426)#3,916 |
| 78. | Southgate | 0.25% | 0.24%(+0.006)#78 | 0.68%(-0.431)#3,945 |
| 79. | Comstock Park | 0.24% | 0.24%(-0.000)#79 | 0.68%(-0.438)#3,980 |
| 80. | Cadillac | 0.24% | 0.24%(-0.001)#80 | 0.68%(-0.438)#3,985 |
| 81. | Novi | 0.24% | 0.24%(-0.003)#81 | 0.68%(-0.440)#3,997 |
| 82. | Midland | 0.23% | 0.24%(-0.007)#82 | 0.68%(-0.445)#4,017 |
| 83. | Norton Shores | 0.23% | 0.24%(-0.009)#83 | 0.68%(-0.446)#4,025 |
| 84. | Portage | 0.23% | 0.24%(-0.014)#84 | 0.68%(-0.452)#4,067 |
| 85. | Shoreham | 0.22% | 0.24%(-0.024)#85 | 0.68%(-0.461)#4,133 |
| 86. | Allendale | 0.21% | 0.24%(-0.027)#86 | 0.68%(-0.464)#4,157 |
| 87. | Milan | 0.21% | 0.24%(-0.030)#87 | 0.68%(-0.467)#4,180 |
| 88. | Southfield | 0.20% | 0.24%(-0.037)#88 | 0.68%(-0.475)#4,228 |
| 89. | Roosevelt Park | 0.19% | 0.24%(-0.048)#89 | 0.68%(-0.485)#4,287 |
| 90. | Houghton | 0.19% | 0.24%(-0.048)#90 | 0.68%(-0.486)#4,290 |
| 91. | Manistee | 0.19% | 0.24%(-0.049)#91 | 0.68%(-0.486)#4,299 |
| 92. | Village Of Grosse Pointe Shores | 0.19% | 0.24%(-0.049)#92 | 0.68%(-0.487)#4,302 |
| 93. | Flat Rock | 0.19% | 0.24%(-0.049)#93 | 0.68%(-0.487)#4,303 |
| 94. | Bingham Farms | 0.18% | 0.24%(-0.056)#94 | 0.68%(-0.494)#4,346 |
| 95. | Fraser | 0.18% | 0.24%(-0.057)#95 | 0.68%(-0.494)#4,352 |
| 96. | Cement City | 0.18% | 0.24%(-0.059)#96 | 0.68%(-0.497)#4,374 |
| 97. | Farmington Hills | 0.18% | 0.24%(-0.061)#97 | 0.68%(-0.499)#4,392 |
| 98. | Brown City | 0.18% | 0.24%(-0.064)#98 | 0.68%(-0.502)#4,412 |
| 99. | Pontiac | 0.17% | 0.24%(-0.070)#99 | 0.68%(-0.507)#4,461 |
| 100. | Dewitt | 0.17% | 0.24%(-0.074)#100 | 0.68%(-0.511)#4,497 |
Common Questions
What are the Top 10 Cities with the Highest Percentage of Sri Lankan Population in Michigan?
Top 10 Cities with the Highest Percentage of Sri Lankan Population in Michigan are:
#1
4.14%
#2
3.55%
#3
3.54%
#4
2.89%
#5
2.64%
#6
2.57%
#7
2.08%
#8
1.87%
#9
1.52%
#10
1.31%
What city has the Highest Percentage of Sri Lankan Population in Michigan?
Walled Lake has the Highest Percentage of Sri Lankan Population in Michigan with 4.14%.
What is the Percentage of Sri Lankan Population in the State of Michigan?
Percentage of Sri Lankan Population in Michigan is 0.24%.
What is the Percentage of Sri Lankan Population in the United States?
Percentage of Sri Lankan Population in the United States is 0.68%.