Hummelstown borough, PA Map & Demographics
Hummelstown borough Overview
$51,411
PER CAPITA INCOME
$123,150
AVG FAMILY INCOME
$53,203
AVG HOUSEHOLD INCOME
34.7%
WAGE / INCOME GAP [ % ]
65.3¢/ $1
WAGE / INCOME GAP [ $ ]
0.56
INEQUALITY / GINI INDEX
4,536
TOTAL POPULATION
2,073
MALE POPULATION
2,463
FEMALE POPULATION
84.17
MALES / 100 FEMALES
118.81
FEMALES / 100 MALES
37.4
MEDIAN AGE
2.9
AVG FAMILY SIZE
2.0
AVG HOUSEHOLD SIZE
2,985
LABOR FORCE [ PEOPLE ]
81.5%
PERCENT IN LABOR FORCE
3.5%
UNEMPLOYMENT RATE
Income in Hummelstown borough
Income Overview in Hummelstown borough
Per Capita Income in Hummelstown borough is $51,411, while median incomes of families and households are $123,150 and $53,203 respectively.
| Characteristic | Number | Measure |
| Per Capita Income | 4,536 | $51,411 |
| Median Family Income | 1,052 | $123,150 |
| Mean Family Income | 1,052 | $168,895 |
| Median Household Income | 2,251 | $53,203 |
| Mean Household Income | 2,251 | $104,874 |
| Income Deficit | 1,052 | $0 |
| Wage / Income Gap (%) | 4,536 | 34.74% |
| Wage / Income Gap ($) | 4,536 | 65.26¢ per $1 |
| Gini / Inequality Index | 4,536 | 0.56 |
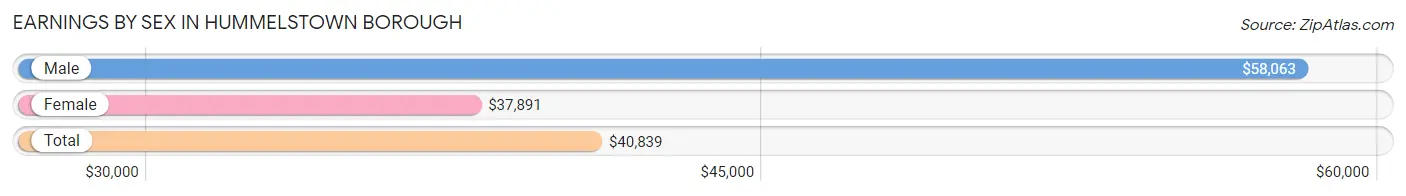
Earnings by Sex in Hummelstown borough
Average Earnings in Hummelstown borough are $40,839, $58,063 for men and $37,891 for women, a difference of 34.7%.
| Sex | Number | Average Earnings |
| Male | 1,230 (41.1%) | $58,063 |
| Female | 1,761 (58.9%) | $37,891 |
| Total | 2,991 (100.0%) | $40,839 |
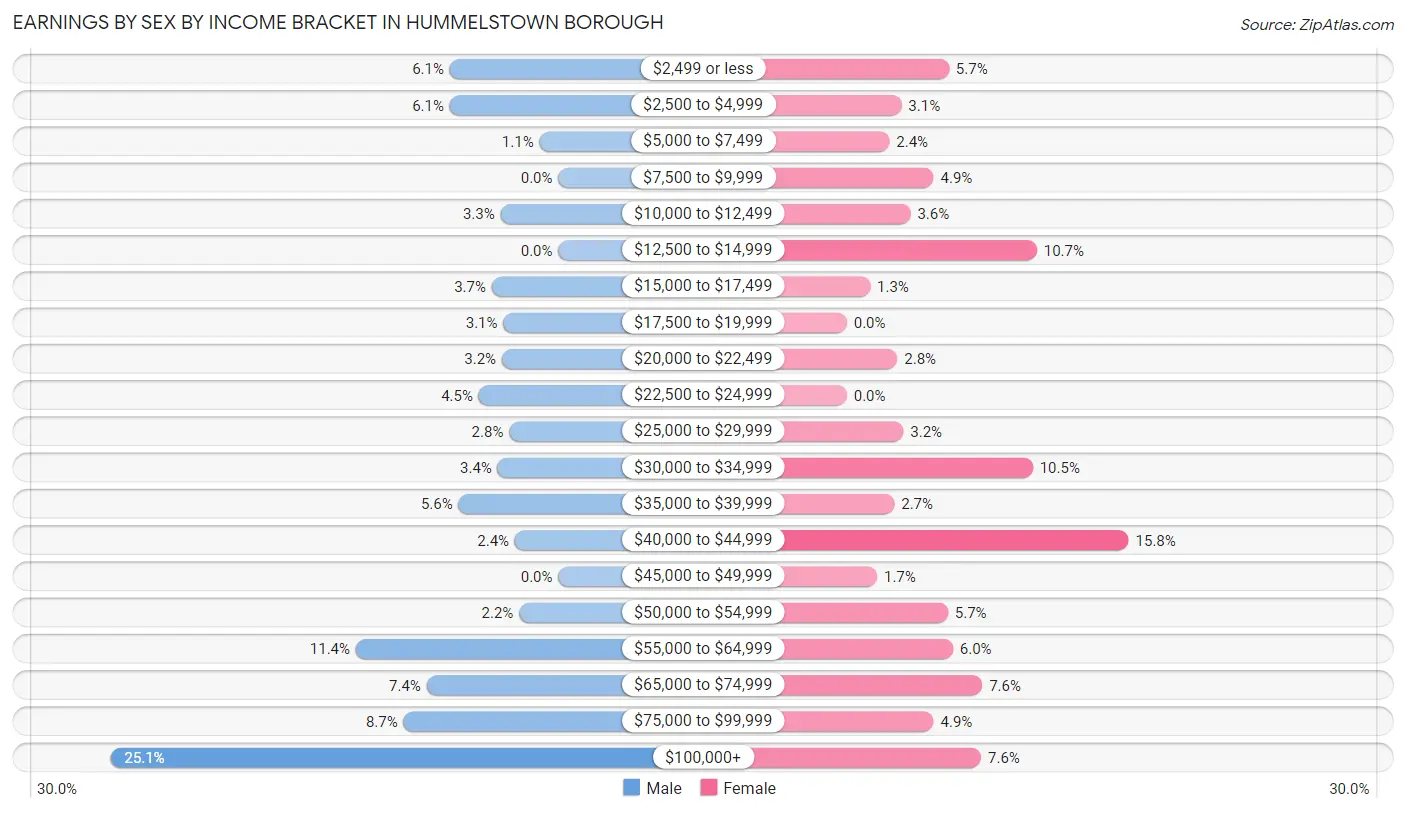
Earnings by Sex by Income Bracket in Hummelstown borough
The most common earnings brackets in Hummelstown borough are $100,000+ for men (309 | 25.1%) and $40,000 to $44,999 for women (279 | 15.8%).
| Income | Male | Female |
| $2,499 or less | 75 (6.1%) | 101 (5.7%) |
| $2,500 to $4,999 | 75 (6.1%) | 54 (3.1%) |
| $5,000 to $7,499 | 13 (1.1%) | 42 (2.4%) |
| $7,500 to $9,999 | 0 (0.0%) | 86 (4.9%) |
| $10,000 to $12,499 | 40 (3.3%) | 63 (3.6%) |
| $12,500 to $14,999 | 0 (0.0%) | 188 (10.7%) |
| $15,000 to $17,499 | 46 (3.7%) | 23 (1.3%) |
| $17,500 to $19,999 | 38 (3.1%) | 0 (0.0%) |
| $20,000 to $22,499 | 39 (3.2%) | 50 (2.8%) |
| $22,500 to $24,999 | 55 (4.5%) | 0 (0.0%) |
| $25,000 to $29,999 | 34 (2.8%) | 56 (3.2%) |
| $30,000 to $34,999 | 42 (3.4%) | 184 (10.4%) |
| $35,000 to $39,999 | 69 (5.6%) | 47 (2.7%) |
| $40,000 to $44,999 | 30 (2.4%) | 279 (15.8%) |
| $45,000 to $49,999 | 0 (0.0%) | 30 (1.7%) |
| $50,000 to $54,999 | 27 (2.2%) | 100 (5.7%) |
| $55,000 to $64,999 | 140 (11.4%) | 105 (6.0%) |
| $65,000 to $74,999 | 91 (7.4%) | 134 (7.6%) |
| $75,000 to $99,999 | 107 (8.7%) | 86 (4.9%) |
| $100,000+ | 309 (25.1%) | 133 (7.5%) |
| Total | 1,230 (100.0%) | 1,761 (100.0%) |
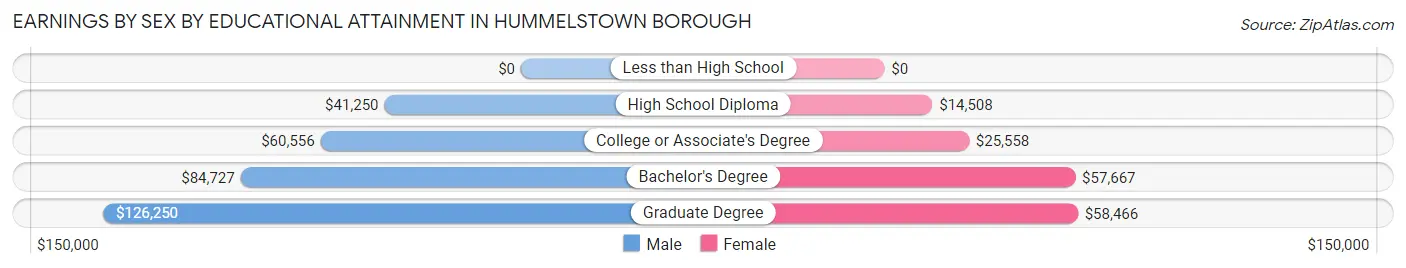
Earnings by Sex by Educational Attainment in Hummelstown borough
Average earnings in Hummelstown borough are $62,774 for men and $35,484 for women, a difference of 43.5%. Men with an educational attainment of graduate degree enjoy the highest average annual earnings of $126,250, while those with high school diploma education earn the least with $41,250. Women with an educational attainment of graduate degree earn the most with the average annual earnings of $58,466, while those with high school diploma education have the smallest earnings of $14,508.
| Educational Attainment | Male Income | Female Income |
| Less than High School | - | - |
| High School Diploma | $41,250 | $14,508 |
| College or Associate's Degree | $60,556 | $25,558 |
| Bachelor's Degree | $84,727 | $57,667 |
| Graduate Degree | $126,250 | $58,466 |
| Total | $62,774 | $35,484 |
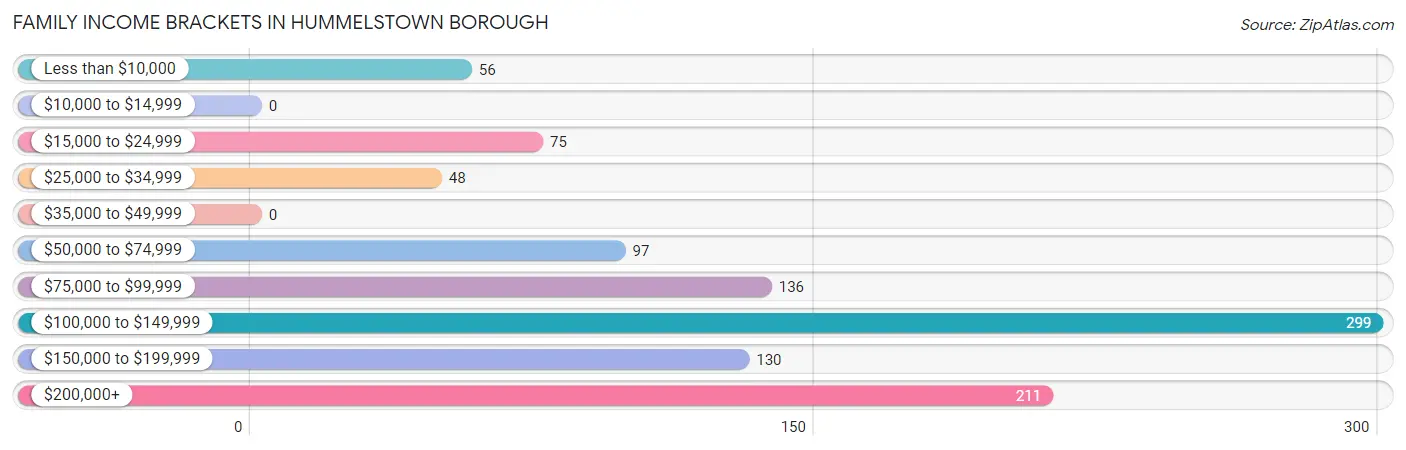
Family Income in Hummelstown borough
Family Income Brackets in Hummelstown borough
According to the Hummelstown borough family income data, there are 299 families falling into the $100,000 to $149,999 income range, which is the most common income bracket and makes up 28.4% of all families.
| Income Bracket | # Families | % Families |
| Less than $10,000 | 56 | 5.3% |
| $10,000 to $14,999 | 0 | 0.0% |
| $15,000 to $24,999 | 75 | 7.1% |
| $25,000 to $34,999 | 48 | 4.6% |
| $35,000 to $49,999 | 0 | 0.0% |
| $50,000 to $74,999 | 97 | 9.2% |
| $75,000 to $99,999 | 136 | 12.9% |
| $100,000 to $149,999 | 299 | 28.4% |
| $150,000 to $199,999 | 130 | 12.4% |
| $200,000+ | 211 | 20.1% |
Family Income by Famaliy Size in Hummelstown borough
5-person families (133 | 12.6%) account for the highest median family income in Hummelstown borough with $134,759 per family, while 2-person families (454 | 43.2%) have the highest median income of $53,125 per family member.
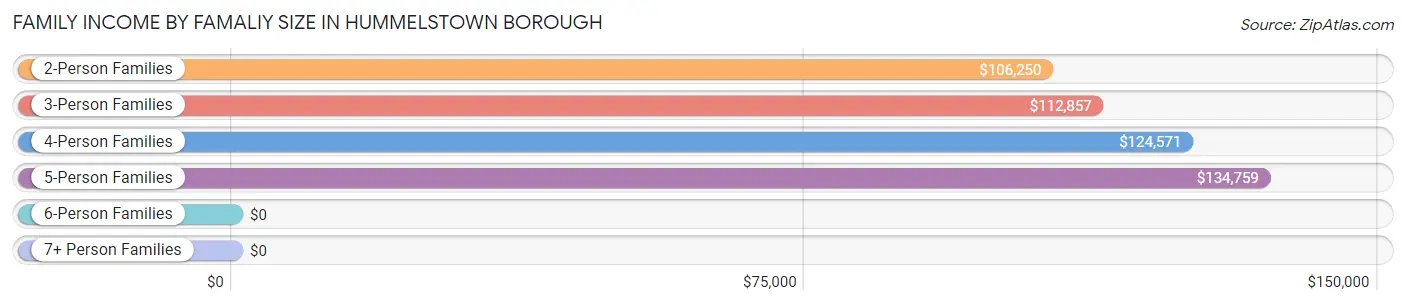
| Income Bracket | # Families | Median Income |
| 2-Person Families | 454 (43.2%) | $106,250 |
| 3-Person Families | 336 (31.9%) | $112,857 |
| 4-Person Families | 100 (9.5%) | $124,571 |
| 5-Person Families | 133 (12.6%) | $134,759 |
| 6-Person Families | 29 (2.8%) | $0 |
| 7+ Person Families | 0 (0.0%) | $0 |
| Total | 1,052 (100.0%) | $123,150 |
Family Income by Number of Earners in Hummelstown borough
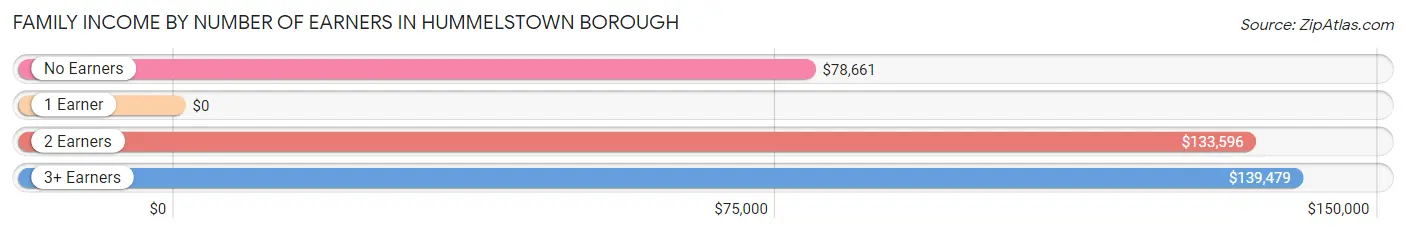
| Number of Earners | # Families | Median Income |
| No Earners | 73 (6.9%) | $78,661 |
| 1 Earner | 264 (25.1%) | $0 |
| 2 Earners | 536 (50.9%) | $133,596 |
| 3+ Earners | 179 (17.0%) | $139,479 |
| Total | 1,052 (100.0%) | $123,150 |
Household Income in Hummelstown borough
Household Income Brackets in Hummelstown borough
With 392 households falling in the category, the $35,000 to $49,999 income range is the most frequent in Hummelstown borough, accounting for 17.4% of all households. In contrast, only 86 households (3.8%) fall into the $150,000 to $199,999 income bracket, making it the least populous group.
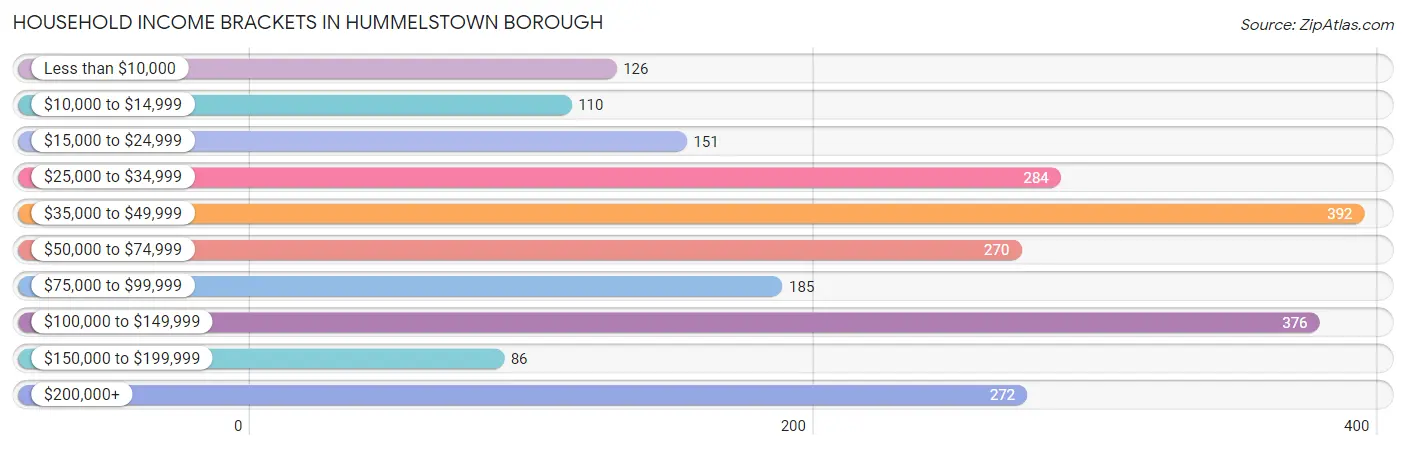
| Income Bracket | # Households | % Households |
| Less than $10,000 | 126 | 5.6% |
| $10,000 to $14,999 | 110 | 4.9% |
| $15,000 to $24,999 | 151 | 6.7% |
| $25,000 to $34,999 | 284 | 12.6% |
| $35,000 to $49,999 | 392 | 17.4% |
| $50,000 to $74,999 | 270 | 12.0% |
| $75,000 to $99,999 | 185 | 8.2% |
| $100,000 to $149,999 | 376 | 16.7% |
| $150,000 to $199,999 | 86 | 3.8% |
| $200,000+ | 272 | 12.1% |
Household Income by Householder Age in Hummelstown borough
The median household income in Hummelstown borough is $53,203, with the highest median household income of $108,750 found in the 45 to 64 years age bracket for the primary householder. A total of 776 households (34.5%) fall into this category. Meanwhile, the 65+ years age bracket for the primary householder has the lowest median household income of $36,042, with 495 households (22.0%) in this group.
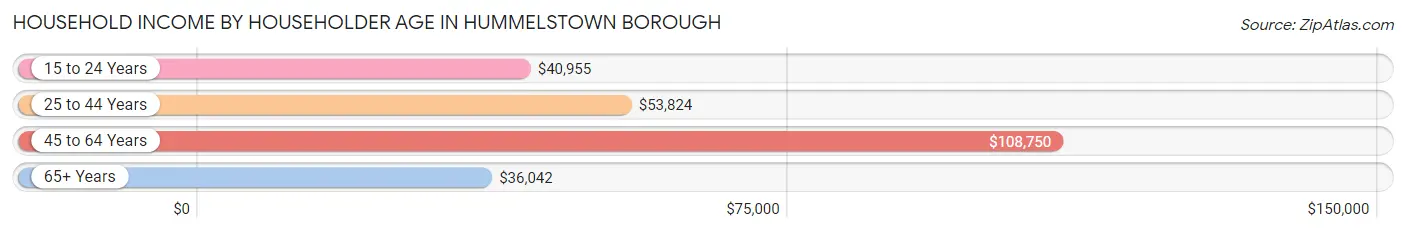
| Income Bracket | # Households | Median Income |
| 15 to 24 Years | 236 (10.5%) | $40,955 |
| 25 to 44 Years | 744 (33.1%) | $53,824 |
| 45 to 64 Years | 776 (34.5%) | $108,750 |
| 65+ Years | 495 (22.0%) | $36,042 |
| Total | 2,251 (100.0%) | $53,203 |
Poverty in Hummelstown borough
Income Below Poverty by Sex and Age in Hummelstown borough
With 8.1% poverty level for males and 15.8% for females among the residents of Hummelstown borough, 5 year old males and 15 year old females are the most vulnerable to poverty, with 43 males (100.0%) and 37 females (100.0%) in their respective age groups living below the poverty level.
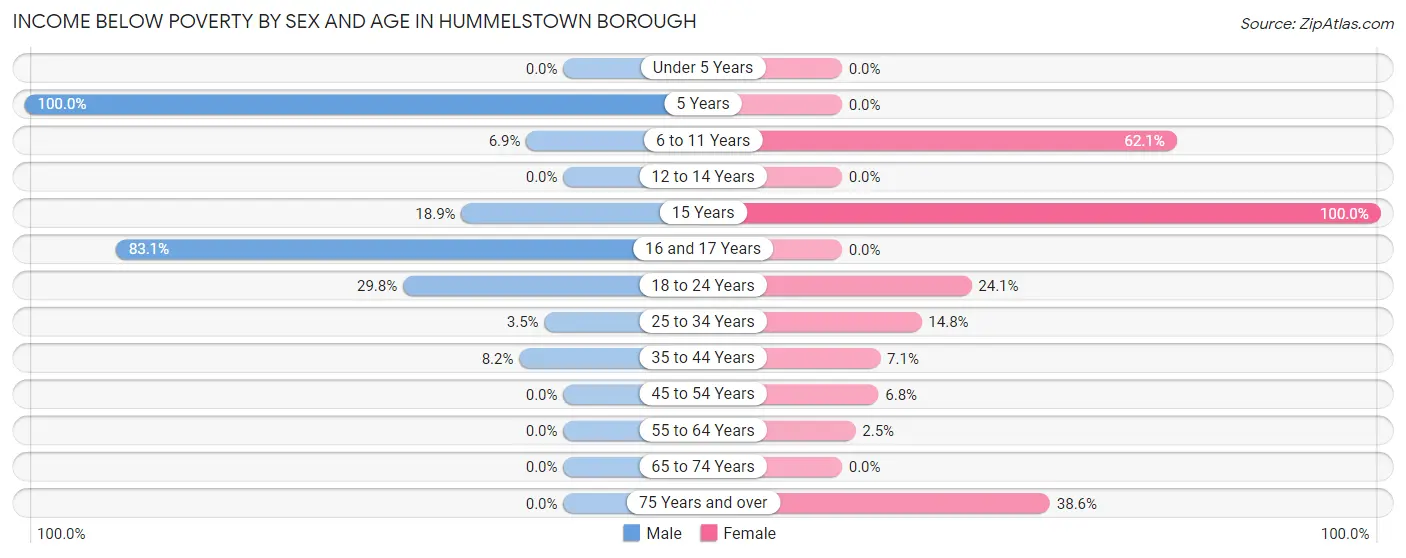
| Age Bracket | Male | Female |
| Under 5 Years | 0 (0.0%) | 0 (0.0%) |
| 5 Years | 43 (100.0%) | 0 (0.0%) |
| 6 to 11 Years | 13 (6.9%) | 64 (62.1%) |
| 12 to 14 Years | 0 (0.0%) | 0 (0.0%) |
| 15 Years | 7 (18.9%) | 37 (100.0%) |
| 16 and 17 Years | 49 (83.1%) | 0 (0.0%) |
| 18 to 24 Years | 25 (29.8%) | 76 (24.0%) |
| 25 to 34 Years | 9 (3.5%) | 72 (14.8%) |
| 35 to 44 Years | 21 (8.2%) | 20 (7.1%) |
| 45 to 54 Years | 0 (0.0%) | 18 (6.8%) |
| 55 to 64 Years | 0 (0.0%) | 8 (2.5%) |
| 65 to 74 Years | 0 (0.0%) | 0 (0.0%) |
| 75 Years and over | 0 (0.0%) | 95 (38.6%) |
| Total | 167 (8.1%) | 390 (15.8%) |
Income Above Poverty by Sex and Age in Hummelstown borough
According to the poverty statistics in Hummelstown borough, males aged under 5 years and females aged under 5 years are the age groups that are most secure financially, with 100.0% of males and 100.0% of females in these age groups living above the poverty line.
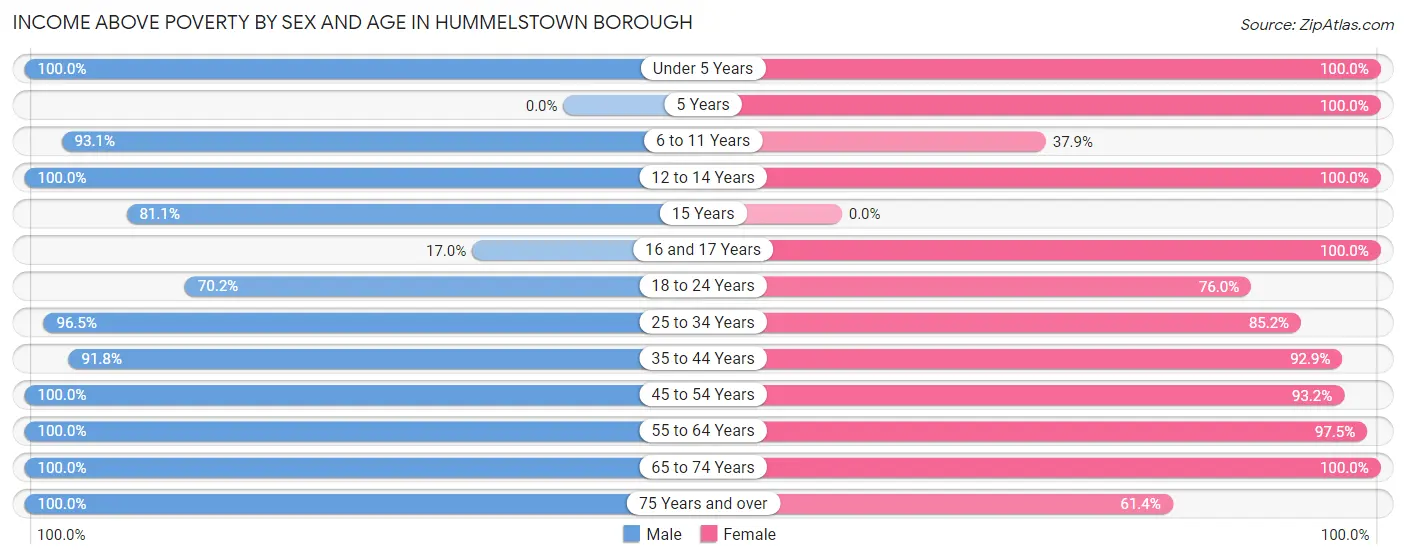
| Age Bracket | Male | Female |
| Under 5 Years | 214 (100.0%) | 66 (100.0%) |
| 5 Years | 0 (0.0%) | 55 (100.0%) |
| 6 to 11 Years | 176 (93.1%) | 39 (37.9%) |
| 12 to 14 Years | 85 (100.0%) | 44 (100.0%) |
| 15 Years | 30 (81.1%) | 0 (0.0%) |
| 16 and 17 Years | 10 (17.0%) | 31 (100.0%) |
| 18 to 24 Years | 59 (70.2%) | 240 (75.9%) |
| 25 to 34 Years | 247 (96.5%) | 415 (85.2%) |
| 35 to 44 Years | 236 (91.8%) | 261 (92.9%) |
| 45 to 54 Years | 295 (100.0%) | 247 (93.2%) |
| 55 to 64 Years | 323 (100.0%) | 311 (97.5%) |
| 65 to 74 Years | 135 (100.0%) | 213 (100.0%) |
| 75 Years and over | 96 (100.0%) | 151 (61.4%) |
| Total | 1,906 (91.9%) | 2,073 (84.2%) |
Income Below Poverty Among Married-Couple Families in Hummelstown borough
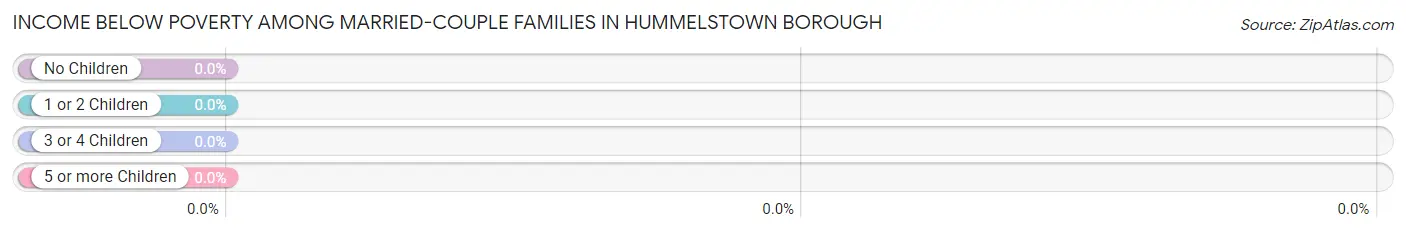
| Children | Above Poverty | Below Poverty |
| No Children | 465 (100.0%) | 0 (0.0%) |
| 1 or 2 Children | 210 (100.0%) | 0 (0.0%) |
| 3 or 4 Children | 55 (100.0%) | 0 (0.0%) |
| 5 or more Children | 0 (0.0%) | 0 (0.0%) |
| Total | 730 (100.0%) | 0 (0.0%) |
Income Below Poverty Among Single-Parent Households in Hummelstown borough
According to the poverty data in Hummelstown borough, 22.6% or 21 single-father households and 36.7% or 84 single-mother households are living below the poverty line. Among single-father households, those with 1 or 2 children have the highest poverty rate, with 21 households (77.8%) experiencing poverty. Likewise, among single-mother households, those with 1 or 2 children have the highest poverty rate, with 84 households (56.4%) falling below the poverty line.
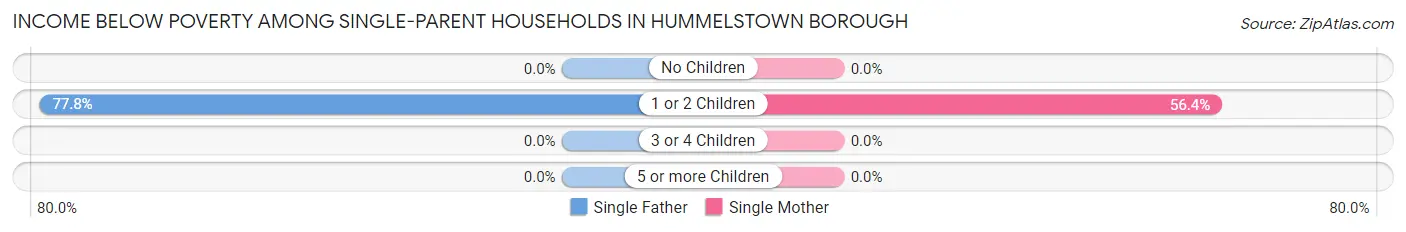
| Children | Single Father | Single Mother |
| No Children | 0 (0.0%) | 0 (0.0%) |
| 1 or 2 Children | 21 (77.8%) | 84 (56.4%) |
| 3 or 4 Children | 0 (0.0%) | 0 (0.0%) |
| 5 or more Children | 0 (0.0%) | 0 (0.0%) |
| Total | 21 (22.6%) | 84 (36.7%) |
Income Below Poverty Among Married-Couple vs Single-Parent Households in Hummelstown borough
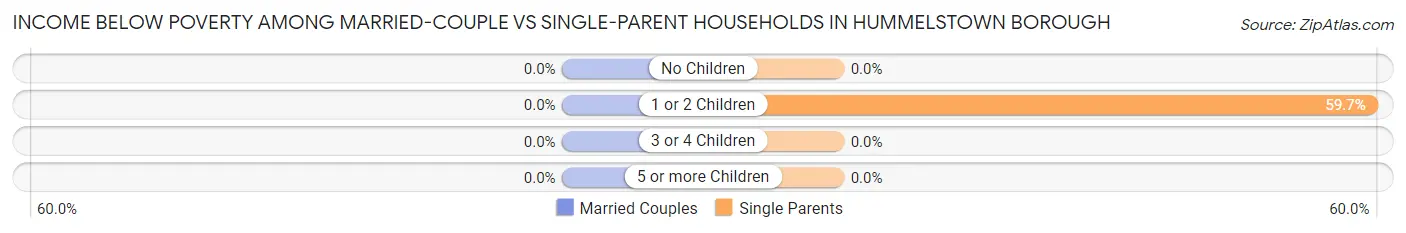
| Children | Married-Couple Families | Single-Parent Households |
| No Children | 0 (0.0%) | 0 (0.0%) |
| 1 or 2 Children | 0 (0.0%) | 105 (59.7%) |
| 3 or 4 Children | 0 (0.0%) | 0 (0.0%) |
| 5 or more Children | 0 (0.0%) | 0 (0.0%) |
| Total | 0 (0.0%) | 105 (32.6%) |
Race in Hummelstown borough
The most populous races in Hummelstown borough are White / Caucasian (4,063 | 89.6%), Hispanic or Latino (421 | 9.3%), and Asian (277 | 6.1%).
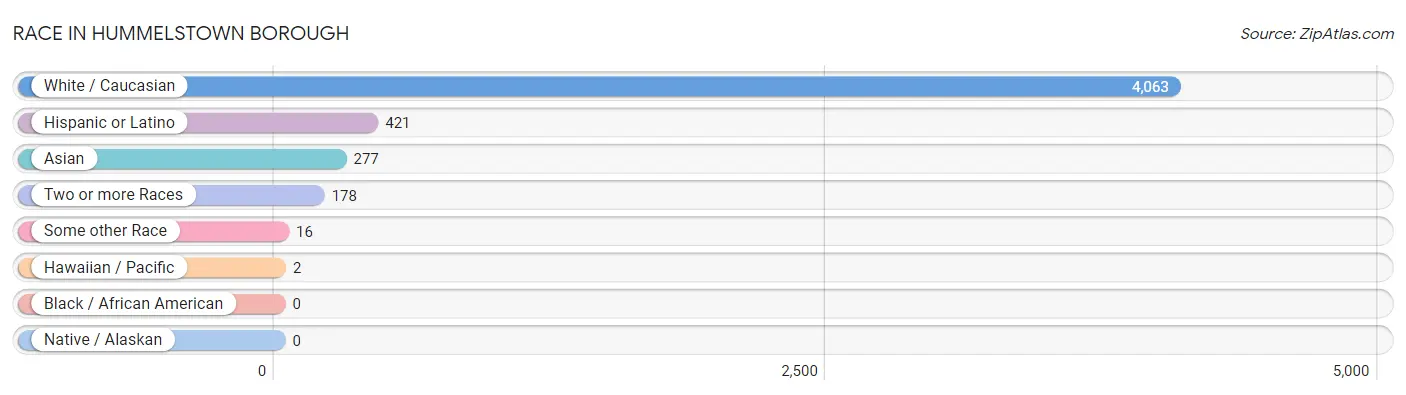
| Race | # Population | % Population |
| Asian | 277 | 6.1% |
| Black / African American | 0 | 0.0% |
| Hawaiian / Pacific | 2 | 0.0% |
| Hispanic or Latino | 421 | 9.3% |
| Native / Alaskan | 0 | 0.0% |
| White / Caucasian | 4,063 | 89.6% |
| Two or more Races | 178 | 3.9% |
| Some other Race | 16 | 0.4% |
| Total | 4,536 | 100.0% |
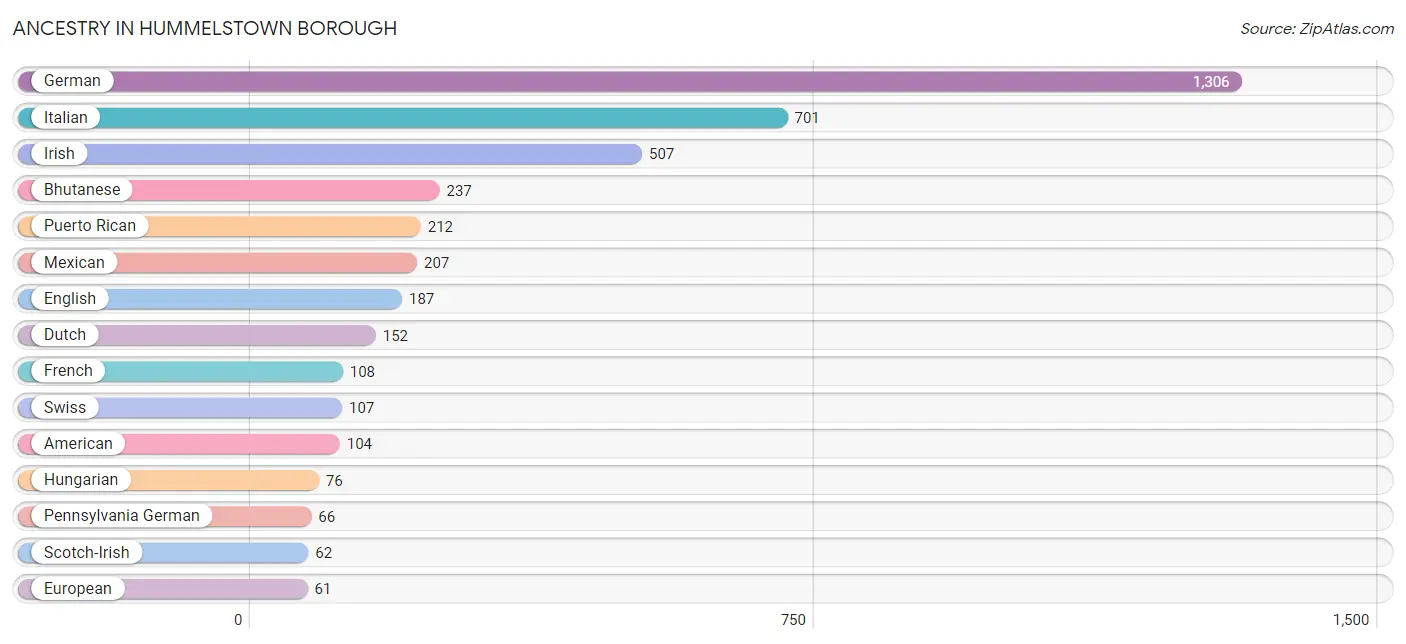
Ancestry in Hummelstown borough
The most populous ancestries reported in Hummelstown borough are German (1,306 | 28.8%), Italian (701 | 15.4%), Irish (507 | 11.2%), Bhutanese (237 | 5.2%), and Puerto Rican (212 | 4.7%), together accounting for 65.3% of all Hummelstown borough residents.
| Ancestry | # Population | % Population |
| Afghan | 9 | 0.2% |
| American | 104 | 2.3% |
| Arab | 39 | 0.9% |
| Armenian | 16 | 0.4% |
| Bhutanese | 237 | 5.2% |
| British | 47 | 1.0% |
| Burmese | 30 | 0.7% |
| Croatian | 12 | 0.3% |
| Danish | 10 | 0.2% |
| Dutch | 152 | 3.4% |
| Egyptian | 39 | 0.9% |
| English | 187 | 4.1% |
| European | 61 | 1.3% |
| Finnish | 22 | 0.5% |
| French | 108 | 2.4% |
| German | 1,306 | 28.8% |
| Guamanian / Chamorro | 2 | 0.0% |
| Hungarian | 76 | 1.7% |
| Irish | 507 | 11.2% |
| Italian | 701 | 15.4% |
| Korean | 7 | 0.2% |
| Lithuanian | 23 | 0.5% |
| Mexican | 207 | 4.6% |
| Norwegian | 14 | 0.3% |
| Pennsylvania German | 66 | 1.5% |
| Polish | 47 | 1.0% |
| Puerto Rican | 212 | 4.7% |
| Scotch-Irish | 62 | 1.4% |
| Scottish | 24 | 0.5% |
| Slavic | 13 | 0.3% |
| Slovak | 22 | 0.5% |
| Sri Lankan | 44 | 1.0% |
| Subsaharan African | 23 | 0.5% |
| Swedish | 59 | 1.3% |
| Swiss | 107 | 2.4% |
| Ukrainian | 12 | 0.3% |
| Welsh | 6 | 0.1% |
| Yugoslavian | 13 | 0.3% | View All 38 Rows |
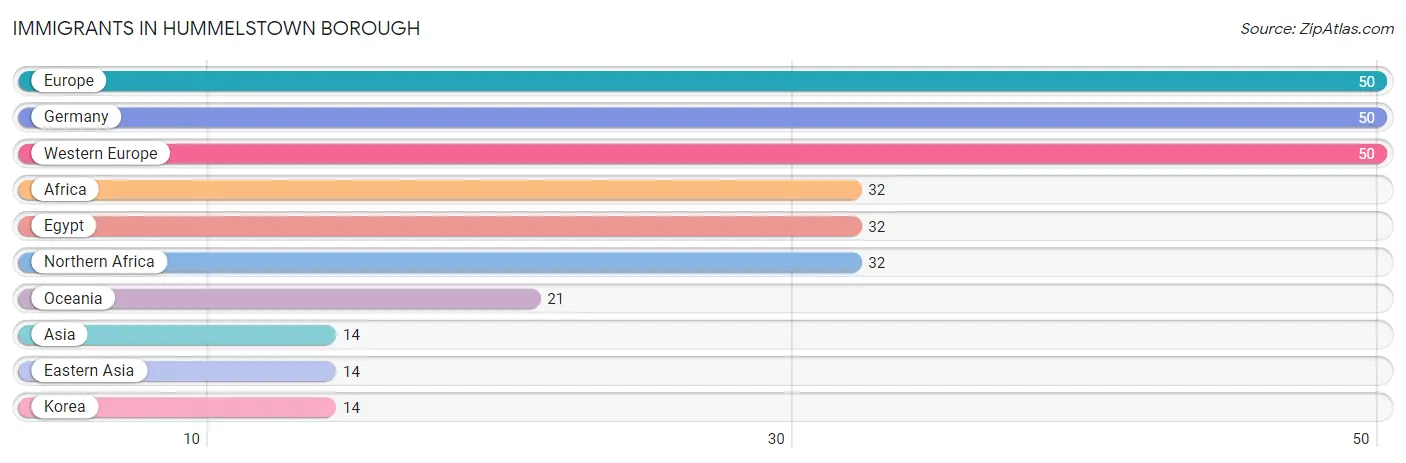
Immigrants in Hummelstown borough
The most numerous immigrant groups reported in Hummelstown borough came from Europe (50 | 1.1%), Germany (50 | 1.1%), Western Europe (50 | 1.1%), Africa (32 | 0.7%), and Egypt (32 | 0.7%), together accounting for 4.7% of all Hummelstown borough residents.
| Immigration Origin | # Population | % Population |
| Africa | 32 | 0.7% |
| Asia | 14 | 0.3% |
| Eastern Asia | 14 | 0.3% |
| Egypt | 32 | 0.7% |
| Europe | 50 | 1.1% |
| Germany | 50 | 1.1% |
| Korea | 14 | 0.3% |
| Northern Africa | 32 | 0.7% |
| Oceania | 21 | 0.5% |
| Western Europe | 50 | 1.1% | View All 10 Rows |
Sex and Age in Hummelstown borough
Sex and Age in Hummelstown borough
The most populous age groups in Hummelstown borough are Under 5 Years (214 | 10.3%) for men and 30 to 34 Years (260 | 10.6%) for women.
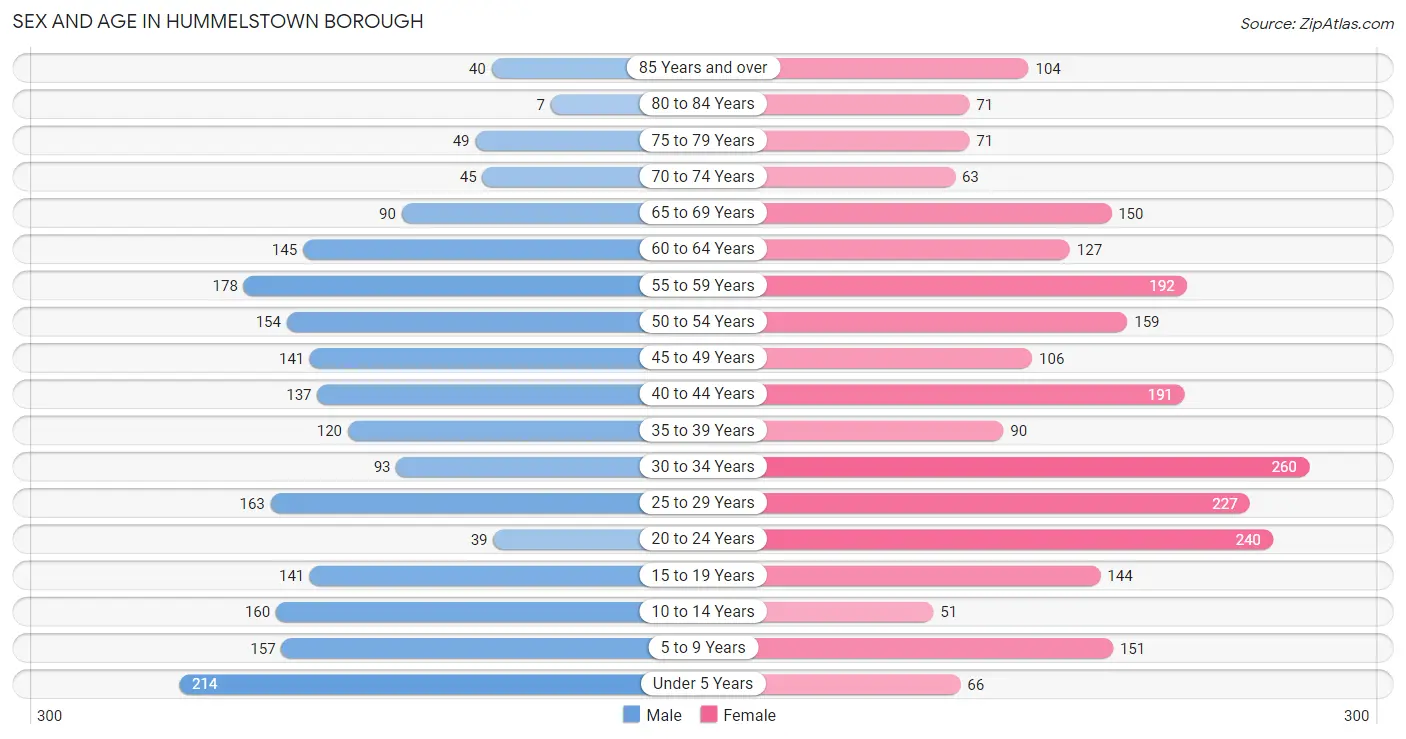
| Age Bracket | Male | Female |
| Under 5 Years | 214 (10.3%) | 66 (2.7%) |
| 5 to 9 Years | 157 (7.6%) | 151 (6.1%) |
| 10 to 14 Years | 160 (7.7%) | 51 (2.1%) |
| 15 to 19 Years | 141 (6.8%) | 144 (5.9%) |
| 20 to 24 Years | 39 (1.9%) | 240 (9.7%) |
| 25 to 29 Years | 163 (7.9%) | 227 (9.2%) |
| 30 to 34 Years | 93 (4.5%) | 260 (10.6%) |
| 35 to 39 Years | 120 (5.8%) | 90 (3.6%) |
| 40 to 44 Years | 137 (6.6%) | 191 (7.7%) |
| 45 to 49 Years | 141 (6.8%) | 106 (4.3%) |
| 50 to 54 Years | 154 (7.4%) | 159 (6.5%) |
| 55 to 59 Years | 178 (8.6%) | 192 (7.8%) |
| 60 to 64 Years | 145 (7.0%) | 127 (5.2%) |
| 65 to 69 Years | 90 (4.3%) | 150 (6.1%) |
| 70 to 74 Years | 45 (2.2%) | 63 (2.6%) |
| 75 to 79 Years | 49 (2.4%) | 71 (2.9%) |
| 80 to 84 Years | 7 (0.3%) | 71 (2.9%) |
| 85 Years and over | 40 (1.9%) | 104 (4.2%) |
| Total | 2,073 (100.0%) | 2,463 (100.0%) |
Families and Households in Hummelstown borough
Median Family Size in Hummelstown borough
The median family size in Hummelstown borough is 2.89 persons per family, with single female/mother families (229 | 21.8%) accounting for the largest median family size of 3.06 persons per family. On the other hand, single male/father families (93 | 8.8%) represent the smallest median family size with 1.77 persons per family.
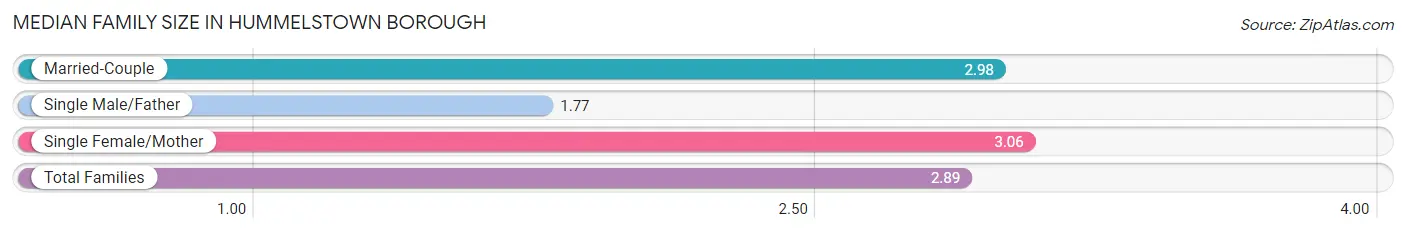
| Family Type | # Families | Family Size |
| Married-Couple | 730 (69.4%) | 2.98 |
| Single Male/Father | 93 (8.8%) | 1.77 |
| Single Female/Mother | 229 (21.8%) | 3.06 |
| Total Families | 1,052 (100.0%) | 2.89 |
Median Household Size in Hummelstown borough
The median household size in Hummelstown borough is 2.02 persons per household, with single male/father households (93 | 4.1%) accounting for the largest median household size of 3.29 persons per household. non-family households (1,199 | 53.3%) represent the smallest median household size with 1.13 persons per household.
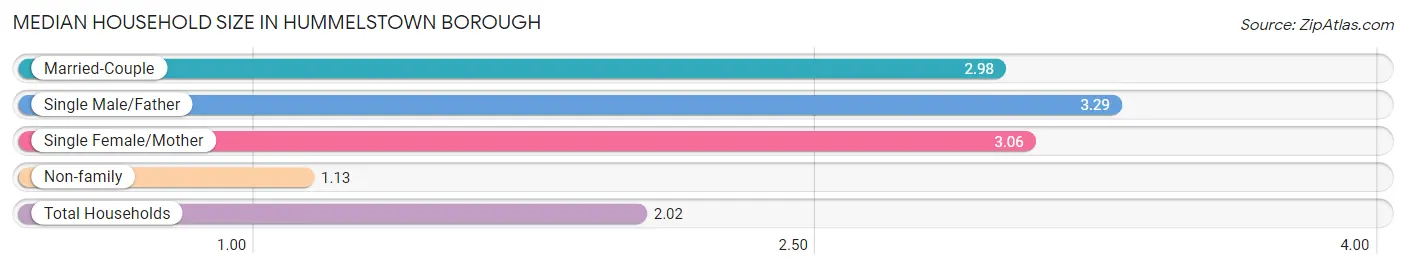
| Household Type | # Households | Household Size |
| Married-Couple | 730 (32.4%) | 2.98 |
| Single Male/Father | 93 (4.1%) | 3.29 |
| Single Female/Mother | 229 (10.2%) | 3.06 |
| Non-family | 1,199 (53.3%) | 1.13 |
| Total Households | 2,251 (100.0%) | 2.02 |
Household Size by Marriage Status in Hummelstown borough
Out of a total of 2,251 households in Hummelstown borough, 1,052 (46.7%) are family households, while 1,199 (53.3%) are nonfamily households. The most numerous type of family households are 3-person households, comprising 398, and the most common type of nonfamily households are 1-person households, comprising 1,084.
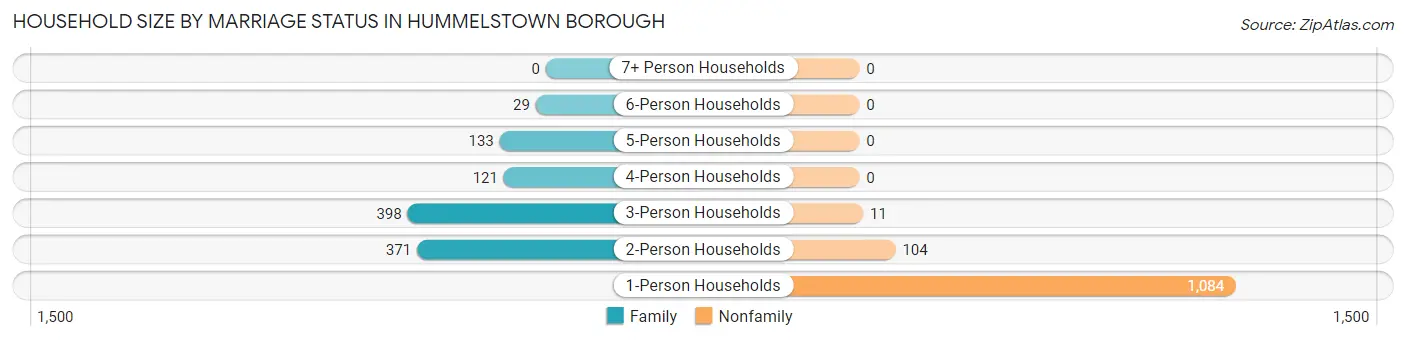
| Household Size | Family Households | Nonfamily Households |
| 1-Person Households | - | 1,084 (48.2%) |
| 2-Person Households | 371 (16.5%) | 104 (4.6%) |
| 3-Person Households | 398 (17.7%) | 11 (0.5%) |
| 4-Person Households | 121 (5.4%) | 0 (0.0%) |
| 5-Person Households | 133 (5.9%) | 0 (0.0%) |
| 6-Person Households | 29 (1.3%) | 0 (0.0%) |
| 7+ Person Households | 0 (0.0%) | 0 (0.0%) |
| Total | 1,052 (46.7%) | 1,199 (53.3%) |
Female Fertility in Hummelstown borough
Fertility by Age in Hummelstown borough
Average fertility rate in Hummelstown borough is 15.0 births per 1,000 women. Women in the age bracket of 35 to 50 years have the highest fertility rate with 49.0 births per 1,000 women. Women in the age bracket of 35 to 50 years acount for 100.0% of all women with births.
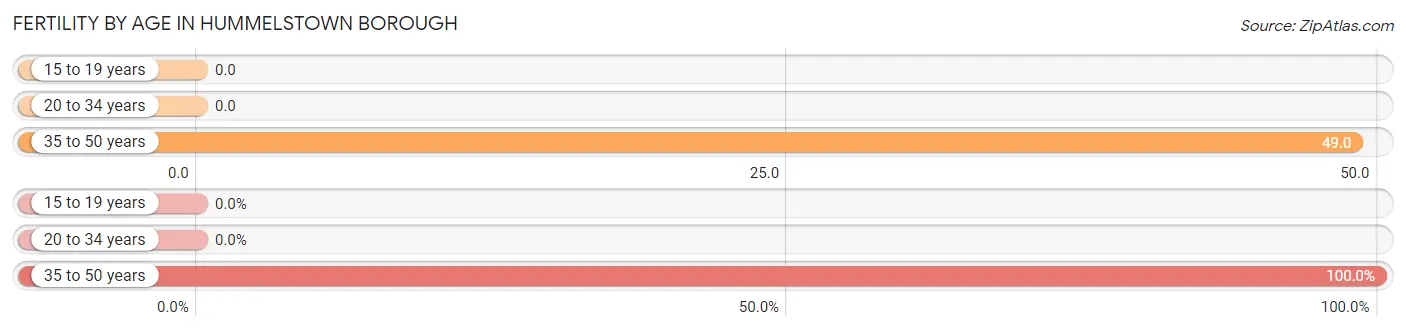
| Age Bracket | Women with Births | Births / 1,000 Women |
| 15 to 19 years | 0 (0.0%) | 0.0 |
| 20 to 34 years | 0 (0.0%) | 0.0 |
| 35 to 50 years | 19 (100.0%) | 49.0 |
| Total | 19 (100.0%) | 15.0 |
Fertility by Age by Marriage Status in Hummelstown borough
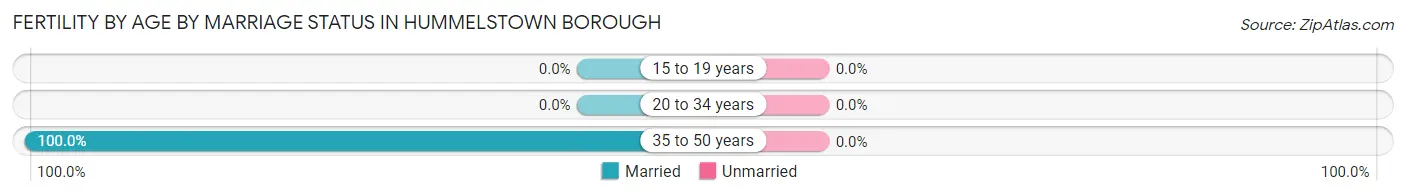
| Age Bracket | Married | Unmarried |
| 15 to 19 years | 0 (0.0%) | 0 (0.0%) |
| 20 to 34 years | 0 (0.0%) | 0 (0.0%) |
| 35 to 50 years | 19 (100.0%) | 0 (0.0%) |
| Total | 19 (100.0%) | 0 (0.0%) |
Fertility by Education in Hummelstown borough
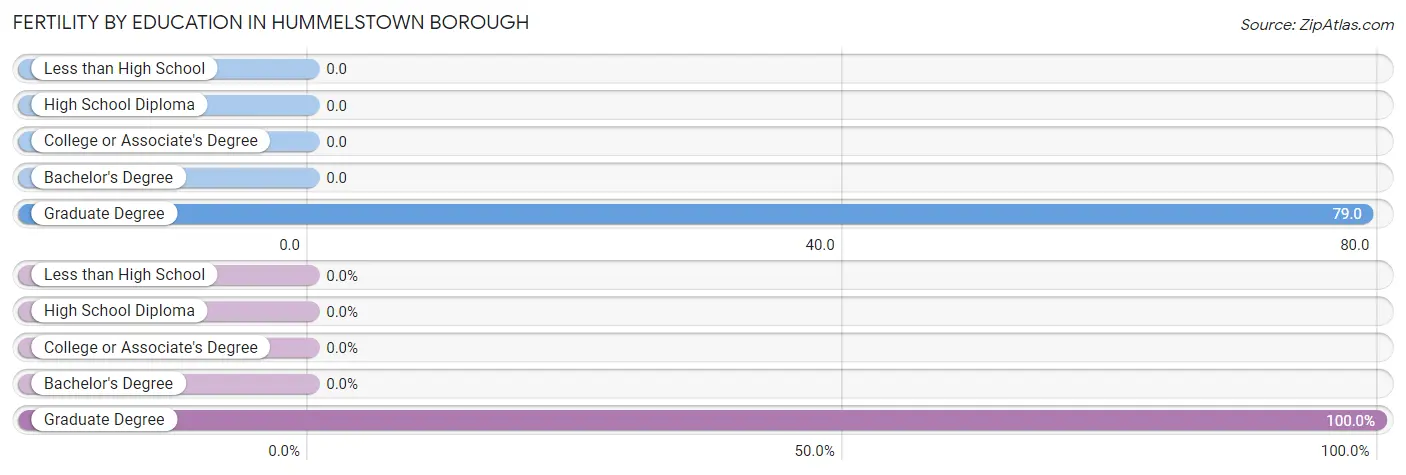
| Educational Attainment | Women with Births | Births / 1,000 Women |
| Less than High School | 0 (0.0%) | 0.0 |
| High School Diploma | 0 (0.0%) | 0.0 |
| College or Associate's Degree | 0 (0.0%) | 0.0 |
| Bachelor's Degree | 0 (0.0%) | 0.0 |
| Graduate Degree | 19 (100.0%) | 79.0 |
| Total | 19 (100.0%) | 15.0 |
Fertility by Education by Marriage Status in Hummelstown borough
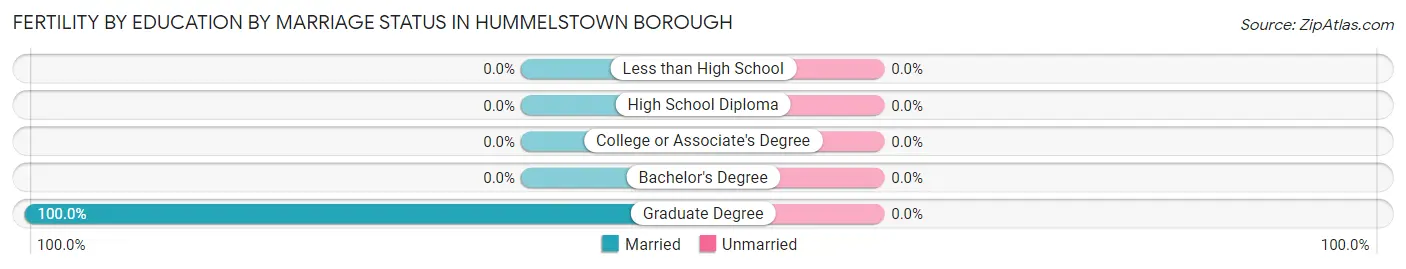
| Educational Attainment | Married | Unmarried |
| Less than High School | 0 (0.0%) | 0 (0.0%) |
| High School Diploma | 0 (0.0%) | 0 (0.0%) |
| College or Associate's Degree | 0 (0.0%) | 0 (0.0%) |
| Bachelor's Degree | 0 (0.0%) | 0 (0.0%) |
| Graduate Degree | 19 (100.0%) | 0 (0.0%) |
| Total | 19 (100.0%) | 0 (0.0%) |
Employment Characteristics in Hummelstown borough
Employment by Class of Employer in Hummelstown borough
Among the 2,865 employed individuals in Hummelstown borough, private company employees (1,656 | 57.8%), not-for-profit organizations (535 | 18.7%), and local government employees (241 | 8.4%) make up the most common classes of employment.
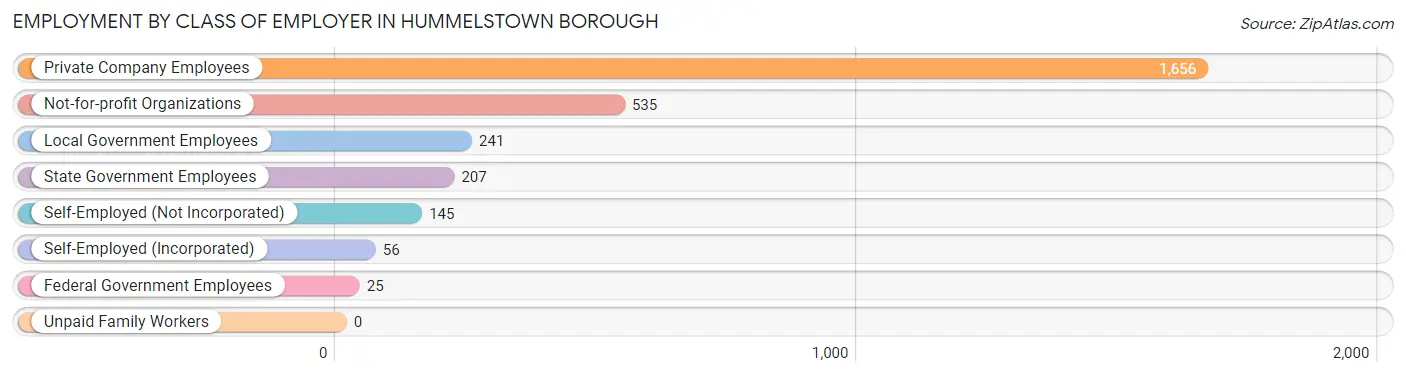
| Employer Class | # Employees | % Employees |
| Private Company Employees | 1,656 | 57.8% |
| Self-Employed (Incorporated) | 56 | 1.9% |
| Self-Employed (Not Incorporated) | 145 | 5.1% |
| Not-for-profit Organizations | 535 | 18.7% |
| Local Government Employees | 241 | 8.4% |
| State Government Employees | 207 | 7.2% |
| Federal Government Employees | 25 | 0.9% |
| Unpaid Family Workers | 0 | 0.0% |
| Total | 2,865 | 100.0% |
Employment Status by Age in Hummelstown borough
According to the labor force statistics for Hummelstown borough, out of the total population over 16 years of age (3,663), 81.5% or 2,985 individuals are in the labor force, with 3.5% or 104 of them unemployed. The age group with the highest labor force participation rate is 30 to 34 years, with 100.0% or 353 individuals in the labor force. Within the labor force, the 16 to 19 years age range has the highest percentage of unemployed individuals, with 19.7% or 30 of them being unemployed.
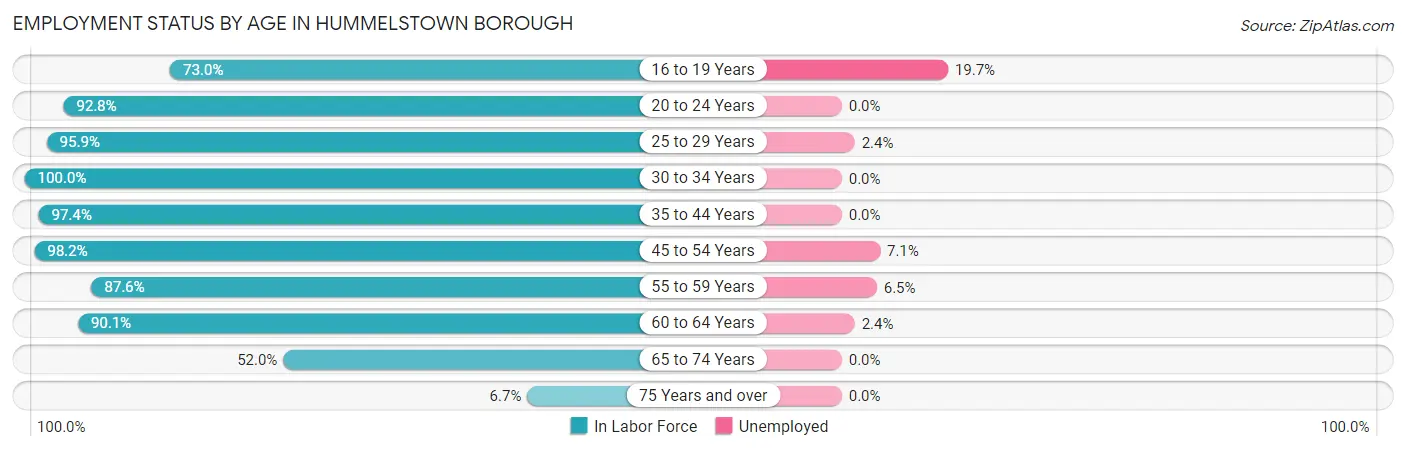
| Age Bracket | In Labor Force | Unemployed |
| 16 to 19 Years | 154 (73.0%) | 30 (19.7%) |
| 20 to 24 Years | 259 (92.8%) | 0 (0.0%) |
| 25 to 29 Years | 374 (95.9%) | 9 (2.4%) |
| 30 to 34 Years | 353 (100.0%) | 0 (0.0%) |
| 35 to 44 Years | 524 (97.4%) | 0 (0.0%) |
| 45 to 54 Years | 550 (98.2%) | 39 (7.1%) |
| 55 to 59 Years | 324 (87.6%) | 21 (6.5%) |
| 60 to 64 Years | 245 (90.1%) | 6 (2.4%) |
| 65 to 74 Years | 181 (52.0%) | 0 (0.0%) |
| 75 Years and over | 23 (6.7%) | 0 (0.0%) |
| Total | 2,985 (81.5%) | 104 (3.5%) |
Employment Status by Educational Attainment in Hummelstown borough
According to labor force statistics for Hummelstown borough, 95.4% of individuals (2,369) out of the total population between 25 and 64 years of age (2,483) are in the labor force, with 3.2% or 76 of them being unemployed. The group with the highest labor force participation rate are those with the educational attainment of less than high school, with 100.0% or 69 individuals in the labor force. Within the labor force, individuals with high school diploma education have the highest percentage of unemployment, with 5.8% or 21 of them being unemployed.
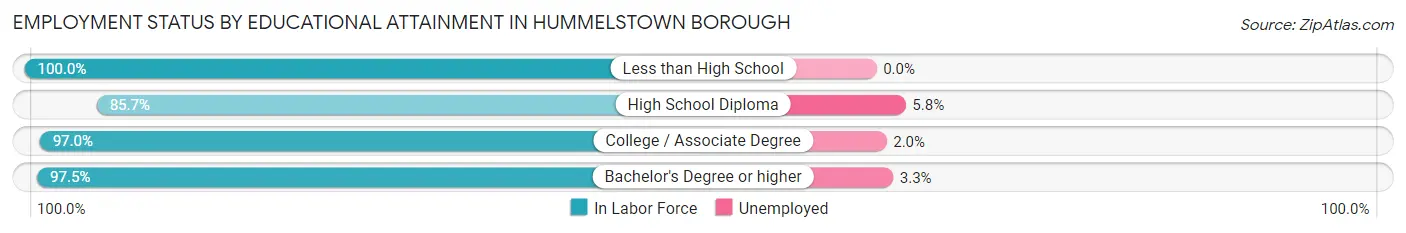
| Educational Attainment | In Labor Force | Unemployed |
| Less than High School | 69 (100.0%) | 0 (0.0%) |
| High School Diploma | 361 (85.7%) | 24 (5.8%) |
| College / Associate Degree | 747 (97.0%) | 15 (2.0%) |
| Bachelor's Degree or higher | 1,192 (97.5%) | 40 (3.3%) |
| Total | 2,369 (95.4%) | 79 (3.2%) |
Employment Occupations by Sex in Hummelstown borough
Management, Business, Science and Arts Occupations
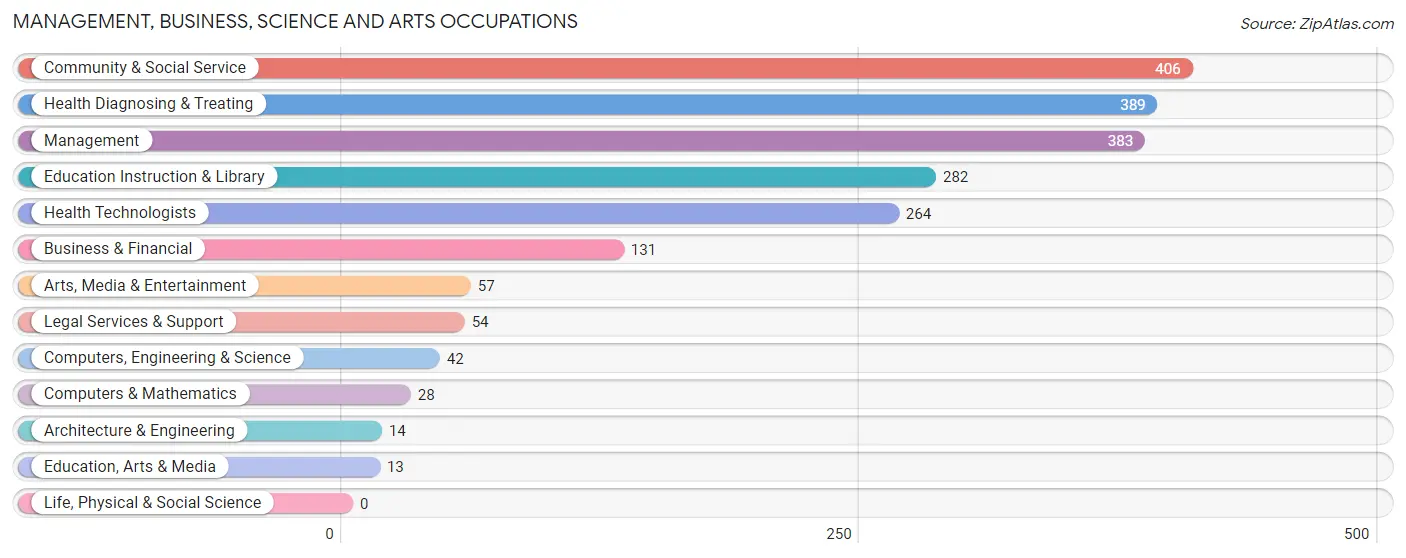
The most common Management, Business, Science and Arts occupations in Hummelstown borough are Community & Social Service (406 | 14.1%), Health Diagnosing & Treating (389 | 13.5%), Management (383 | 13.3%), Education Instruction & Library (282 | 9.8%), and Health Technologists (264 | 9.2%).
Management, Business, Science and Arts Occupations by Sex
Within the Management, Business, Science and Arts occupations in Hummelstown borough, the most male-oriented occupations are Architecture & Engineering (100.0%), Legal Services & Support (79.6%), and Computers, Engineering & Science (66.7%), while the most female-oriented occupations are Education, Arts & Media (100.0%), Health Diagnosing & Treating (73.0%), and Health Technologists (70.1%).
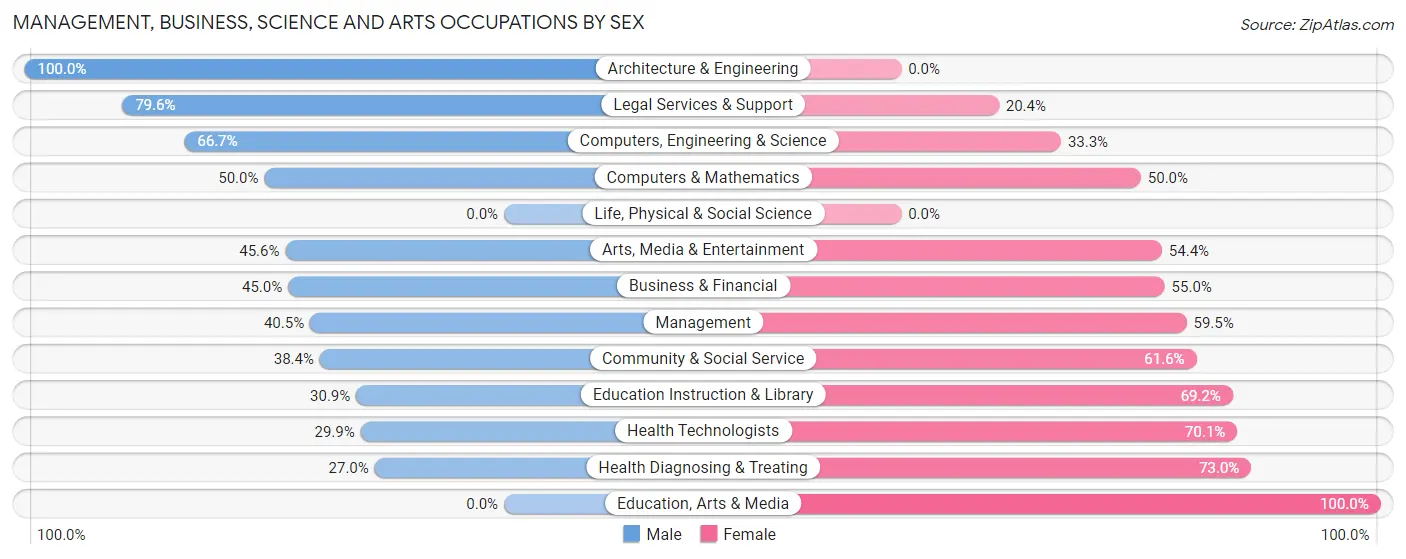
| Occupation | Male | Female |
| Management | 155 (40.5%) | 228 (59.5%) |
| Business & Financial | 59 (45.0%) | 72 (55.0%) |
| Computers, Engineering & Science | 28 (66.7%) | 14 (33.3%) |
| Computers & Mathematics | 14 (50.0%) | 14 (50.0%) |
| Architecture & Engineering | 14 (100.0%) | 0 (0.0%) |
| Life, Physical & Social Science | 0 (0.0%) | 0 (0.0%) |
| Community & Social Service | 156 (38.4%) | 250 (61.6%) |
| Education, Arts & Media | 0 (0.0%) | 13 (100.0%) |
| Legal Services & Support | 43 (79.6%) | 11 (20.4%) |
| Education Instruction & Library | 87 (30.8%) | 195 (69.2%) |
| Arts, Media & Entertainment | 26 (45.6%) | 31 (54.4%) |
| Health Diagnosing & Treating | 105 (27.0%) | 284 (73.0%) |
| Health Technologists | 79 (29.9%) | 185 (70.1%) |
| Total (Category) | 503 (37.2%) | 848 (62.8%) |
| Total (Overall) | 1,154 (40.2%) | 1,718 (59.8%) |
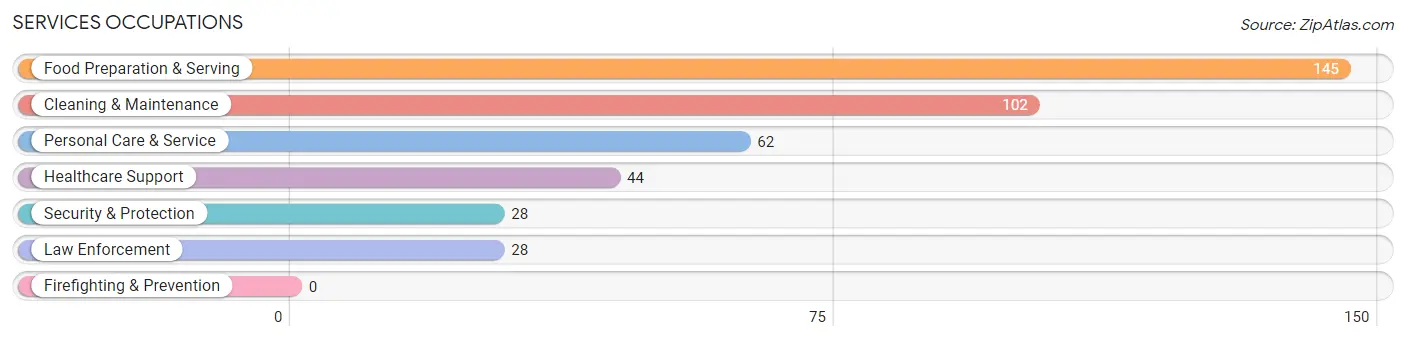
Services Occupations
The most common Services occupations in Hummelstown borough are Food Preparation & Serving (145 | 5.1%), Cleaning & Maintenance (102 | 3.5%), Personal Care & Service (62 | 2.2%), Healthcare Support (44 | 1.5%), and Security & Protection (28 | 1.0%).
Services Occupations by Sex
Within the Services occupations in Hummelstown borough, the most male-oriented occupations are Food Preparation & Serving (60.0%), Cleaning & Maintenance (39.2%), and Security & Protection (28.6%), while the most female-oriented occupations are Healthcare Support (100.0%), Personal Care & Service (88.7%), and Security & Protection (71.4%).
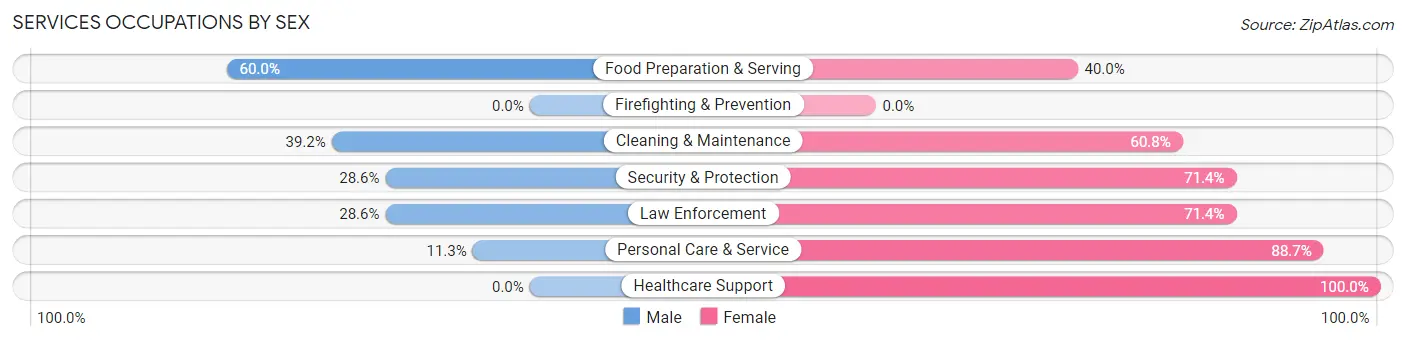
| Occupation | Male | Female |
| Healthcare Support | 0 (0.0%) | 44 (100.0%) |
| Security & Protection | 8 (28.6%) | 20 (71.4%) |
| Firefighting & Prevention | 0 (0.0%) | 0 (0.0%) |
| Law Enforcement | 8 (28.6%) | 20 (71.4%) |
| Food Preparation & Serving | 87 (60.0%) | 58 (40.0%) |
| Cleaning & Maintenance | 40 (39.2%) | 62 (60.8%) |
| Personal Care & Service | 7 (11.3%) | 55 (88.7%) |
| Total (Category) | 142 (37.3%) | 239 (62.7%) |
| Total (Overall) | 1,154 (40.2%) | 1,718 (59.8%) |
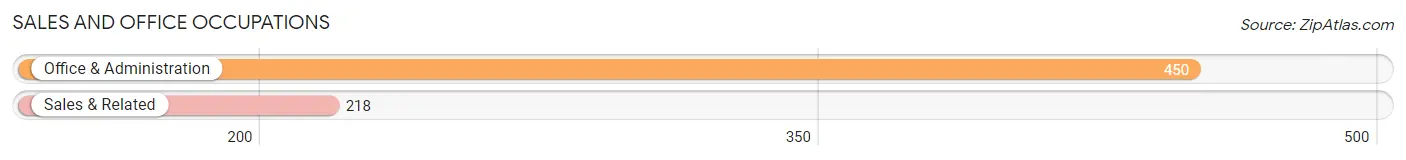
Sales and Office Occupations
The most common Sales and Office occupations in Hummelstown borough are Office & Administration (450 | 15.7%), and Sales & Related (218 | 7.6%).
Sales and Office Occupations by Sex
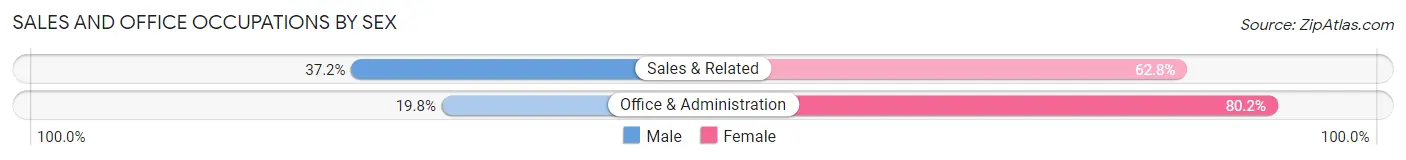
| Occupation | Male | Female |
| Sales & Related | 81 (37.2%) | 137 (62.8%) |
| Office & Administration | 89 (19.8%) | 361 (80.2%) |
| Total (Category) | 170 (25.5%) | 498 (74.6%) |
| Total (Overall) | 1,154 (40.2%) | 1,718 (59.8%) |
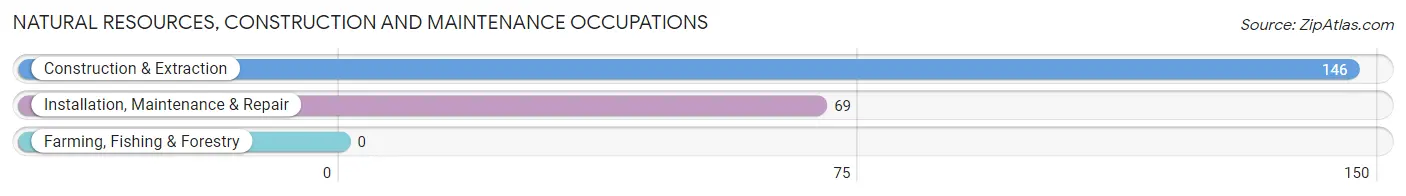
Natural Resources, Construction and Maintenance Occupations
The most common Natural Resources, Construction and Maintenance occupations in Hummelstown borough are Construction & Extraction (146 | 5.1%), and Installation, Maintenance & Repair (69 | 2.4%).
Natural Resources, Construction and Maintenance Occupations by Sex
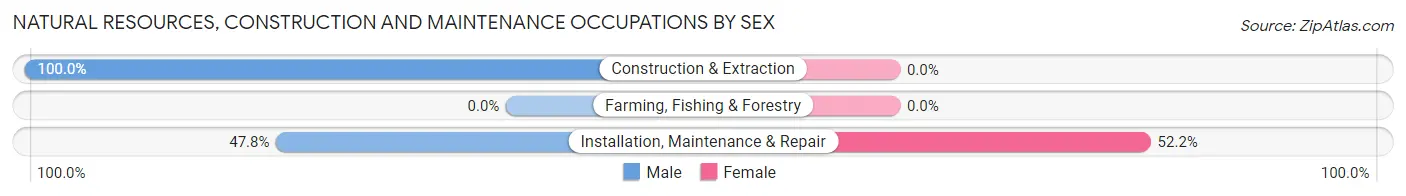
| Occupation | Male | Female |
| Farming, Fishing & Forestry | 0 (0.0%) | 0 (0.0%) |
| Construction & Extraction | 146 (100.0%) | 0 (0.0%) |
| Installation, Maintenance & Repair | 33 (47.8%) | 36 (52.2%) |
| Total (Category) | 179 (83.3%) | 36 (16.7%) |
| Total (Overall) | 1,154 (40.2%) | 1,718 (59.8%) |
Production, Transportation and Moving Occupations
The most common Production, Transportation and Moving occupations in Hummelstown borough are Production (98 | 3.4%), Transportation (85 | 3.0%), and Material Moving (74 | 2.6%).
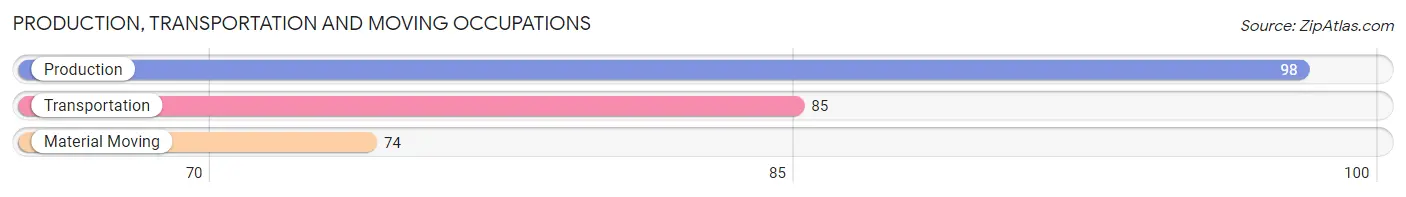
Production, Transportation and Moving Occupations by Sex
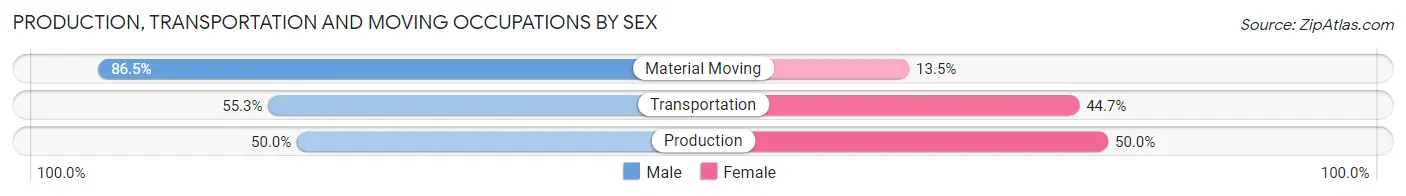
| Occupation | Male | Female |
| Production | 49 (50.0%) | 49 (50.0%) |
| Transportation | 47 (55.3%) | 38 (44.7%) |
| Material Moving | 64 (86.5%) | 10 (13.5%) |
| Total (Category) | 160 (62.3%) | 97 (37.7%) |
| Total (Overall) | 1,154 (40.2%) | 1,718 (59.8%) |
Employment Industries by Sex in Hummelstown borough
Employment Industries in Hummelstown borough
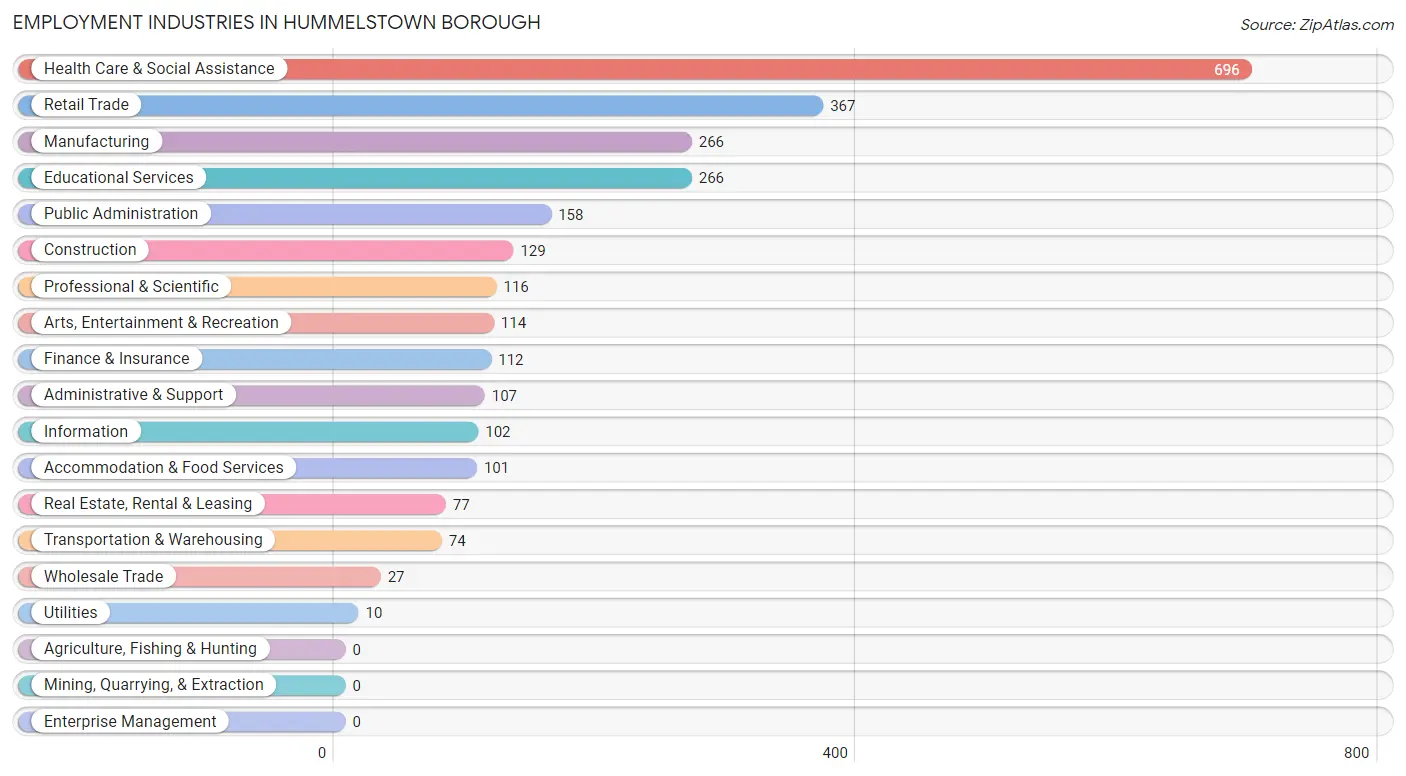
The major employment industries in Hummelstown borough include Health Care & Social Assistance (696 | 24.2%), Retail Trade (367 | 12.8%), Manufacturing (266 | 9.3%), Educational Services (266 | 9.3%), and Public Administration (158 | 5.5%).
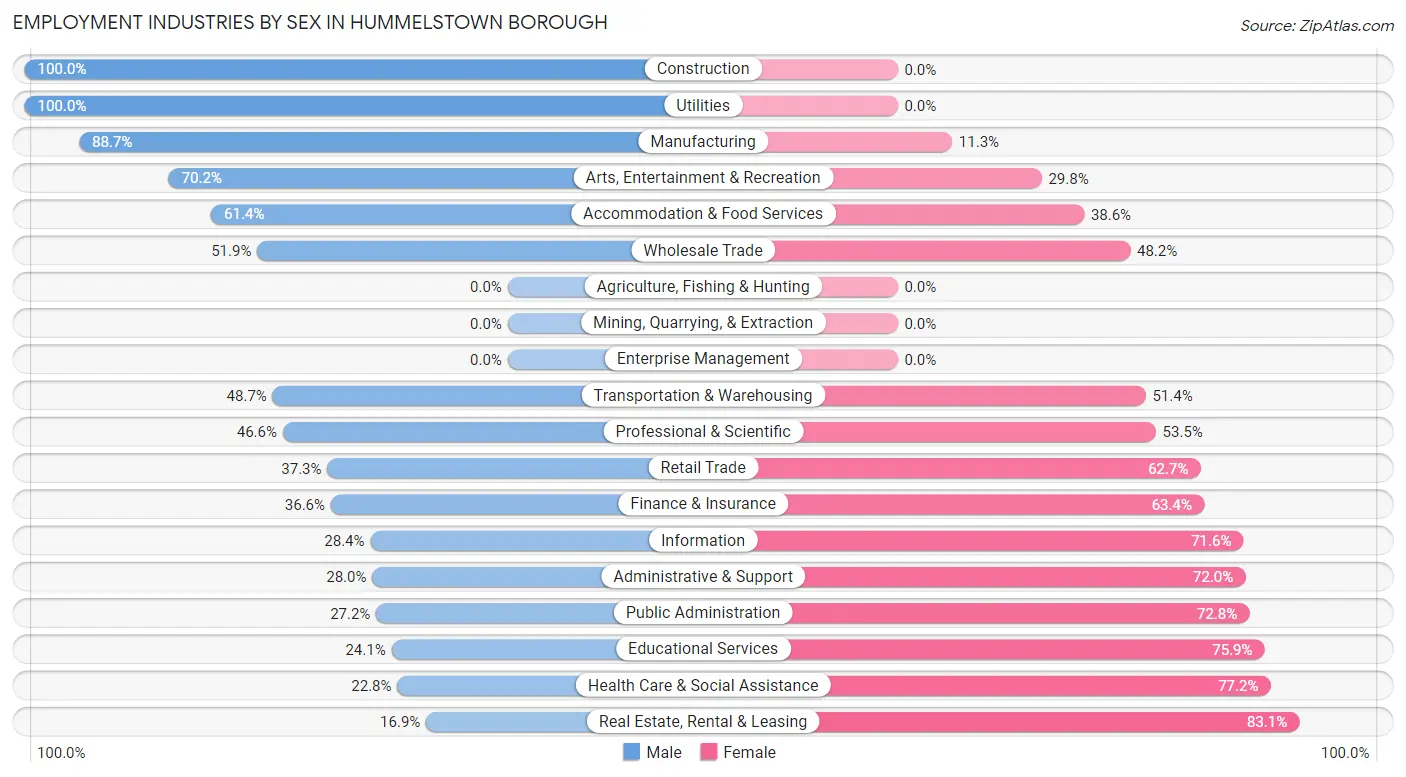
Employment Industries by Sex in Hummelstown borough
The Hummelstown borough industries that see more men than women are Construction (100.0%), Utilities (100.0%), and Manufacturing (88.7%), whereas the industries that tend to have a higher number of women are Real Estate, Rental & Leasing (83.1%), Health Care & Social Assistance (77.2%), and Educational Services (75.9%).
| Industry | Male | Female |
| Agriculture, Fishing & Hunting | 0 (0.0%) | 0 (0.0%) |
| Mining, Quarrying, & Extraction | 0 (0.0%) | 0 (0.0%) |
| Construction | 129 (100.0%) | 0 (0.0%) |
| Manufacturing | 236 (88.7%) | 30 (11.3%) |
| Wholesale Trade | 14 (51.8%) | 13 (48.1%) |
| Retail Trade | 137 (37.3%) | 230 (62.7%) |
| Transportation & Warehousing | 36 (48.6%) | 38 (51.3%) |
| Utilities | 10 (100.0%) | 0 (0.0%) |
| Information | 29 (28.4%) | 73 (71.6%) |
| Finance & Insurance | 41 (36.6%) | 71 (63.4%) |
| Real Estate, Rental & Leasing | 13 (16.9%) | 64 (83.1%) |
| Professional & Scientific | 54 (46.6%) | 62 (53.4%) |
| Enterprise Management | 0 (0.0%) | 0 (0.0%) |
| Administrative & Support | 30 (28.0%) | 77 (72.0%) |
| Educational Services | 64 (24.1%) | 202 (75.9%) |
| Health Care & Social Assistance | 159 (22.8%) | 537 (77.2%) |
| Arts, Entertainment & Recreation | 80 (70.2%) | 34 (29.8%) |
| Accommodation & Food Services | 62 (61.4%) | 39 (38.6%) |
| Public Administration | 43 (27.2%) | 115 (72.8%) |
| Total | 1,154 (40.2%) | 1,718 (59.8%) |
Education in Hummelstown borough
School Enrollment in Hummelstown borough
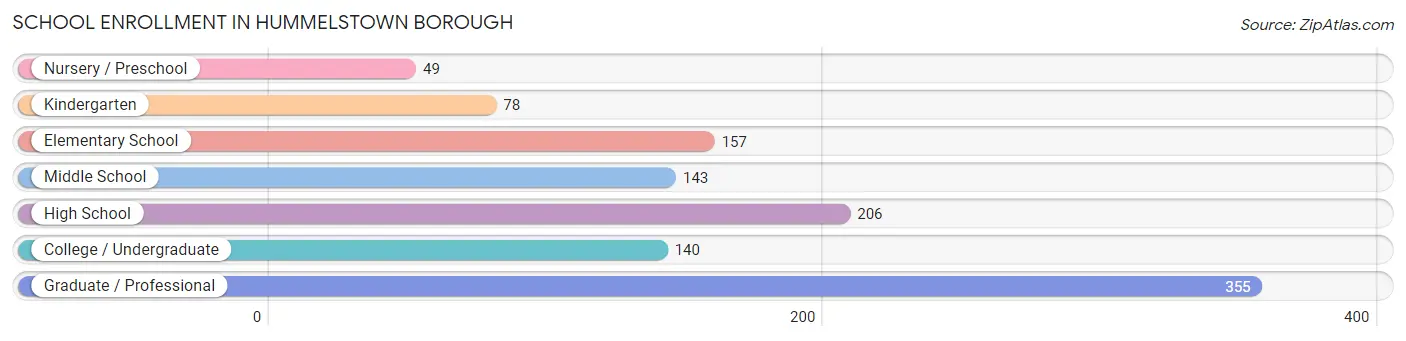
The most common levels of schooling among the 1,128 students in Hummelstown borough are graduate / professional (355 | 31.5%), high school (206 | 18.3%), and elementary school (157 | 13.9%).
| School Level | # Students | % Students |
| Nursery / Preschool | 49 | 4.3% |
| Kindergarten | 78 | 6.9% |
| Elementary School | 157 | 13.9% |
| Middle School | 143 | 12.7% |
| High School | 206 | 18.3% |
| College / Undergraduate | 140 | 12.4% |
| Graduate / Professional | 355 | 31.5% |
| Total | 1,128 | 100.0% |
School Enrollment by Age by Funding Source in Hummelstown borough
Out of a total of 1,128 students who are enrolled in schools in Hummelstown borough, 136 (12.1%) attend a private institution, while the remaining 992 (87.9%) are enrolled in public schools. The age group of 3 to 4 year olds has the highest likelihood of being enrolled in private schools, with 24 (68.6% in the age bracket) enrolled. Conversely, the age group of 10 to 14 year olds has the lowest likelihood of being enrolled in a private school, with 211 (100.0% in the age bracket) attending a public institution.
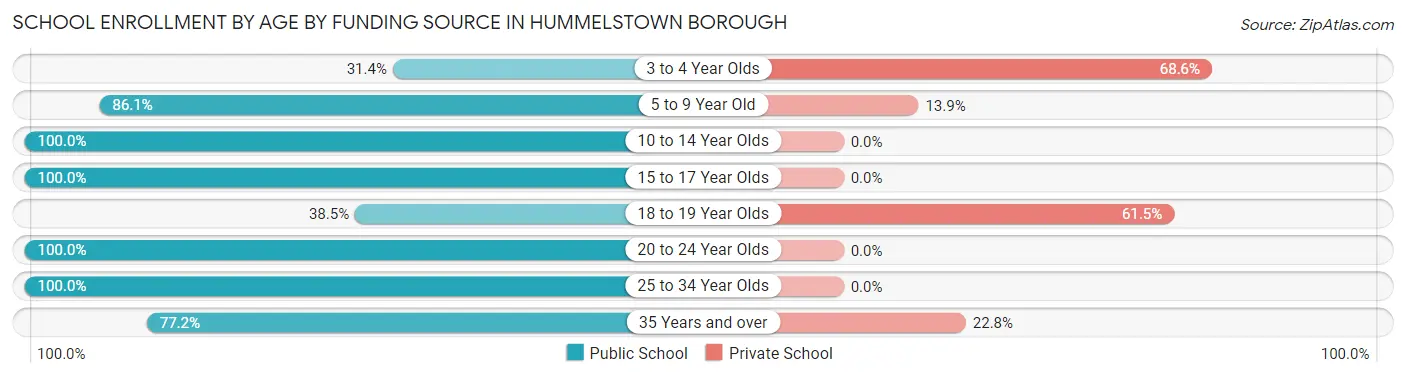
| Age Bracket | Public School | Private School |
| 3 to 4 Year Olds | 11 (31.4%) | 24 (68.6%) |
| 5 to 9 Year Old | 179 (86.1%) | 29 (13.9%) |
| 10 to 14 Year Olds | 211 (100.0%) | 0 (0.0%) |
| 15 to 17 Year Olds | 164 (100.0%) | 0 (0.0%) |
| 18 to 19 Year Olds | 35 (38.5%) | 56 (61.5%) |
| 20 to 24 Year Olds | 207 (100.0%) | 0 (0.0%) |
| 25 to 34 Year Olds | 89 (100.0%) | 0 (0.0%) |
| 35 Years and over | 95 (77.2%) | 28 (22.8%) |
| Total | 992 (87.9%) | 136 (12.1%) |
Educational Attainment by Field of Study in Hummelstown borough
Liberal arts & history (165 | 10.1%), arts & humanities (158 | 9.7%), business (145 | 8.9%), psychology (140 | 8.6%), and science & technology (134 | 8.2%) are the most common fields of study among 1,637 individuals in Hummelstown borough who have obtained a bachelor's degree or higher.
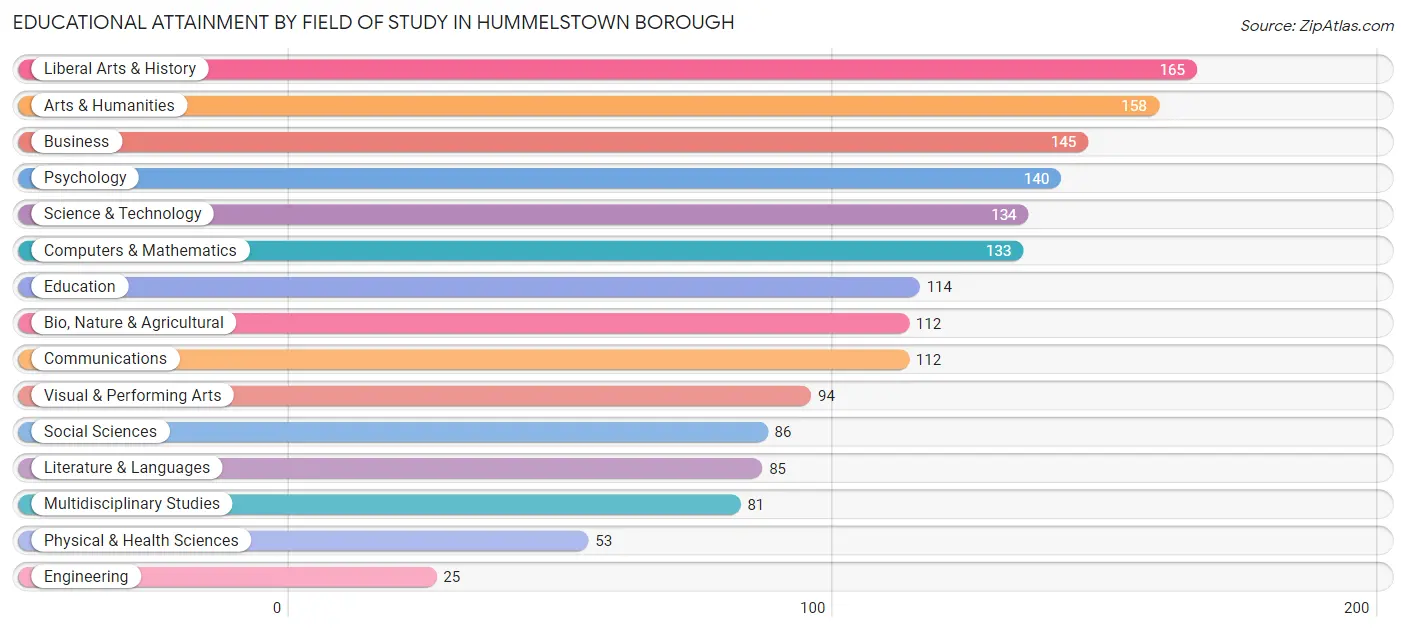
| Field of Study | # Graduates | % Graduates |
| Computers & Mathematics | 133 | 8.1% |
| Bio, Nature & Agricultural | 112 | 6.8% |
| Physical & Health Sciences | 53 | 3.2% |
| Psychology | 140 | 8.6% |
| Social Sciences | 86 | 5.2% |
| Engineering | 25 | 1.5% |
| Multidisciplinary Studies | 81 | 5.0% |
| Science & Technology | 134 | 8.2% |
| Business | 145 | 8.9% |
| Education | 114 | 7.0% |
| Literature & Languages | 85 | 5.2% |
| Liberal Arts & History | 165 | 10.1% |
| Visual & Performing Arts | 94 | 5.7% |
| Communications | 112 | 6.8% |
| Arts & Humanities | 158 | 9.7% |
| Total | 1,637 | 100.0% |
Transportation & Commute in Hummelstown borough
Vehicle Availability by Sex in Hummelstown borough
The most prevalent vehicle ownership categories in Hummelstown borough are males with 2 vehicles (436, accounting for 37.7%) and females with 2 vehicles (505, making up 25.5%).
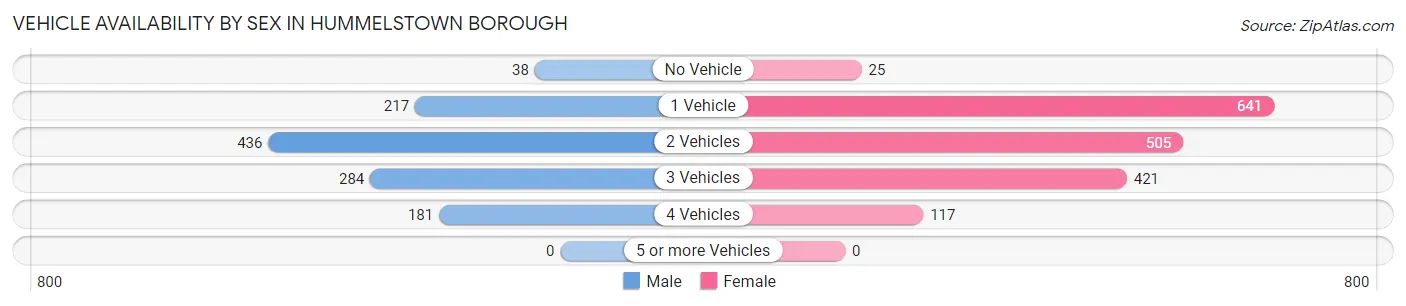
| Vehicles Available | Male | Female |
| No Vehicle | 38 (3.3%) | 25 (1.5%) |
| 1 Vehicle | 217 (18.8%) | 641 (37.5%) |
| 2 Vehicles | 436 (37.7%) | 505 (29.5%) |
| 3 Vehicles | 284 (24.6%) | 421 (24.6%) |
| 4 Vehicles | 181 (15.7%) | 117 (6.9%) |
| 5 or more Vehicles | 0 (0.0%) | 0 (0.0%) |
| Total | 1,156 (100.0%) | 1,709 (100.0%) |
Commute Time in Hummelstown borough
The most frequently occuring commute durations in Hummelstown borough are 5 to 9 minutes (725 commuters, 28.7%), 15 to 19 minutes (373 commuters, 14.8%), and 30 to 34 minutes (183 commuters, 7.2%).
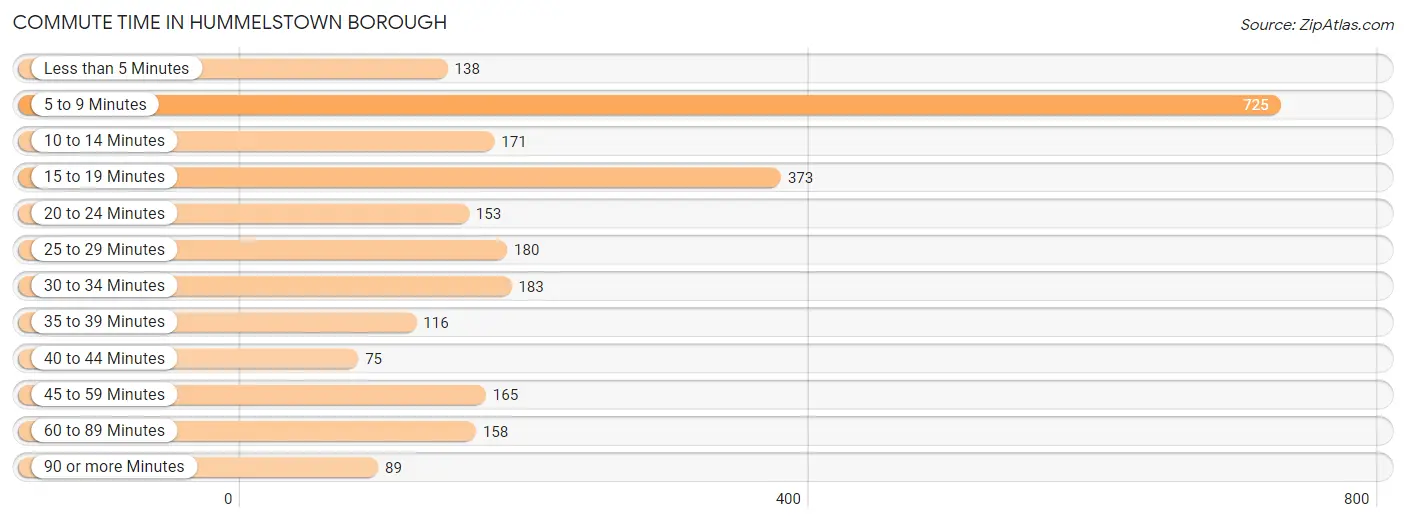
| Commute Time | # Commuters | % Commuters |
| Less than 5 Minutes | 138 | 5.5% |
| 5 to 9 Minutes | 725 | 28.7% |
| 10 to 14 Minutes | 171 | 6.8% |
| 15 to 19 Minutes | 373 | 14.8% |
| 20 to 24 Minutes | 153 | 6.1% |
| 25 to 29 Minutes | 180 | 7.1% |
| 30 to 34 Minutes | 183 | 7.2% |
| 35 to 39 Minutes | 116 | 4.6% |
| 40 to 44 Minutes | 75 | 3.0% |
| 45 to 59 Minutes | 165 | 6.5% |
| 60 to 89 Minutes | 158 | 6.2% |
| 90 or more Minutes | 89 | 3.5% |
Commute Time by Sex in Hummelstown borough
The most common commute times in Hummelstown borough are 5 to 9 minutes (308 commuters, 30.6%) for males and 5 to 9 minutes (417 commuters, 27.5%) for females.
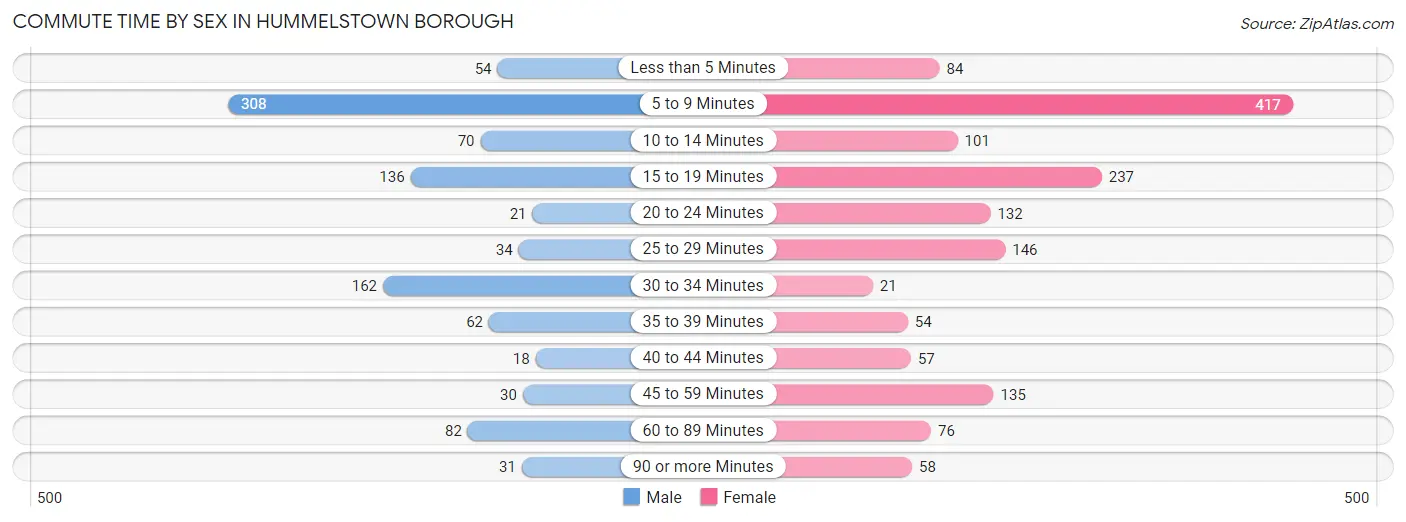
| Commute Time | Male | Female |
| Less than 5 Minutes | 54 (5.4%) | 84 (5.5%) |
| 5 to 9 Minutes | 308 (30.6%) | 417 (27.5%) |
| 10 to 14 Minutes | 70 (6.9%) | 101 (6.7%) |
| 15 to 19 Minutes | 136 (13.5%) | 237 (15.6%) |
| 20 to 24 Minutes | 21 (2.1%) | 132 (8.7%) |
| 25 to 29 Minutes | 34 (3.4%) | 146 (9.6%) |
| 30 to 34 Minutes | 162 (16.1%) | 21 (1.4%) |
| 35 to 39 Minutes | 62 (6.1%) | 54 (3.6%) |
| 40 to 44 Minutes | 18 (1.8%) | 57 (3.7%) |
| 45 to 59 Minutes | 30 (3.0%) | 135 (8.9%) |
| 60 to 89 Minutes | 82 (8.1%) | 76 (5.0%) |
| 90 or more Minutes | 31 (3.1%) | 58 (3.8%) |
Time of Departure to Work by Sex in Hummelstown borough
The most frequent times of departure to work in Hummelstown borough are 7:30 AM to 7:59 AM (250, 24.8%) for males and 12:00 PM to 3:59 PM (334, 22.0%) for females.
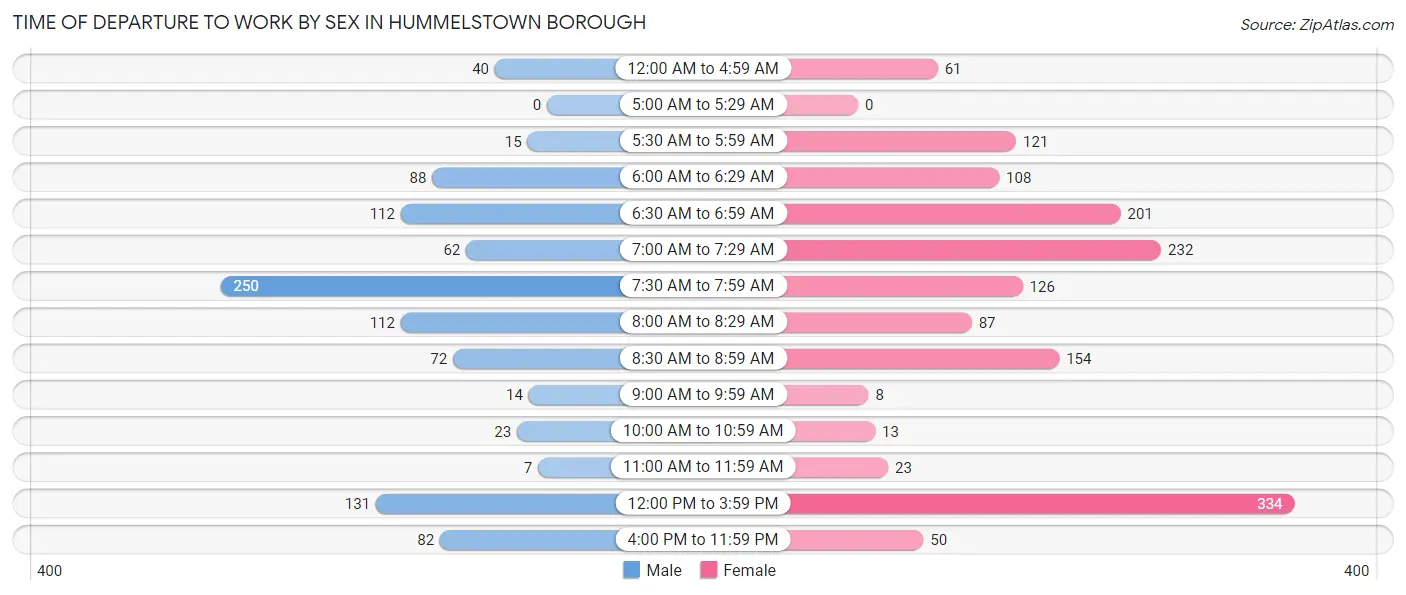
| Time of Departure | Male | Female |
| 12:00 AM to 4:59 AM | 40 (4.0%) | 61 (4.0%) |
| 5:00 AM to 5:29 AM | 0 (0.0%) | 0 (0.0%) |
| 5:30 AM to 5:59 AM | 15 (1.5%) | 121 (8.0%) |
| 6:00 AM to 6:29 AM | 88 (8.7%) | 108 (7.1%) |
| 6:30 AM to 6:59 AM | 112 (11.1%) | 201 (13.2%) |
| 7:00 AM to 7:29 AM | 62 (6.1%) | 232 (15.3%) |
| 7:30 AM to 7:59 AM | 250 (24.8%) | 126 (8.3%) |
| 8:00 AM to 8:29 AM | 112 (11.1%) | 87 (5.7%) |
| 8:30 AM to 8:59 AM | 72 (7.1%) | 154 (10.1%) |
| 9:00 AM to 9:59 AM | 14 (1.4%) | 8 (0.5%) |
| 10:00 AM to 10:59 AM | 23 (2.3%) | 13 (0.9%) |
| 11:00 AM to 11:59 AM | 7 (0.7%) | 23 (1.5%) |
| 12:00 PM to 3:59 PM | 131 (13.0%) | 334 (22.0%) |
| 4:00 PM to 11:59 PM | 82 (8.1%) | 50 (3.3%) |
| Total | 1,008 (100.0%) | 1,518 (100.0%) |
Housing Occupancy in Hummelstown borough
Occupancy by Ownership in Hummelstown borough
Of the total 2,251 dwellings in Hummelstown borough, owner-occupied units account for 1,142 (50.7%), while renter-occupied units make up 1,109 (49.3%).
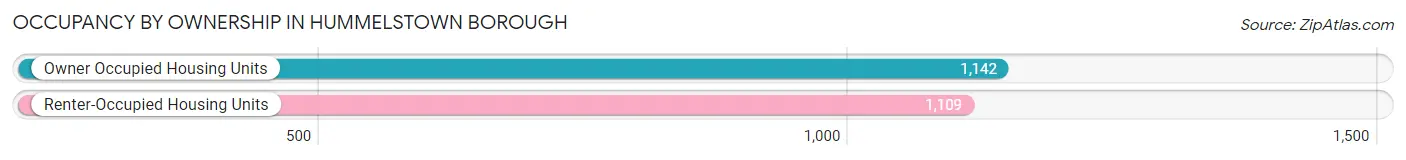
| Occupancy | # Housing Units | % Housing Units |
| Owner Occupied Housing Units | 1,142 | 50.7% |
| Renter-Occupied Housing Units | 1,109 | 49.3% |
| Total Occupied Housing Units | 2,251 | 100.0% |
Occupancy by Household Size in Hummelstown borough
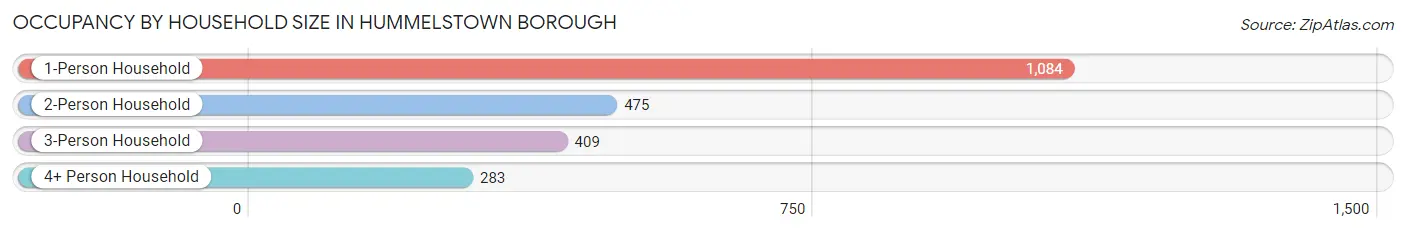
| Household Size | # Housing Units | % Housing Units |
| 1-Person Household | 1,084 | 48.2% |
| 2-Person Household | 475 | 21.1% |
| 3-Person Household | 409 | 18.2% |
| 4+ Person Household | 283 | 12.6% |
| Total Housing Units | 2,251 | 100.0% |
Occupancy by Ownership by Household Size in Hummelstown borough
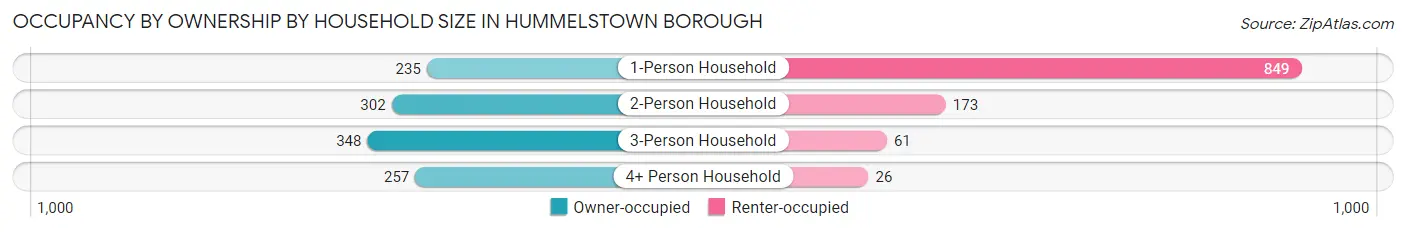
| Household Size | Owner-occupied | Renter-occupied |
| 1-Person Household | 235 (21.7%) | 849 (78.3%) |
| 2-Person Household | 302 (63.6%) | 173 (36.4%) |
| 3-Person Household | 348 (85.1%) | 61 (14.9%) |
| 4+ Person Household | 257 (90.8%) | 26 (9.2%) |
| Total Housing Units | 1,142 (50.7%) | 1,109 (49.3%) |
Occupancy by Educational Attainment in Hummelstown borough
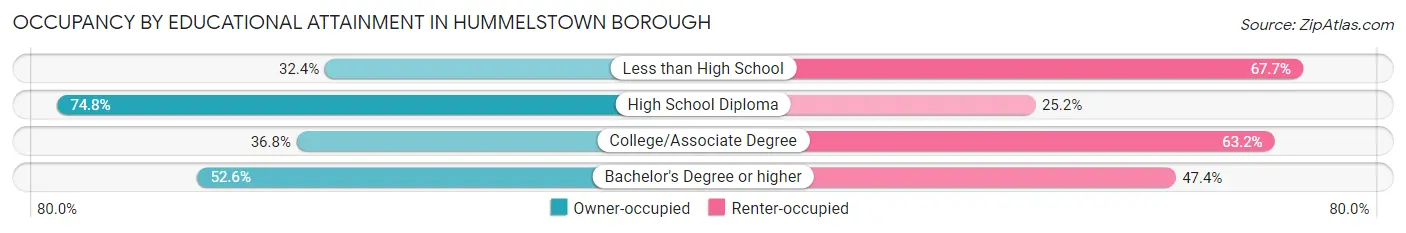
| Household Size | Owner-occupied | Renter-occupied |
| Less than High School | 55 (32.4%) | 115 (67.6%) |
| High School Diploma | 288 (74.8%) | 97 (25.2%) |
| College/Associate Degree | 217 (36.8%) | 372 (63.2%) |
| Bachelor's Degree or higher | 582 (52.6%) | 525 (47.4%) |
Occupancy by Age of Householder in Hummelstown borough
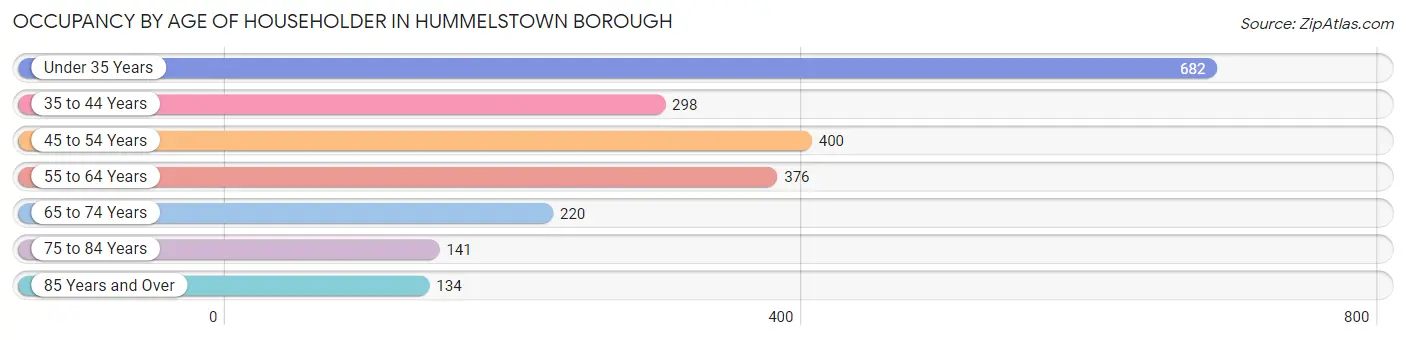
| Age Bracket | # Households | % Households |
| Under 35 Years | 682 | 30.3% |
| 35 to 44 Years | 298 | 13.2% |
| 45 to 54 Years | 400 | 17.8% |
| 55 to 64 Years | 376 | 16.7% |
| 65 to 74 Years | 220 | 9.8% |
| 75 to 84 Years | 141 | 6.3% |
| 85 Years and Over | 134 | 5.9% |
| Total | 2,251 | 100.0% |
Housing Finances in Hummelstown borough
Median Income by Occupancy in Hummelstown borough
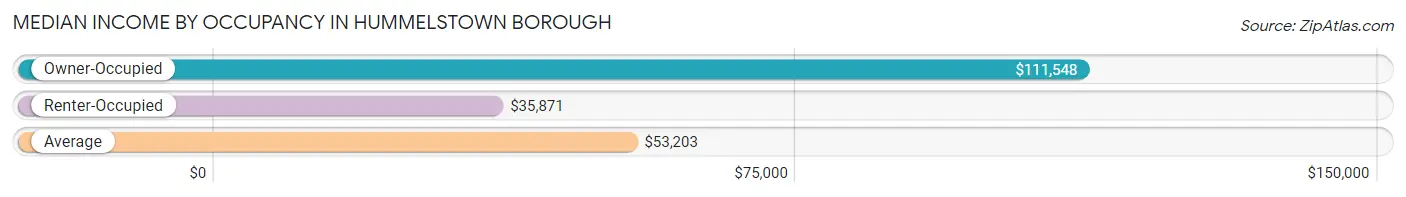
| Occupancy Type | # Households | Median Income |
| Owner-Occupied | 1,142 (50.7%) | $111,548 |
| Renter-Occupied | 1,109 (49.3%) | $35,871 |
| Average | 2,251 (100.0%) | $53,203 |
Occupancy by Householder Income Bracket in Hummelstown borough
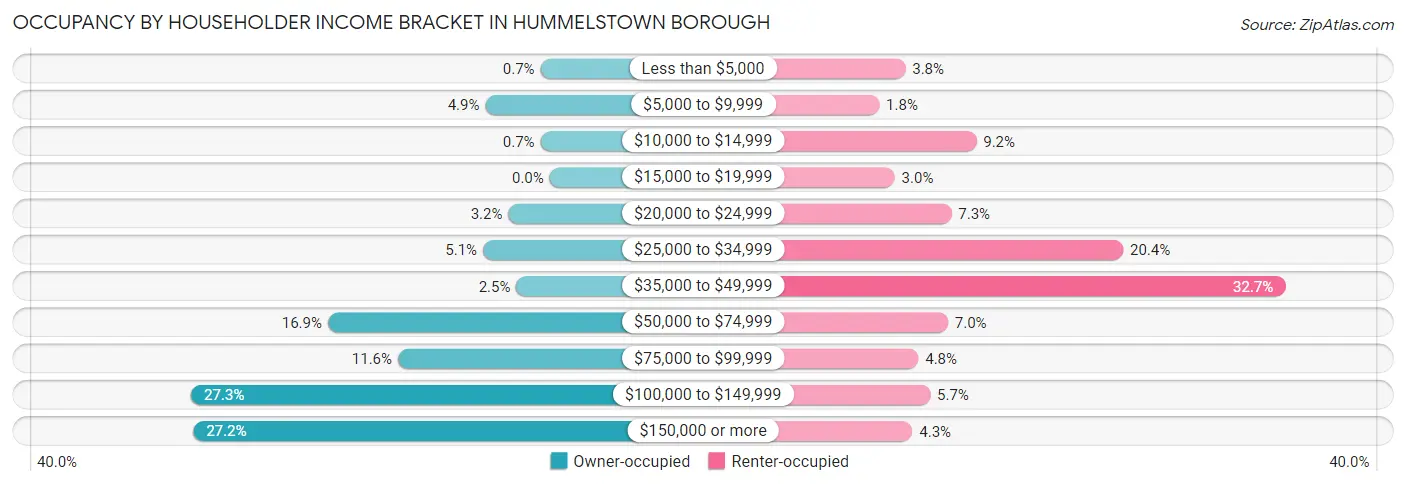
| Income Bracket | Owner-occupied | Renter-occupied |
| Less than $5,000 | 8 (0.7%) | 42 (3.8%) |
| $5,000 to $9,999 | 56 (4.9%) | 20 (1.8%) |
| $10,000 to $14,999 | 8 (0.7%) | 102 (9.2%) |
| $15,000 to $19,999 | 0 (0.0%) | 33 (3.0%) |
| $20,000 to $24,999 | 36 (3.2%) | 81 (7.3%) |
| $25,000 to $34,999 | 58 (5.1%) | 226 (20.4%) |
| $35,000 to $49,999 | 29 (2.5%) | 363 (32.7%) |
| $50,000 to $74,999 | 193 (16.9%) | 78 (7.0%) |
| $75,000 to $99,999 | 132 (11.6%) | 53 (4.8%) |
| $100,000 to $149,999 | 312 (27.3%) | 63 (5.7%) |
| $150,000 or more | 310 (27.2%) | 48 (4.3%) |
| Total | 1,142 (100.0%) | 1,109 (100.0%) |
Monthly Housing Cost Tiers in Hummelstown borough
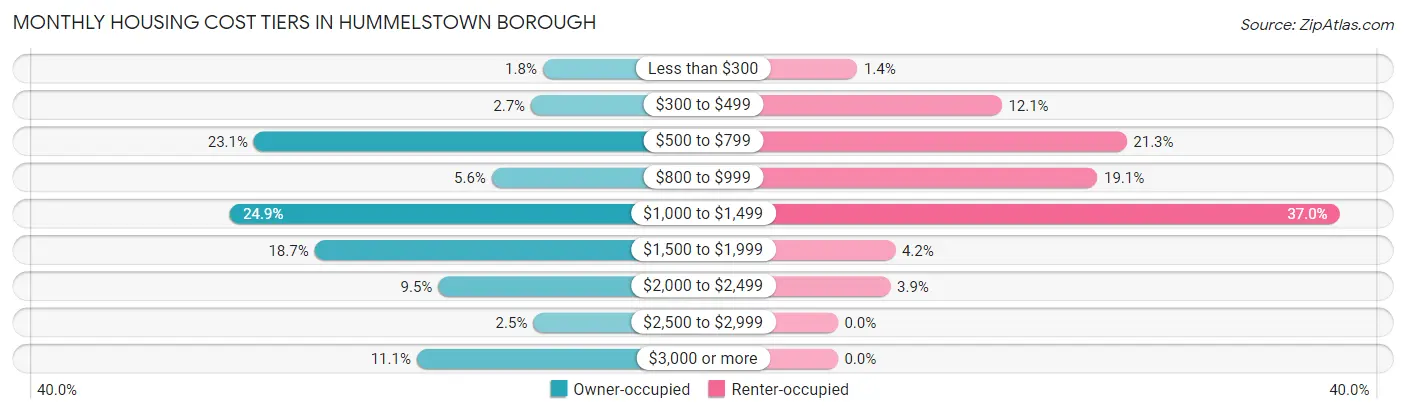
| Monthly Cost | Owner-occupied | Renter-occupied |
| Less than $300 | 21 (1.8%) | 16 (1.4%) |
| $300 to $499 | 31 (2.7%) | 134 (12.1%) |
| $500 to $799 | 264 (23.1%) | 236 (21.3%) |
| $800 to $999 | 64 (5.6%) | 212 (19.1%) |
| $1,000 to $1,499 | 284 (24.9%) | 410 (37.0%) |
| $1,500 to $1,999 | 213 (18.6%) | 47 (4.2%) |
| $2,000 to $2,499 | 109 (9.5%) | 43 (3.9%) |
| $2,500 to $2,999 | 29 (2.5%) | 0 (0.0%) |
| $3,000 or more | 127 (11.1%) | 0 (0.0%) |
| Total | 1,142 (100.0%) | 1,109 (100.0%) |
Physical Housing Characteristics in Hummelstown borough
Housing Structures in Hummelstown borough
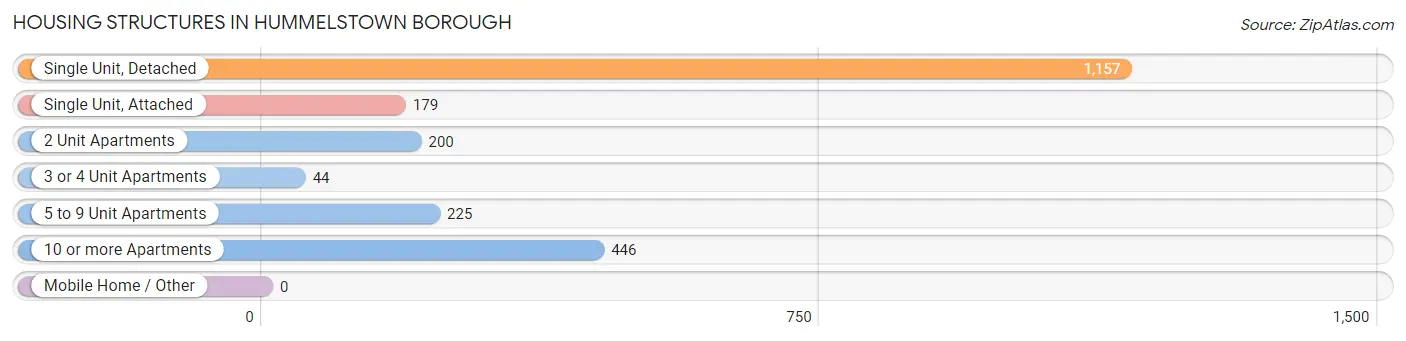
| Structure Type | # Housing Units | % Housing Units |
| Single Unit, Detached | 1,157 | 51.4% |
| Single Unit, Attached | 179 | 8.0% |
| 2 Unit Apartments | 200 | 8.9% |
| 3 or 4 Unit Apartments | 44 | 1.9% |
| 5 to 9 Unit Apartments | 225 | 10.0% |
| 10 or more Apartments | 446 | 19.8% |
| Mobile Home / Other | 0 | 0.0% |
| Total | 2,251 | 100.0% |
Housing Structures by Occupancy in Hummelstown borough
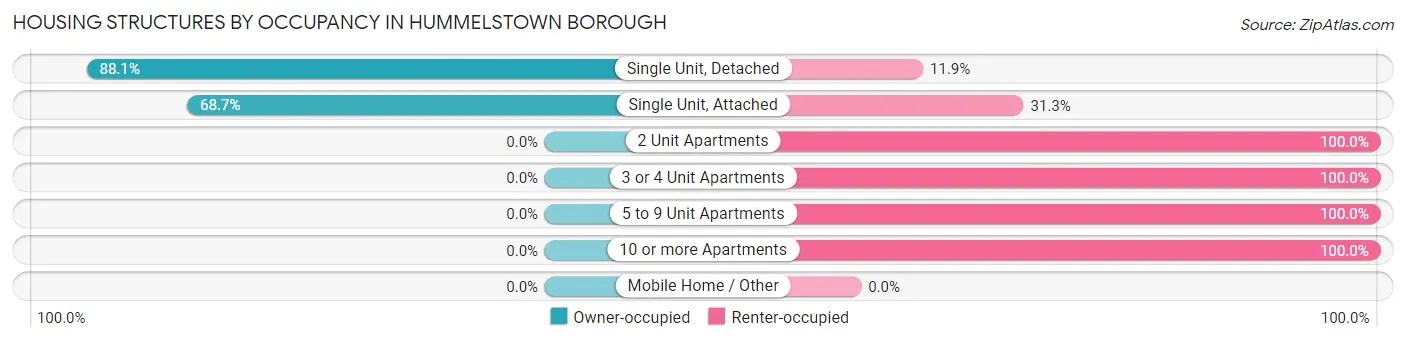
| Structure Type | Owner-occupied | Renter-occupied |
| Single Unit, Detached | 1,019 (88.1%) | 138 (11.9%) |
| Single Unit, Attached | 123 (68.7%) | 56 (31.3%) |
| 2 Unit Apartments | 0 (0.0%) | 200 (100.0%) |
| 3 or 4 Unit Apartments | 0 (0.0%) | 44 (100.0%) |
| 5 to 9 Unit Apartments | 0 (0.0%) | 225 (100.0%) |
| 10 or more Apartments | 0 (0.0%) | 446 (100.0%) |
| Mobile Home / Other | 0 (0.0%) | 0 (0.0%) |
| Total | 1,142 (50.7%) | 1,109 (49.3%) |
Housing Structures by Number of Rooms in Hummelstown borough
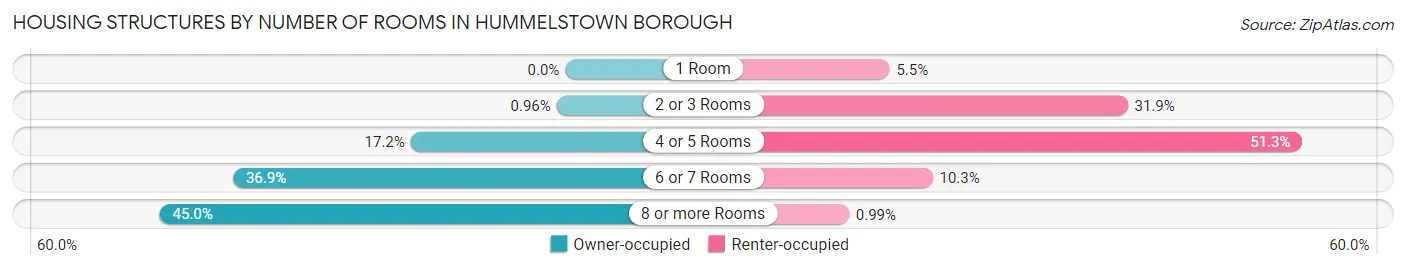
| Number of Rooms | Owner-occupied | Renter-occupied |
| 1 Room | 0 (0.0%) | 61 (5.5%) |
| 2 or 3 Rooms | 11 (1.0%) | 354 (31.9%) |
| 4 or 5 Rooms | 196 (17.2%) | 569 (51.3%) |
| 6 or 7 Rooms | 421 (36.9%) | 114 (10.3%) |
| 8 or more Rooms | 514 (45.0%) | 11 (1.0%) |
| Total | 1,142 (100.0%) | 1,109 (100.0%) |
Housing Structure by Heating Type in Hummelstown borough
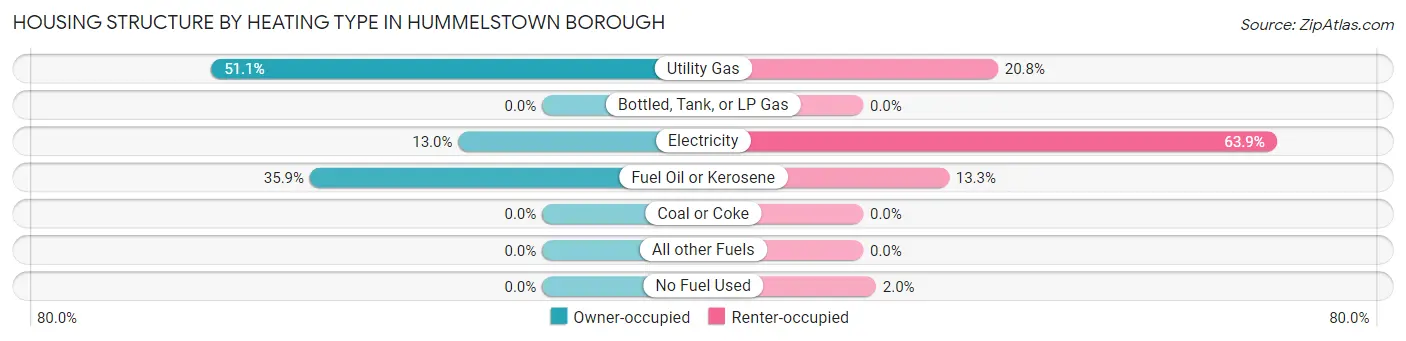
| Heating Type | Owner-occupied | Renter-occupied |
| Utility Gas | 584 (51.1%) | 231 (20.8%) |
| Bottled, Tank, or LP Gas | 0 (0.0%) | 0 (0.0%) |
| Electricity | 148 (13.0%) | 709 (63.9%) |
| Fuel Oil or Kerosene | 410 (35.9%) | 147 (13.3%) |
| Coal or Coke | 0 (0.0%) | 0 (0.0%) |
| All other Fuels | 0 (0.0%) | 0 (0.0%) |
| No Fuel Used | 0 (0.0%) | 22 (2.0%) |
| Total | 1,142 (100.0%) | 1,109 (100.0%) |
Household Vehicle Usage in Hummelstown borough
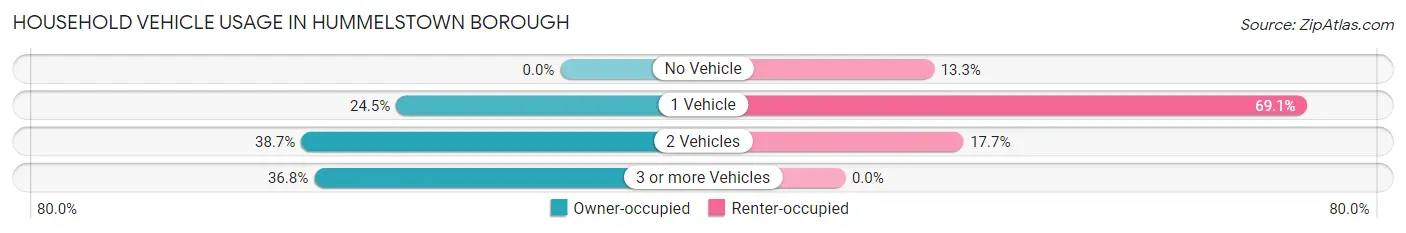
| Vehicles per Household | Owner-occupied | Renter-occupied |
| No Vehicle | 0 (0.0%) | 147 (13.3%) |
| 1 Vehicle | 280 (24.5%) | 766 (69.1%) |
| 2 Vehicles | 442 (38.7%) | 196 (17.7%) |
| 3 or more Vehicles | 420 (36.8%) | 0 (0.0%) |
| Total | 1,142 (100.0%) | 1,109 (100.0%) |
Real Estate & Mortgages in Hummelstown borough
Real Estate and Mortgage Overview in Hummelstown borough
| Characteristic | Without Mortgage | With Mortgage |
| Housing Units | 363 | 779 |
| Median Property Value | $258,300 | $228,100 |
| Median Household Income | $113,188 | $198 |
| Monthly Housing Costs | $658 | $127 |
| Real Estate Taxes | $3,618 | $21 |
Property Value by Mortgage Status in Hummelstown borough
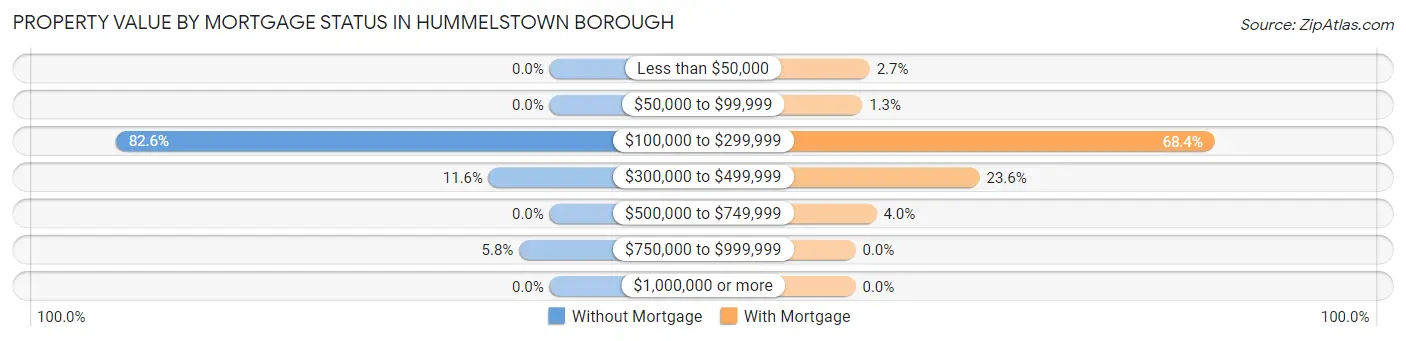
| Property Value | Without Mortgage | With Mortgage |
| Less than $50,000 | 0 (0.0%) | 21 (2.7%) |
| $50,000 to $99,999 | 0 (0.0%) | 10 (1.3%) |
| $100,000 to $299,999 | 300 (82.6%) | 533 (68.4%) |
| $300,000 to $499,999 | 42 (11.6%) | 184 (23.6%) |
| $500,000 to $749,999 | 0 (0.0%) | 31 (4.0%) |
| $750,000 to $999,999 | 21 (5.8%) | 0 (0.0%) |
| $1,000,000 or more | 0 (0.0%) | 0 (0.0%) |
| Total | 363 (100.0%) | 779 (100.0%) |
Household Income by Mortgage Status in Hummelstown borough
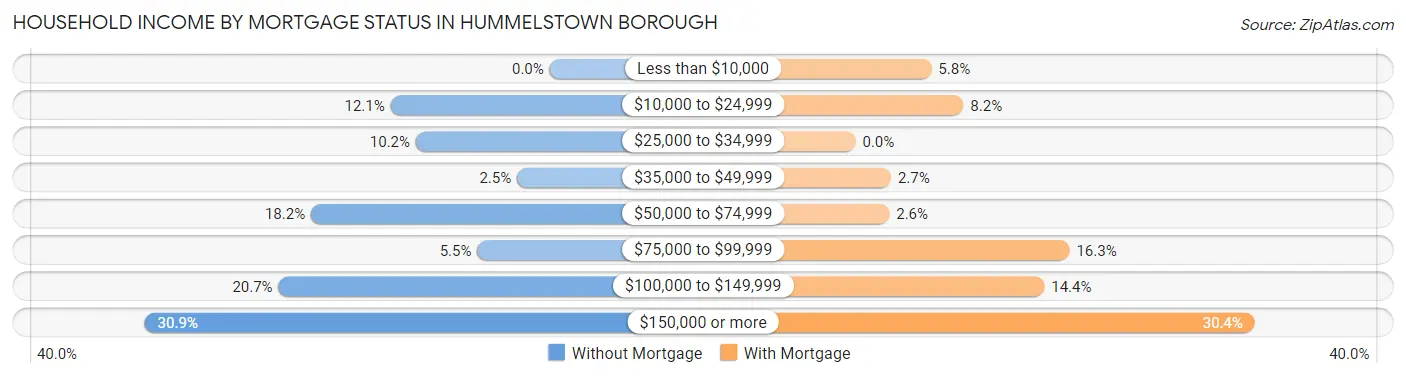
| Household Income | Without Mortgage | With Mortgage |
| Less than $10,000 | 0 (0.0%) | 45 (5.8%) |
| $10,000 to $24,999 | 44 (12.1%) | 64 (8.2%) |
| $25,000 to $34,999 | 37 (10.2%) | 0 (0.0%) |
| $35,000 to $49,999 | 9 (2.5%) | 21 (2.7%) |
| $50,000 to $74,999 | 66 (18.2%) | 20 (2.6%) |
| $75,000 to $99,999 | 20 (5.5%) | 127 (16.3%) |
| $100,000 to $149,999 | 75 (20.7%) | 112 (14.4%) |
| $150,000 or more | 112 (30.8%) | 237 (30.4%) |
| Total | 363 (100.0%) | 779 (100.0%) |
Property Value to Household Income Ratio in Hummelstown borough
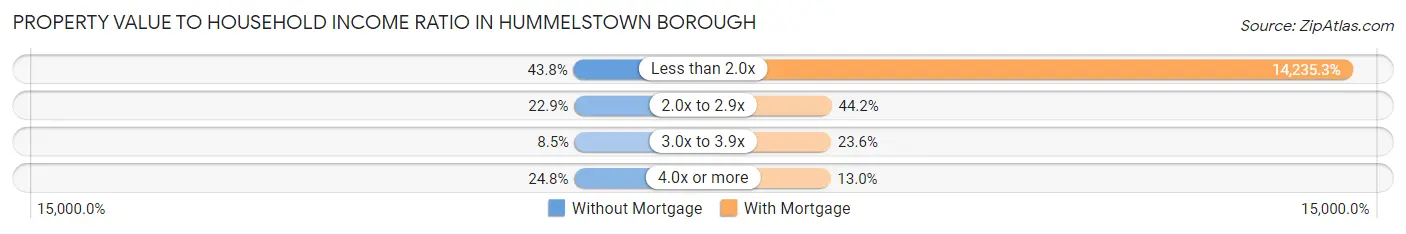
| Value-to-Income Ratio | Without Mortgage | With Mortgage |
| Less than 2.0x | 159 (43.8%) | 110,893 (14,235.3%) |
| 2.0x to 2.9x | 83 (22.9%) | 344 (44.2%) |
| 3.0x to 3.9x | 31 (8.5%) | 184 (23.6%) |
| 4.0x or more | 90 (24.8%) | 101 (13.0%) |
| Total | 363 (100.0%) | 779 (100.0%) |
Real Estate Taxes by Mortgage Status in Hummelstown borough
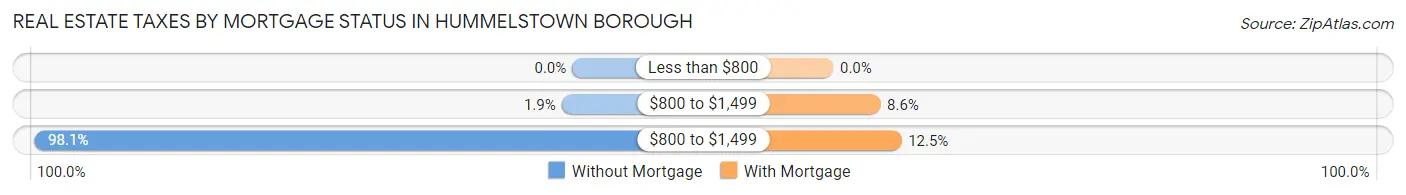
| Property Taxes | Without Mortgage | With Mortgage |
| Less than $800 | 0 (0.0%) | 0 (0.0%) |
| $800 to $1,499 | 7 (1.9%) | 67 (8.6%) |
| $800 to $1,499 | 356 (98.1%) | 97 (12.4%) |
| Total | 363 (100.0%) | 779 (100.0%) |
Health & Disability in Hummelstown borough
Health Insurance Coverage by Age in Hummelstown borough
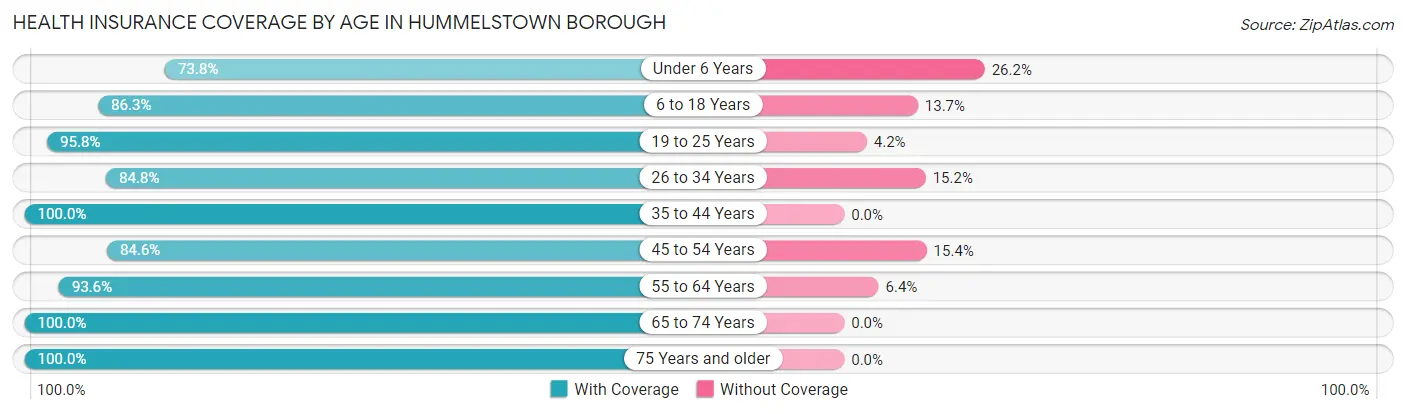
| Age Bracket | With Coverage | Without Coverage |
| Under 6 Years | 279 (73.8%) | 99 (26.2%) |
| 6 to 18 Years | 566 (86.3%) | 90 (13.7%) |
| 19 to 25 Years | 410 (95.8%) | 18 (4.2%) |
| 26 to 34 Years | 536 (84.8%) | 96 (15.2%) |
| 35 to 44 Years | 538 (100.0%) | 0 (0.0%) |
| 45 to 54 Years | 474 (84.6%) | 86 (15.4%) |
| 55 to 64 Years | 601 (93.6%) | 41 (6.4%) |
| 65 to 74 Years | 348 (100.0%) | 0 (0.0%) |
| 75 Years and older | 342 (100.0%) | 0 (0.0%) |
| Total | 4,094 (90.5%) | 430 (9.5%) |
Health Insurance Coverage by Citizenship Status in Hummelstown borough
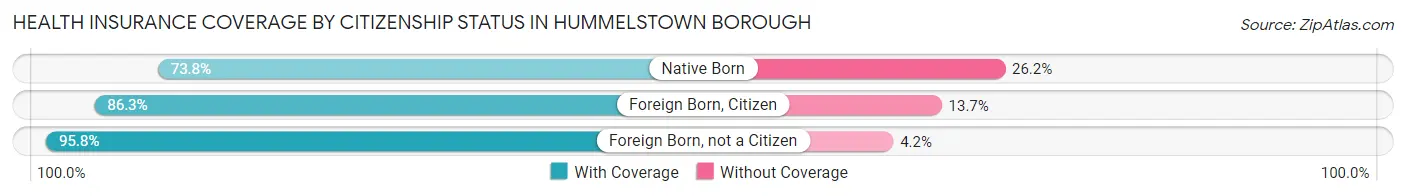
| Citizenship Status | With Coverage | Without Coverage |
| Native Born | 279 (73.8%) | 99 (26.2%) |
| Foreign Born, Citizen | 566 (86.3%) | 90 (13.7%) |
| Foreign Born, not a Citizen | 410 (95.8%) | 18 (4.2%) |
Health Insurance Coverage by Household Income in Hummelstown borough
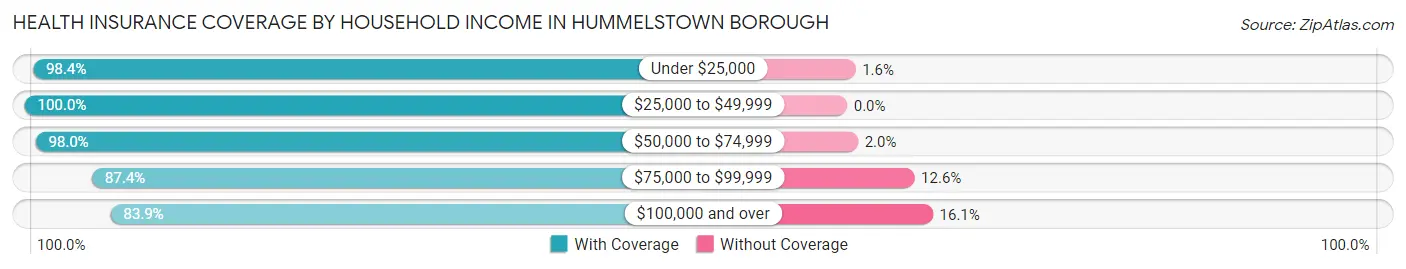
| Household Income | With Coverage | Without Coverage |
| Under $25,000 | 623 (98.4%) | 10 (1.6%) |
| $25,000 to $49,999 | 738 (100.0%) | 0 (0.0%) |
| $50,000 to $74,999 | 481 (98.0%) | 10 (2.0%) |
| $75,000 to $99,999 | 457 (87.4%) | 66 (12.6%) |
| $100,000 and over | 1,795 (83.9%) | 344 (16.1%) |
Public vs Private Health Insurance Coverage by Age in Hummelstown borough
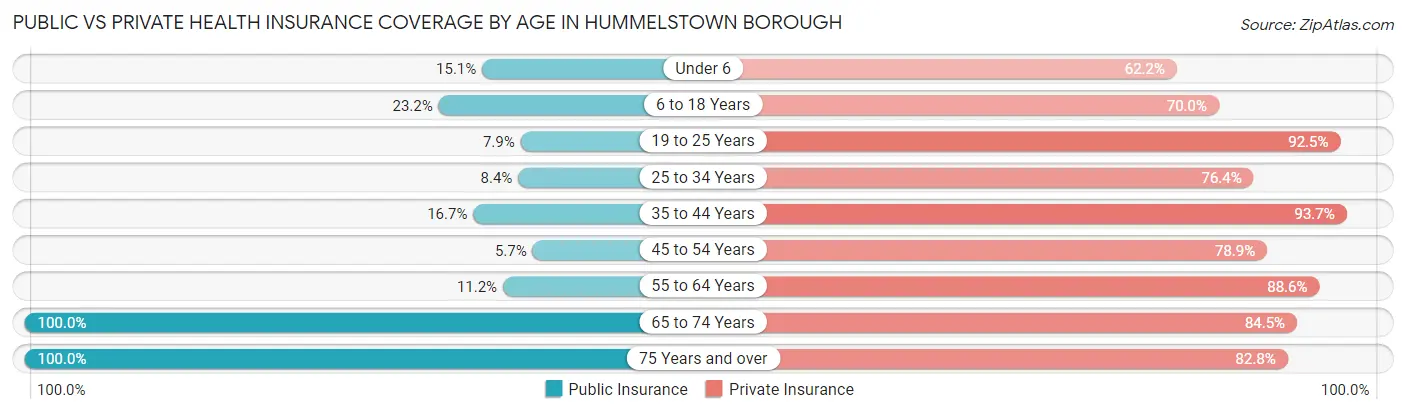
| Age Bracket | Public Insurance | Private Insurance |
| Under 6 | 57 (15.1%) | 235 (62.2%) |
| 6 to 18 Years | 152 (23.2%) | 459 (70.0%) |
| 19 to 25 Years | 34 (7.9%) | 396 (92.5%) |
| 25 to 34 Years | 53 (8.4%) | 483 (76.4%) |
| 35 to 44 Years | 90 (16.7%) | 504 (93.7%) |
| 45 to 54 Years | 32 (5.7%) | 442 (78.9%) |
| 55 to 64 Years | 72 (11.2%) | 569 (88.6%) |
| 65 to 74 Years | 348 (100.0%) | 294 (84.5%) |
| 75 Years and over | 342 (100.0%) | 283 (82.8%) |
| Total | 1,180 (26.1%) | 3,665 (81.0%) |
Disability Status by Sex by Age in Hummelstown borough
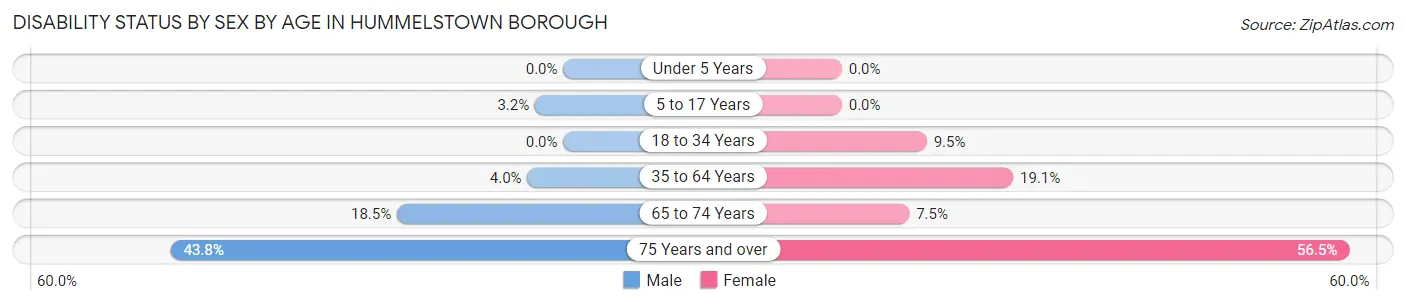
| Age Bracket | Male | Female |
| Under 5 Years | 0 (0.0%) | 0 (0.0%) |
| 5 to 17 Years | 13 (3.2%) | 0 (0.0%) |
| 18 to 34 Years | 0 (0.0%) | 76 (9.5%) |
| 35 to 64 Years | 35 (4.0%) | 165 (19.1%) |
| 65 to 74 Years | 25 (18.5%) | 16 (7.5%) |
| 75 Years and over | 42 (43.8%) | 139 (56.5%) |
Disability Class by Sex by Age in Hummelstown borough
Disability Class: Hearing Difficulty
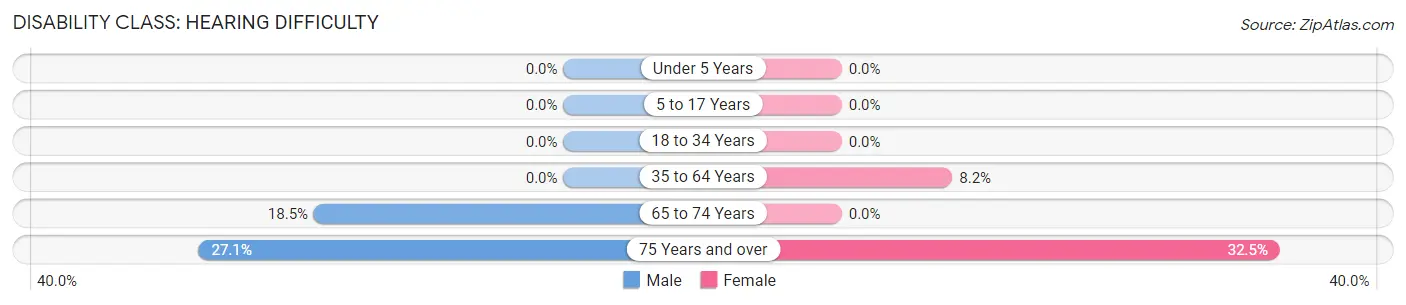
| Age Bracket | Male | Female |
| Under 5 Years | 0 (0.0%) | 0 (0.0%) |
| 5 to 17 Years | 0 (0.0%) | 0 (0.0%) |
| 18 to 34 Years | 0 (0.0%) | 0 (0.0%) |
| 35 to 64 Years | 0 (0.0%) | 71 (8.2%) |
| 65 to 74 Years | 25 (18.5%) | 0 (0.0%) |
| 75 Years and over | 26 (27.1%) | 80 (32.5%) |
Disability Class: Vision Difficulty
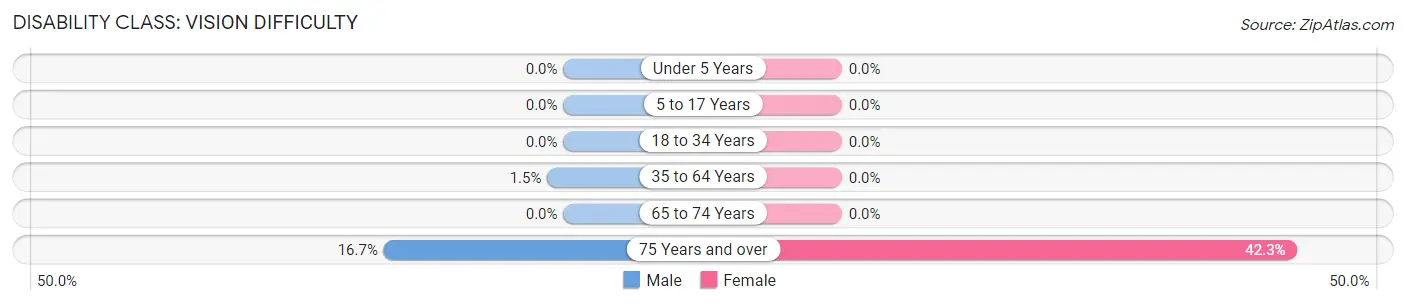
| Age Bracket | Male | Female |
| Under 5 Years | 0 (0.0%) | 0 (0.0%) |
| 5 to 17 Years | 0 (0.0%) | 0 (0.0%) |
| 18 to 34 Years | 0 (0.0%) | 0 (0.0%) |
| 35 to 64 Years | 13 (1.5%) | 0 (0.0%) |
| 65 to 74 Years | 0 (0.0%) | 0 (0.0%) |
| 75 Years and over | 16 (16.7%) | 104 (42.3%) |
Disability Class: Cognitive Difficulty
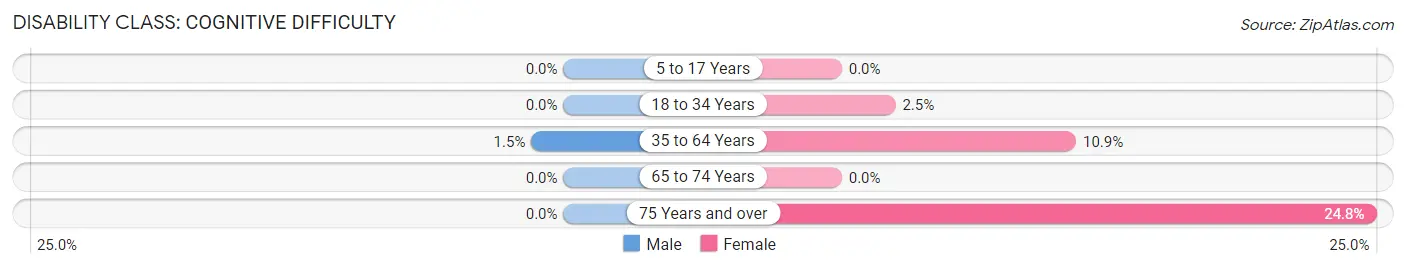
| Age Bracket | Male | Female |
| 5 to 17 Years | 0 (0.0%) | 0 (0.0%) |
| 18 to 34 Years | 0 (0.0%) | 20 (2.5%) |
| 35 to 64 Years | 13 (1.5%) | 94 (10.9%) |
| 65 to 74 Years | 0 (0.0%) | 0 (0.0%) |
| 75 Years and over | 0 (0.0%) | 61 (24.8%) |
Disability Class: Ambulatory Difficulty
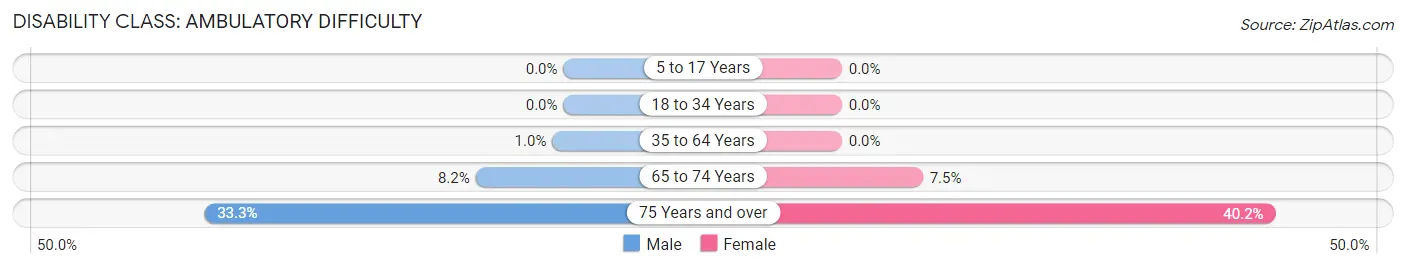
| Age Bracket | Male | Female |
| 5 to 17 Years | 0 (0.0%) | 0 (0.0%) |
| 18 to 34 Years | 0 (0.0%) | 0 (0.0%) |
| 35 to 64 Years | 9 (1.0%) | 0 (0.0%) |
| 65 to 74 Years | 11 (8.2%) | 16 (7.5%) |
| 75 Years and over | 32 (33.3%) | 99 (40.2%) |
Disability Class: Self-Care Difficulty
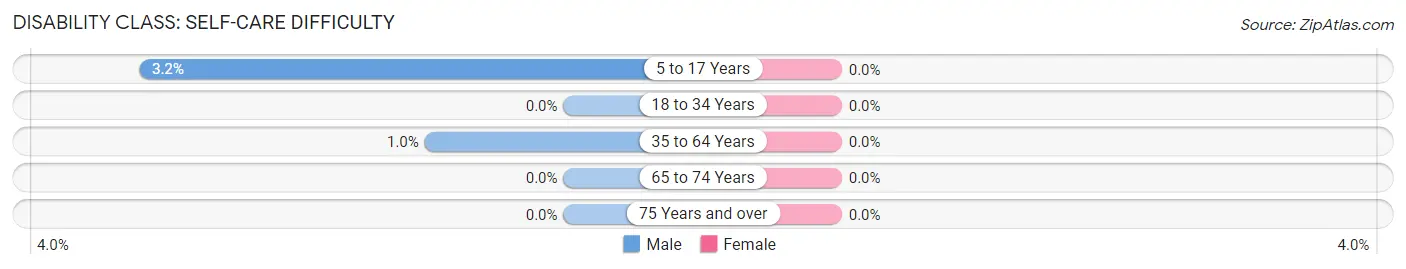
| Age Bracket | Male | Female |
| 5 to 17 Years | 13 (3.2%) | 0 (0.0%) |
| 18 to 34 Years | 0 (0.0%) | 0 (0.0%) |
| 35 to 64 Years | 9 (1.0%) | 0 (0.0%) |
| 65 to 74 Years | 0 (0.0%) | 0 (0.0%) |
| 75 Years and over | 0 (0.0%) | 0 (0.0%) |
Technology Access in Hummelstown borough
Computing Device Access in Hummelstown borough
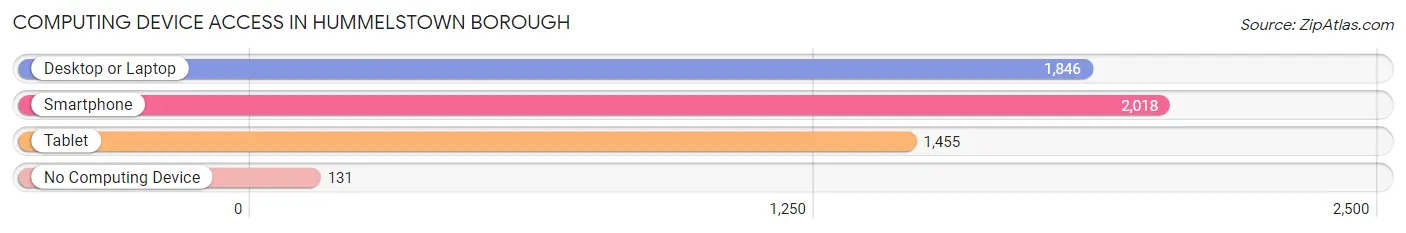
| Device Type | # Households | % Households |
| Desktop or Laptop | 1,846 | 82.0% |
| Smartphone | 2,018 | 89.6% |
| Tablet | 1,455 | 64.6% |
| No Computing Device | 131 | 5.8% |
| Total | 2,251 | 100.0% |
Internet Access in Hummelstown borough
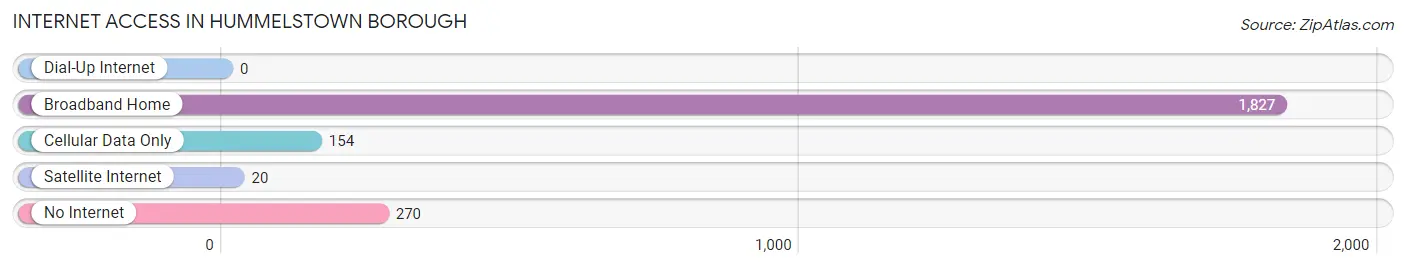
| Internet Type | # Households | % Households |
| Dial-Up Internet | 0 | 0.0% |
| Broadband Home | 1,827 | 81.2% |
| Cellular Data Only | 154 | 6.8% |
| Satellite Internet | 20 | 0.9% |
| No Internet | 270 | 12.0% |
| Total | 2,251 | 100.0% |
Hummelstown borough Summary
Hummelstown Borough is a small borough located in Dauphin County, Pennsylvania. It is situated in the Susquehanna Valley, approximately 10 miles east of Harrisburg, the state capital. The borough is part of the Harrisburg-Carlisle Metropolitan Statistical Area. As of the 2010 census, the population of Hummelstown was 4,520.
History
Hummelstown was founded in 1762 by John Hummel, a German immigrant. The town was originally known as “Hummel’s Town” and was incorporated as a borough in 1851. The town was named after its founder and was the first borough in Dauphin County.
In the late 19th century, Hummelstown was a major center for the production of cigars. The town was home to several cigar factories, including the Hummelstown Cigar Company, which was founded in 1883. The company was one of the largest cigar manufacturers in the United States and employed over 500 people. The company closed in the early 20th century, but the town still has a few cigar-related businesses.
Geography
Hummelstown is located at 40°14'N 76°45'W (40.23, -76.75). According to the United States Census Bureau, the borough has a total area of 1.2 square miles (3.1 km2), all of it land.
The borough is located in the Susquehanna Valley, approximately 10 miles east of Harrisburg. The borough is bordered by Lower Swatara Township to the north, South Hanover Township to the east, and Derry Township to the south and west.
Economy
Hummelstown’s economy is largely based on retail and services. The borough is home to several retail stores, restaurants, and other businesses. The borough is also home to several medical facilities, including the Penn State Milton S. Hershey Medical Center and the Hummelstown Medical Center.
The borough is also home to several manufacturing companies, including the Hershey Company, which produces chocolate and other confectionery products. The borough is also home to several other manufacturing companies, including the Hummelstown Manufacturing Company, which produces industrial equipment.
Demographics
As of the 2010 census, there were 4,520 people, 1,845 households, and 1,093 families residing in the borough. The population density was 3,741.7 people per square mile (1,444.2/km2). There were 1,945 housing units at an average density of 1,619.2 per square mile (625.2/km2). The racial makeup of the borough was 94.2% White, 1.7% African American, 0.2% Native American, 1.2% Asian, 0.1% Pacific Islander, 1.2% from other races, and 1.6% from two or more races. Hispanic or Latino of any race were 3.2% of the population.
There were 1,845 households, out of which 28.2% had children under the age of 18 living with them, 43.2% were married couples living together, 11.7% had a female householder with no husband present, and 40.2% were non-families. 33.2% of all households were made up of individuals, and 13.2% had someone living alone who was 65 years of age or older. The average household size was 2.35 and the average family size was 3.02.
In the borough, the population was spread out, with 22.7% under the age of 18, 8.2% from 18 to 24, 30.2% from 25 to 44, 22.3% from 45 to 64, and 16.6% who were 65 years of age or older. The median age was 38 years. For every 100 females, there were 91.2 males. For every 100 females age 18 and over, there were 88.2 males.
The median income for a household in the borough was $41,964, and the median income for a family was $50,972. Males had a median income of $36,944 versus $27,917 for females. The per capita income for the borough was $20,945. About 4.2% of families and 6.2% of the population were below the poverty line, including 8.2% of those under age 18 and 5.2% of those age 65 or over.
Common Questions
What is Per Capita Income in Hummelstown borough?
Per Capita income in Hummelstown borough is $51,411.
What is the Median Family Income in Hummelstown borough?
Median Family Income in Hummelstown borough is $123,150.
What is the Median Household income in Hummelstown borough?
Median Household Income in Hummelstown borough is $53,203.
What is Income or Wage Gap in Hummelstown borough?
Income or Wage Gap in Hummelstown borough is 34.7%.
Women in Hummelstown borough earn 65.3 cents for every dollar earned by a man.
What is Inequality or Gini Index in Hummelstown borough?
Inequality or Gini Index in Hummelstown borough is 0.56.
What is the Total Population of Hummelstown borough?
Total Population of Hummelstown borough is 4,536.
What is the Total Male Population of Hummelstown borough?
Total Male Population of Hummelstown borough is 2,073.
What is the Total Female Population of Hummelstown borough?
Total Female Population of Hummelstown borough is 2,463.
What is the Ratio of Males per 100 Females in Hummelstown borough?
There are 84.17 Males per 100 Females in Hummelstown borough.
What is the Ratio of Females per 100 Males in Hummelstown borough?
There are 118.81 Females per 100 Males in Hummelstown borough.
What is the Median Population Age in Hummelstown borough?
Median Population Age in Hummelstown borough is 37.4 Years.
What is the Average Family Size in Hummelstown borough
Average Family Size in Hummelstown borough is 2.9 People.
What is the Average Household Size in Hummelstown borough
Average Household Size in Hummelstown borough is 2.0 People.
How Large is the Labor Force in Hummelstown borough?
There are 2,985 People in the Labor Forcein in Hummelstown borough.
What is the Percentage of People in the Labor Force in Hummelstown borough?
81.5% of People are in the Labor Force in Hummelstown borough.
What is the Unemployment Rate in Hummelstown borough?
Unemployment Rate in Hummelstown borough is 3.5%.