Cities with the Highest Percentage of Sri Lankan Population in Minnesota
RELATED REPORTS & OPTIONS
Sri Lankan
Minnesota
Compare Cities
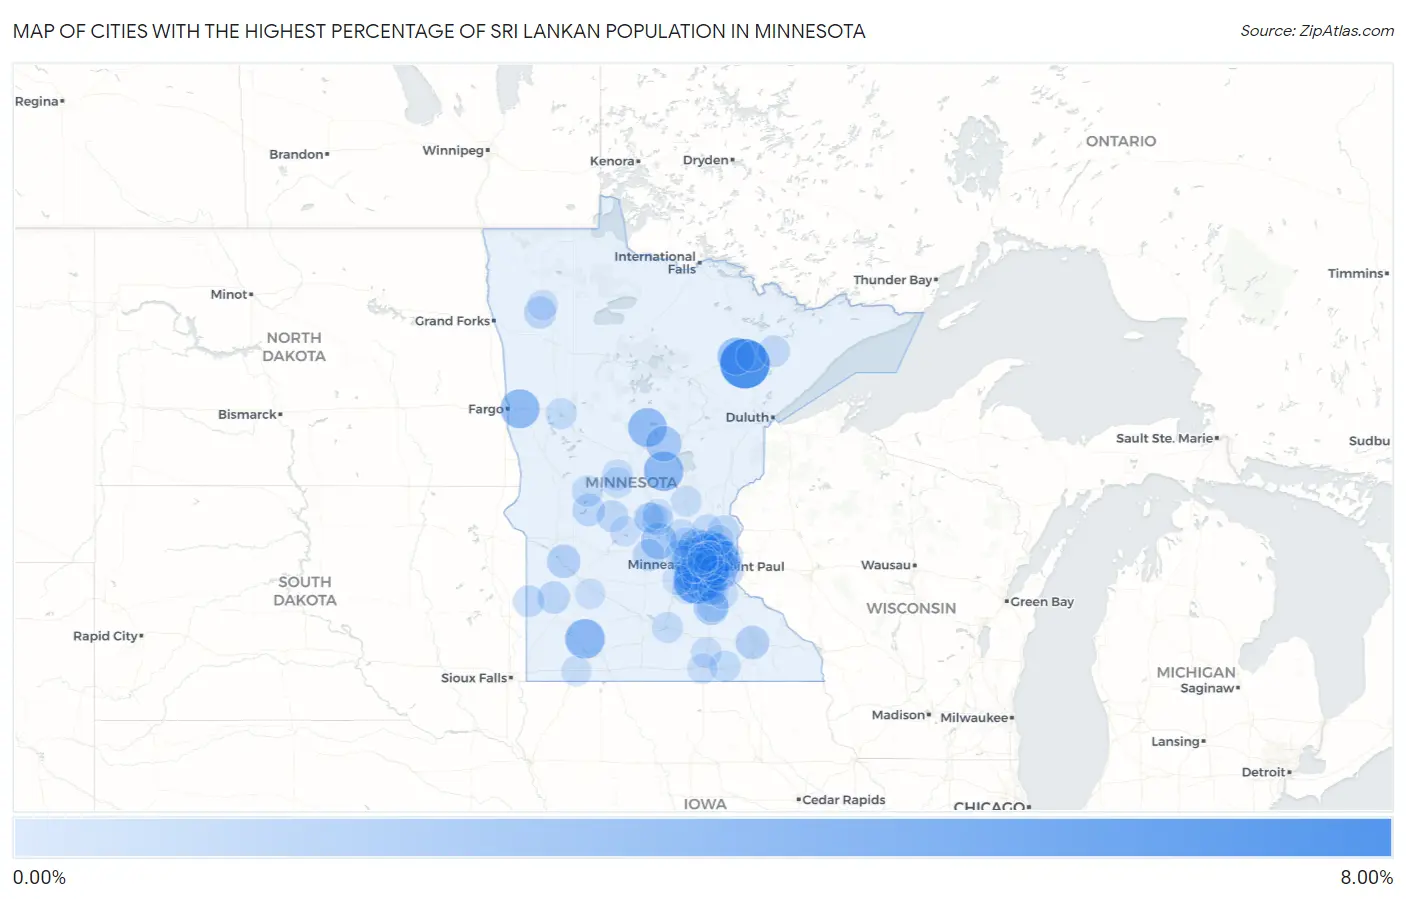
Map of Cities with the Highest Percentage of Sri Lankan Population in Minnesota
0.00%
8.00%
Cities with the Highest Percentage of Sri Lankan Population in Minnesota
| City | Sri Lankan | vs State | vs National | |
| 1. | Iron Junction | 7.06% | 0.60%(+6.46)#1 | 0.68%(+6.38)#87 |
| 2. | Shakopee | 5.44% | 0.60%(+4.83)#2 | 0.68%(+4.76)#138 |
| 3. | Savage | 3.70% | 0.60%(+3.10)#3 | 0.68%(+3.02)#268 |
| 4. | Westbrook | 3.61% | 0.60%(+3.01)#4 | 0.68%(+2.93)#278 |
| 5. | Harding | 3.60% | 0.60%(+3.00)#5 | 0.68%(+2.92)#282 |
| 6. | Glyndon | 3.43% | 0.60%(+2.83)#6 | 0.68%(+2.75)#308 |
| 7. | Jenkins | 3.28% | 0.60%(+2.68)#7 | 0.68%(+2.60)#338 |
| 8. | Buhl | 2.82% | 0.60%(+2.22)#8 | 0.68%(+2.14)#426 |
| 9. | Lexington | 2.78% | 0.60%(+2.18)#9 | 0.68%(+2.10)#441 |
| 10. | Brooklyn Park | 2.55% | 0.60%(+1.95)#10 | 0.68%(+1.87)#486 |
| 11. | Annandale | 2.42% | 0.60%(+1.82)#11 | 0.68%(+1.74)#522 |
| 12. | Blaine | 2.34% | 0.60%(+1.73)#12 | 0.68%(+1.66)#557 |
| 13. | Medina | 2.22% | 0.60%(+1.62)#13 | 0.68%(+1.55)#593 |
| 14. | Riverton | 2.21% | 0.60%(+1.61)#14 | 0.68%(+1.53)#601 |
| 15. | Spring Lake Park | 2.12% | 0.60%(+1.52)#15 | 0.68%(+1.45)#630 |
| 16. | Gem Lake | 2.11% | 0.60%(+1.50)#16 | 0.68%(+1.43)#637 |
| 17. | Dayton | 2.00% | 0.60%(+1.40)#17 | 0.68%(+1.32)#670 |
| 18. | Dundas | 1.98% | 0.60%(+1.38)#18 | 0.68%(+1.30)#682 |
| 19. | Champlin | 1.70% | 0.60%(+1.10)#19 | 0.68%(+1.02)#847 |
| 20. | Roseville | 1.64% | 0.60%(+1.04)#20 | 0.68%(+0.957)#897 |
| 21. | Bloomington | 1.60% | 0.60%(+1.00)#21 | 0.68%(+0.924)#923 |
| 22. | Rochester | 1.59% | 0.60%(+0.994)#22 | 0.68%(+0.916)#927 |
| 23. | Watson | 1.57% | 0.60%(+0.970)#23 | 0.68%(+0.892)#954 |
| 24. | New Hope | 1.43% | 0.60%(+0.829)#24 | 0.68%(+0.751)#1,066 |
| 25. | Burnsville | 1.42% | 0.60%(+0.816)#25 | 0.68%(+0.739)#1,080 |
| 26. | Hilltop | 1.39% | 0.60%(+0.792)#26 | 0.68%(+0.715)#1,105 |
| 27. | Woodbury | 1.34% | 0.60%(+0.738)#27 | 0.68%(+0.660)#1,147 |
| 28. | Lauderdale | 1.30% | 0.60%(+0.703)#28 | 0.68%(+0.626)#1,187 |
| 29. | Chanhassen | 1.29% | 0.60%(+0.687)#29 | 0.68%(+0.609)#1,213 |
| 30. | Maplewood | 1.28% | 0.60%(+0.679)#30 | 0.68%(+0.602)#1,221 |
| 31. | Mounds View | 1.27% | 0.60%(+0.674)#31 | 0.68%(+0.596)#1,226 |
| 32. | Corcoran | 1.24% | 0.60%(+0.636)#32 | 0.68%(+0.558)#1,274 |
| 33. | Eagan | 1.23% | 0.60%(+0.633)#33 | 0.68%(+0.555)#1,278 |
| 34. | Glenwood | 1.22% | 0.60%(+0.617)#34 | 0.68%(+0.539)#1,294 |
| 35. | Minneota | 1.20% | 0.60%(+0.597)#35 | 0.68%(+0.519)#1,320 |
| 36. | Columbia Heights | 1.16% | 0.60%(+0.563)#36 | 0.68%(+0.485)#1,355 |
| 37. | St Hilaire | 1.16% | 0.60%(+0.562)#37 | 0.68%(+0.484)#1,358 |
| 38. | Maple Grove | 1.16% | 0.60%(+0.556)#38 | 0.68%(+0.478)#1,361 |
| 39. | Dassel | 1.12% | 0.60%(+0.518)#39 | 0.68%(+0.440)#1,406 |
| 40. | Apple Valley | 1.08% | 0.60%(+0.475)#40 | 0.68%(+0.397)#1,462 |
| 41. | Oakdale | 1.07% | 0.60%(+0.473)#41 | 0.68%(+0.395)#1,467 |
| 42. | Hoyt Lakes | 1.05% | 0.60%(+0.449)#42 | 0.68%(+0.372)#1,499 |
| 43. | Richfield | 1.05% | 0.60%(+0.448)#43 | 0.68%(+0.370)#1,504 |
| 44. | Elrosa | 1.03% | 0.60%(+0.425)#44 | 0.68%(+0.347)#1,531 |
| 45. | Waite Park | 1.03% | 0.60%(+0.425)#45 | 0.68%(+0.347)#1,533 |
| 46. | Lakeville | 1.02% | 0.60%(+0.416)#46 | 0.68%(+0.339)#1,545 |
| 47. | Stacy | 1.00% | 0.60%(+0.402)#47 | 0.68%(+0.324)#1,558 |
| 48. | Hendricks | 1.00% | 0.60%(+0.396)#48 | 0.68%(+0.318)#1,566 |
| 49. | Hopkins | 0.99% | 0.60%(+0.386)#49 | 0.68%(+0.308)#1,586 |
| 50. | Northfield | 0.95% | 0.60%(+0.345)#50 | 0.68%(+0.267)#1,644 |
| 51. | White Bear Lake | 0.93% | 0.60%(+0.325)#51 | 0.68%(+0.247)#1,696 |
| 52. | Plymouth | 0.92% | 0.60%(+0.320)#52 | 0.68%(+0.242)#1,704 |
| 53. | Big Lake | 0.90% | 0.60%(+0.302)#53 | 0.68%(+0.224)#1,740 |
| 54. | Alexandria | 0.88% | 0.60%(+0.281)#54 | 0.68%(+0.203)#1,766 |
| 55. | Mapleview | 0.86% | 0.60%(+0.261)#55 | 0.68%(+0.184)#1,796 |
| 56. | Bethel | 0.85% | 0.60%(+0.250)#56 | 0.68%(+0.173)#1,819 |
| 57. | St Cloud | 0.82% | 0.60%(+0.221)#57 | 0.68%(+0.143)#1,881 |
| 58. | Credit River | 0.82% | 0.60%(+0.216)#58 | 0.68%(+0.139)#1,890 |
| 59. | Landfall | 0.80% | 0.60%(+0.201)#59 | 0.68%(+0.124)#1,923 |
| 60. | Mankato | 0.80% | 0.60%(+0.198)#60 | 0.68%(+0.120)#1,925 |
| 61. | Lino Lakes | 0.79% | 0.60%(+0.189)#61 | 0.68%(+0.111)#1,943 |
| 62. | Maple Plain | 0.79% | 0.60%(+0.186)#62 | 0.68%(+0.108)#1,951 |
| 63. | Chaska | 0.79% | 0.60%(+0.185)#63 | 0.68%(+0.107)#1,954 |
| 64. | Browerville | 0.78% | 0.60%(+0.178)#64 | 0.68%(+0.100)#1,976 |
| 65. | New Brighton | 0.78% | 0.60%(+0.177)#65 | 0.68%(+0.099)#1,982 |
| 66. | Eden Prairie | 0.78% | 0.60%(+0.176)#66 | 0.68%(+0.098)#1,983 |
| 67. | Detroit Lakes | 0.77% | 0.60%(+0.172)#67 | 0.68%(+0.094)#1,990 |
| 68. | Rockford | 0.75% | 0.60%(+0.154)#68 | 0.68%(+0.076)#2,022 |
| 69. | Deephaven | 0.75% | 0.60%(+0.152)#69 | 0.68%(+0.074)#2,028 |
| 70. | Milaca | 0.73% | 0.60%(+0.125)#70 | 0.68%(+0.047)#2,087 |
| 71. | St Paul | 0.72% | 0.60%(+0.123)#71 | 0.68%(+0.046)#2,093 |
| 72. | Long Prairie | 0.71% | 0.60%(+0.110)#72 | 0.68%(+0.032)#2,122 |
| 73. | Little Canada | 0.71% | 0.60%(+0.105)#73 | 0.68%(+0.027)#2,143 |
| 74. | Jordan | 0.69% | 0.60%(+0.091)#74 | 0.68%(+0.013)#2,180 |
| 75. | Grant | 0.68% | 0.60%(+0.080)#75 | 0.68%(+0.002)#2,217 |
| 76. | Mendota Heights | 0.68% | 0.60%(+0.078)#76 | 0.68%(+0.000)#2,222 |
| 77. | Hampton | 0.68% | 0.60%(+0.076)#77 | 0.68%(-0.002)#2,230 |
| 78. | Ellendale | 0.67% | 0.60%(+0.073)#78 | 0.68%(-0.005)#2,241 |
| 79. | Coon Rapids | 0.66% | 0.60%(+0.061)#79 | 0.68%(-0.017)#2,271 |
| 80. | Lilydale | 0.66% | 0.60%(+0.056)#80 | 0.68%(-0.021)#2,279 |
| 81. | Farmington | 0.60% | 0.60%(-0.005)#81 | 0.68%(-0.082)#2,446 |
| 82. | Brooklyn Center | 0.58% | 0.60%(-0.018)#82 | 0.68%(-0.096)#2,481 |
| 83. | Albert Lea | 0.58% | 0.60%(-0.026)#83 | 0.68%(-0.103)#2,501 |
| 84. | Thief River Falls | 0.57% | 0.60%(-0.026)#84 | 0.68%(-0.104)#2,502 |
| 85. | Belview | 0.56% | 0.60%(-0.044)#85 | 0.68%(-0.121)#2,558 |
| 86. | Columbus | 0.55% | 0.60%(-0.050)#86 | 0.68%(-0.128)#2,584 |
| 87. | Minnetonka | 0.55% | 0.60%(-0.055)#87 | 0.68%(-0.133)#2,597 |
| 88. | Worthington | 0.54% | 0.60%(-0.059)#88 | 0.68%(-0.137)#2,606 |
| 89. | Paynesville | 0.53% | 0.60%(-0.066)#89 | 0.68%(-0.144)#2,624 |
| 90. | Inver Grove Heights | 0.53% | 0.60%(-0.071)#90 | 0.68%(-0.149)#2,641 |
| 91. | Minneapolis | 0.53% | 0.60%(-0.072)#91 | 0.68%(-0.150)#2,651 |
| 92. | Albertville | 0.52% | 0.60%(-0.081)#92 | 0.68%(-0.158)#2,681 |
| 93. | St Joseph | 0.51% | 0.60%(-0.091)#93 | 0.68%(-0.169)#2,717 |
| 94. | Fridley | 0.50% | 0.60%(-0.100)#94 | 0.68%(-0.177)#2,748 |
| 95. | Golden Valley | 0.50% | 0.60%(-0.104)#95 | 0.68%(-0.182)#2,757 |
| 96. | St. John's University | 0.49% | 0.60%(-0.114)#96 | 0.68%(-0.192)#2,805 |
| 97. | Sauk Rapids | 0.48% | 0.60%(-0.116)#97 | 0.68%(-0.194)#2,813 |
| 98. | Cologne | 0.48% | 0.60%(-0.121)#98 | 0.68%(-0.199)#2,833 |
| 99. | Virginia | 0.48% | 0.60%(-0.125)#99 | 0.68%(-0.203)#2,848 |
| 100. | Crystal | 0.46% | 0.60%(-0.139)#100 | 0.68%(-0.217)#2,892 |
Common Questions
What are the Top 10 Cities with the Highest Percentage of Sri Lankan Population in Minnesota?
Top 10 Cities with the Highest Percentage of Sri Lankan Population in Minnesota are:
#1
7.06%
#2
5.44%
#3
3.70%
#4
3.61%
#5
3.60%
#6
3.43%
#7
3.28%
#8
2.82%
#9
2.78%
#10
2.55%
What city has the Highest Percentage of Sri Lankan Population in Minnesota?
Iron Junction has the Highest Percentage of Sri Lankan Population in Minnesota with 7.06%.
What is the Percentage of Sri Lankan Population in the State of Minnesota?
Percentage of Sri Lankan Population in Minnesota is 0.60%.
What is the Percentage of Sri Lankan Population in the United States?
Percentage of Sri Lankan Population in the United States is 0.68%.